1. Introduction
Owing to the development of renewable energy and concerns over environmental protection, distributed generations (DGs) have been introduced into many distribution systems worldwide. The penetration of DGs into such systems, including cogeneration, photovoltaics, gas turbines, wind power, and fuel cells, is rapidly increasing, and consequently, traditional power distribution systems are gradually shifting from radial to meshed topology. Moreover, high DG penetration may lead to the notable contribution of the short-circuit current when faults occur. Meanwhile, in some areas, the fault current surpasses the interruption capacity of the circuit breaker (CB), resulting in failure of the CB to isolate the fault or prevent cascading blackouts [
1,
2,
3].
Fault current limiters (FCLs) have attracted considerable attention from utility providers for their advantages of causing nearly zero power loss during normal operation and ability to restrain the fault current when a fault occurs [
4,
5]. Applications that combine DGs and FCLs increase the reliability and security of power systems; however, such applications have drawbacks, the most notable of which is miscoordination in protection systems due to the addition of DGs and FCLs [
6,
7,
8].
Some methods are addressed for solving the aforementioned problems [
9,
10,
11]. The authors in [
9] employ nonlinear programming techniques to determine the discrete pickup current value of directional overcurrent relay settings. In [
10,
11], the miscoordination problem is formulated by mixed integer nonlinear programming according to different network topologies, and then solved by genetic algorithm and particle swam optimization. Different settings of relays are pre-determined and updated each time the operating state is detected to be changed in [
12]. These optimization approaches ensure coordination between the system and the DGs or FCLs therein. However, because the relay setting remains fixed, adapting to the system with distributed power sources or flexibly changed topology is difficult. Furthermore, the fault current contributed by an inverter-based DG, which lacks inertia, leads to further detection difficulty because of the existing overcurrent, differential, and pilot protection schemes. More DG penetrations thus increase the difficulty of modeling and analyzing short-circuit behaviors.
As the fast growth in microprocessor and communication techniques continues, it enables the computation implementation in smart devices with high computing efficiency and accuracy in fault detection [
13]. Various relay algorithms have been proposed to solve the problems by embedded digital devices, such as intelligent electrical devices (IEDs) installed in a substation to use all information on the lines downstream to determine the parameters of overcurrent relay based on traditional principles [
12,
14]. Based on Ethernet-based communication network technology, one study proposes and employs a peer-to-peer (P2P) structure, also called a multi-agent framework, based on the IED [
15]. Compared with the central communication system, P2P architecture is scalable, identical, and efficient. In that study, IEDs are employed as protection diagnostic agents to exchange measured data, calculate results, and independently determine the operating status.
Moreover, the IEC 61850 standard-based environment ensures that all devices are available in specific positions to be devoted to multi-type protection functions [
16]. The aforementioned facilities enable data to be obtained on crucial system parameters, active/reactive power flow, frequency, impedance, and voltage [
17]. The techniques changes the traditional protection philosophy, which relies on current- and time-based constant relay setting. Selectivity and security are thus guaranteed based on complete data and adaptive intelligent optimized protection scheme [
18].
Based on the IEDs, some adaptive protection models are proposed [
14,
19,
20,
21,
22]. Some are initially constructed offline, while faults are detected online by IEDs installed at one or both ends of the line. Real-time data are collected to facilitate tuning of the protection model to achieve adaptive optimal relay setting [
19,
20]. Artificial intelligence, data mining, and machine learning are implemented extensively [
17,
18,
21]. One study shows that decision tree (DT)-based approaches can detect and classify the faults by using a single-circuit transmission line scheme [
14] and has been proved to be more transparent than the aforementioned solutions [
22]. Although these studies successfully prevent miscoordination, relay settings require updating through data re-collection and offline re-training once the topology changes. Topology-adaptive schemes have been considered to enable optimization settings to fit various power system structures [
14,
21]. However, structures or configurations should be pre-determined before models are built up, and the number of conditions to be considered is fixed.
Based on the studies mentioned above, we explore a more adaptive and comprehensive protection scheme structure. The contributions of this paper are: (1) All data are collected and preprocessed via wavelet transform to capture significant features and thus reduce the computation burden in the subsequent steps; (2) By using a DT, various transparent protection models are constructed according to diverse potential network topologies; (3) To prevent the impact of white noise caused by irrelevant features, a sensitivity analysis algorithm (SAA) is incorporated; (4) The most crucial contribution of this paper is the topology-adaptive protection resetting model achieved through the neural network algorithm.
2. Data Collection and Preprocessing
Phasor measurement units (PMUs) provide the functions of real-time measurements that capture transient periods and contingency conditions. PMUs measure indices such as voltage magnitude, phase, and branch currents within microseconds. PMUs are favorable to traditional measurement units, especially in terms of dynamic state estimation and phase detection [
23]. In this study, PMUs were assumed to be installed at one end of the line and embedded in IED.
2.1. Data Collection with Event Generation and Continuous Wavelet Transform
Data are generated by an event generator that simulates various types of faults (e.g., single-phase-ground, two-phase-ground, three-phase-ground) occurring at various locations on the lines, buses, and other power apparatus. The sample data are subsequently subjected to continuous wavelet transform (CWT). CWT reduces white noise while maintaining meaningful features.
Fourier transform (FT) is used for evaluating frequency components from signals [
24]; however, FT is principally limited in that it overlooks some instant frequency variations [
25]. Through the changing of the window length to introduce time information, short-time FT (STFT) can be introduced to obtain the spectrogram. However, the time boundary affects the resolution. CWT can solve this problem; the time-domain signal is decomposed into several scales with various time scale resolution levels, and the CWT output reveals the signal variations between different frequency bands [
26]. Therefore, disturbance or sudden changes in the time domain are easily detectable.
Equation (1) shows the mathematical structure of CWT;
, called the basis function or mother wavelet, denotes a wavelet that satisfies Equation (2). The variable
a is used to scale
t to
t/a in the basis function and translate
t by separately using
b.
The collected data are subjected to CWT to obtain the corresponding features. The data include the following items:
Positive sequence of voltage/current
Negative sequence of voltage/current
Zero sequence of voltage/current
Phase a/b/c voltage
Phase a/b/c current
Phase a/b/c reactive power
Phase a/b/c active power
Phase a/b/c angle
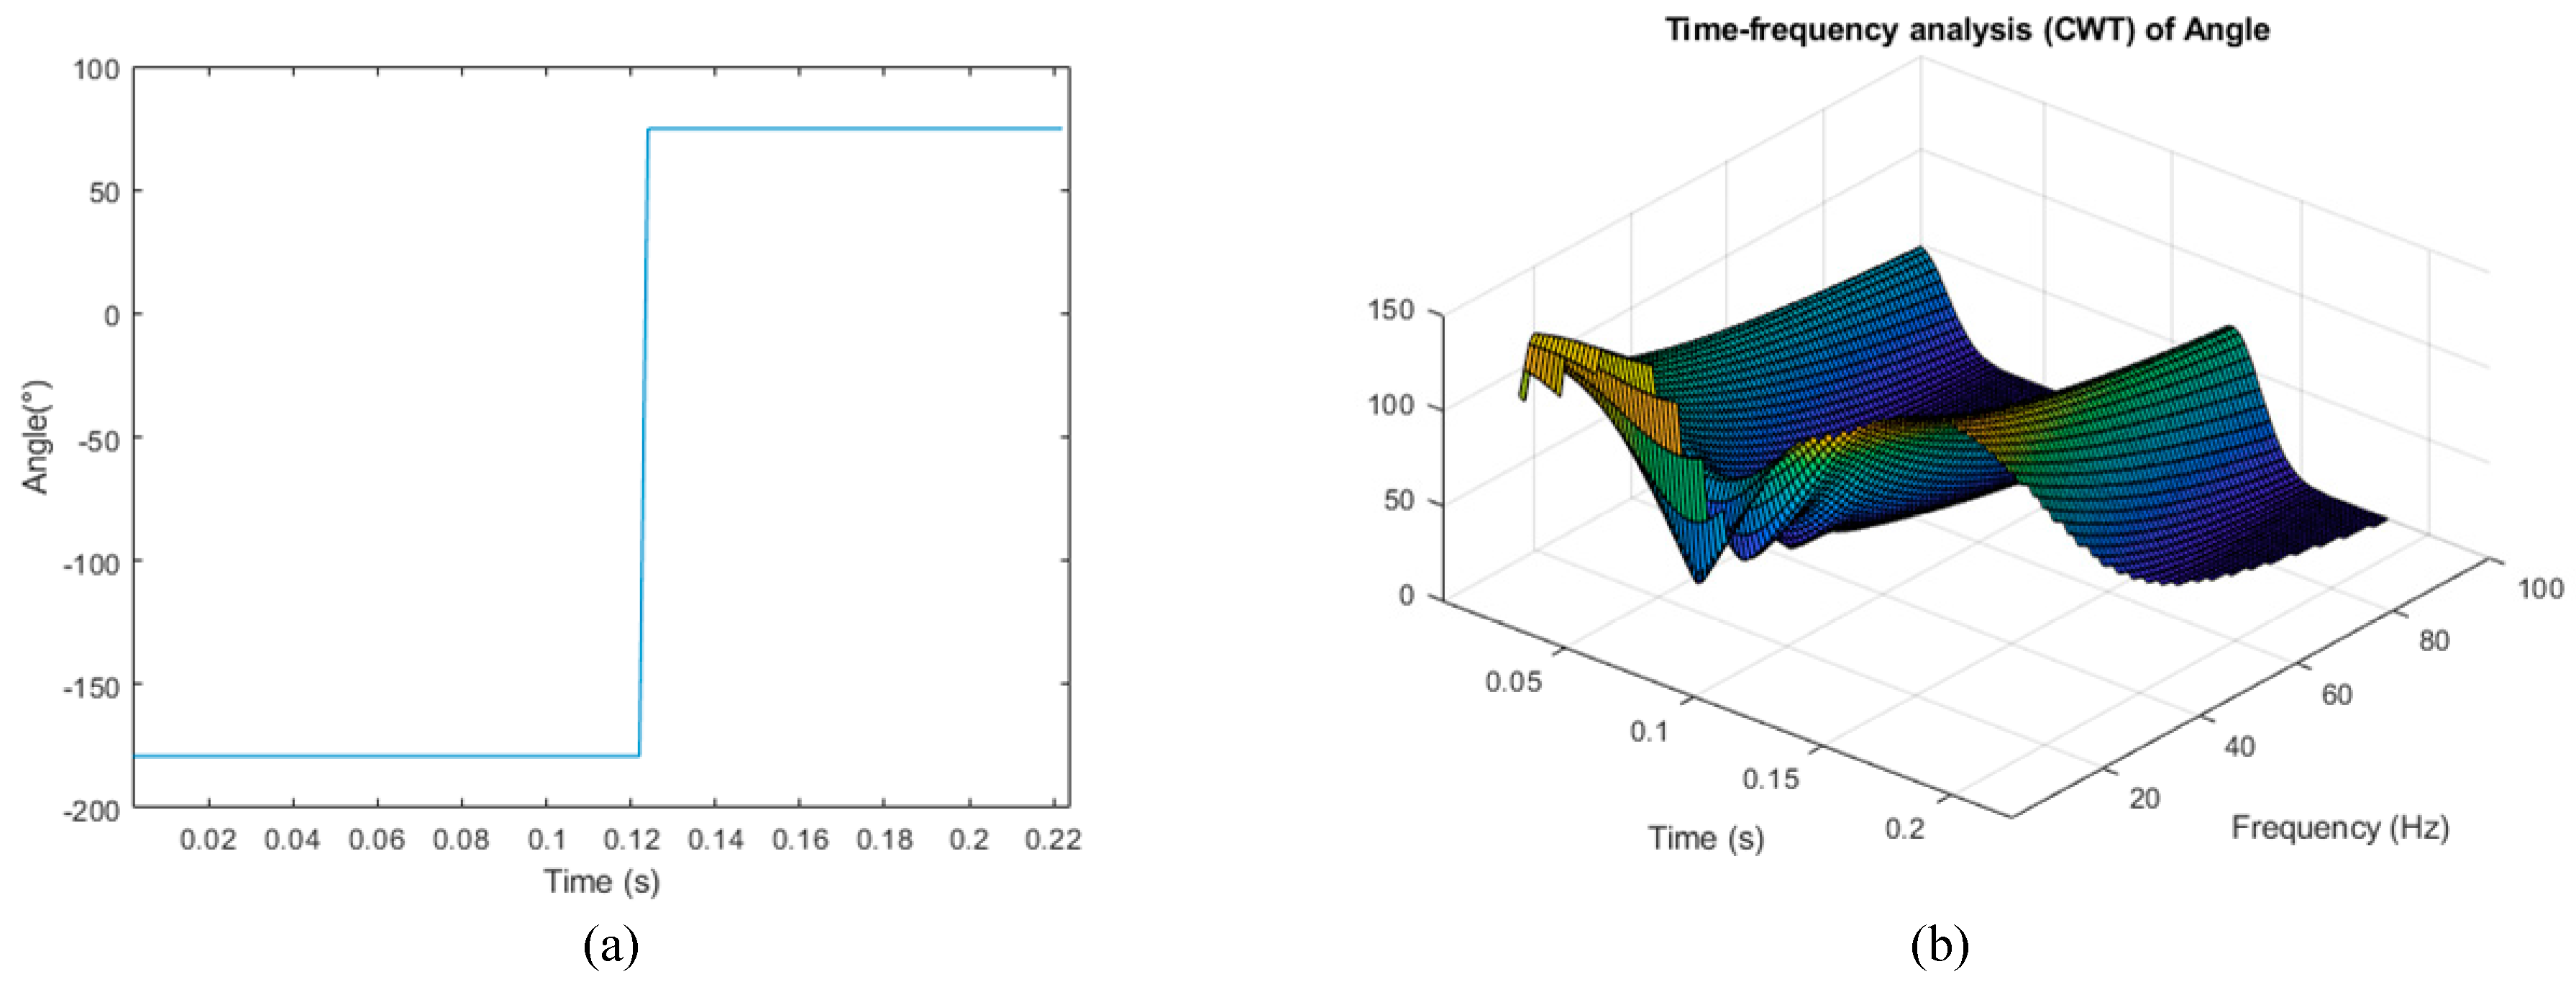
Through CWT, these data are processed based on the rate of change features. An angle signal obtained by a PMU is disposed by CWT, as shown in
Figure 1. A comparison between
Figure 1a,b reveals that after CWT processing, the deviation between frequencies referring to a specific time interval is evident. Thus, the relevant features are selected. Subsequently, the features are distinguished from one another through sensitivity analysis algorithm and assigned the sensitive one to one of two groups, named the fixed topology condition (FTC) and topology change condition (TCC) groups. These two groups can be defined as follows: the FTC group contained features used to train the adaptive relay setting model, whereas the TCC group contained features used to generate a model that can detect topology changes. The aim of topology condition monitoring is to reconstruct the relay setting to make the protection scheme adaptive.
2.2. Sensitivity Analysis Algorithm
For sensitivity analysis in the proposed method, the SAA evaluates the most worthy subsets of features among the learning samples. The feature subset most highly correlated with the training data classification result and with the lowest level of inter-correlation is preferred. The reason is that a good feature subset for algorithm training is the one containing features having more correlation with the prediction (the classification result) and less correlation with each other. This definition can be expressed by choosing the feature composite according to (3), where
is the correlation between the selected predictor and the response (the classification result),
is the number of chosen predictor,
is the average of the correlation values between each predictor and the response while
is the average of inner-correlation value between the predictors. It should be noted that, the correlation value is calculated by Pearson’s correlation coefficient function and should be standardized in advance [
27].
When FTC data are input into the SAA algorithm, the feature subset FTC* is selected as the predictor. This is the subset least sensitive to system changes and fault occurrence but not to changes in other features in the same subset. TCC data are input in the same manner to obtain the promising feature that related to system reconstruction, called subset TCC*. For fault current detection in this procedure, the derivatives of current (∂i/∂t), voltage (∂v/∂t), and angle (∂arg(u,i)/∂t) are selected as FTC*, whereas the active power deviation (∂P/∂t) is selected as TCC* for topology adjustment.
3. Proposed Protective Strategies
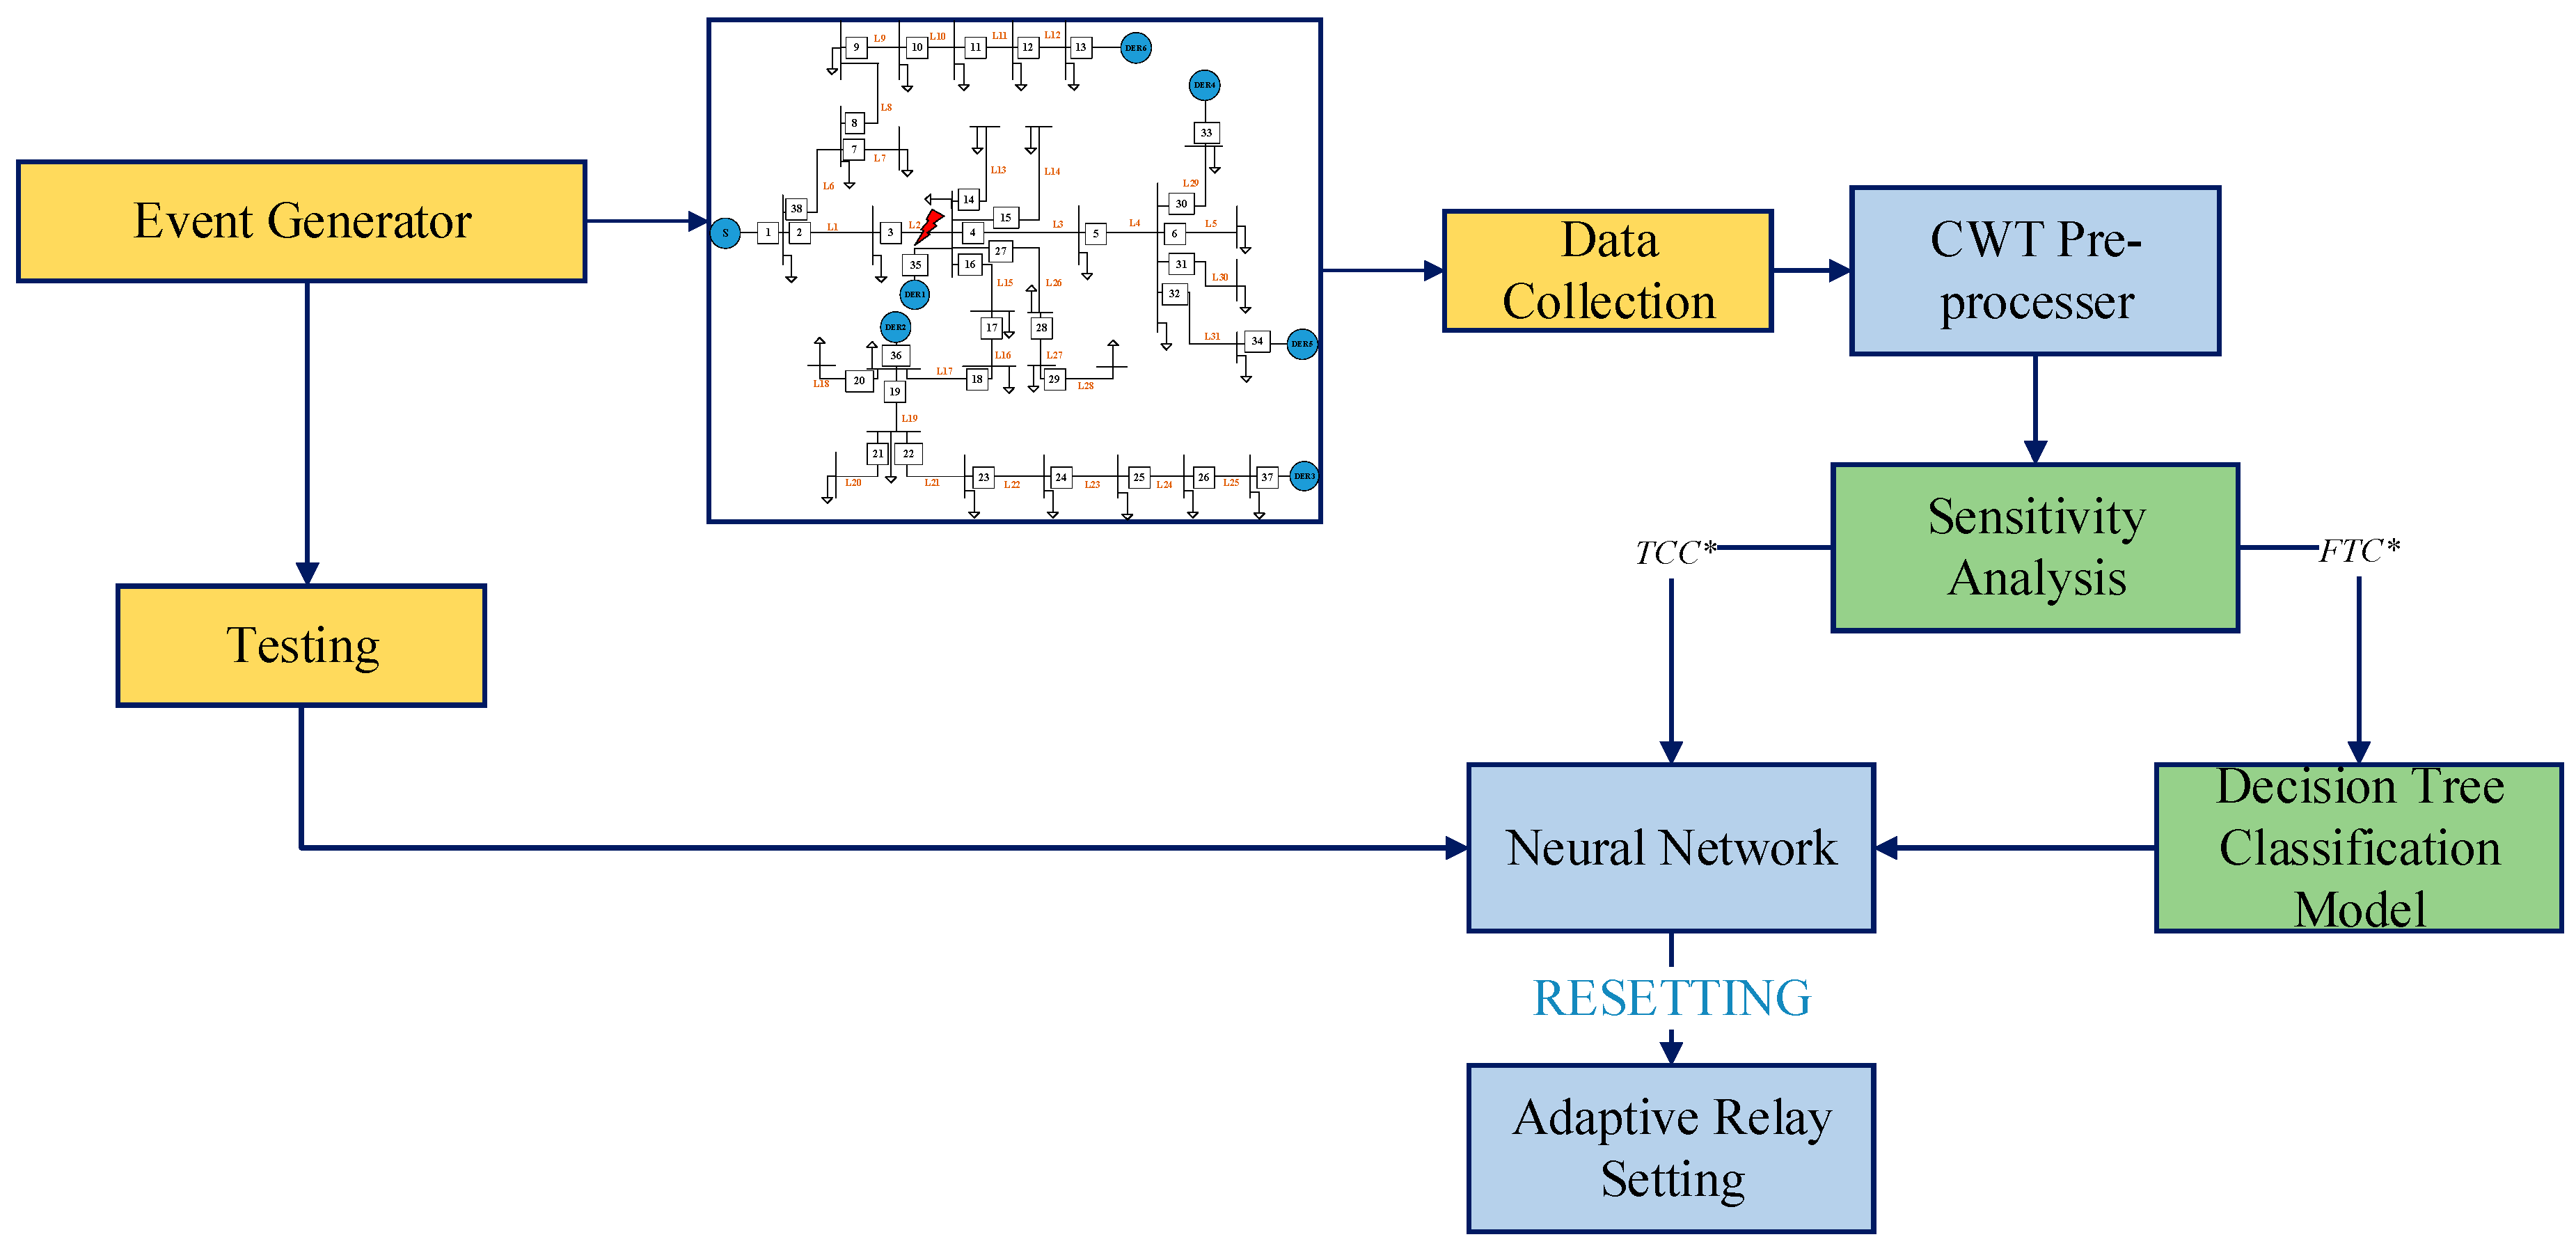
Figure 2 shows the general flowchart of the proposed method. The steps from the event generation to sensitivity analysis are discussed in the preceding section. This section describes how the proposed method works based on the manipulated FTC* and TCC* data.
3.1. DT Relay Setting Models
As a decision support tool, DT is an inductive learning algorithm employed to map the relationship between input and output training data. A tree structure models decisions based on possible consequences of various inputs. This tool is considered superior to other data mining models for handling black-box situations such as random forest and support vector machines [
21].
Implementing a DT can enable obtaining all the action settings of FTC* associated with each considered topology. The objective of DT classification in this study is to determine the relationship between the FTC* values and related fault types. The fault types determine the operating status of each CB, represented as primary protection, backup protection, or no action. The output reveals the relay operation settings associated with a specific topology. All FTC* data are expressed as patterns denoting different events.
The model construction follows the general format of the DT expressed in Equations (4) and (5). Each relay has its own corresponding training dataset
DT referring to a single topology. Event vector
Dj fills into
DT with all the features and action command corresponding to fault event
j. Every event vector thus stores the relay’s detection features of the derivatives of current
∂i/∂t (
X1j), voltage
∂v/∂t (X2j), angle
∂arg(
v,
i)
/∂t (
X3j) and related action commands
Yj (such as primary, secondary protection, or no action).
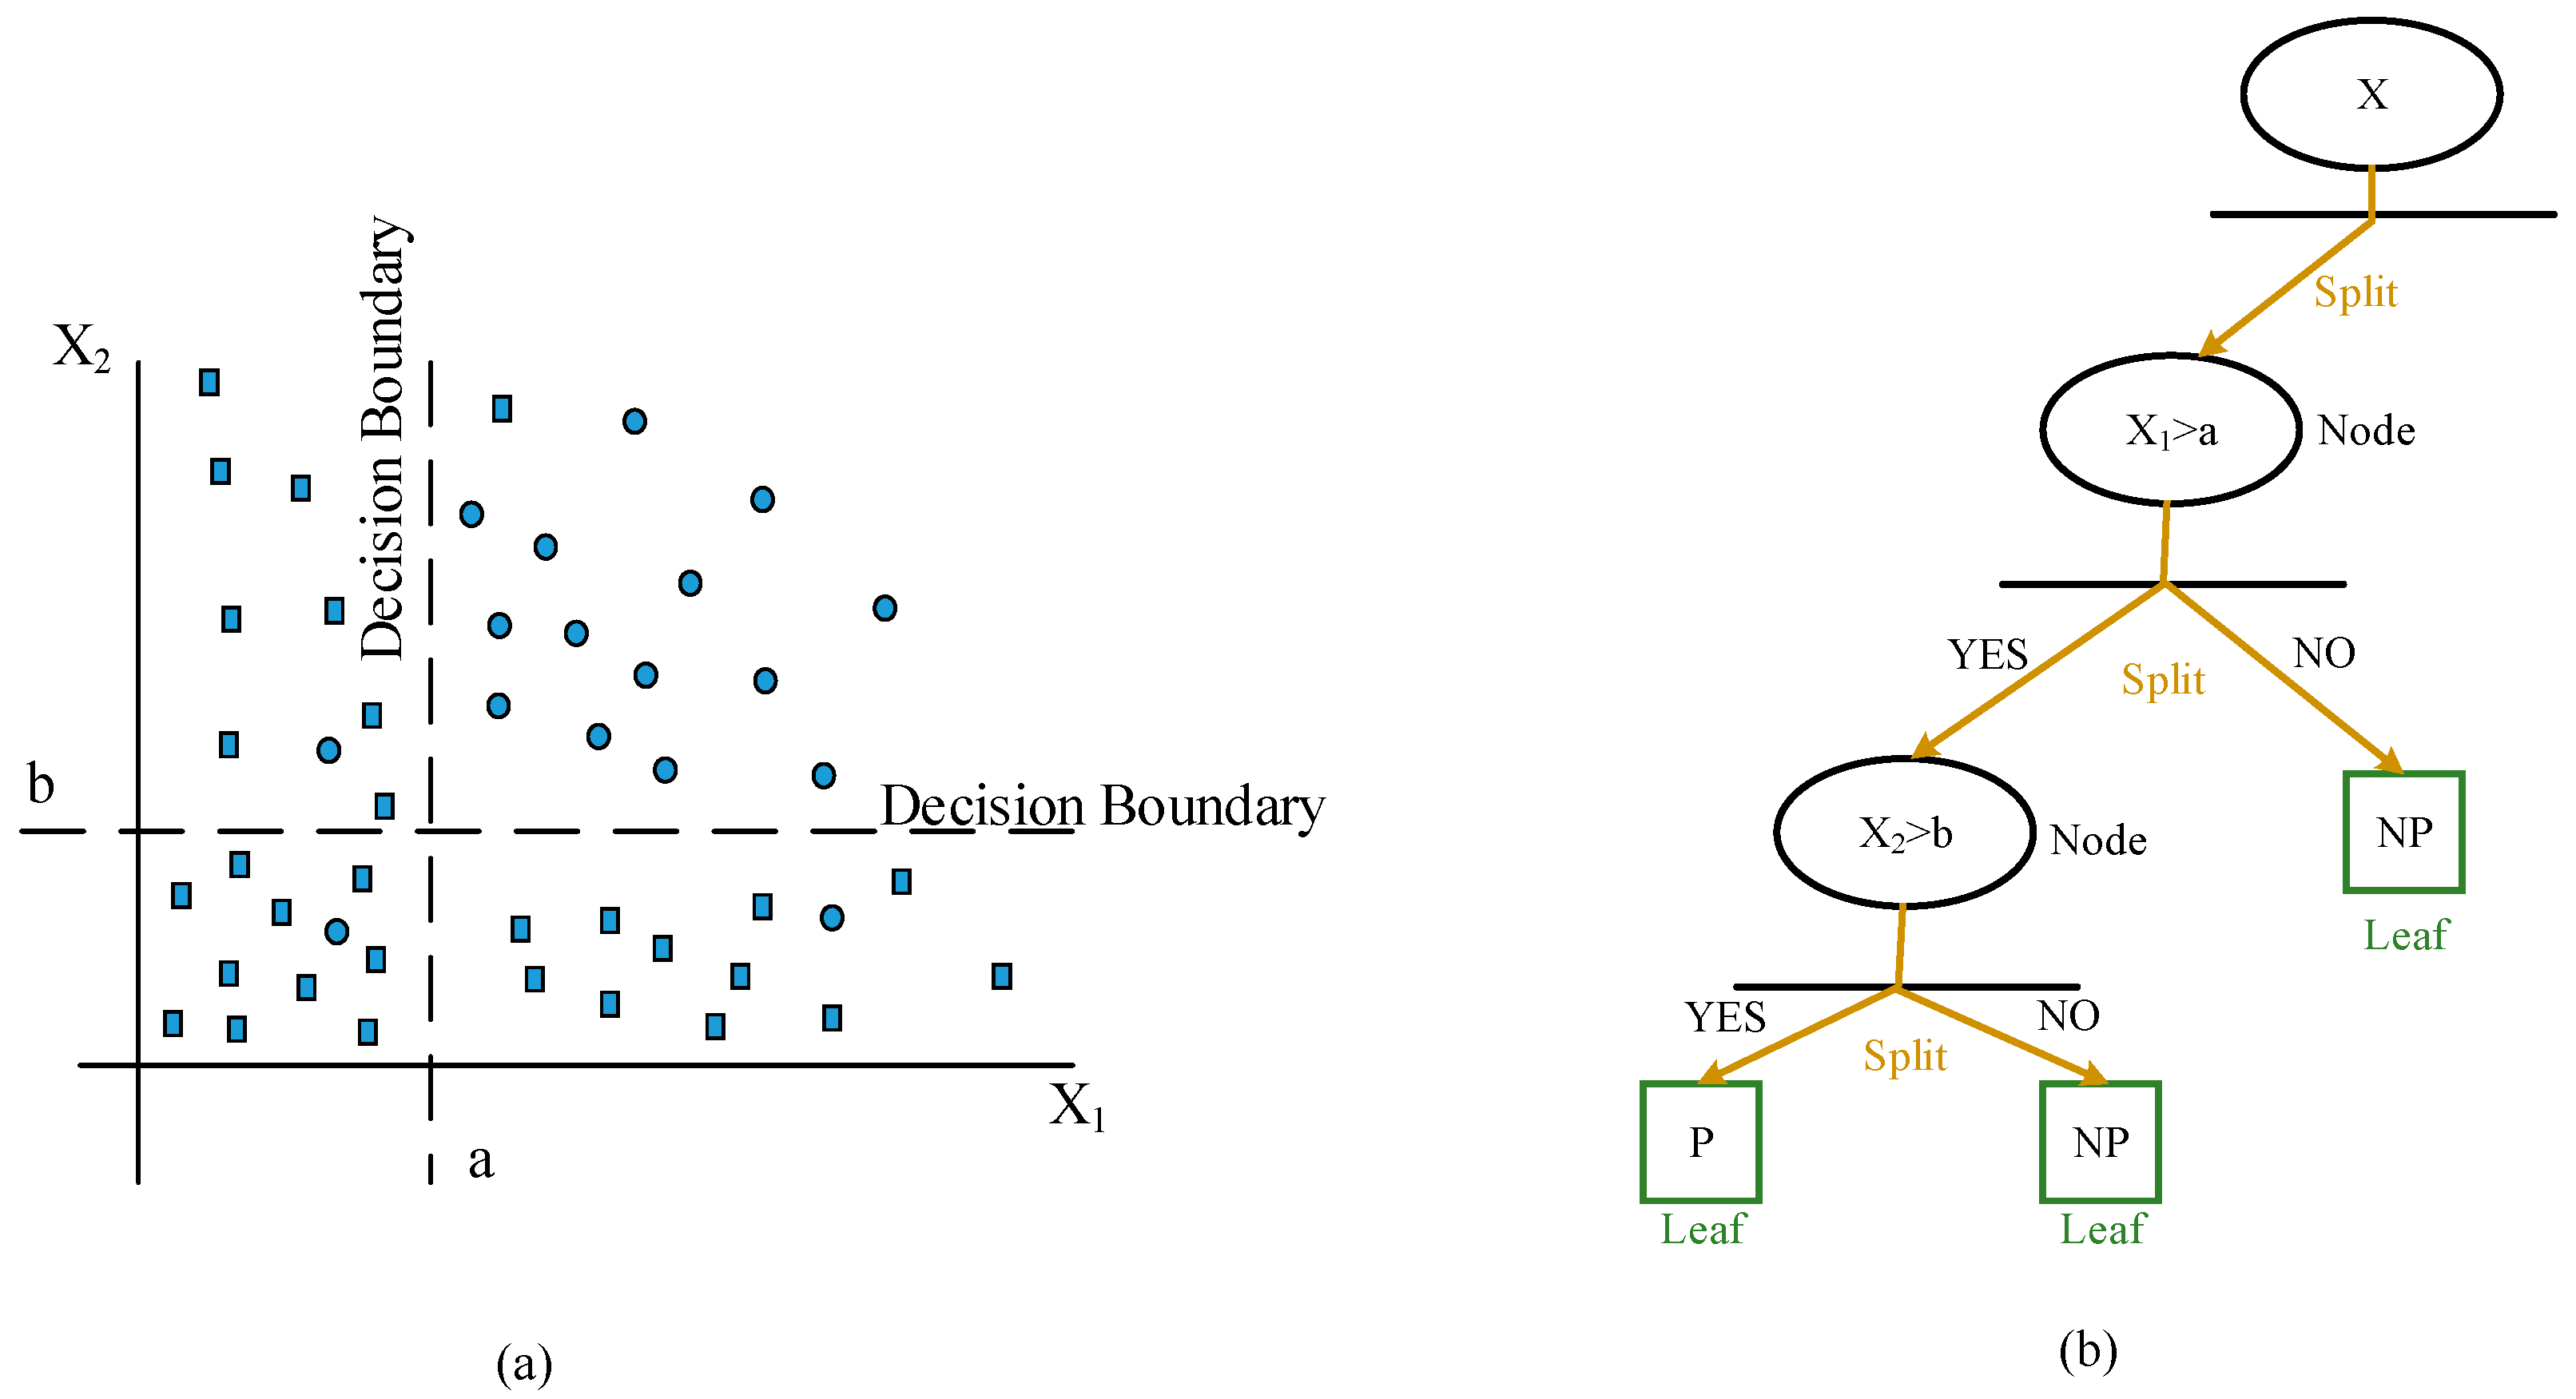
Consider a simplified dataset
DT, for example, a two-feature (
M = 2),
X1 and
X2, subset classification is trained with
,
j = 1, …,
n, and the corresponding protection type,
Yj: primary one (shown as circle) and non-primary one (shown as square) in
Figure 3a.
Figure 3a demonstrates a possible partition. The decision boundary expressed as a dashed line denotes the optimized classification result based on these two features
X1 and
X2 as value a and b. The action region is, therefore, obtained, where the feature
X1 is higher than “a” while
X2 higher than “b.” To map these characteristics to a tree structure, these boundaries are defined as terminal nodes with splits and leaves as
Figure 3b. Similarly, in the processing of data with
M-feature matrices, the data dimension is
M.Maximal accuracy to achieve a separate distribution of datasets is the goal of the DT algorithm. The objective function expressed as Equation (6) is constructed to solve the accuracy problem through minimizing classification error. The misclassification error rate
is calculated in Equation (7) based on the misclassification rate
r(
t) of a case in node
t and the probability
p(
t) of one case falling into node
t, where
r(
t) and
p(
t) are obtained from cross-validation steps.
where
Tk0 represents the optimal DT that with minimum
,
Tk represents the binary tree, and
t represents the node of the tree.
To embed this idea into the relay setting, suitable relay actions represented by end nodes are trained by dataset DT. Action commands are the action settings of each relay. To prevent mis-operation, the coordination criterion between primary and secondary protection is set as 0.2 s. In the meantime, the employed P2P communication structure offers double assurance that backup protection acts only if primary protection fails. Therefore, once the primary and backup protection action points have been determined by the DT, coordination between relays is established.
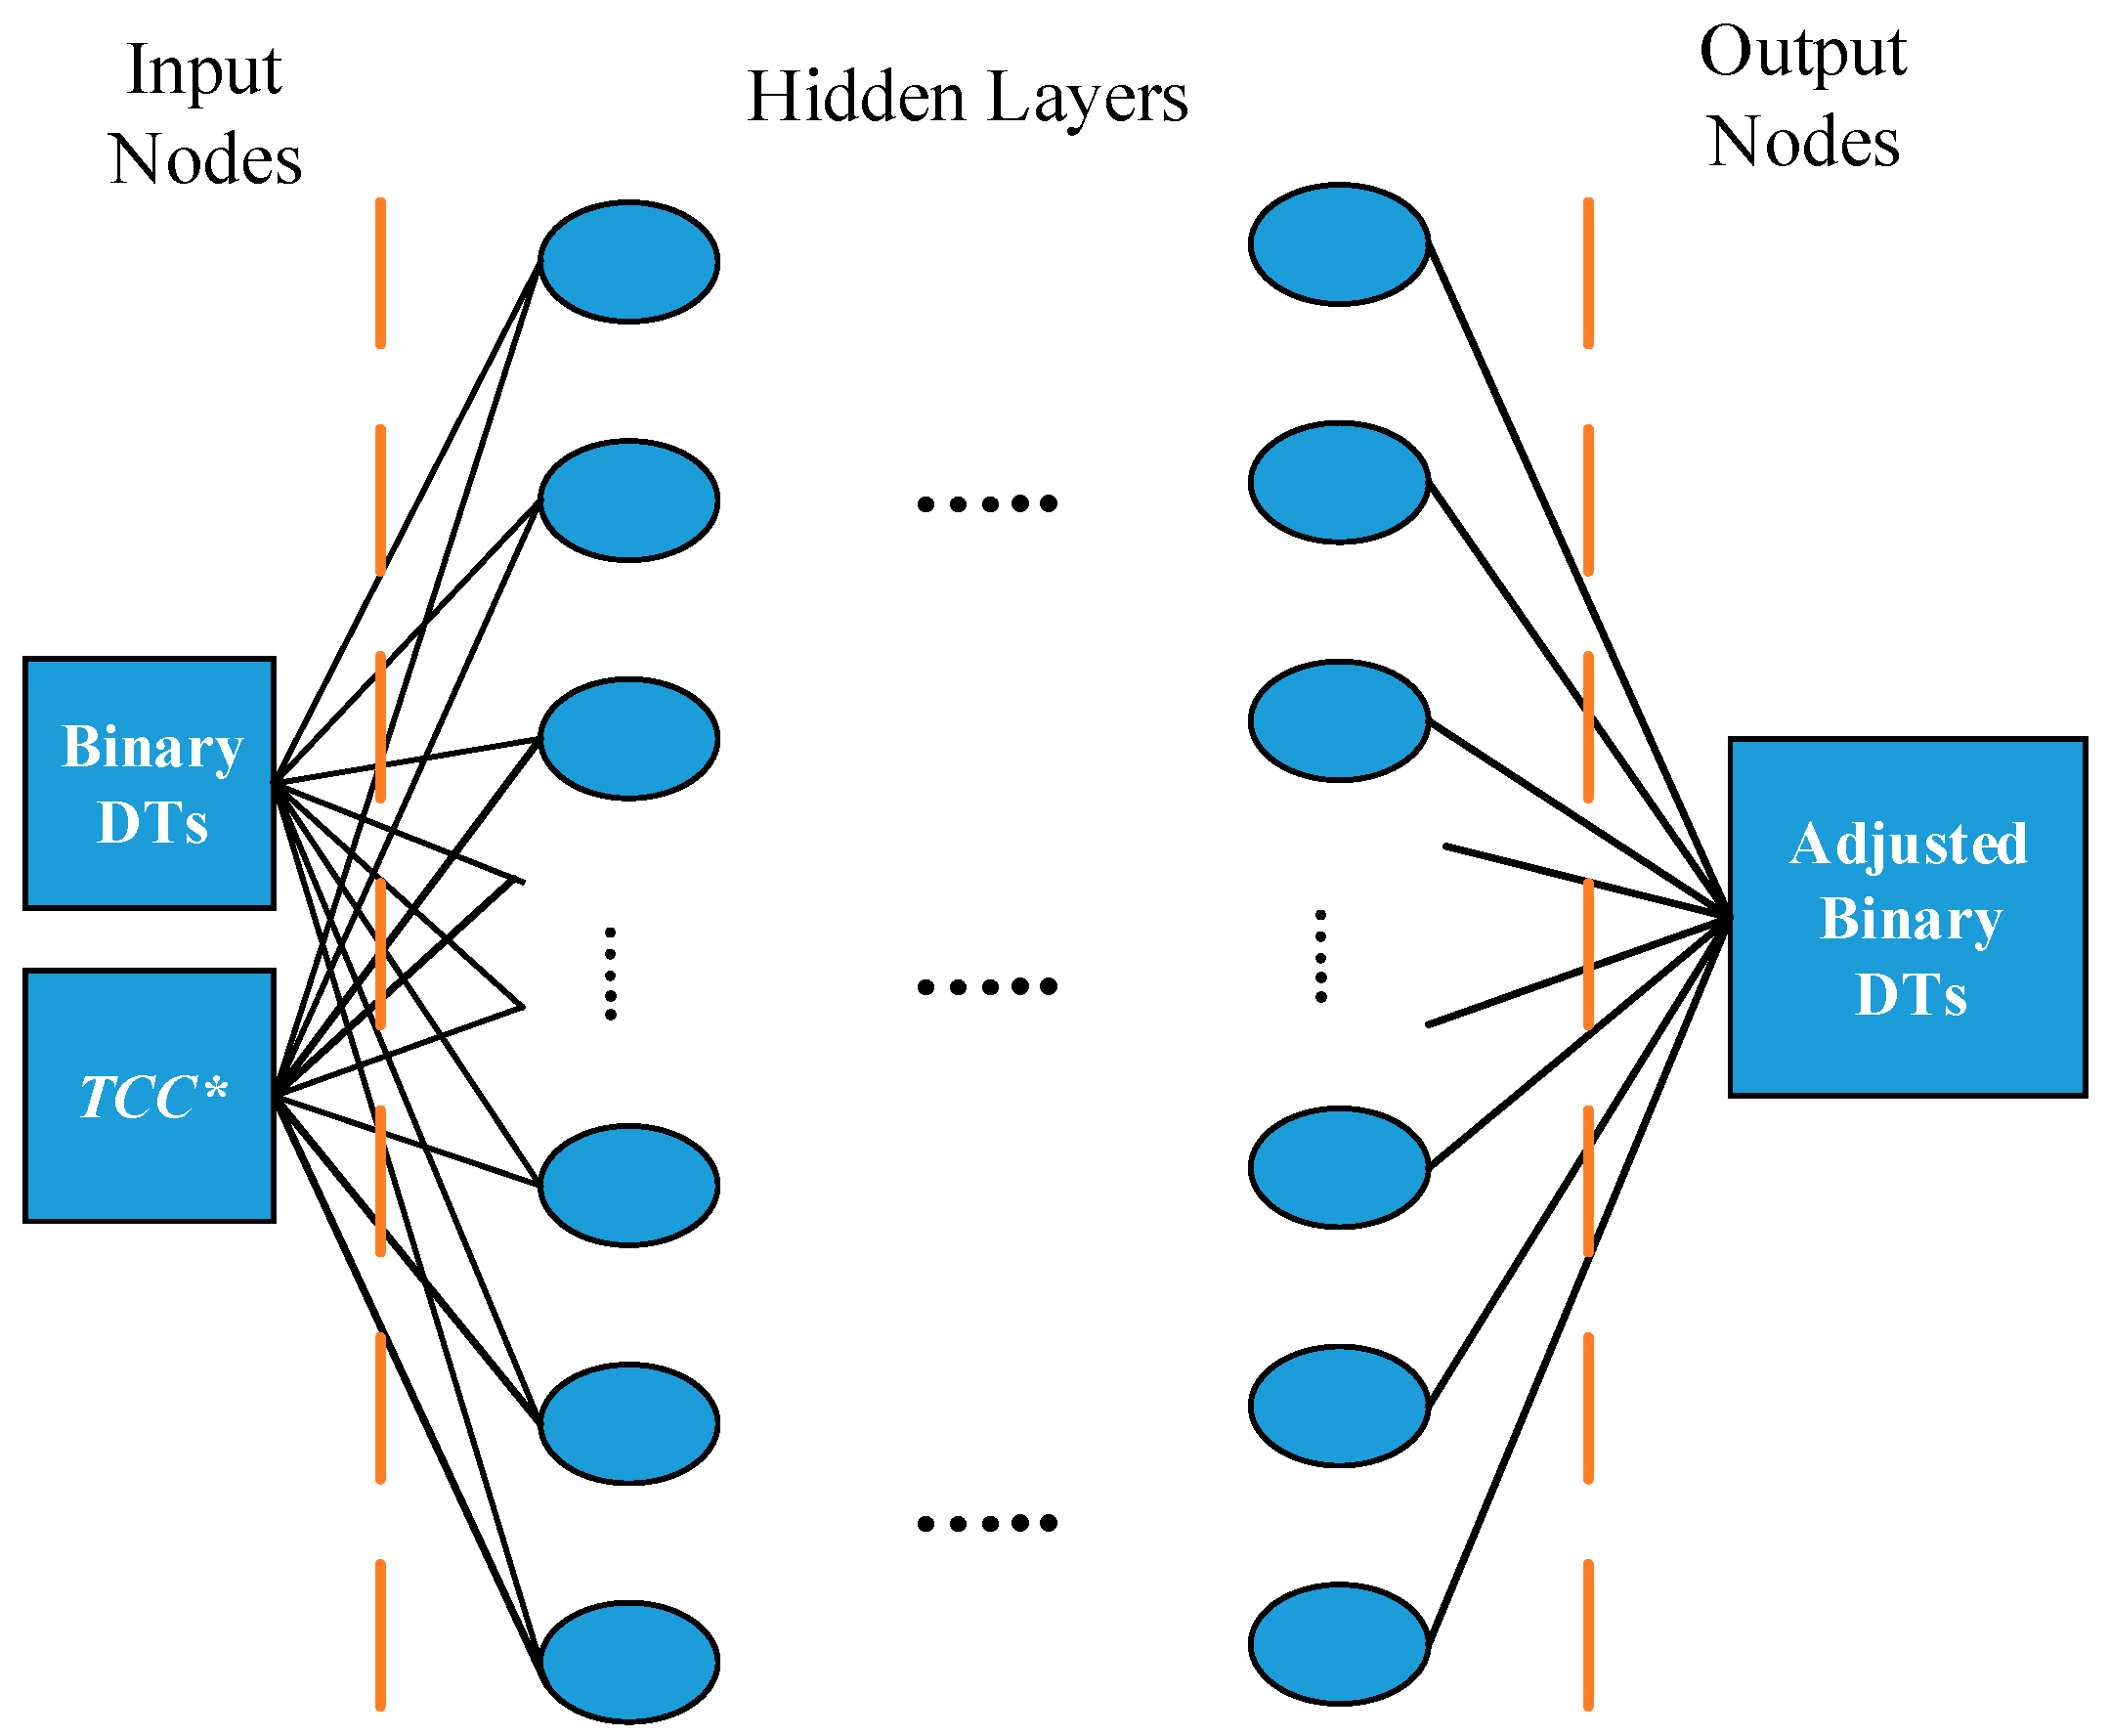
3.2. Neural Network Topology-Adjusting Algorithm
Inspired by the biological principle of neural networks, a neural network algorithm was developed. The system constitutes a substantial improvement in terms of performance compared with traditional artificial intelligence algorithms by changing construction when variations in the input information are revealed. This principle guarantees the algorithm’s adaptivity and indicates that the algorithm is a suitable tool for adjustment.
The relay operation thresholds obtained in the previous DT step are the settings embedded in IED functions that enable accurate protection to be achieved. However, this alone cannot be referred to as “adaptive”. In power systems, especially those involving frequent topology reestablishment, the adaptive protection scheme must be able to adjust its settings to protect the system. The neural network topology-adjusting algorithm (NNTA) was developed for this purpose.
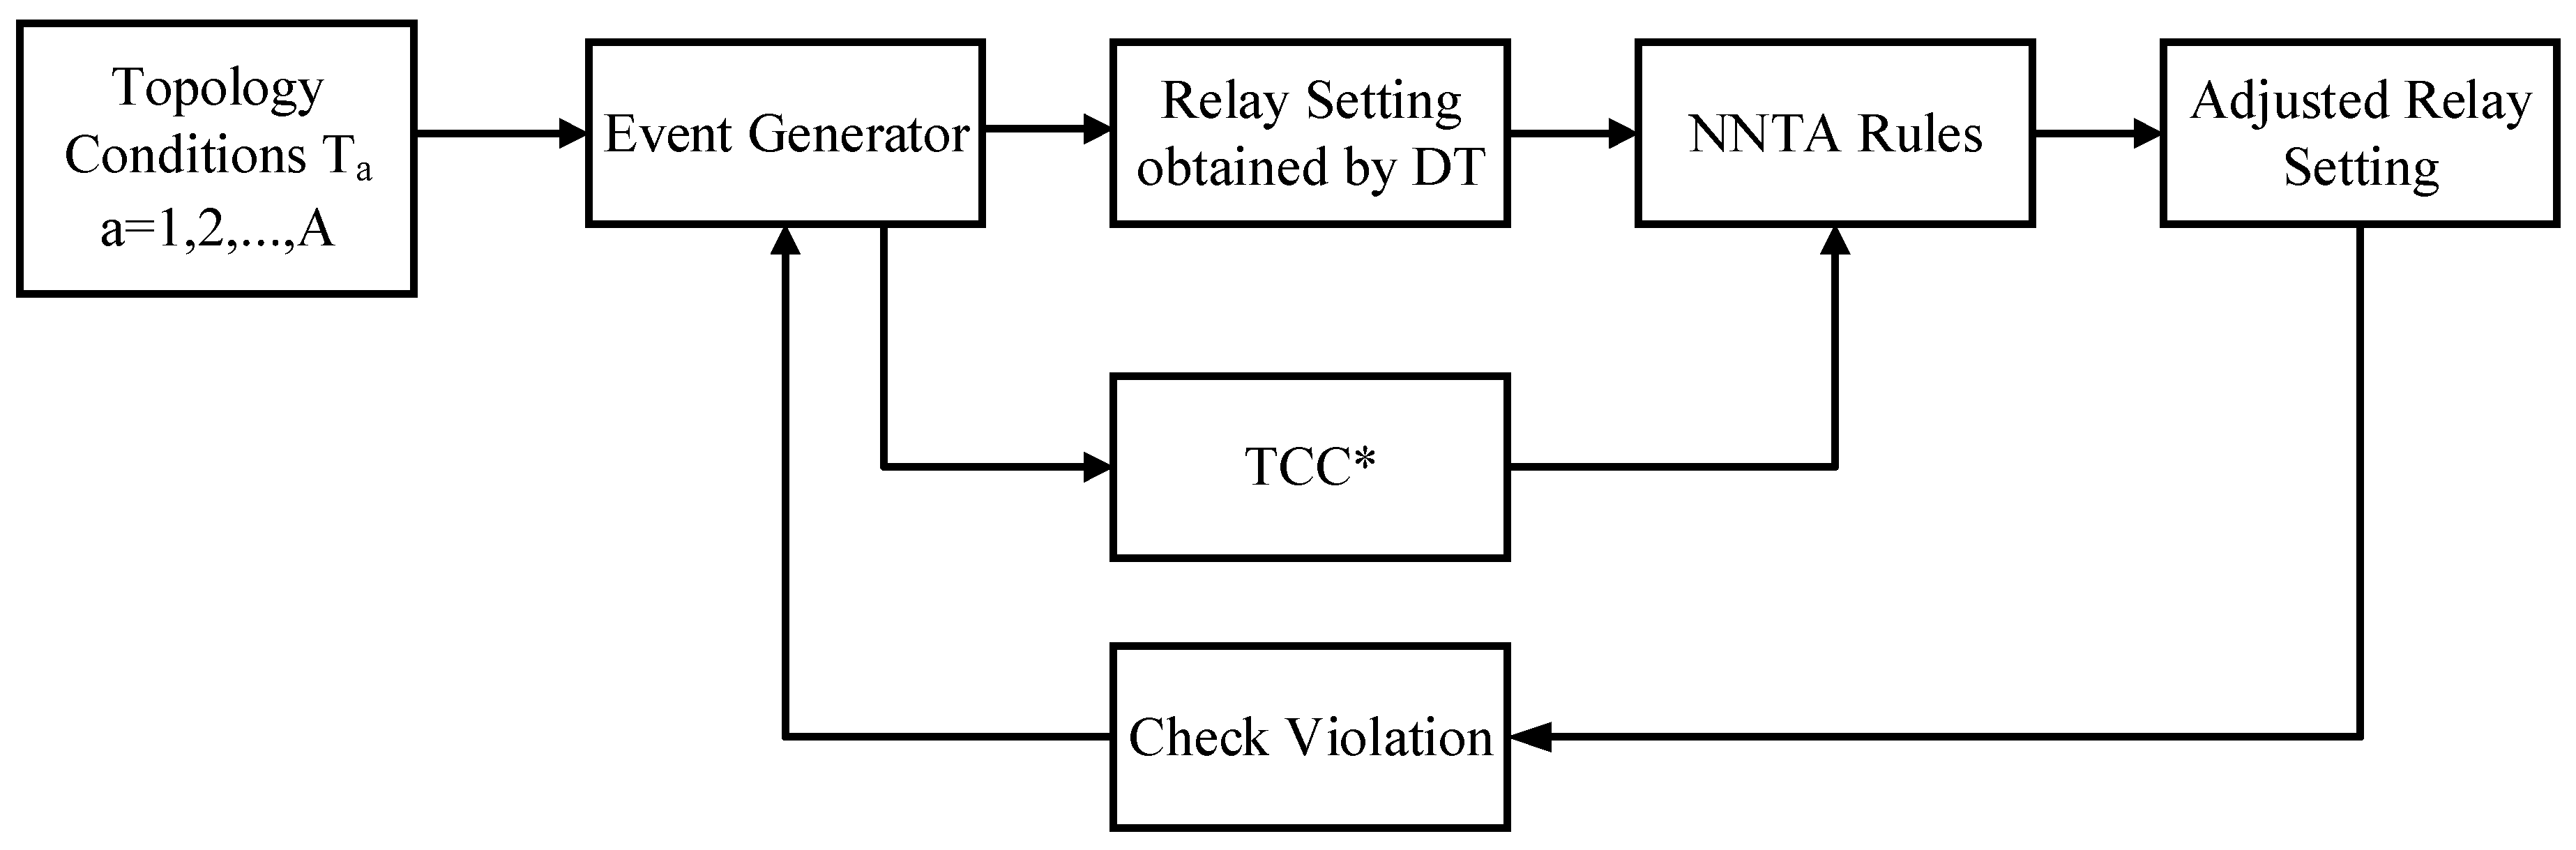
Figure 4 illustrates the flowchart of the training procedure, where a pieces of topology condition data are assembled. Data
∂P/∂t for TCC* are produced by various faults created by the event generator for various topology situations. The relay setting is achieved via the constructed DT at the same time. Subsequently, TCC* subsets with corresponding relay settings are combined to prepare for training for NNTA rules. The rules are determined through the NN architecture as presented in
Figure 5 through the weight adjustment by back-propagation approach [
28].
The training process elucidates the relationship between TCC* and the threshold adjustment of each DT. A threshold of TCC* is also obtained embedded in this black-box algorithm to determine whether the adjustment prunes the splits or leaves when some connected devices are out of service. Moreover, the close-loop architecture enables the adjusted tree to be corrected in real time and can be fitted to various probable conditions by checking if violation exists with adjusted relay setting and the generated events.
It is remarkable that only data collection and simple calculations are accomplished by IED. Other computations are accomplished by Cloud or central server in substation to mitigate the computation burden of IED. It thus decreases the investment cost and increases the efficiency at the same time. Data collection, data preprocessing, data mining, and training procedures are all performed offline. After the relay settings and NNTA rules are determined centralized and then embedded in the IED, the fault can thus be detected online in real time. The settings, therefore, become adaptive to various system configurations, since they will be updated as soon as it is detected that TCC* reaches the threshold learnt from NNTA rules, a fact which means the topology has changed. Each IED is assumed to communicate with each other through IEC 61850 protocol and built to be a peer-to-peer information exchange architecture to ensure the system stability and security.
4. Simulation Results
The proposed method has been verified in two test systems, the IEEE 30-Bus test system and a practical 83-Bus power system in Taiwan, to demonstrate its applicability in various fault locations. PowerFactory software (15.2, DIgSILENT GmbH, Gomaringen, Germany) was employed to simulate the test systems and collect the event data. Weka was employed for DT construction, and Matlab (R2017a, MathWorks, Natick, MA, USA) was used for CWT preprocessing and NNTA modeling.
Sixteen conditions were evaluated, as listed in
Table 1, with DGs, FCLs, load variations, and topological reconstructions considered. Faults were assumed to have occurred at various line locations (1%, 25%, 50%, 75%, and 99%) and on various buses and transformers. The data collected by IEDs included all the information presented in
Section 2. These data were subjected to CWT and sensitivity analysis.
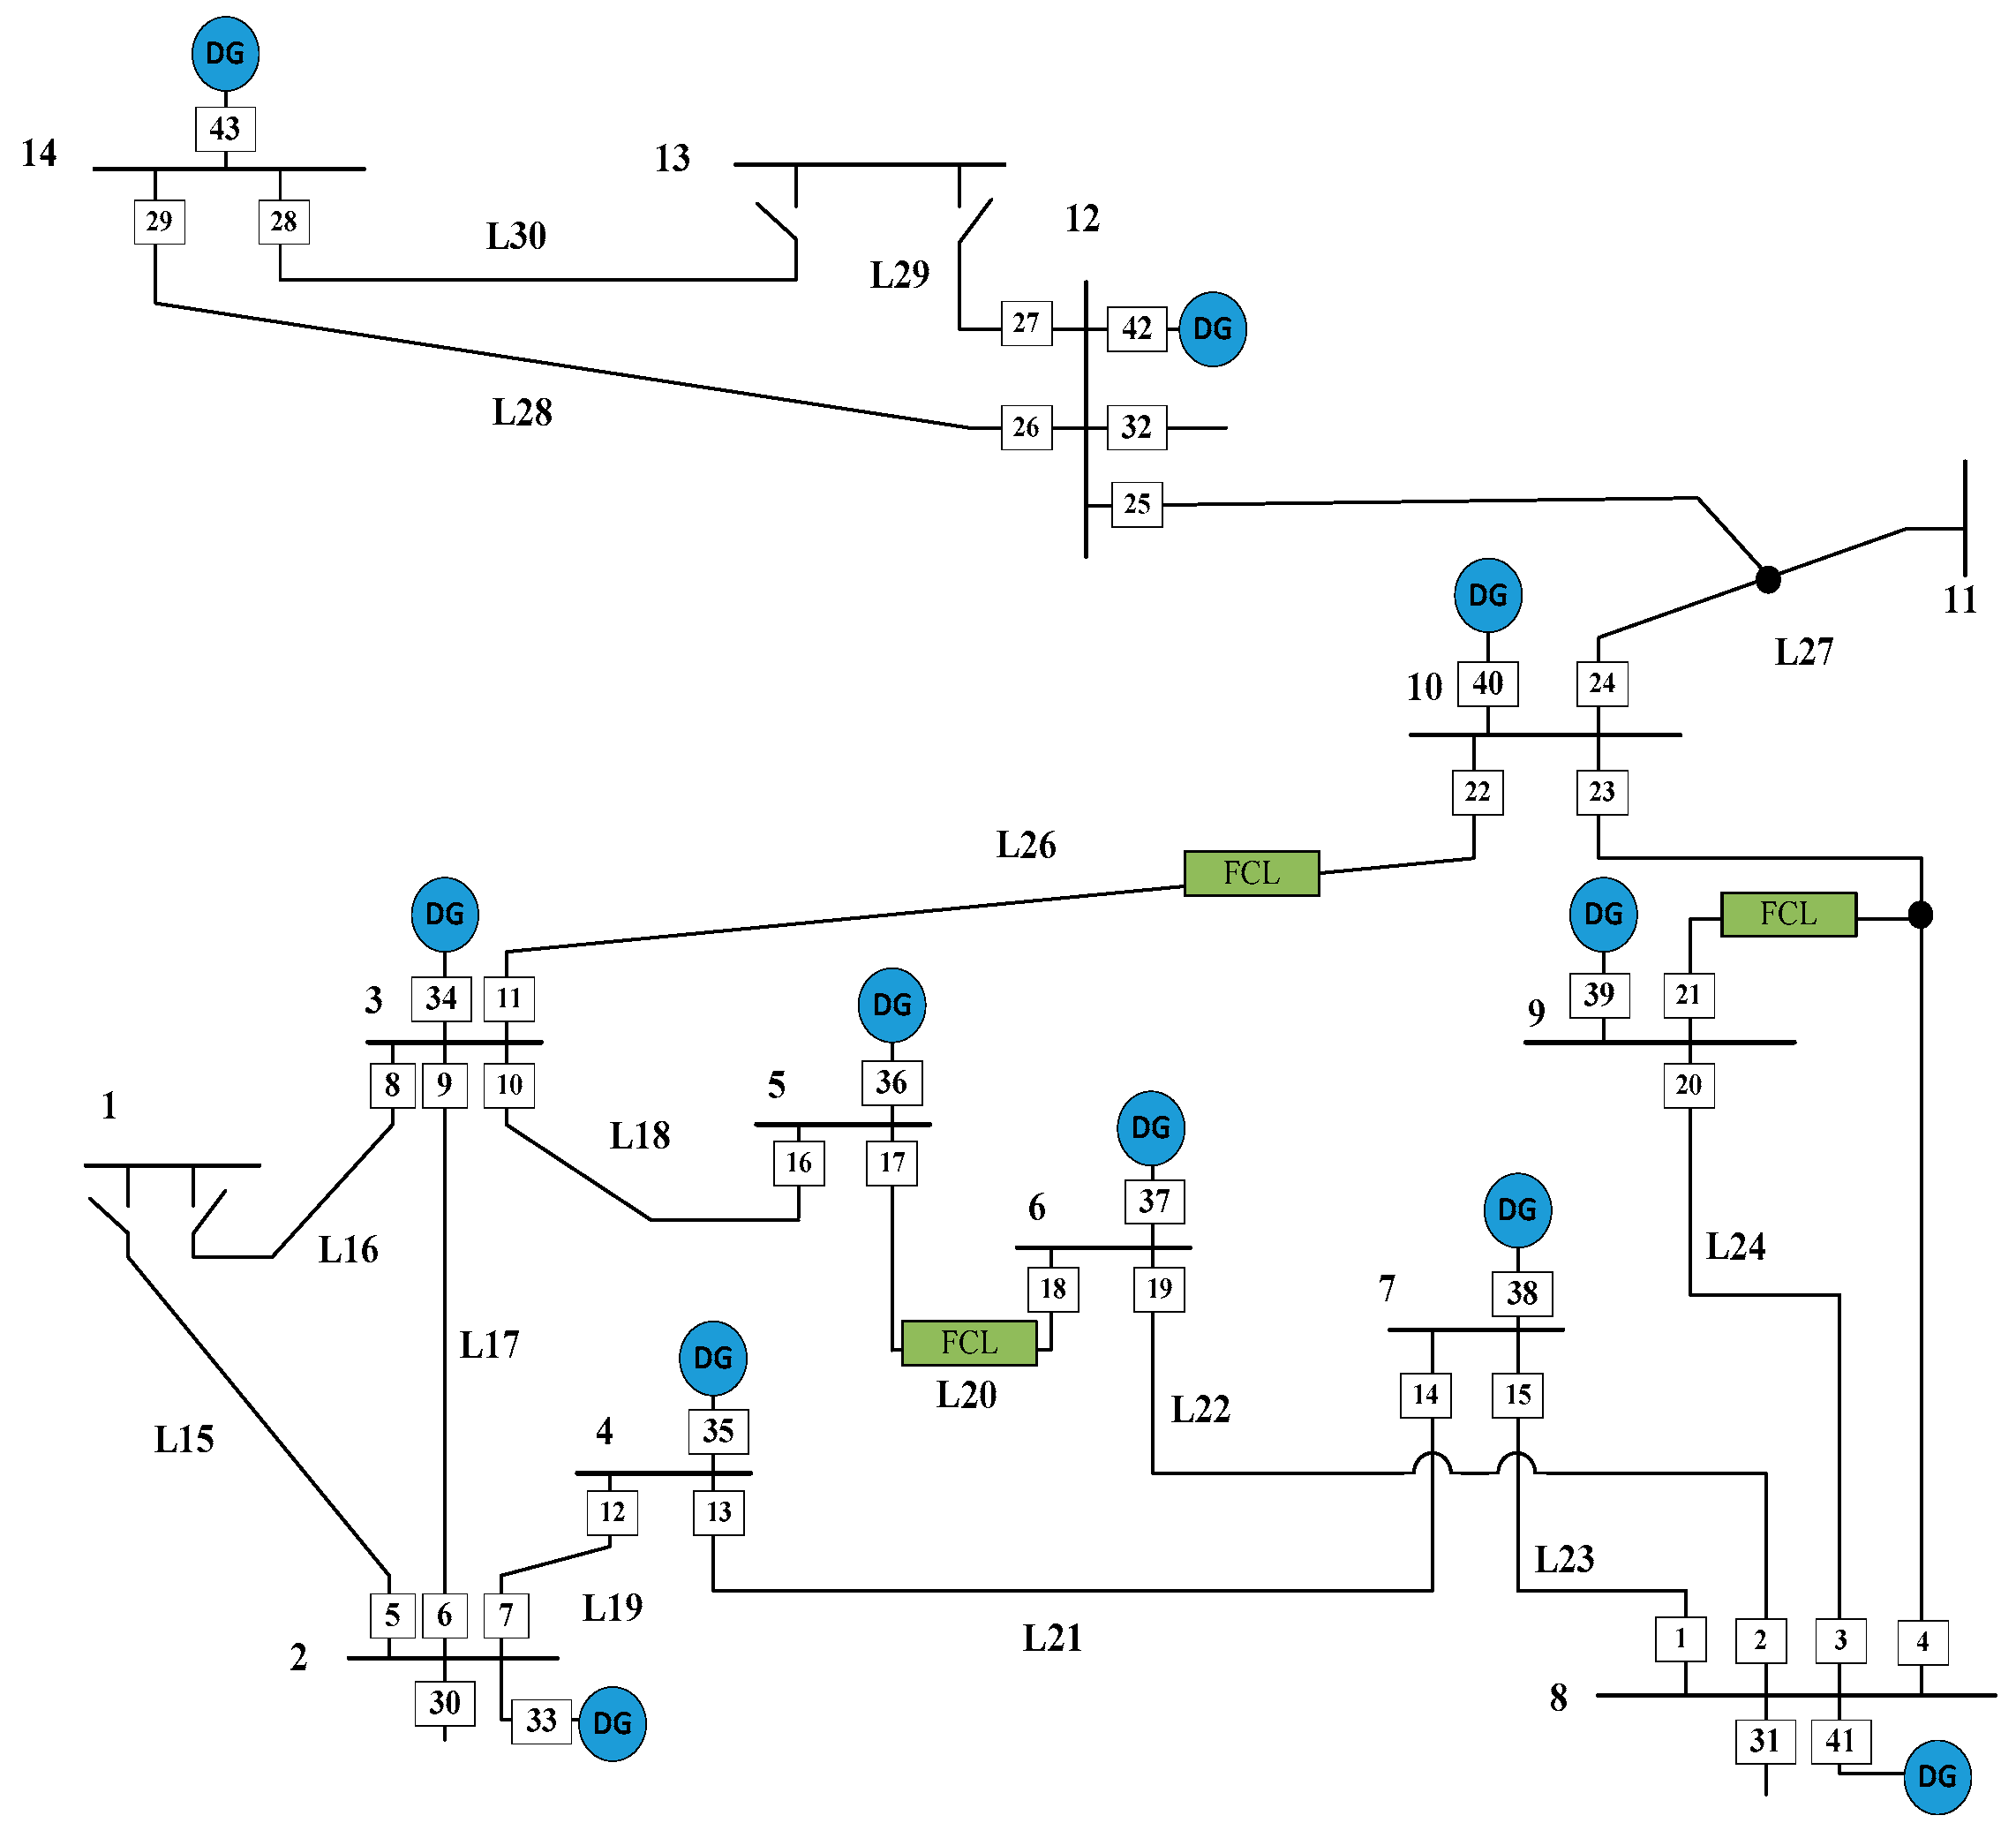
4.1. IEEE 30-Bus Test System
The study case involved the IEEE 30-bus distribution network with six DG units and three FCLs. IEDs were assumed to be installed at the ends of lines and are denoted by square symbols in
Figure 6.
Condition 1 was evaluated as an example. The relay setting obtained by the DT for relay 8 is shown in
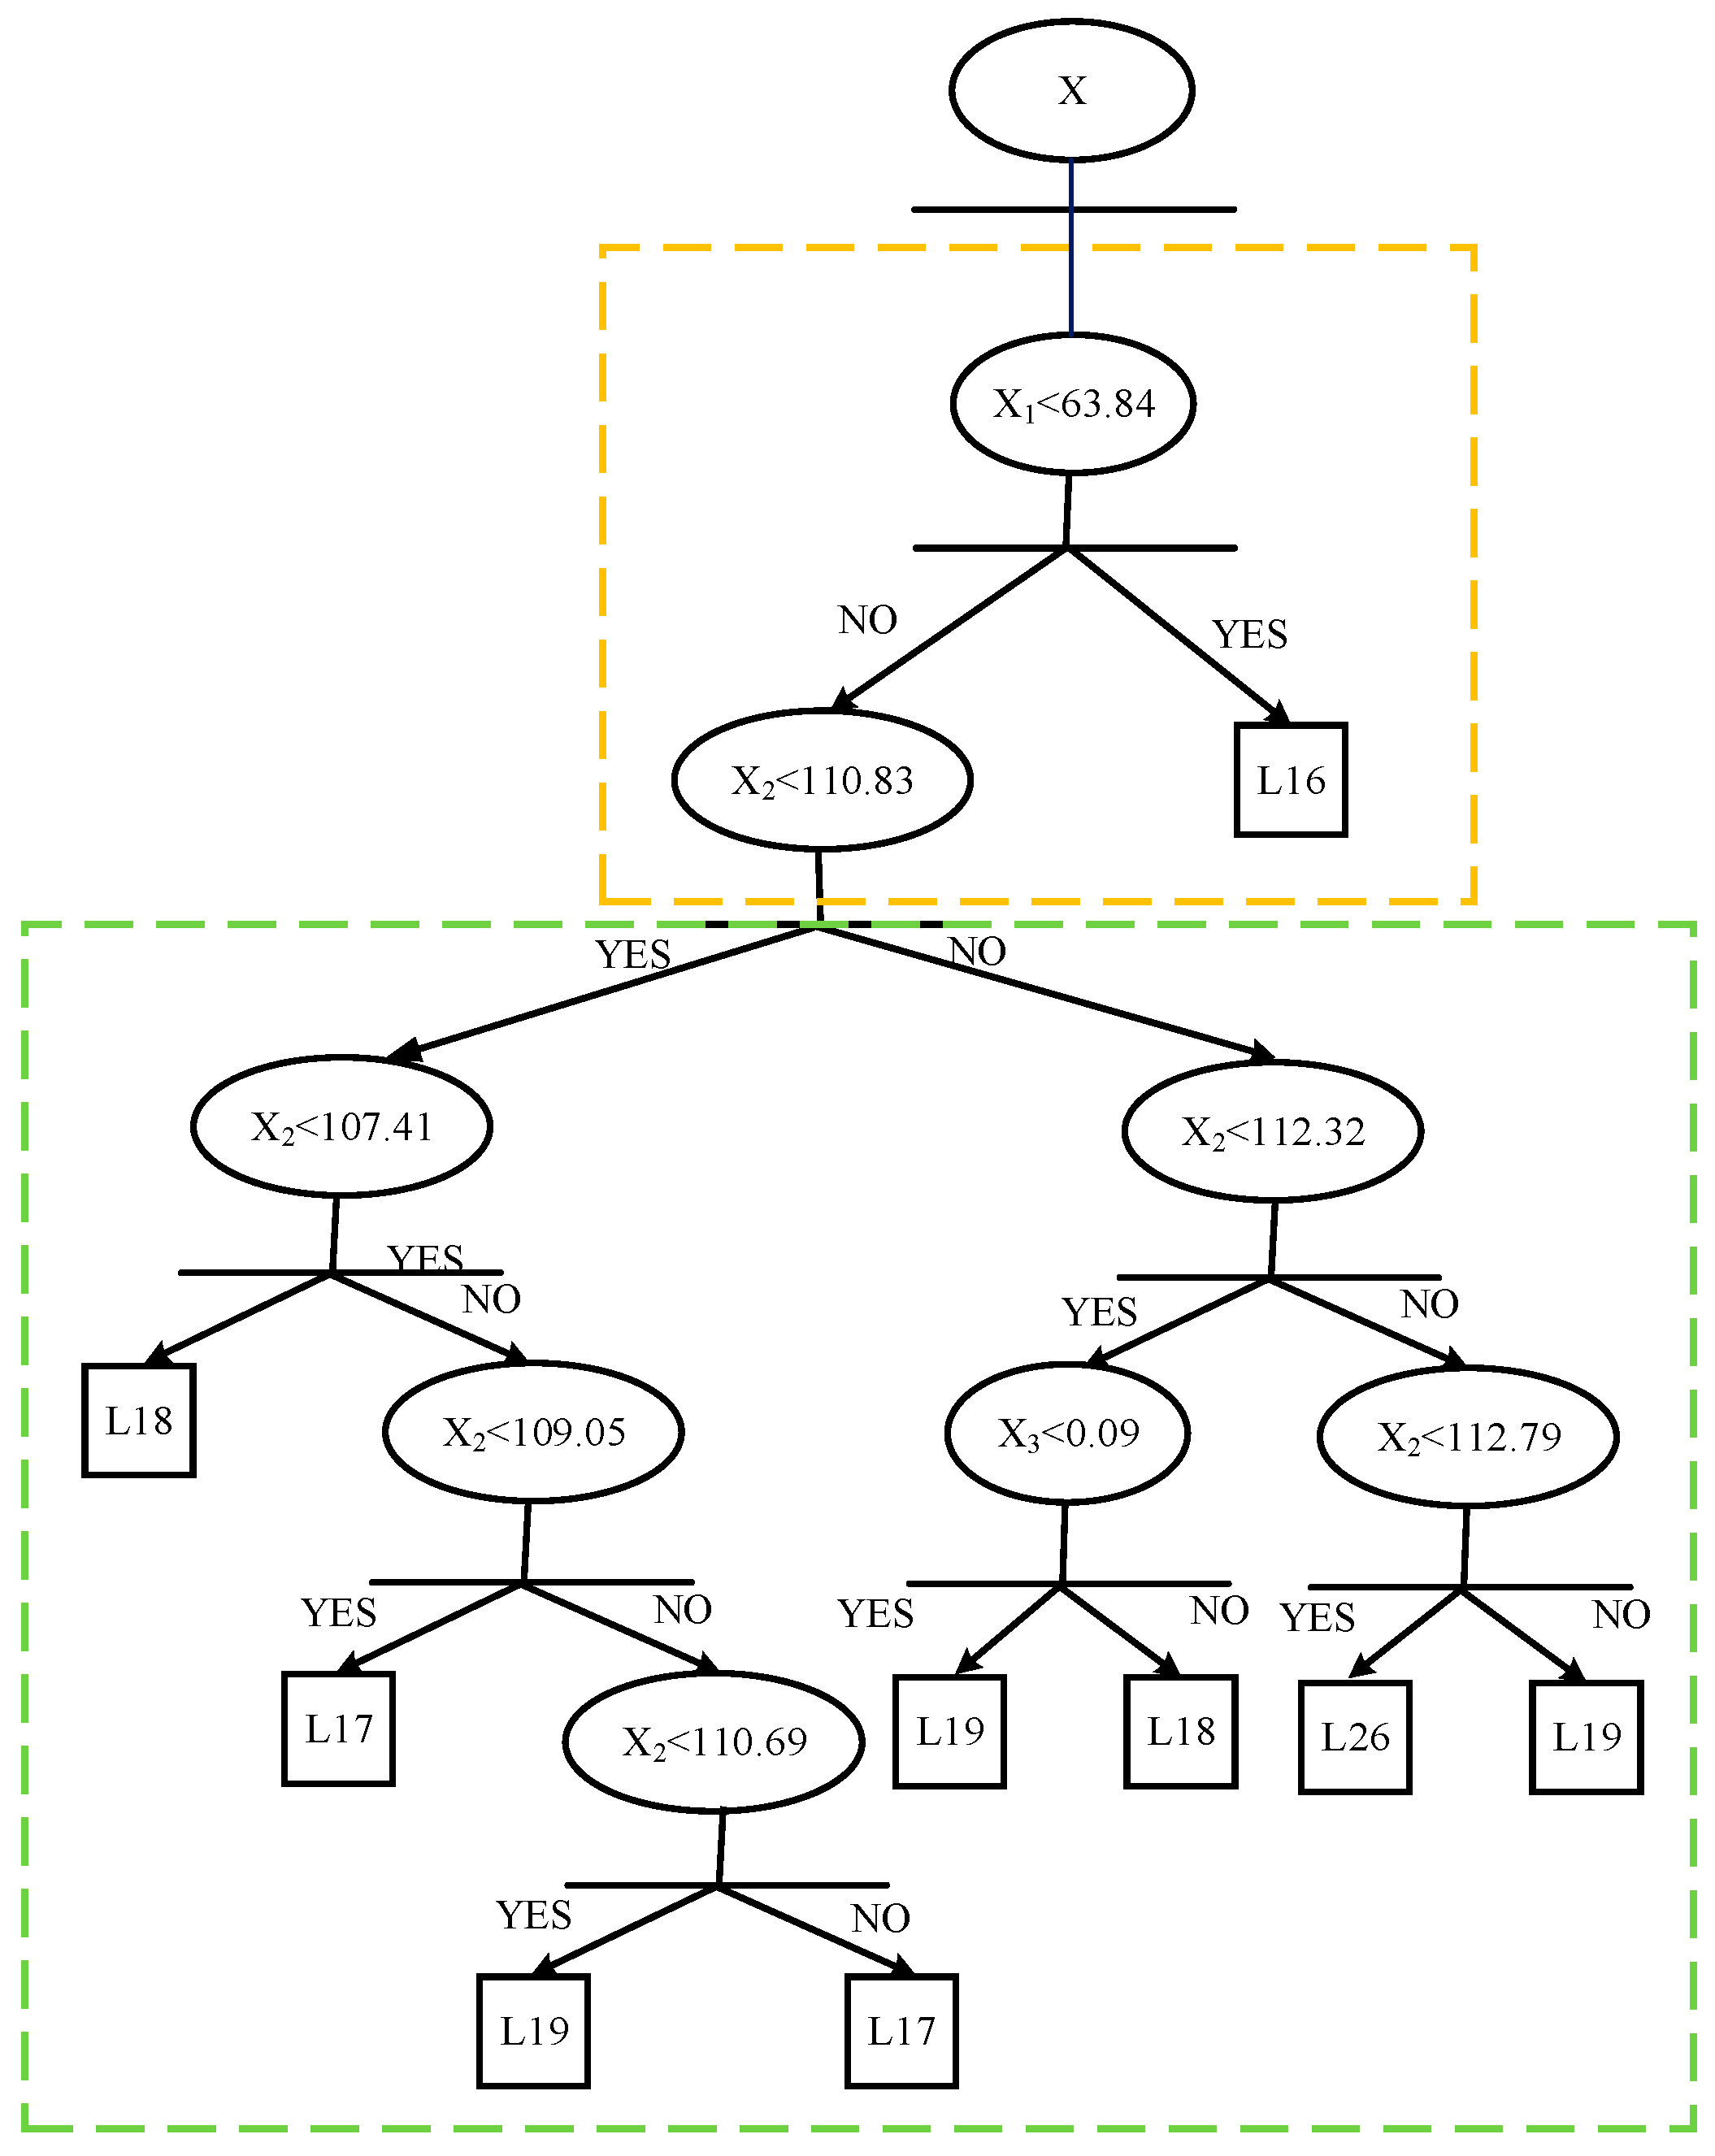
Figure 6, after features being preprocessed separately through CWT. The primary protection was determined within the step described in the yellow box in
Figure 7, where the fault on L16 was detected. The secondary protection of relay 8 acted within the steps in the green box, rendering it the backup relay for L17, L18, L19, and L26. Notably, to ensure that the IED clearly determines whether the fault occurs in the primary protection area (e.g., L16 to relay 8) or one of the secondary areas (e.g., L17, L18, L19, and L26 to relay 8), the relationship between the line index and IED index should be pre-stored in each database. The relationship must be unique.
The tie was assumed to switch from bus 1 to bus 2, and buses 1–3 were opened as a base case. The power did not flow through L15 to L16. Thus, relay 8 was not the backup relay for L15, and this was also verified by the DT output.
Regarding all different faults occurring on L17, L18, L19, and L26, for which relay 8 served as backup protection, relay 8 engaged in the same operation. Therefore, all the DT can be transferred to a simplified form through pre-determining this relationship.
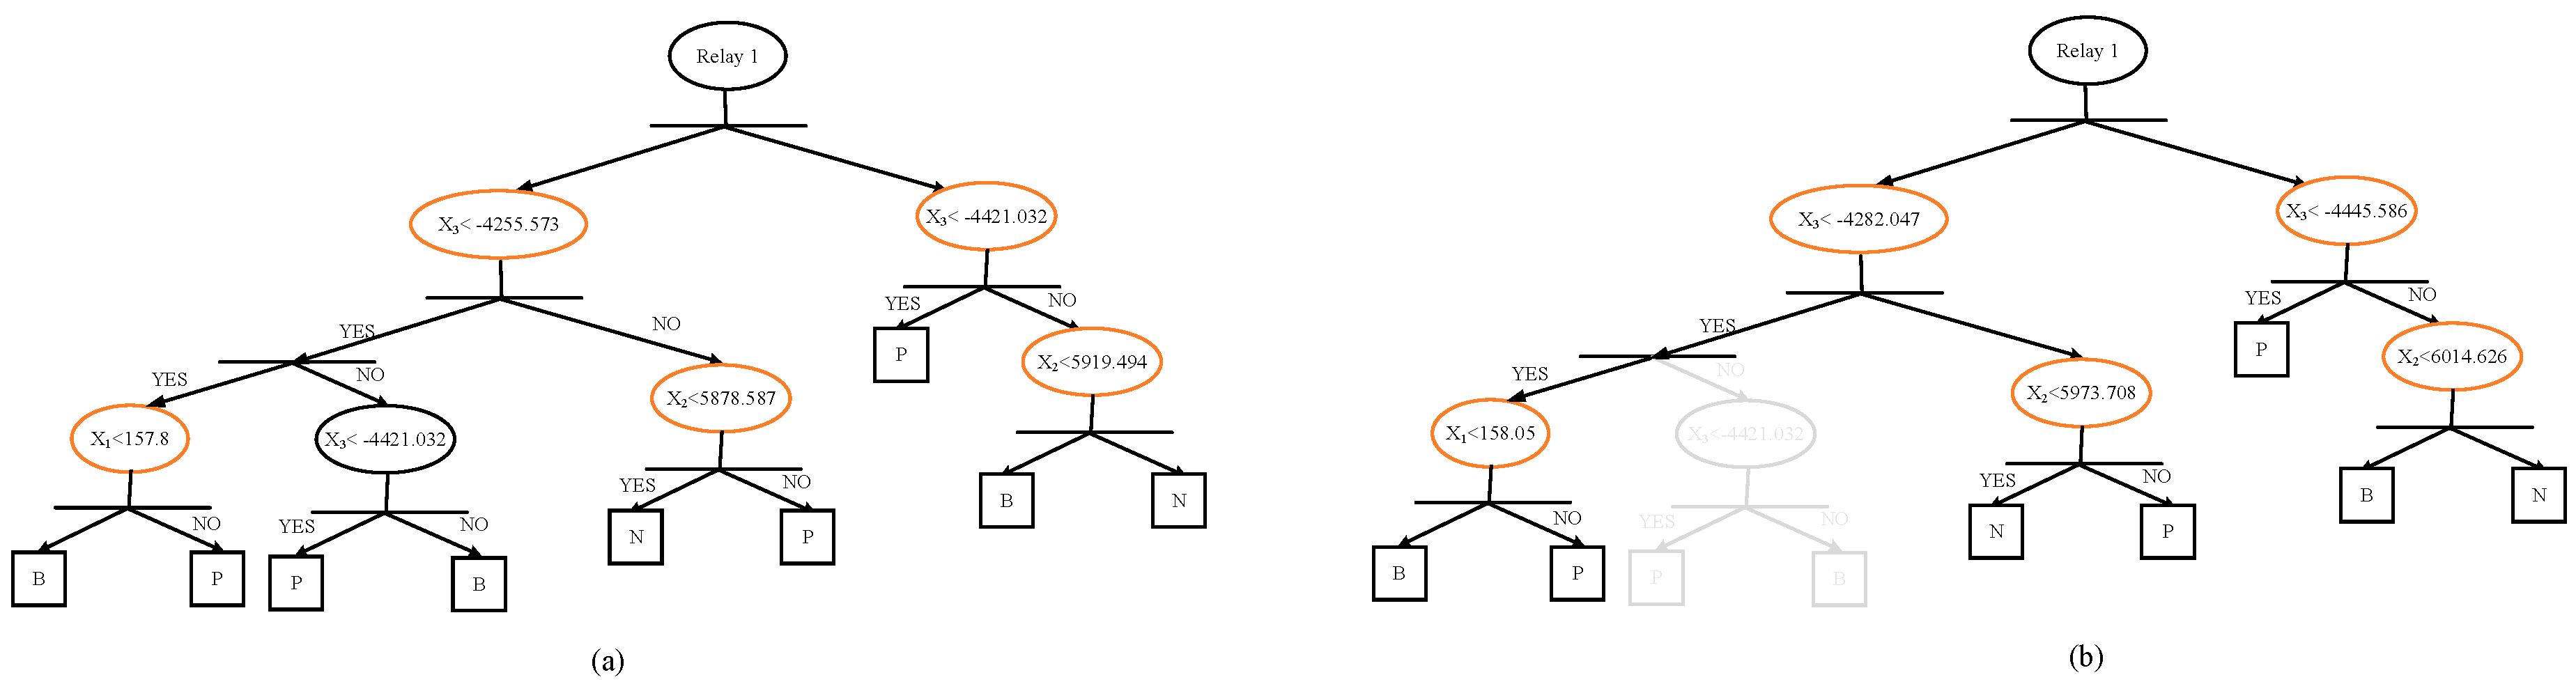
Figure 8a is a simplified DT structure for relay 1, where P, B, and N signify primary protection, backup protection, and no action, respectively. Through this method, the action status was determined in at most two estimation steps, whereas the NNTA rule model was constructed far easier.
This study employed FTC* and its related DT and TCC* values from conditions 2–15 as training data for NNTA rules. Condition 16 was the test situation. The DT of relay 1 obtained from NNTA rules is shown in
Figure 8b. The thresholds in each step were slightly adjusted and one split was pruned. Among the DTs training based on various topologies, pruned splits were mostly found in situations where branches or devices connected to the same bus were out of service. By contrast, new splits or nodes were established when normal-open tie switches or DGs were assumed to be in service.
Various fault events were generated randomly in condition 16, which contained 238 classified instances, comprising 14 backup protection events, 7 primary protection events, and 217 no-action events. The fault rate (as calculated by Equation (8)) of the proposed method for building a protection model was calculated as zero without error of detection.
4.2. Practical 83-Bus Power System in Taiwan
With three voltage levels of 161, 33, and 11.5 kV, the practical factory system used for verifying the proposed method consisted of 83 buses, 48 loads, and 14 generators. One IED only was assumed to be installed at the end of each branch.
To demonstrate its accuracy and computing efficiency, the test system was simulated with two test cases. One was for general topology without topology changes or new devices installed (called the “base case”), and the other was the test case, which referred to condition 16 in
Table 1 used to constitute the scenario. A method proposed in a previous study was simulated and used as a reference method [
13]. This reference method involves a coordination function and fuzzy adjustment procedure to ensure adaptive protection.
The comparison is presented in
Table 2. In the base case, our proposed method and the reference method exhibited high performance in terms of not only failure rate but also the coordination results. Our method exhibited higher performance in terms of computing efficiency. In the test case, the reference method failed to achieve protection coordination, with a 30% failure rate. By contrast, the proposed scheme achieved 0% failure, with a shorter operating time for relays and shorter total computing time. Notably, the online adjustment modeling times (fuzzy rule in the reference method and NNTA rule in the proposed method) are not considered in the total consumption time in the comparison table.
4.3. Discussion
The overall model construction process involved four steps: event generation, CWT preprocessing and sensitivity analysis, data tree construction, and NNTA rule modeling. Each step was determined to require a specific duration, namely 120.33 s, 26.68 s, 1.85 s, and 68.43 s, respectively, in the IEEE 30-bus system as well as 320.88 s, 60.4s, 21.33 s, and 180.72 s, respectively, in the 83-bus system. The total model construction duration was less than 4 minutes for the 30-bus system and 10 min for the 83-bus system, which were both run offline by the simulation models. The online adjustment algorithm required 0.63 s to retune the relay settings based on the 14 test cases (conditions 2–15) for the 30-bus system. Online adjustment for the 83-bus system required 0.87 s. In conclusion, the proposed method achieved the objectives of maintaining 1R&3S criteria (Reliable, Stable, Sensitive and Selective) and adaptive protection.


