Article

Impact of Demand Side Response on a Commercial Retail Refrigeration System

School of Engineering, University of Lincoln, Brayford Pool, Lincoln LN6 7TS, UK
*
Authors to whom correspondence should be addressed.
These authors contributed equally to this work.
Energies 2018, 11(2), 371; https://doi.org/10.3390/en11020371
Submission received: 26 December 2017 / Revised: 10 January 2018 / Accepted: 20 January 2018 / Published: 5 February 2018

Abstract

:
The UK National Grid has placed increased emphasis on the development of Demand Side Response (DSR) tariff mechanisms to manage load at peak times. Refrigeration systems, along with HVAC, are estimated to consume 14% of the UK’s electricity and could have a significant role for DSR application. However, characterized by relatively low individual electrical loads and massive asset numbers, multiple low power refrigerators need aggregation for inclusion in these tariffs. In this paper, the impact of the Demand Side Response (DSR) control mechanisms on food retailing refrigeration systems is investigated. The experiments are conducted in a test-rig built to resemble a typical small supermarket store. The paper demonstrates how the temperature and pressure profiles of the system, the active power and the drawn current of the compressors are affected following a rapid shut down and subsequent return to normal operation as a response to a DSR event. Moreover, risks and challenges associated with primary and secondary Firm Frequency Response (FFR) mechanisms, where the load is rapidly shed at high speed in response to changes in grid frequency, is considered. For instance, measurements are included that show a significant increase in peak inrush currents of approx. 30% when the system returns to normal operation at the end of a DSR event. Consideration of how high inrush currents after a DSR event can produce voltage fluctuations of the supply and we assess risks to the local power supply system.

1. Introduction

Electrical generation and transmission infrastructures of many countries are under increased pressure. This partially reflects the move towards low carbon economies and the increased reliance on renewable power generation systems [1]. Traditional fossil fuel generation systems, which provide a stable base load, have been replaced with less stiff renewable supplies. The available supply to the grid is therefore becoming less predictable [2]. To ameliorate these effects, the UK National Grid is placing increased emphasis on the development of Demand Side Response (DSR) tariffs and active load management mechanisms to better match electrical supply and demand. The successful implementation of DSR will require large numbers of electrical consumers to integrate demand reduction from industrial processes [3].
Mechanisms include Firm Frequency Response (FFR) which is triggered when the grid frequency drops to a predefined level. Two phases of FFR are then initiated, the first phase (termed primary FFR) where load is rapidly shed and held off for 30 s, whilst in the 2nd phase (termed secondary FFR) the load has to be held off for up to 30 min, as depicted in Figure 1.
Financial rewards for delivering primary and secondary FFR reflect the load shed. Currently, the minimum tender load is in the order of 10 MWs. The uptake of FFR DSR has increased significantly and can be deployed via the shedding of a single large load or via the aggregation of large numbers of smaller connected loads [4,5,6,7,8,9]. Where large numbers of loads are aggregated, multi-vector devices controlling a buffered thermostatic load are considered well suited for FFR DSR [10,11]. These include heating, ventilation and air conditioning systems (HVAC), hot water storage tanks and refrigeration systems. Such devices are thermally buffered and can withstand short-term (0 to 30 min) loss of operation [11].
Refrigeration systems could have national significance for DSR. The Carbon Trust estimate that “cooling” (refrigeration plus HVAC) consumes 14% of the UK’s electricity [12]. The food industry is the UK’s largest manufacturing sector, accounting for £188bn of consumer expenditure and 18% of the total UK energy consumption. The food retailing sector alone uses c. 12 TWh of energy per annum and accounts for 3.4% of total electrical consumption, within this c. 29% is used to power in-store refrigeration units [12]. However, the application of DSR in food systems is not straight forward; in particular, sufficient thermal inertia is required within a refrigerator to maintain the integrity of the food when the electrical load has been reduced or shut down [13,14].

2. The Extent of the Challenge

Food refrigeration networks can involve substantial numbers of cases and compressors. Large UK retailers can have estates of over 100,000 refrigeration cases. However, deploying FFR within massive networks poses significant technical challenges. These include the need to control refrigerators across the entire country at high speed without jeopardising the safety of the food or the assets. This is complicated by set point temperature being dependent on product type and achieved temperature can vary significantly throughout the day [15]. An example is shown in Figure 2a, which depicts measurements from one retailer showing the product temperature distribution for 18,653 low temperature (LT) cases (i.e., freezers) with temperatures varying between −32 and −1 °C during a 24 h period from 12:30 p.m. to 12:30 p.m. of the next day, while Figure 2b shows the product temperature distribution for 49,897 high temperature (HT) cases with temperatures varying between −1 and 8 °C for the same period of time.
Furthermore, previous studies have identified issues of post DSR event power synchronization that create high transient demands by refrigeration systems [16,17]. Whilst control and protection devices on power system networks can work to minimize power fluctuations, synchronization could compromise the stability of the grid and increase network failure risks [18,19]. For small groups of domestic refrigerators, computationally demanding stochastic decentralized control has been proposed to ameliorate the effects of these power oscillations [20,21,22]. Initial studies suggested that networks of refrigerators can trigger sequential under-frequency events particularly after switching off and return to operation [23]. Moreover, stability can be further degraded by post recovery inrush currents and this has yet to be investigated and reported.
In addition, the application of DSR to thermostatic loads relies on a stable thermal inertia to buffer short term shedding of the electrical supply. Systems where the thermal inertia can rapidly change carry increased risks. This applies to food retail refrigerators, where product is purchased by consumers and replenished by the store. For food systems, great care is required to ensure that temperature does not increase above legally required set points. Any control system will therefore require the real-time estimation of the thermal inertia of the refrigeration system to ensure food safety temperature breeches do not occur. The duration that cases can be shut down for DSR is then a function of case temperature at the start of the DSR event, the rate at which the case warms when the cooling load is removed, thermal inertia of food, system insulation and the food safety temperature limit which should not be exceeded. Moreover, delivering FFR DSR across multiple retails outlets on a national scale requires a considerable IT architecture to handle large, high bandwidth data streams. [24,25,26,27].
Many research outcomes have addressed the impact of DSR on the voltage stability of power distribution networks and the effect of load shedding/shifting on overall network stability [28,29]. DSR actions can change the voltage waveform of the network (amplitude or angular, or both), with the level of impact dependent on the type and size of the shed load (induction motor, constant impedance load, or both) from one hour to another. It has been reported that shedding constant impedance loads decreases maximum loadability (the critical point of the system where beyond this point the voltage tends to become unstable) of the network rather more than other induction motor type loads [28].
A common phenomenon occurring in electrical power system are inrush currents; the maximum instantaneous current drawn by the electrical motors or devices at start-up. Inrush currents are always unbalanced among a three phases power system and create a drop in the line voltages of the power system, thereby degrading the power quality of the overall network. The declining quality levels depend mainly on the decay time constant and the magnitude of the transient inrush current [30,31,32]. Inrush current phenomena have hitherto not been studied in large scale commercial retail refrigeration systems as a consequence of FFR DSR control mechanisms. They remain a system risk and need a better understanding prior to wide scale deployment of DSR on a large commercial scale.
It is clear from this overview that key system risks to the application of DSR to food refrigeration systems (synchronisation and changes in thermal inertia) have previously been identified. However, all previous studies of the application of DSR to food refrigeration systems have focused on domestic refrigerators or simple systems where a single case is cooled by a single compressor. Large retail refrigeration systems are far more complex and a typical configuration will comprise a pack of compressors cooling multiple cases but with either a centralized or distributed controller per case. In this paper, the first experimental study of FFR mediated dynamics of a large scale multi-case/pack system, is considered, along with how they can be used to facilitate DSR. In particular, the variation of temperature in refrigeration cases, the profiles of suction and discharge pressure of refrigerant and the ability of the cases to safely recover after a DSR, are demonstrated. Moreover, the impact of transient compressor operation on the performance, inrush currents and risk associated with the power supply system, during and after responding to a FFR DSR, are investigated.

3. Refrigeration System Description and Testing Procedure

A refrigeration system common to small supermarket stores has been constructed in the Refrigeration Research Centre at The University of Lincoln. The cooling site consists of 13 HT cases (models Atlas FHGD and Monza FHGD) and 2 LT cases (model Hockenheim), 2 fans condenser unit (model RF-MB102L3H-091-E550) and a pack of Copeland Scroll compressors: 4 identical HT compressors (model ZB45KCE-TFD) and 2 LT compressors of different size (models ZF09K4E-TFD and ZF15K4E-TFD). All compressors operate as fixed volume displacement machines. The compressors receive refrigerant through separate HT and LT suction lines and feed it into a common discharge line, thereby providing one-stage compression for refrigerant from both HT and LT cases. Figure 3 presents the schematic diagram of the suction pipeline of the refrigeration system.
Case settings are presented in Table A1. Case controllers are Danfoss 514B and Danfoss 550. Case control set-points vary from −2 to 1 °C for HT cases and −23 °C for LT cases with the temperature differential set to 2 °C for all cases. Expansion valves types are AKV10 and TEX for HT and LT cases, respectively. Example measurements recorded for 24 h of normal operation of the system are shown in Figure 4. The defrost schedule consists of 4 defrosts per day for HT cases (Figure 4a) and 2 defrosts per day for LT cases (Figure 4b). Defrost is terminated either by timer or by reaching a pre-defined case temperature.
The compressors are controlled by Danfoss 531B to maintain a desired suction pressure in both the HT and LT suction lines. Suction pressure set-points are 3.4 bar for HT compressors (Figure 4c) and 0.7 bar for LT compressors (Figure 4d). Each case has four probes installed: two placed at the inlet and the outlet of the evaporator coil (S1 & S2) and the other two at the front and the back of the left half of the case (S3 & S4). Temperature control is performed based on the readings from S4 probe for all HT cases and a combination of two probes with a ratio of (0.6 S4 + 0.4 S3) for LT cases. This ratio is also called the shelf temperature and S3 and S4 are commonly referred to as air-on and air-off probes, respectively.
CPT represents the calculated product temperature, comprising of a 30 min moving average filter output based on measurements from air-on and air-off probes. The shelf temperature T s h e l f is a linear combination of T a i r o f f and T a i r o n [33].
T s h e l f = 0.6   T a i r o f f + 0.4   T a i r o n
with CPT at kth minute being
C P T k = 1 30 ( i = 1 29 C P T k i +   T s h e l f k )
and where T s h e l f k is the shelf temperature at the kth minute. This induces artificial thermal inertia to temperature readings from the probes and provides an estimated temperature of foodstuff on the shelves. It should be noted that CPT is also calculated for empty cases as no additional information about the shelf contents is used. As 29 previous CPT values are required to calculate a new one on each iteration, when logging starts the first 29 CPT readings are estimated and equal to the corresponding T s h e l f k values. Further readings are self-corrected over time.
The testing procedure is designed to examine different scenarios of system operation in response to FFR DSR. During triggered DSR events, the compressors of the refrigeration system are switched off for the first 30 s of the event and then switched back on with a suction pressure offset applied for 30 min. This allows limited flow of refrigerant in the system and ensures that refrigeration is not disrupted for the cases that cannot be switched off during the DSR event (some cases will have to be left operating to meet food safety requirements). A very common example of this is when cases are recovering from defrost. The offset for presented experiments is set to 0.6 bar, increasing the reference value of suction pressure from 3.4 to 4.0 bar for the HT system and from 0.7 to 1.3 bar for the LT system to assure the conservative operation of compressor pack after it is turned back on, without compromising cooling capacity of the remaining cases (since higher suction pressure results in a higher evaporation temperature).
The impact of simulated DSR events are studied in the context of electrical and thermal response of the test system. Food safety standards and DSR associated food safety risks are not directly addressed in this paper but is part of the overall study and will be reported in due course.

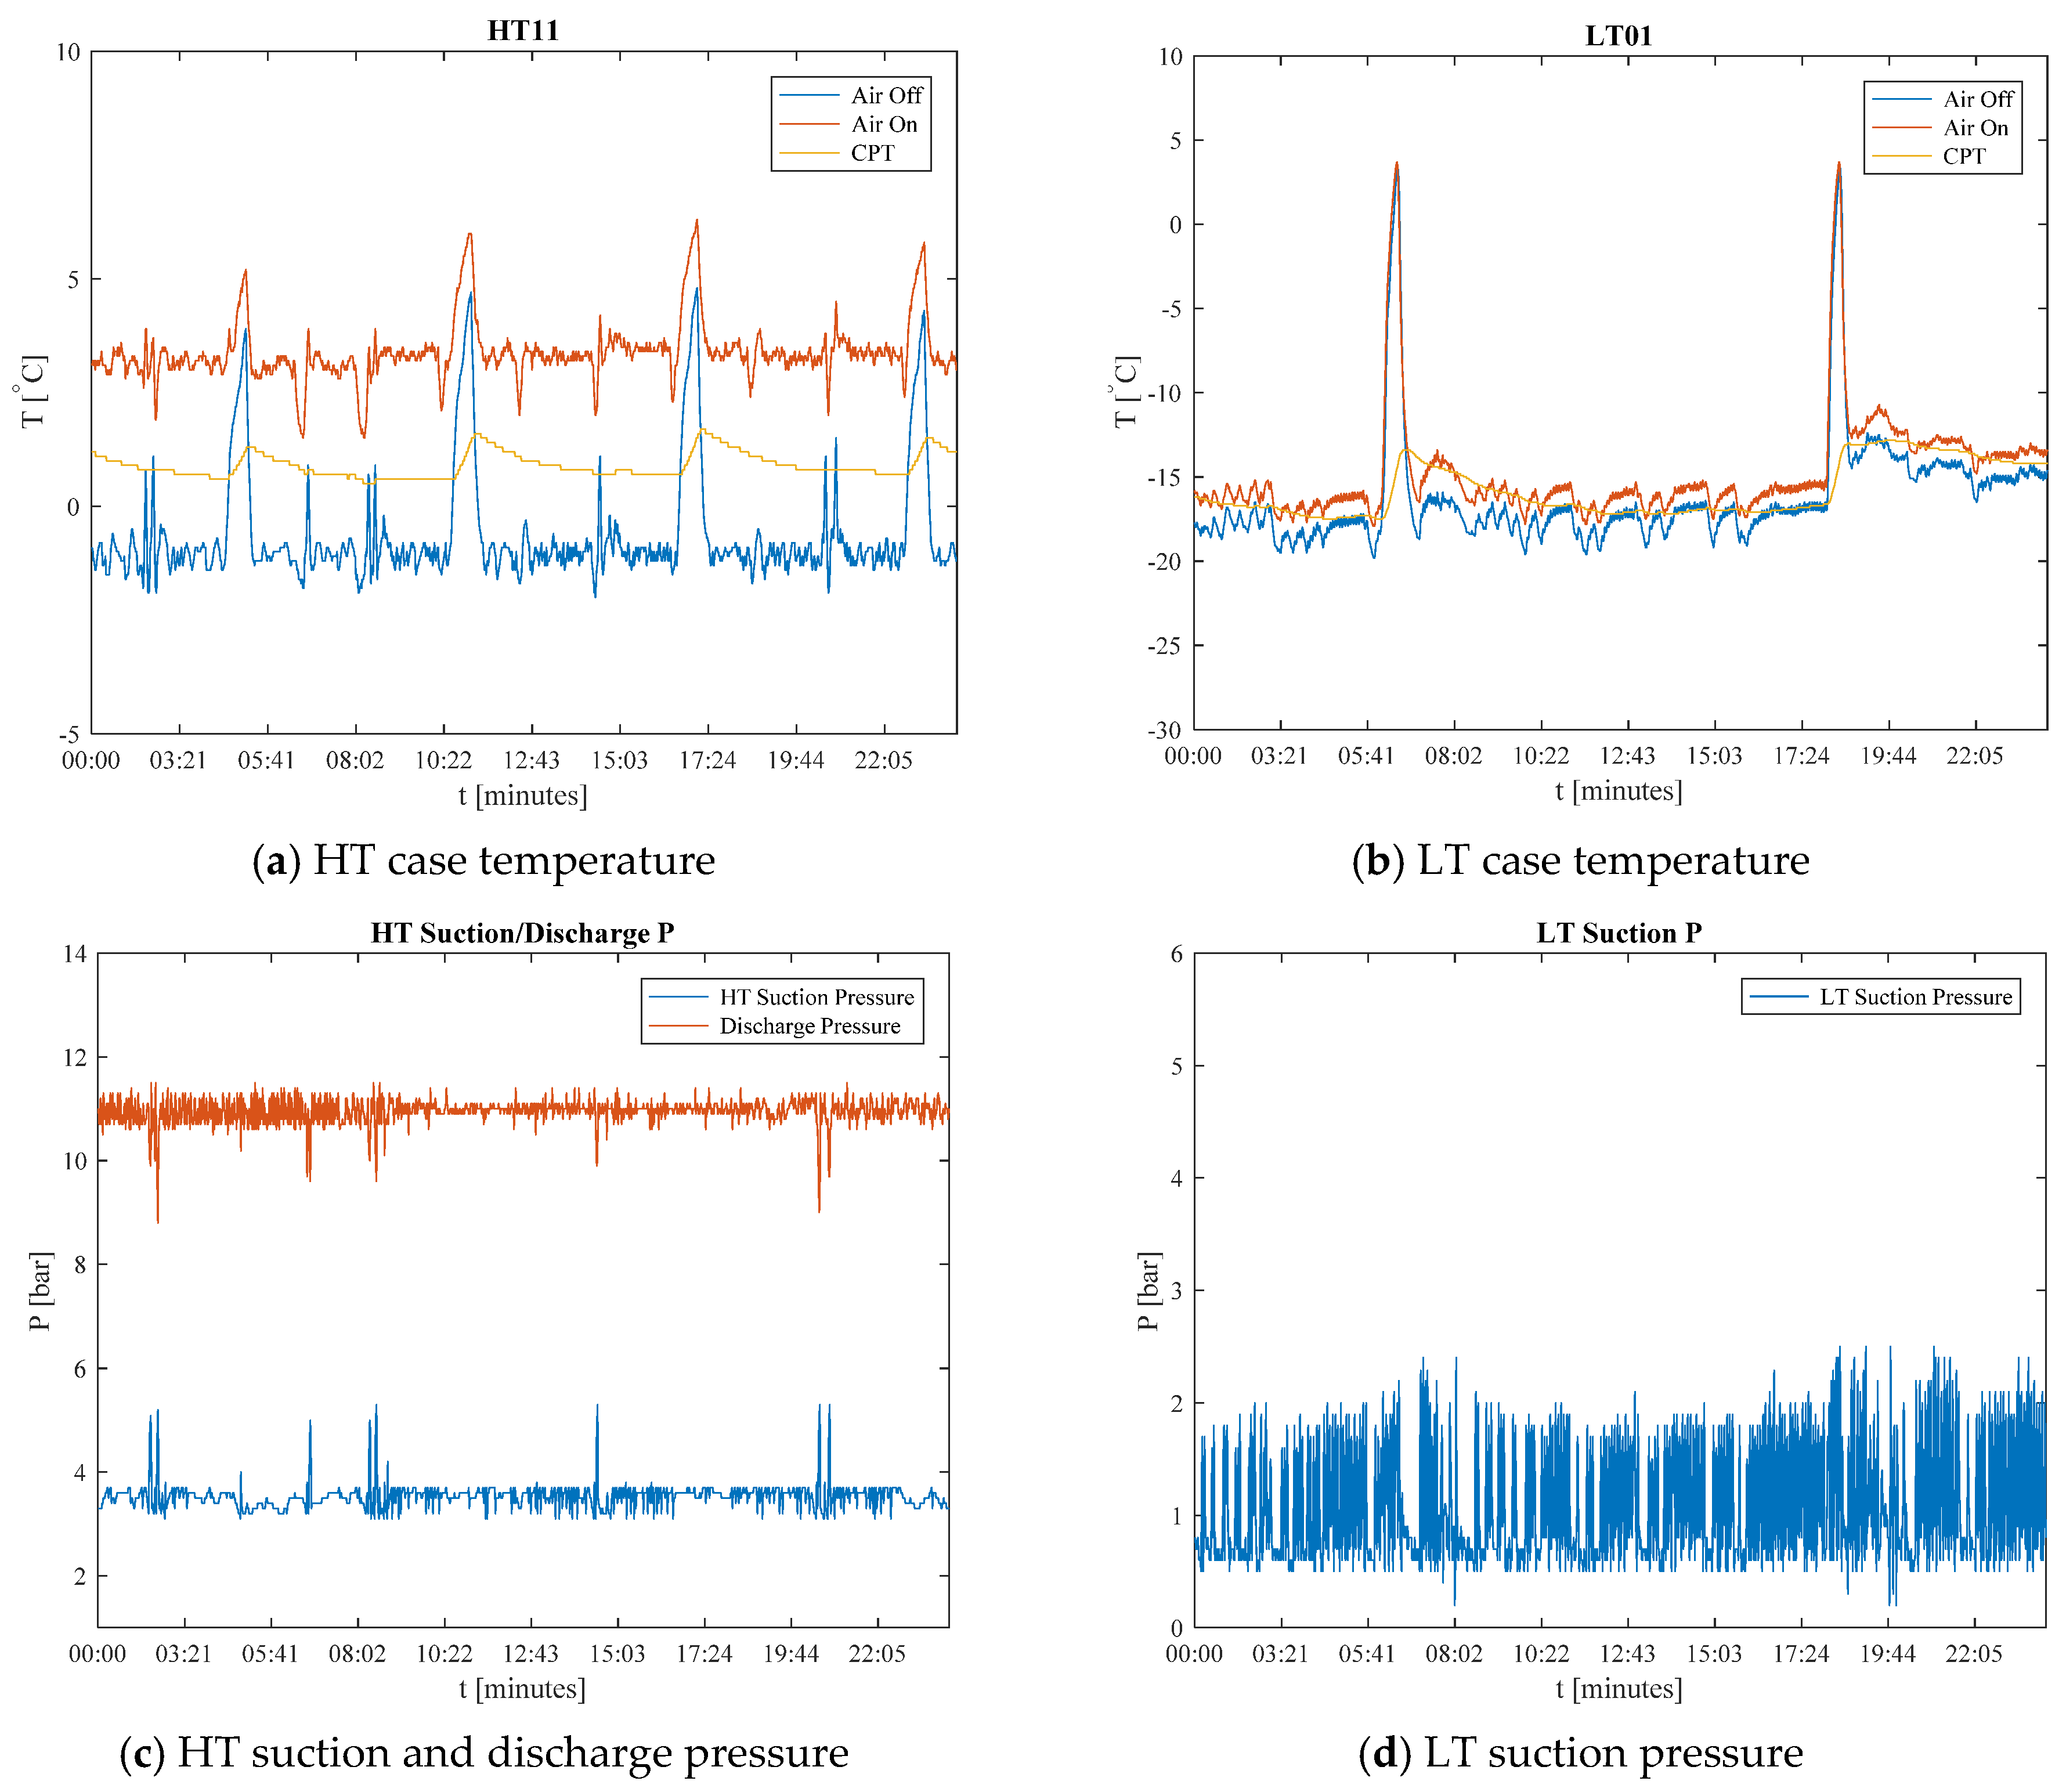
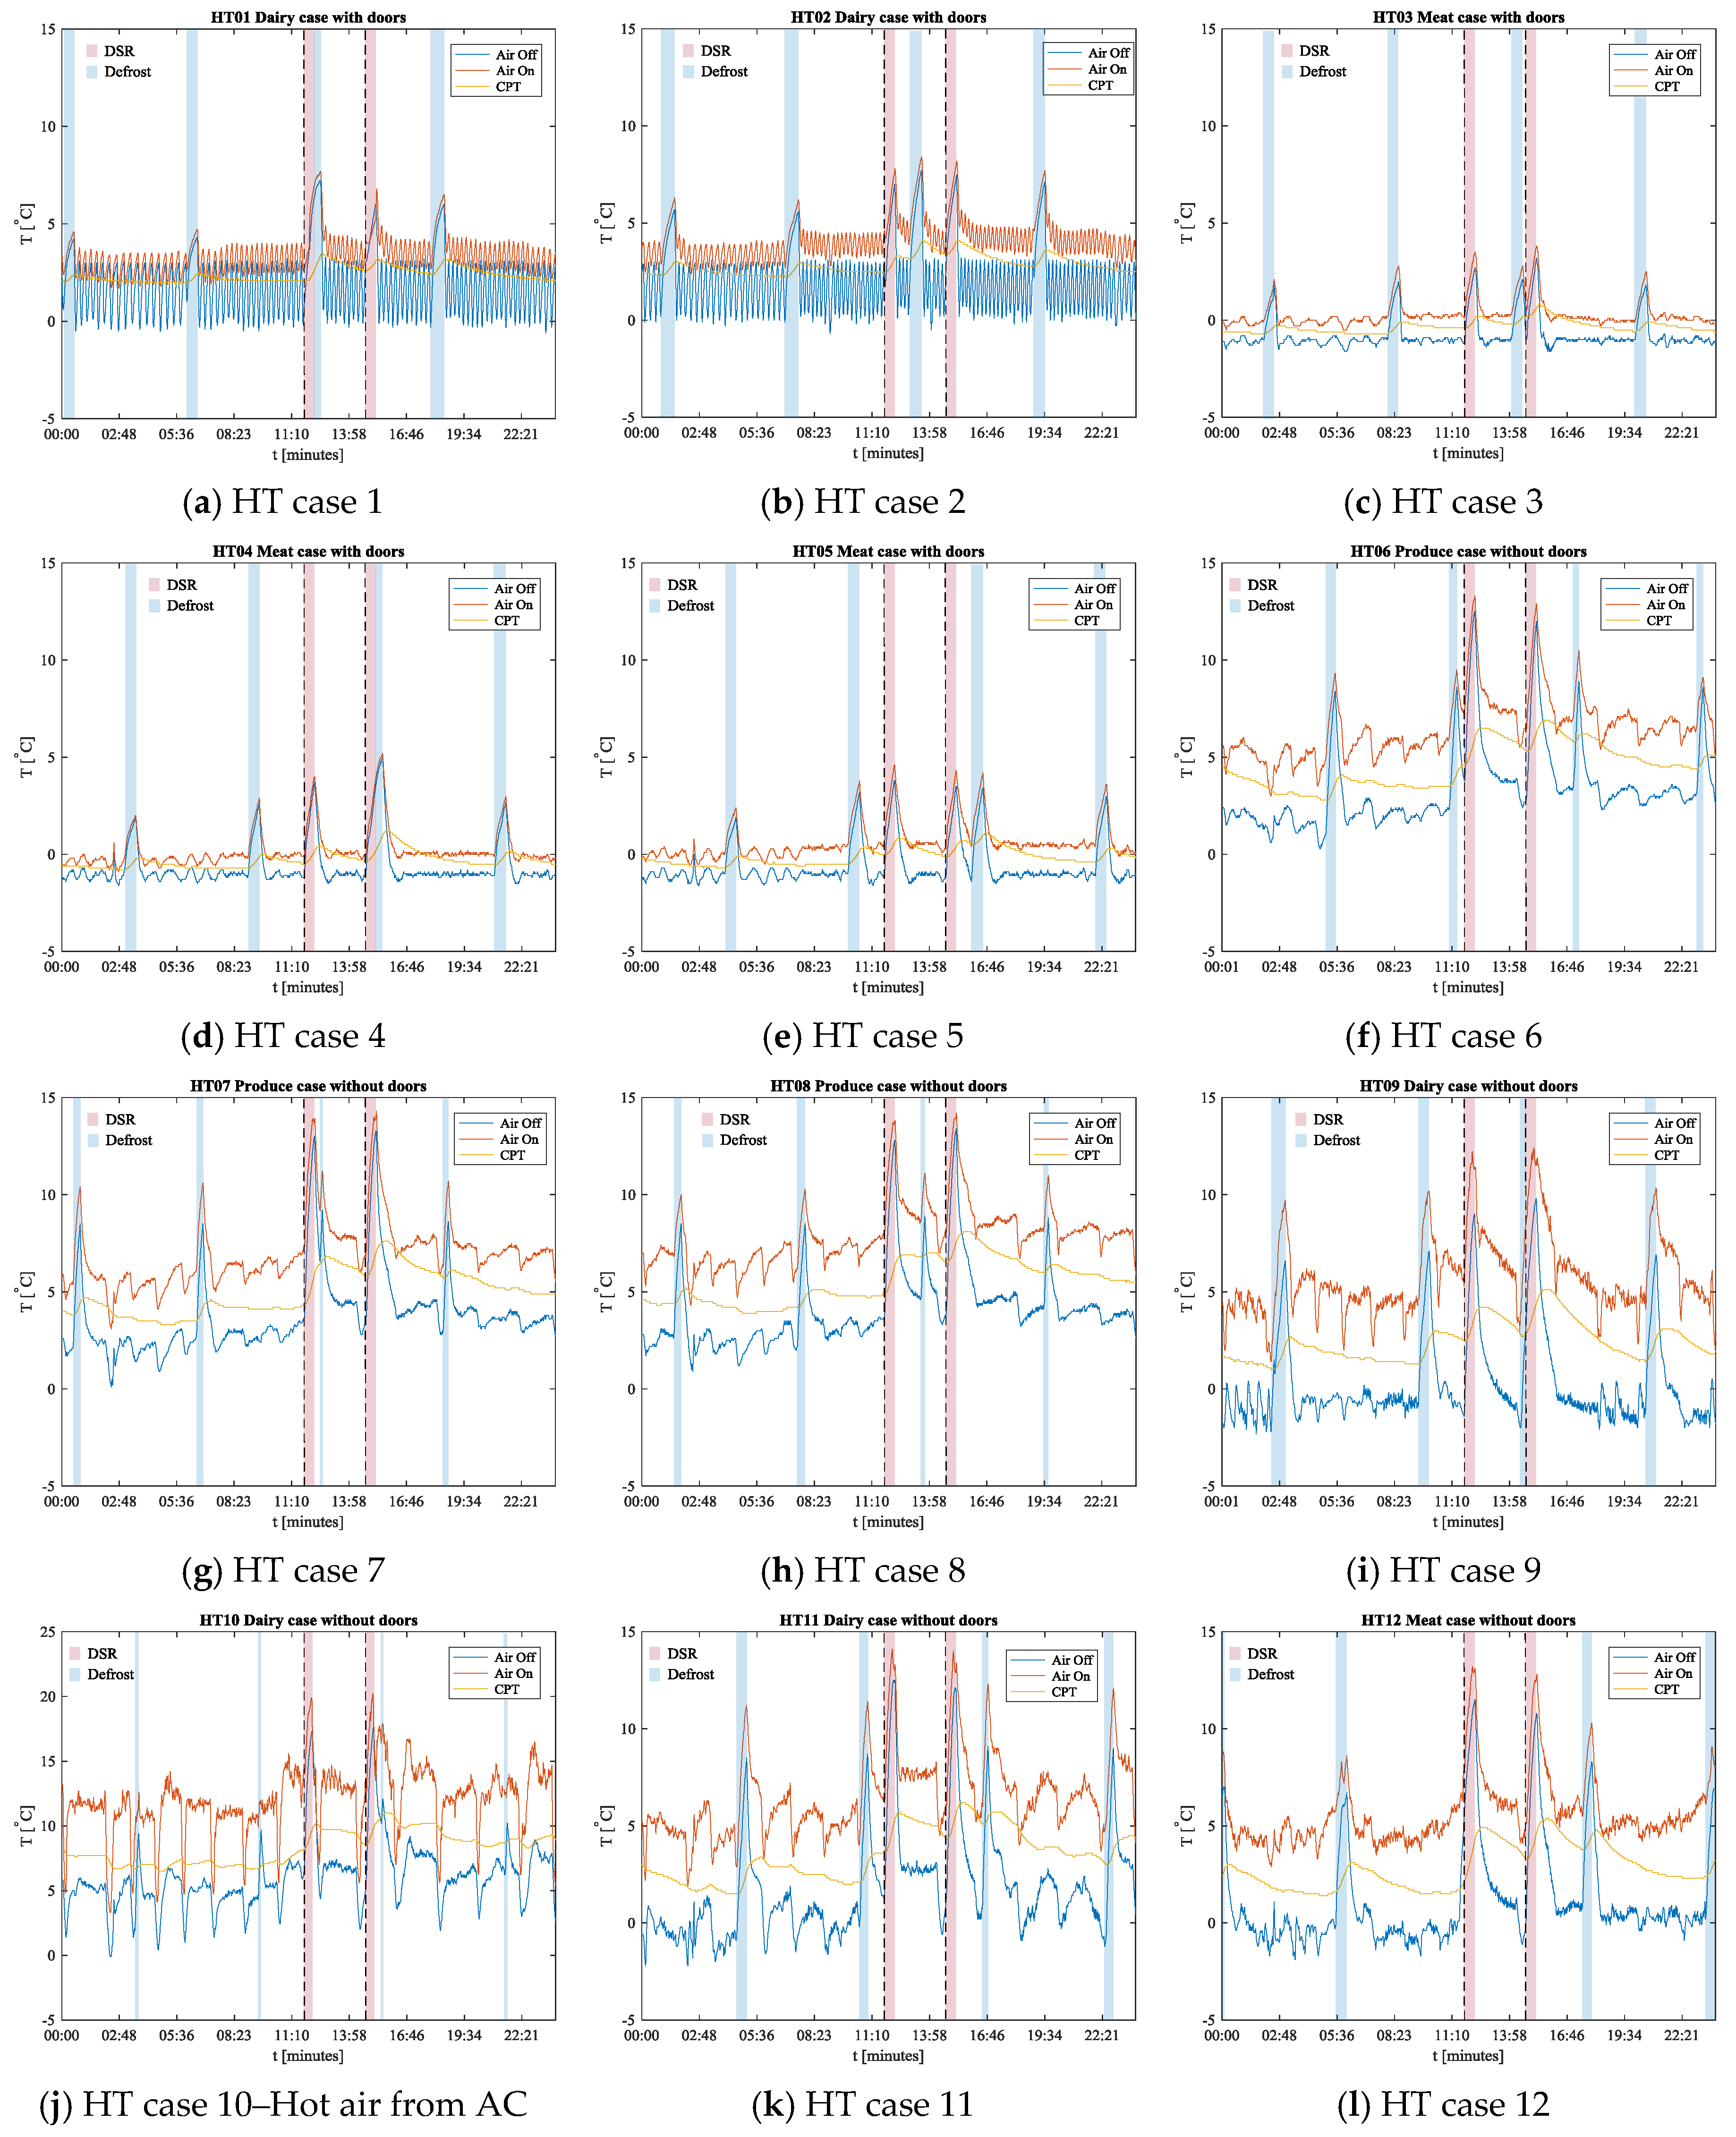
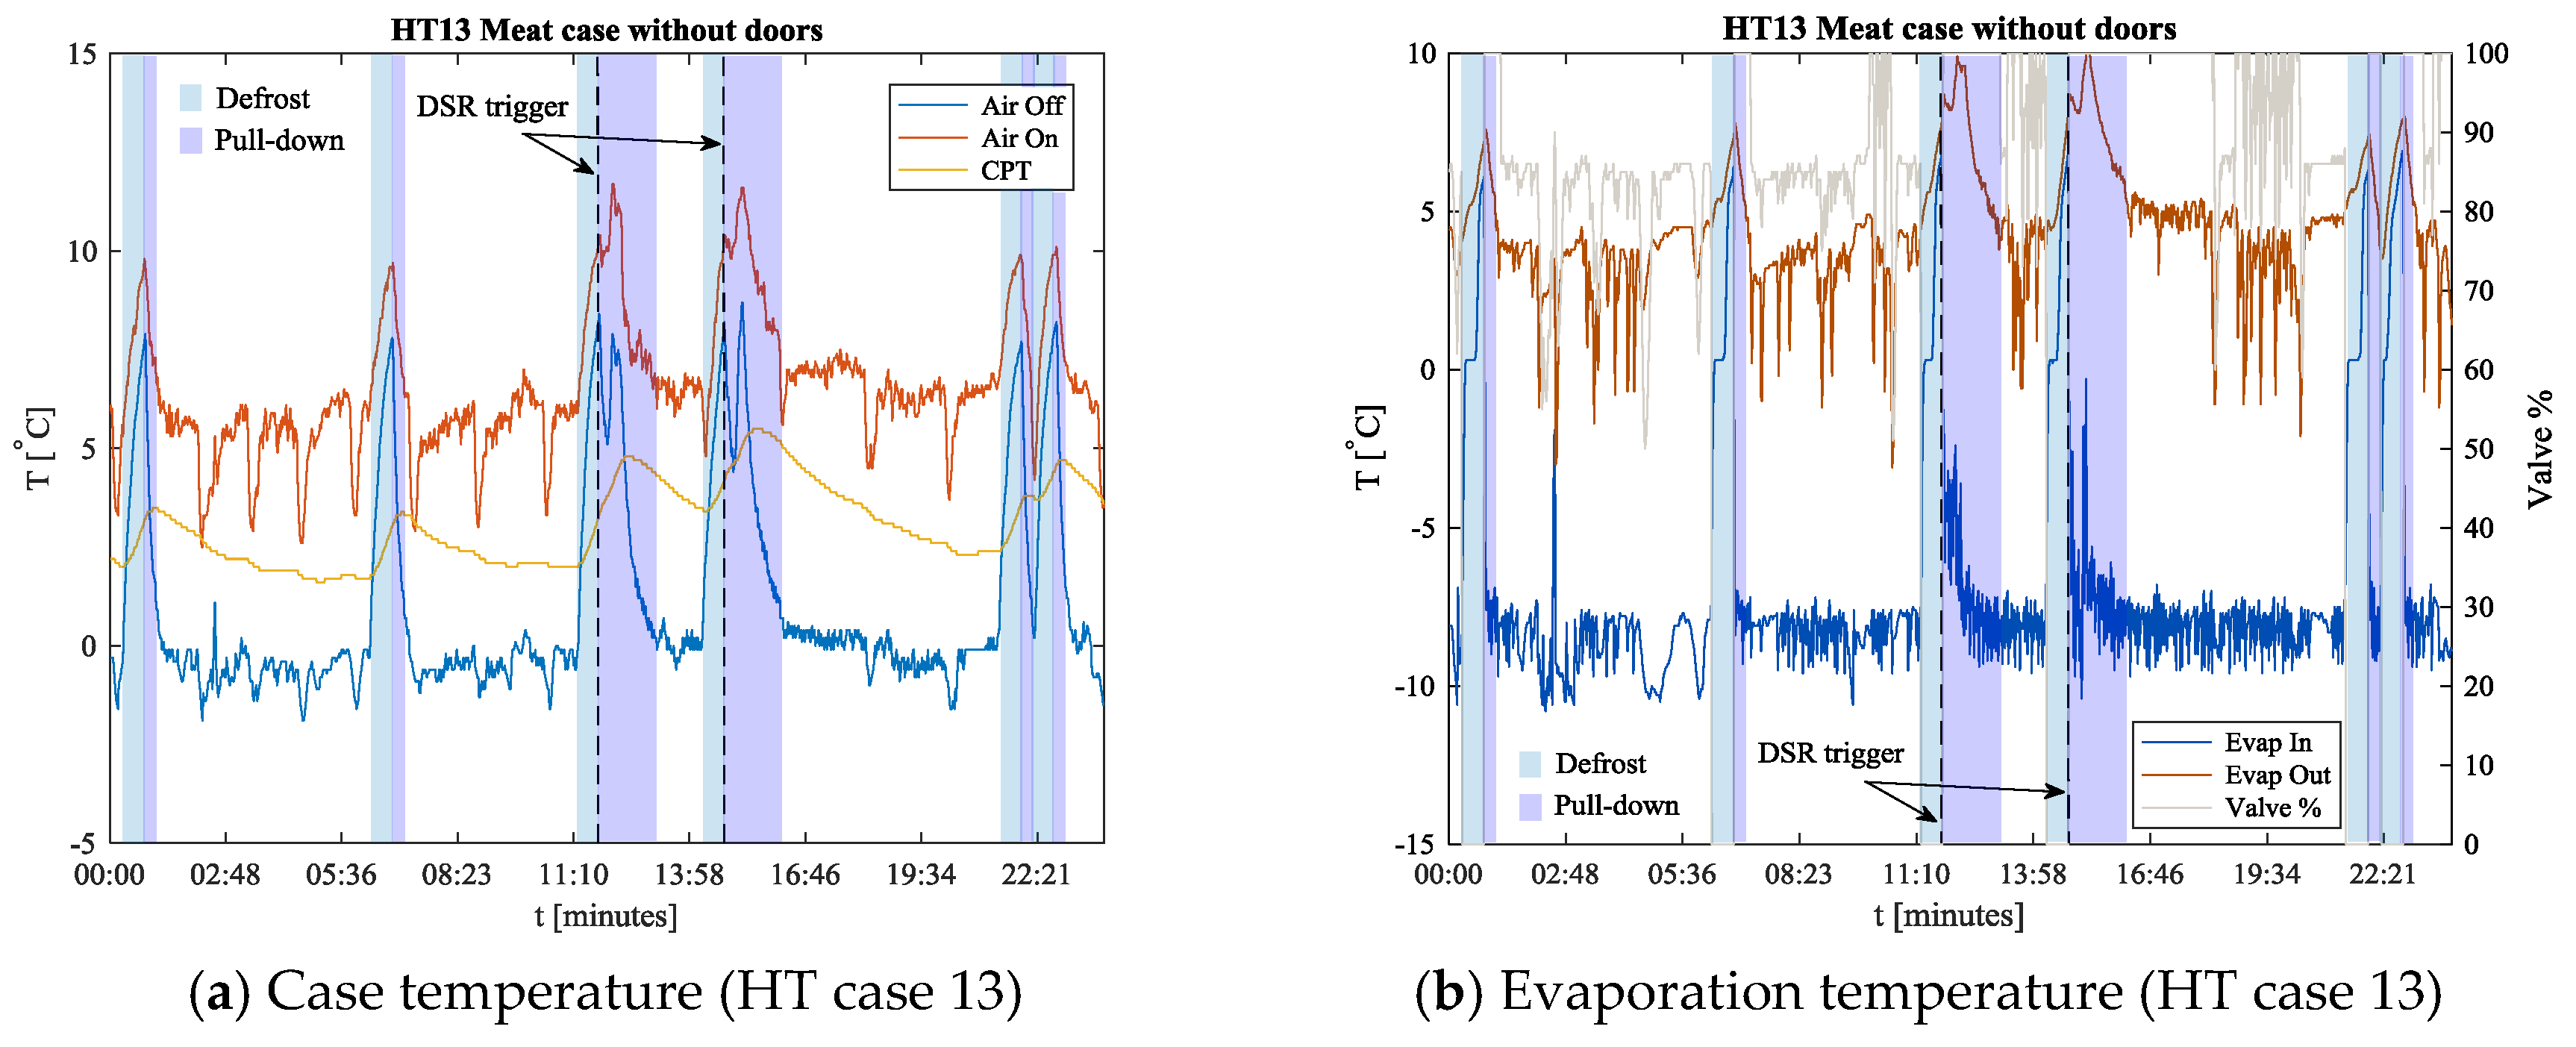
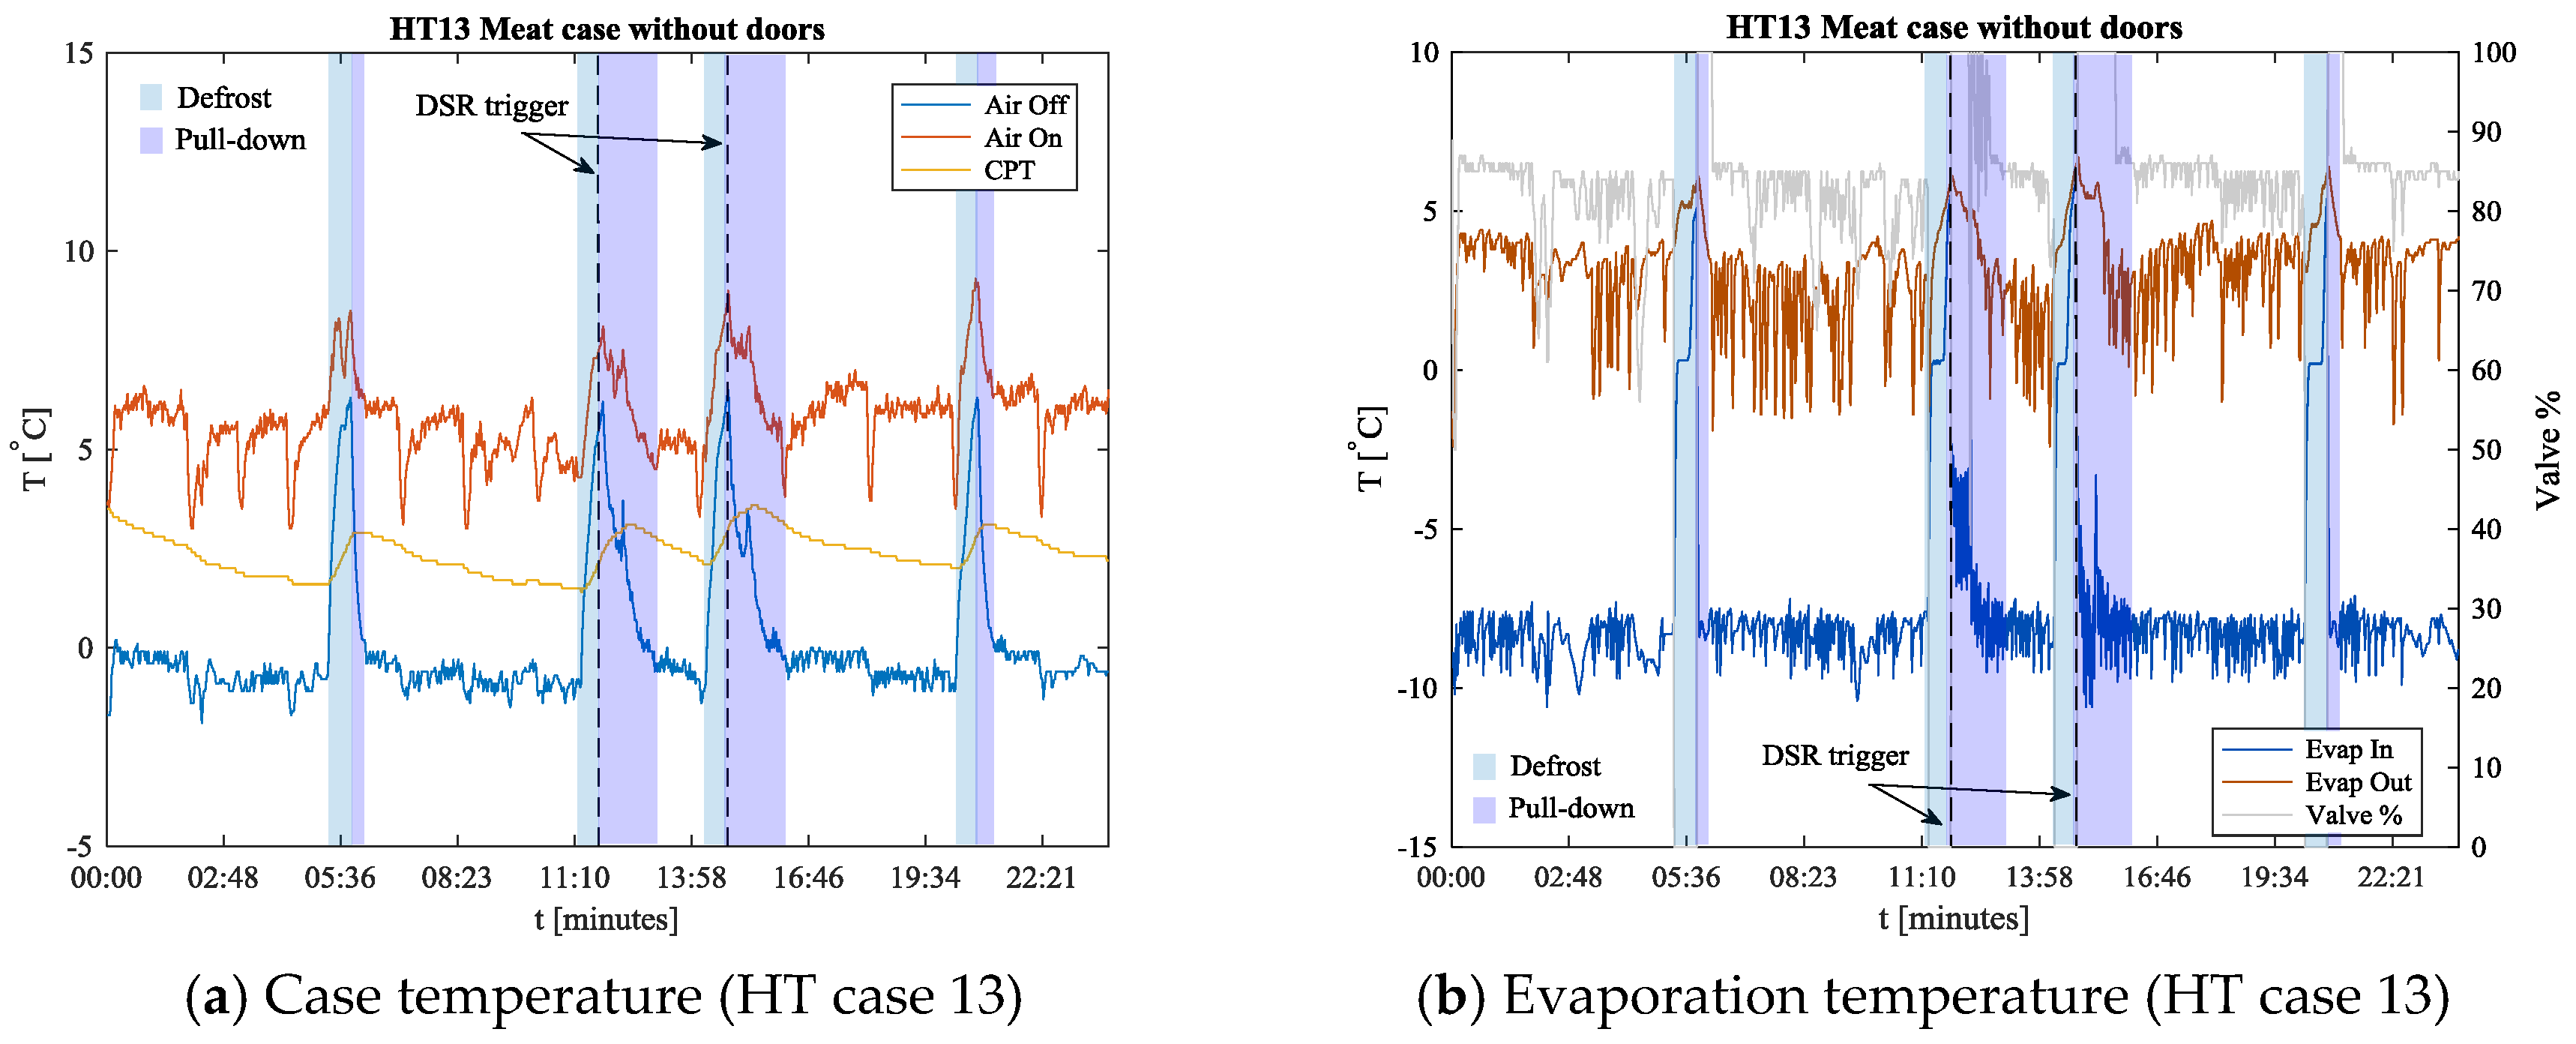
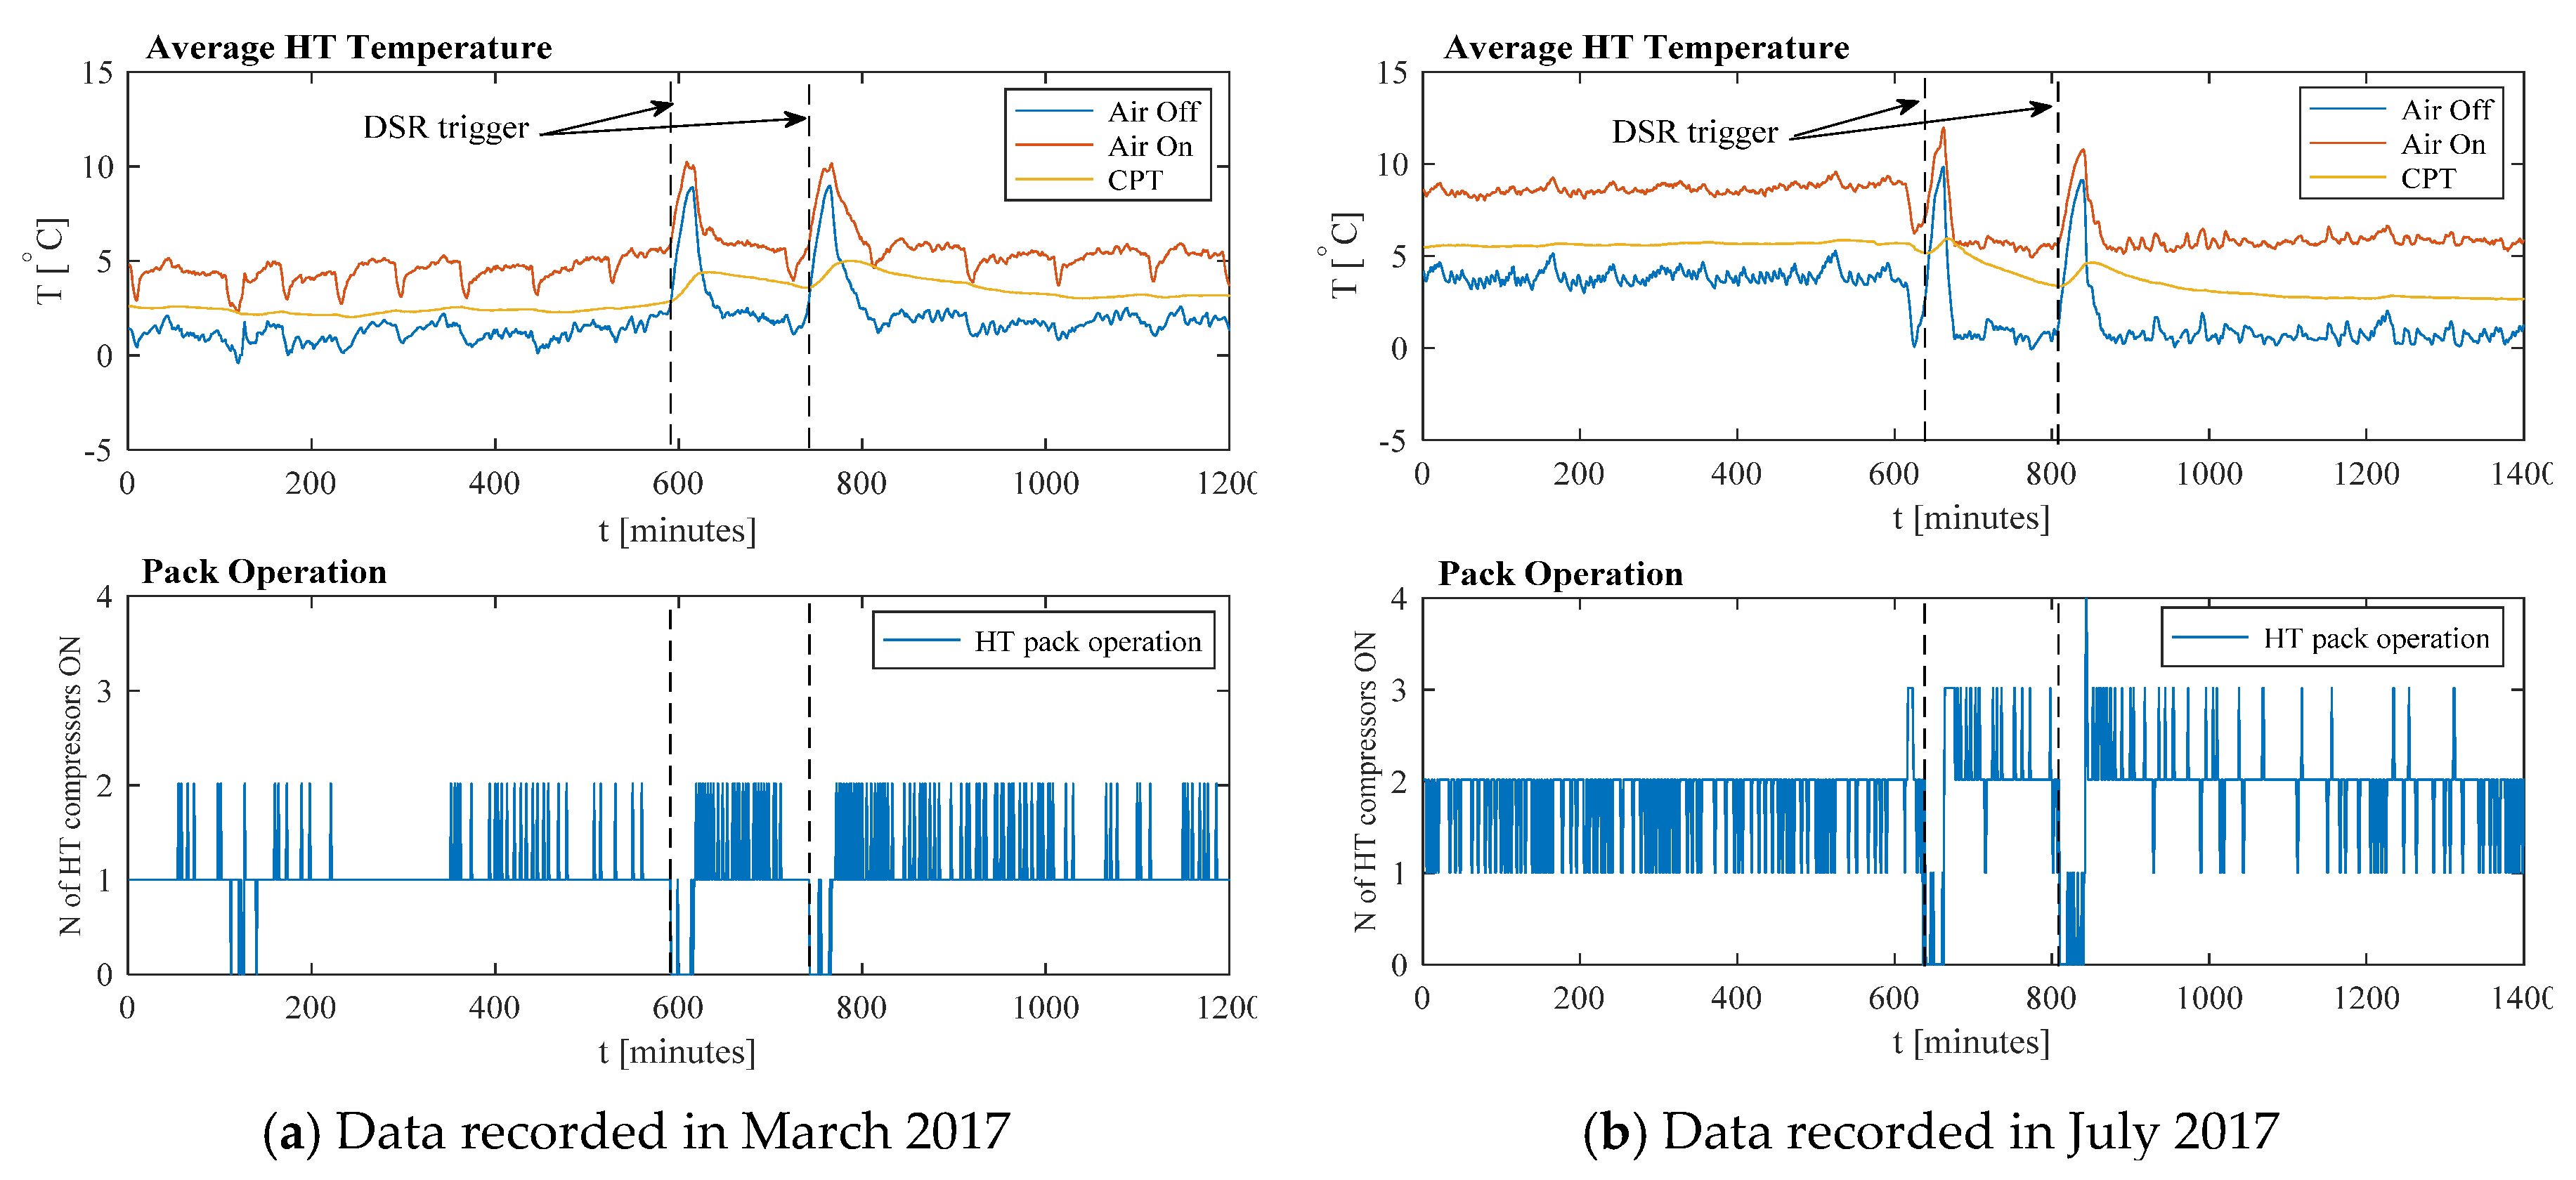
3.1. Impact of DSR on the Temperature Variation of the Refrigeration Cases

Here, the impact of a DSR event on the temperature variation inside cases of the HT refrigeration unit and the ability of the HT cases to safely recover after DSR, is investigated. First, two test trials are undertaken with a full shut-down of the compressor pack for 30 s, followed by switching off 12 out of the 13 cases. Cases 1–5 are HT cases with doors, 6–12 are HT cases with an air curtain. Cases 10 and 11 are placed in proximity to the air conditioning system AC, where the AC is set to disturb the air curtain of the case 10 by blowing hot air directly into it. The remaining case 13 is in the process of recovering from defrost and not available for the shut-down. When the DSR event begins, the 12 HT cases are shut down for 30 min, at 11:45 and 14:45, respectively. Figure 5 shows the active power consumption and the suction-discharge pressure profiles of the HT compressors, while Figure 6 shows the temperature time histories of the 12 HT cases. In the first test a 0.6 bar suction pressure offset is applied for 30 min to reduce the frequency of compressor cycling in the pack during the DSR event. In the second test no pressure offset is applied. Power transients that can be seen in Figure 5a after the DSR triggers are associated with refrigerant still circulating in the system: the remaining refrigerant in all evaporator coils that once boiled, travels to the suction line (which has to be compressed once) and the refrigerant circulating in the system to support normal operation of the remaining case (which has to be compressed repeatedly for the entire DSR duration).
The environment can add significant ‘noise’ to the system by disturbing the air curtain of the HT cases 6–12 (without front doors) as shown in Figure 6f–l, where an effective heat load is added to the system which contributes to increasing the internal temperature of the cases. This then impacts the rate of temperature change for the air off and air on and hence undermines the cooling capacity of the cases, in comparison to the HT cases with front doors as shown in Figure 6a–e.
HT Case 13 is manually put on defrost 30 min prior to the shut-down (11:15 and 14:15) and excluded from the secondary response in order to proceed with a post-defrost pull-down and achieve the target operating temperature. In both tests refrigeration cases are kept empty. It can be seen in Figure 7a that the case is cooling down only for a short period of time, eventually extending the defrost-like state for another 30 min (double ‘spike’ in the air-off temperature) until other cases are switched back on. The evaporation temperature increases from c. −8 °C to c. −4 °C during both DSR events, as can be seen in Figure 7b. The absence of (product) thermal inertia and undermined cooling capacity contributed to the extended pull-down state during both DSR events. Subsequently, two tests trials are undertaken with 210 fully filled 2-L water containers placed inside the case 13 in three full rows on each shelf to provide sufficient thermal inertia and support the pull-down. The remainder of the test procedure is identical to that of the previous two tests. Figure 8a shows the effect of the thermal inertia, which assists the air-off temperature to slowly reach the set point value, with only a short-period region where the temperature rises again. As in the previous two tests, the duration of pull-down was extended, with its total duration being 5–6 times longer than a normal 7–10 min pull-down (large purple regions after DSR triggers in Figure 8a), as cooling capacity is undermined by the increase of evaporation temperature (Figure 8b). This, combined with external factors that add to the heat load from environment such as, for instance, an AC system operating near the case and diminishing the efficiency of the air curtain may lead to a situation where the system cannot reach air-off reference value for over an hour. By way of example, it can be seen in Figure 6j that case 10 does not achieve the temperature set point because of the proximity to expelled hot air from the Air Conditioning in the direction of the case in this instance.
Figure 9 shows the average temperature profiles of the HT cases and the HT compressors duty cycles in March and July 2017, respectively. Ambient temperature for March is c. 15 °C, reaching over 25 °C in July. It is notable that the load on the compressors is significantly higher during post-DSR recovery, with all 4 HT compressors operating simultaneously after the second DSR event. The duty profile (Figure 9b) also demonstrates less stable operation, with the pack frequently switching between 1 to 3 active compressors post-DSR, compared to the data obtained in March. Average temperature in Figure 9b is 3 °C higher than normal for the first 10 h of recording as the result of a number of cases being in the clean-up mode to melt ice on evaporator coils.

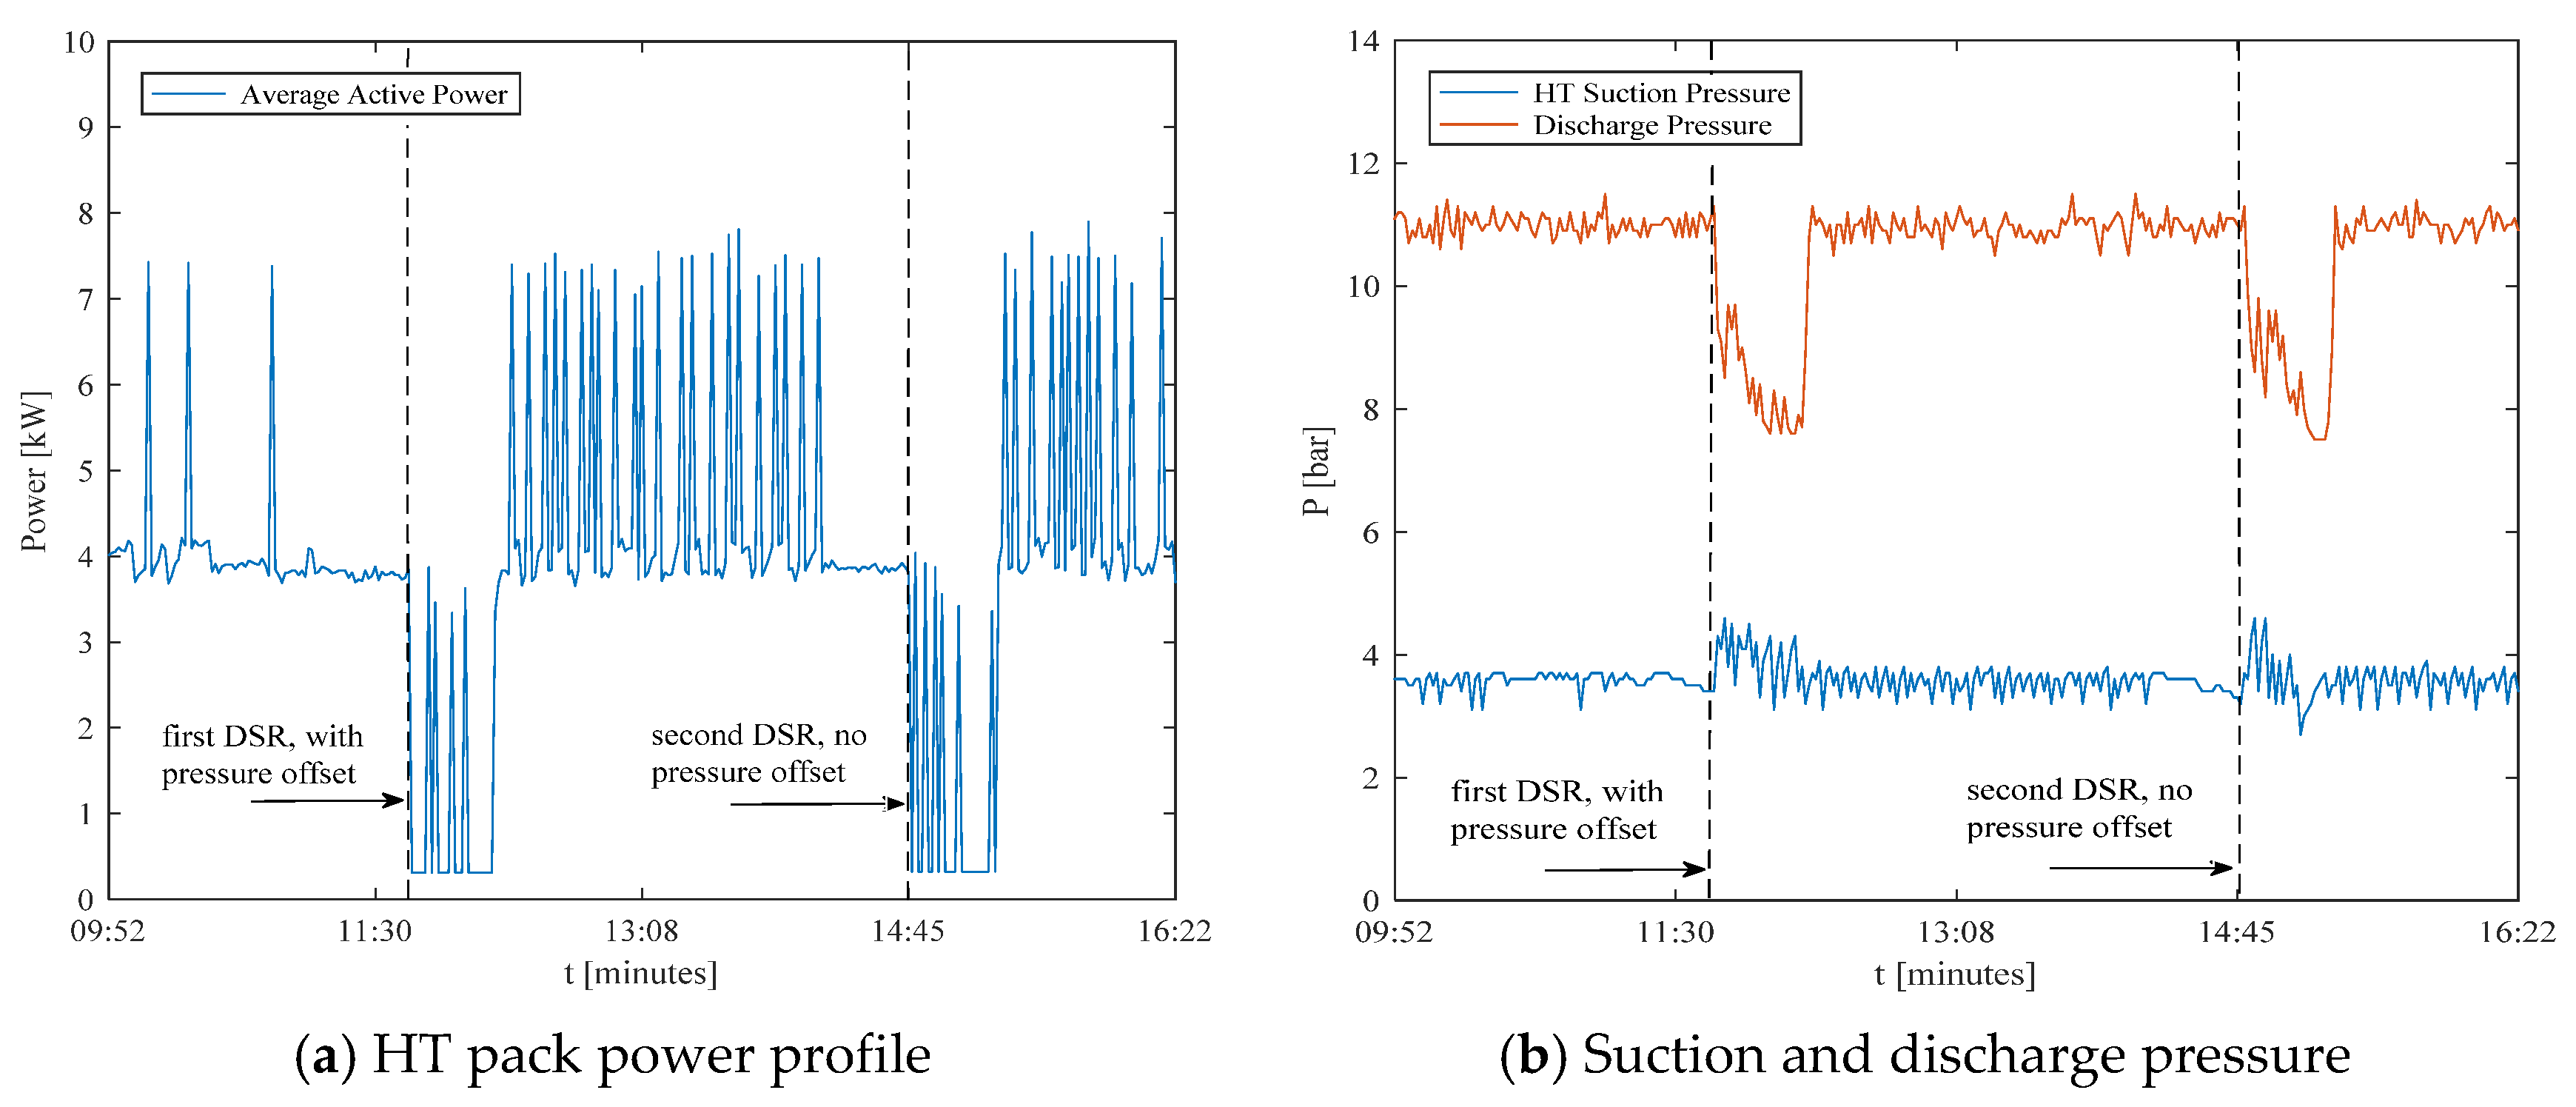
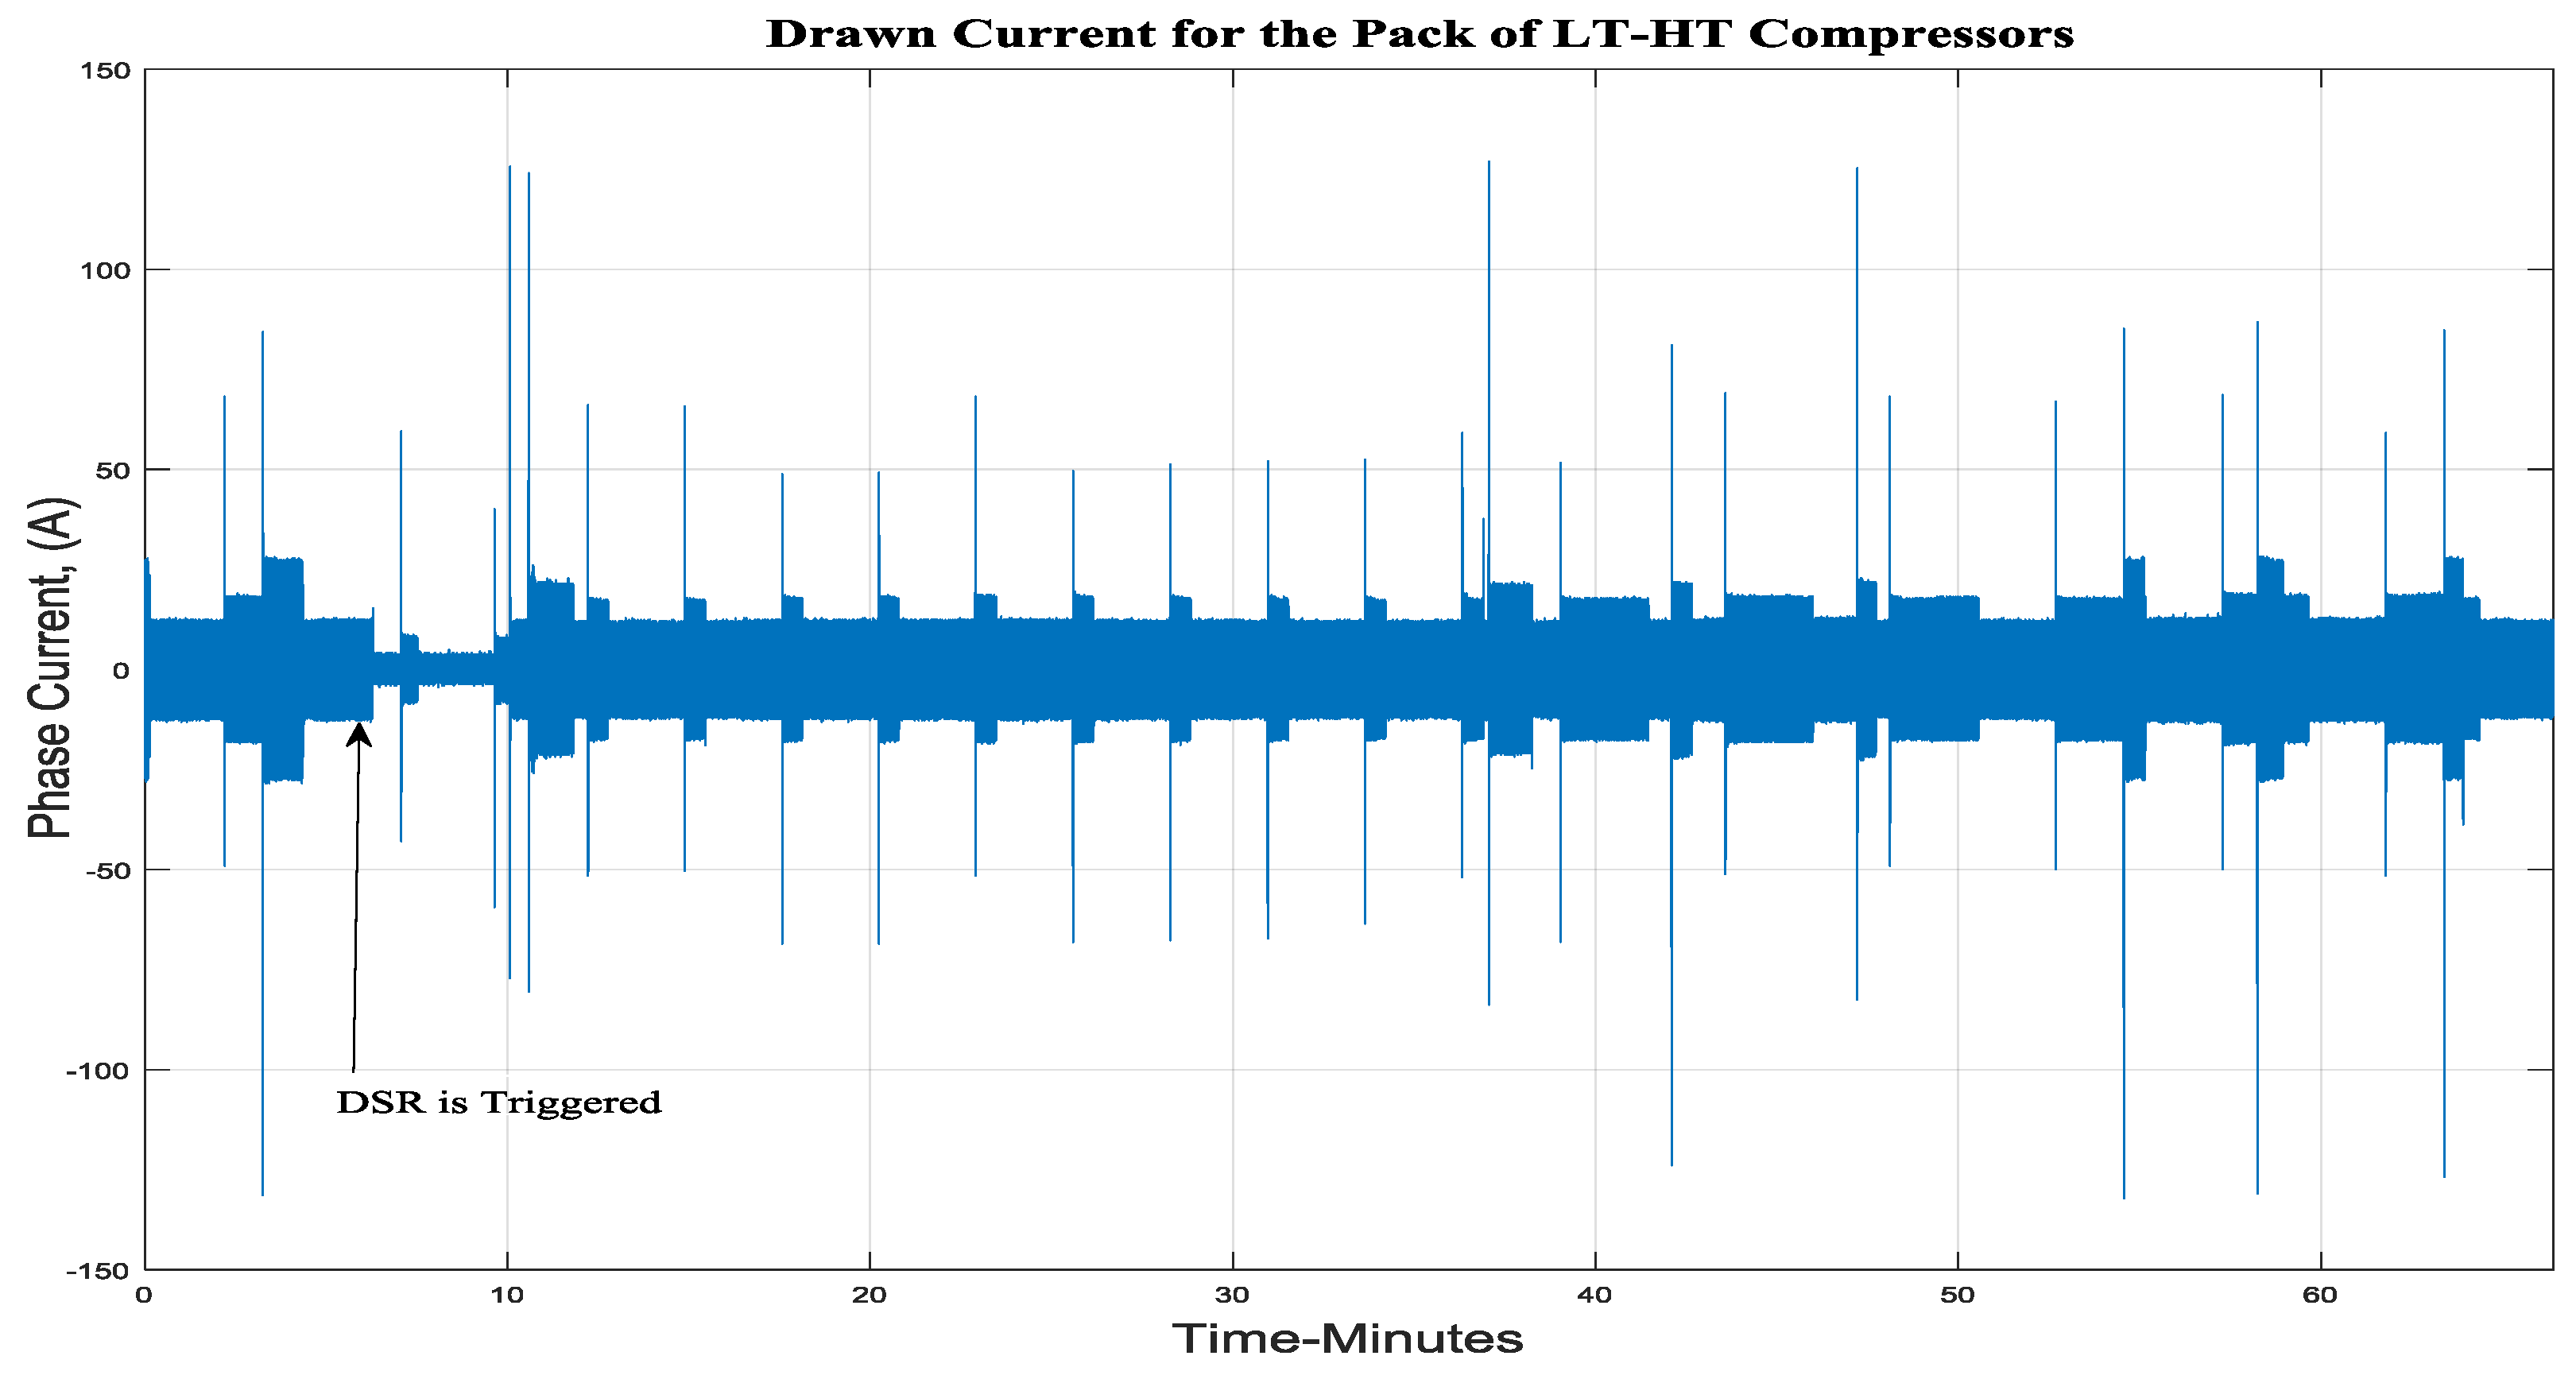
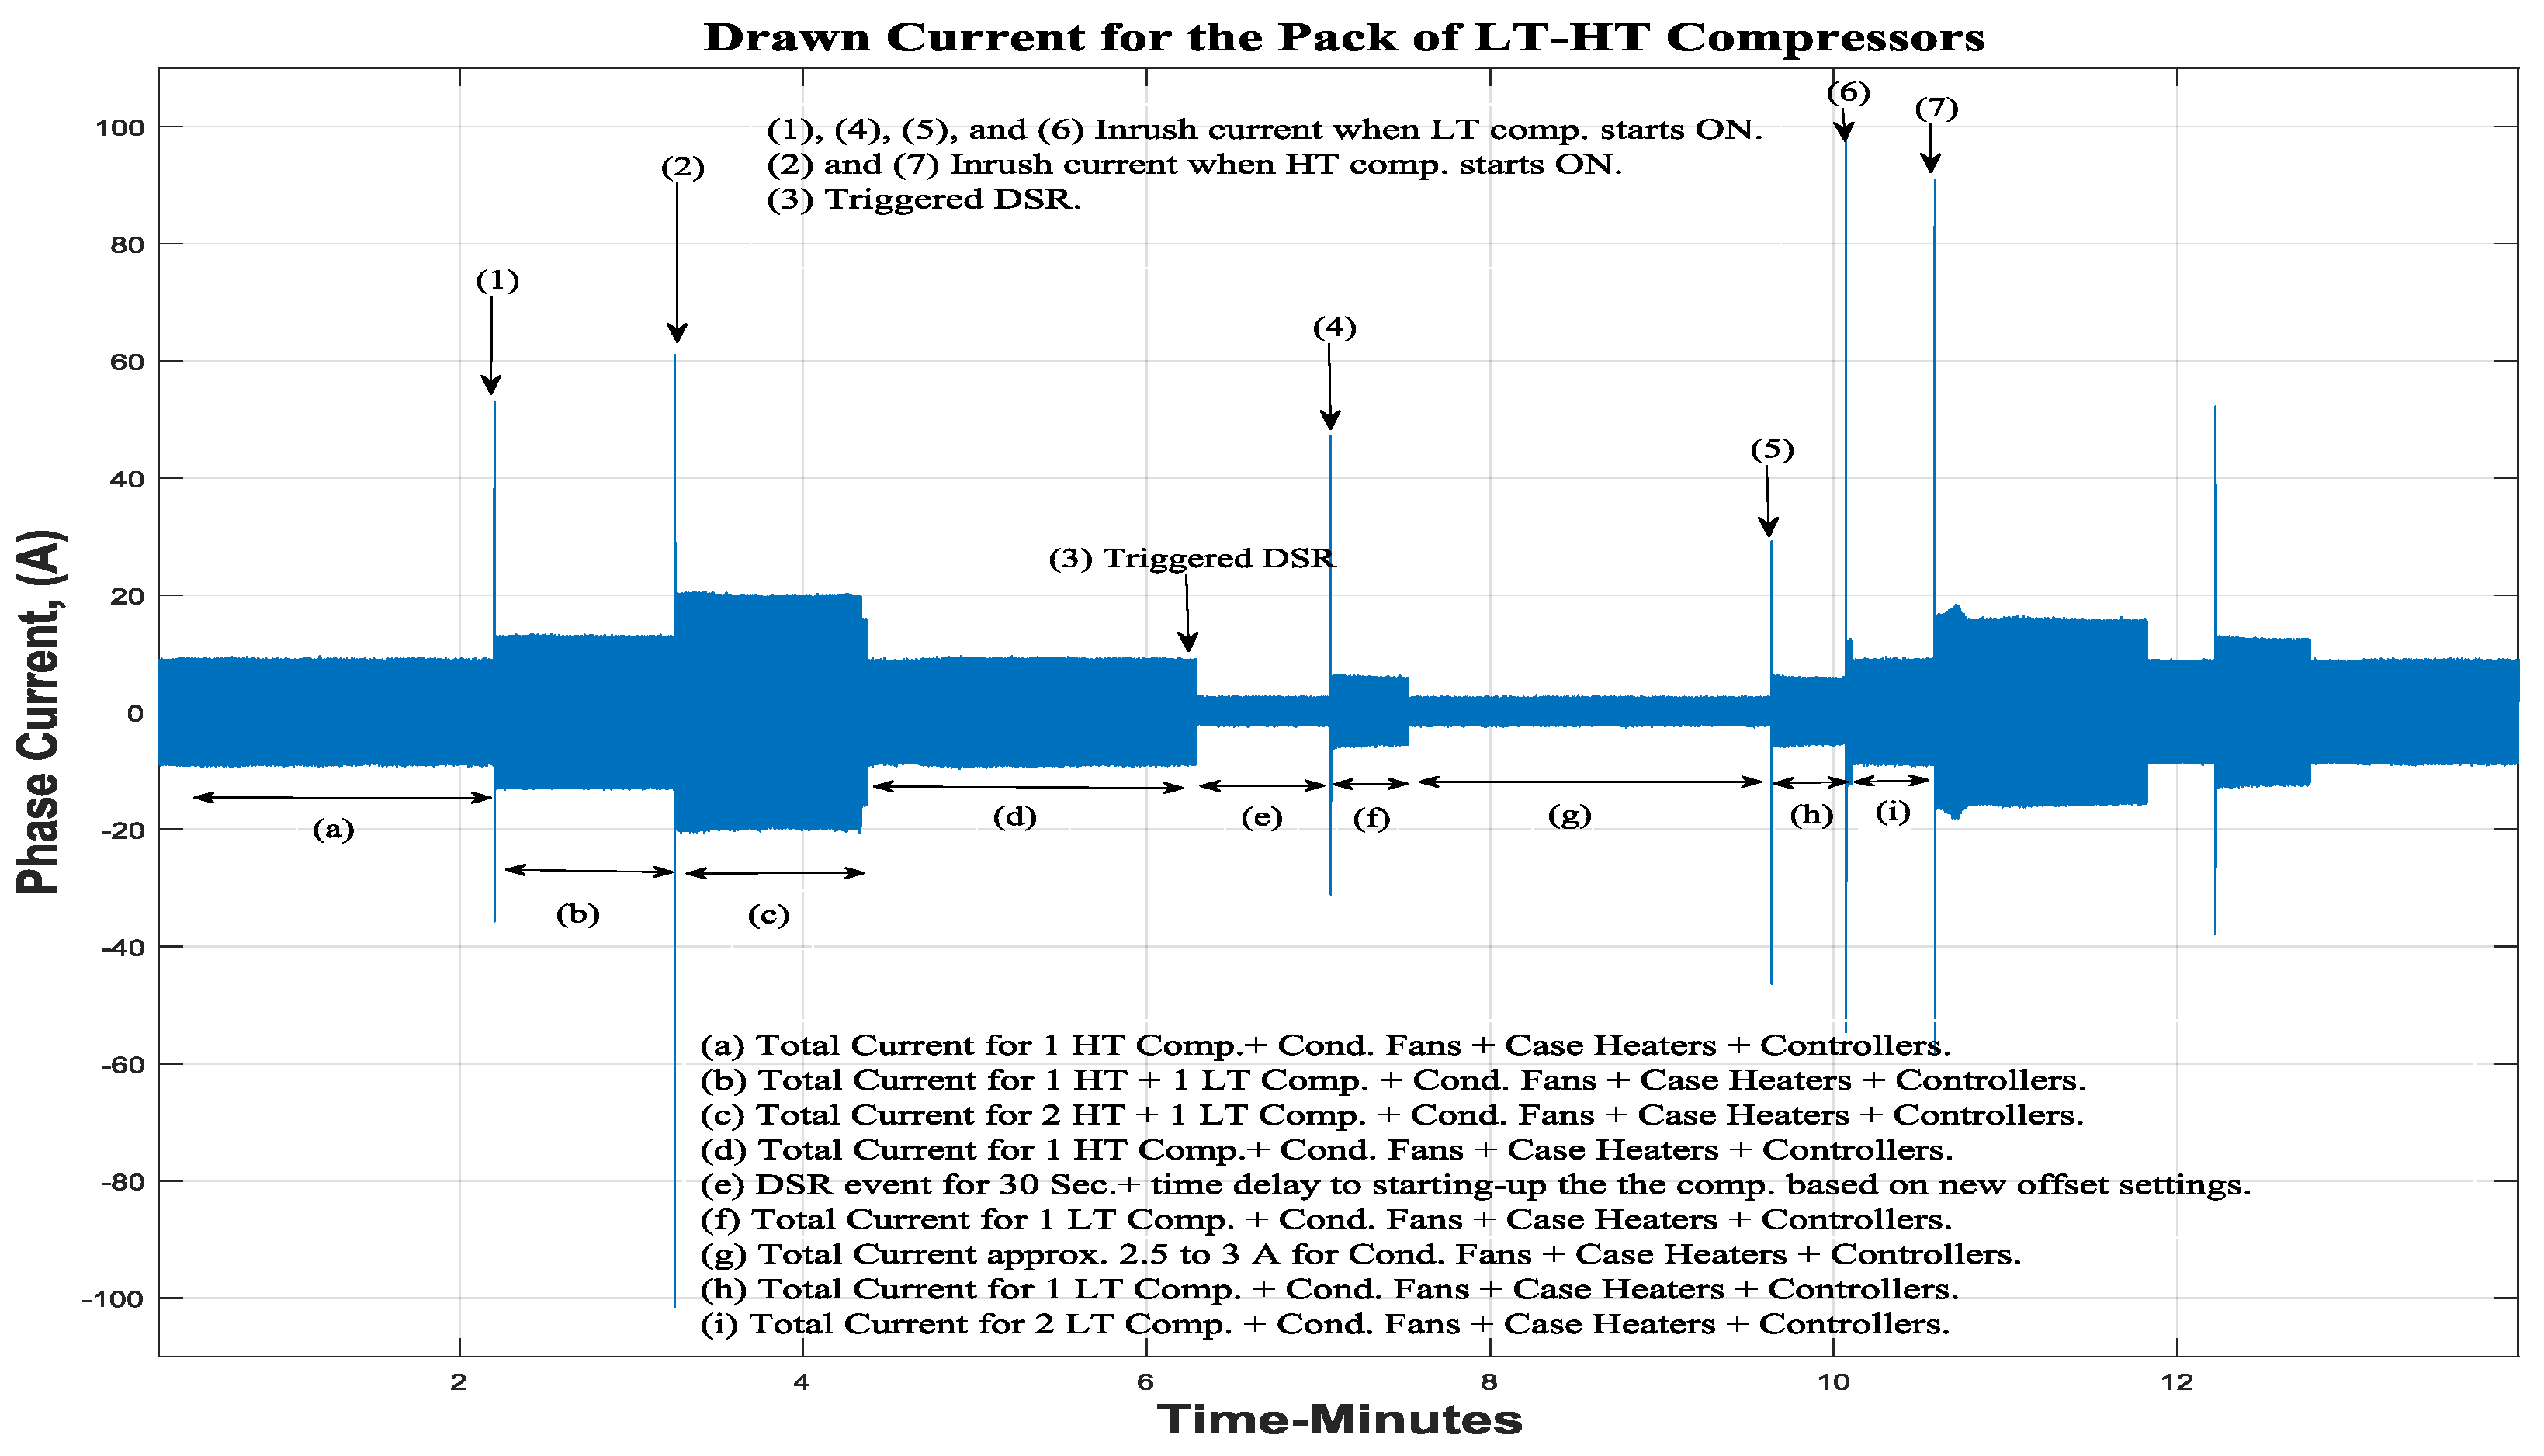
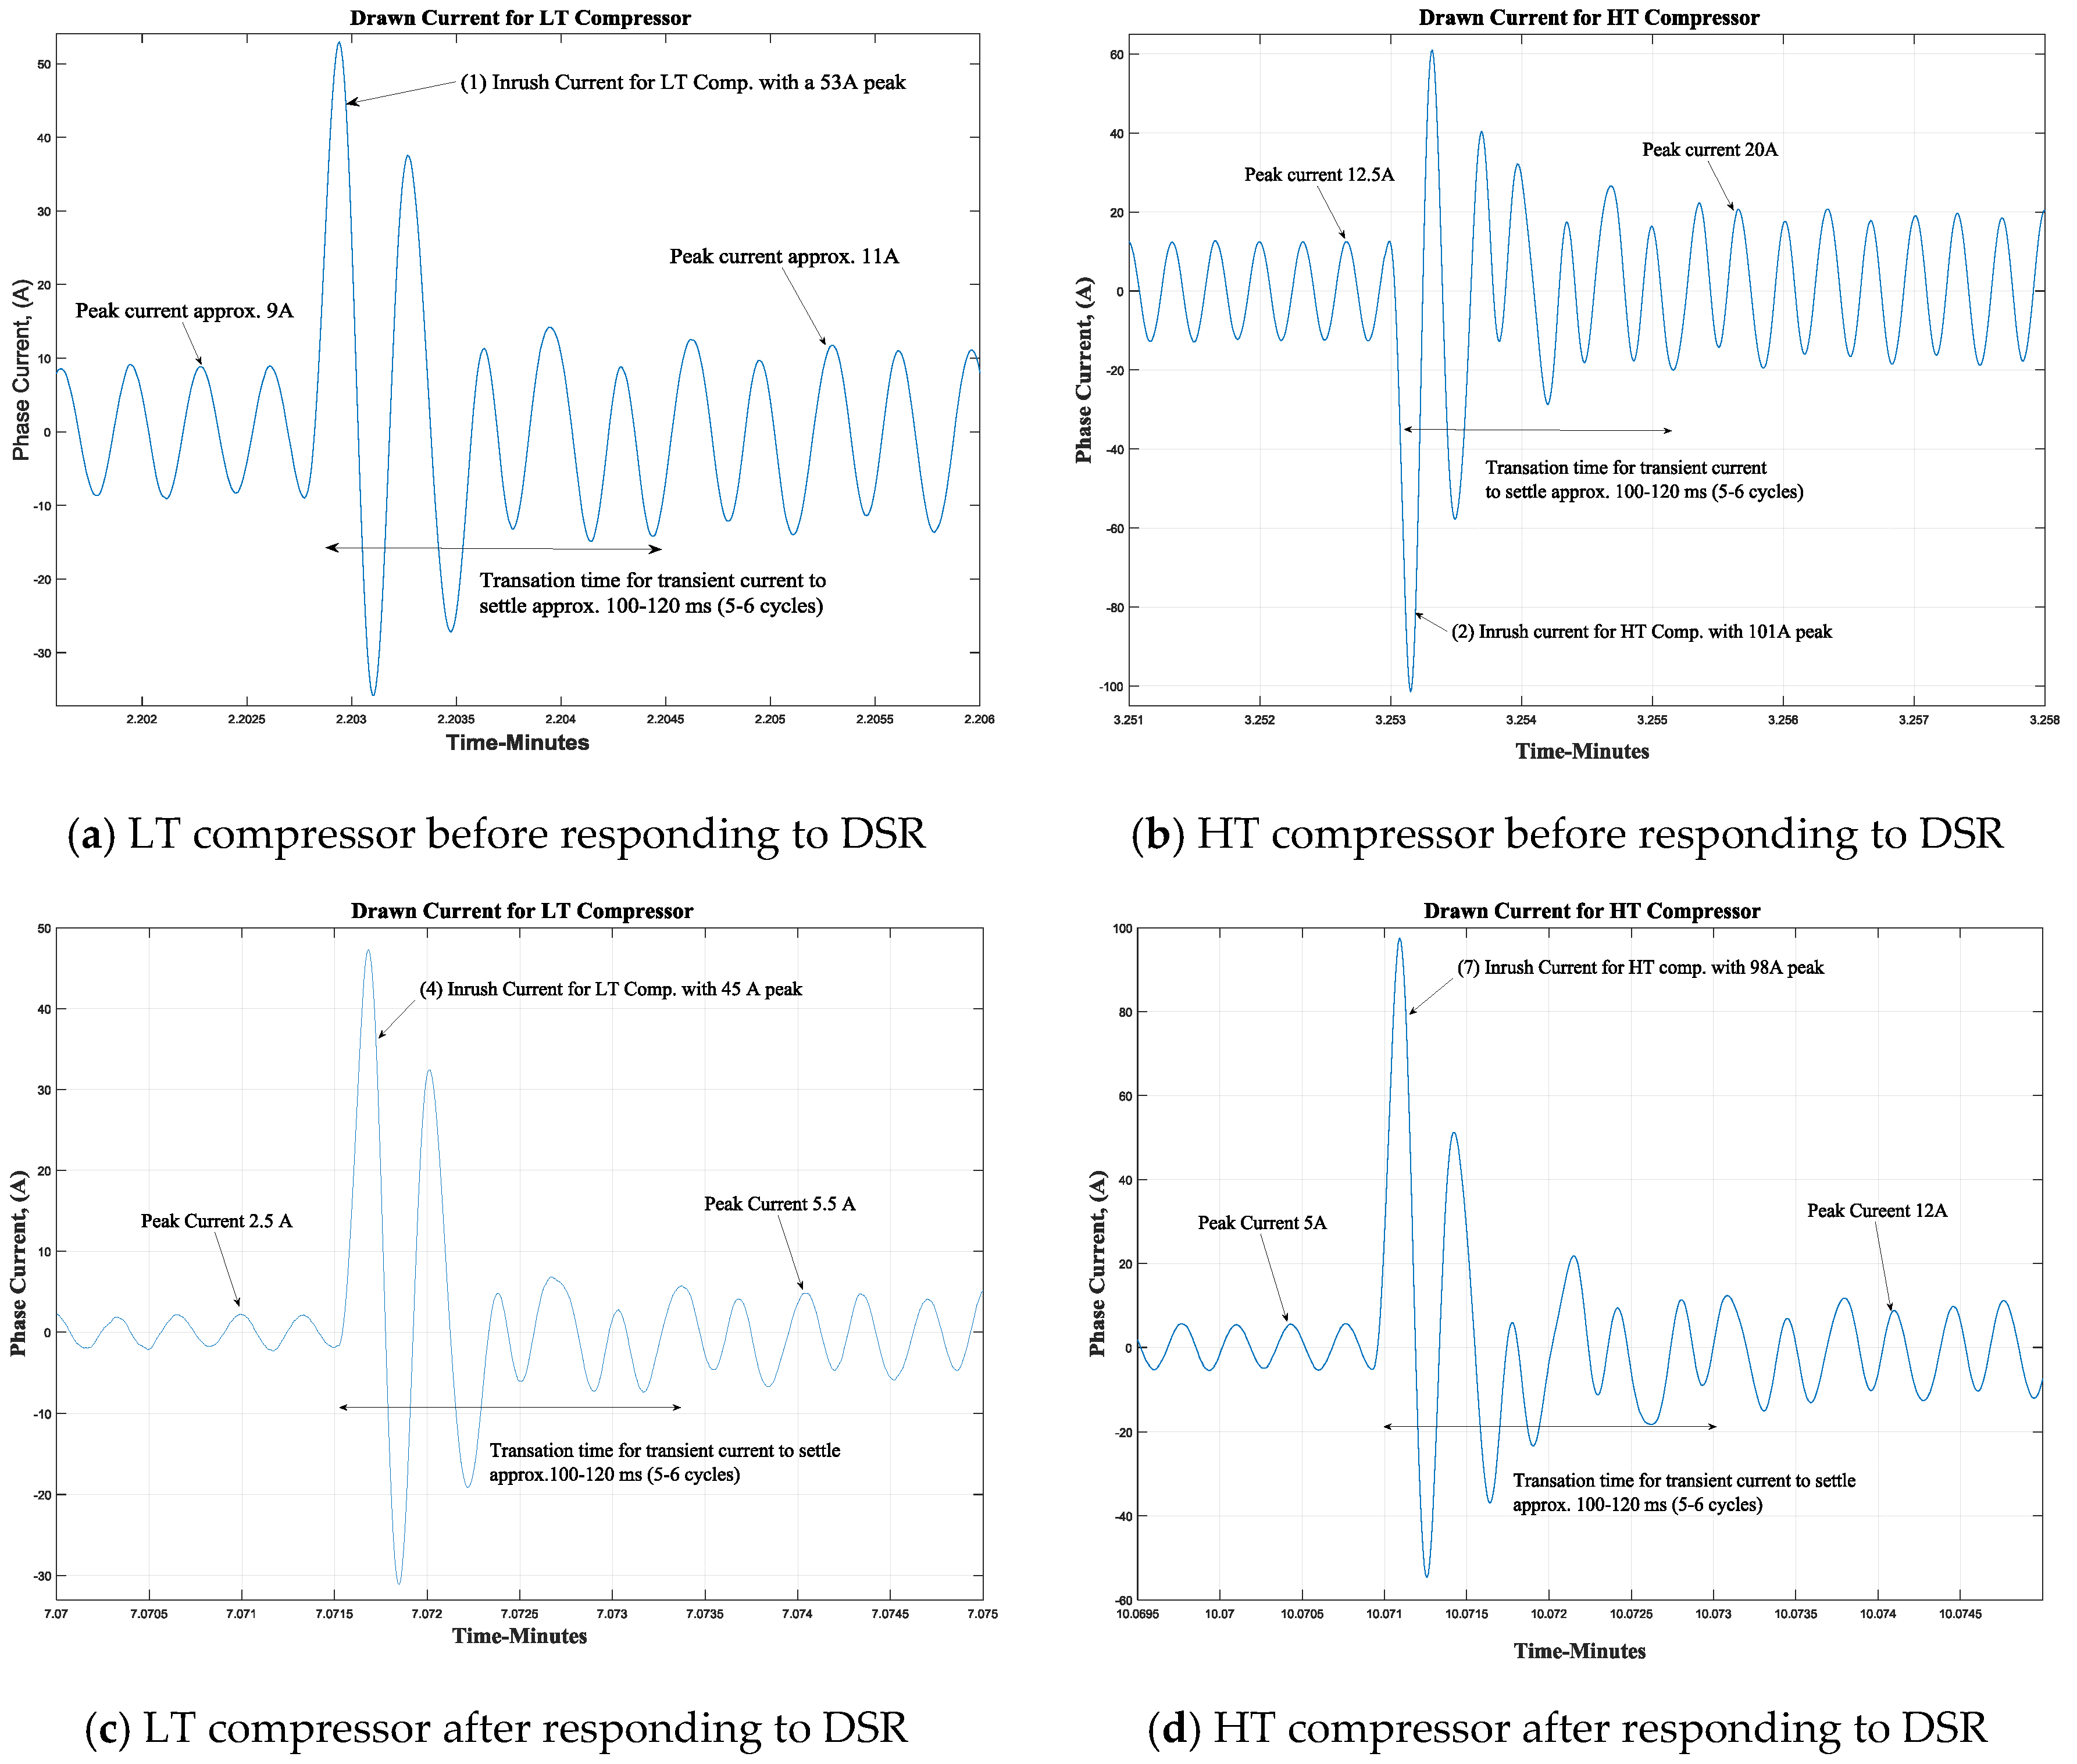
3.2. Impact of DSR on Power Consumption

Inrush current is the maximum instantaneous current drawn by the electrical motors at start-up [32]. To investigate the impact of DSR on the inrush and power consumption of the entire refrigeration system, a full system hard shutdown is deployed based on instantly shutting down the pack of six compressors for 30 s, then back on with a suction pressure offset and then rolling back the offset after 30 min and observing the whole system recovery to normal operation. A high sensitivity split core current transducer CT (HOBUT), rated current 120 A and 333 mV output voltage is used to measure the current drawn by the compressor. A PicoScope 4824 is used to capture the data at a sampling frequency of 2 kHz per channel.
Figure 10 shows one line current (of the 3Ø current) drawn from the refrigeration HT and LT pack of compressors, while Figure 11 shows the expanded event for the first 15 min of continuous operation, prior to and after responding to the DSR event. Each high-valued transient current spike in Figure 10 and Figure 11 is an inrush current peak that occurs at the starting duty cycle of the compressor. This helps identify the number of operational duty cycles of the compressor over a given time period and provides insight into how the pack of compressors will respond to variations of the thermodynamic characteristics of the entire refrigeration system. Inrush currents of the HT and LT compressors before and after the DSR are clearly evident in Figure 12.
It can be seen that the peak of inrush current is approximately 4–5 times higher than the rated current supplied prior to responding to the DSR event and taking approximately 100–120 ms (5–6 cycles) for the current to settle, as shown in Figure 12a,b, respectively. Moreover, the peak inrush current is around 7–8 times higher than the nominal operating current after responding to the DSR event, as shown in Figure 12c,d, respectively. This is due to the base load current before the DSR being greater than the base load current after the DSR, as shown in Figure 12. It is also impacted by applying the suction pressure offset to reduce the frequency of compressor duty cycles during the DSR event, which lowered the base current of the system during DSR.
Since the peak inrush current after a DSR event is around 30% higher than those before responding to it, the latter, in particular, might impart voltage fluctuations on the power supply and potentially cause instability to the local power supply system, depending on the stiffness of the supply. References [30,31,32,34,35] reported that inrush currents are always unbalanced in a three phase power system and can cause a fall in the line voltages and thereby impacting the power quality of the entire network. Declining quality depends mainly on the decay time constant and the magnitude of the transient inrush current.
To examine this in further detail, a three phase power supply system is modelled and implemented in Simulink, Figure 13. The model is designed to determine the impact of the compressor operation on the performance of the power supply system and in particular the load on the primary input transformer (i.e., the Power Source in Figure 13). The power system consists of the following primary components:
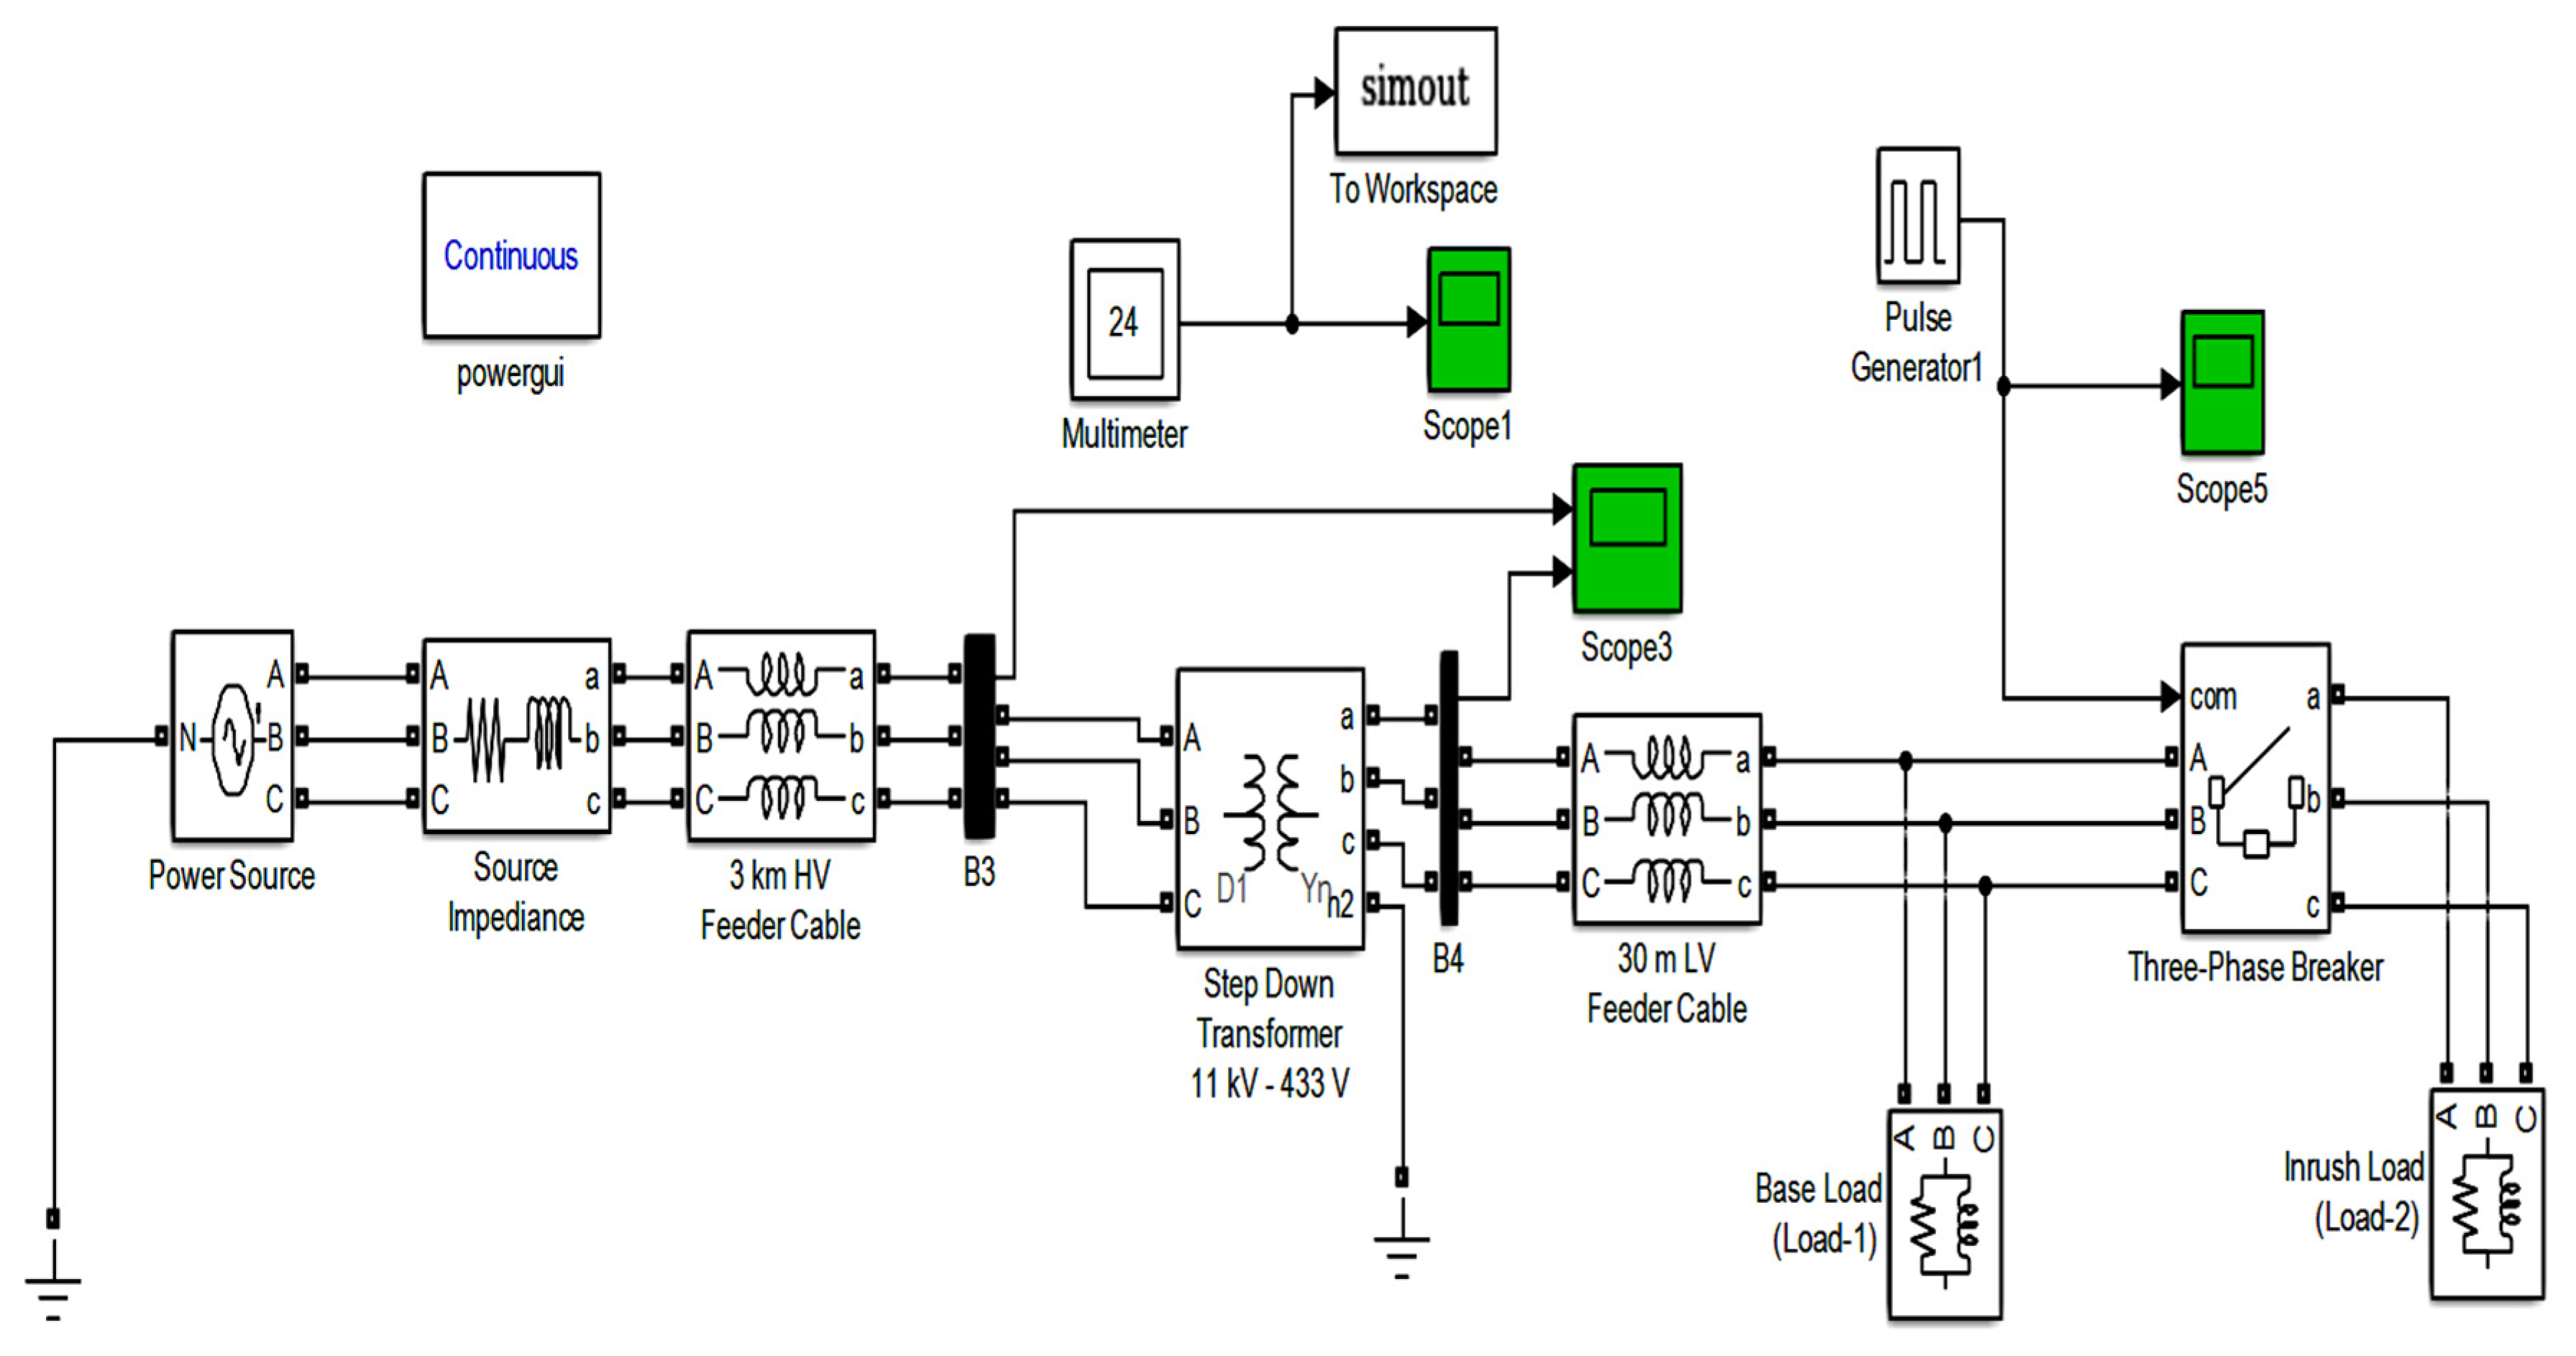
  • High voltage 11 kV power source with resistive-inductive characteristics and 50 Hz supply frequency. The generator is set to always control the output active power and reactive power.
  • High voltage 11 kV feeder cable: the distance from the HV distribution substation to the local stepdown transformer is approximately 3 km.
  • Step-down transformer (type Dyn11), where the low voltage at the secondary winding leads the high voltage at the primary winding by 30 degrees.
  • Low voltage 433 V feeder cable, the distance from the step down transformed to the site main incomer is approximately 30 m.
  • The refrigeration load is represented by a constant resistive-inductive base-load, while the inrush current is generated by a variable resistive-inductive load (i.e., inrush load), with floating Y connections (which unbalance the three phases of the power supply system).
Parameters, specifications and settings are given in Table A2.
Figure 12b shows the HT compressor inrush current exhibits a transient increase from 12.5 A to 101 A during the initial 10 ms, then settles at 20 A after approximately 120 ms, for normal system operation prior to responding to the DSR event. Correspondingly, Figure 12d shows the same HT compressor inrush current has a transient increase from 5 A to 98 A during the first 10 ms, then settles at 12 A after approximately 120 ms, for normal system operation after the DSR.
To investigate the impact of inrush currents on the power network, the system (Figure 13) is simulated under circumstances commensurate with those for the HT compressor depicted in Figure 12b above, where the base load (Load-1) draws normal rated current and the inrush load (Load-2) draws a current equivalent to the inrush current in magnitude and time (i.e., 10 ms). Table 1 presents values for the supplied current and the power consumption of the simulated power system for one HT compressor.
An inrush current with a transient magnitude of 101 A is induced after 30 ms. Figure 14 shows the resulting peak to peak voltages and currents of the power system, whilst Figure 14a–f show the three phase voltages and currents of the primary windings of the 11 kV–433 V (500 kVA) transformer. Figure 14g–l also show the three line to neutral voltages and currents of the secondary windings. Line to neutral voltages and currents of the base load are given in Figure 14m–r and line to neutral voltages and currents of the induced inrush load are shown in Figure 14s–x. It is notable from Figure 14 above that all the line voltages of the: base load, secondary and primary terminals of the transformer are impacted by the rapid transition spike of inrush current, resulting changes in the phase and magnitude of voltage waveform of the power supply. Figure 15 shows the expanded events of the impact of inrush current on the primary and secondary voltages of the 11 kV–433 V (500 kVA) transformer and show the resulting transient voltage fluctuations at the primary and secondary terminals. In particular, it can be seen that a 101 A transient inrush current over a period of 10 ms creates a drop in line voltages of up to 1500 V (~10% of rated) at the primary side and 100 V (~30% of rated) at the secondary side of the transformer, with a transition time of 25 us (Figure 15b,e).
It is clear that the inrush currents of the load have direct impact on the terminal voltages and currents of the HV and LV sides of the step-down transformer and can be significantly greater if the start-up of multiple compressors are synchronized after a DSR in the same store. Investigations to determine the consequences of this impact and technical solutions to mitigate it are currently under investigation.
However, of note [30,31,32,34,35] reported that inrush can cause voltage fluctuations on the power supply and potentially cause instability to the local power supply system. References [35,36,37] reported that inrush current of the induction motor can cause a voltage drop at the distribution line and affect the operation of the other electrical equipment, particularly voltage sensitive devices such as fluorescence lamps and UPS and on occasion can also damage the induction motor start coil. References [38,39] reported that high inrush current which flows during the starting of the induction motor can cause overheat stress and potentially damage the insulation of the adjacent windings and produce torque pulsations that lead to premature failures in stator windings, rotor cage, couplings and gearbox of the machine. Malfunctions will lead to increase the repair expenses and cause a significant financial loss due to unexpected breakdown time. Reference [40] reported that inrush current can damage the Variable Speed Drive in HVAC and refrigeration systems While, reference [41] addressed the effect of inrush current on the transformer protection, hence inrush current involves a great and long-lasting dc component and harmonics. This could unbalance the power system and will mal-trip the over-current protection. The statistical faults survey on the indication motor due to stator winding failure as a result of high current impact has been reported to be 28% respecting to the total number of faults according to IEEE study and 36% according to Electric Power Research Institute EPRI [42,43]. However, further studies are required to understand the magnitude of these risks on modern refrigeration packs. These need to be conducted over long durations but the risk is notable.

4. Conclusions

The impact of the Firm Frequency Response (FFR) Demand Side Response (DSR) on food retailing refrigeration systems is investigated. The authors present results to show how the temperature profiles of the refrigeration cases, the active power and the current drawn by the compressors are affected by responding to a DSR event and evaluate the risks and challenges associated with primary and secondary FFR response requests from the grid.
From experimental trials, it is shown that a DSR event can cause disruption to the post-defrost pull-down state of HT cases with air curtain that remain active, extending duration of pull-down up to 5–6 times compared to normal operation. Performed DSR tests revealed that, depending on the amount of contents of refrigeration case, this can result in an increase of CPT to up to 2 °C above its nominal value for the duration of the pull-down. During the July tests, the pack operation post-DSR demonstrated less stable cycling of active HT compressors, varying from 1 to 4 active compressors compared to 1 to 2 active compressors during March tests, with all 4 compressors being active immediately after the end of DSR. In order to mitigate this and reduce the fatigue on compressors, variable frequency drives (VFDs) are considered for further trials.
Measurements have shown an increase in supply current (by approximately 30%) after responding to the DSR event compared to the normal operation. It has been found that a 101 A transient inrush current over a period of 10 ms creates a drop in line voltages of up to 1.5 kV (~10% of rated) at the primary side and 100 V (~30% of rated) at the secondary side of the transformer, with a transition time of 25 μs. Inrush currents of the load have direct impact on the terminal voltage and current of the HV and LV sides of the step-down transformer and can cause voltage fluctuations on the power supply and potentially cause instability to the local power supply system. Moreover, inrush current can be much greater if the subsequent start-up sequence of multiple compressors is synchronized.
The authors would like to stress the importance of considerate choice of suction pressure offset values for packs with refrigeration cases that are expected to exit defrost during DSR, or cases that are already not achieving target temperature. Also, it is important to note that evaporation temperature may be affected even if the suction pressure offset is not applied due to limited circulation of refrigerant in the system for the duration of DSR, as the experiments have shown. Further investigations are required to understand the magnitude of inrush current risks on modern refrigeration packs and to determine the consequences of this impact and the technical solutions to mitigate it.

Acknowledgments

The authors would like to thank Innovate UK (grant number 54043-400273) for funding this project. Authors also would like to thank Edward Hammond from ECH Engineering and Lee Harpham from IMS Evolve Ltd. for their assistance and guidance during field experiments at Riseholme Refrigeration Research Centre.

Author Contributions

The first two authors contributed towards: carrying out all the works related to the design of the testing procedure, testing and experimenting the refrigeration system at the Refrigeration Research Centre, modelling and simulation the system, collecting and analysing the data, and formatting and writing the manuscript. While, the third author contributed towards: the section of (Extent of the Challenge), updating the list of references, and reviewing the manuscript. Other authors contributed effectively towards: reviewing and correcting the manuscript through adding their comments and technical advice. Furthermore, the last three authors contributed to the strategic planning and development of the project.

Conflicts of Interest

The authors declare no conflict of interest.

Appendix A

Table A1. Case Settings.
Case NameCase TypeSet PointDifferentialValve TypeDefrost Termination
HT case 01Diary case with doors1 °C2 °CAKV1030 min/8 °C
HT case 021 °C
HT case 03Meat case with doors−2 °C
HT case 04−2 °C
HT case 05−2 °C
HT case 06Produce case with air curtain0 °C
HT case 070 °C
HT case 080 °C
HT case 09Dairy case with air curtain−2 °C
HT case 10−2 °C
HT case 11−2 °C
HT case 12Meat case with air curtain−2 °C
HT case 13−2 °C
LT case 01Freezer−23 °C2 °CTEX30 min/3 °C
LT case 02Freezer−23 °C
Table A2. Values of the parameters, specifications and settings for the components of the Simulink model of power system.
RatingPower SourceHigh Voltage FeederStep Down TransformerLow Voltage Feeder
Voltage11 kV-11 kV/433 V433 V
Current39.4 A-26.24 A/666.7 A-
Power Factor0.98 *-0.98 *-
Apparent Power750 kVA *-500 kVA-
Active Power736 kW-490 kW-
Reactive Power149.3 kVAR-99.5 kVAR-
3-phase Self-Impedance1 ohm, 1 mH0.1153 Ohm/km, 1.048 mH/km--
3-phase Mutual-Impedance-0.4130 Ohm/km, 3.321 mH/km-0.4130 Ohm/km, 3.321 mH/km
3-phase Primary Winding Impedance--0.024485 Ohm, 1.9244 mH-
3-phase Secondary Winding Impedance--6.1714 × 10⁻⁵ Ohm, 4.8504 × 10⁻⁶ H-
3-Phase Magnetization Impedance--4534.3 Ohm, 12.028 H-
* Assumed values.

References

  1. Armstrong, R.C.; Wolfram, C.; de Jong, K.P.; Gross, R.; Lewis, N.S.; Boardman, B.; Ragauskas, A.J.; Ehrhardt-Martinez, K.; Crabtree, G.; Ramana, M.V. The frontiers of energy. Nat. Energy 2016, 1. [Google Scholar] [CrossRef]
  2. Tan, X.; Li, Q.; Wang, H. Advances and trends of energy storage technology in Microgrid. Int. JEPE 2013, 44, 179–191. [Google Scholar] [CrossRef]
  3. Elvi Group. EPS partners with AutoGrid on software for energy storage, acquires Elvi Energy. Fuel Cells Bull. 2016, 2016, 9–10. [Google Scholar]
  4. Kamel, F.; Marwan, M. Demand-side response smart grid technique for optimized energy use. In Innovation in Power, Control and Optimization: Emerging Energy Technologies: Emerging Energy Technologies; Vasant, P., Barsoum, N., Webb, J., Eds.; Engineering Science Reference (IGI Global): Hershey, PA, USA, 2011; pp. 137–163. [Google Scholar]
  5. Proffitt, E. Profiting from Demand Side Response. Power Responsive, the National Grid in Association with the Major Energy Users’ Council. 2016. Available online: http://www.powerresponsive.com/media/1140/ng_meuc-dsr-book.pdf (accessed on 1 September 2017).
  6. Grünewald, P.; Torriti, J. Demand response from the non-domestic sector: Early UK experiences and future opportunities. Energy Policy 2013, 61, 423–429. [Google Scholar] [CrossRef]
  7. Granell, R.; Axon, C.J.; Wallom, D.C.; Layberry, R.L. Power-use profile analysis of non-domestic consumers for electricity tariff switching. Energy Effic. 2016, 9, 825–841. [Google Scholar] [CrossRef]
  8. Teng, F.; Aunedi, M.; Pudjianto, D.; Strbac, G. Benefits of demand-side response in providing frequency response service in the future GB power system. Front. Energy Res. 2015, 3, 36. [Google Scholar] [CrossRef]
  9. Cheng, M.; Wu, J.; Galsworthy, S.J.; Gargov, N.; Hung, W.H.; Zhou, Y. Performance of industrial melting pots in the provision of dynamic frequency response in the Great Britain power system. Appl. Energy 2017, 201, 245–256. [Google Scholar] [CrossRef]
  10. Beil, I.; Hiskens, I.; Backhaus, S. Frequency regulation from commercial building HVAC demand response. Proc. IEEE 2016, 104, 745–757. [Google Scholar] [CrossRef]
  11. Qadrdan, M.; Cheng, M.; Wu, J.; Jenkins, N. Benefits of demand-side response in combined gas and electricity networks. Appl. Energy 2017, 192, 360–369. [Google Scholar] [CrossRef]
  12. Tassou, S.A.; Kolokotroni, M.; Gowreesunker, B.; Stojceska, V.; Azapagic, A.; Fryer, P.; Bakalis, S. Energy demand and reduction opportunities in the UK food chain. Proc. Inst. Civ. Eng.-Energy 2014, 167, 162–170. [Google Scholar] [CrossRef]
  13. Buzelin, L.O.S.; Amico, S.C.; Vargas, J.V.C.; Parise, J.A.R. Experimental development of an intelligent refrigeration system. Int. J. Refrig. 2005, 28, 165–175. [Google Scholar] [CrossRef]
  14. Conte, F.; Massucco, S.; Silvestro, F.; Ciapessoni, E.; Cirio, D. Stochastic modelling of aggregated thermal loads for impact analysis of demand side frequency regulation in the case of Sardinia in 2020. Int. JEPE 2017, 93, 291–307. [Google Scholar] [CrossRef]
  15. Refrigeration and Air-Conditioning Engineers. ASHRAE Handbook Refrigeration, Inch-Pund Edition, American Society of Heating; Refrigeration and Air-Conditioning Engineers: Atlanta, GA, USA, 2014. [Google Scholar]
  16. Larsen, L.F.; Thybo, C.; Wisniewski, R.; Izadi-Zamanabadi, R. Synchronization and desynchronizing control schemes for supermarket refrigeration systems. In Proceedings of the IEEE International Conference on Singapore Control Applications, Singapore, 1–3 October 2007; pp. 1414–1419. [Google Scholar]
  17. Kremers, E.; Durana, J.M.G.; Barambones, O.; Lachaud, A. Synchronisation Phenomena in Electrical Systems: Emergent Oscillation in a Refrigerator Population. In Complex Systems Design & Management; Springer: Heidelberg, Germany, 2013; pp. 273–284. [Google Scholar]
  18. Stadler, M.; Krause, W.; Sonnenschein, M.; Vogel, U. Modelling and evaluation of control schemes for enhancing load shift of electricity demand for cooling devices. Environ. Model. Softw. 2009, 24, 285–295. [Google Scholar] [CrossRef]
  19. Short, J.A.; Infield, D.G.; Freris, L.L. Stabilization of grid frequency through dynamic demand control. IEEE Trans. Power Syst. 2007, 22, 1284–1293. [Google Scholar] [CrossRef] [Green Version]
  20. Angeli, D.; Kountouriotis, P.A. A stochastic approach to “dynamic-demand” refrigerator control. IEEE Trans. Control Syst. Technol. 2012, 20, 581–592. [Google Scholar] [CrossRef]
  21. Borsche, T.; Markovic, U.; Andersson, G. A new algorithm for primary frequency control with cooling appliances. Comput. Sci.-Res. Dev. 2016, 31, 89–95. [Google Scholar] [CrossRef]
  22. Kremers, E.; Marı, J.; Barambones, O. Emergent synchronisation properties of a refrigerator demand side management system. Appl. Energy 2013, 101, 709–717. [Google Scholar] [CrossRef]
  23. Anderson, P.M.; Mirheydar, M. A low-order system frequency response model. IEEE Trans. Power Syst. 1990, 5, 720–729. [Google Scholar] [CrossRef]
  24. Snijders, C.; Matzat, U.; Reips, U.D. “Big Data”: Big gaps of knowledge in the field of internet science. Int. J. Internet Sci. 2012, 7, 1–5. [Google Scholar]
  25. De Mauro, A.; Greco, M.; Grimaldi, M. A formal definition of Big Data based on its essential features. Libr. Rev. 2016, 65, 122–135. [Google Scholar] [CrossRef]
  26. Brady, N.; Palmes, P.; Walsh, J. Using a Big Data Analytics Approach to Unlock the Value of Refrigeration Case Parametric Data. Comput. Sci. 2014, 121, 1–12. [Google Scholar]
  27. Brady, N.; Palmes, P.; Walsh, J. Using a Big Data Analytics Approach to Unlock the Value of Refrigeration Case Parametric Data. ASHRAE Trans. 2015, 121, 1–8. [Google Scholar]
  28. Tang, X.; Milanović, J.V. Assessment of the impact of demand-side management on distribution network voltage stability. CIRED-Open Access Proc. J. 2017, 1, 2118–2121. [Google Scholar] [CrossRef]
  29. Kies, A.; Schyska, B.U.; von Bremen, L. The Demand Side Management Potential to Balance a Highly Renewable European Power System. Energies 2016, 9, 955. [Google Scholar] [CrossRef]
  30. Cui, Y.; Abdulsalam, S.G.; Chen, S.; Xu, W. A sequential phase energization technique for transformer inrush current reduction-Part I: Simulation and experimental results. IEEE Trans. Power Deliv. 2005, 20, 943–949. [Google Scholar] [CrossRef]
  31. Nagpal, M.; Martinich, T.G.; Moshref, A.; Morison, K.; Kundur, P. Assessing and limiting impact of transformer inrush current on power quality. IEEE Trans. Power Deliv. 2006, 21, 890–896. [Google Scholar] [CrossRef]
  32. Medora, N.K.; Kusko, A.; Thompson, M. Impact of line voltage sag on switch mode power supply operation. In Proceedings of the 3rd IEEE Conference on Industrial Electronics and Applications, Singapore, 3–5 June 2008; pp. 2178–2183. [Google Scholar]
  33. John Michael Walmsley Lawrence. Monitoring Refrigerated Units. U.S. Patent WO1992009977A1, 11 June 1992. [Google Scholar]
  34. Bruce, F.M.; Graefe, R.J.; Lutz, A.; Panlener, M.D. Reduced-voltage starting of squirrel-cage induction motors. IEEE Trans. Ind. Appl. 1984, 1, 46–55. [Google Scholar] [CrossRef]
  35. WEG. Low Inrush Current Induction Motors Brochure-Eng. Available online: http://www.weg.net (accessed on 15 December 2017).
  36. Isobe, T.; Wiik, J.A.; Wijaya, F.D.; Inoue, K.; Usuki, K.; Kitahara, T.; Shimada, R. Improved performance of induction motor using magnetic energy recovery switch. In Proceedings of the Power Conversion Conference PCC’07, Nagoya, Japan, 2–5 April 2007; pp. 919–924. [Google Scholar]
  37. Larabee, J.; Pellegrino, B.; Flick, B. Induction motor starting methods and issues. In Proceedings of the IEEE Industry Applications Society 52nd Annual Petroleum and Chemical Industry Conference, Denver, CO, USA, 12–14 September 2005; pp. 217–222. [Google Scholar]
  38. Lipo, T.A.; Consoli, A. Modeling and simulation of induction motors with saturable leakage reactances. IEEE Trans. Ind. Appl. 1984, 1, 180–189. [Google Scholar] [CrossRef]
  39. Zhang, P.; Du, Y.; Habetler, T.G.; Lu, B. A survey of condition monitoring and protection methods for medium-voltage induction motors. IEEE Trans. Ind. Appl. 2011, 47, 34–46. [Google Scholar] [CrossRef]
  40. Jadric, I.; Schnetzka, H.R. Ride-through Method and System for HVACandR Chillers. U.S. Patent 7,081,734, 25 July 2006. [Google Scholar]
  41. Wu, L.C.; Liu, C.W.; Chien, S.E.; Chen, C.S. The effect of inrush current on transformer protection. In Proceedings of the 38th North American Power Symposium, Carbondale, IL, USA, 17–19 September 2006; pp. 449–456. [Google Scholar]
  42. Singh, G.K. Induction machine drive condition monitoring and diagnostic research—A survey. Electr. Power Syst. Res. 2003, 64, 145–158. [Google Scholar] [CrossRef]
  43. Heising, C. IEEE Recommended Practice for the Design of Reliable Industrial and Commercial Power Systems; IEEE Inc.: New York, NY, USA, 2007. [Google Scholar]
Figure 1. Overview of Firm Frequency Response (National Grid).
Energies 11 00371 g001
Figure 2. (a) Temperature evolution for 18,653 LT cases during a 24 h period from 12:30 p.m. to 12:30 p.m. of the next day with CPT below −1 °C; (b) Temperature evolution for 49,897 HT cases for the same period of time with CPT above −1 °C.
Energies 11 00371 g002
Figure 3. Schematic diagram of the suction pipeline of the refrigeration system.
Energies 11 00371 g003
Figure 4. Probe data recorded for 24 h of normal operation of the refrigeration system.
Energies 11 00371 g004
Figure 5. (a) Active power readings (HT compressors); (b) Suction and discharge pressure profiles (HT). Full system shut-down for 30 s with 12 out of the 13 cases being switched off for 30 min, two DSR events are triggered at 11:45 and 14:45.
Energies 11 00371 g005
Figure 6. Temperature time histories of HT cases. Two simulated DSR events at 11:45 and 14:45. Cases 1–5 are HT cases with doors, cases 6–12 are HT cases with air curtain. Cases 10 and 11 are placed in proximity to the air conditioning system (AC). AC is set to disturb the air curtain of the case 10 by blowing hot air directly into it.
Energies 11 00371 g006
Figure 7. Evaporation temperature increase. Case 13 is not recovering from both defrosts after triggered DSRs.
Energies 11 00371 g007
Figure 8. Evaporation temperature increase; air off and air on temperature is smoothed by the effect of thermal inertia. Case 13 is recovering from defrosts after triggered DSR events but the pull-down time is extended.
Energies 11 00371 g008
Figure 9. Average HT case temperature vs duty profile of HT compressors.
Energies 11 00371 g009
Figure 10. One phase drawn current for the 3Ø refrigeration pack system before and after DSR.
Energies 11 00371 g010
Figure 11. One phase drawn current for the 3Ø refrigeration pack system before and after DSR for the first 15 min of continuous operation.
Energies 11 00371 g011
Figure 12. One phase inrush currents of the HT and LT compressor operation before and after DSR.
Energies 11 00371 g012
Figure 13. Simulink block diagram for a three phase power supply system.
Energies 11 00371 g013
Figure 14. Impact of inrush current with a magnitude of 101 A on the performance of the power system.
Energies 11 00371 g014
Figure 15. Impact of inrush current with a magnitude of 101 A on the primary and secondary terminal voltages of the 11 kV–400 V transformer.
Energies 11 00371 g015
Table 1. Values of the supplied current and the power consumption of the simulated power system for one HT compressor, at 0.85 P.F.
Base Load (Load-1)Inrush Load (Load-2)
Phase Current (A)3Ø Power (kW)3Ø Reactive Power (kVAR)Phase Current (A)3Ø Power (kW)3Ø Reactive Power (kVAR)
12.57.974.9410164.439.9

