Impact of Energy Losses Due to Failures on Photovoltaic Plant Energy Balance

 , , and
Abstract
:1. Introduction
2. Methodology to Assess Energy Losses Due to Failure
- is the peak power of the PV plant in Standard Test Conditions (STC).
- (%/K) temperature coefficient for power (negative in sign) that corresponds to the installed modules.
- ΔTcell_t (K) is the difference between the average hourly temperature of the PV reference module of the PV plant at hour t and 298.15 K.
- h is the hour number of the analysed period.
- (W/m2) is the global tilted irradiance in the hour t on the module plane.
- In the calculation of energy losses caused by a failure, the failure time considered includes the lapse of time between the hour in which the failures has been detected, (td), until the hour in which the failure has been repaired (tr). We do not consider the lapse of time between the real occurrence of the failure until it is detected because it is not known.
- The performance ratio during the failure time is considered the average performance ratio of the PV plant in the 15 months defined by Equation (5). In this equation, we have utilized the hourly measured data of energy production, solar radiation on the plane of the modules measured by a pyranometer, and module temperature.
- In the quantification of the energy losses associated with a failure, we take into account the equipment that failed and the remaining equipment that is affected upstream of the one that failed, taking into account the global hourly radiation on the level of the PV array, the average hourly temperature of the panel during the dwell time, the average performance ratio of the PV plant during the 15 months, and the dwell time, from the td hour in which the failure is detected until the tr hour that the failure has been repaired.
- When a failure takes place in a PV module its associated energy losses have been calculated assuming that in the time period between when the failure is detected and is replaced, the module there has not produced electric power in the complete string that the PV module belongs.
- Energy losses due to the transformation of solar radiation into electricity by a PV module in STC according to its datasheet have not been considered in PEL estimation.
- The PV plant energy losses due to a failure produced in the period from the moment when the failure took place and the instant in which it has been detected have been included in PEL estimation.
3. Application and Results
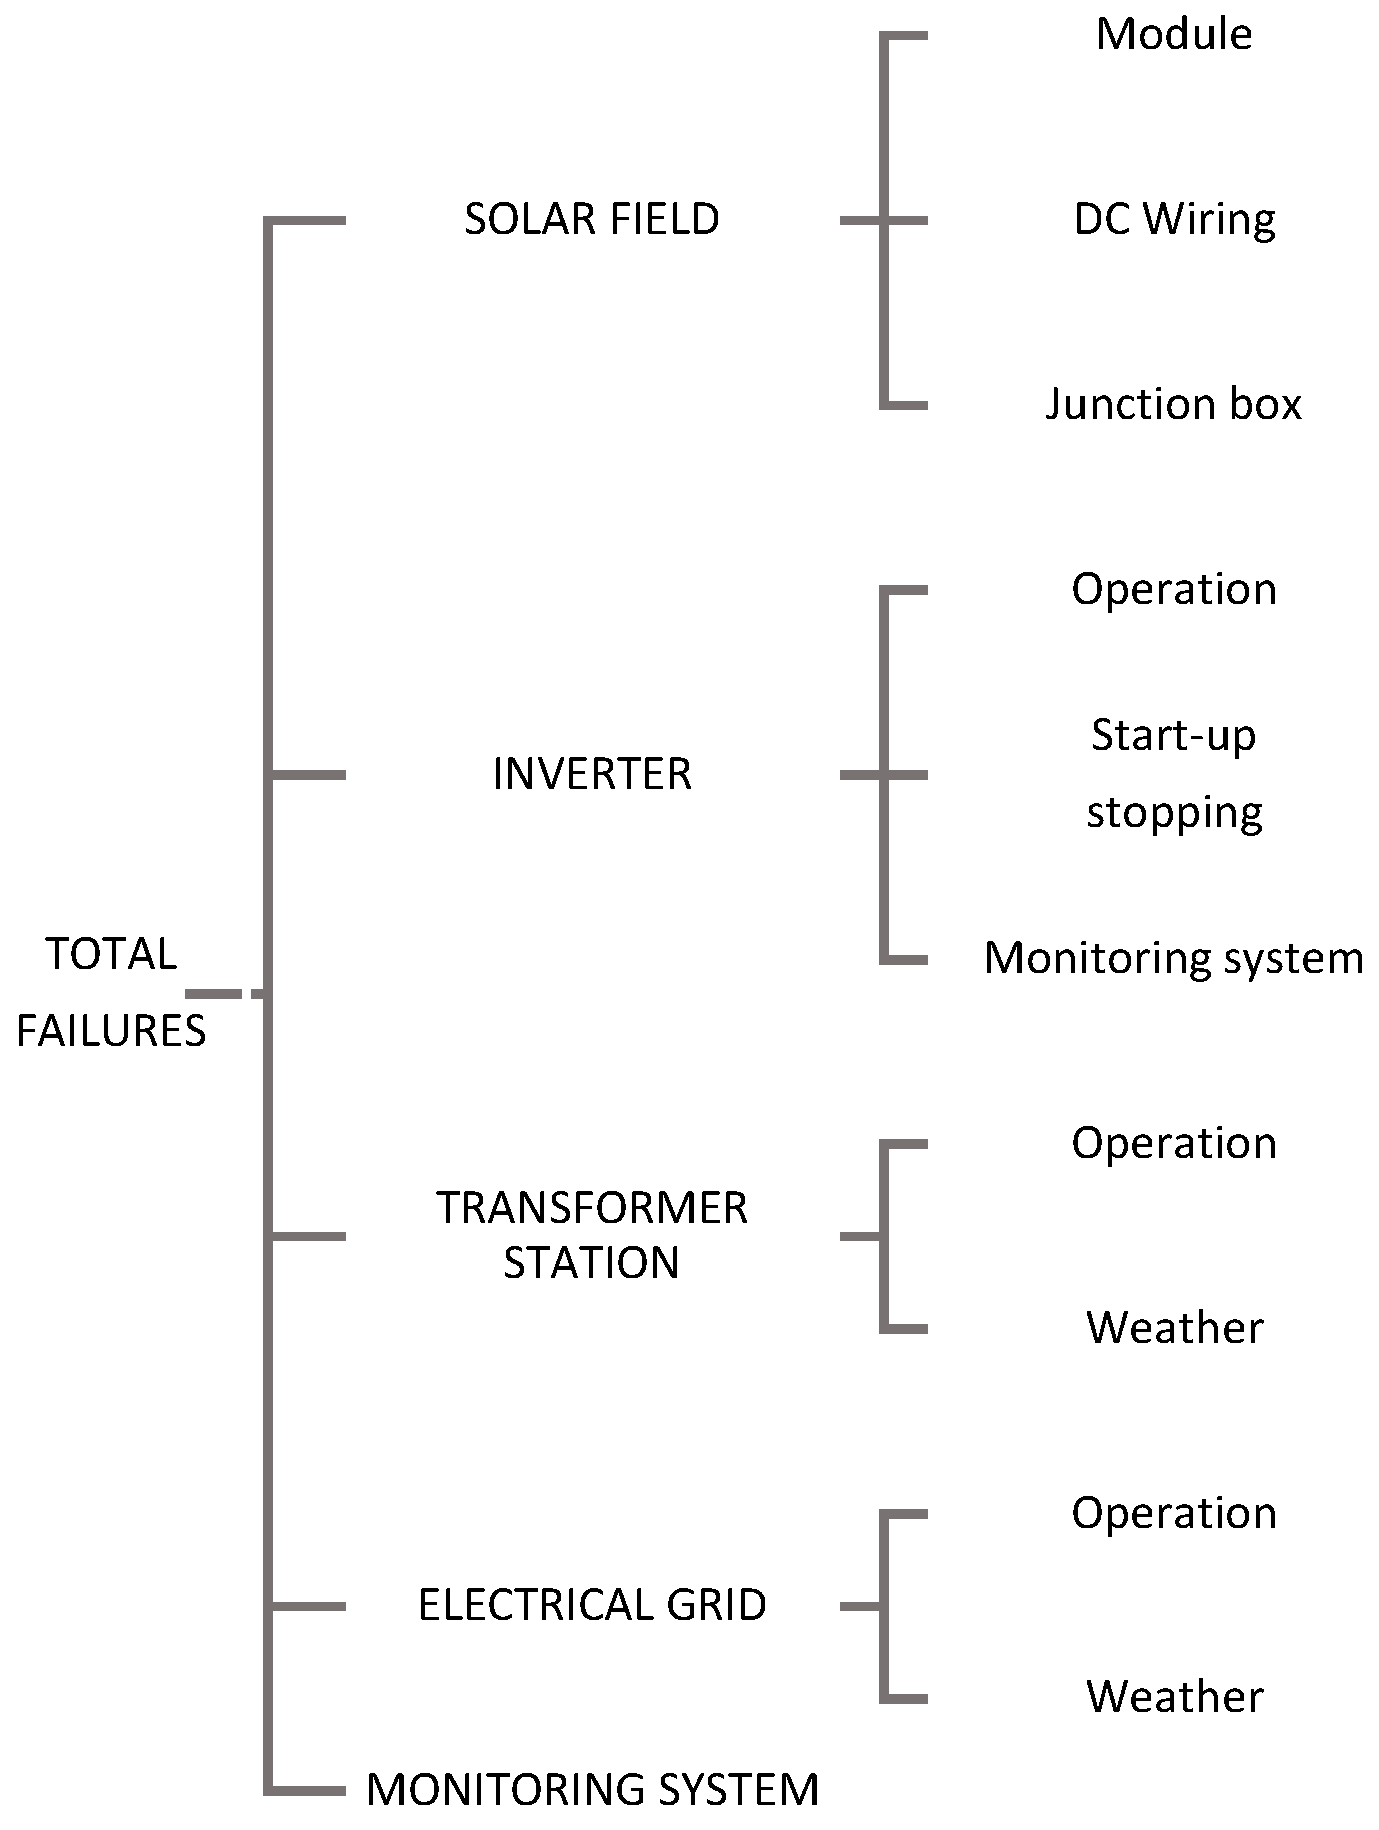
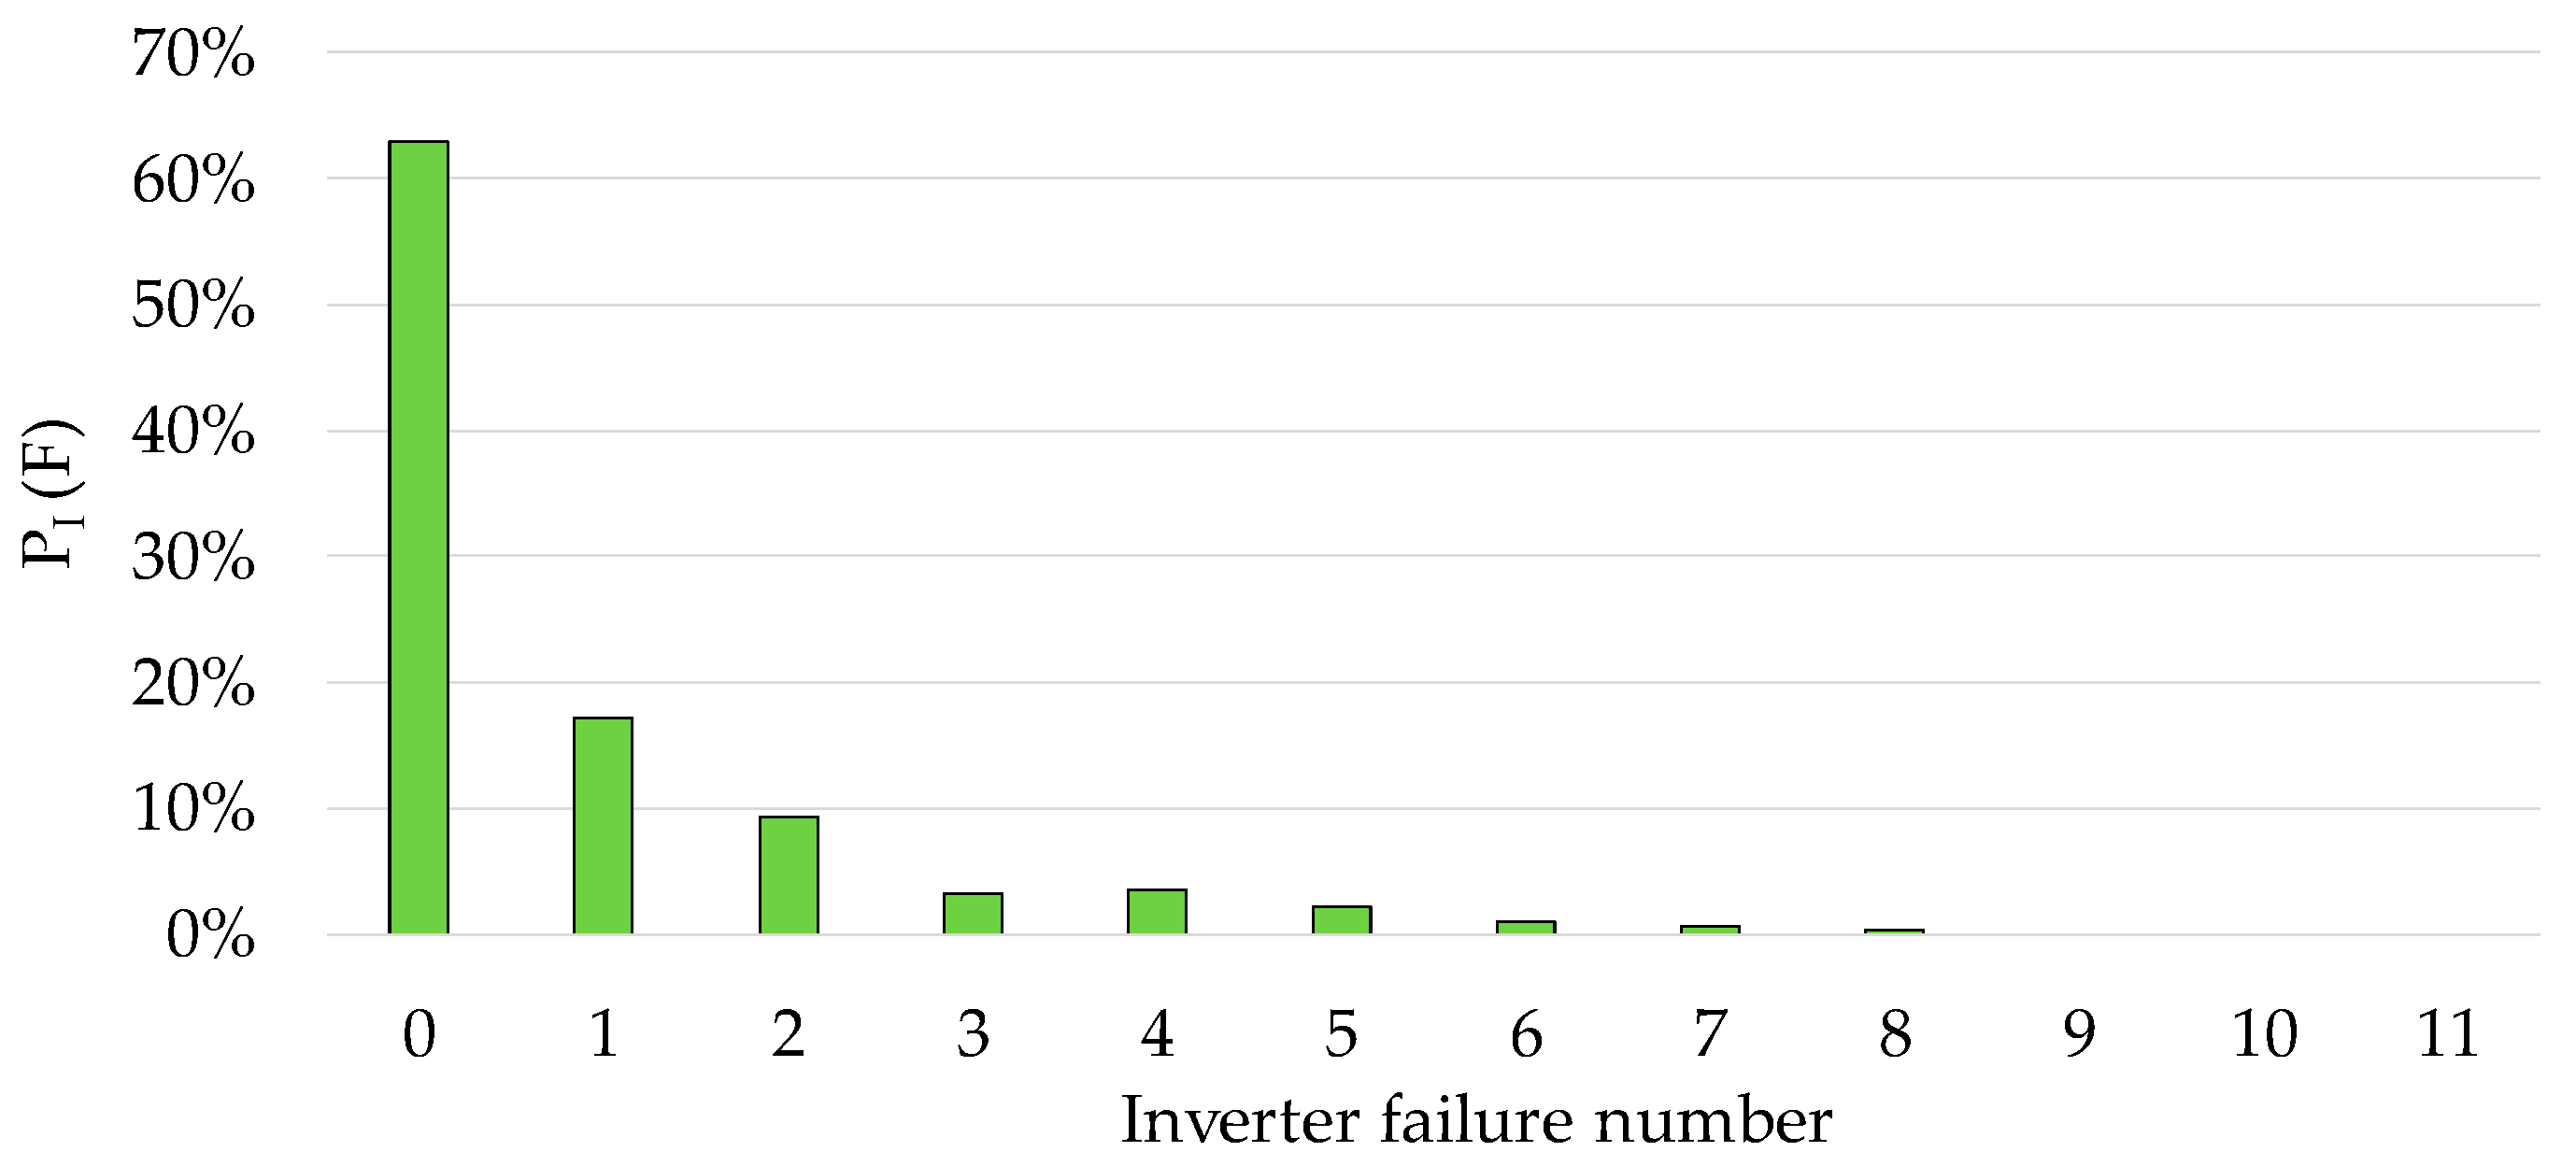
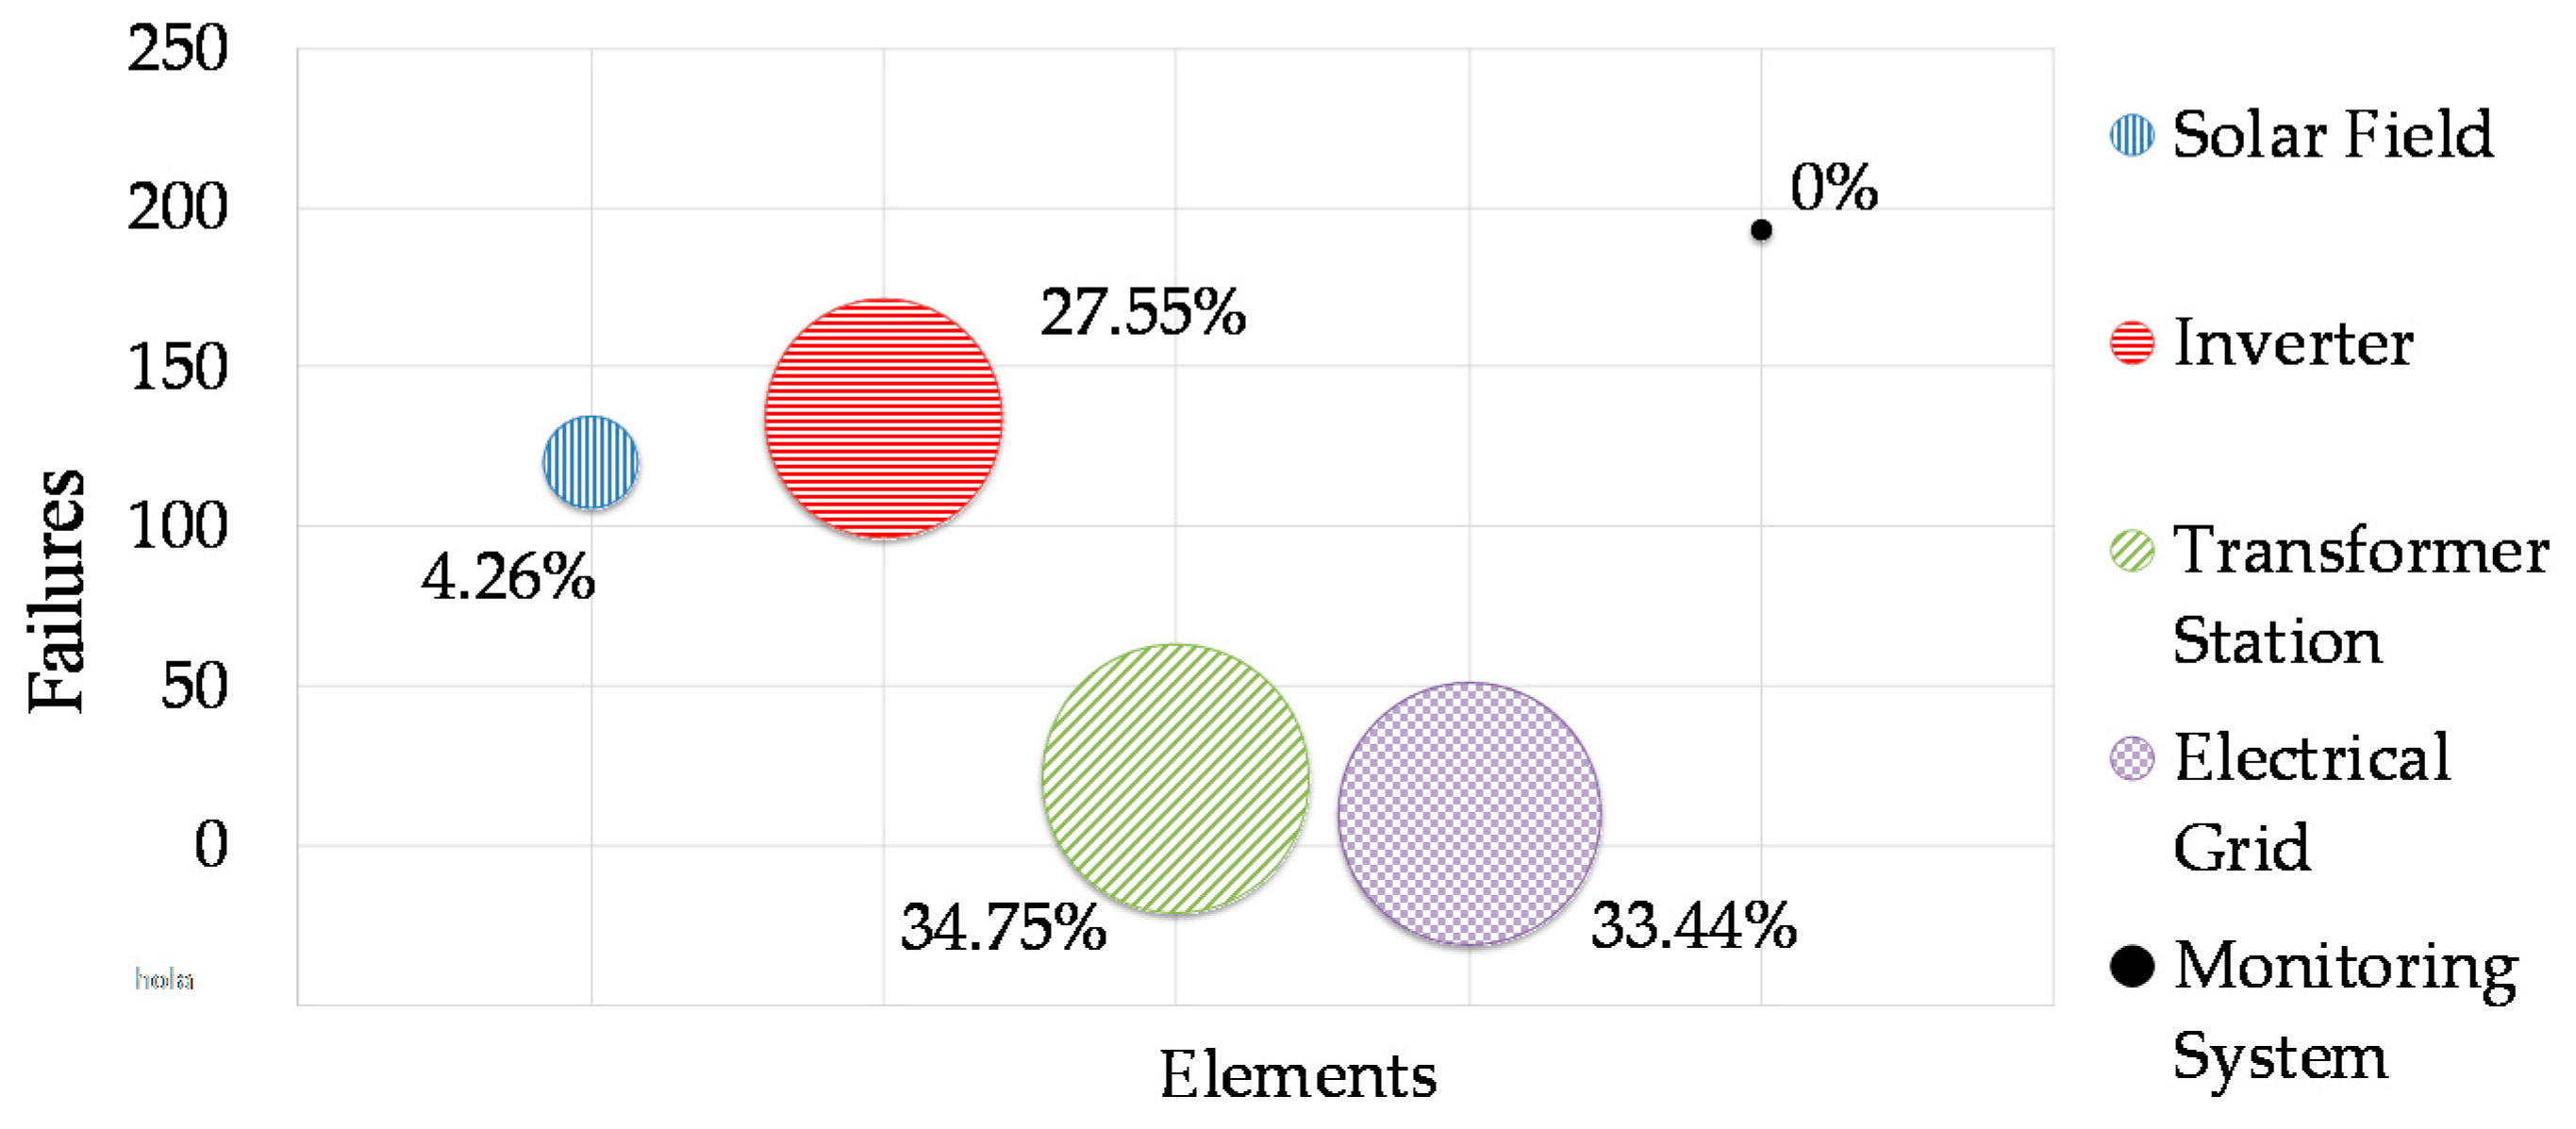
3.1. Failure Rates
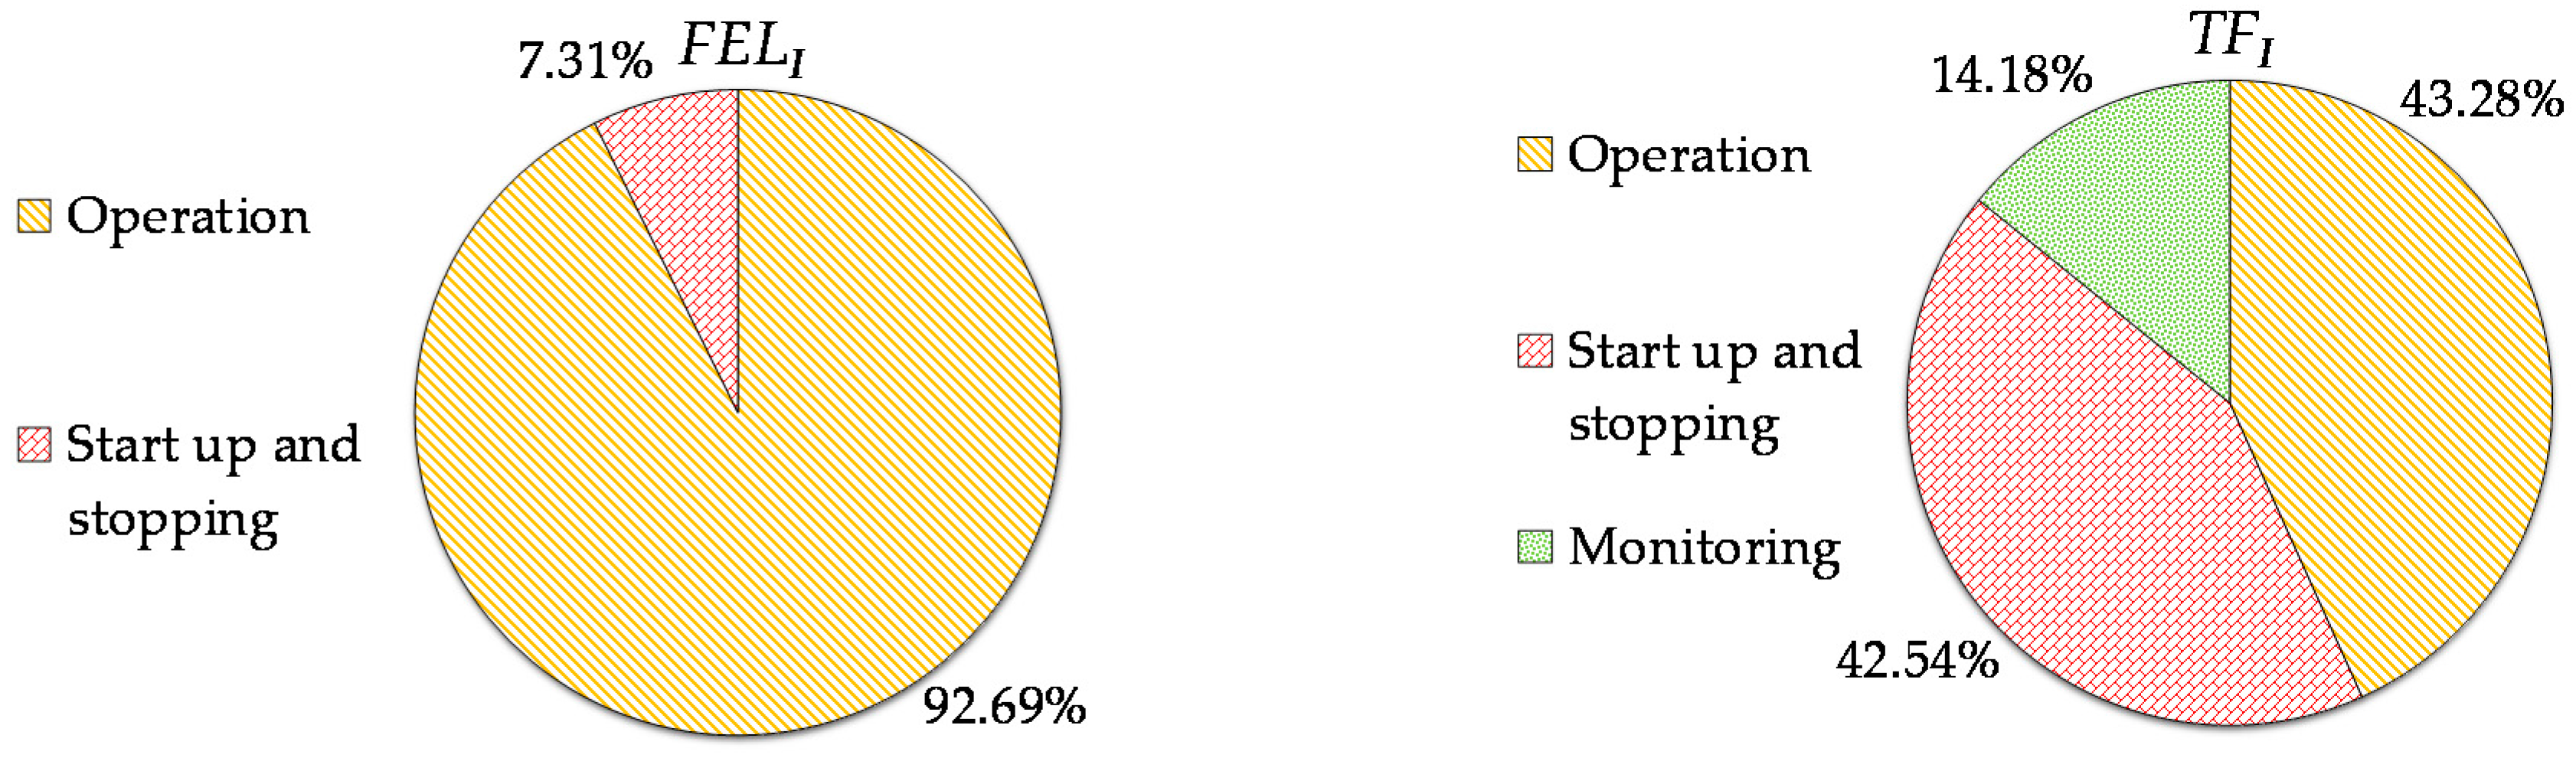
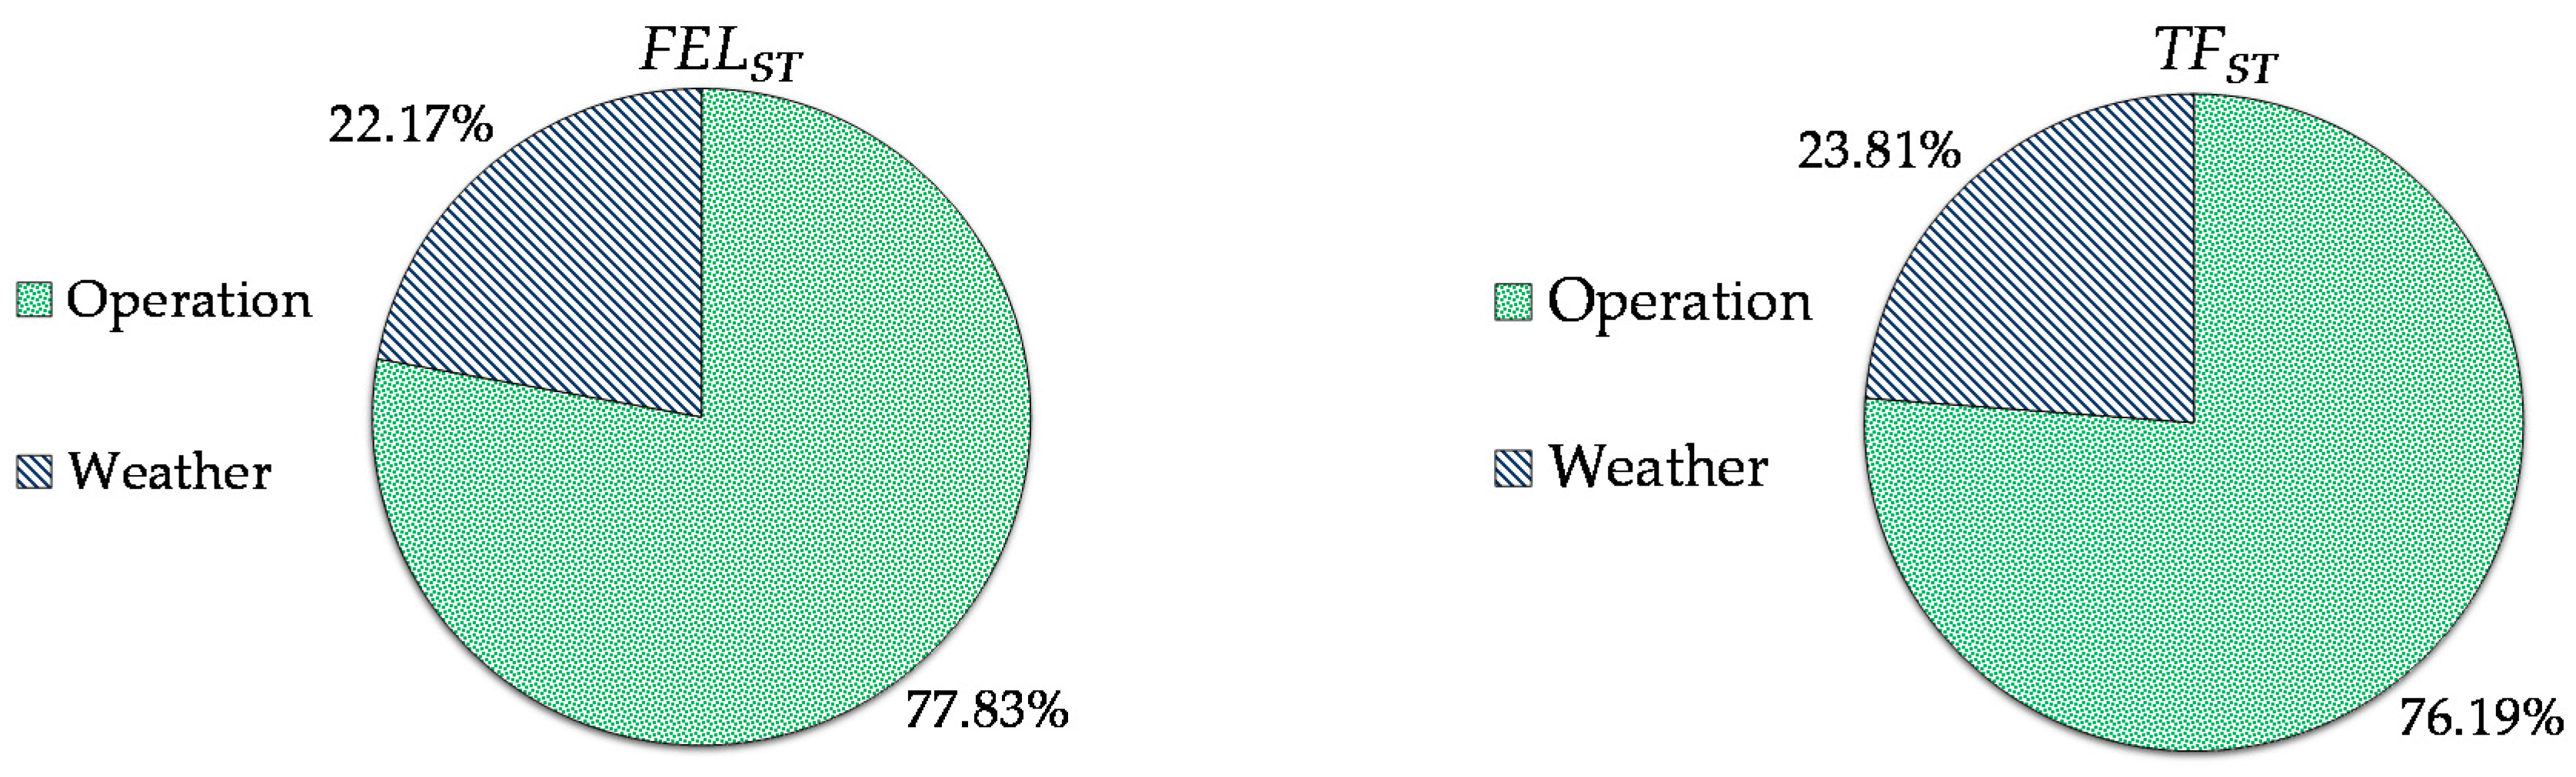
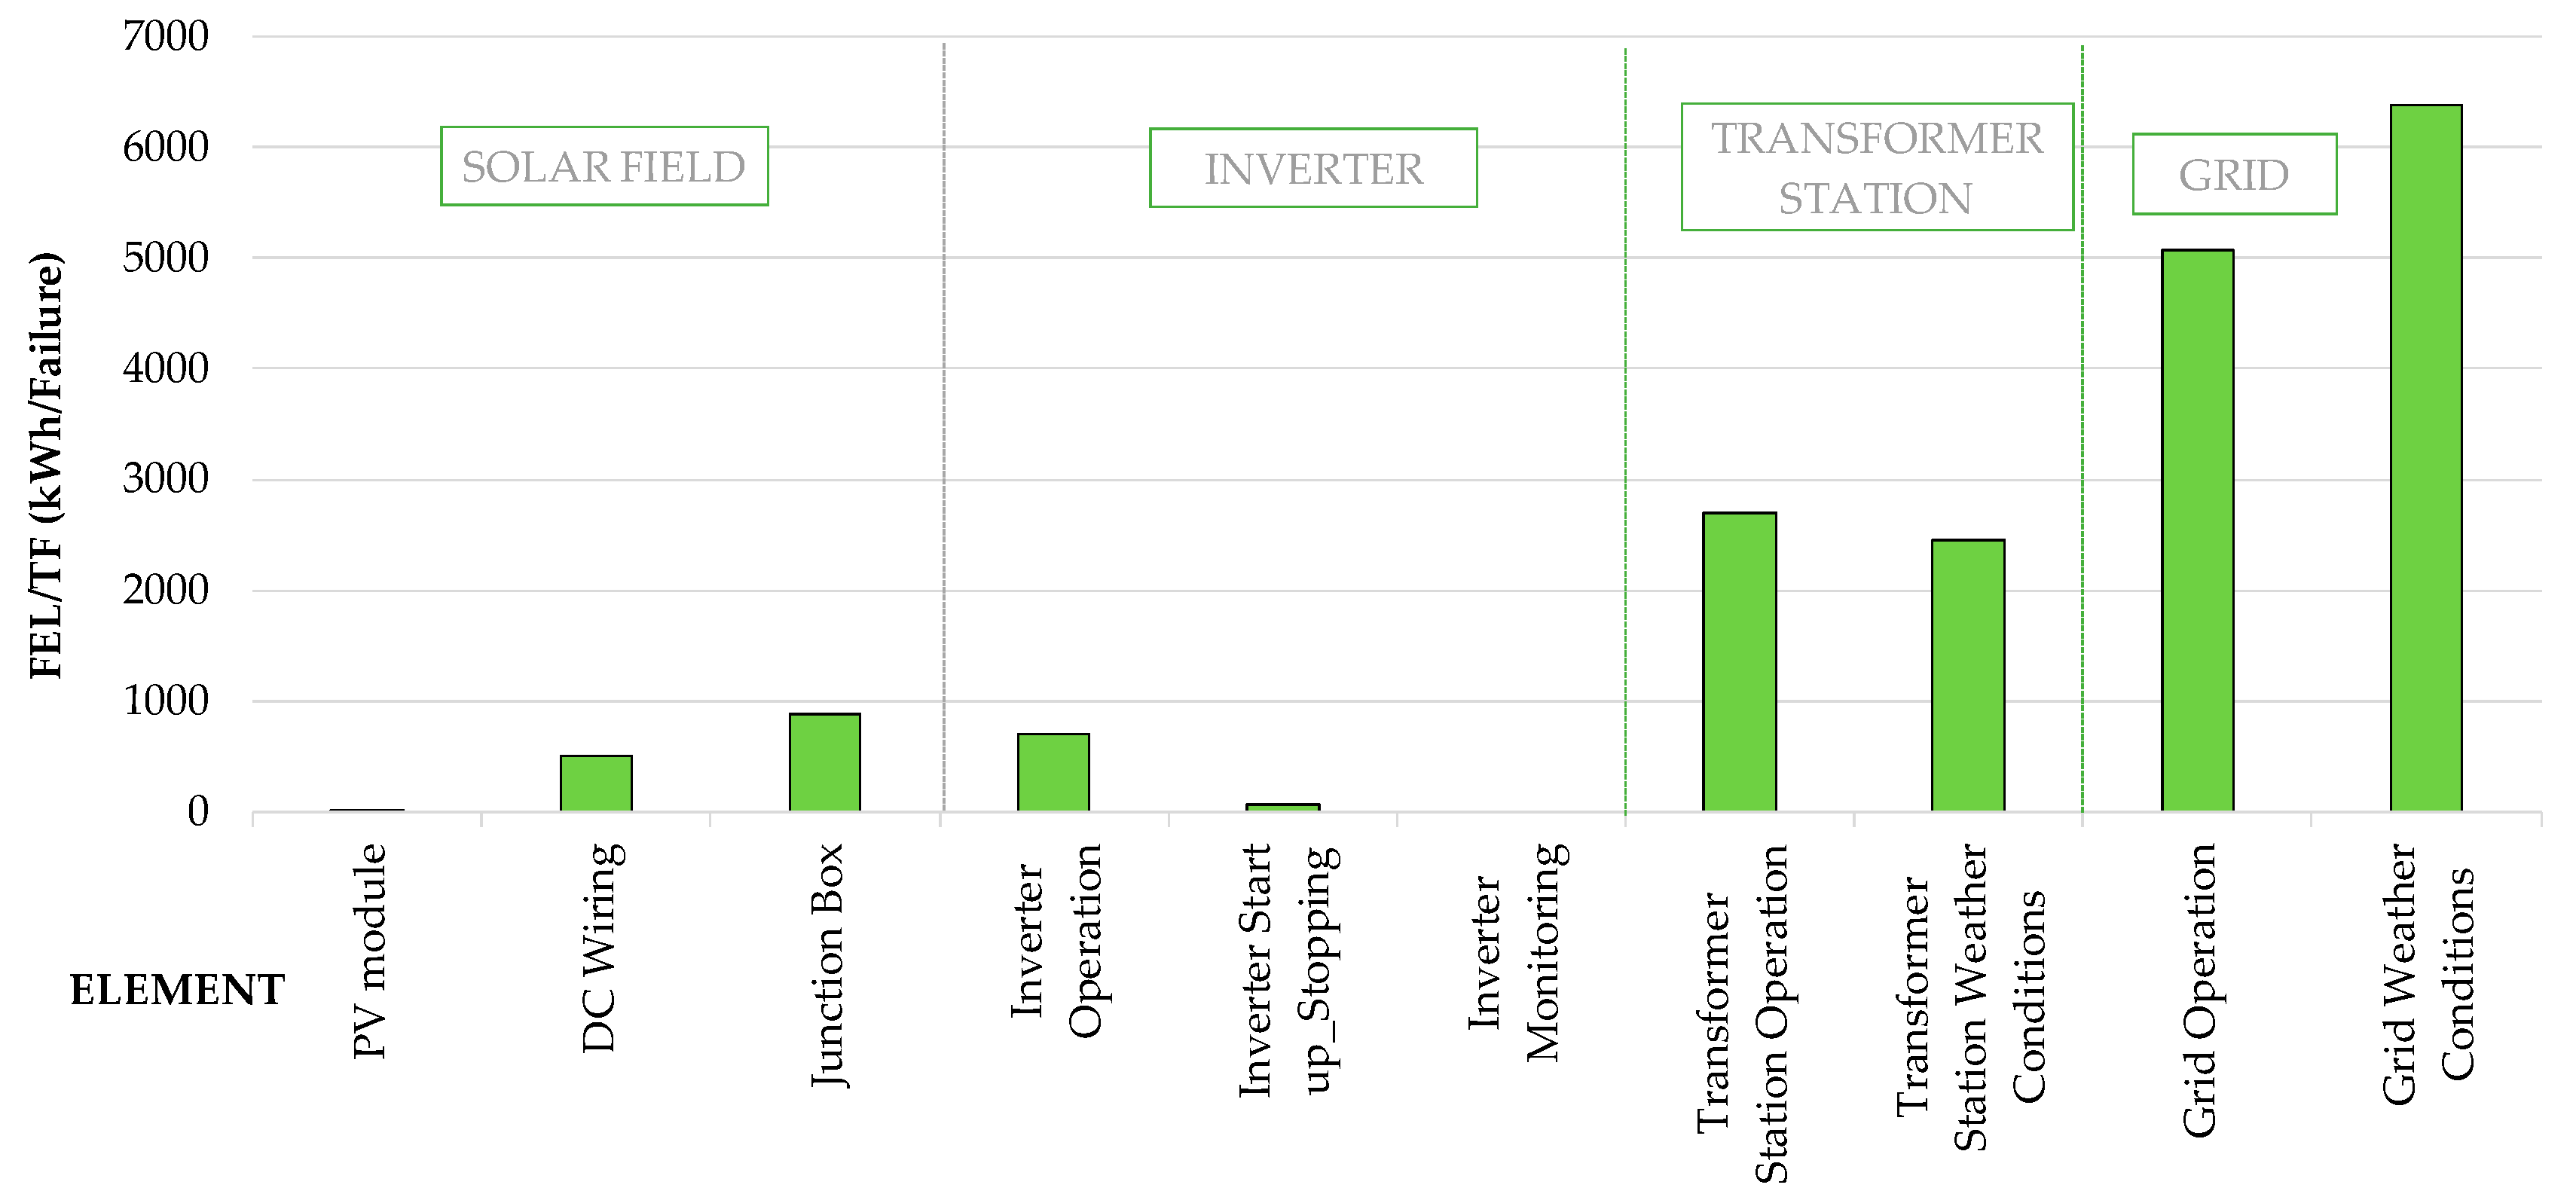
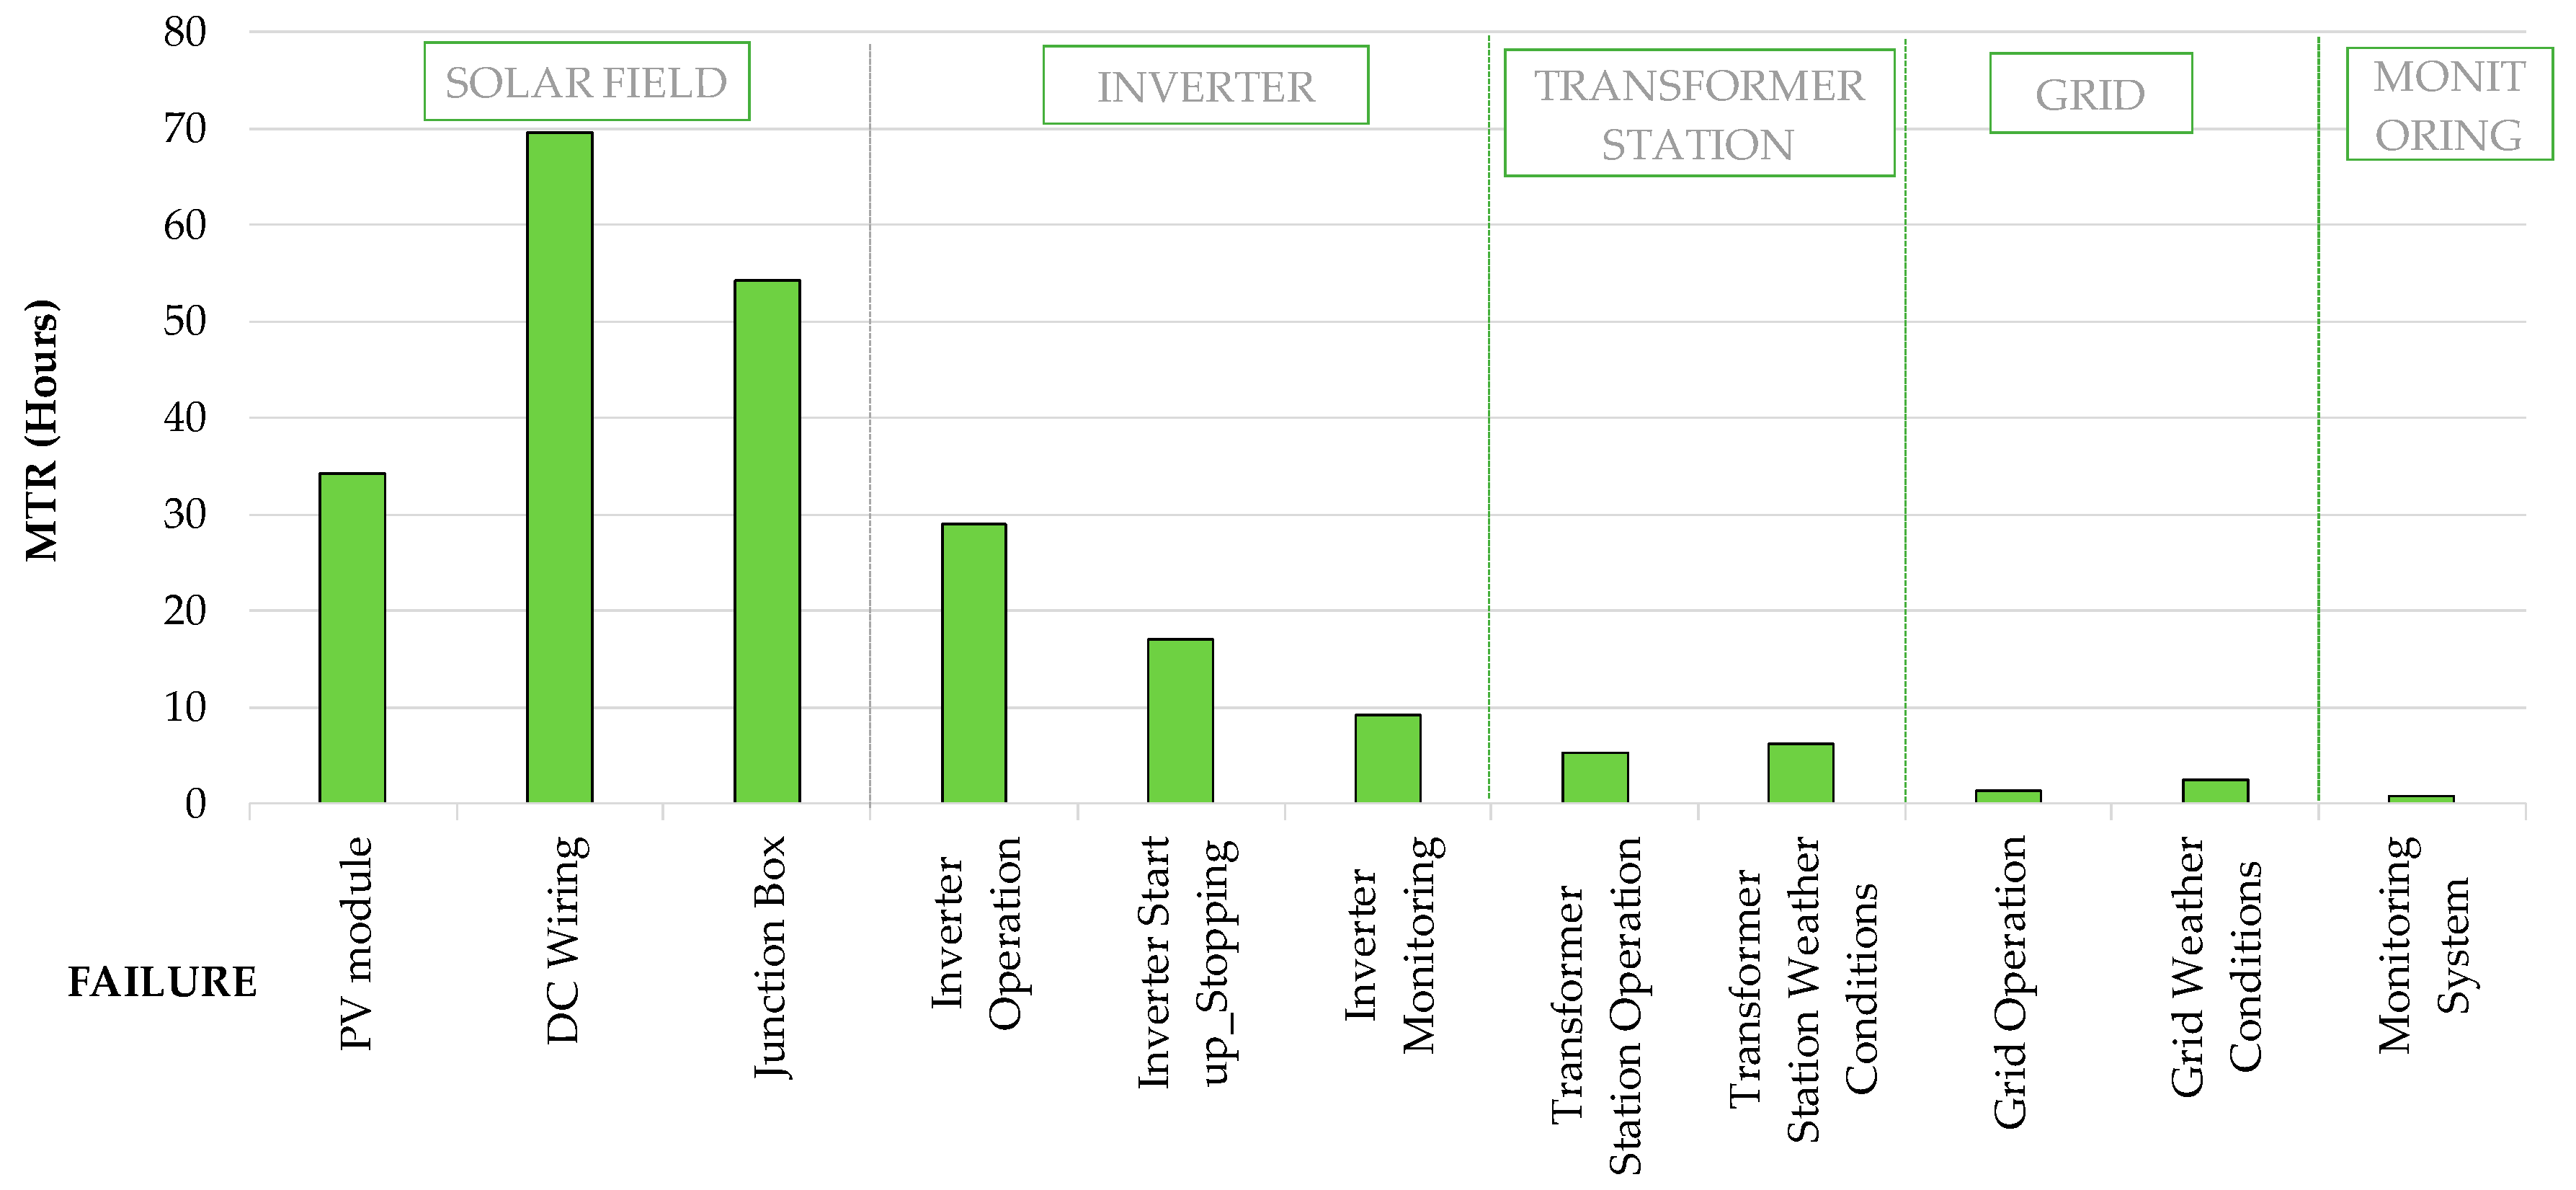
3.2. Failures and Energy Losses
3.2.1. Failures and Energy Losses under Criterion 1
3.2.2. Failure and Energy Losses under Criterion 2
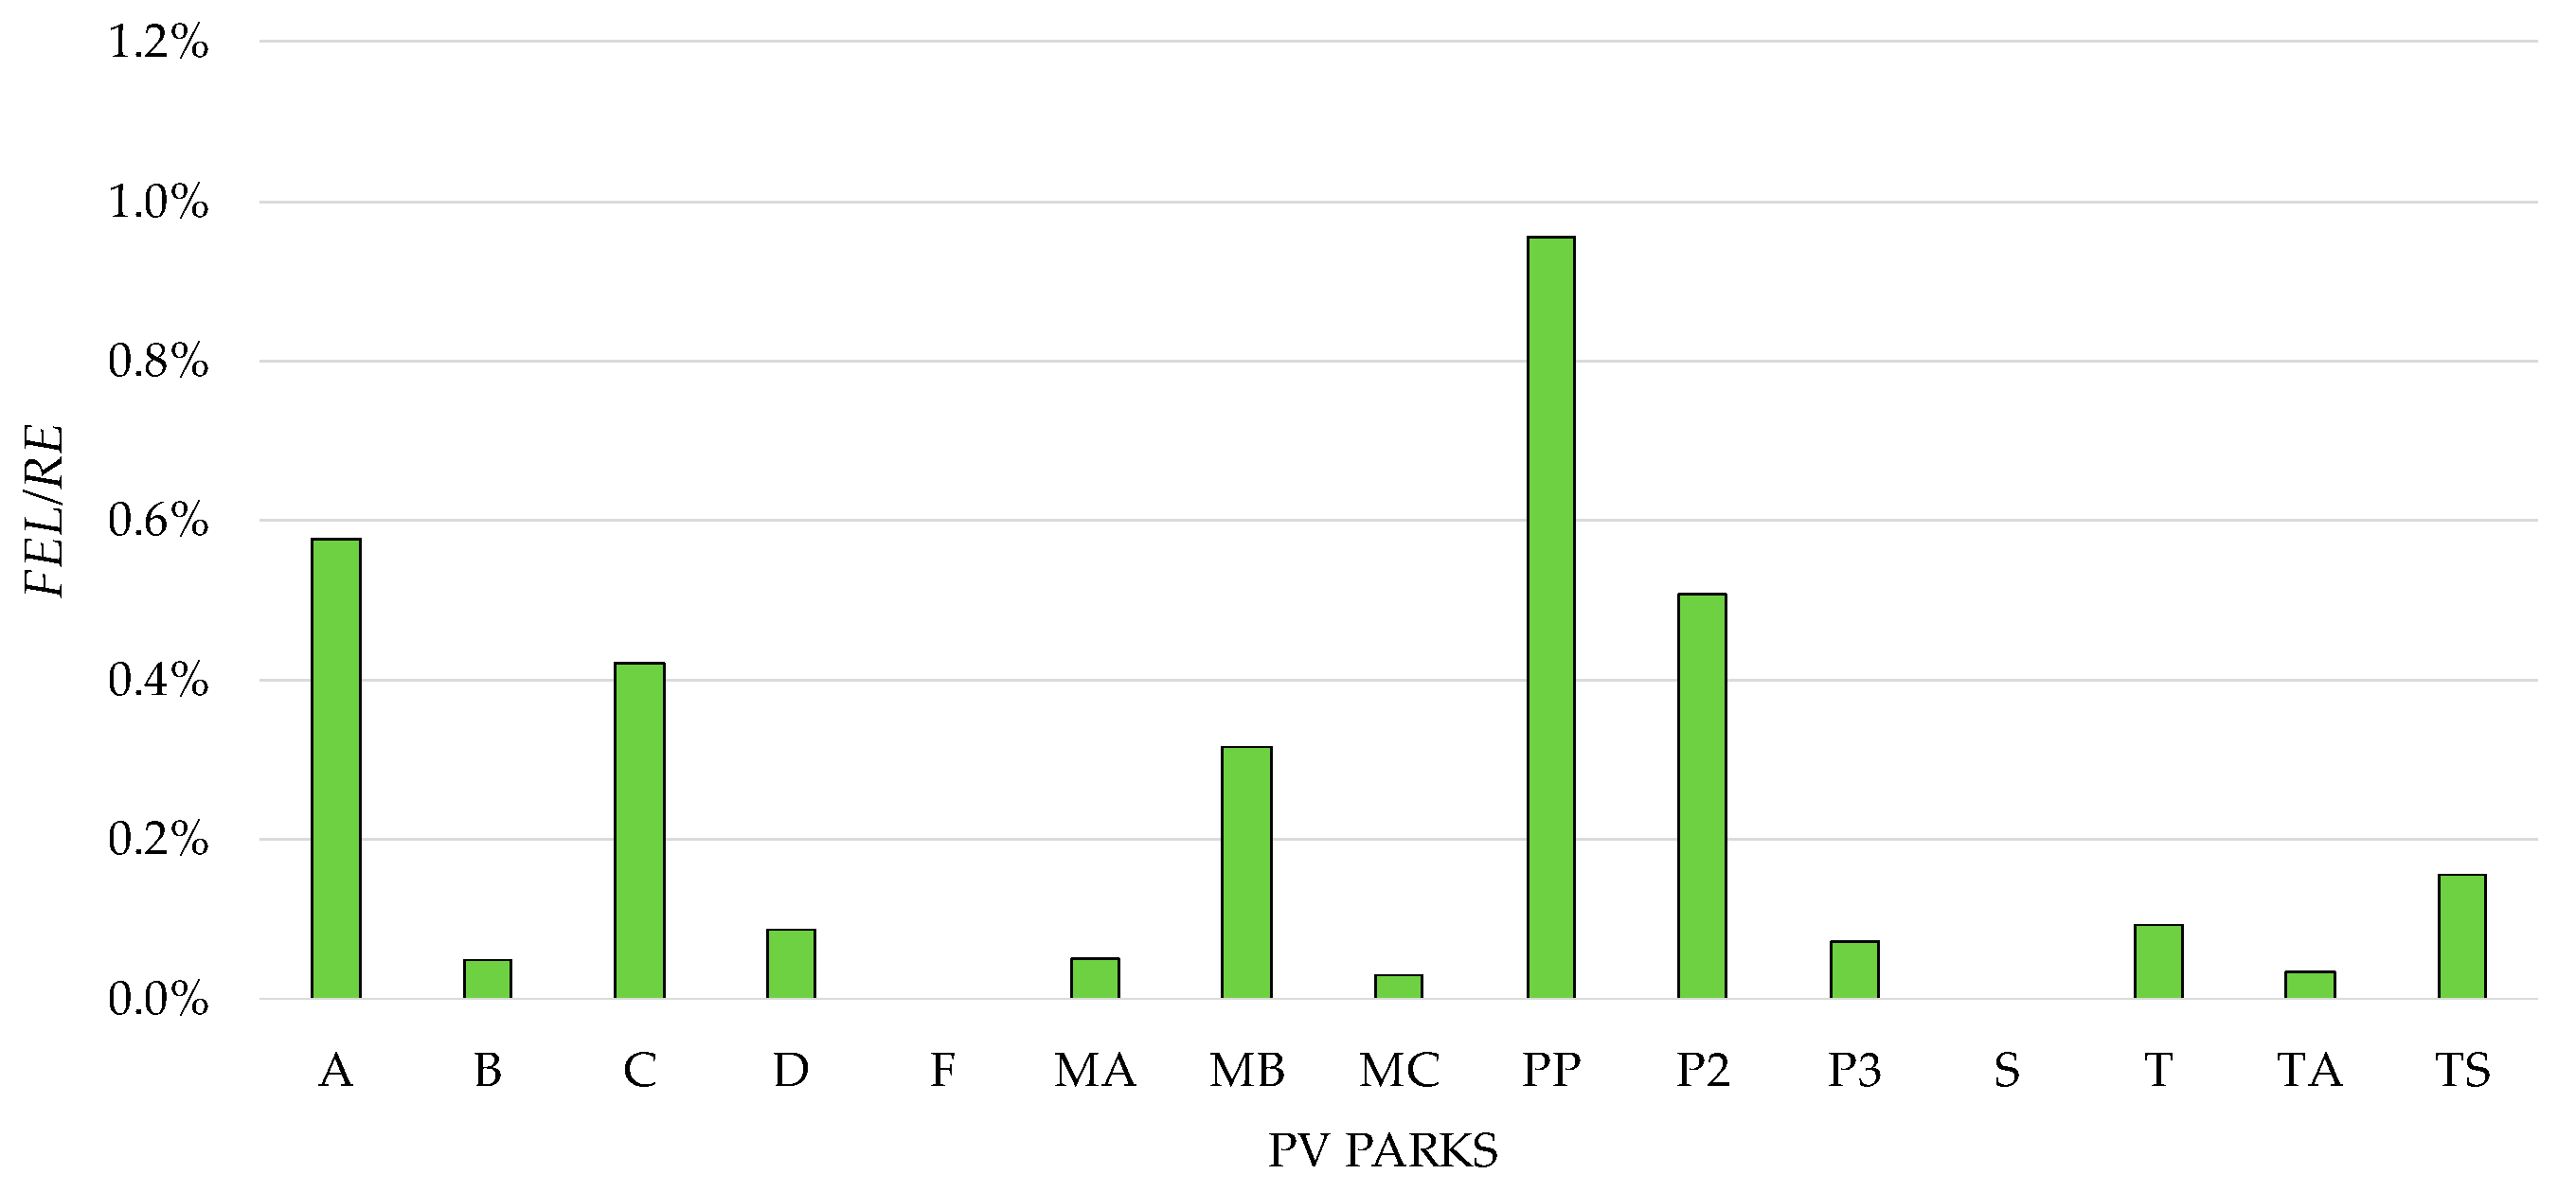
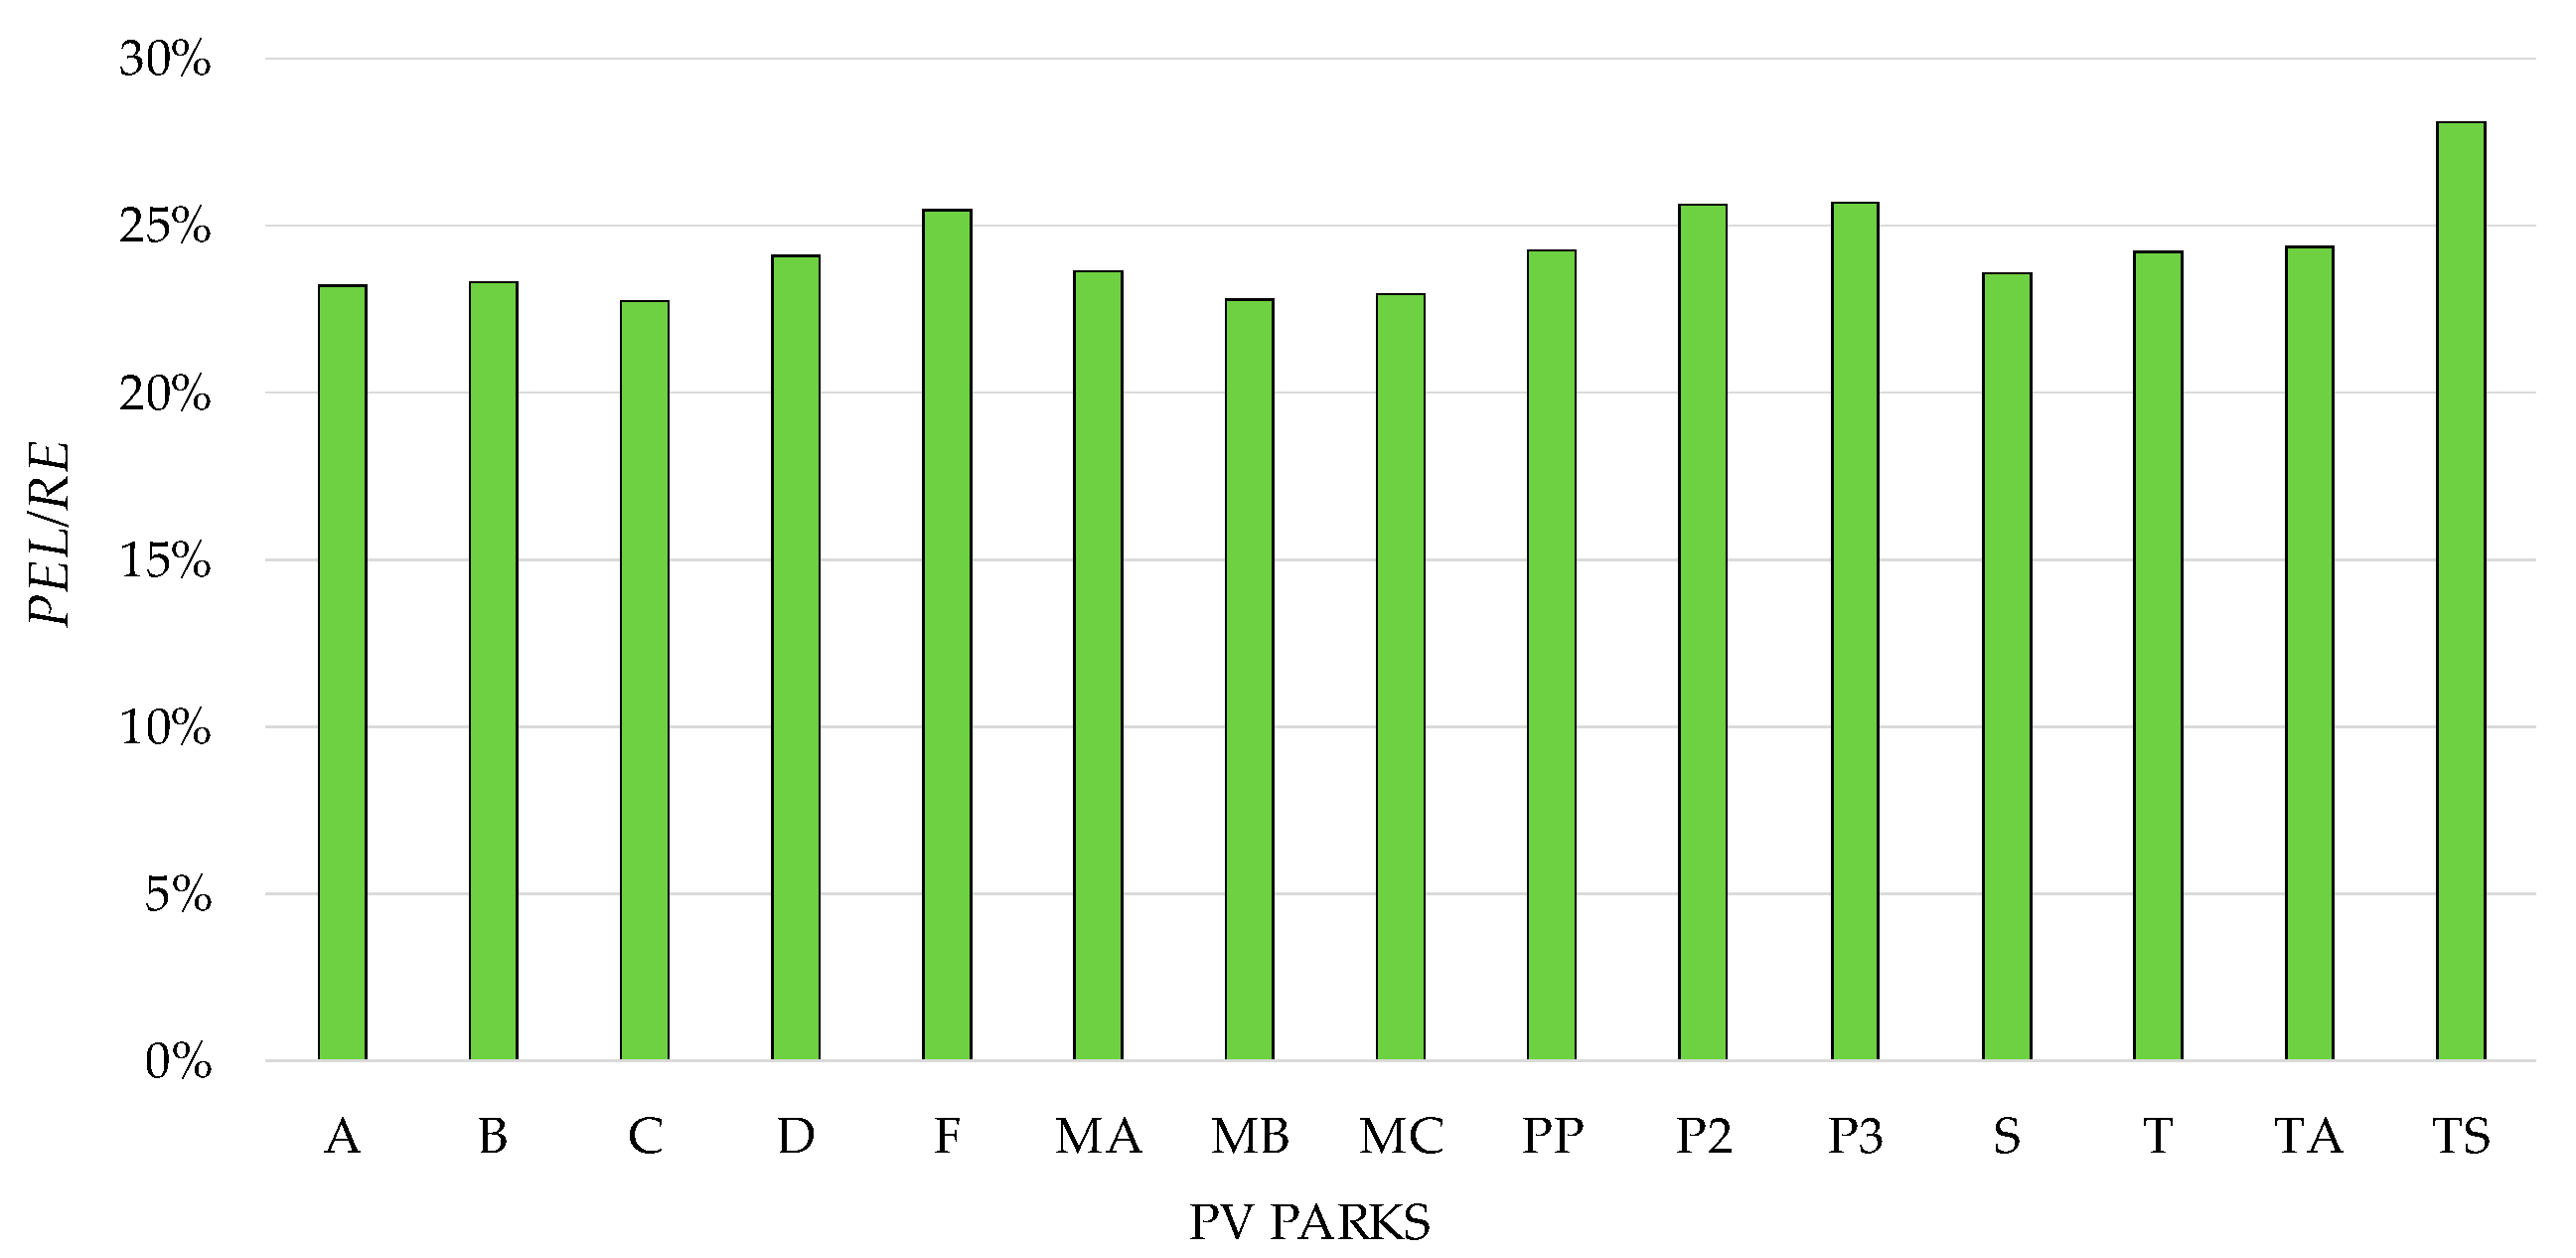
3.3. Relative Impact of Failure and Inefficiencies on Energy Balance
4. Conclusions
Author Contributions
Conflicts of Interest
Abbrevations
| CdTe | Cadmium Telluride |
| FRG | Annual failure rate in the electrical grid of the PV plant |
| FRI | Annual failure rate in the inverter of the PV plant per inverter |
| FRM | Annual failure rate in the monitoring system of the PV plant |
| FRSF | Annual failure rate in the solar field of the PV plant per module |
| FRST | Annual failure rate in the transformer stations of the PV plant |
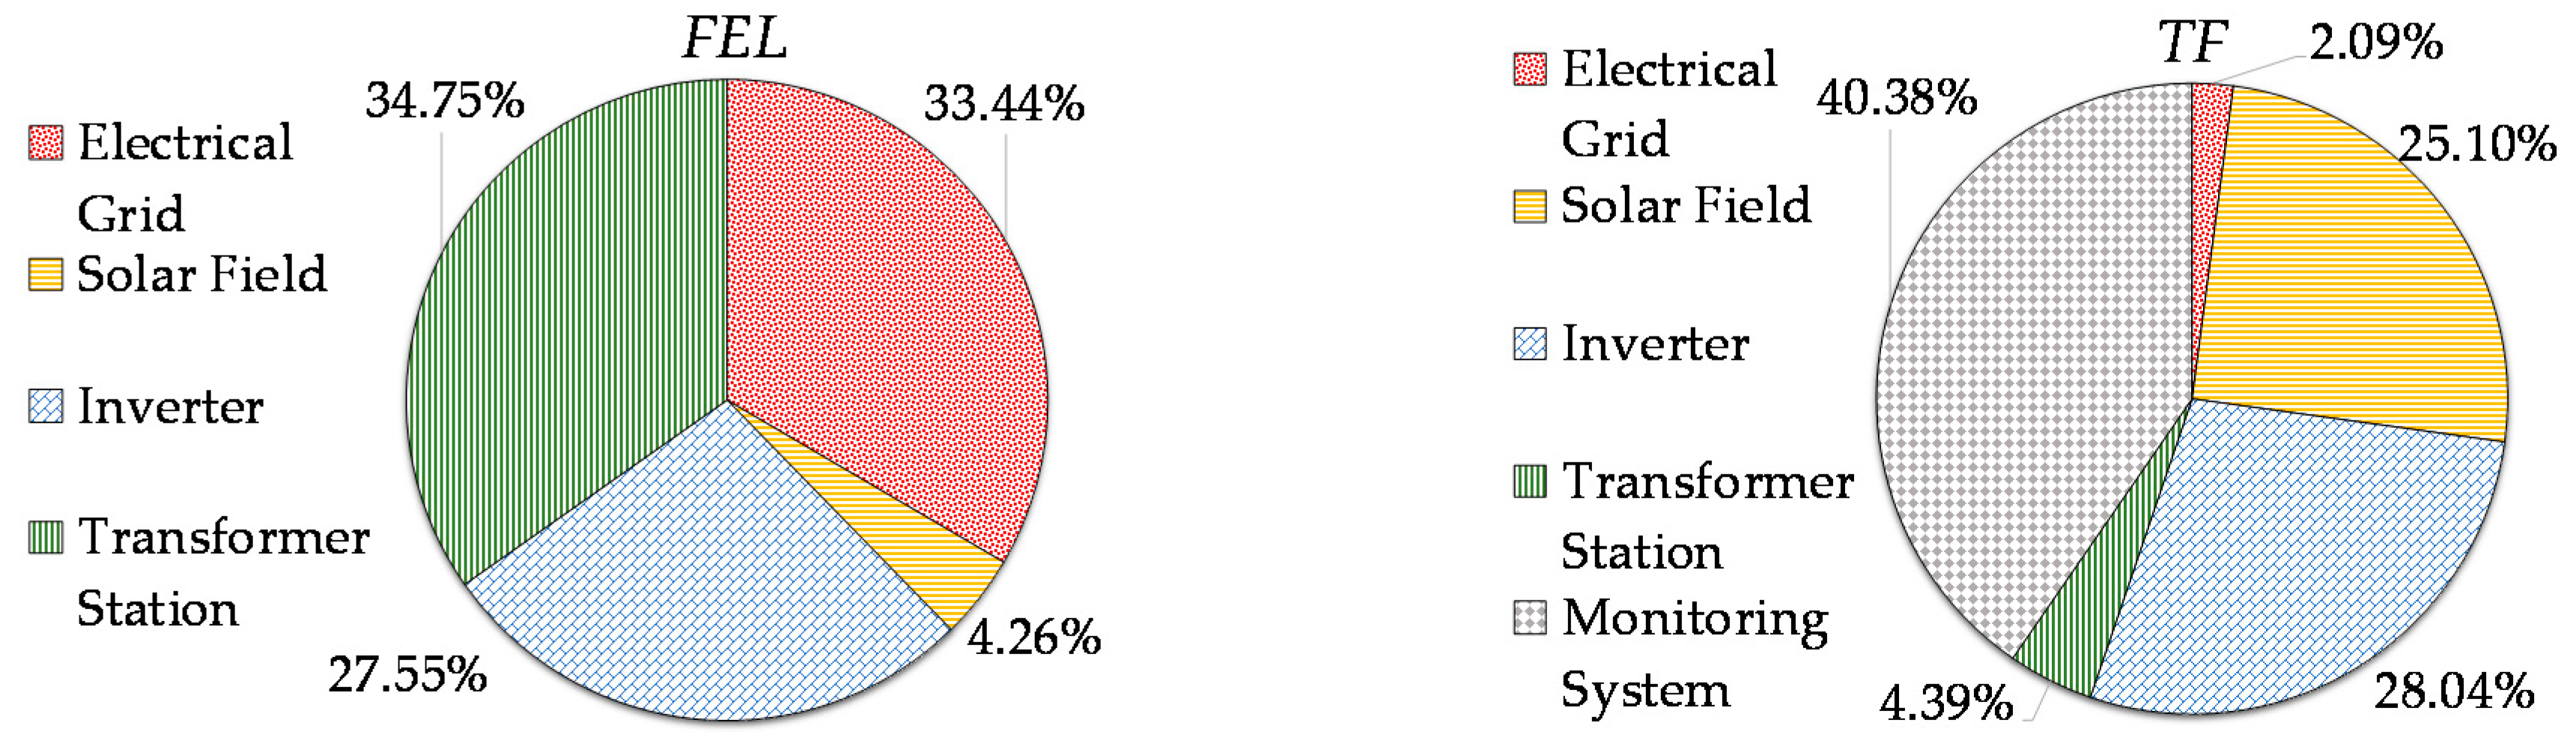
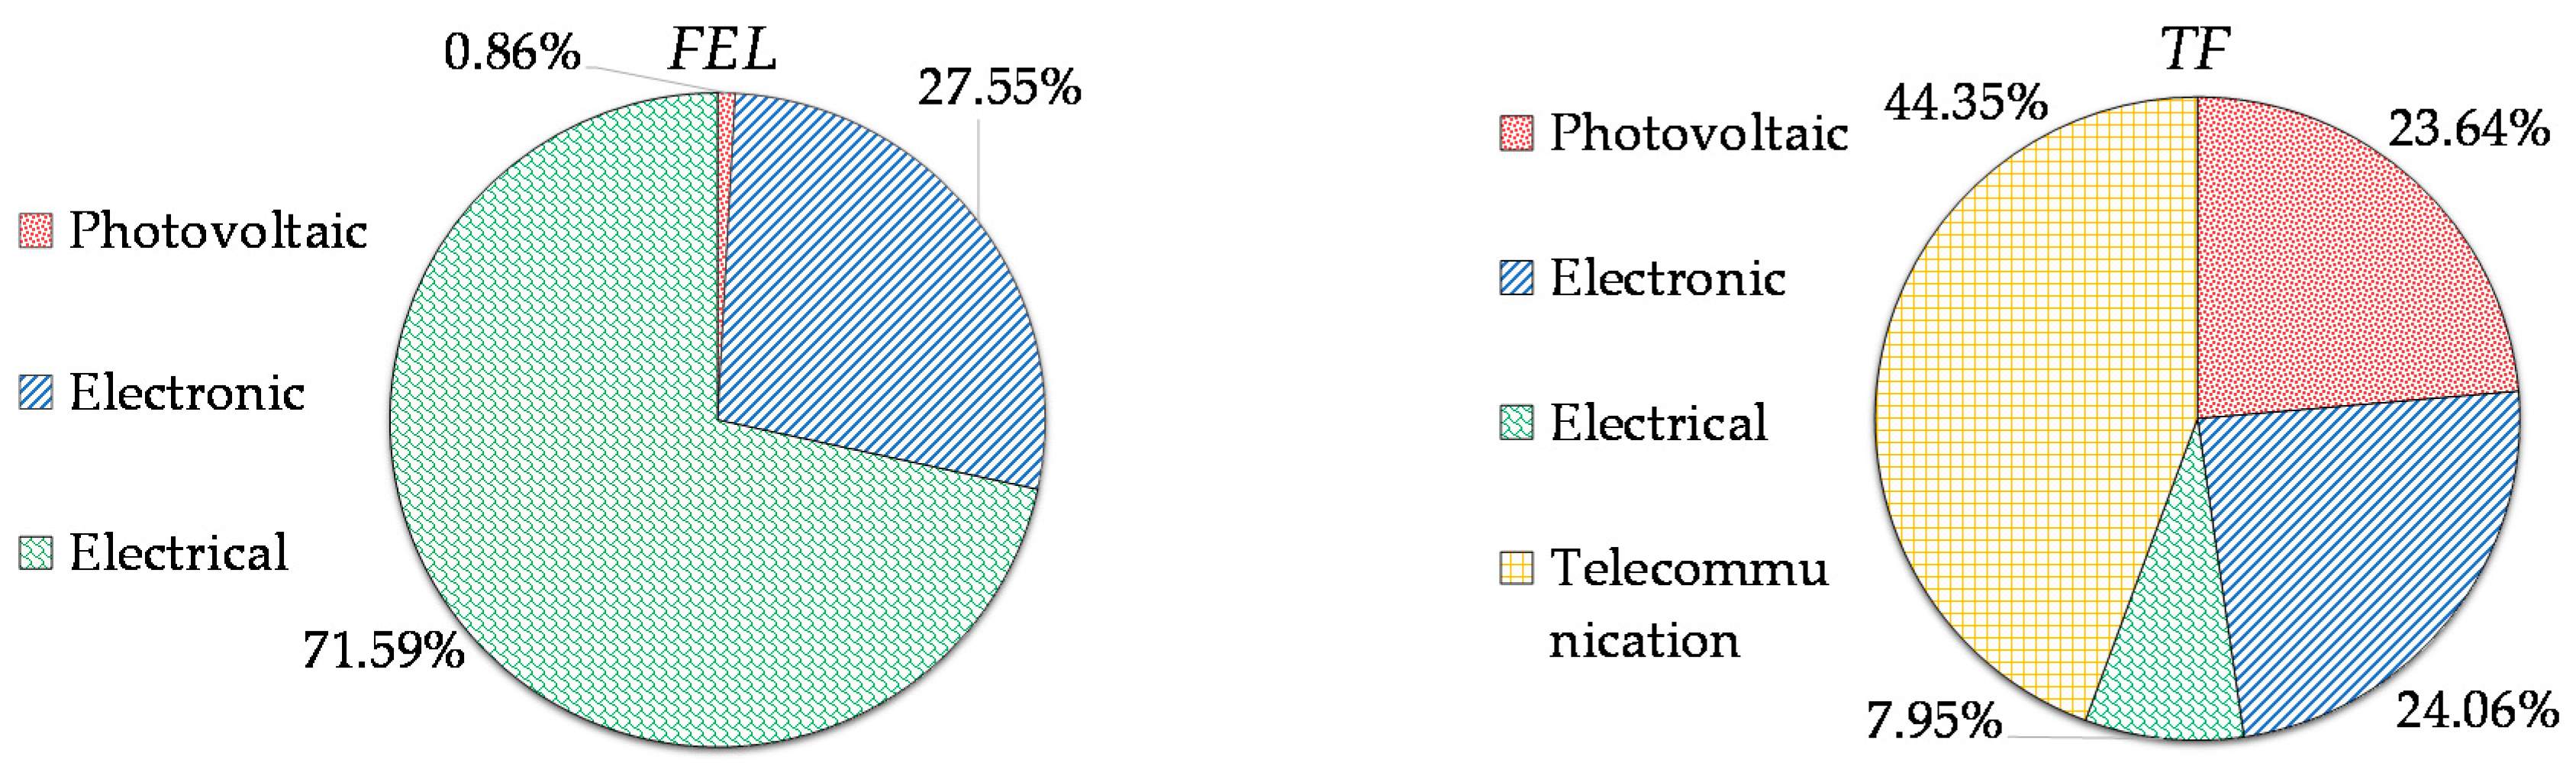
| FEL | Energy losses due to failures |
| FELJB | Total energy losses of all junction boxes of the PV plant |
| FELI | Total energy losses due to failures in the inverters of the PV plant |
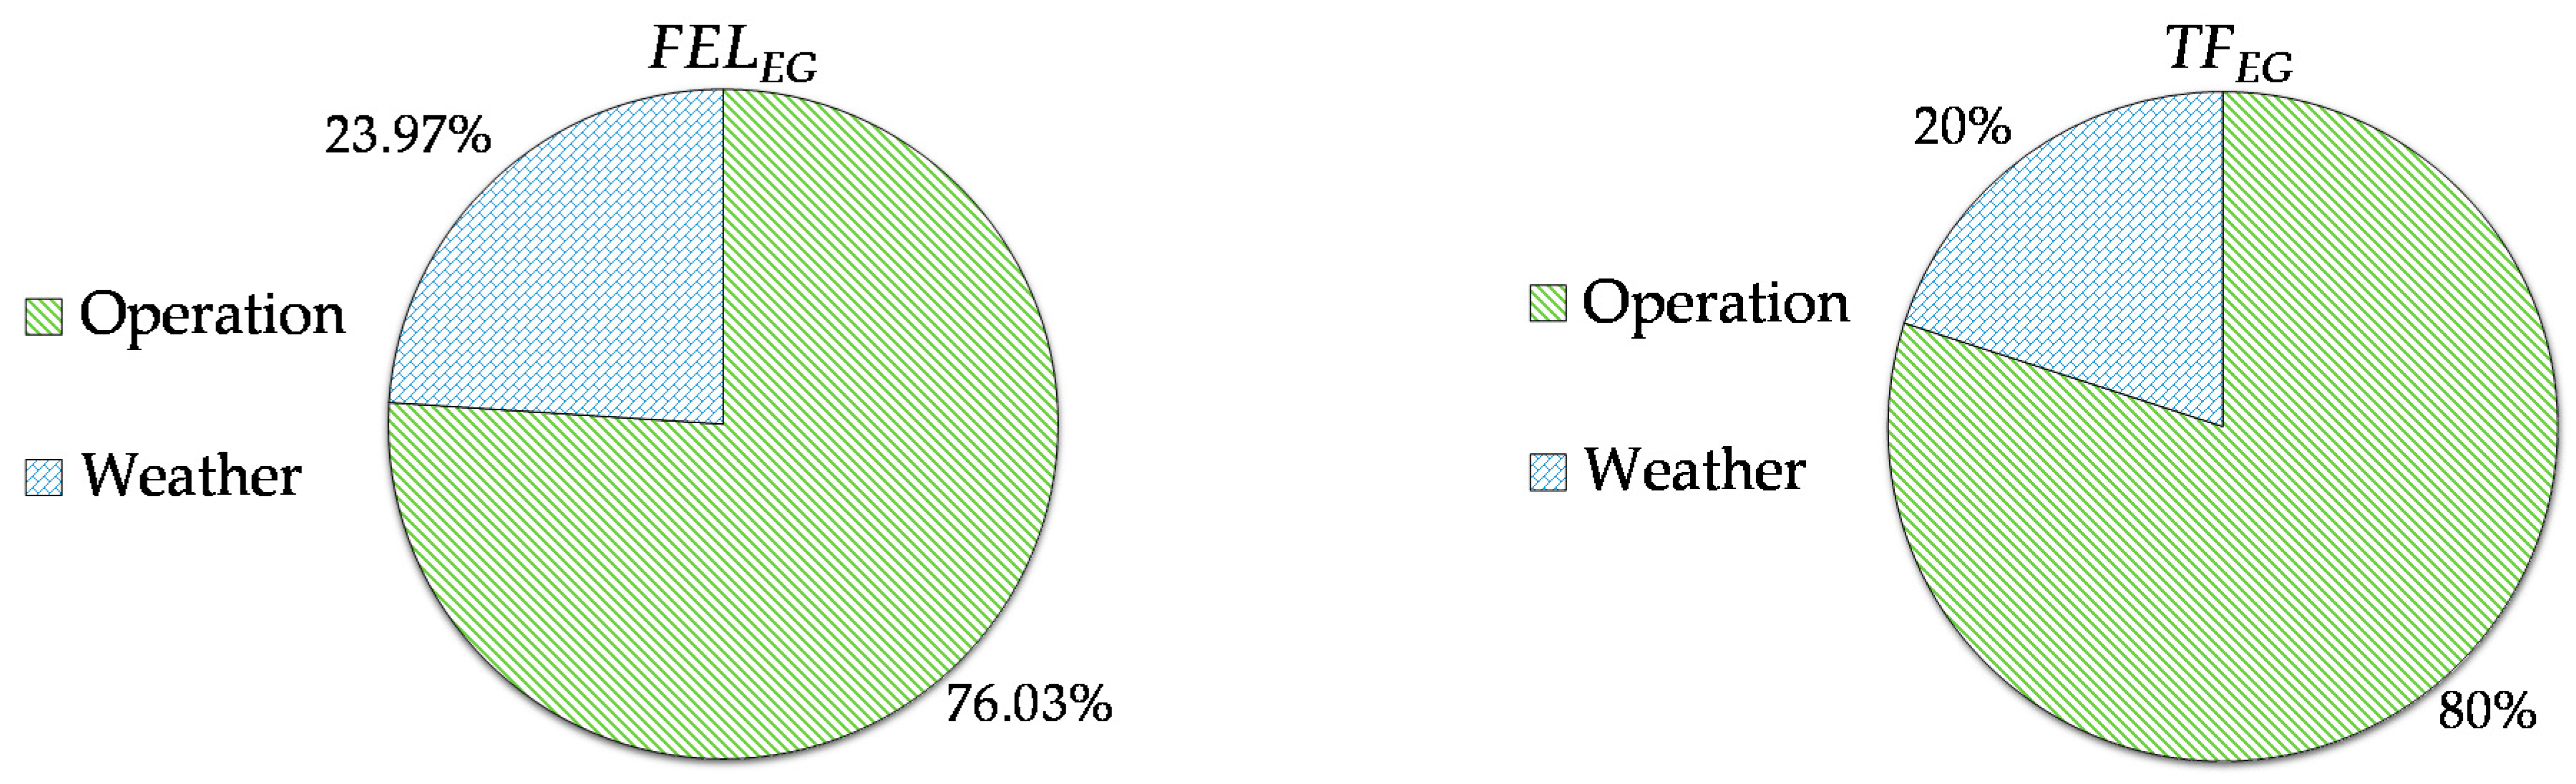
| FELG | Total energy losses due to failures in the electrical grid of the PV plant |
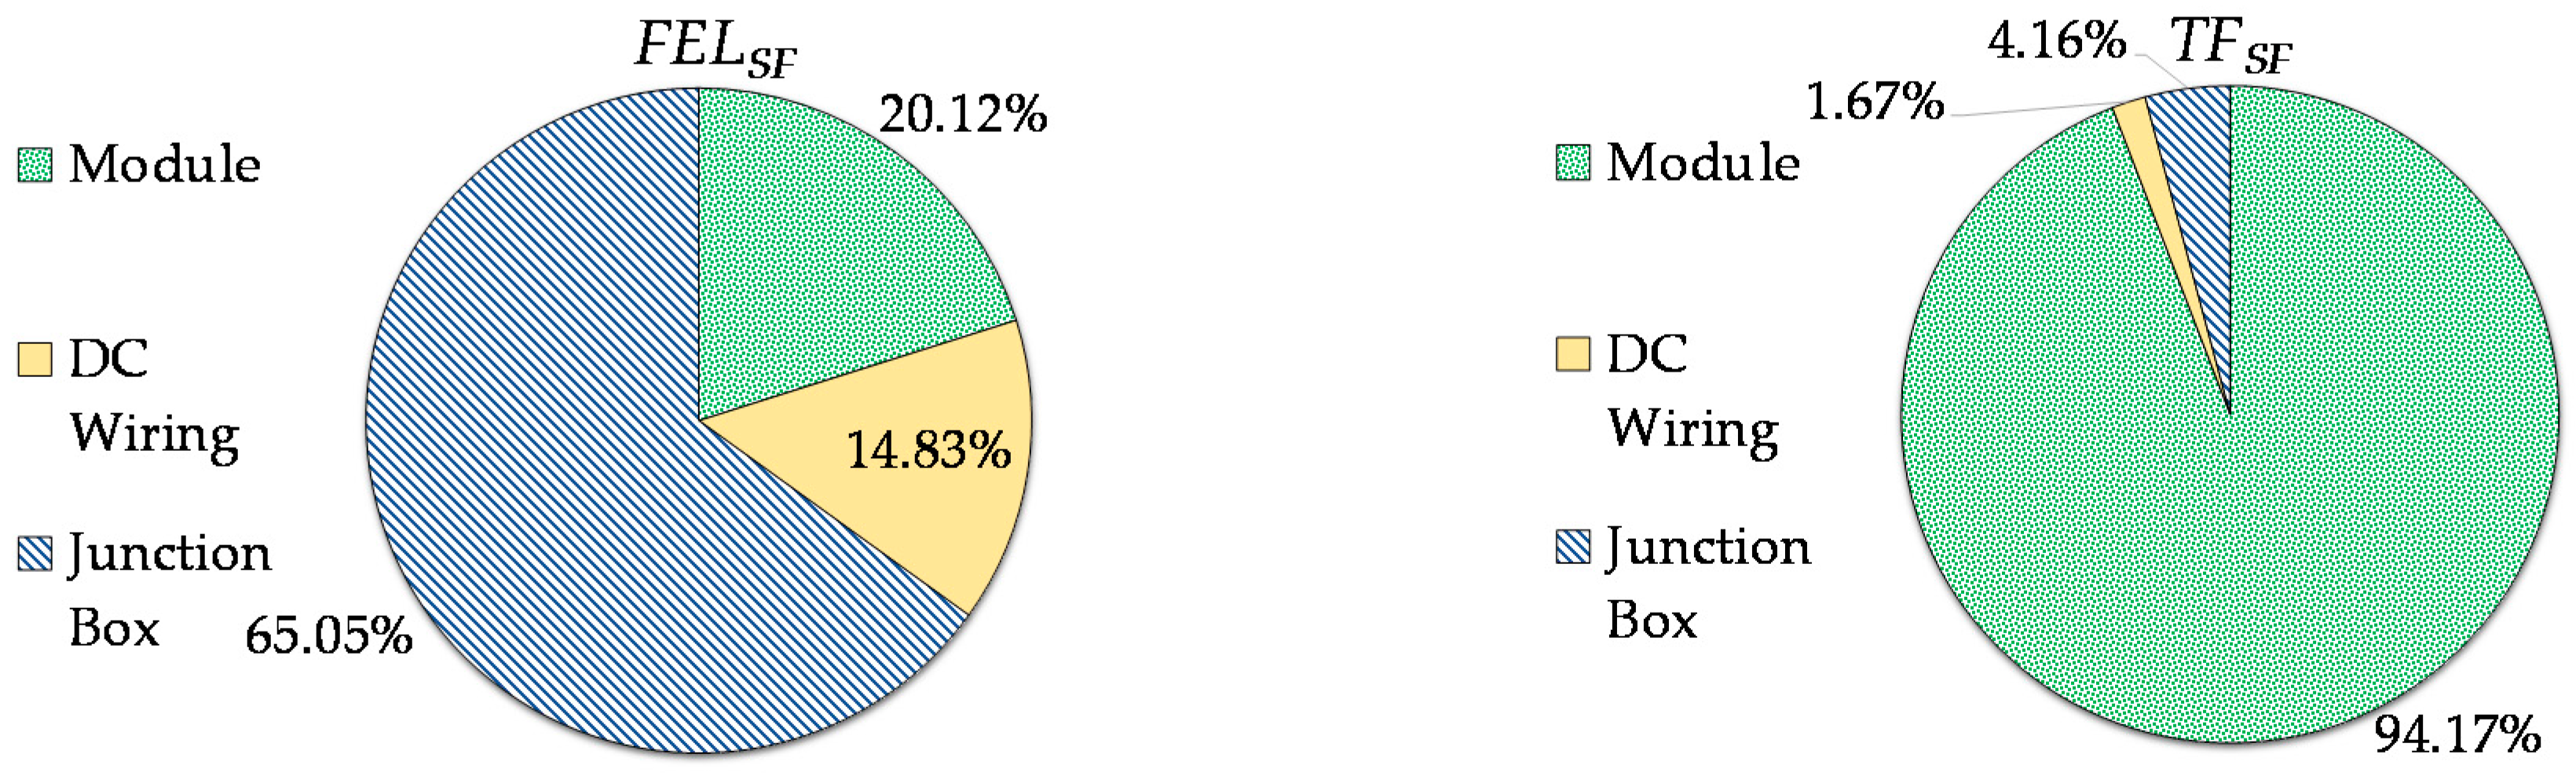
| FELSF | Total energy losses due to failures in the solar fields of the PV plant |
| FELST | Total energy losses due to failures in the transformer stations of the PV plant |
| Global tilted irradiance in the hour t on the module plane | |
| ME | Maximum electrical output of a photovoltaic array |
| O&M | operation and maintenance |
| OPEX | operation and maintenance costs |
| PEL | Energy losses due to inefficiencies |
| PI (F) | Probability of an inverter has a number of failures |
| Pn | Peak power of the PV plant in Standard Test Conditions |
| Hourly correct performance ratio | |
| RE | Electrical energy yield at the feed-in meter |
| Si MC | Mono-crystalline silicon |
| Si PC | Poly-crystalline silicon |
| x-Si | Crystalline silicon |
| td | Hour in which the failure has been detected |
| tr | Hour in which the failure has been repaired |
| TF | Total failures in the PV plant for 15 months |
| TFG | Total failures in the electrical grid for 15 months |
| TFI | Total failures in the inverters for 15 months |
| TFMS | Total failures in the monitoring system for 15 months |
| TFSF | Total failures in the solar field for 15 months |
| TFST | Total failures in the transformer station for 15 months |
| TFR | Annual total failures rate of the PV plant |
| ΔTcell_t (K) | The difference between the average hourly temperature of the PV reference module of the PV plant at hour t and 29,815 K |
Appendix A
References
- International Renewable Energy Agency. The Power to Change: Solar and Wind Cost Reduction Potential to 2025; International Renewable Energy Agency (IRENA): Abu Dhabi, United Arab Emirates, 2016; ISBN 978-92-95111-97-4. [Google Scholar]
- David, M.; Jahn, U.; Tjengdrawira, C.; Theologitis, I.T. “Technical risks in PV projects—Report on technical risks in PV project development and PV plant operation” Solar Bankability. Available online: http://www.solarbankability.org/fileadmin/sites/www/files/documents/D1.1_2.1_Technical_risks_in_PV_projects.pdf (accessed on 2 January 2018).
- Kim, N.; Hwang, K.; Kim, D.; Lee, J.H.; Jeong, D.H. Analysis and reproduction of snail trails on silver grid lines in crystalline silicon photovoltaic modules. Sol. Energy 2016, 124, 153–162. [Google Scholar] [CrossRef]
- Köntges, M.; Kurtz, S.; Jahn, U.; Berger, K.A.; Kato, K.; Friesen, T.; Liu, H.; van Iseghem, M. Review of Failures of Photovoltaic Modules 2014; Report IEA-PVPS T13-01:2014; Institute for Solar Energy Research Hamelin: Emmerthal, Germany, 2014; ISBN 978-3-906042-16-9. [Google Scholar]
- Sporleder, K.; Hübener, K.; Petter, K.; Kranert, C.; Luka, T.; Tureka, M. Light induced degradation: Kinetic model and grain boundary impact on sponge-LID. Energy Procedia 2017, 124, 174–179. [Google Scholar] [CrossRef]
- Mavromatakis, F.; Vigmola, F.; Marion, B. Low irradiance losses of photovoltaic modules. Sol. Energy 2017, 157, 496–506. [Google Scholar] [CrossRef]
- Kaden, T.; Lammers, K.; Möller, H.J. Power loss prognosis from thermographic images of PID affected silicon solar modules. Sol. Energy Mater. Sol. Cells 2015, 142, 24–28. [Google Scholar] [CrossRef]
- Pareek, S.; Chaturvedi, N.; Dahiya, R. Optimal interconnections to address partial shading losses in solar photovoltaic arrays. Sol. Energy 2017, 155, 537–551. [Google Scholar] [CrossRef]
- Marion, B.; Schaefer, R.; Caine, H.; Sanchez, G. Measured and modeled photovoltaic system energy losses from snow for Colorado and Wisconsin location. Sol. Energy 2013, 97, 112–121. [Google Scholar] [CrossRef]
- Racharla, S.; Rajan, K. Solar tracking system—A review. Int. J. Sustain. Eng. 2017, 10, 27–81. [Google Scholar]
- Potnuru, S.R.; Pattabiraman, D.; Ganesan, S.I.; Chilakapati, N. Positioning of PV panels for reduction in line losses and mismatch losses in PV array. Renew. Energy 2017, 78, 264–275. [Google Scholar] [CrossRef]
- Lappalainen, K.; Valkealahti, S. Photovoltaic mismatch losses caused by moving clouds. Sol. Energy 2017, 158, 455–461. [Google Scholar] [CrossRef]
- Alam, M.; Khan, F.; Johnson, J.; Flicker, J. A comprehensive review of catastrophic faults in PV arrays: Types, detection, and mitigation techniques. IEEE J. Photovolt. 2015, 5, 1–16. [Google Scholar] [CrossRef]
- Hasselbrink, M.; Anderson, Z.; Defreitas, M.; Mikofski, Y.-C.; Shen, S.; Caldwell, A.; Terao, D.; Kavulak, Z.; Campeau, Z.; DeGraaff, D. Site Data Validation of the PVLife model using 3 Million Module-Years of Live. In Proceedings of the 39th IEEE PVSC Tampa, Tampa, FL, USA, 16–21 June 2013; pp. 7–12. [Google Scholar]
- Jordan, D.C.; Silverman, T.J.; Wohlgemuth, J.H.; Kurtz, S.R.; van Sant, K.T. Photovoltaic Failure and Degradation Modes. Prog. Photovolt. 2017, 25, 318–326. [Google Scholar] [CrossRef]
- Jordan, D.C.; Kurtz, S.R. Photovoltaic Degradation Rates—An Analytical Review. Prog. Photovolt. Res. Appl. 2013, 21, 12–29. [Google Scholar] [CrossRef]
- Wei, L.; Kerkman, R.J.; Lukaszewski, R.A.; Brown, B.P.; Gollhardt, N.; Weiss, B.W. Junction temperature prediction of a multiple-chip IGBT module under DC condition. In Proceedings of the 41st IAS Annual Meeting Conference Record of the IEEE Industry Applications Conference, Tampa, FL, USA, 8–12 October 2006; pp. 754–762. [Google Scholar]
- Saravanan, S.; Babu, N.R. Maximum power point tracking algorithms for photovoltaic system—A review. Renew. Sustain. Energy Rev. 2017, 57, 192–204. [Google Scholar] [CrossRef]
- Harb, S.; Balog, R.S. Reliability of candidate photovoltaic module-integrated inverter topologies. In Proceedings of the Twenty-Seventh Annual IEEE Applied Power Electronics Conference and Exposition. (APEC), Orlando, FL, USA, 5–9 February 2012; pp. 898–903. [Google Scholar]
- Flicker, J.; Kaplar, R.; Marinella, M.; Granata, J. PV inverter performance and reliability: What is the role of the bus capacitor? In Proceedings of the IEEE 38th Photovoltaic Specialists Conference (PVSC), Austin, TX, USA, 3–8 June 2012; Volume 2, pp. 1–3. [Google Scholar]
- Chan, F.; Calleja, H.; Martinez, E. Grid connected PV systems: A reliability based comparison. In Proceedings of the IEEE International Symposium on Industrial Electronics, Montreal, QC, Canada, 9–13 July 2006; pp. 1–6. [Google Scholar]
- Zhang, P.; Li, W.; Li, S.; Wang, Y.; Xiao, W. Reliability assessment of photovoltaic power systems: Review of current status and future perspectives. Appl. Energy 2013, 104, 822–833. [Google Scholar] [CrossRef]
- Seguin, R.; Woyak, J.; Costyk, D.; Hambrick, J. High-Penetration PV Integration Handbook for Distribution Engineers; Technical Report NREL/TP-5D00-63114; National Renewable Energy Laboratory: Denver W Pkwy, CO, USA, 2016.
- Nikolovski, S.; Papuga, V.; Knežević, G.; Fekete, K. Relay protection coordination for photovoltaic power plant connected on distribution network. Case study. Int. J. Electr. Comput. Eng. Syst. 2014, 5, 15–20. [Google Scholar]
- Dhople, S.V.; Davoudi, A.; Chapman, P.L.; Domínguez-García, A.D. Integrating photovoltaic inverter reliability into energy yield estimation with markov models. In Proceedings of the 12th Workshop on Control and Modeling for Power Electronics (COMPEL), Boulder, CO, USA, 28–30 June 2010; pp. 1–5. [Google Scholar]
- Sarr, O.N.; Barro, F.I.; Niasse, O.A.; Dia, F.; Mbengue, N.; Ba, B.; Sene, C. Analysis of Failure Modes Effect and Criticality Analysis (FMECA): A stand-alone photovoltaic system. Sci. J. Energy Eng. 2017, 5, 40–47. [Google Scholar] [CrossRef]
- Wang, H.; Zhu, N.; Bai, X. Reliability model assessment of grid-connected solar photovoltaic system based on Monte-Carlo. Appl. Sol. Energy 2015, 51, 262–266. [Google Scholar] [CrossRef]
- Gupta, N.; Garg, R. Parmod Kumar Sensitivity and reliability models of a PV system connected to grid. Renew. Sustain. Energy Rev. 2017, 69, 188–196. [Google Scholar] [CrossRef]
- Mustafa, A.M.; Omran, W.A.; Hegazy, Y.G.; Abu-Elnaga, M.M. Reliability assessment of grid connected photovoltaic generation systems. In Proceedings of the International Conference on Renewable Energy Research and Applications (ICRERA), Palermo, Italy, 22–25 November 2015; pp. 22–25. [Google Scholar]
- Van Sark, W.; Reich, N.H.; Müller, B.; Reise, C. Review of PV performance ratio development. In Proceedings of the 28th World Renewable Energy Forum, WREF 2012, Including World Renewable Energy Congress XII and Colorado Renewable Energy Society (CRES) Annual Conference, Denver, CO, USA, 13–17 May 2012. [Google Scholar]
- Zhang, L.; Zhou, Y.; Flynn, D.; Mutale, J.; Mancarella, P. System-level operational and adequacy impact assessment of photovoltaic and distributed energy storage, with consideration of inertial constraints, dynamic reserve and interconnection flexibility. Energies 2017, 10, 989. [Google Scholar] [CrossRef]
- Grunow, P.; Lust, S.; Sauter, D.; Hoffmann, V.; Beneking, C.; Litzenburger, B.; Podlowski, L. Weak light performance and annual yields of PV modules and systems as a result of the basic parameter set of industrial solar cells. In Proceedings of the 19th European Photovoltaic Solar Energy Conference, Paris, France, 7–11 June 2004. [Google Scholar]
- Mishra, N.; Yadav, A.S.; Pachauri, R.; Chauhan, Y.K.; Yadav, V.K. Performance enhancement of PV system using proposed array topologies under various shadow patterns. Sol. Energy 2017, 157, 641–656. [Google Scholar] [CrossRef]
- Pierro, M.; Bucci, F.; Cornaro, C. Impact of light soaking and thermal annealing on amorphous silicon thin film performance. Prog. Photovolt. Res. Appl. 2015, 23, 1581–1596. [Google Scholar] [CrossRef]
- Cornaro, C.; Pierro, M.; Moser, D.; Garrido, G.N.; Alonso-Abella, M.; Gueymard, C.A. Outdoor Characterization of CdTe Technology and Seasonal Performance Analysis at Different Latitudes in Europe. In Proceedings of the 33rd European Photovoltaic Solar Energy Conference and Exhibition, Amsterdam, The Netherlands, 25–29 September 2017. [Google Scholar]
- Pierro, M.; Bucci, F.; Cornaro, C. Full characterization of photovoltaic modules in real operating conditions: Theoretical model, measurement method and results. Prog. Photovolt. Res. Appl. 2014, 23, 443–461. [Google Scholar] [CrossRef]
- Zhang, Z.; Wang, L.; Kurtz, S.; Wu, J.; Zhu, Z.W. Operating temperatures of open-rack installed photovoltaic inverters. Sol. Energy 2016, 137, 344–351. [Google Scholar] [CrossRef]
- Tobón, A.; Peláez-Restrepo, J.; Villegas-Ceballos, J.P.; Serna-Garcés, S.I.; Herrera, J.; Ibeas, A. Maximum power point tracking of photovoltaic panels by using improved pattern search methods. Energies 2017, 10, 1316. [Google Scholar] [CrossRef]
- Zini, G.; Mangeant, C.; Merten, J. Reliability of large-scale grid-connected photovoltaic systems. Renew. Energy 2011, 36, 2334–2340. [Google Scholar] [CrossRef]
- Golnas, A. PV System Reliability: An Operator’s Perspective. In Proceedings of the IEEE 38th Photovoltaic Specialists Conference (PVSC) Part 2, Austin, TX, USA, 3–8 June 2012; pp. 2156–3381. [Google Scholar]
- Jahn, U.; Herz, M. Managing Technical Risks in PV Investments: How to Quantify the Impact of Risk Mitigation Measures for Different PV Project Phases? Available online: https://doi.org/10.1002/pip.2970 (accessed on 2 January 2018).
- Wittmer, B.; Mermoud, A.; Schott, T. Analysis of PV grid installations performance, comparing measured data to simulation results to identify problems in operation and monitoring. In Proceedings of the 30th European Photovoltaic Solar Energy Conference and Exhibition, Hamburg, Germany, 14–18 September 2015. [Google Scholar]
- System Advisor Model Version 2016.3.14 (SAM 2016.3.14). National Renewable Energy Laboratory: Golden, CO, USA. Available online: https://sam.nrel.gov/content/downloads (accessed on 31 October 2016).
- Kurtz, S.; Riley, E.; Newmiller, J.; Dierauf, T.; Kimber, A.; McKee, J.; Flottemesch, R.; Krishnani, P. Analysis of Photovoltaic System Energy Performance Evaluation Method; Technical Report NREL/TP-5200-60628; NREL: Golden, CO, USA, 2013. Available online: www.nrel.gov/publications (accessed on 2 January 2018).
- International Electrotechnical Commission. International Electrotechnical Vocabulary Chapter 191, Dependability and Quality of Service; International Standard: IEC 60050-191; International Electrotechnical Commission: Geneva, Switzerland, 1990. [Google Scholar]
- Dierauf, T.; Growitz, A.; Kurtz, S.; Cruz, J.L.B.; Riley, E.; Hansen, C. Weather-Corrected Performance Ratio; Technical Report NREL/TP-5200-57991; NREL: Golden, CO, USA, 2013. Available online: http://www.nrel.gov/docs/fy13osti/57991.pdf (accessed on 2 January 2018).


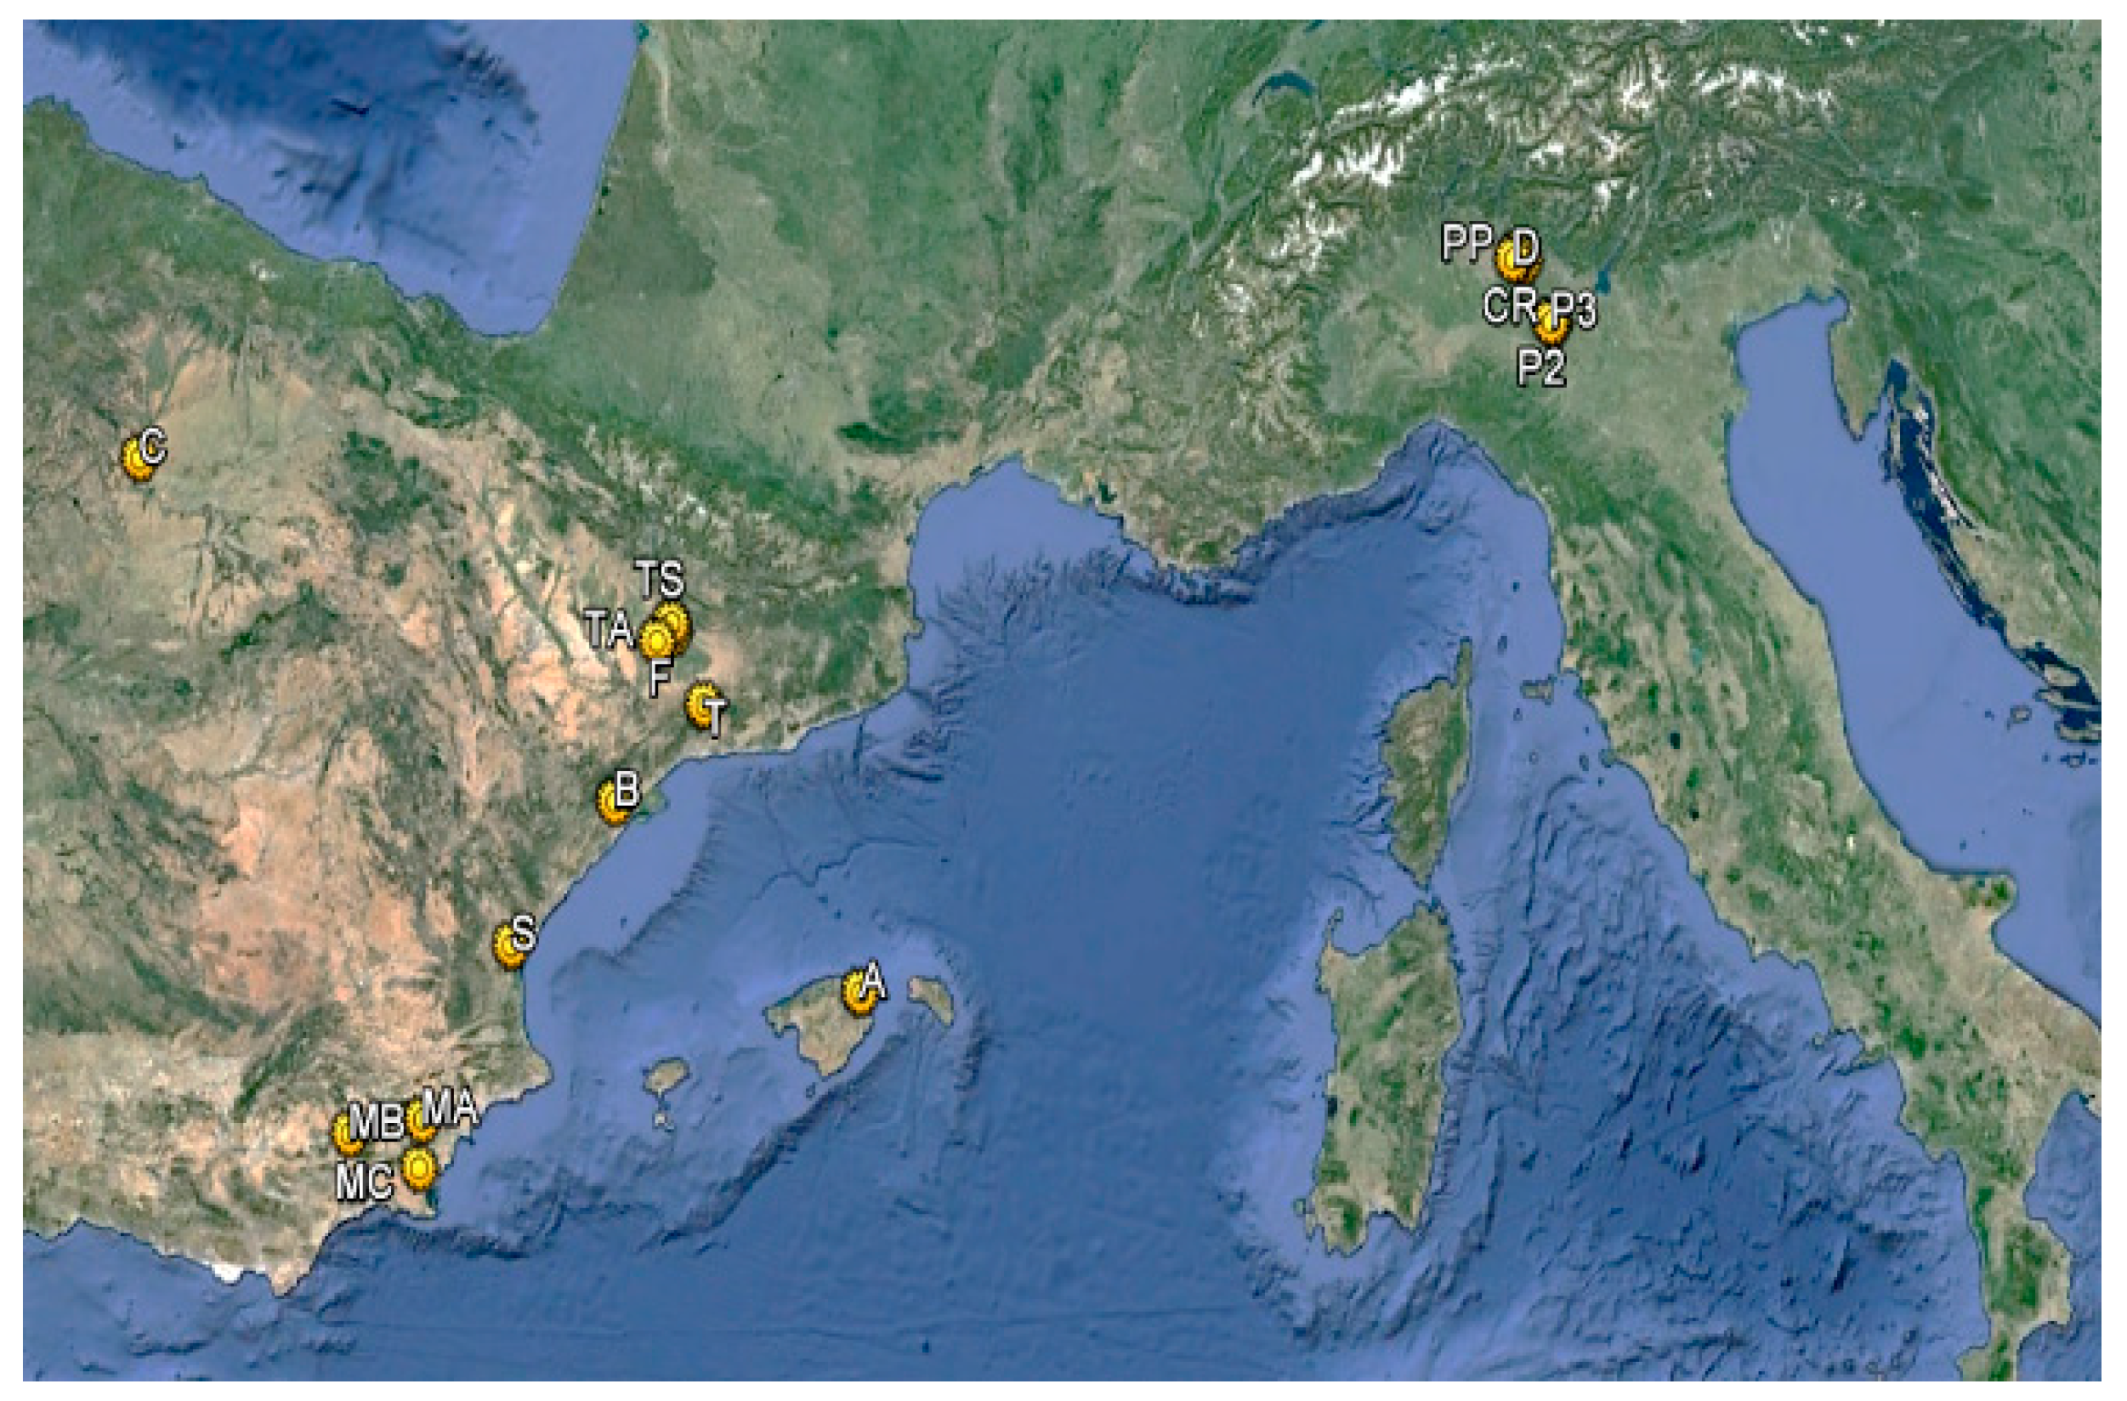
| PV Parks Characteristics | |||||||||||
|---|---|---|---|---|---|---|---|---|---|---|---|
| Location | Type | Solar Field | Inverter | ST | Plant | ||||||
| PV Park | PV Plant | Province | Ground/Roof | N° PV Modules | Material | Peak Power (Wp) | N° Inverters | Nominal Power (kW) | N° STs | Peak Power (kWp) | Nominal Power (kW) |
| A | A-1 | Mallorca | Ground | 44,928 | CdTe | 75/77.5 | 2 | 500 | 3 | 3,425.8 | 3160 |
| 4 | 540 | ||||||||||
| B | B-1 | Castellón | Roof | 3465 | Si MC | 238 | 7 | 100 | 1 | 824.7 | 700 |
| B-2 | Roof | 2590 | Si MC | 305 | 7 | 100 | 1 | 789.9 | 700 | ||
| C | C1 | Zamora | Ground | 57,888 | CdTe | 75 | 4 | 1000 | 4 | 4,341.6 | 4000 |
| D | D-1 | Cremona | Ground | 16,200 | CdTe | 77.5 | 2 | 630 | 1 | 1,255.5 | 1260 |
| F | F-1 | Lérida | Roof | 3754 | Si PC | 235 | 8 | 100 | 1 | 880.1 | 800 |
| MA | MA-1 | Murcia | Ground | 25,812 | CdTe | 80 | 4 | 500 | 3 | 2,065.0 | 2000 |
| MB | MB-1 | Murcia | Ground | 9540 | Si PC | 235 | 4 | 500 | 4 | 2,241.9 | 2000 |
| MC | MC-1 | Murcia | Ground | 13,680 | Si PC | 230 | 6 | 500 | 3 | 3,146.4 | 3000 |
| PP | PP-1 | Palazzo P. | Ground | 46,200 | CdTe | 77.5 | 2 | 800 | 3 | 3,580.5 | 3490 |
| 3 | 630 | ||||||||||
| P2 | P2-1 | Parmense | Ground | 20,520 | CdTe | 77.5 | 2 | 800 | 1 | 1,590.3 | 1600 |
| P3 | P3-1 | Parmense | Ground | 16,680 | CdTe | 77.5 | 2 | 630 | 1 | 1,292.7 | 1260 |
| S | S-1 | Valencia | Roof | 3266 | Si PC | 230 | 1 | 630 | 1 | 751.2 | 630 |
| S-2 | Roof | 3266 | Si PC | 230 | 1 | 630 | 1 | 751.2 | 630 | ||
| T | T-1 | Tarragona | Roof | 5374 | Si PC | 215-235 | 10 | 100 | 1 | 1,218.6 | 1000 |
| TA | TA-1 | Lérida | Roof | 520 | Si PC | 220 | 20 | 5 | 1 | 114.4 | 100 |
| TA-2 | Roof | 520 | Si PC | 220/225 | 14 | 5 | 1 | 81.3 | 70 | ||
| TA-3 | Roof | 5139 | CdTe | 77.5 | 4 | 100 | 1 | 398.0 | 400 | ||
| TS | TS-1 | Lérida | Roof | 1587 | Si PC | 215-235 | 22 | 15 | 1 | 354.6 | 330 |
| TS-2 | Roof | 1560 | Si PC | 235 | 24 | 15 | 1 | 366.1 | 360 | ||
| Total | |||||||||||
| 15 | 20 | - | Ground | 282,489 | Si PC | 29.627 | 153 | MAX | 34 | 29.470 | 27.490 |
| 9 | 17.4% | (MWp) | 1000 | (MWp) | (MW) | ||||||
| Roof | CdTe | MIN | |||||||||
| 6 | 82.6% | 5 | |||||||||
| Failures | ||||||||||||||||
|---|---|---|---|---|---|---|---|---|---|---|---|---|---|---|---|---|
| PV Park | Solar Field | Inverter | ST | Electrical Grid | Monitoring System | TF | ||||||||||
| Modules | DC Wiring | Junction Box | TFSF | Operation | Start up and Stopping | Monitoring | TFI | Operation | Weather | TFST | Operation | Weather | TFG | TFMS | ||
| A | 24 | 0 | 1 | 25 | 7 | 2 | 9 | 18 | 3 | 1 | 4 | 0 | 1 | 1 | 3 | 54 |
| B | 0 | 2 | 0 | 2 | 2 | 0 | 0 | 2 | 0 | 0 | 0 | 0 | 0 | 0 | 34 | 38 |
| C | 13 | 0 | 1 | 14 | 1 | 0 | 2 | 3 | 4 | 0 | 4 | 2 | 0 | 2 | 4 | 31 |
| D | 8 | 0 | 0 | 8 | 0 | 0 | 0 | 0 | 0 | 0 | 0 | 1 | 0 | 1 | 11 | 20 |
| F | 0 | 0 | 0 | 0 | 0 | 0 | 2 | 2 | 0 | 0 | 0 | 0 | 0 | 0 | 20 | 22 |
| MA | 0 | 0 | 0 | 0 | 0 | 1 | 0 | 1 | 0 | 0 | 0 | 1 | 0 | 1 | 2 | 4 |
| MB | 0 | 0 | 1 | 1 | 3 | 0 | 0 | 3 | 0 | 0 | 0 | 2 | 0 | 2 | 4 | 10 |
| MC | 0 | 0 | 1 | 1 | 0 | 2 | 0 | 2 | 0 | 0 | 0 | 0 | 0 | 0 | 2 | 5 |
| PP | 45 | 0 | 0 | 45 | 1 | 4 | 0 | 5 | 4 | 1 | 5 | 1 | 0 | 1 | 3 | 63 |
| P2 | 12 | 0 | 1 | 13 | 1 | 0 | 2 | 3 | 2 | 1 | 3 | 1 | 1 | 2 | 5 | 28 |
| P3 | 11 | 0 | 0 | 11 | 0 | 0 | 0 | 0 | 2 | 3 | 5 | 0 | 0 | 0 | 4 | 22 |
| S | 0 | 0 | 0 | 0 | 0 | 0 | 0 | 0 | 0 | 0 | 0 | 0 | 0 | 0 | 4 | 4 |
| T | 0 | 0 | 0 | 0 | 2 | 1 | 0 | 3 | 0 | 0 | 0 | 0 | 0 | 0 | 26 | 29 |
| TA | 0 | 0 | 0 | 0 | 3 | 17 | 2 | 22 | 0 | 0 | 0 | 0 | 0 | 0 | 24 | 46 |
| TS | 0 | 0 | 0 | 0 | 38 | 30 | 2 | 70 | 0 | 0 | 0 | 0 | 0 | 0 | 47 | 117 |
| Total | 113 | 2 | 5 | 120 | 58 | 57 | 19 | 134 | 15 | 6 | 21 | 8 | 2 | 10 | 193 | 478 |
| Failure Rates | |||||||
|---|---|---|---|---|---|---|---|
| PV Parks | FRSF | FRI | FRST | FRG | FRM | TFR | TFRp |
| A | 0.0004452 | 2.4 | 1.067 | 0.8 | 2.4 | 43.2 | 0.01367 |
| B | 0.0002642 | 0.114 | 0 | 0 | 27.2 | 30.4 | 0.02171 |
| C | 0.0001935 | 0.6 | 0.8 | 1.6 | 3.2 | 24.8 | 0.0062 |
| D | 0.0003951 | 0 | 0 | 0.8 | 8.8 | 16 | 0.0127 |
| F | 0 | 0.2 | 0 | 0 | 16 | 17.6 | 0.022 |
| MA | 0 | 0.2 | 0 | 0.8 | 1.6 | 3.2 | 0.0016 |
| MB | 0.0000839 | 0.6 | 0 | 1.6 | 3.2 | 8 | 0.004 |
| MC | 0.0000585 | 0.267 | 0 | 0 | 1.6 | 4 | 0.00133 |
| PP | 0.0007792 | 0.8 | 1.333 | 0.8 | 2.4 | 51.2 | 0.01467 |
| P2 | 0.0005068 | 1.2 | 2.4 | 1.6 | 4 | 22.4 | 0.014 |
| P3 | 0.0005276 | 0 | 4 | 0 | 3.2 | 17.6 | 0.01397 |
| S | 0 | 0 | 0 | 0 | 3.2 | 3.2 | 0.00254 |
| T | 0 | 0.24 | 0 | 0 | 20.8 | 23.2 | 0.0232 |
| TA | 0 | 0.463 | 0 | 0 | 19.2 | 36.8 | 0.06456 |
| TS | 0 | 1.217 | 0 | 0 | 37.6 | 93.6 | 0.13565 |
| Total | 0.00034081 | 0.701 | 0.494 | 0.53 | 10.4 | 25.49 | 0.01739 |
| Power (kW) | Number of Inverters | Percentage of Failured Inverters | Operations Failures | Start-up and Stopping Failures | FELIO (kWh) | FELStSp (kWh) | FELI (kWh) | FELI/FEL |
|---|---|---|---|---|---|---|---|---|
| 5 | 34 | 29.41% | 1 | 12 | 3 | 2 | 5 | 0.01% |
| 15 | 46 | 50.00% | 38 | 30 | 1654 | 274 | 1928 | 1.21% |
| 100 | 36 | 25.00% | 5 | 8 | 2214 | 96 | 2310 | 1.45% |
| 500 | 17 | 47.06% | 7 | 4 | 12,243 | 2 | 12,244 | 7.68% |
| 540 | 4 | 75.00% | 4 | 2 | 20,249 | 1038 | 21,287 | 13.35% |
| 630 | 8 | 12.50% | 1 | 1 | 424 | 1664 | 2088 | 1.40% |
| 800 | 4 | 25.00% | 1 | 0 | 308 | 0 | 308 | 0.19% |
| 1000 | 4 | 25.00% | 1 | 0 | 3,595 | 0 | 3595 | 2.26% |
| Total | 153 | - | 58 | 57 | 40,689 | 3077 | 43,766 | 27.55% |
© 2018 by the authors. Licensee MDPI, Basel, Switzerland. This article is an open access article distributed under the terms and conditions of the Creative Commons Attribution (CC BY) license (http://creativecommons.org/licenses/by/4.0/).
Share and Cite
Lillo-Bravo, I.; González-Martínez, P.; Larrañeta, M.; Guasumba-Codena, J. Impact of Energy Losses Due to Failures on Photovoltaic Plant Energy Balance. Energies 2018, 11, 363. https://doi.org/10.3390/en11020363
Lillo-Bravo I, González-Martínez P, Larrañeta M, Guasumba-Codena J. Impact of Energy Losses Due to Failures on Photovoltaic Plant Energy Balance. Energies. 2018; 11(2):363. https://doi.org/10.3390/en11020363
Chicago/Turabian StyleLillo-Bravo, Isidoro, Pablo González-Martínez, Miguel Larrañeta, and José Guasumba-Codena. 2018. "Impact of Energy Losses Due to Failures on Photovoltaic Plant Energy Balance" Energies 11, no. 2: 363. https://doi.org/10.3390/en11020363
APA StyleLillo-Bravo, I., González-Martínez, P., Larrañeta, M., & Guasumba-Codena, J. (2018). Impact of Energy Losses Due to Failures on Photovoltaic Plant Energy Balance. Energies, 11(2), 363. https://doi.org/10.3390/en11020363