1. Introduction
A few decades ago, the entire electricity sector in Europe was organised as a state-owned and -controlled monopoly. Each state had one or more vertically integrated companies that were responsible for the generation, transmission, distribution and supply of electricity. In 1996, the European Union gradually began to open up the electricity sector to competition by launching the first electricity-related directive (1996/92/EC). It consisted of common rules for the internal market for electricity [
1]. This was followed by two electricity-specific directives, launched in 2003 and 2009. The second directive (2003/54/EC) established rules for separation between network responsible companies (Transmission System Operator—TSO and Distribution System Operator—DSO) and competitive market companies. This directive also introduces conditions for cross-border trading of electricity [
2]. The Agency for Cooperation of Energy Regulators (ACER) was established in the third directive (2009/72/EC) [
3]. The ACER’s main task is to coordinate the operation of national energy regulators at the EU level and work towards a single EU energy market for electricity and natural gas. In this regard, ACER, in cooperation with the European Network of Transmission System Operators for Electricity (ENTSO-E), plays the most important role in the development of EU-wide network and market rules [
4].
The aim of these directives was to create a competitive internal European electricity market (IEM). In order to further promote the completion of IEM and creation of the Energy Union, on 30 November 2016, the European Commission published a “Clean Energy for All Europeans” package consisting of numerous legislative proposals. Although this package consists of more than 40 planned measures, the following key objectives can be derived [
5]:
establishment of a common electricity market design across the Union;
efficient integration of electricity produced from renewable sources into the market;
advancement of energy efficiency and energy cleanliness, which, along with the support of renewables, are needed to achieve the European Union goals;
promotion of end-users and other distribution grid users (energy storage, electric vehicles charging station, distributed generation) to take an active role in the electricity market;
a further push to market-based pricing (even in scarcity periods) and free access to both electricity and balancing markets for all grid users.
Liberalization of the Croatian electricity sector started with the introduction of the 2001 Energy Act [
6]. This act created a legislative framework that was necessary to provide suppliers and customers with more freedom when selling and procuring electricity. The Energy Act served also as a basis for the creation of a market framework focused on efficiency and reliability. The main entities in the Croatian energy sector, Croatian Power Utility (HEP) and the Croatian oil and gas company (INA), which were responsible for the production, distribution and supply of electricity, oil and gas, started the restructuring process with the aim of adapting to the liberalised European Market. One of the main goals of European directives was unbundling, which refers to the separation of market (generation and supply) and natural monopoly (system infrastructure and organization) functions. Before the unbundling process, both functions were provided by the national utility. The process of unbundling can be divided into: accounting unbundling, functional unbundling, legal unbundling and ownership unbundling. Croatia formally conducted all these steps, except ownership unbundling.
The main intention of this paper is to explain the organisation and function of the electricity market in Croatia, as well as identify key obstacles and propose relevant measures that Croatia needs to take in order to make a transition to a fully liberalized, liquid and transparent electricity market. Additionally, this paper contributes with recommendations towards the integration of the Croatian market into the wider regional market, which is a necessary step before the creation of the IEM.
The paper is organised as follows. Relevant work is presented in
Section 2.
Section 3 provides a general overview of electricity market design in Europe.
Section 4 analyses electricity market design in Croatia, while cross-border capacity allocation is explained in
Section 5. Support schemes for the electricity production from Renewable Energy Sources (RES) and Combined Heat and Power (CHP) in Croatia are explained in
Section 6, and
Section 7 provides a detailed analysis of the procurement of ancillary services.
Section 8 explains in detail the current situation of the Croatian retail market. Finally, conclusions and recommendations are provided in
Section 9.
Although energy legislation in Croatia contains a lot of secondary legislation related to one or more laws, the main energy laws currently in force are as follows:
Secondary legislation related to a particular energy law is addressed as necessary in the remainder of this paper.
Since this paper is focused on the Croatian electricity market, we provide basic information on the Croatian power system. Maximum and minimum system demand, annual consumption and transmission network losses are given in
Table 1, while the total production capacity in Croatia is given in
Table 2 [
7].
2. Relevant Work
The creation of the IEM is one of the most important objectives of the EU concerning future energy. However, various national electricity market designs pose a significant threat to this process. Newbery et al. [
8] examine the potential benefits of coupling interconnectors to increase the efficiency of the day-ahead, intra-day and balancing services trading across the borders. They explain that additional gains are possible by eliminating unscheduled flows and avoiding the curtailment of renewables with a better market design. Ringler et al. [
9] emphasize the importance of electricity market design coordination among the member states to benefit from a common IEM. Therefore, a detailed analysis of various national electricity market designs is necessary for further harmonization of these markets and the creation of a fully functional IEM in the EU. Several papers on electricity market designs for specific countries have already been published. For example, Tanrisever et al. [
10] examine the organization and functioning of the Dutch electricity market. The paper describes in detail the role of the main market participants in the Dutch electricity market. In [
11], the authors analyse the restructuring processes for different market structures, such as Nord Pool, Trilateral Market Coupling (TLC), Pennsylvania-New Jersey-Maryland interconnection (PJM) and electricity market structure in Russia. All of these markets experienced different development paths during restructuring due to different states of the electricity sector prior to restructuring. In [
12] and [
13], the German power market organisation and functionality is described. The main conclusion is that the market concentration in Germany is still relatively high. Generally, market concentration is described using the Hefindahl-Hirschman Index (HHI) as a measure of market concentration and competition among the market participants. HHI is calculated as a sum of squares of the market shares of each market participant, and can range from close to zero to 10,000. HHI close to 10,000 indicates monopoly market structure, while HHI close to zero indicates a market with perfect competition. Generally, markets with HHI less than 1500 are considered competitive; HHI between 1500 and 2500 indicates moderately competitive markets, while HHI greater than 2500 indicates a highly concentrated market. In 2011, the HHI of Germany’s wholesale electricity market concentration was around 2000, which means that the wholesale market in Germany is moderately concentrated. However, in recent years, market liquidity in Germany increased due to the obligation of the TSOs to sell renewable energy in the spot market [
12]. The French power market design and functionality were also analysed, and the main conclusions were that the French power market is still highly concentrated and the wholesale market liquidity is low compared with its neighbours. In 2013, the French wholesale market had an HHI index around 9000, while liquidity was around 12%, which is relatively low compared with 40% for Germany and 67% for Spain [
14]. An interested reader is referred to [
15] for European electricity markets’ liquidity values for 2015.
3. Current Electricity Market Design in Europe
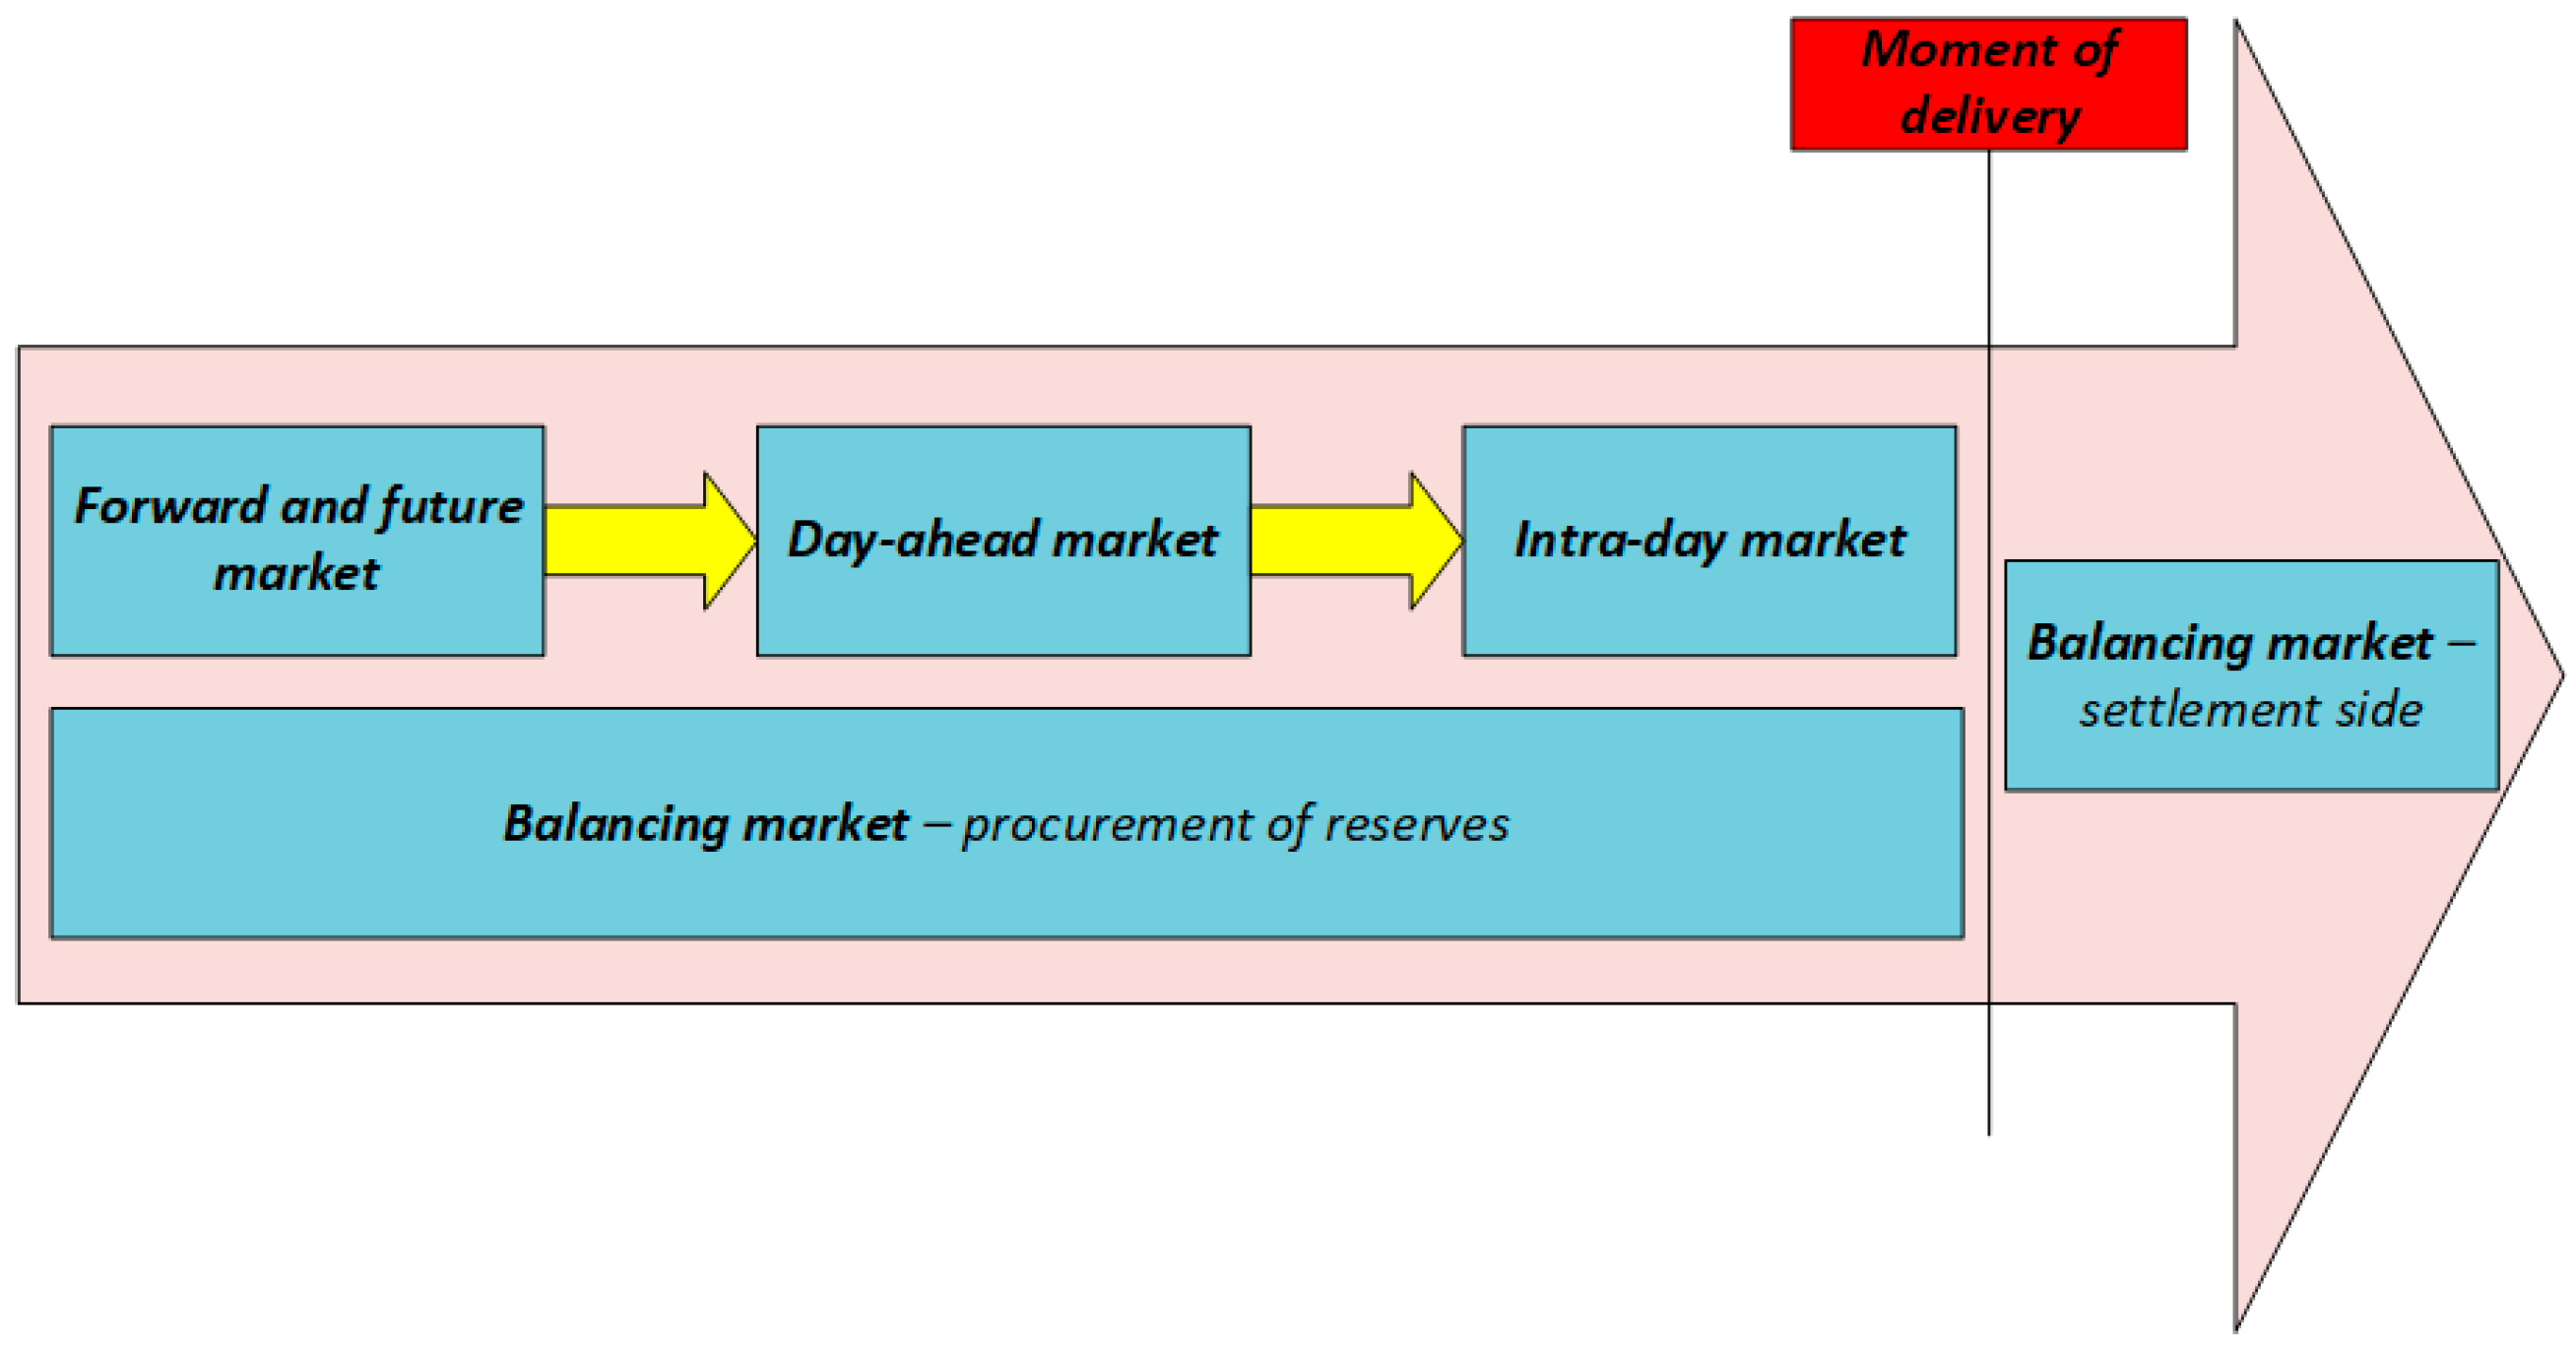
Electricity is a special type of commodity in that generation and consumption (including grid losses) must be in balance at all times. Electricity markets are designed to be able to deal with this specific feature. Therefore, different types of electricity markets are arranged consecutively, starting a few years before the actual delivery and ending after the delivery of electricity.
Figure 1 gives a conceptual overview of different types of electricity markets regarding their time dimension.
Forwards and futures are long-term markets, which run from years before up to the day before the delivery of electricity. They serve market participants as a tool for reducing their exposure to price fluctuations in short-term markets. It is in the interest of electricity producers to contract future electricity sales using forward and future markets in order to reduce their exposure to the price decrease in the short-term markets.
It is also important to distinguish two ways in which electricity can be traded in different types of wholesale markets. The first way is bilateral trading, in which producers and customers directly negotiate and agree on the price of electricity. The second way is trading at power exchanges or organised trading platforms. Power exchanges are usually designed as continuous trading or discrete auctions. Discrete auction is a form of trading where market participants submit generation and demand bids that are used to obtain supply and demand curves. Market clearing price for each trading period is based on the supply and demand curve intersection. Continuous trading implies trades between two market participants when one accepts offers from the other without the formation of a uniform market clearing price. The price is formed for each of the trades independently.
Day-Ahead Markets (DAM) are the basis of electricity trading, where electricity is traded one day before the delivery. Their high importance arises from the day-ahead balance requirement of the entire bidding zone, i.e., in a bidding zone the planned electricity generation must be equal to the forecasted demand plus the difference between imports from and exports to the other bidding zones. European day-ahead markets usually use discrete auctions as a form of trading.
In Intra-Day Markets (IM) the electricity is traded on the delivery day. These types of markets supplement the DAM and secure the balance between the supply and the demand caused by unexpected events that can occur between closing the DAM and the delivery time, e.g., due to unexpected power plant outage or inaccurate wind forecast. Using the intra-day market platform, market participants can minimize the gap between the day-ahead contracts and the actual produced/consumed volume of electricity. European intra-day markets are usually designed as continuous trading or discrete auctions.
The role of the TSO is to maintain a real-time balance by activating reserves. Balancing Markets (BM) are used by the TSO to procure reserves. Balancing markets can be divided into reserve procurement and financial settlement of imbalances. Reserve procurement is a reservation of spare capacity in advance. This capacity can, if needed, be used for generation demand balancing. Financial settlement of imbalances can be defined as penalization for market participants causing imbalance and financial awards for market participants used for imbalance mitigation (e.g., reserve providers).
Electricity markets in Europe are organised by the Nominated Electricity Market Operators (NEMOs), while the TSOs are in charge of balancing markets.
4. The Electricity Market Design in Croatia According to the Current Laws and Regulations
All market participants and their roles in the electricity market in Croatia are explained in accordance with the current energy legislation. Additionally, electricity market parameters (HHI, products available in the DAM and the IM, etc.) are identified and compared with the parameters of well-established markets, such as Nord Pool. Market participants defined within the Croatian electricity market can be divided into those who trade electricity under market principles (competitive market participants) and regulated market participants responsible for market organisation and network management.
4.1. Competitive Market Participants
Market participants in the wholesale electricity market in Croatia are producers, traders and suppliers.
4.1.1. Producers
A producer is an energy entity with a license to produce electricity. Additionally, energy entities producing electricity for its own needs and energy entities operating generation facilities below 1 MW can be considered as exceptions since they do not need to have a license to produce electricity. According to Articles 4–6 of [
17], “a producer may buy or sell electricity to another producer, supplier, trader, power exchange, Croatian Transmission System Operator (HOPS) in order to provide ancillary services, providing balancing services, compensation plan exchanges and to cover losses in the transmission network, HEP Distribution System Operator (HEP-DSO) in order to provide ancillary services and to cover losses in the distribution network or in a way that is imported or exported over Croatian borders”.
A power producer in Croatia is classified either as an eligible producer or an independent producer. An eligible producer is a producer with both grid (priority dispatch) and market priority. RES/CHP generators may obtain a so-called “eligibility status”. All RES/CHP generators that have this status are subsidized under the Feed-in-Tariff (FiT) support scheme. The Energy Act, the Act on renewable energy and high-efficiency cogeneration and secondary legislation regulate incentivizing such electricity production, as well as the purchase/sale of electricity produced from renewables and cogeneration [
18,
19,
20,
21].
4.1.2. Traders
A trader is an energy entity that purchases and sells electricity and has been licensed to carry out the energy activity. According to Articles 12–14 of [
17], “a trader may buy or sell electricity to producer, supplier, another trader, power exchange, Croatian Transmission System Operator in order to provide ancillary services, providing balancing services, compensation plan exchanges and to cover losses in the transmission network, HEP Distribution System Operator in order to provide ancillary services and to cover losses in the distribution network or in a way that is imported or exported over the Croatian borders”.
4.1.3. Suppliers
A supplier is an energy entity that has been licensed to perform the activities of electricity supply. According to Articles 8–11 of [
17], “a supplier may buy or sell electricity to producer, another supplier, trader, power exchange, Croatian Transmission System Operator in order to provide ancillary services, providing balancing services, compensation plan exchanges and to cover losses in the transmission network, HEP Distribution System Operator in order to provide ancillary services and to cover losses in the distribution network or in a way that is imported or exported over Croatian borders”.
As opposed to a trader, who is a market participant not allowed to sell electricity to end-users, e.g., households, a supplier can sell electricity to end-users. This means that the trader can only participate in the wholesale market, while the supplier can participate in the wholesale and the retail market.
Each market participant must obtain Energy License issued by Croatian Energy Regulatory Agency (HERA) to participate in the market [
20].
4.2. Regulated Market Participants and Balancing Group Scheme
Except market participants, there are also four regulated market participants [
17]:
Croatian Energy Market Operator (HROTE)
Croatian Power Exchange (CROPEX)
Croatian Transmission System Operator (HOPS)
Croatian Distribution System Operator (HEP-DSO).
HOPS is responsible for maintaining the instantaneous generation-consumption balance, but before the actual delivery, the balancing responsibility is passed on to Balancing Groups (BG). In [
16], a BG is described as an entity that takes up responsibility to compose a balanced portfolio. BG can represent a certain number of producers, suppliers and consumers individually or combined. The DAM in Croatia is organised on the basis of BGs. There are several types of balancing groups in the Croatian market [
20,
22]:
Market Balancing Group (M-BG)
Power Exchange Balancing Group (PE-BG)
ECO Balancing Group (ECO-BG)—not operational yet
TSO’s Balancing Group (TSO-BG)
DSO’s Balancing Group (DSO-BG).
A market participant must be a member of a certain BG. Each BG has its own manager who is responsible for imbalances of the entire BG. A market participant who wants to join a certain BG is obliged to sign a membership contract with the manager of the BG. All market participants also have to sign an Electricity Market Participation Agreement with HROTE. Article 13 of [
22] defines that a BG manager is responsible for imbalances of its balancing group members in a settlement interval.
HOPS procures balancing energy and issues monthly invoices for imbalances to the managers of the balancing groups based on calculation of imbalances conducted by HROTE. If a certain BG has a negative imbalance during an imbalance settlement period, HOPS issues an invoice to the BG manager. On the other hand, if the BG has a positive imbalance during an imbalance settlement period, the BG manager issues an invoice to HOPS.
Balancing energy calculation is carried out in accordance with the Electricity Balancing Rules [
22], while the balancing energy price is calculated in accordance with the rules and recommendations defined in Methodology for determining the price for the settlement of balancing energy [
23].
CROPEX is the only member and, at the same time, the manager of the PE-BG. All market participants interested in participating at CROPEX are obliged to sign a Membership Agreement with CROPEX. Prerequisites for market participants to sign Membership Agreement with CROPEX are as follows [
24]:
Valid Energy License issued by HERA
Balance Responsibility Agreement with HOPS
Electricity Market Participation Agreement with HROTE.
HOPS and HEP-DSO are the only members and managers of their BGs. They must have their own BGs because they purchase electricity to cover for losses in their networks (both HOPS and HEP-DSO) and balancing energy (only HOPS).
ECO-BG is not operational yet. Fully operational ECO-BG is expected for 1 January 2018. Until then, HROTE will remain the single buyer of electricity from RES/CHP that is under the FiT support system. In this way HROTE practically acts as an aggregator of RES/CHP production. Currently, HROTE sells electricity to suppliers proportionally to their market share at regulated price [
25]. When ECO-BG becomes operational, HROTE as a manager of the ECO-BG will be responsible for production forecast and imbalances caused by RES under the FiT. HROTE will pay imbalances to HOPS on hourly basis. Further discussion of the support mechanisms in Croatia can be found in
Section 6.
At the closure of the DAM, BG managers submit their market positions to HROTE to verify their compliance. HROTE forwards the received market positions to HOPS, which verifies their technical feasibility with respect to the network constraints. Market positions of PE-BG, TSO-BG and DSO-BG are also delivered to HROTE.
4.3. Bilateral Electricity Market in Croatia
In Croatia electricity can be traded in two types of wholesale markets: bilateral over-the-counter and power exchange [
17,
20]. Balancing market is not yet operational. Bilateral trading means that market participants agree on trading contracts by directly interacting with each other. This implies that each market participant can make bilateral contracts with members of its own BG or with HOPS for balancing. However, most of the electricity in Croatia is still traded through the bilateral market. Every market participant from the Croatian bidding zone (except RES in the FiT support scheme) can make a bilateral contract with any market participant from the Croatian bidding zone and can also engage in cross-border trading. Trading with market participants from other EU bidding zones implies the use of the cross-border transmission capacity, which is explained in detail in
Section 5.
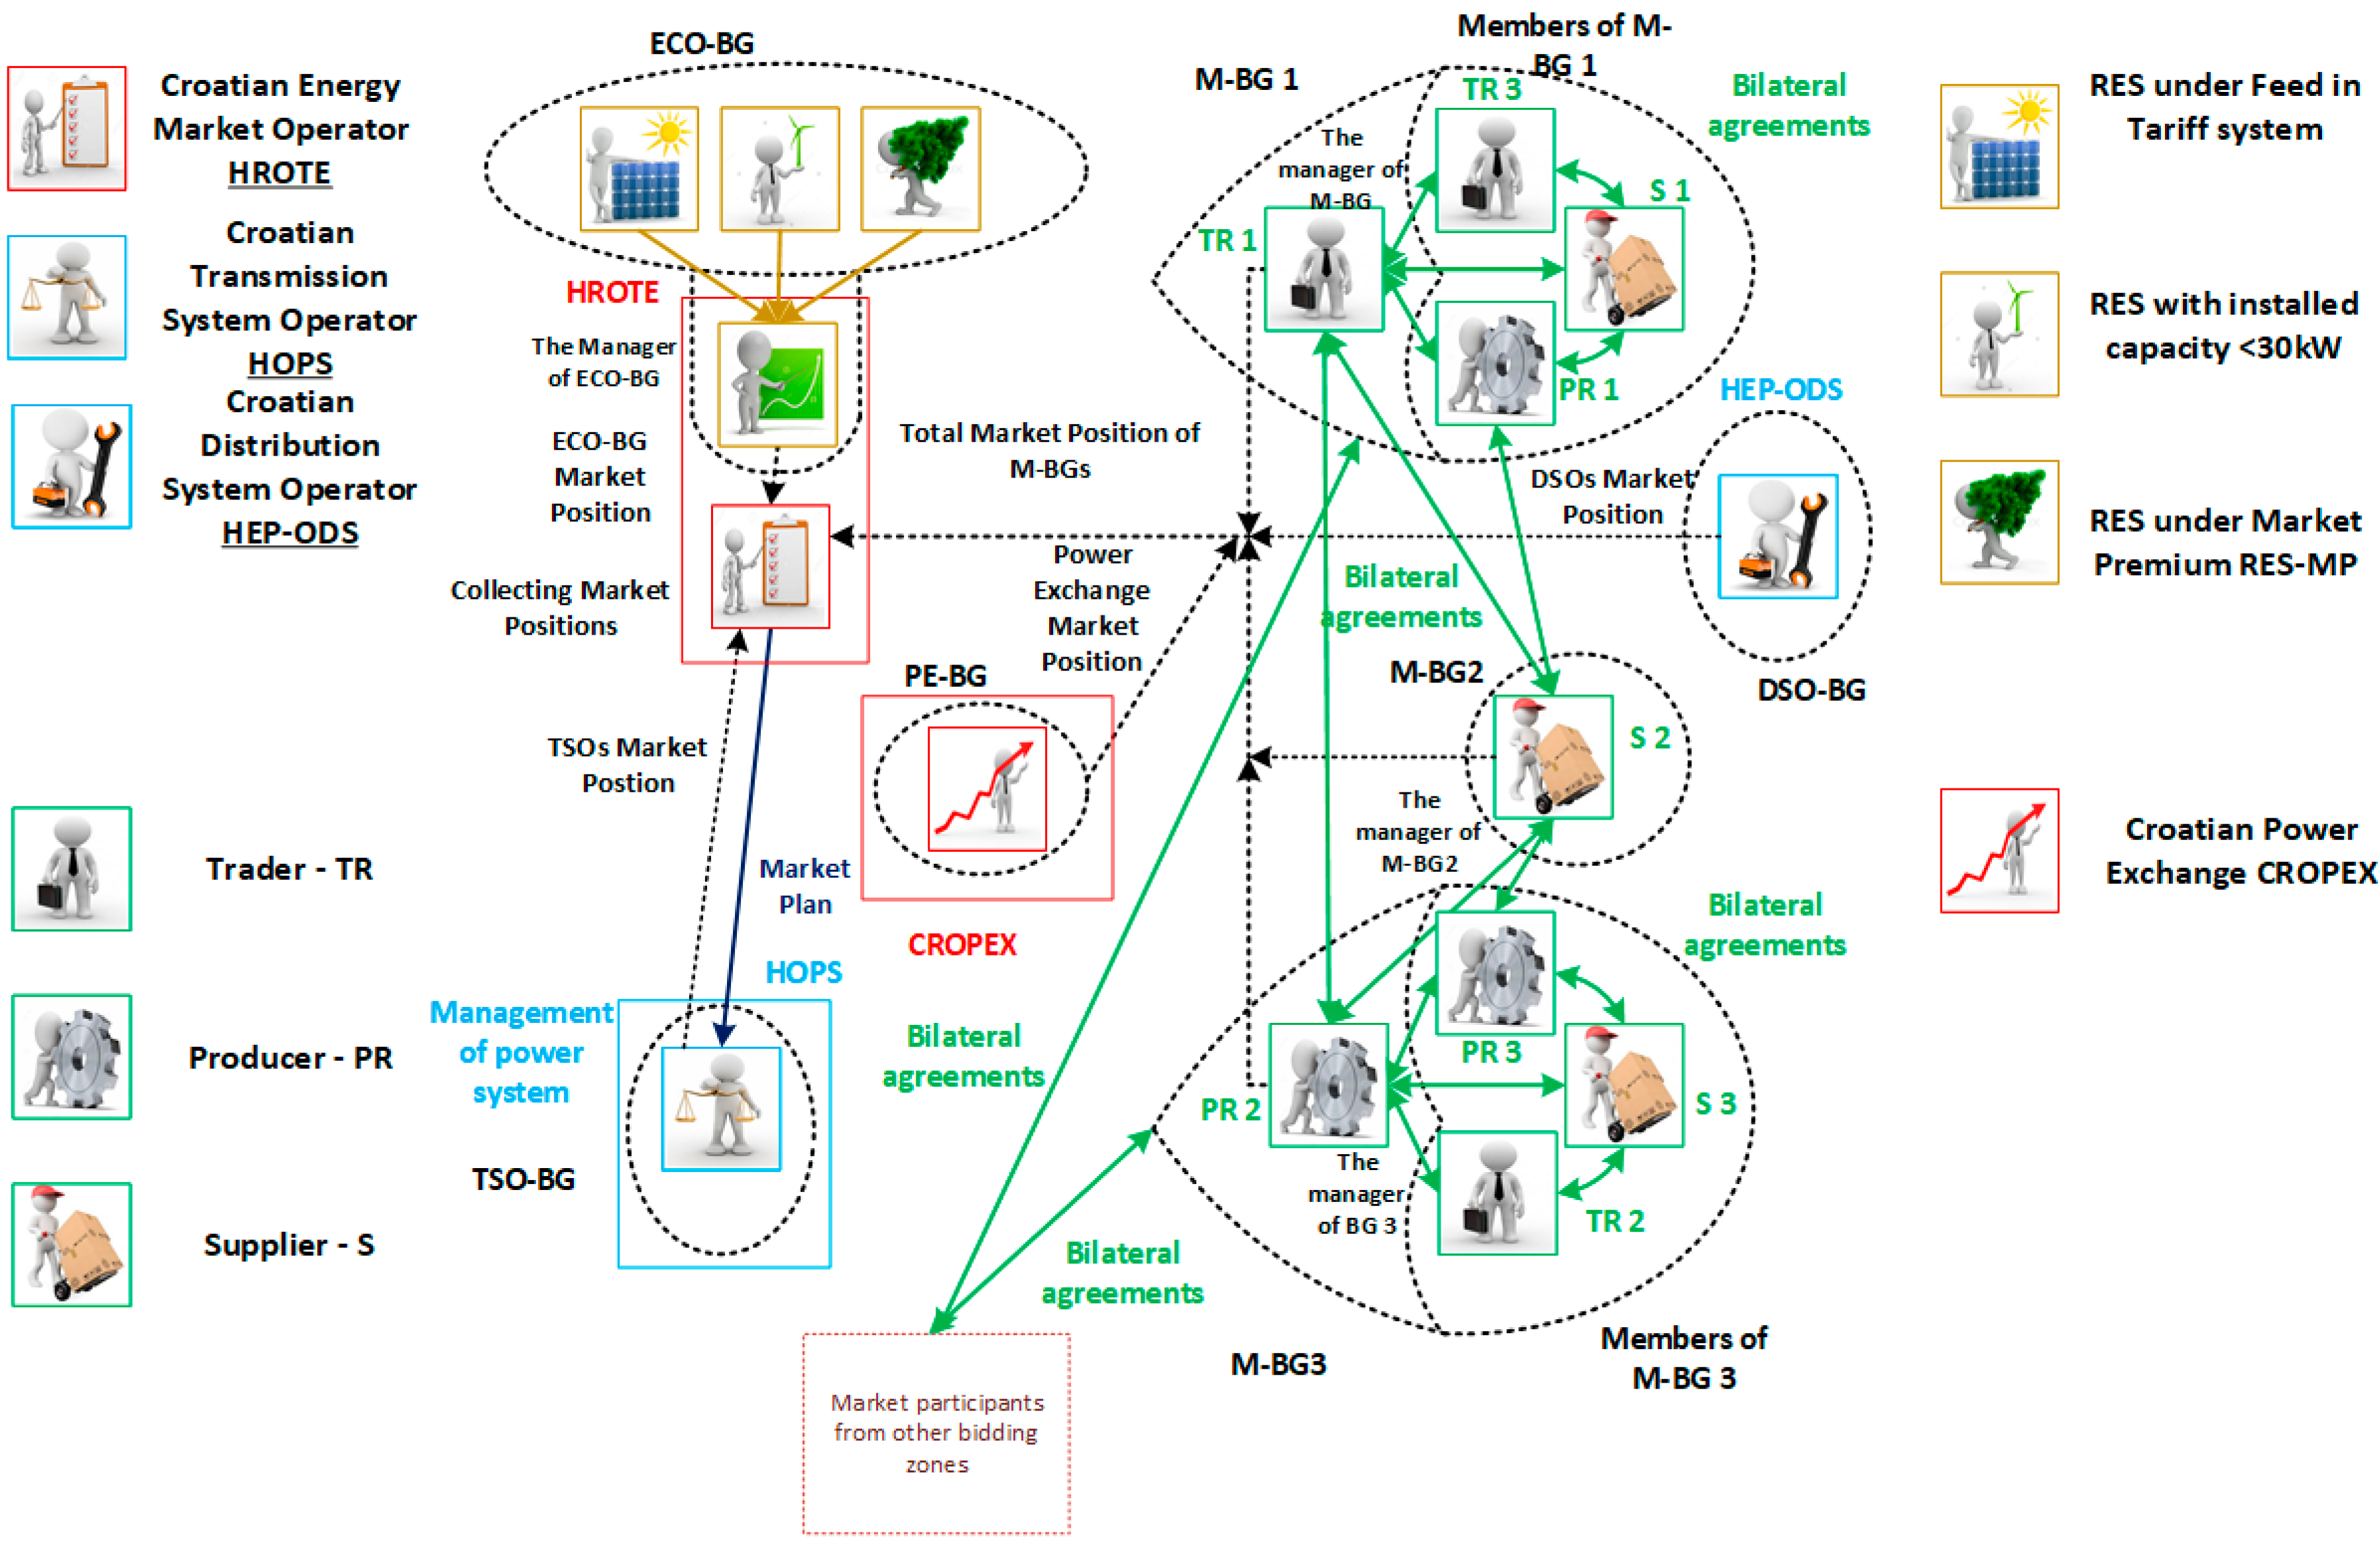
The concept of the bilateral electricity market in Croatia is presented in
Figure 3. Black dotted lines represent BGs.
Figure 2 contains M-BG (M-BG 1–3), DSO-BG, TSO-BG, PE-BG and ECO-BG. In each BG, the manager is specifically denoted. Black dotted lines with arrows represent market positions that the manager of each BG sends to HROTE. Green lines with arrows represent bilateral arrangements between market participants, which can be members of the same or any other BG. Market positions, which HROTE sends to HOPS to verify their technical feasibility, are represented with blue arrows.
4.4. Organised Electricity Market in Croatia—CROPEX
CROPEX is the Croatian power exchange and is also the nominated electricity market operator (NEMO). CROPEX is jointly owned by HROTE and HOPS. CROPEX DAM has been operational since 10 February 2016, while CROPEX IM has been active since 26 April 2017. Currently, CROPEX has been organised as the DAM and IM energy-only market.
4.4.1. CROPEX—Day-Ahead Market
Market participants at CROPEX DAM submit generation and demand bids that are the basis for the formation of market clearing price. Participants can submit their bids and offers via the Electronic Trading System (ETS) until 12 p.m. the day before the delivery. These bids/offers cannot be changed, and they are binding. Hourly Orders are the only type of orders that are defined at CROPEX DAM. Single hourly orders are placed as a monotonous curve with up to 200 price-quantity combinations that limit the volume at a specific price. Prices are defined in steps of 0.1 EUR/MWh and volume in steps of 0.1 MW [
26]. Prices for each order must be strictly defined in between the minimum and the maximum price threshold.
Market coupling mechanisms are used as means to integrate DAMs in the EU. An Integrated electricity market in Europe will increase efficiency and liquidity. Generally speaking, the main idea of market coupling is to lower electricity prices in the entire EU by harmonising day-ahead operations of different markets in terms of product specifications, transmission capacity allocation across borders, gate closure time and operational procedures. Currently, CROPEX is not coupled with any other power exchange, but there are strong intentions to couple first with the Slovenian Power Exchange (BSP SouthPool) and then with the Hungarian Power Exchange (HUPX). Market coupling of BSP SouthPool and CROPEX is scheduled for the second quarter of 2018 [
27]. BSP SouthPool has already implemented DAM coupling on Slovenian-Italian and Slovenian-Austrian borders [
28]. This implies that CROPEX will also be coupled with other European Power Exchanges once coupled with BSP SouthPool.
Since CROPEX is still not coupled with any other power exchange, transmission capacities in Croatia are still auctioned explicitly. Cross-border capacity allocation in Croatia is explained further in
Section 5. Market coupling enables implicit allocation of cross-border transmission capacities, which leads to increased cross-border flows, decreased price volatility and electricity price convergence. Harmonisation of products traded on power exchanges is one of the prerequisites for market coupling. Therefore, products traded at the BSP SouthPool DAM and HUPX DAM are compared with the product specifications available at CROPEX in
Table 3. Gate Closure, Trade Lot, Tick Size and Order Types should be harmonised before CROPEX market can be coupled with HUPX and BSP SouthPool.
It is interesting to compare order types available at Nord Pool and EPEX DAMs with order types available at CROPEX DAM. Market participants at Nord Pool and EPEX are more flexible since, in addition to hourly orders, they can use block orders, exclusive group orders and flexible orders [
31,
32]. Introduction of these types of orders could bring additional flexibility to CROPEX DAM.
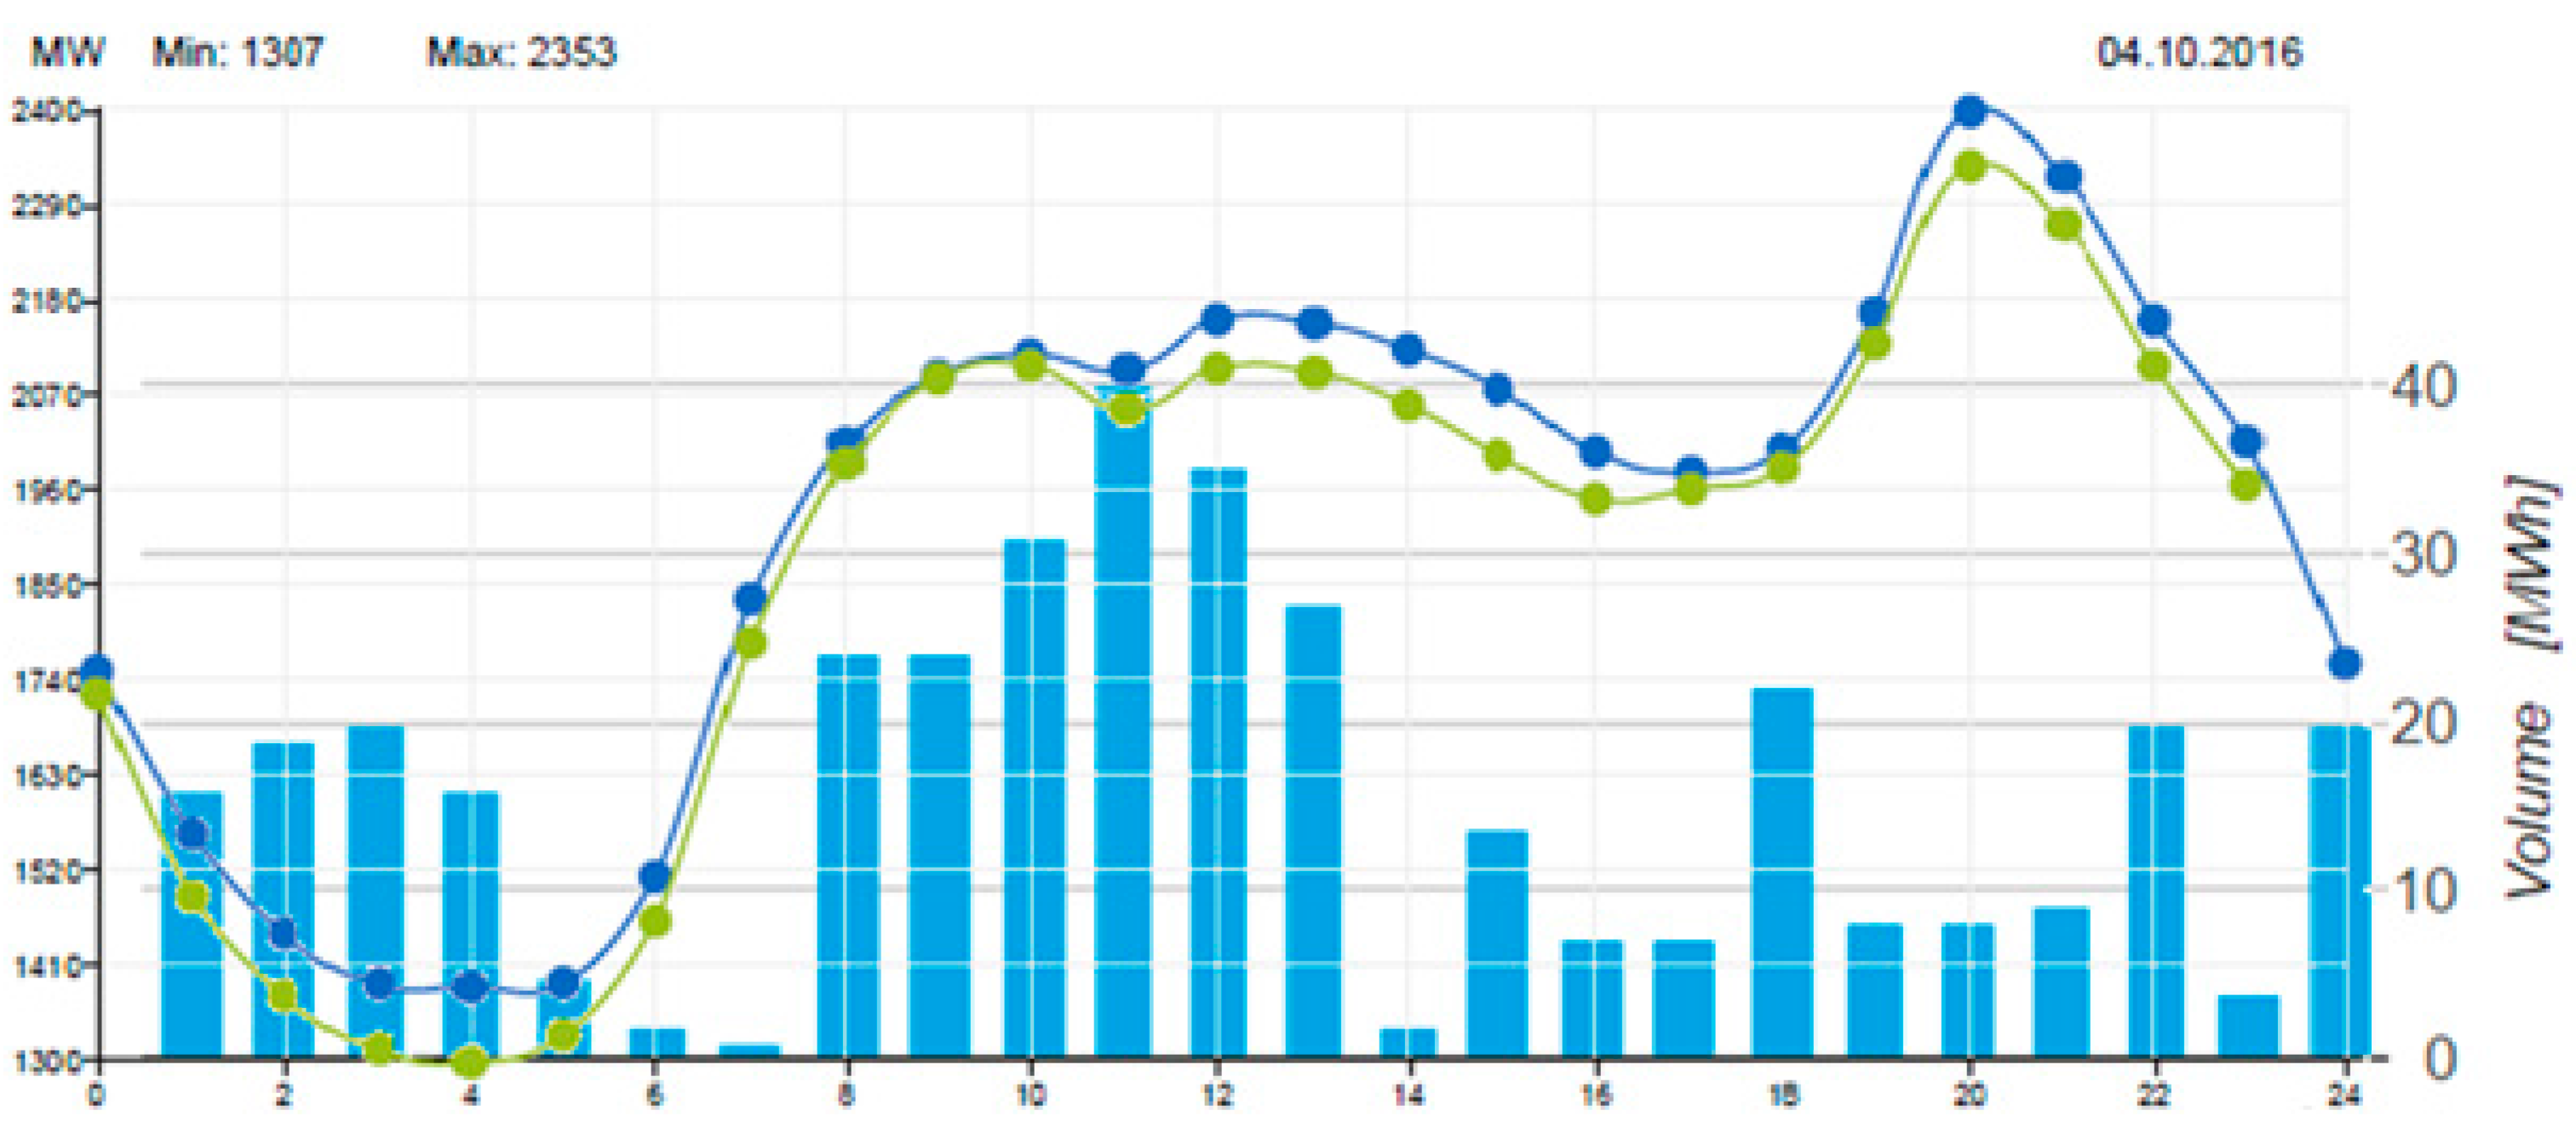
During the first 100 days of trading, only 100 GWh of electricity was traded over CROPEX, which means that its liquidity was less than 2% [
15].
Figure 3 shows that on 4 October 2016, the liquidity of the CROPEX was only 0.84%. The blue bars in
Figure 3 represent traded volume of electricity at each trading hour. Trading hours are marked on x-axis with numbers 0–24, while traded volume of electricity in MWh is indicated on y-axis located on the right-hand side of
Figure 3 with numbers 0–40. The blue and green curves represent forecasted and actual demand. Demand level is indicated in MW on the left-hand side of
Figure 3 with numbers 1300–2400. If we compare the liquidity of CROPEX with Nord Pool, which has liquidity beyond 90%, it is obvious that CROPEX is still not a well-functioning market and additional analyses and development strategies should be performed [
15,
33,
34]. However, CROPEX is a small national power exchange, while Nord Pool represents a regional power exchange, which is one of the reasons for such a difference in liquidity between them.
Another important indicator of market development is market concentration described by HHI. HHI for CROPEX DAM is given in
Table 4, while HHI for the Nordic and Croatian wholesale markets is given in
Table 5 and
Table 6, respectively.
In
Table 5, abbreviations NO 1–5 are used for bidding zone names in Norway, while SE 1–4 are used as bidding zones in Sweden. FI is a bidding zone in Finland and DK 1–2 are bidding zones in Denmark.
Table 4 indicates that market concentration at CROPEX is extremely high, which means that competition is very low. This can be partially explained by the fact that CROPEX DAM has been operational since 2016.
Based on data from
Table 5, the HHI index for the entire Nordic wholesale market in 2013 was 2041. On the other hand, the HHI index for the same year in the Croatian wholesale market was 6393. This indicates that in 2013 the Nordic wholesale market was moderately to highly competitive, while the Croatian wholesale market was not very competitive. One of the reasons for this is that the Nordic market is mature, while the Croatian market is still in development. However, from 2012 to 2016, the HHI for the Croatian wholesale market decreased from 6575 to 4928. Although an HHI value of 4928 is still very high, this decrease means that the Croatian wholesale market is developing in the right direction.
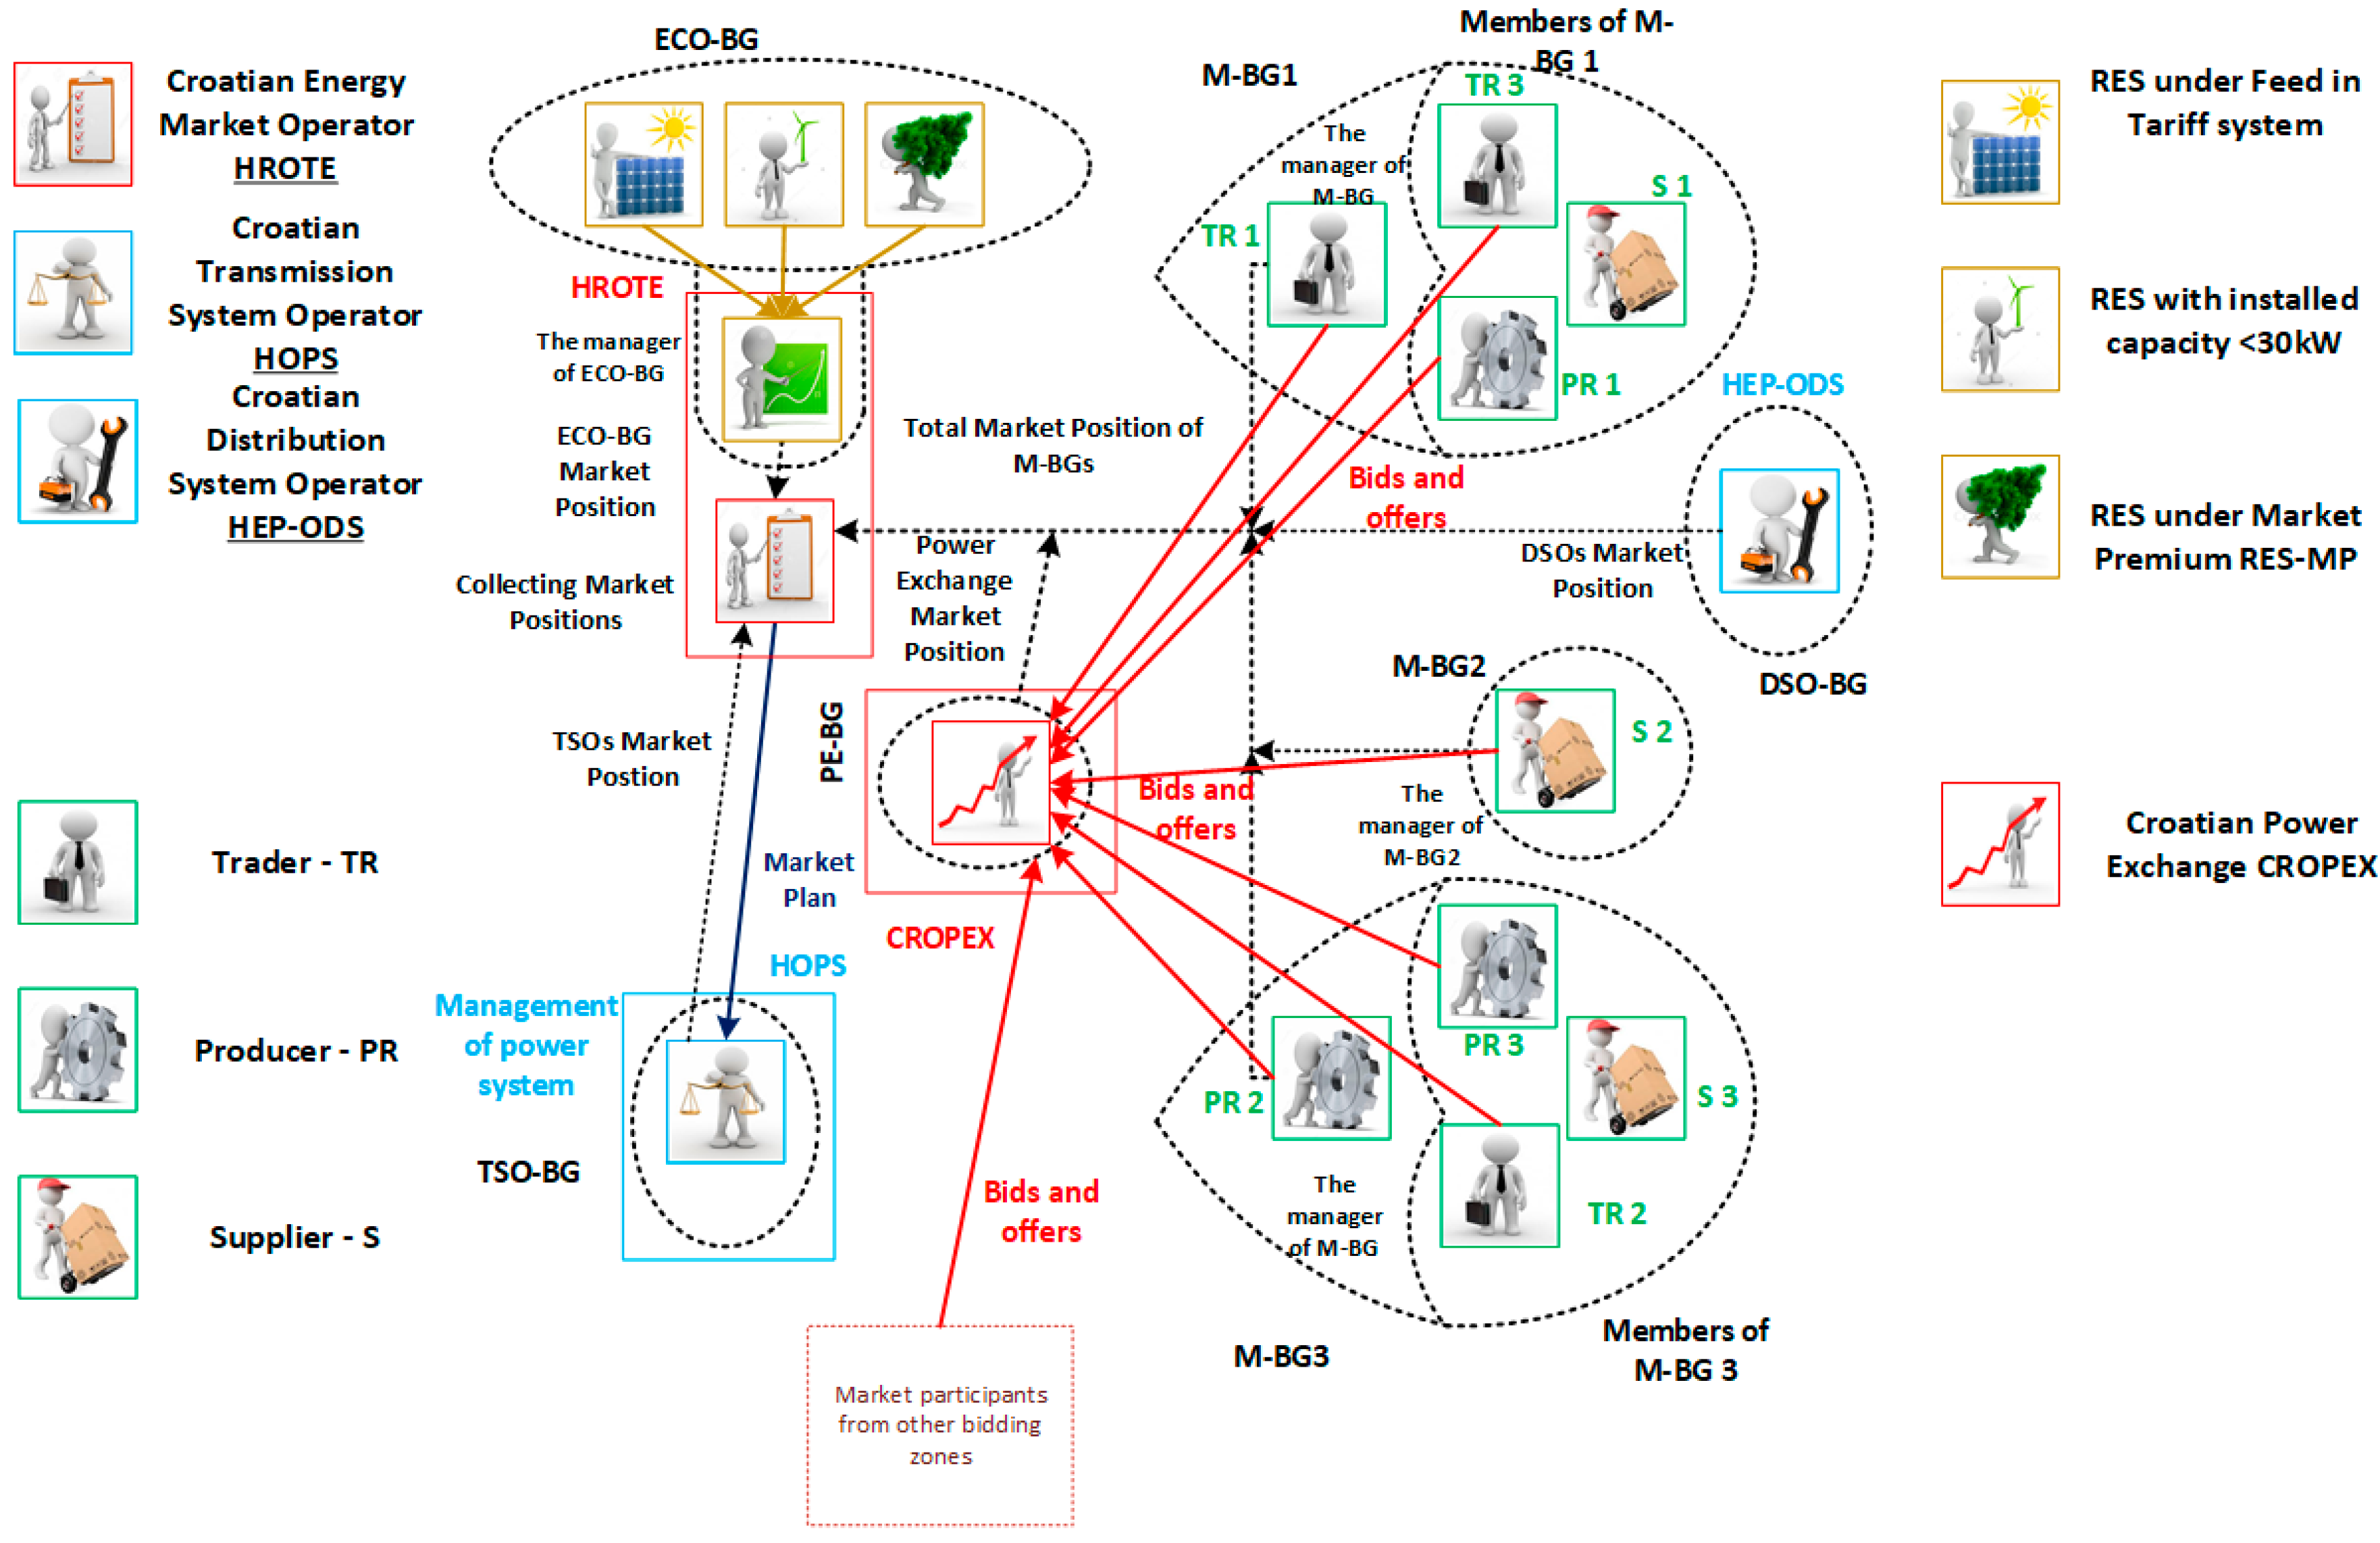
The concept of an organised electricity market in Croatia is presented graphically in
Figure 4. As already explained, black dotted lines represent BGs. In each BG members are separated from the manager. Black dotted lines with arrows represent market positions, which the manager of each BG sends to HROTE. Red arrows represent arrangements between market participants at CROPEX.
Figure 4 shows that one or more market participants from the same or a different BG or from different bidding zones can freely participate in CROPEX. Market positions, which HROTE sends to HOPS to verify their technical feasibility, are represented by blue arrows.
4.4.2. CROPEX—Intraday Market
CROPEX IM uses a continuous form of trading. This is for market participants, in particular RES, to reduce their imbalance costs, optimize own generation/consumption schedules and provide flexibility in their own production/consumption facilities. Namely, the introduction of a market premium support scheme scheduled for 2018 implies that RES will have the responsibility for balancing in the future. In [
37], the authors conducted an analysis of trading activity and price development at ELBAS (Nord Pool’s IM), and concluded that intraday trading at ELBAS can be beneficial for market participants to reduce their imbalance costs.
Table 7 shows a comparison between products that are currently available at CROPEX IM, BSP SouthPool, HUPX and ELBAS.
As shown in
Table 7, the only difference between products available through CROPEX IM and these three power exchanges is that 15-min products are not available at CROPEX. Gate Closure times are different. HUPX has Gate Closure 120 min, while BSP SouthPool and ELBAS have Gate Closure 60 min. CROPEX Gate Closure is 30 min. Additionally, BM is embedded in BSP SouthPool intraday market and this market is used by the Slovenian TSO (ELES) to buy/sell electricity for the settlement of imbalances [
38].
5. Cross-Border Capacity Allocation
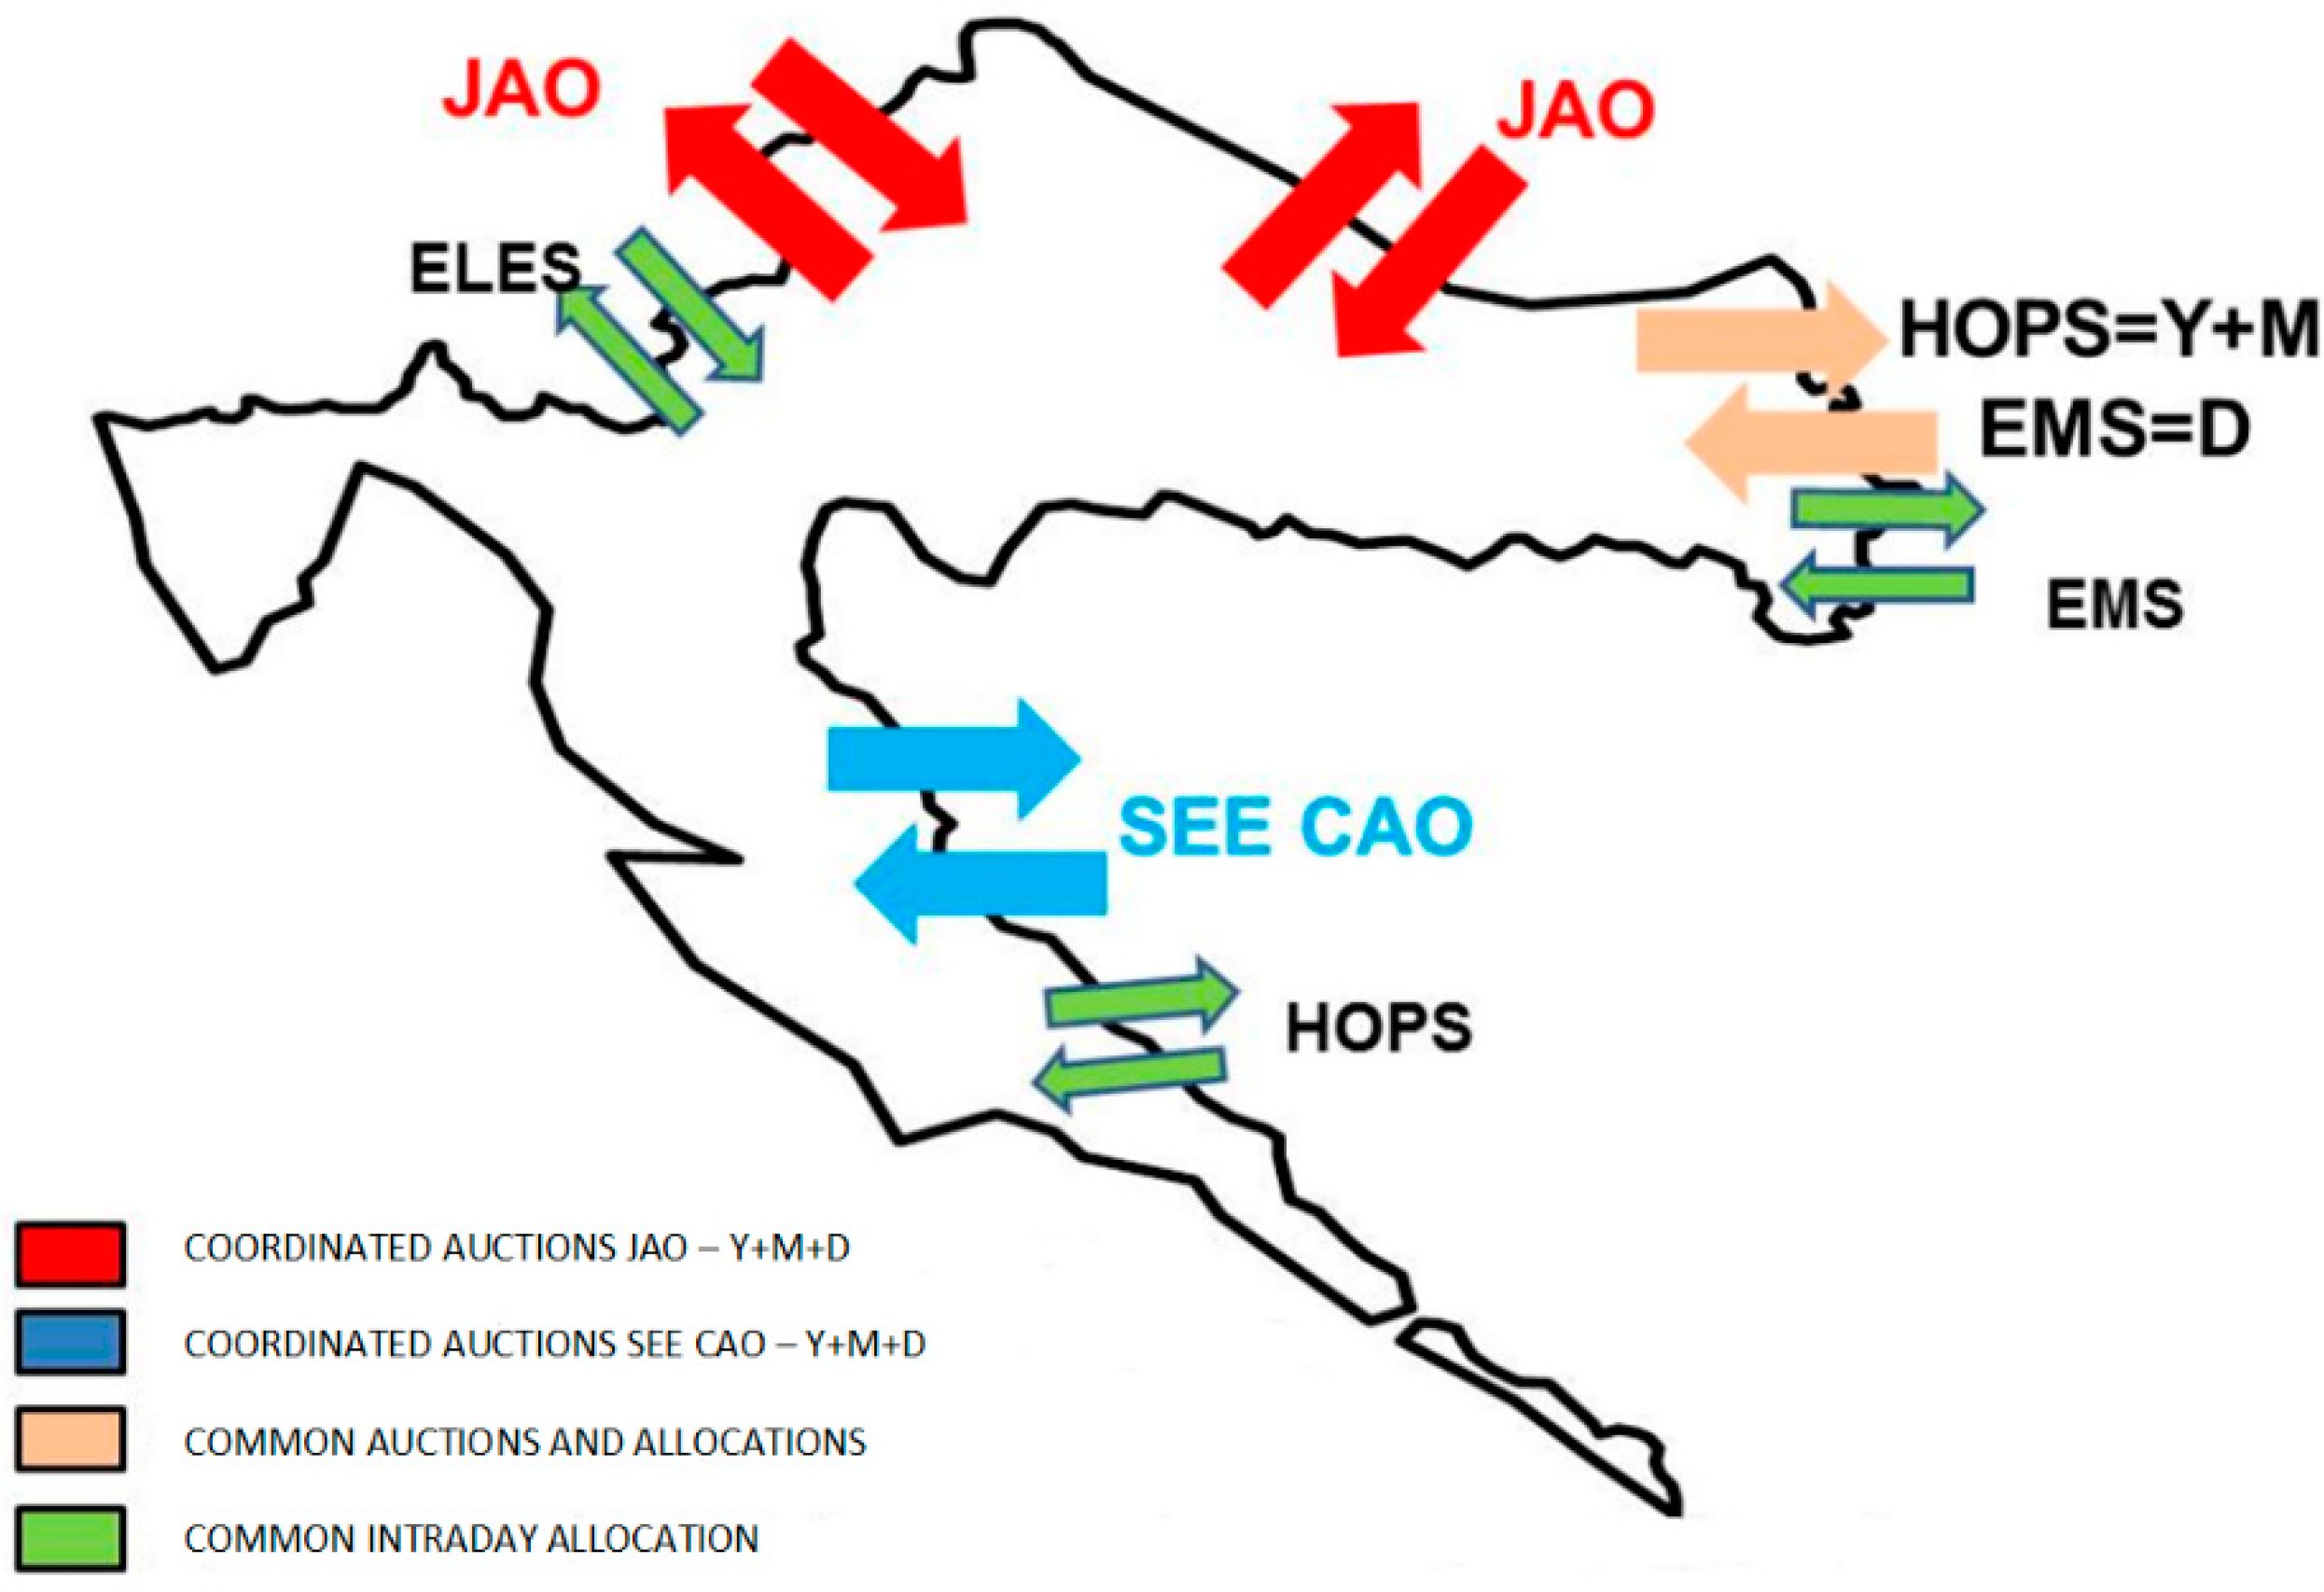
All market participants from the Croatian bidding zone can trade electricity using cross-border transmission capacities. Cross-border capacity allocation in Croatia is explicit. In explicit cross-border allocation, a buyer or seller of electricity must first buy the transmission capacity necessary for trading. Energy and transmission capacity are thus traded separately. Capacity allocation in Croatia is performed in an annual, monthly or daily auction or in an intraday allocation organised by HOPS, neighbouring TSOs, Joint Allocation Offices (JAO) or Coordinated Auction Office in South East Europe (SEE-CAO). Annual, monthly or daily auctions between Croatia and Slovenia and between Croatia and Hungary are organised by the Joint Allocation Office. Intraday cross-border allocation between Croatia and Slovenia is organised by the Slovenian TSO (ELES), while intraday cross-border allocation between Croatia and Hungary does not currently exist [
40]. SEE-CAO is responsible for organizing an annual, monthly and daily auction between Croatia and Bosnia, while HOPS is responsible for intraday cross-border allocation. HOPS is also responsible for organizing an annual and monthly auction between Croatia and Serbia, while Serbian TSO (EMS) is responsible for daily and intraday auctions. Once the cross-border transmission capacity has been assigned to a particular market participant, it can use that capacity for the delivery of electricity purchased abroad.
CROPEX and HOPS joined the 15th Cross Border Intraday Market (XBID) Local Implementation Project [
41]. Other members of the project are TSOs and power exchanges from Germany, Austria, the Czech Republic, Romania and Hungary. The intention of this project is to enable the coupling of intraday continuous electricity markets by using implicit allocation of intraday cross-border capacity at the borders between the countries that participate in the project. This implies that in Q4 2018, when the project is scheduled to go live, the CROPEX intraday market will be coupled with the HUPX intraday market and implicit allocation of intraday cross-border capacities at the Croatian-Hungarian border will be used.
Joint auction offices responsible for the allocation of Croatian cross-border transmission capacity are visualized in
Figure 5.
6. Support Schemes for Electricity Production from Renewable Energy Sources and Cogeneration
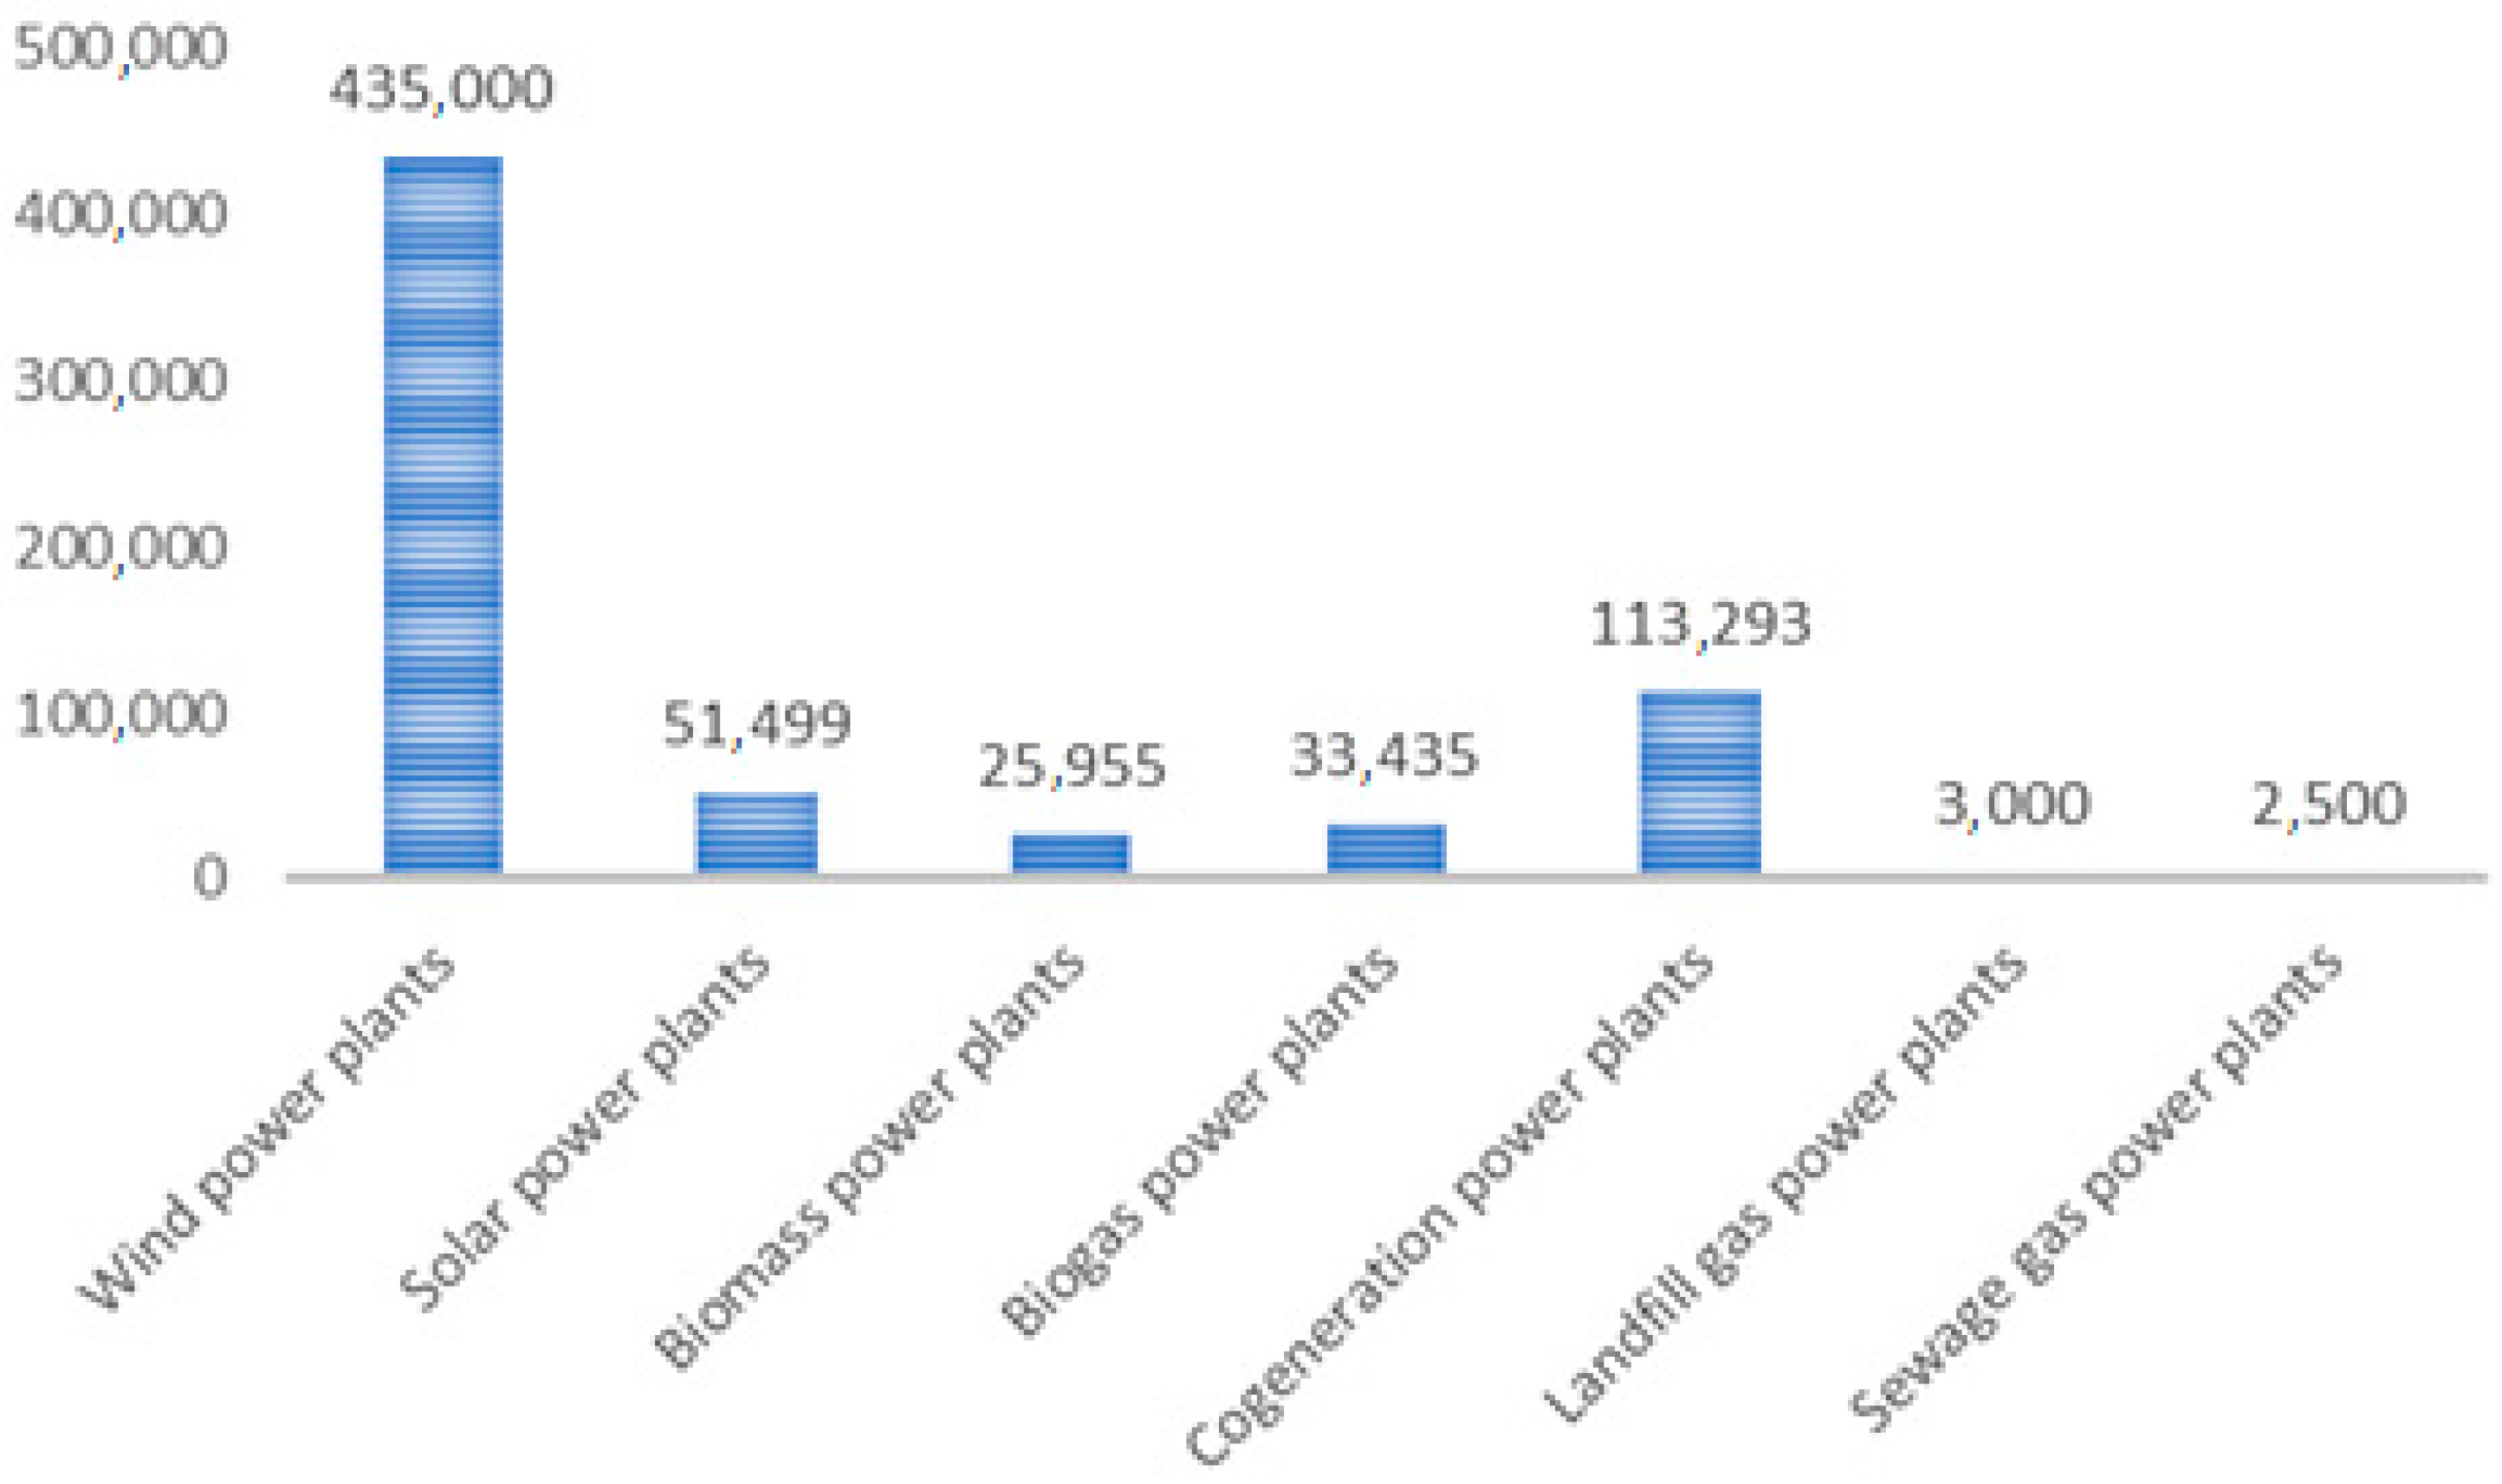
Electricity production from RES and CHP in Croatia has been incentivized since 2007 in such a way that HROTE signs a long-term purchase contract with RES and CHP under the FiT support system. In April 2017, the total installed capacity of RES remunerated according to the Feed-in Tariff system was 671.41 MW, of which 435 MW (65%) was wind power. The total amount of electricity generated by RES and CHP in 2016 was 1725 GWh, for which HROTE paid 1547 million HRK or 896 HRK/MWh, which is equal to 119 EUR/MWh [
43]. This means that in 2016 around 10% of the total electricity generated in Croatia was produced by eligible producers from RES and CHP.
Figure 6 shows the total installed capacity of each technology under the FiT support system in Croatia.
6.1. Feed-in Tariff System
The New Act on renewable energy sources and high-efficiency cogeneration, which has been in force since January 2016, has provided a framework for supporting RES and CHP electricity production via market premium contracts obtained through a bidding process. This Act also changed FiT policy in such a way that the FiT support system is in operation solely for old eligible producers and for newly eligible producers with less than 30 kW of installed capacity.
According to [
19], RES and CHP can participate in the electricity market in Croatia in four ways:
- -
Existing RES and CHP:
Under the “Old Feed-in Tariff” system issued in 2007, 2012 and 2014 for the production of electricity from RES and CHP, purchase contracts incorporating preferential price were signed with HROTE for a period of 14 years—new contracts cannot be signed anymore;
- -
New RES and CHP:
Under the Market Premium system, which implies that RES producers have to use public auctions to obtain the status of eligible producer (not in force yet);
Under the “New Feed-in Tariff” with guaranteed purchase price for the new RES producers with installed capacity up to 30 kW (not in force yet);
As a prosumer with installed generation capacity up to 500 kW and with a production capacity that is lower than the consumption capacity.
FiT preferential prices are different depending on the technology and size of an eligible producer. Preferential prices for smaller producers are higher than those for larger producers. This is because larger producers typically have decreasing cost per MW. Rules that need to be satisfied by RES and CHP producers in order to gain the status of an eligible producer are defined in [
21]. RES and CHP producers that have obtained this status have a grid priority in Croatia. This means that in situations when HOPS must curtail generation, those producers will be curtailed last.
RES under the FiT system of the classification above will be members of the ECO-BG. HROTE, as a manager of the ECO-BG, will gather data from them and generate RES day-ahead generation plans that are coupled with the market positions received from other BGs. HROTE will be responsible for the imbalances caused by the RES that are members of the ECO-BG. Imbalances that have arisen as a result of differences between the planned and actual RES production will be paid by HROTE from levies for renewables collected from end-users and by selling electricity produced by RES to suppliers according to their market share. Using the funds collected from taxes, levies and by selling electricity, HROTE also pays a preferential price for electricity to the RES in accordance with actual production.
According to [
44], when ECO-BG becomes fully operational, HROTE will be able to sell electricity produced by RES at auctions, at CROPEX and using bilateral agreements. Currently, HROTE sells electricity from producers within the FiT support system at a regulated price defined by “The Tariff System for the Production of Electricity from Renewable Energy Sources and Cogeneration” [
45], whereby each supplier is obligated to buy a portion of that electricity according to its market share.
6.2. Market Premium System
In January 2016, Croatia adopted a new legislation package, shifting the remuneration of RES from an FiT support system to a market premium system, but the market premium system is still not in use because the methods for calculating the reference price for different RES technologies have not been adopted yet. RES under a market premium system will be able to sell electricity according to the same market principles as any other conventional producer. This means that they will be allowed to sell electricity using bilateral agreements or power exchange. The only difference between conventional producers and RES under the premium system is that RES additionally receives a premium from HROTE, which is the difference between the reference cost for each RES technology and the market price. From the market perspective, RES under a premium system is equal to any other conventional producer, which means that they can be members of any M-BG. This implies that RES under a premium system is responsible for imbalances they cause, unlike RES under the FiT system.
6.3. Prosumers
Prosumers are end-users whose main objective is the procurement of energy for their own use, but they also have a certain production capacity installed that can be used to inject energy into the network (e.g., rooftop PV). Suppliers are obliged to purchase the surplus of prosumers’ generated electricity and pay them the following price [
19]:
90% of the average monthly price that the prosumer pays to the supplier when the prosumer’s energy injected into the network is less than or equal to the energy consumed from the network;
90% of the average monthly price that the prosumer pays to the supplier multiplied by the ratio of injected and consumed energy in a month when the energy injected into the network from the prosumer is greater than the consumed energy.
This measure does not serve as a support scheme, but rather as protection for small prosumers who may encounter problems finding a market participant willing to purchase their excess energy. Small prosumers may choose to sign a different contract with their supplier.
7. Procurement of Ancillary Services
As already mentioned in
Section 4, every market participant in Croatia must be a member of a certain BG. Each BG has a manager who signs a Balance Responsibility Agreement with HOPS. Imbalance of a BG is defined as the difference between the actual generation/consumption of a BG and markets position sent to HROTE and HOPS. HOPS charge the managers of BGs for the measured imbalances. The reference price of balancing energy in Croatia is defined as the average price at CROPEX, BSP SouthPool and HUPX [
23].
Currently, HOPS can procure energy necessary for system balancing in the following ways [
22]:
- -
activation through the contracted ancillary services (bilateral contracts);
- -
purchasing from neighbouring system operators;
- -
at market principles using balancing market—not yet operational.
All market participants willing to provide ancillary services must be pre-tested in order to prove their technical capability for providing the desired services [
46].
HOPS is a single buyer of reserves and contracts different types of reserves and ancillary services [
47]:
secondary reserves used to restore the system balance;
tertiary reserves used to restore the system balance when secondary reserves are depleted and to allow units that provide secondary reserve to return to their pre-imbalance status, allowing them to be ready for the next short-term imbalance intervention;
tertiary reserves responsible for system safety;
operation in compensation regime during which generating units provide voltage and reactive power control;
availability to start a generation unit without external power supply (blackout restoration capabilities).
Primary reserves are not contracted or remunerated in Croatia. This means that producers, hydro power plants with installed capacity above 10 MW and thermal power plants with installed capacity above 30 MW are obliged to provide primary reserve services without being remunerated [
46]. The required amount of primary, secondary and tertiary reserves in the Croatian control area is determined in accordance with the ENTSO-E rules. According to [
48], the required amount of primary reserves in Croatian control area is ±10 MW, while the required amount of secondary and tertiary reserves is ±83 MW and +256 MW/−51 MW. It is also important to emphasize that HOPS still procures the majority of ancillary services and reserves by bilateral contracts. Also, ancillary services in Croatia are exclusively provided by large-scale power plants and a significant effort should be made in order to allow micro- to medium-sized power plants (DERs), as well as prosumers, to provide ancillary services.
In this regard, the proactive participation of wind turbines, which is enabled in the Nordic Regulating Market, should be treated as a positive example. The Danish TSO Energinet.dk updated its regulations in order to allow wind turbines to offer balancing power under the same terms as other market participants in the regulating market and in that way increase the flexibility of the system [
49]. TSOs in the Nordic area recognized the importance and benefits of the market integration of wind power in electricity system balancing. The analysis made in [
50], where a 21 MW wind farm has been tested, showed that the wind farm is able to play a proactive role regarding downward regulation.
Recommendations Regarding Procurement of Ancillary Services in Croatia
The main issue regarding procurement of ancillary services is that BM is not operational yet. This is the main reason why HOPS procures the majority of ancillary services and reserves by bilateral contracts. This implies that the prices of these services are strictly defined by HERA, which hampers the development of the market. For further development of the overall electricity market in Croatia, it is vital to establish the BM. Additionally, the introduction of aggregation arrangement (explained in
Section 8) would enable DERs to participate in BM like any other conventional producer.
8. The Retail Market in Croatia
Market participants in the retail market in Croatia are suppliers that offer electricity contracts to end-users. End-users have the right to choose their supplier. The supplier acts as a wholesale buyer for end-users. Since the electricity market has opened, the percentage of end-users who have switched their supplier is extremely low. The first reason for this is that there is no standard procedure to change supplier contracts. As a result, the supplier changing procedure was relatively slow and uncertain. Another reason is that there were very few new suppliers in the market and, even after they emerged, end-users did not want to change their old trusted supplier. Another reason is that average electricity consumption (for household category) is relatively low and even if different suppliers offer a better price, the savings is overall very low for end-users. The retail market in Croatia is still not competitive because in 2016 companies that were part of the previously vertically integrated utility provided electricity for 85% of the total number of end-users, including industrial consumers [
43]. The main objective of the end-user is the procurement of electricity for its own use at minimum cost. Suppliers in Croatia are divided into two categories [
20]:
market suppliers—suppliers that are not under public service obligation (sell electricity based on market principles),
regulated (last resort) supplier (for commercial and industrial consumers only)—supplier that is under public service obligation (sell electricity based on the price approved by HERA, while the price for households is not regulated).
The regulated supplier must sign a supply contract with all its end-users. The last resort supplier in Croatia is HEP ELEKTRA, Ltd. All end-users who are connected to the distribution network need to sign the use of network contract with HEP-DSO. Market suppliers can provide electricity to all end-users with whom they have signed a supply contract.
Further Steps in the Market Development
Introduction of an aggregator as a new market participant is important for further development of the electricity market in Croatia. Currently, the Act on Energy Efficiency provides only a definition of an aggregator, but energy legislation in Croatia does not recognize an aggregator as a market participant [
51]. In [
52], NordREG analyses different models for aggregation of demand response and describes the consequences for balancing groups with relation to settlement results. It concludes that aggregation arrangement “supplier and aggregator as one entity”, where supplier can offer aggregation services (demand response, energy or flexibility services provided by Distributed Energy Resources—DERs, etc.), is the most efficient solution for well-functioning markets. If the market is not sufficiently developed, like in the Croatian case, NordREG suggests introducing another aggregation arrangement—“Independent aggregator and a supplier with balancing responsibility at the same connection point—with adjustment of imbalances and reimbursement of sourcing costs”. This aggregation arrangement would require a split and separation of the balancing responsibility and needs to set up a compensating financial transfer mechanism. Aggregators would become additional entities in the market, which means that market concentration would decrease and the liquidity of the market would increase. This arrangement for aggregators also implies the existence of additional administrative costs related to the establishment of the regulated framework for aggregation.
Although it is not explicitly stated, the provision of aggregation services would require the roll-out of smart meters, which is currently not the case in Croatia.
Keeping all aspects of the electricity market in mind, it is not straightforward to choose which aggregation arrangement is best suited for Croatia. For the time being, this question will remain without answer and is a topic for further research.
9. Discussion and Conclusions
This paper provided a comprehensive overview of the electricity market design in Croatia and identified key obstacles that hamper the development of a well-functioning electricity market in Croatia and its further integration into IEM. Key obstacles that need to be resolved for the further development of the electricity market in Croatia are:
market coupling with neighbouring power exchanges (BSP SouthPool and HUPX) is still not conducted;
secondary legislation, which is necessary for establishment of Market Premium support scheme, has not been adopted yet;
ECO-BG is still not operational;
BM exists on paper, but is still not operational, while for further market development it is necessary that the BM become fully operational as soon as possible;
aggregation services do not exist.
Apart from these obstacles, there are other problems that are caused by these obstacles. The main additional problem caused by the non-existence of aggregation services is that micro- to medium-sized power plants (DERs) do not provide ancillary services in practice, although energy legislation does not prohibit them from providing this type of services. Also, the roll-out of smart meters, which is a prerequisite for the introduction of aggregation services, is still not conducted on a large scale in Croatia.
However, a positive step toward further market development in Croatia is the introduction of IM at CROPEX. Also, all the obstacles except for aggregation services should be resolved during 2018.
On the basis of the data available in this paper, key indicators that show current electricity market development level in Croatia are summarized and listed in
Table 8.
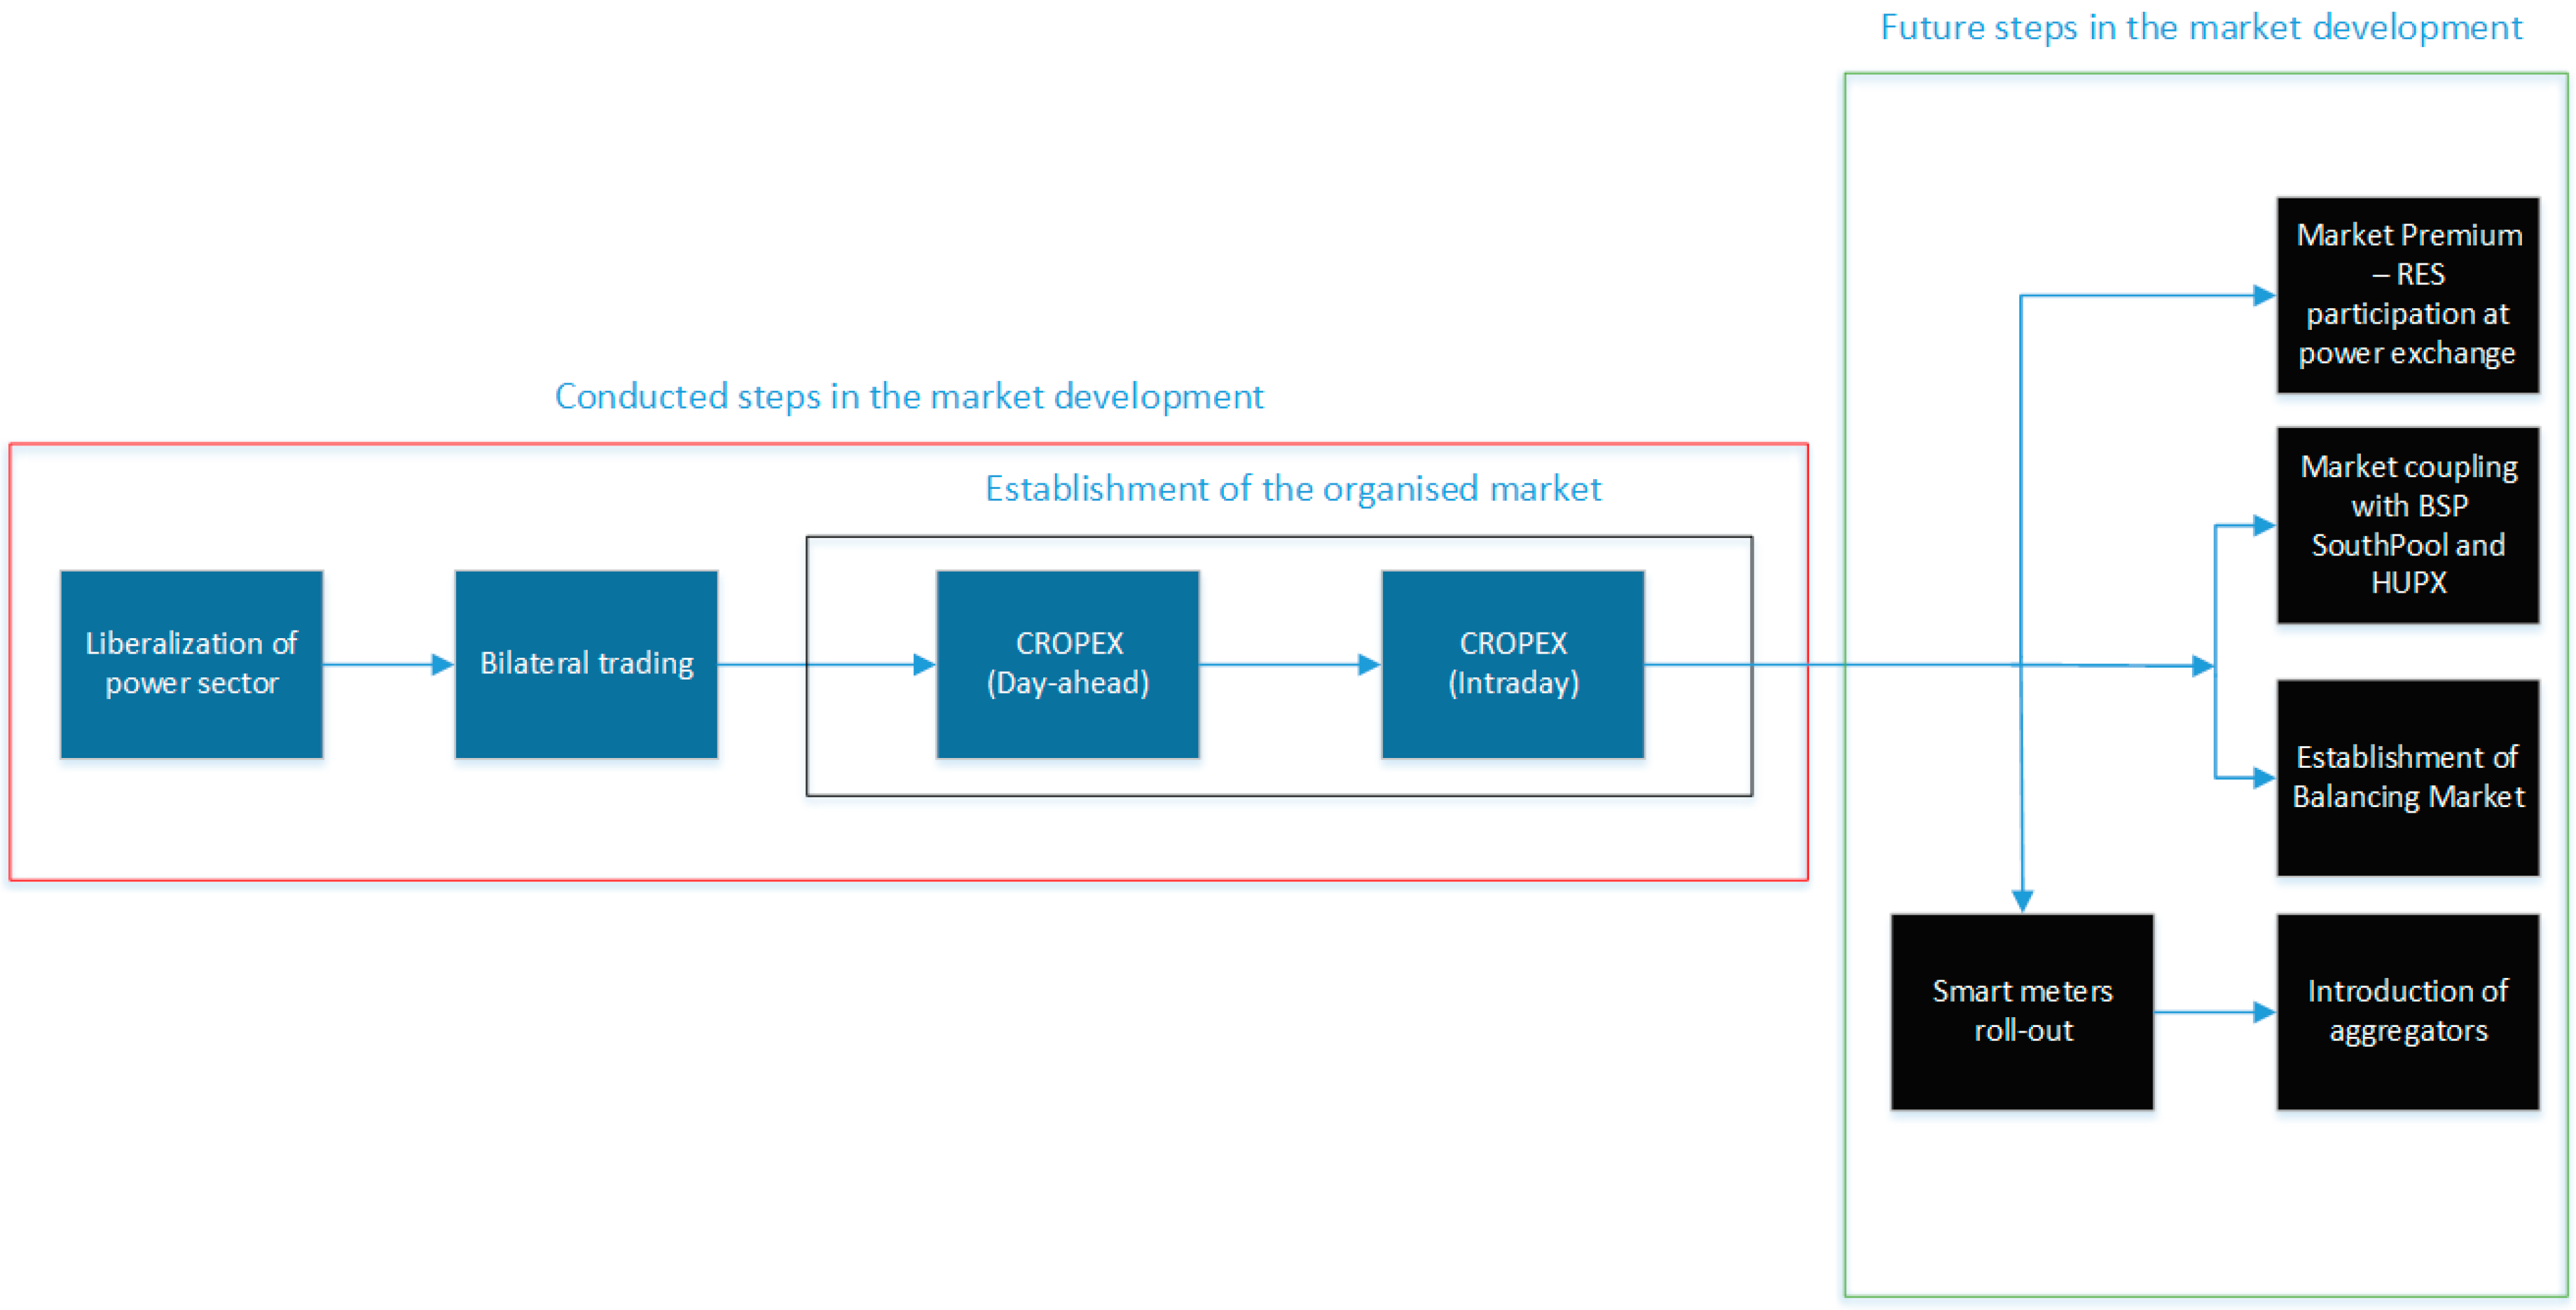
One of the most important objectives of the European Union is the creation of an Internal Electricity Market in Europe. Various national electricity market designs represent one of the major obstacles to the creation of IEM and it is necessary to coordinate national market designs among Member States in order to achieve that. The main purpose of this paper was to provide information regarding market design and to identify key obstacles that hamper the development of the market in Croatia and in this way, contribute to the creation of an IEM.
Figure 7 shows a diagram that clearly separates the steps of market development and future steps that need to be conducted in order to create a well-functioning market in Croatia.


