Cyber-Attacks on Smart Meters in Household Nanogrid: Modeling, Simulation and Analysis


Abstract
:1. Introduction
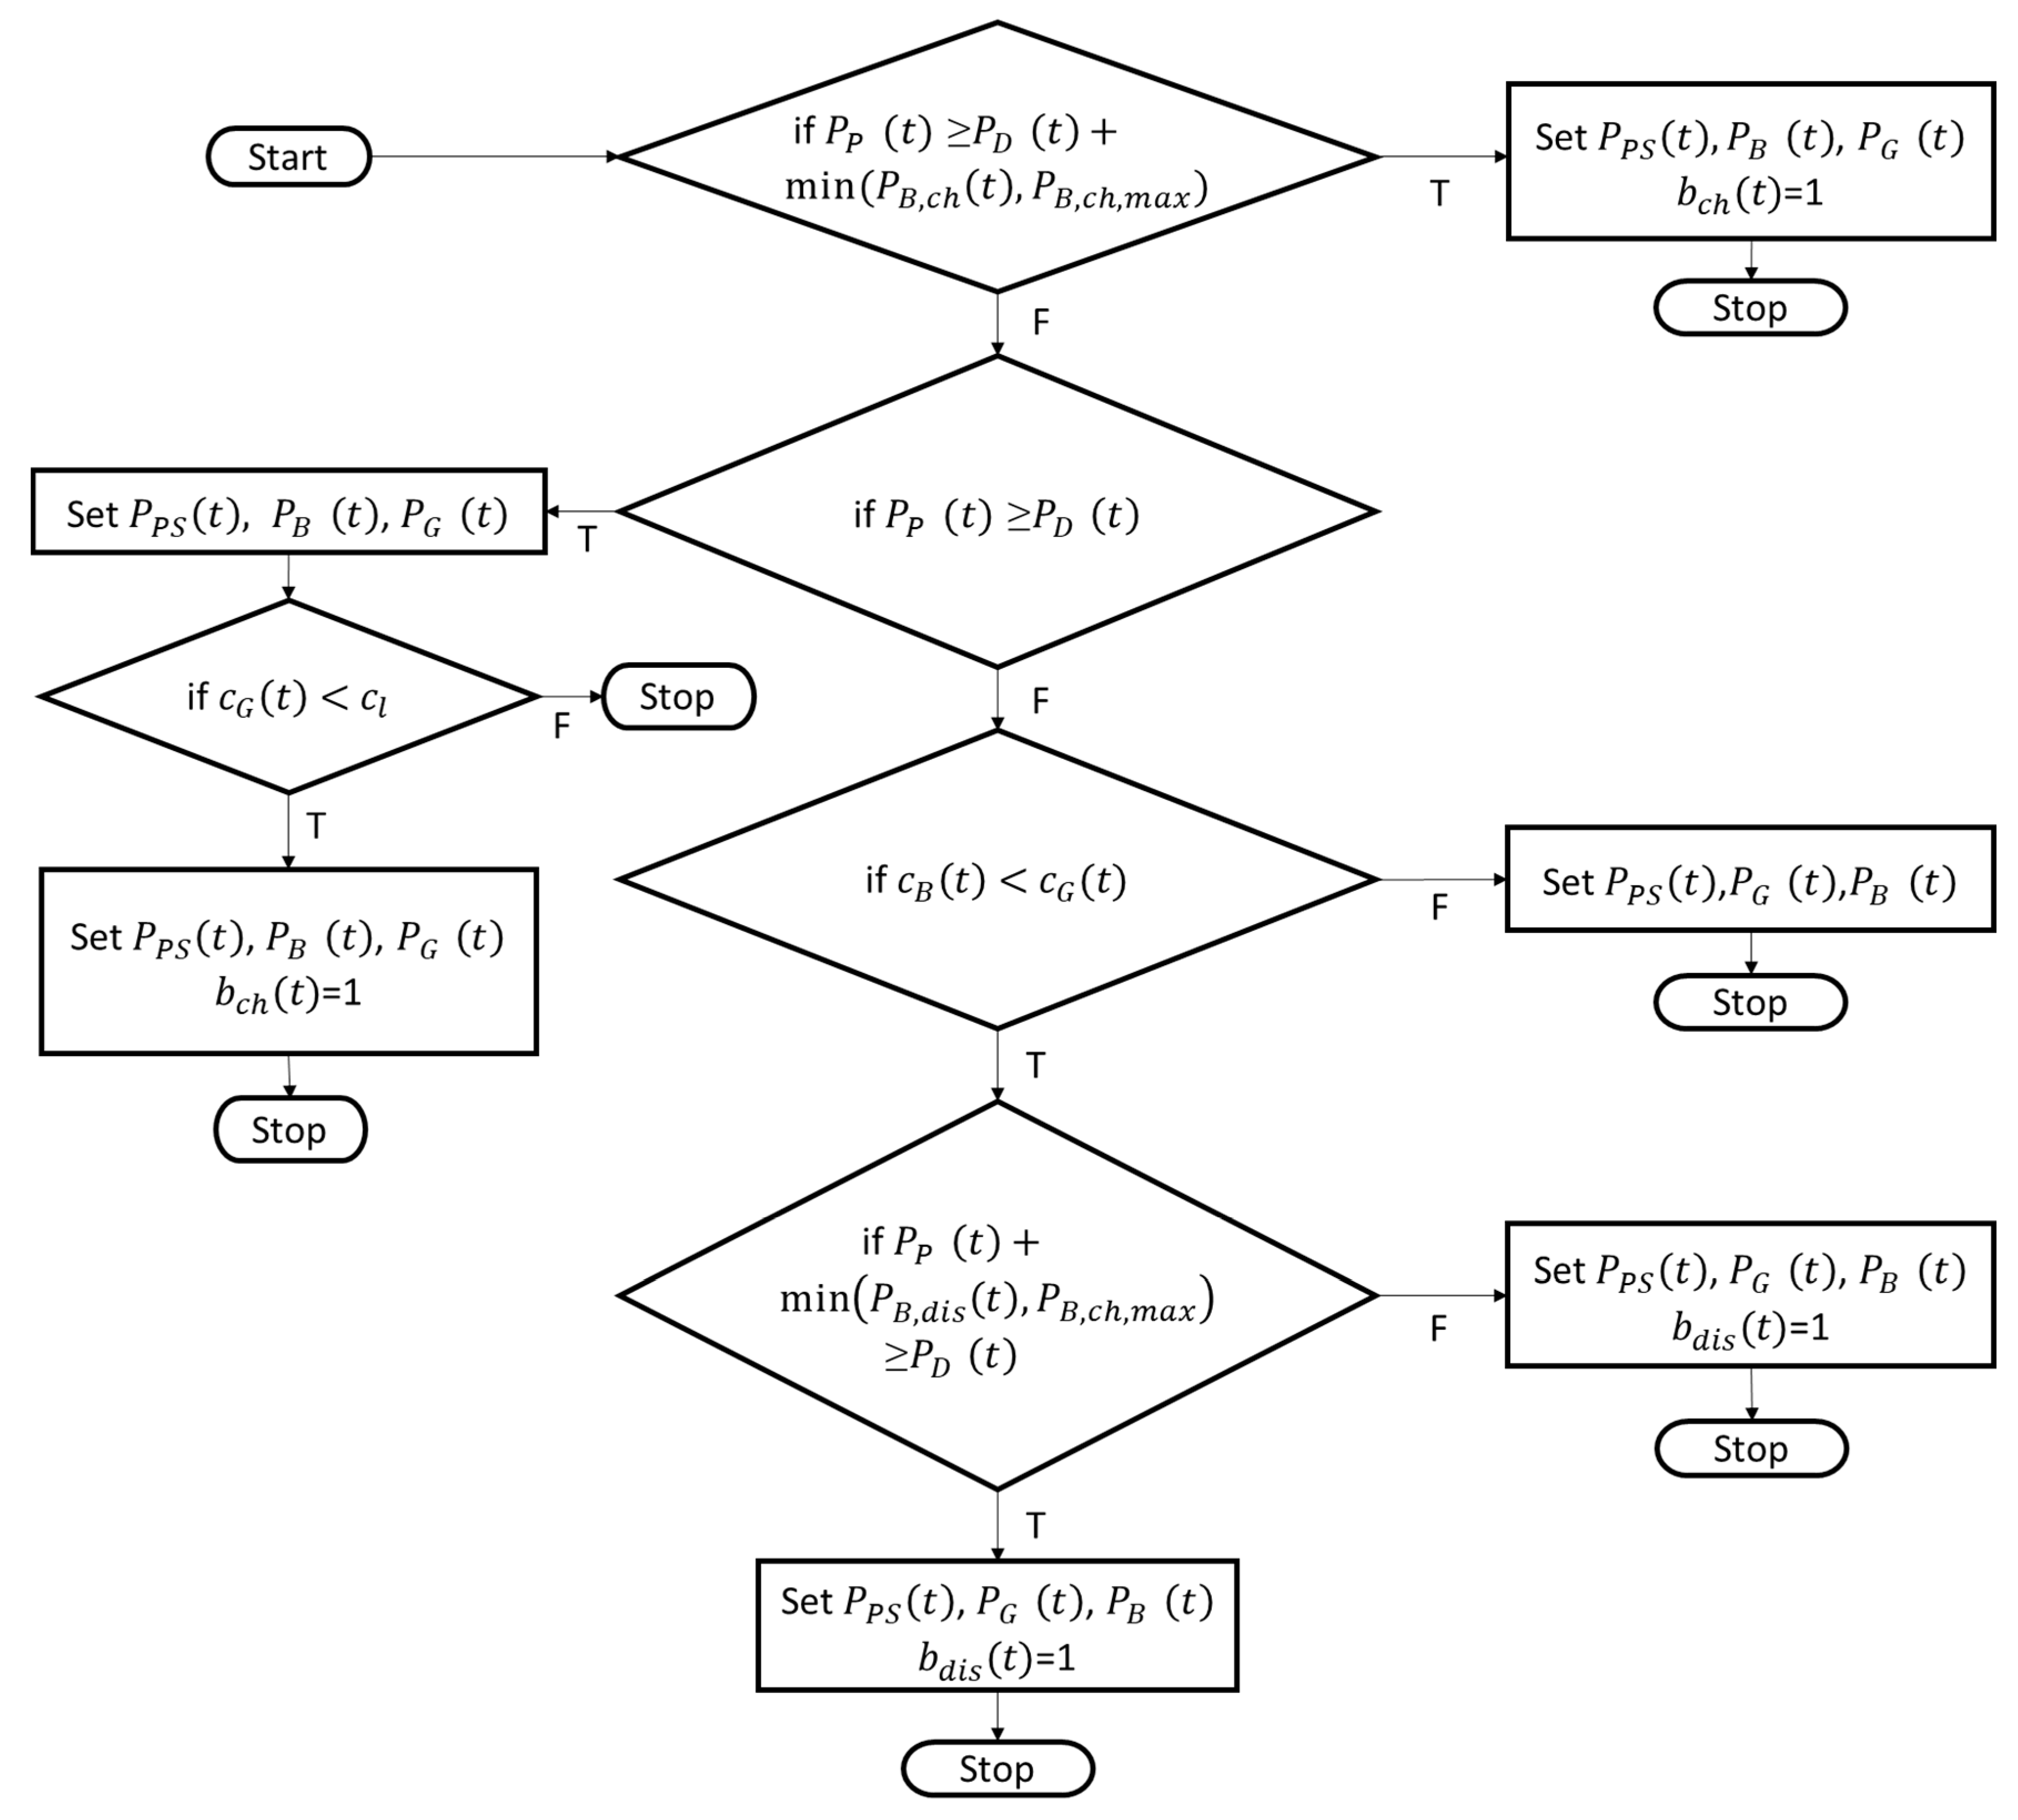
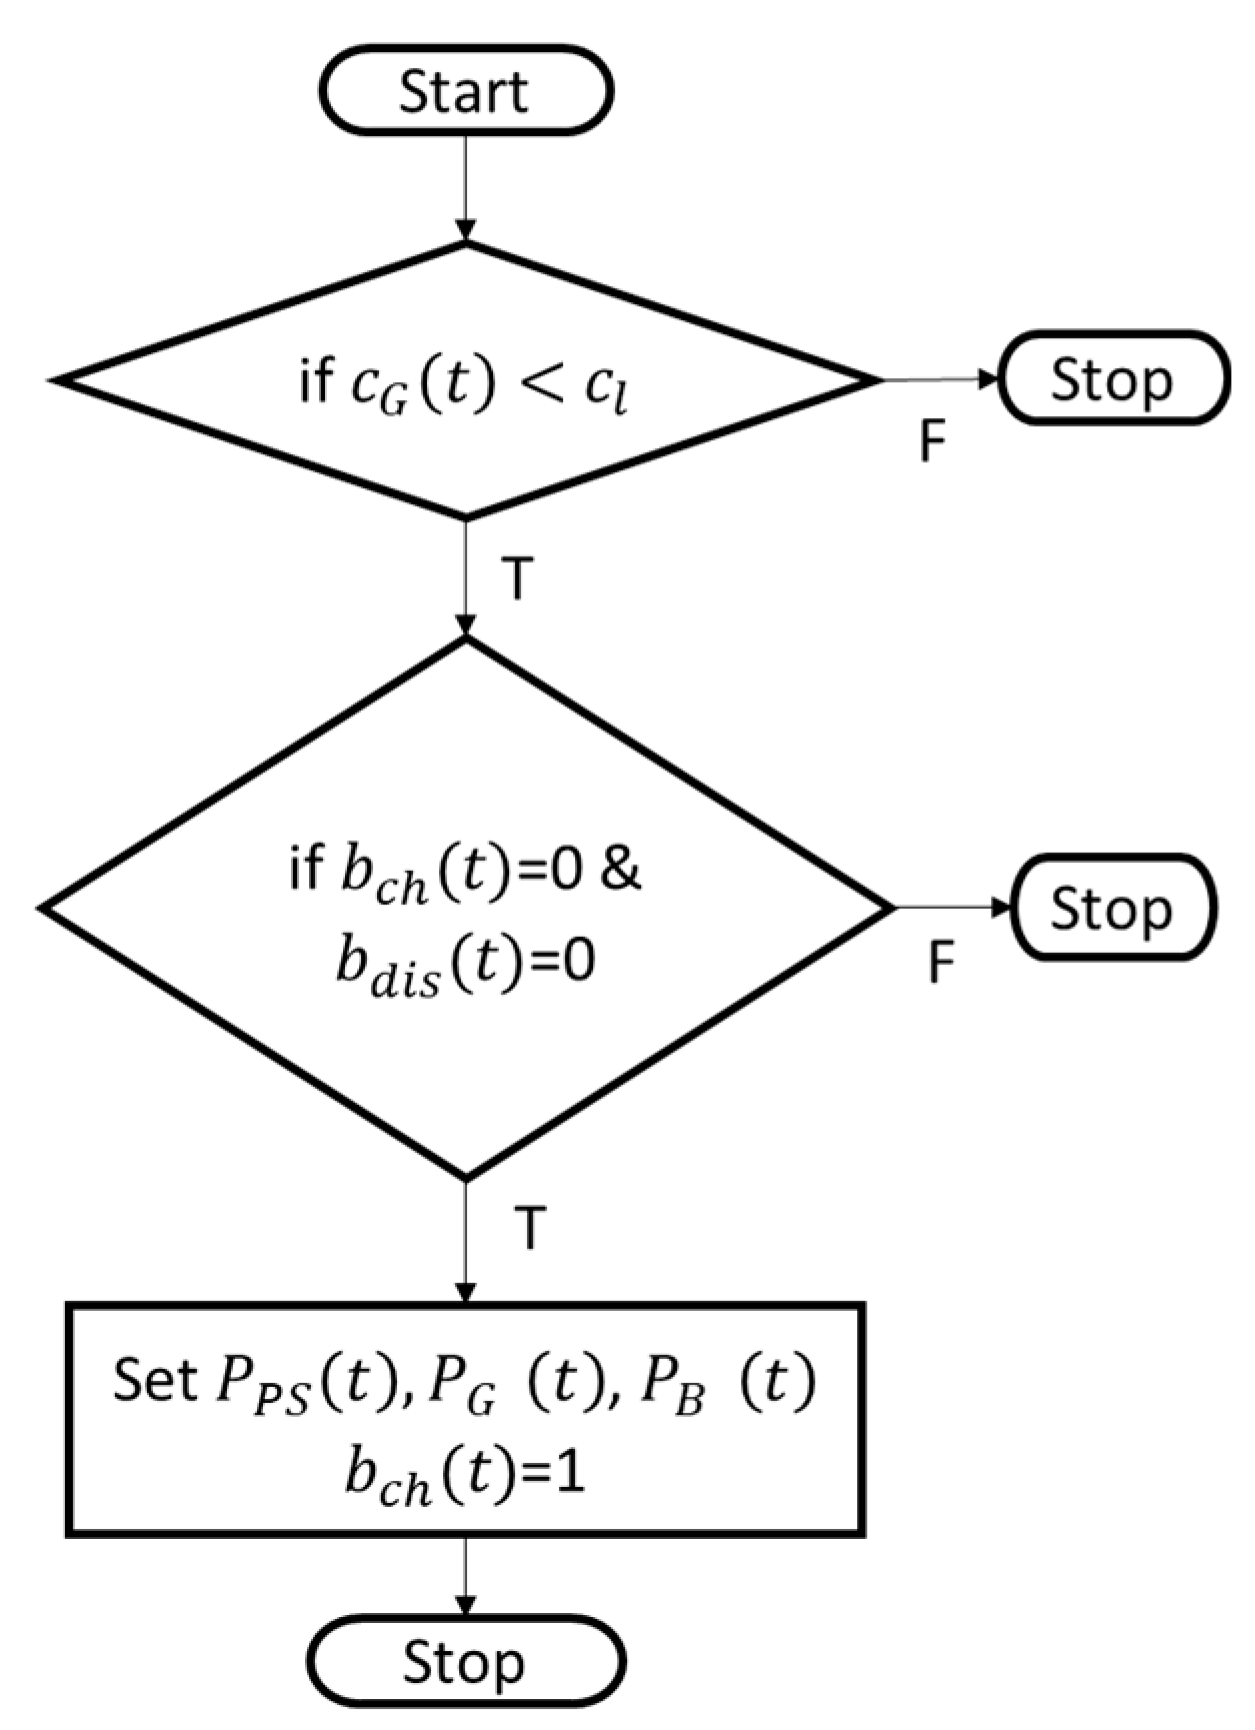
2. Modelling
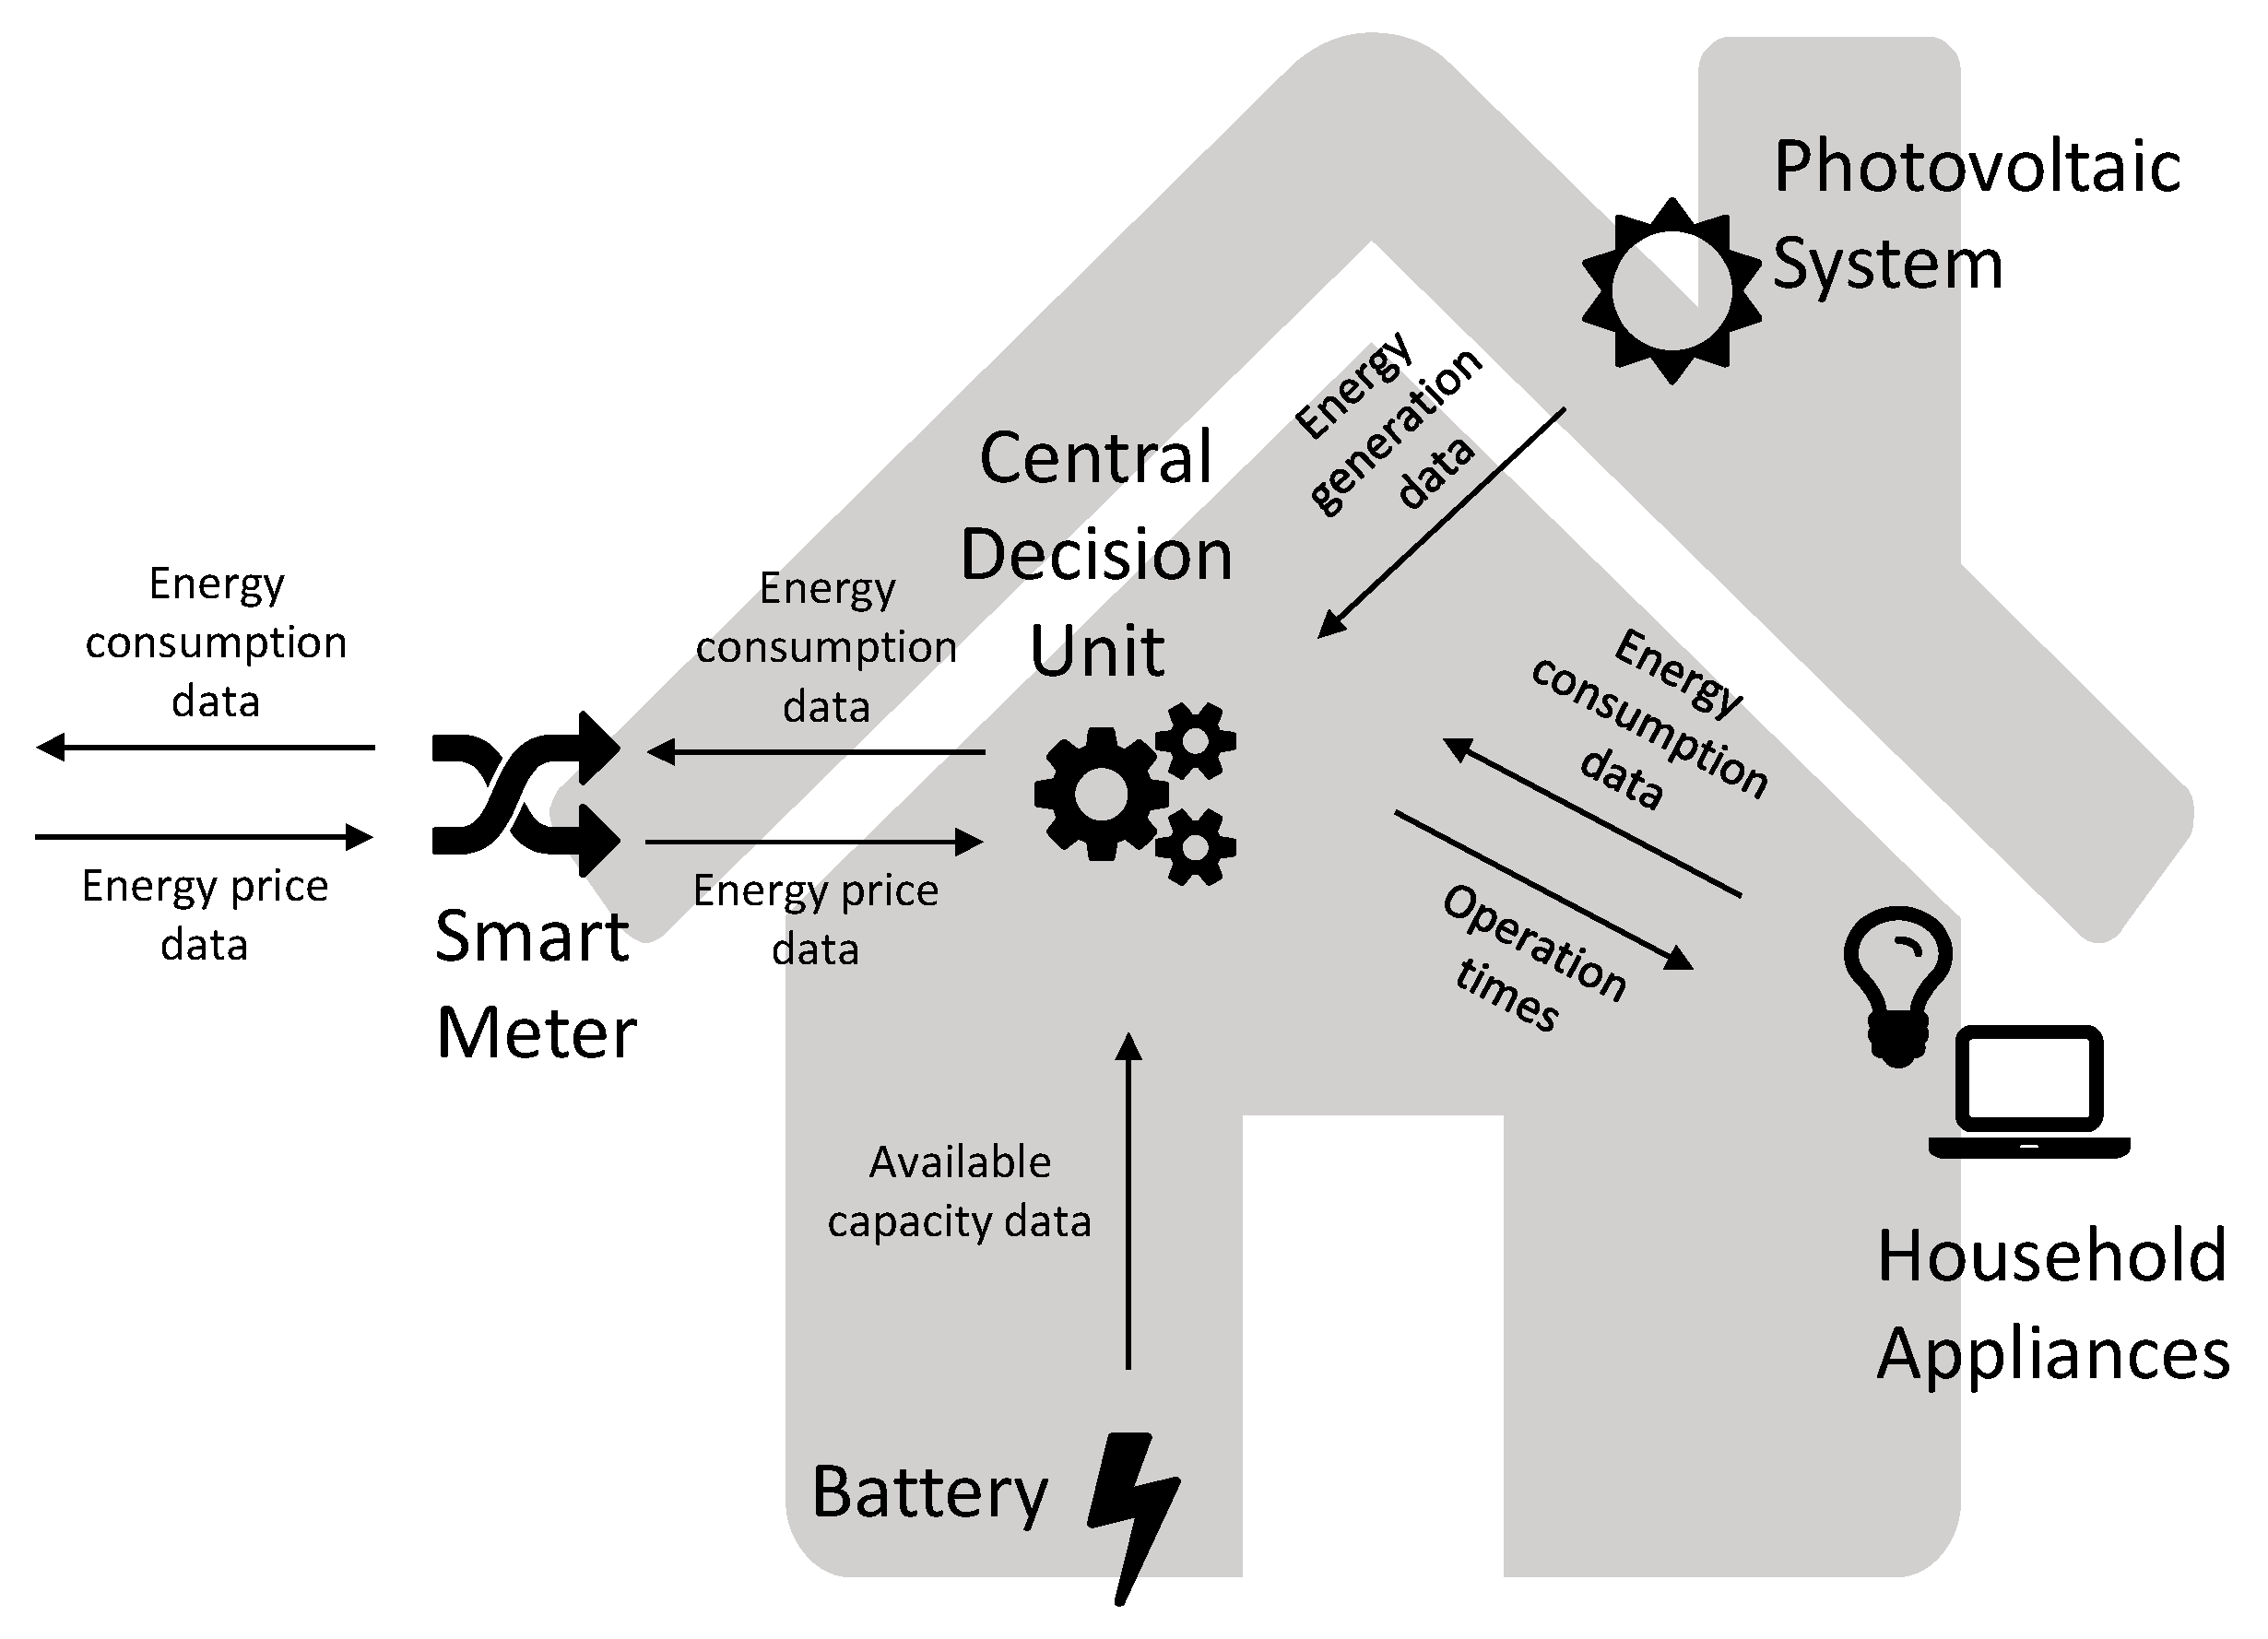
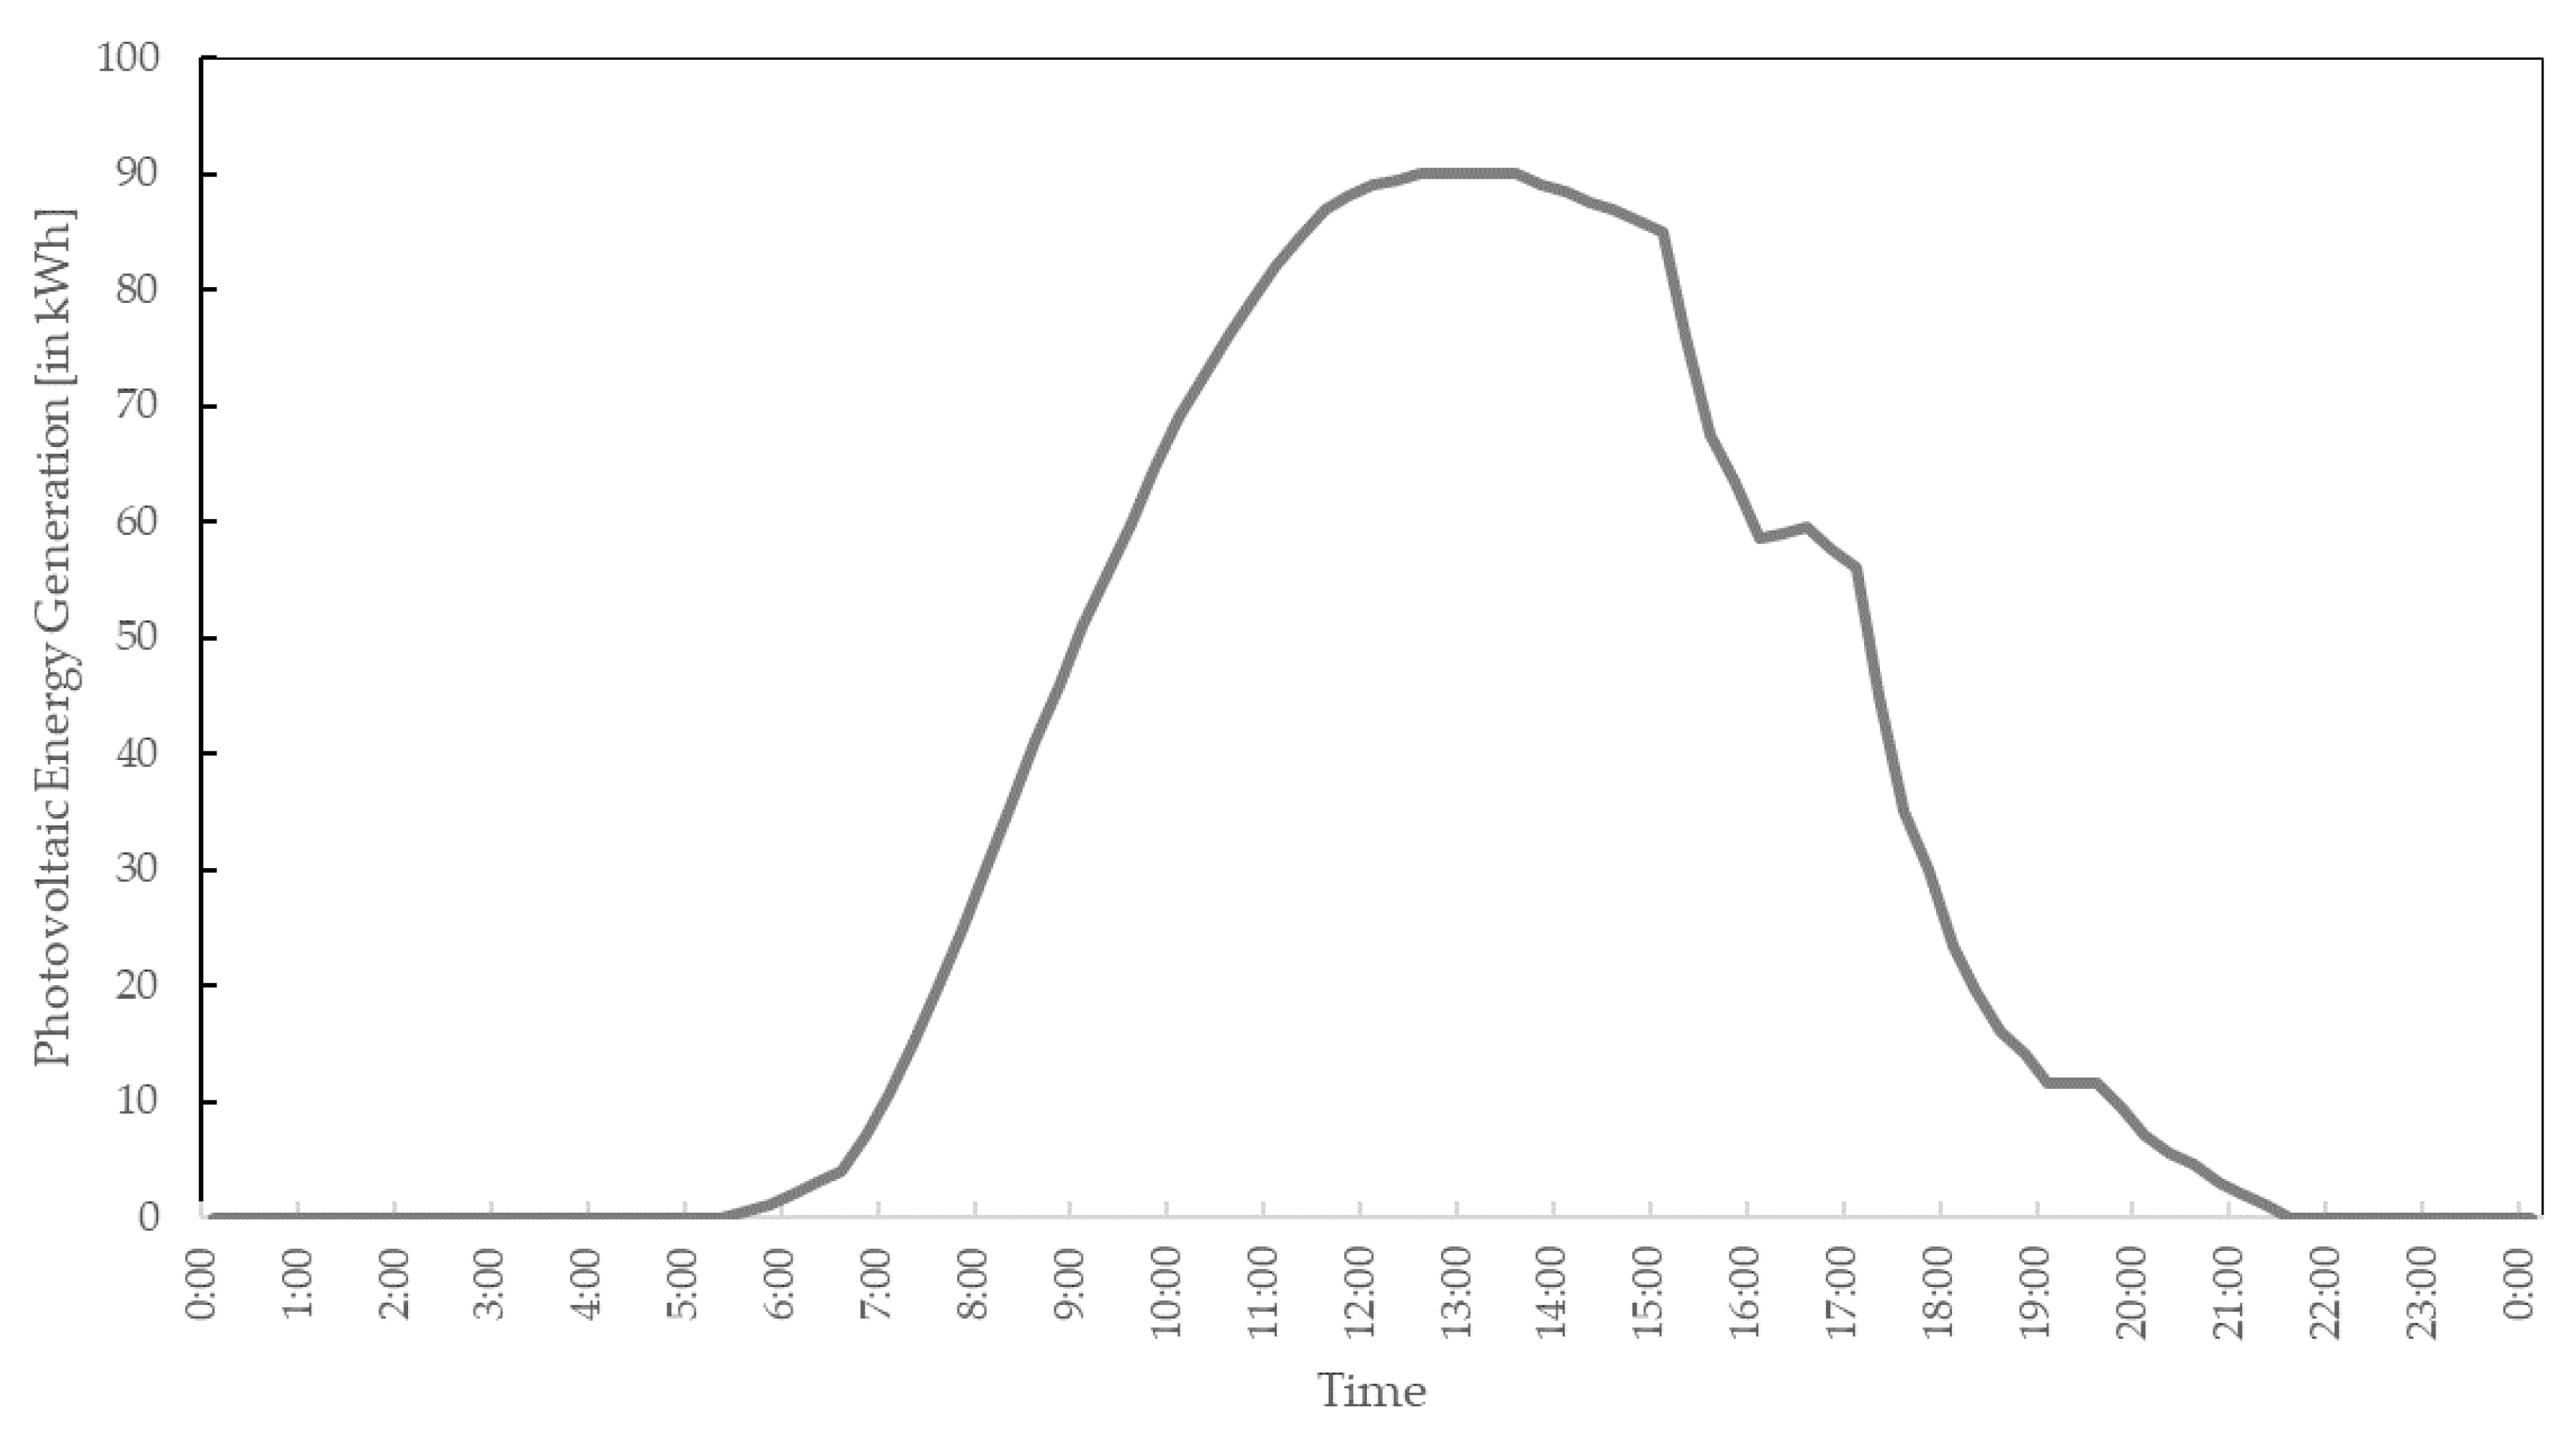
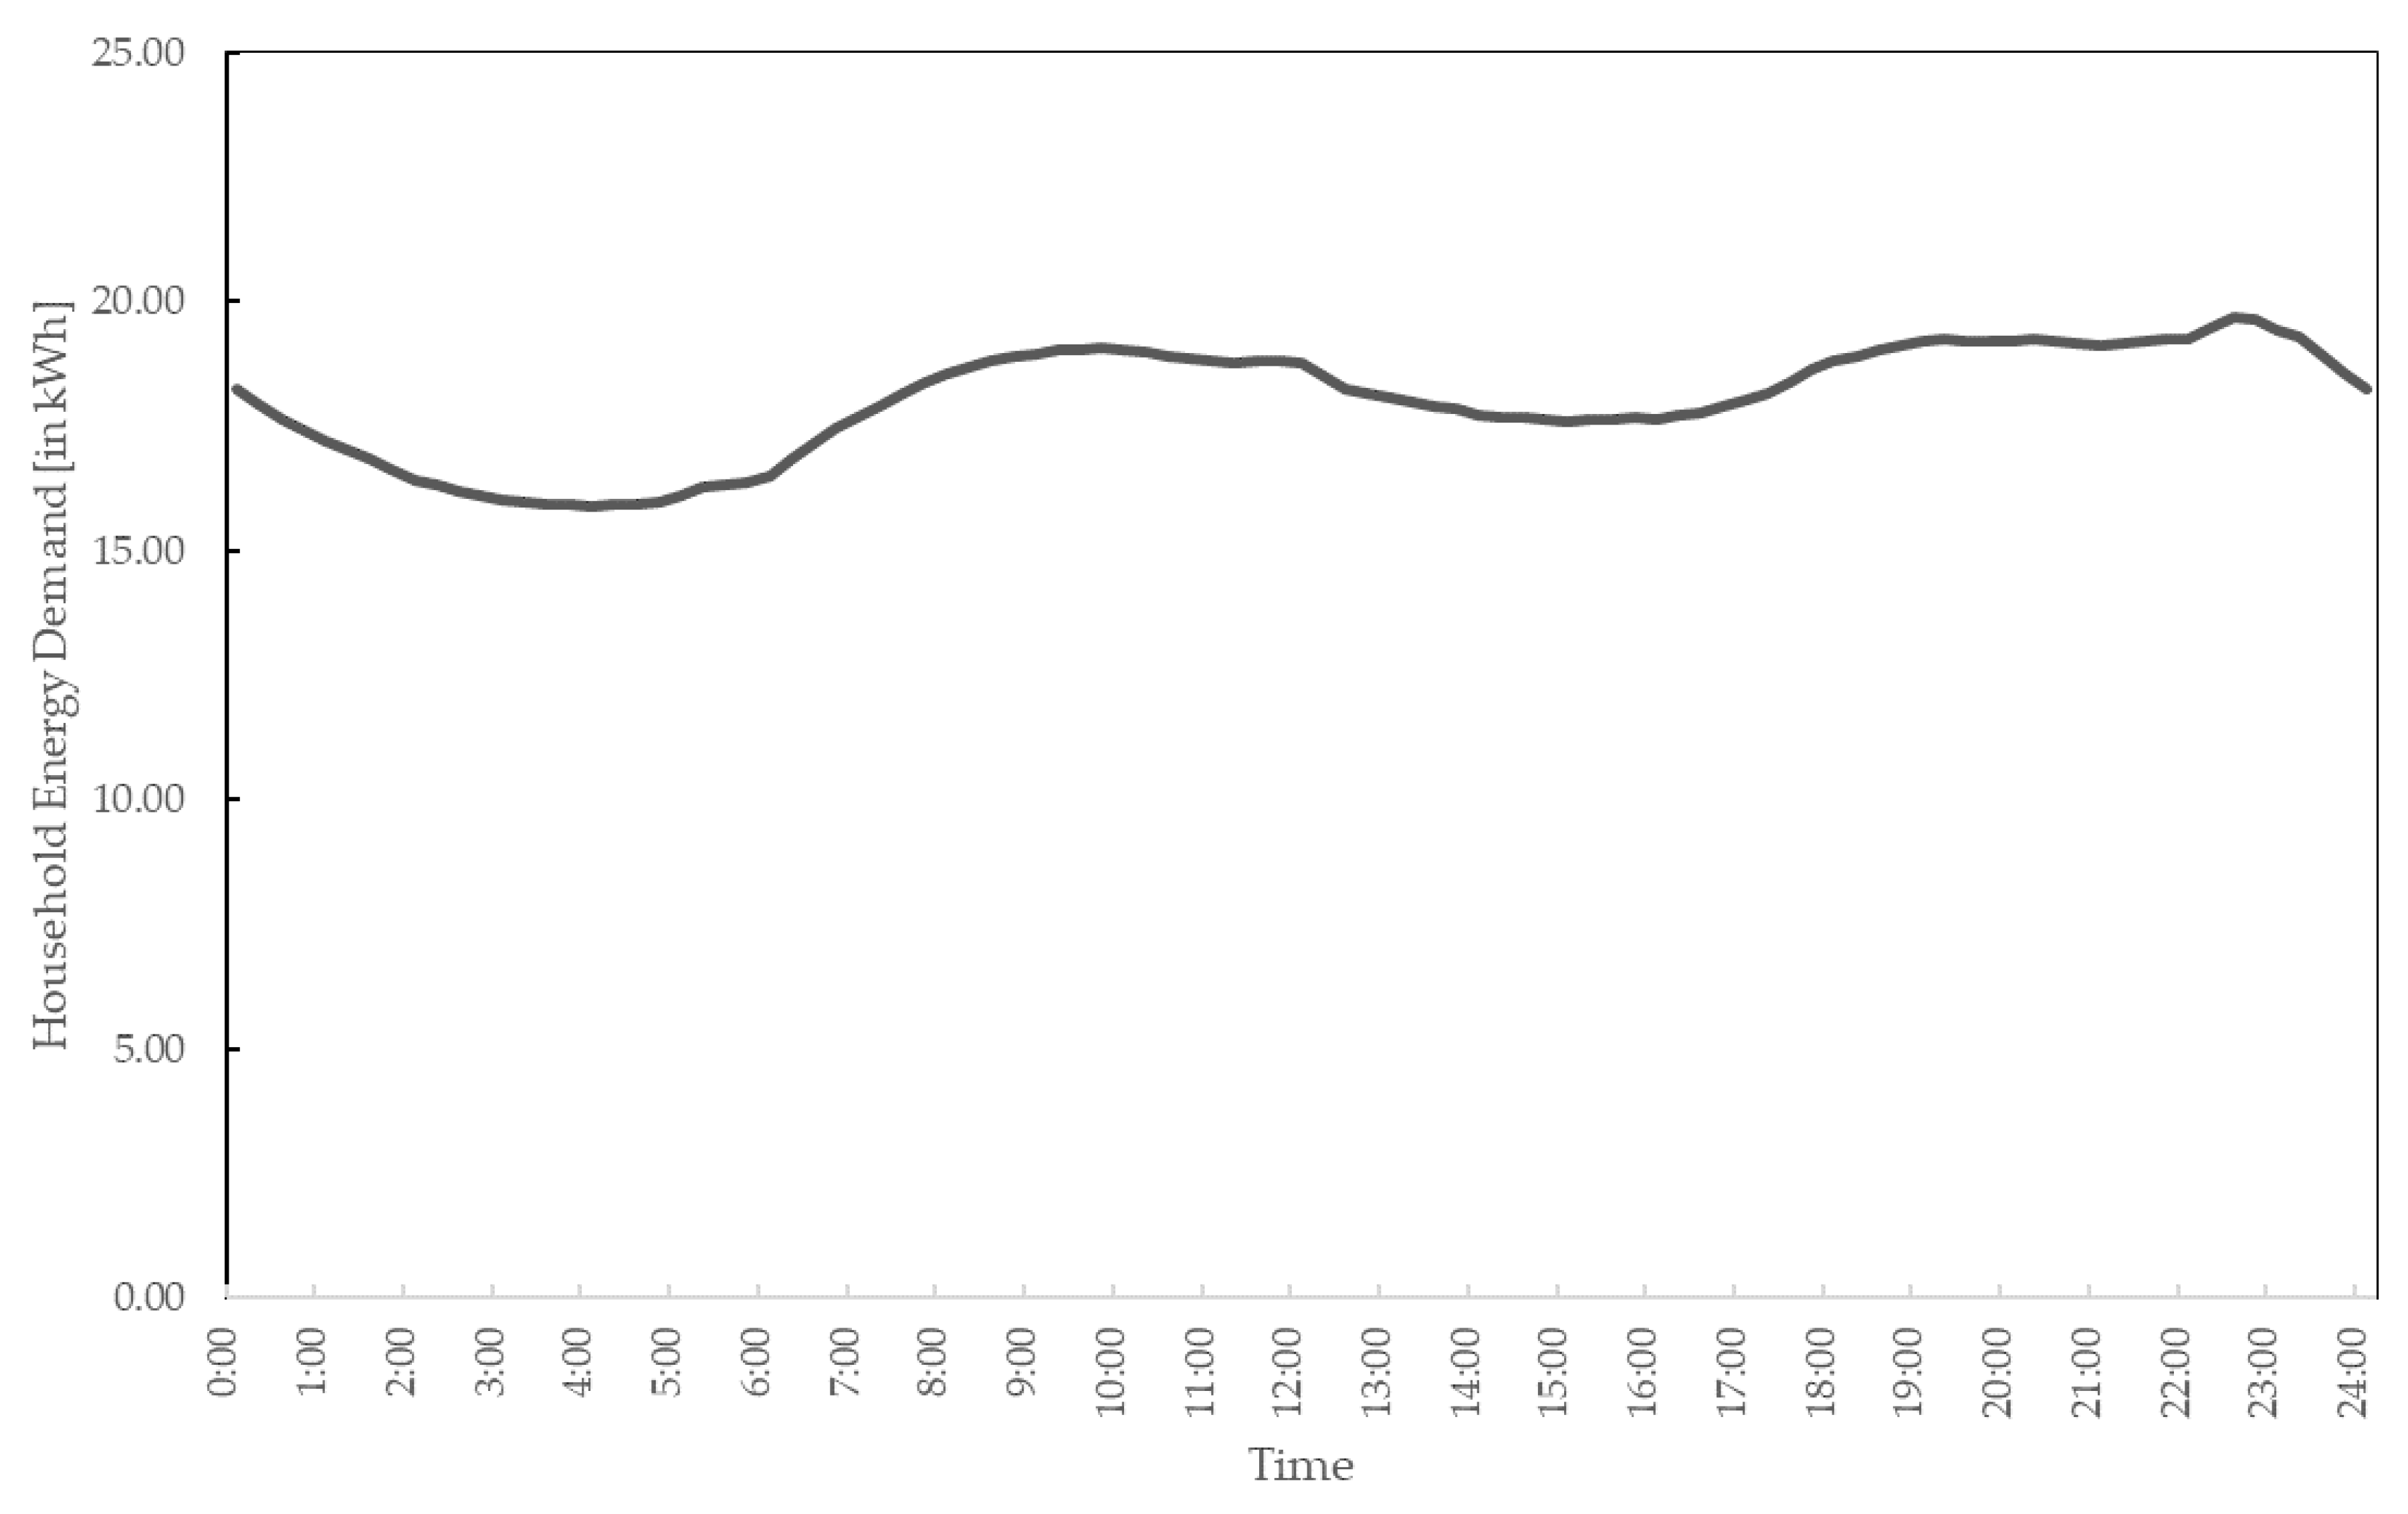
2.1. Household Nanogrid
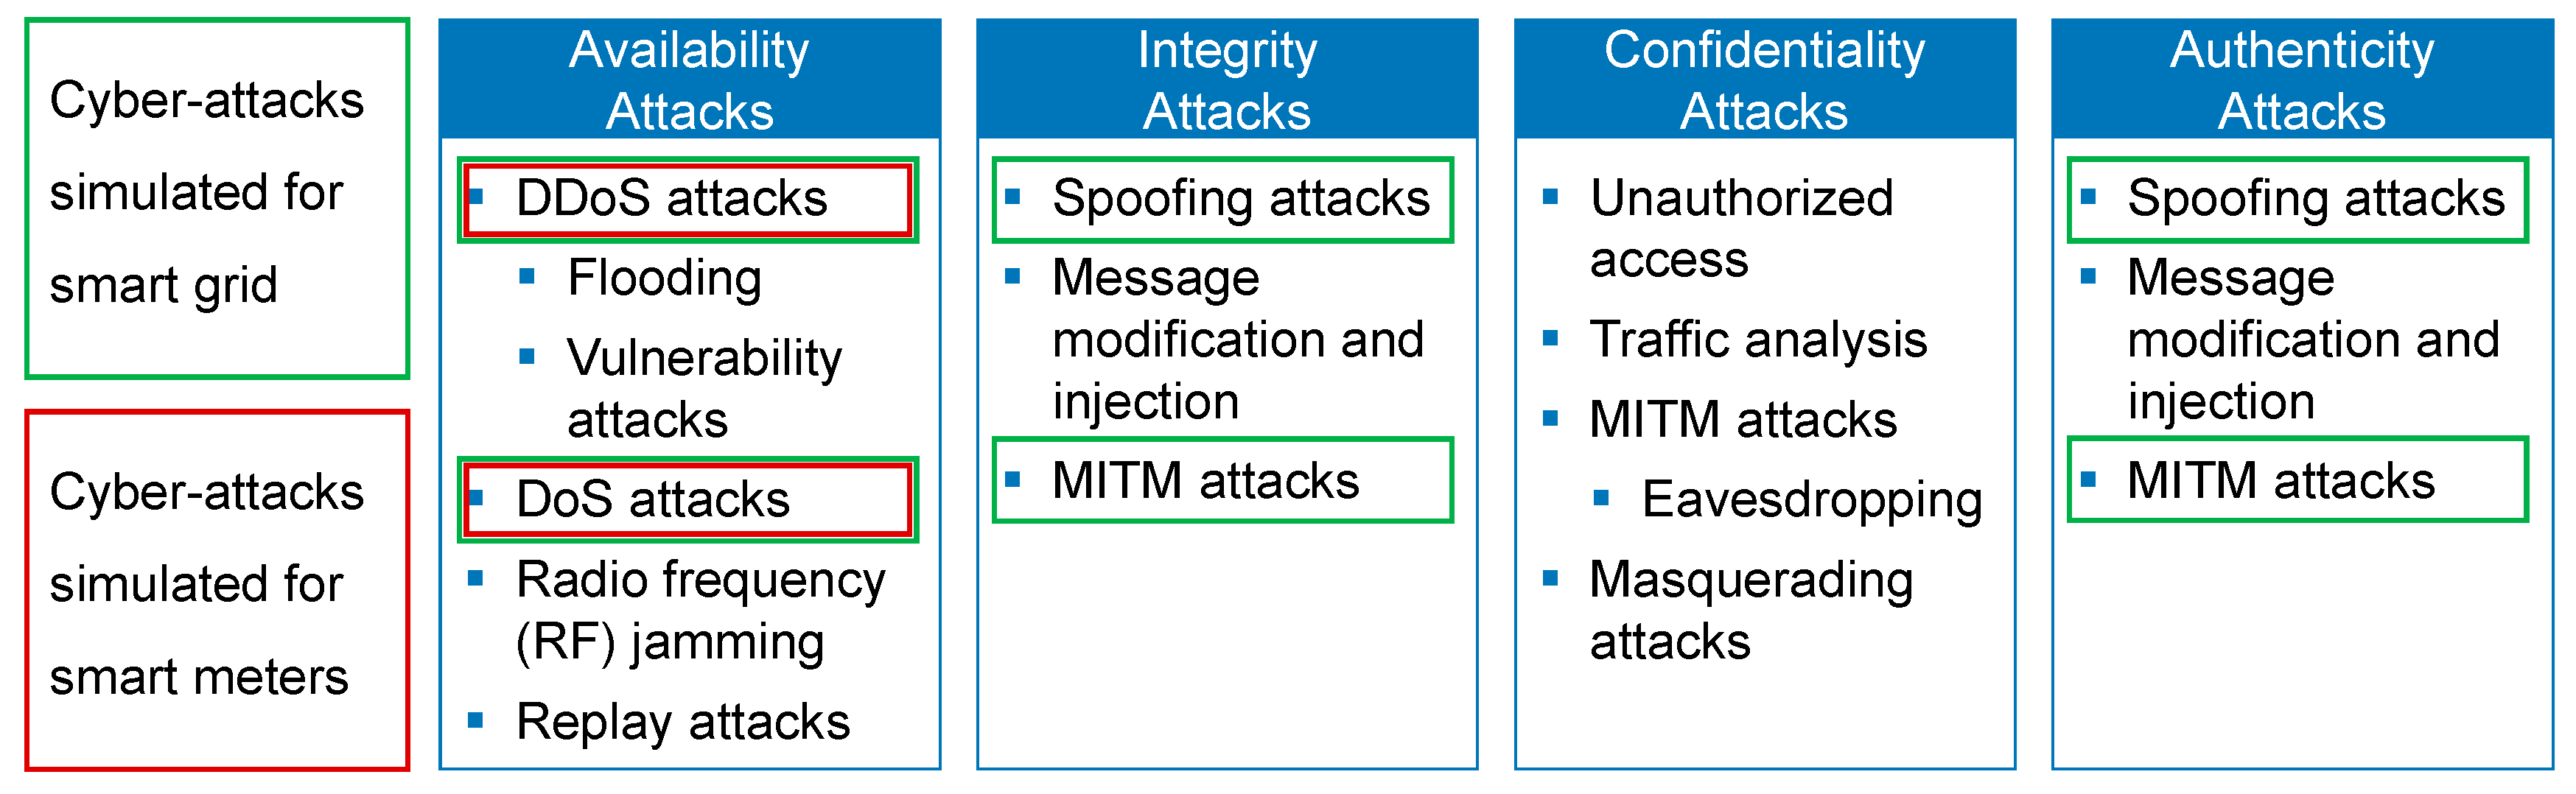
2.2. Cyber-Attacks
3. Simulation
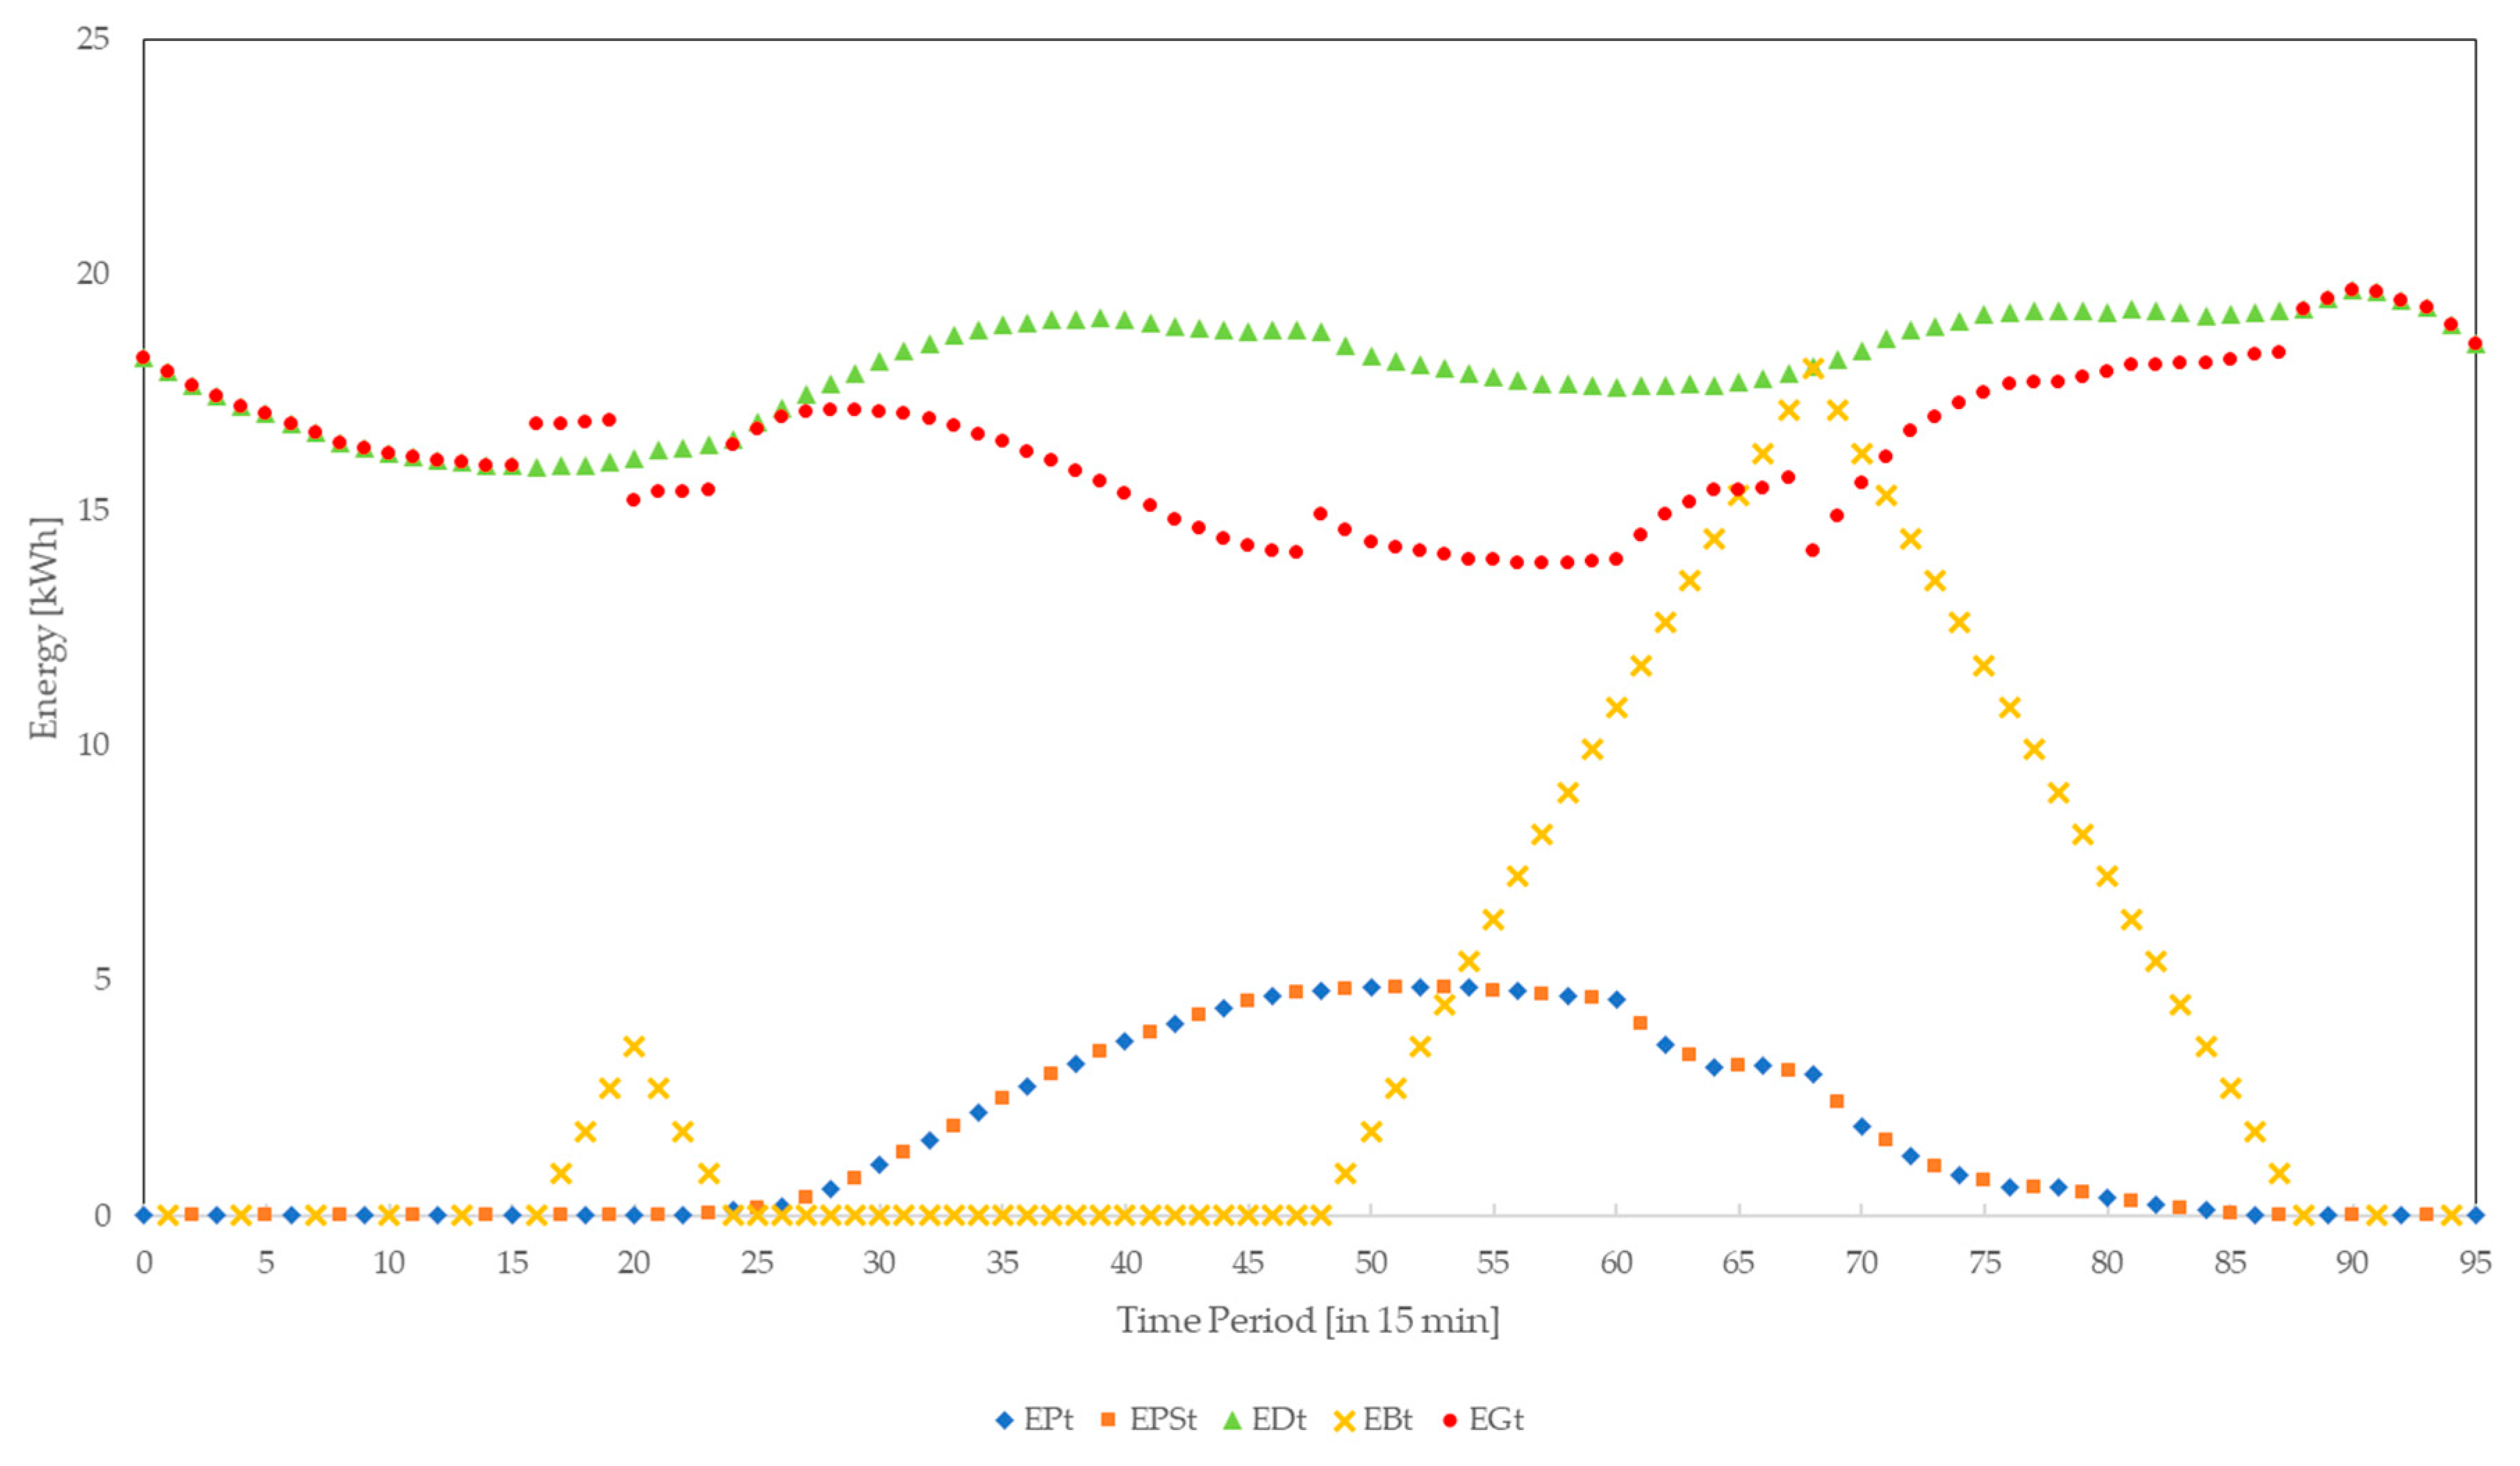
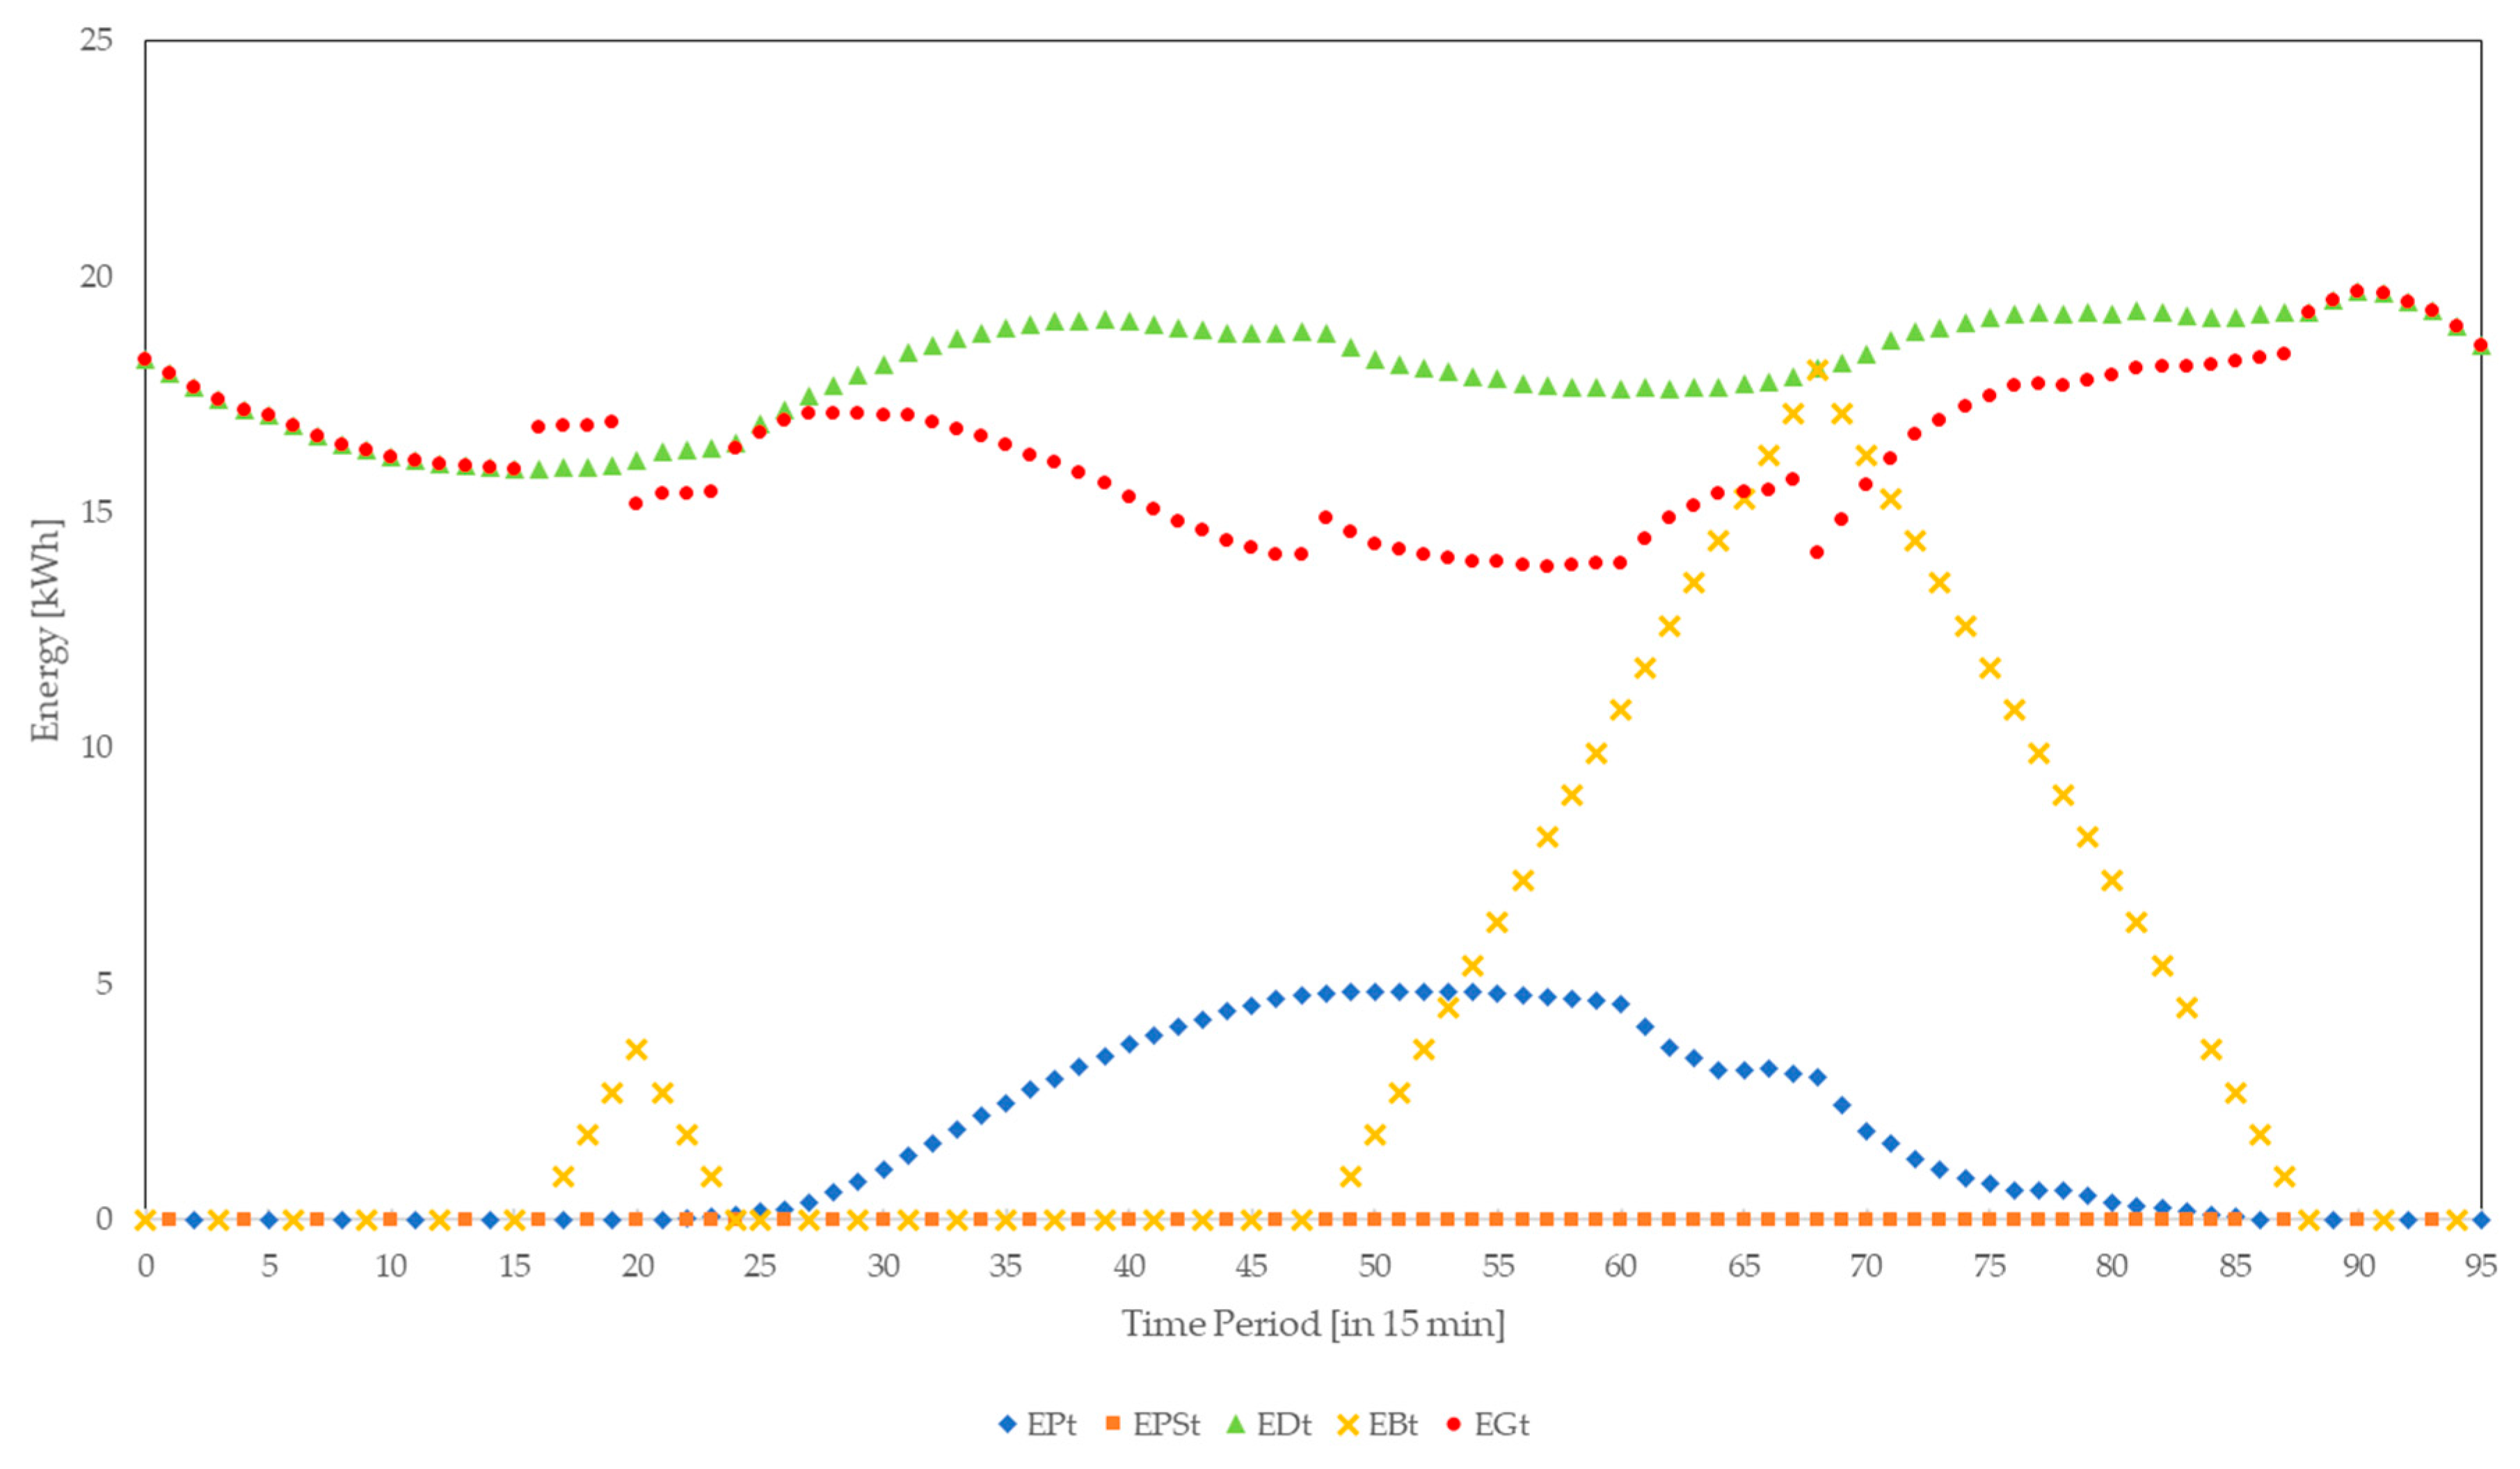
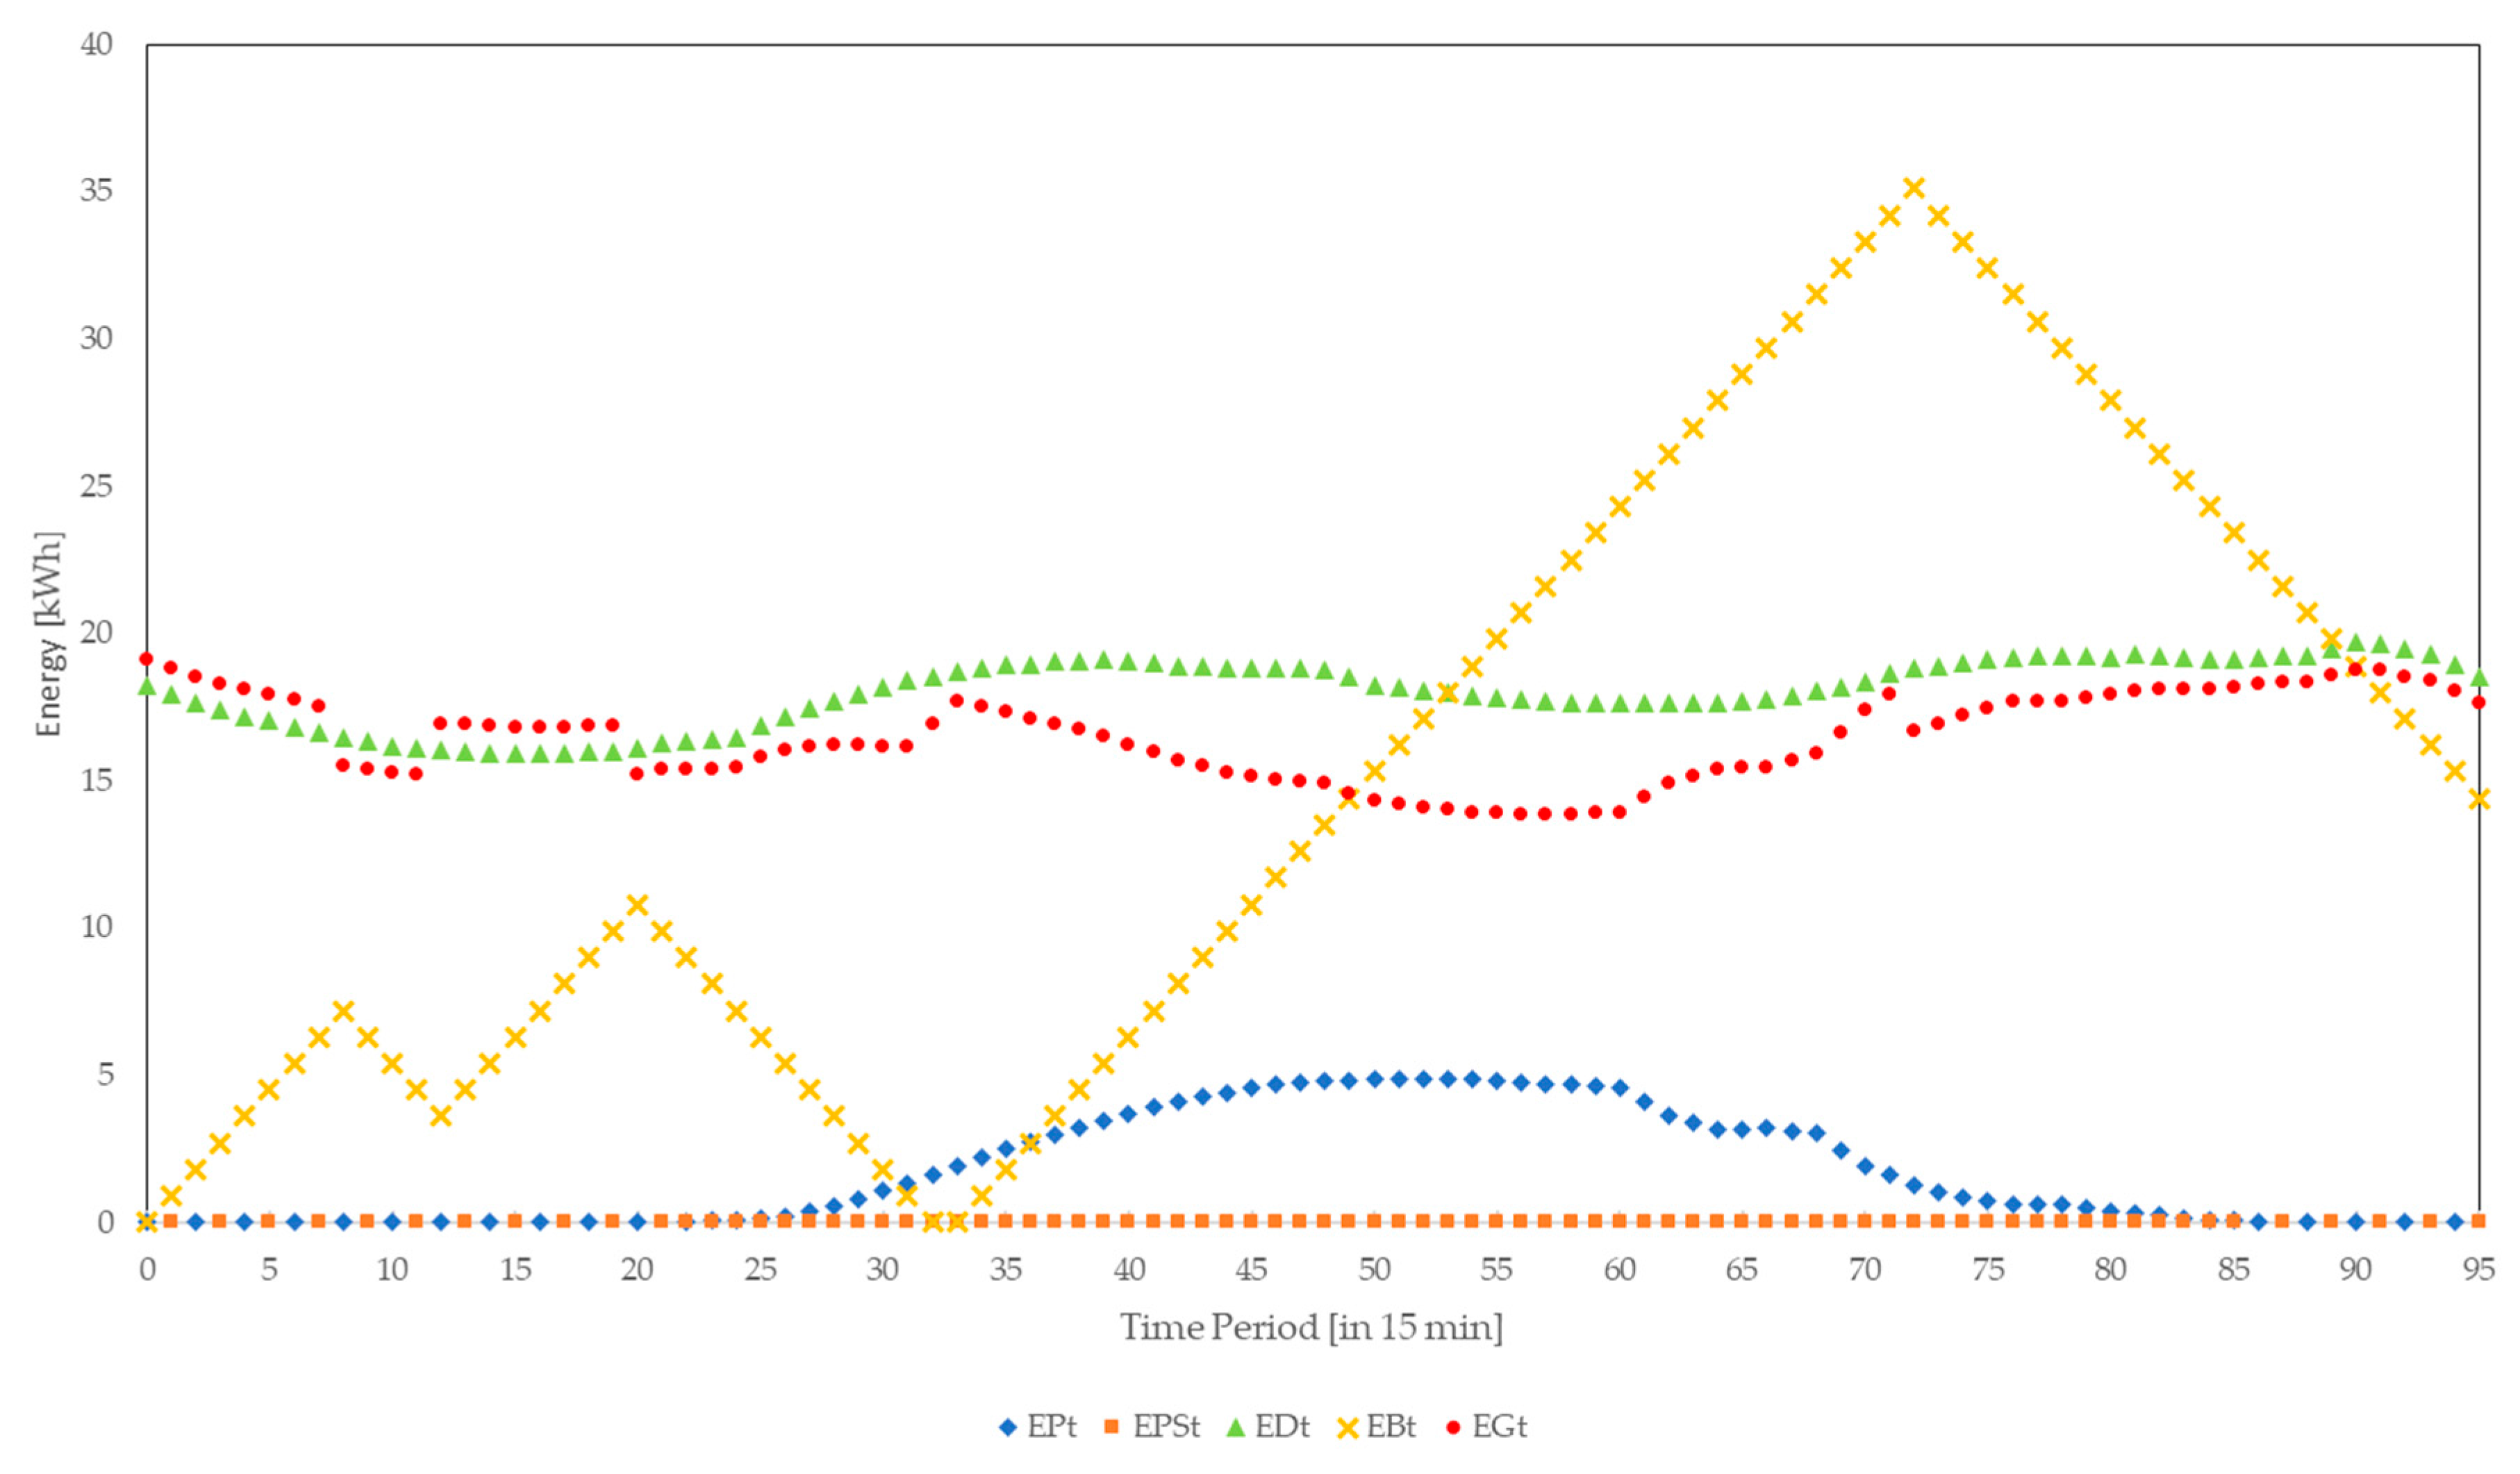
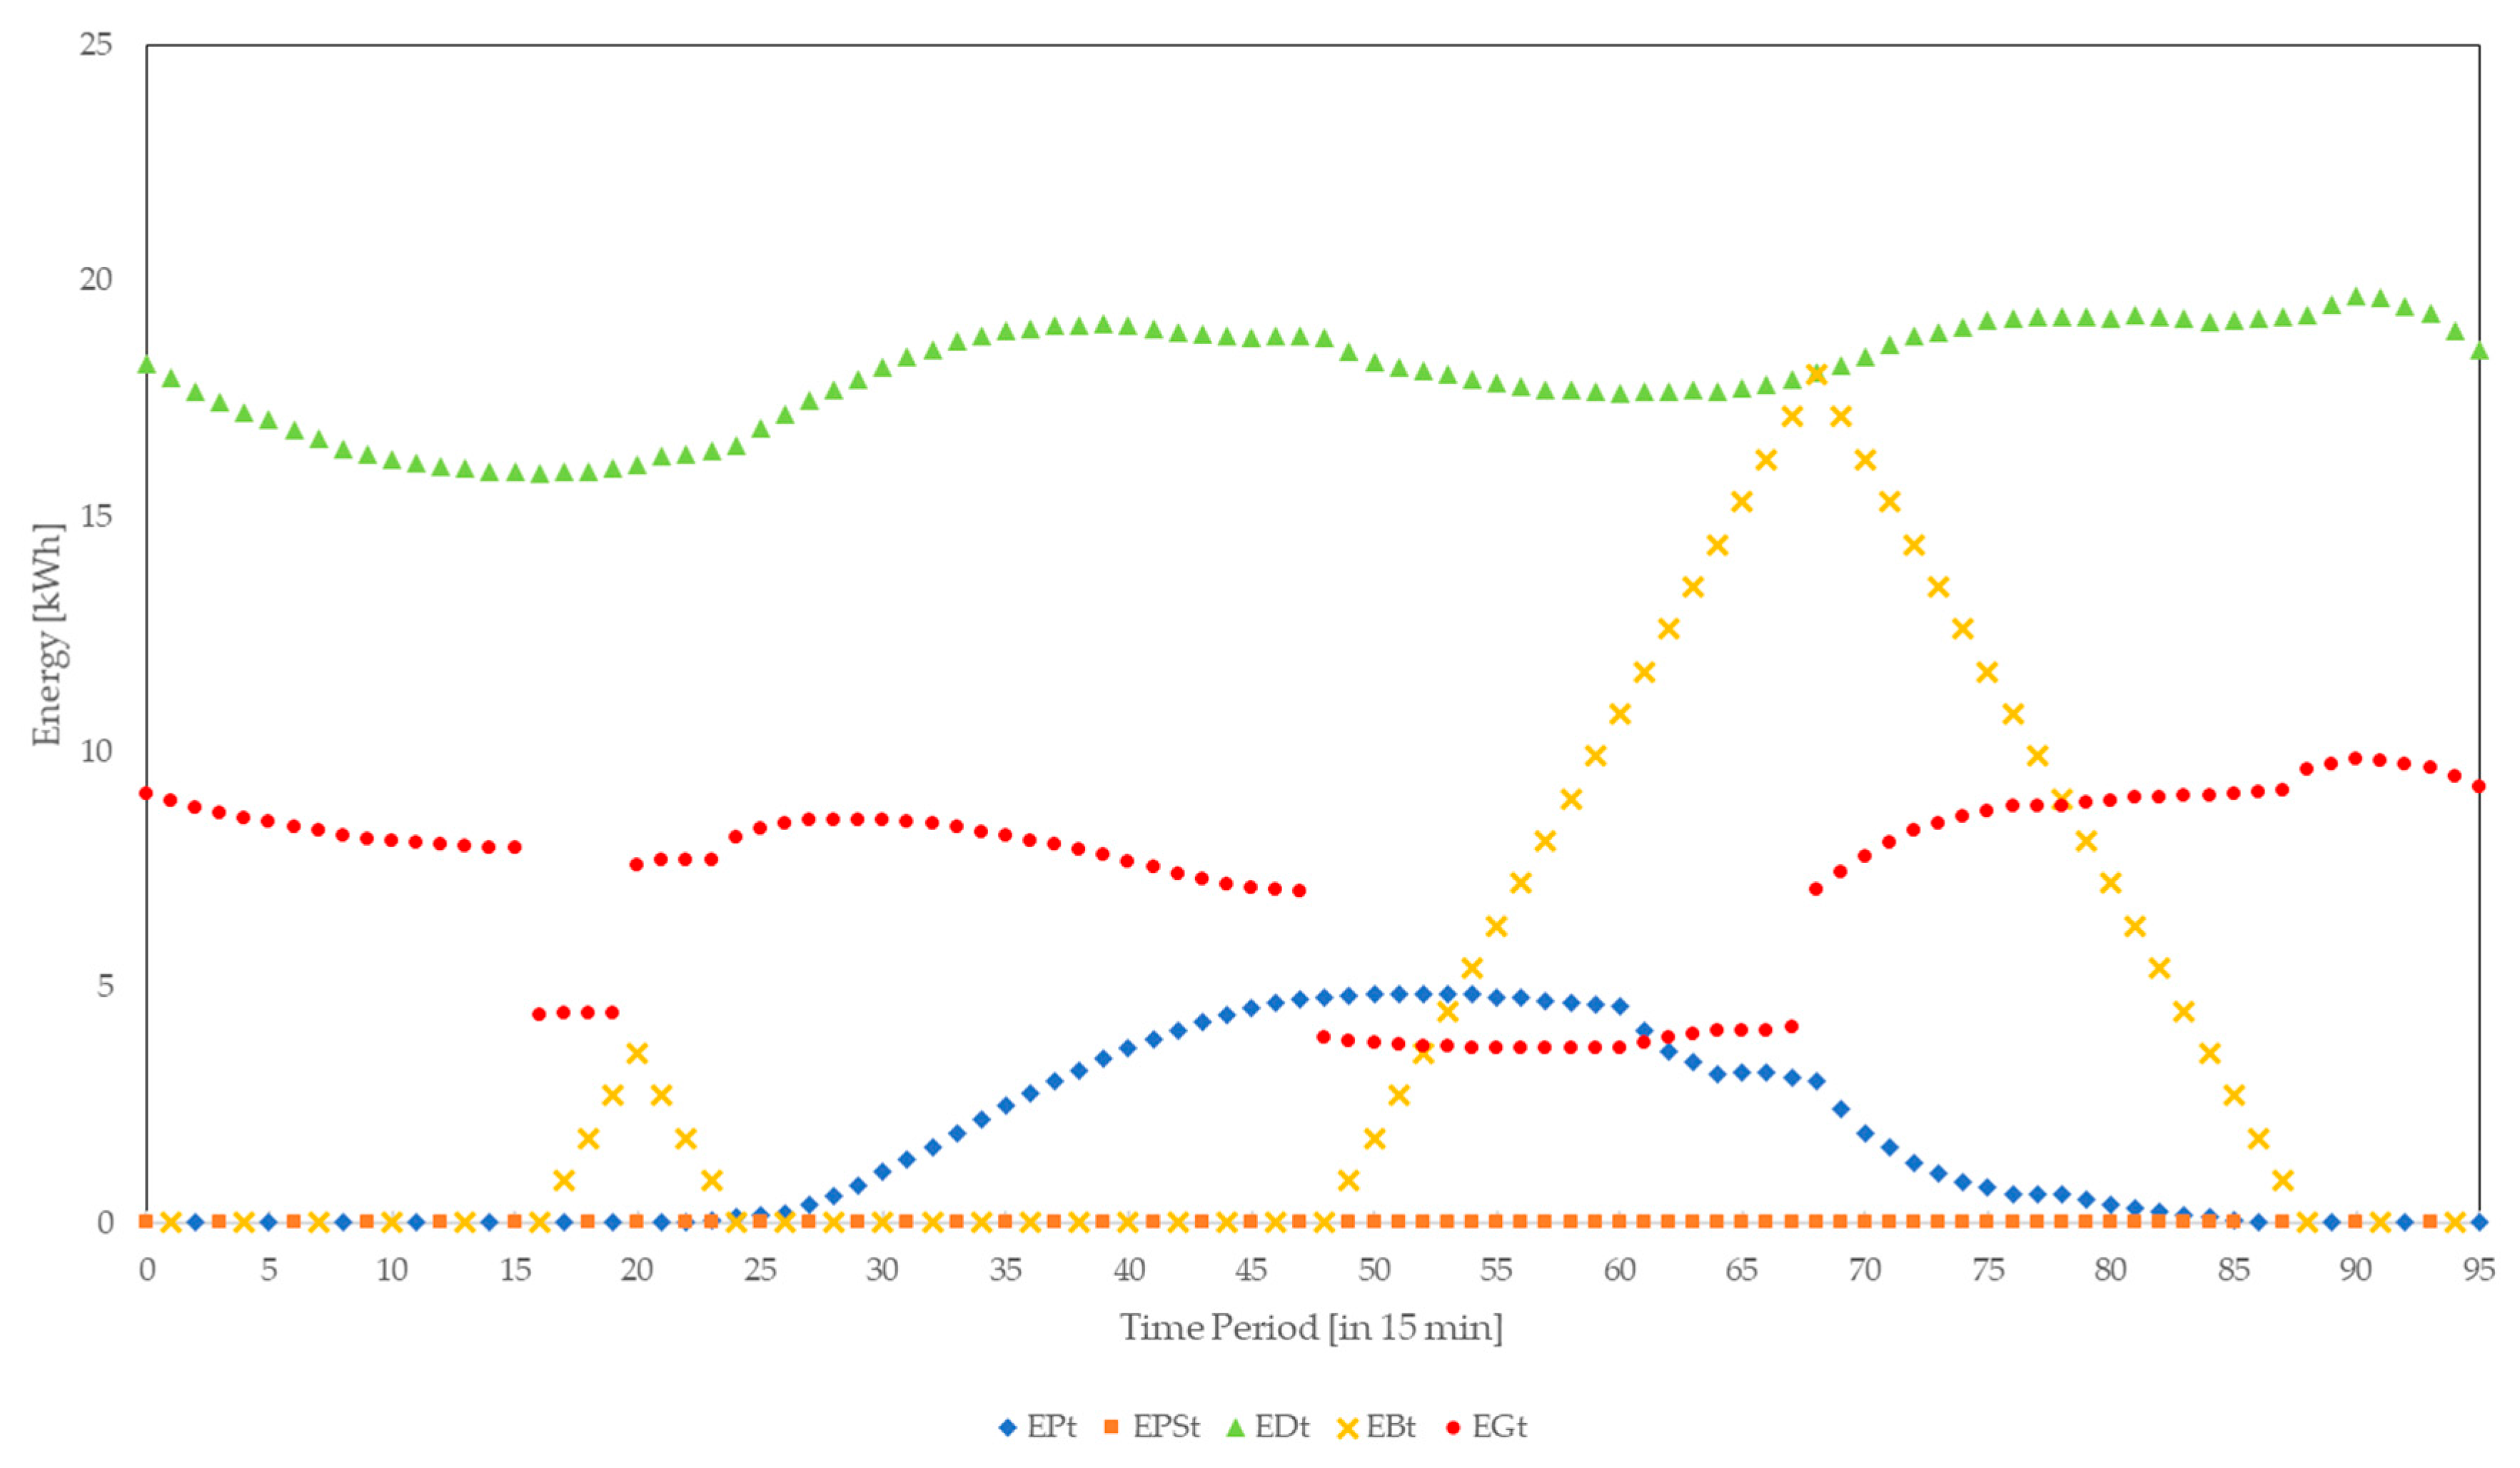
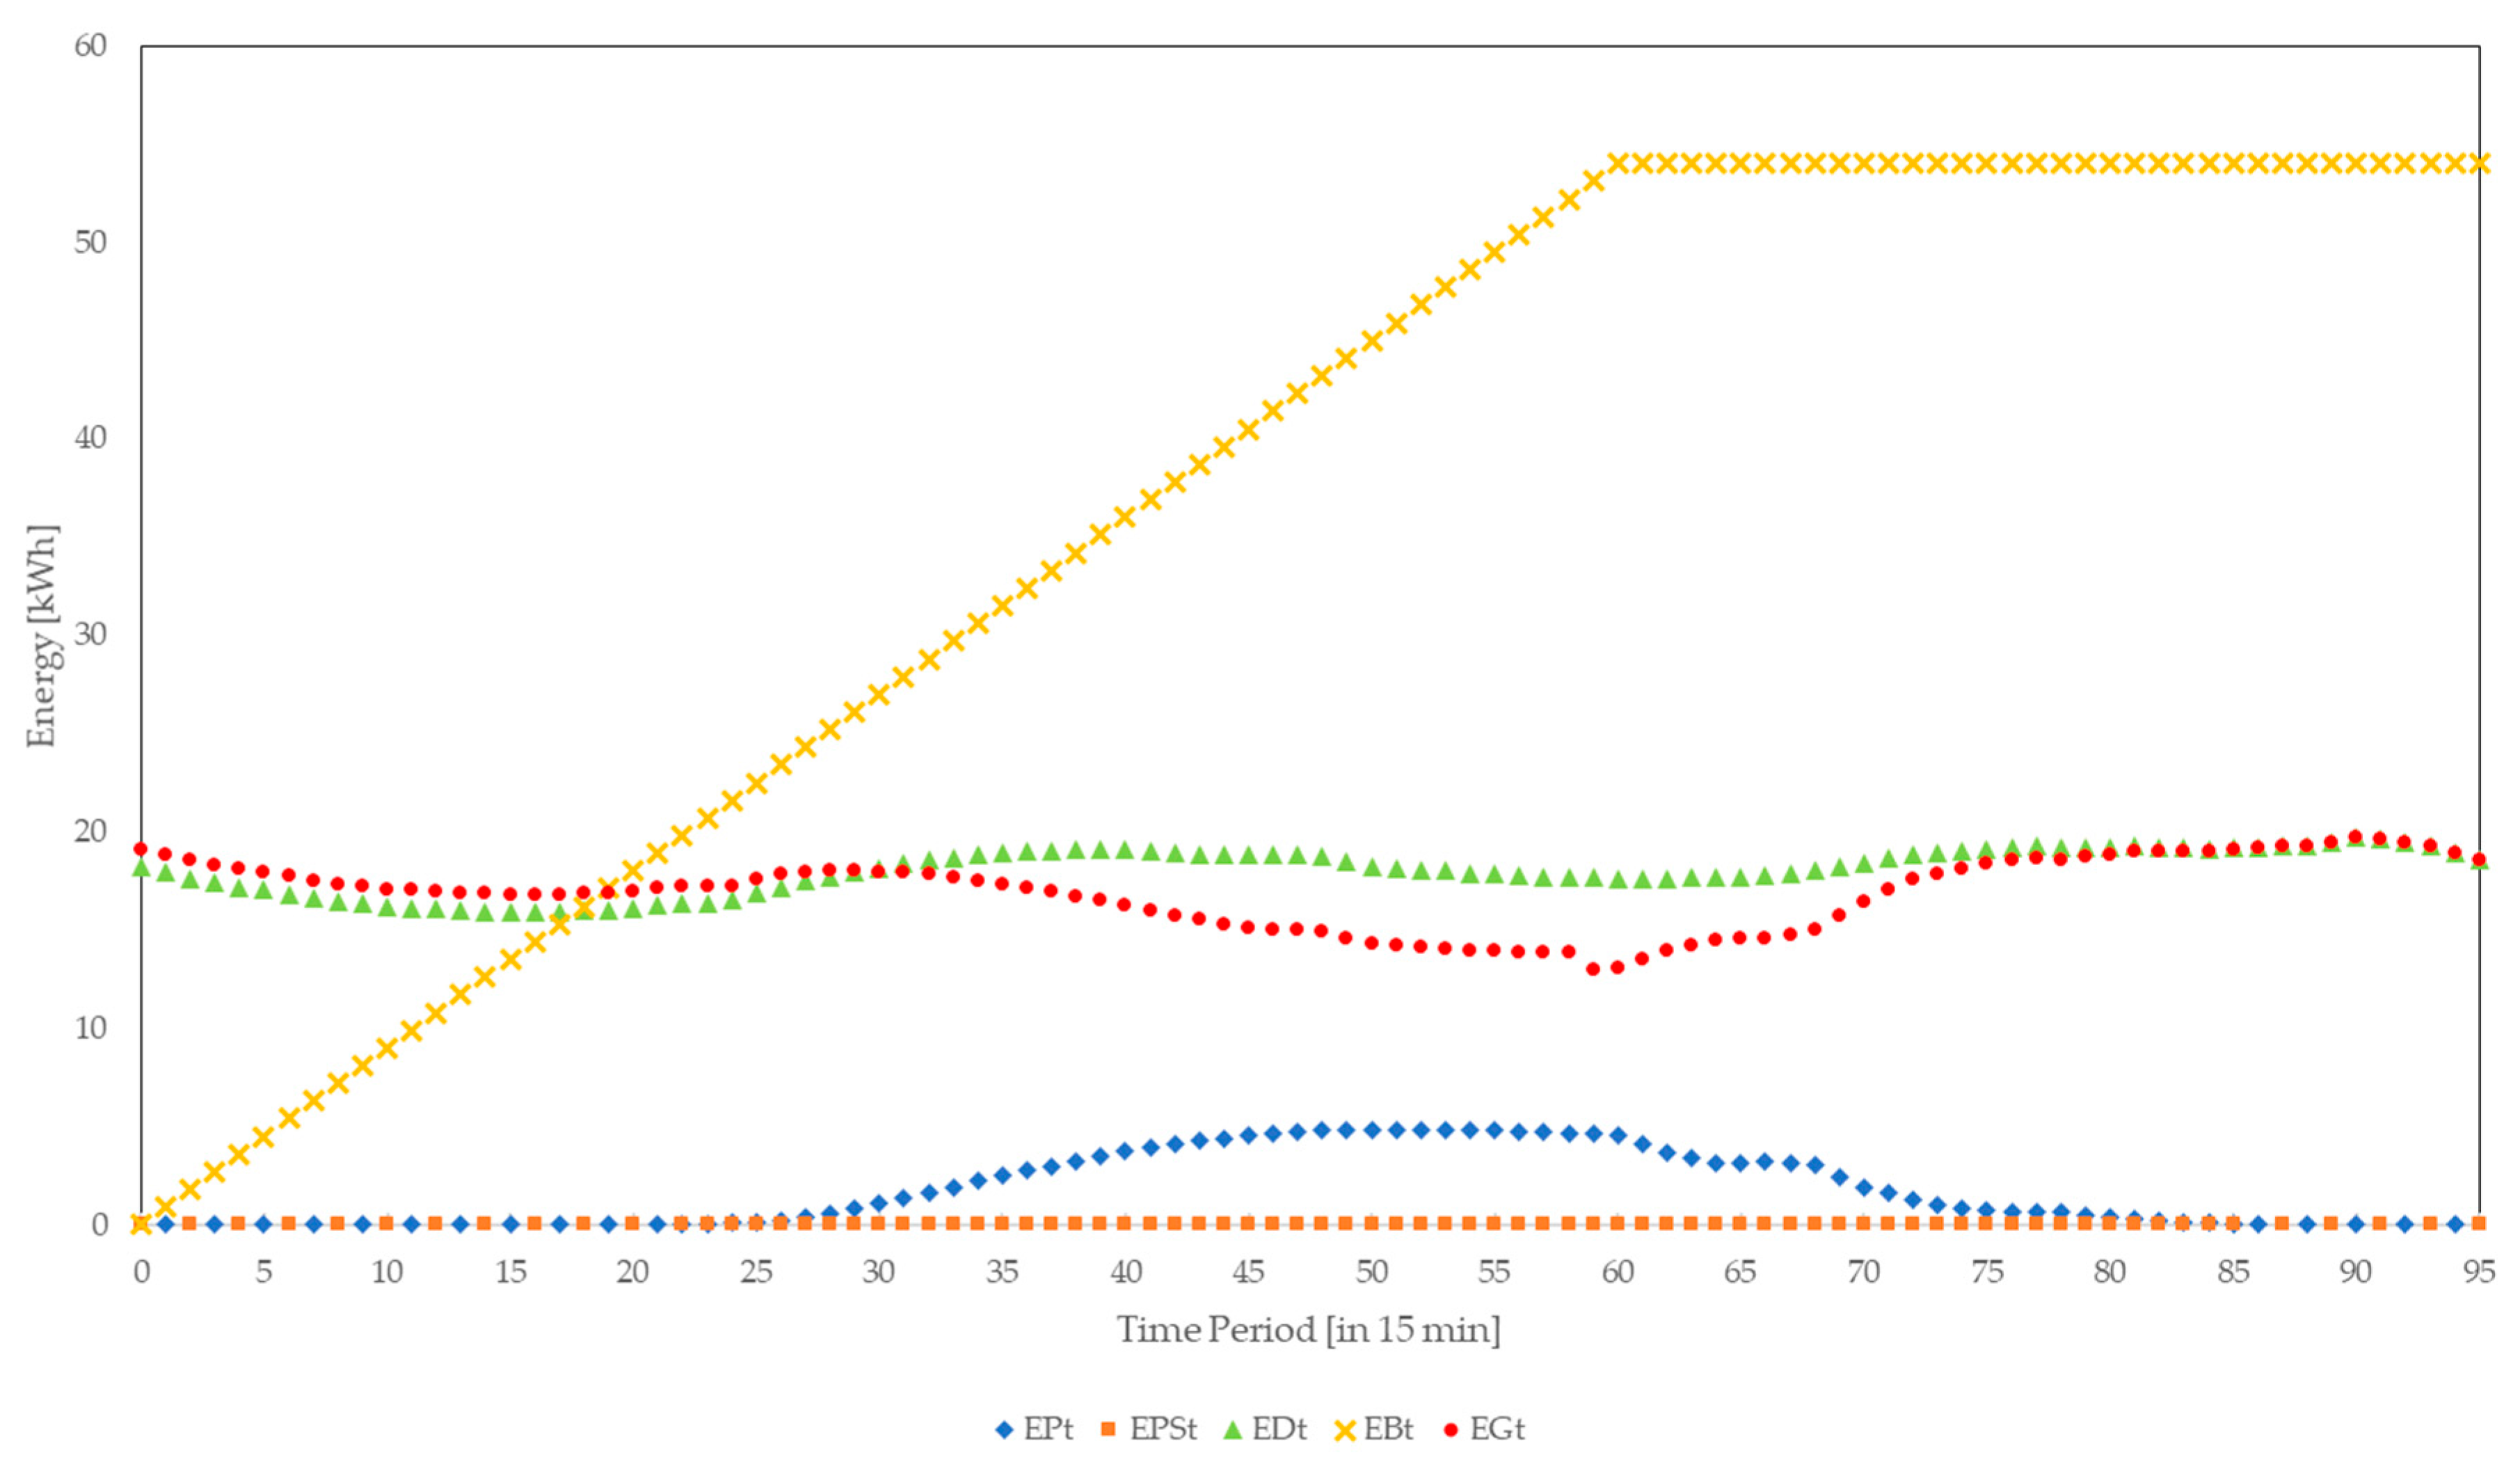
4. Results and Analyses
4.1. Availability Attacks
4.1.1. DoS/DDoS Attacks
4.1.2. Radio Frequency Jamming
4.1.3. Replay Attacks
4.2. Integrity Attacks
4.3. Confidentiality Attacks
5. Conclusions
Author Contributions
Conflicts of Interest
Symbols
| Photovoltaic generated energy in time period t in kWh | |
| Photovoltaic generated energy sold to grid in time period t in kWh | |
| Maximum capacity of battery in kWh | |
| Maximum charging rate of battery in kW | |
| Amount of energy to charge the battery in time period t in kWh | |
| Amount of energy to discharge the battery in time period t in kWh | |
| Grid energy demand in time period t in kWh | |
| Household energy demand in time period t in kWh | |
| Energy stored in battery at beginning of time period t in kWh | |
| EPt | Photovoltaic generated energy in time period t in kWh |
| EPSt | Photovoltaic generated energy sold to the grid in period t in kWh |
| EDt | Household energy demand in period t in kWh |
| EBt | Energy stored in battery in time period t in kWh |
| EGt | Grid energy demand in time period t in kWh |
| Rate at which grid buys photovoltaic generated energy | |
| Cost in EUR cent per kWh to satisfy demand in time period t | |
| Cost in EUR cent per kWh to charge battery in time period t | |
| Grid energy cost in EUR cent per kWh in time period t | |
| Cost limit in EUR cent per kWh to charge the battery | |
| Binary variable that is 1 if battery is charged in time period t | |
| Binary variable that is 1 if battery is discharged in time period t | |
| ∆t | Time delay |
References
- Mo, Y.; Kim, T.H.J.; Brancik, K.; Dickinson, D.; Lee, H.; Perrig, A.; Sinopoli, B. Cyber–Physical Security of a Smart Grid Infrastructure. Proc. IEEE 2012, 100, 195–209. [Google Scholar]
- Wang, W.; Lu, Z. Cyber Security in the Smart Grid: Survey and Challenges. Comput. Netw. 2012, 57, 1344–1371. [Google Scholar] [CrossRef]
- Yadav, S.A.; Kumar, S.R.; Sharma, S.; Singh, A. A review of possibilities and solutions of cyber attacks in smart grids. In Proceedings of the Innovation and Challenges in Cyber Security, Noida, India, 3–5 February 2016. [Google Scholar]
- Sgouras, K.I.; Birda, A.D.; Labridis, D.P. Cyber Attack Impact on Critical Smart Grid Infrastructures. In Proceedings of the Innovative Smart Grid Technologies Conference, Washington, DC, USA, 19–22 February 2014. [Google Scholar]
- Asri, S.; Pranggono, B. Impact of Distributed Denial-of-Service Attack on Advanced Metering Infrastructure. Wirel. Pers. Commun. 2015, 83, 2211–2223. [Google Scholar] [CrossRef]
- Anzalchi, A.; Sarwat, A. A Survey on Security Assessment of Metering Infrastructure in Smart Grid Systems. In Proceedings of the Southeast Conference, Fort Lauderdale, FL, USA, 9–12 April 2015. [Google Scholar]
- Mahmud, R.; Vallkati, R.; Mukherjee, A.; Ranganathan, P.; Nejadpak, A. A Survey on Smart Grid Metering Infrastructures: Threats and Solutions. In Proceedings of the IEEE International Conference on Electro/Information Technology (EIT), Dekalb, IL, USA, 21–23 May 2015. [Google Scholar]
- Bou-Harb, E.; Fachkha, C.; Pourzandi, M.; Debbabi, M.; Assi, C. Communication Security for Smart Grid Distribution Networks. IEEE Commun. Mag. 2013, 51, 42–49. [Google Scholar] [CrossRef]
- Wang, W.; Xu, Y.; Khanna, M. A survey on the communication architectures in smart grid. Comput. Netw. 2011, 55, 3604–3629. [Google Scholar] [CrossRef]
- Tellbach, D.; Li, Y.F. A survey on the cyber-security of distributed generation systems. In Proceedings of the ESREL, Portorož, Slovenia, 18–22 June 2017. [Google Scholar]
- Soupionis, Y.; Benoist, T. Cyber-Physical Testbed—The Impact of Cyber Attacks and the Human Factor. In Proceedings of the 10th International Conference for Internet Technology and Secured Transactions, London, UK, 14–16 December 2015; pp. 326–331. [Google Scholar]
- Zhang, Y.; Wang, L.; Sun, W. Investigating the Impact of Cyber Attacks on Power System Reliability. In Proceedings of the 3rd Annual International Conference on Cyber Technology in Automation, Control and Intelligent Systems, Nanjing, China, 26–29 May 2013. [Google Scholar]
- Ma, C.Y.T.; Yau, D.K.Y.; Rao, N.S.V. Scalable Solutions of Markov Games for Smart-Grid Infrastructure Protection. IEEE Trans. Smart Grid 2013, 4, 47–55. [Google Scholar] [CrossRef]
- Ciancamerla, E.; Fresilli, B.; Minichino, M.; Patriarca, T.; Iassinovski, S. An electrical grid and its SCADA under cyber attacks Modelling versus a Hybrid Test Bed. In Proceedings of the 2014 Internation Carnahan Conference on Security Technology, Rome, Italy, 13–16 October 2014. [Google Scholar]
- Asare-Bediako, B.; Kling, W.L.; Ribeiro, P.F. Integrated agent-based home energy management system for smart grids applications. In Proceedings of the Innovative Smart Grid Technologies Europe (ISGT EUROPE), Lyngby, Denmark, 6–9 October 2013. [Google Scholar]
- Kahrobaee, S.; Rajabzadeh, R.A.; Soh, L.-K.; Asgarpoor, S. A multiagent modeling and investigation of smart homes with power generation, storage, and trading features. IEEE Trans. Smart Grid 2013, 4, 659–668. [Google Scholar] [CrossRef]
- Zhang, T.; Siebers, P.-O.; Aickelin, U. Modelling electricity consumption in office buildings: An agent based approach. Energy Build. 2011, 43, 2882–2892. [Google Scholar] [CrossRef]
- Powerstar. Integrating Energy Storage with Renewable Energy. 2017. Available online: http://powerstar.com/energy-storage-renewable-energy/ (accessed on 9 April 2017).
- ELIA. ELIA Load 2017. 2017. Available online: http://www.elia.be/en/grid-data/data-download (accessed on 25 April 2017).
- Muller, J.; Hinken, D.; Blankemeyer, S.; Kohlenberg, H.; Sonntag, U.; Bothe, K.; Dullweber, T.; Kontges, M.; Brendel, R. Resistive Power Loss Analysis of PV Modules Made From Halved 15.6 × 15.6 cm2 Silicon PERC Solar Cells With Efficiencies up to 20.0%. IEEE J. Photovolt. 2015, 5, 189–194. [Google Scholar] [CrossRef]
- Einspeiseverguetung-Photovoltaikde. Das Aktuelle EEG. 2012. Available online: http://www.einspeiseverguetung-photovoltaik.de/ (accessed on 25 April 2017).
- Masoum, A.S.; Deilami, S.; Moses, P.S.; Abu-Siada, A. Impacts of battery charging rates of plug-in electric vehicle on smart grid distribution systems. In Proceedings of the Innovative Smart Grid Technologies Conference Europe (ISGT Europe), Gothenberg, Sweden, 11–13 October 2010. [Google Scholar]
- U.S. Department of Energy and Office of Energy Efficiency & Renewable Estimating Appliance and Home Electronic Energy Use. 2017. Available online: https://energy.gov/energysaver/estimating-appliance-and-home-electronic-energy-use (accessed on 23 April 2017).
- Sibelga. How Much Energy Do My Household Appliances Use? 2017. Available online: https://www.energuide.be/en/questions-answers/how-much-energy-do-my-household-appliances-use/71/ (accessed on 23 April 2017).
- EEX. Auktion EPEX SPOT, PHELIX Marktdaten. 2017. Available online: https://www.eex.com/de/marktdaten/strom/spotmarkt/auktion#!/2017/04/08 (accessed on 9 April 2017).


| Key Words | Simulation of Cyber-Attacks on SG | Simulation of Cyber-Attacks on SMs |
|---|---|---|
| Availability Attacks | ||
| DoS/DDoS Attacks | Soupionis and Benoist [11] Asri and Pranggono [5] Zhang et al. [12] | Sgouras et al. [4] Ma et al. [13] |
| Integrity/Confidentiality Attacks | ||
| Spoofing Attacks | Zhang et al. [12] | |
| Message modification | Zhang et al. [12] | |
| MITM Attacks | Zhang et al. [12] Ciancamerla et al. [14] |
| Household Component Included in Model | Asare-Bediako et al. [15] | Kahrobaee et al. [16] | Zhang et al. [17] |
|---|---|---|---|
| Battery | x | ||
| Energy Generation | x | x | |
| Household Operations | x | ||
| Household Appliances | x | x | |
| SM | x |
| Cyber-Attack | Math. Model | Effects |
|---|---|---|
| DoS Attack | ∆t = 0 | No measurable delay |
| DDoS Attack | ∆t > 0 | Small measurable delay |
| DDoS Attack | ∆t >> 0 | Considerable delay |
| RF Jamming | No grid energy price data for one period | |
| RF Jamming | No grid energy price data for multiple periods | |
| Replay Attack | Delaying grid energy price data | |
| Replay Attack | Repeating grid energy price data |
| Cyber-Attack | Math. Model | Effects |
|---|---|---|
| Grid Energy Price | Financial impact | |
| Grid Energy Demand | Financial impact | |
| Sold Photovoltaic Energy | Financial impact |
| Cyber-Attack | Math. Model | Effects |
|---|---|---|
| Grid Energy Price | Financial impact | |
| Grid Energy Price | Financial impact | |
| Sold Photovoltaic Energy | Financial impact | |
| Grid Energy Demand | Financial impact |
| Cyber-Attack | Total Household Cost [ct] | Loss for Grid [ct] | SM Delay | SM Communication Stop |
|---|---|---|---|---|
| DoS Attack | 5456.46 | 0 | - | - |
| DDoS Attack | 5456.46 | 0 | 6 ms | - |
| DDoS Attack | 5456.46 | 0 | 1 s | - |
| RF Jamming One period | 5453.77 | 2.69 | - | One period |
| RF Jamming Four periods | 5451.07 | 5.39 | - | Four periods |
| Replay Attack Delay | 5382.72 | 73.74 | - | One period |
| Replay Attack Repeat | 5449.88 | 6.58 | - | - |
| Attack on | Total Household Cost [ct] | Loss for Grid [ct] | SM Delay | SM Communication Stop |
|---|---|---|---|---|
| Grid Energy Price | 2748.03 | 2708.43 | - | - |
| Grid Energy Demand | 2759.59 | 2696.87 | - | - |
| Photovoltaic Energy | 3613.38 | 1843.08 | - | - |
| Attack on | Total Household Cost [ct] | Loss for Grid [ct] | SM Delay | SM Communication Stop |
|---|---|---|---|---|
| Grid Energy Half | 2748.03 | 2708.43 | - | - |
| Grid Energy Zero | 0 | 5456.46 | - | - |
| Photovoltaic Energy | 3613.38 | 1843.08 | - | - |
| Grid Energy Demand | 2759.59 | 2696.87 | - | - |
| Attack | Monetary Impact | SM Delay | SM Communication Stop |
|---|---|---|---|
| Availability Attacks | |||
| DoS/DDoS Attacks |  |  | |
| RF Jamming |  | | |
| Replay Attacks | | | |
| Integrity Attacks | | | |
| Confidentiality Attacks | | | |
© 2018 by the authors. Licensee MDPI, Basel, Switzerland. This article is an open access article distributed under the terms and conditions of the Creative Commons Attribution (CC BY) license (http://creativecommons.org/licenses/by/4.0/).
Share and Cite
Tellbach, D.; Li, Y.-F. Cyber-Attacks on Smart Meters in Household Nanogrid: Modeling, Simulation and Analysis. Energies 2018, 11, 316. https://doi.org/10.3390/en11020316
Tellbach D, Li Y-F. Cyber-Attacks on Smart Meters in Household Nanogrid: Modeling, Simulation and Analysis. Energies. 2018; 11(2):316. https://doi.org/10.3390/en11020316
Chicago/Turabian StyleTellbach, Denise, and Yan-Fu Li. 2018. "Cyber-Attacks on Smart Meters in Household Nanogrid: Modeling, Simulation and Analysis" Energies 11, no. 2: 316. https://doi.org/10.3390/en11020316
APA StyleTellbach, D., & Li, Y.-F. (2018). Cyber-Attacks on Smart Meters in Household Nanogrid: Modeling, Simulation and Analysis. Energies, 11(2), 316. https://doi.org/10.3390/en11020316