Abstract
The ongoing study aims to establish a direct probabilistic load flow (PLF) for the analysis of wind integrated radial distribution systems. Because of the stochastic output power of wind farms, it is very important to find a method which can reduce the calculation burden significantly, without having compromising the accuracy of results. In the proposed approach, a K-means based data clustering algorithm is employed, in which all data points are bunched into desired clusters. In this regard, probable agents are selected to run the PLF algorithm. The clustered data are used to employ the Monte Carlo simulation (MCS) method. In this paper, the analysis is performed in terms of simulation run-time. Also, this research follows a two-fold aim. In the first stage, the superiority of data clustering-based MCS over the unsorted data MCS is demonstrated properly. Moreover, the impact of data clustering-based MCS and unsorted data-based MCS is investigated using an indirect probabilistic forward/backward sweep (PFBS) method. Thus, in the second stage, the simulation run-time comparison is carried out rigorously between the proposed direct PLF and the indirect PFBS method to examine the computational burden effects. Simulation results are exhibited on the IEEE 33-bus and 69-bus radial distribution systems.
1. Introduction
Integration of distributed generators (DGs) such as wind farms, photovoltaic generation, diesel generators, and fuel cells gives some salient advantages to the distribution network, such as active power loss reduction, improvement in voltage profile, and enhancement of the reliability of the network [1]. On the other hand, adhesion of renewable energies as alternative generation sources in the power system cause it to encounter a lot of probabilistic phenomena [2]. In this light, probabilistic-generated power from renewables has brought great challenges to power system operation and planning. Among all the DGs, wind generation is growing worldwide, because of economic and environmental privileges. Wind farms (WFs) with stochastic output power are one of the most important reasons for using probabilistic methods in different power systems [3,4].
A study of literature exhibits that there are two general mechanisms for the fulfillment of power flow in power systems, which are known as deterministic and probabilistic. Deterministic power flow calculates the nodal voltages and the electric powers of buses at a specific operating point of the power system. The blind spot of such mechanism is that it cannot take systems’ uncertainties into account. Meanwhile, as introduced by Borkowska in 1974, the probabilistic power flow has been developed to evaluate the impacts of uncertainties, which nowadays is an important tool in power system planning and operation [5]. On the other hand, traditional load flow methods, such as fast decoupled Newton-Raphson and forward/backward sweep, are not that efficient in distribution systems because of their large R/X ratio and high run-time.
There has been a vast body of literature interrogating efficient methods for solving probabilistic load flow (PLF) in the probabilistic mechanism [6,7,8,9,10,11,12,13,14,15]. Reference [6] presented a Quasi-Monte Carlo (QMC) method to calculate the PLF for the radial distribution system. In another attempt, a PLF evaluation with Latin hypercube sampling (LHS) and Cholesky decomposition of the distribution system was proposed in [7]. A general investigation on QMC, Monte Carlo simulation (MCS), and LHS methods is accomplished in [8], with more attention on the QMC approach. In addition, reference [9] employed a probabilistic approach to evaluate the power flow in radial distribution systems. This approach involves two different methods: (i) the compensation-based PLF method and, (ii) the two-point estimation method. A novel PLF solution for both balanced and unbalanced low voltages in radial distribution networks is presented in [10]. Allowing for discrete probability density functions as input variables, without assuming a predefined distribution, is the feature of the proposed method in this reference. An application of the Sigma-point transform algorithm in the PLF problem is done in [11]. One of the advantages of this method is high accuracy in estimating the uncertainty. Approximation of the true mean and covariance in this approach is better than the linearization method. Lower computation burden is the advantage of this point estimate method. Authors in [12] have applied an analytical method, based on generalized polynomial chaos (GPC) for evaluating the PLF. The GPC method first appeared in 2002 as an extension of the polynomial chaos method [13], and has become an effective approach for probabilistic analysis of intricate systems. Furthermore, a new method is proposed for nonparametric probabilistic load flow analysis to identify probability density functions of the load flow outputs in [14]. In another attempt, analyzing the behavior of Hong’s point estimate approach for uncertainty of PLF is considered in [15], by presenting four Hong’s point estimate schemes and utilizing binominal and normal distribution to model the input random variables. Reference [16] evaluates the technical constraint fulfilment in radial distribution systems, based on an analytical technique. The proposed approaches are used to access the fulfilment of voltage constraints in the overall radial distribution systems with uncertainty in the loads and generations.
Solving PLF by combining Quasi-Monte Carlo and multiple linear regression is proposed in [17]. The excellence of this approach is compared with other MCS methods for PLF. The adaptation of uniform design sampling for PLF problems is presented in [18]. The random input variables of this approach are the desired marginal distributions by marginal transformation. Reference [19] proposed a PLF method based on Latin hypercube sampling. In that study, to improve calculation performance, a combined kernel density estimation with Nataf transformation is utilized. In addition, in [20], an analysis of PLF using the novel point estimate approach is demonstrated.
Although the investigated surveys have established efficient methods for PLF, they have not brought up the presumptive behavior of renewable sources. In this regard, the WFs with stochastic behavior aggravate the complexity of PLF evaluation by adding another stochastic factor to the power system. For example, the wind speed varies over time, randomly. The correlation between the wind speed, the output power of WF and system load should be considered when evaluating the PLF [21]. Such uncertainty imposed by the WFs should be considered by researchers to gain more efficient PLF methods. In [22], the impacts of high dimensional dependencies of wind speed are examined among wind farms for the purpose of PLF. Also, the probability distribution of wind speed, by employing the kernel density estimate method, is evaluated, and the pair-copula method is used to gain a joint probability distribution function of wind speed among wind farms. Reference [23] evaluates the transfer capability of power systems in the presence of the WFs. Transfer capability is a key index to determine allowable power transactions between areas, over and above already committed uses. It proposes a hybrid method, based on data clustering and contingency enumeration, by clustering the input data, including the output power of the WFs and systems’ loads, to a finite set, to reduce the complexity of the transfer capability problem. In [24], a decision-making algorithm is presented for the optimal placement and sizing of distributed generation (DG) units in distribution grids that can define the optimal location and estimate the optimum size for a DG unit to be connected. This process is performed for improvement of voltage profiles and reduction of power losses. A Simulink simulation of integration of WFs into the network is provided in [25] to achieve a thorough comprehension of the impact of wind changes on network losses.
As mentioned, the underlined studies certify that versatile viewpoints have been dealt with in the probabilistic load flow in distribution networks. However, as a substantial matter, simulation run-time is not accurately explored by the researchers. Henceforth, the ongoing study mainly addresses this issue in the PLF of the WF-integrated distribution network. In this context, it should be noted that MCS is the most widely-used method for PLF study of a system with wind integration. Broadly speaking, the MCS approach is recognized as a system-dimension independent approach; however, its execution might be rather time-consuming. The main problem in MCS calculation is the wide range of input data from stochastic phenomena in the system. In this paper, to diminish the computation time associated with MCS, a data clustering method, based-on K-means, is employed to cluster the output power of the WF and system load. The clustered data, as a limited version of data, is used in MCS calculations directly. Also, a direct PLF manner is utilized in this study. The results are compared with the unsorted data from MCS to evaluate the effectiveness of the proposed data clustering-based direct PLF approach.
Furthermore, to compare the direct PLF approach with an indirect PLF, the probabilistic forward/backward sweep (PFBS) method is run for the radial distribution system in the presence of the WFs by the two above mentioned approaches: K-means data clustering-based and simple data-based MCS. The PFBS method is based on the direct application of Kirchhoff’s voltage and current laws [26]. Furthermore, the simulation run-time comparison between the proposed direct PLF and the indirect PFBS is carried out, to figure out the effectiveness of both PLF methods.
This paper is arranged in the following sections: In Section 2, the wind turbine model is discussed, in detail. Also, in this section, the cumulative distribution function (CDF), probability density function (PDF), relationship between the input wind speed and output power of a wind turbine and the WF output power are presented. Section 3 describes the problem formulation and presents the proposed direct probabilistic PLF approach. Section 4 explains the MCS method in the PLF process for the WF-integrated distribution network. Also, the proposed K-means clustering algorithm for enhancement of the performance of MCS is described in Section 5. In Section 6, the obtained results are studied. Section 7 includes a discussion about the accomplished studies in the paper. The concluding remarks are mentioned in Section 8.
2. Wind Farm Modeling
2.1. Wind Speed Model
The main part of wind turbine modeling in PLF studies is the manner of obtaining the output power. In this light, the generated power of the wind turbine depends on the wind speed. Due to the undetermined nature of wind speed, this characteristic varies in a stochastic manner with time. The Weibull distribution model is generally used for wind speed estimation [27,28]. The CDF and the PDF of Weibull distribution are denoted as F(V) and G(V), respectively, and can be calculated by Equations (1) and (2), as follows [29]:
where V is the randomly-variable wind speed, V0 is the location parameter, α is the shape parameter and β is the scale parameter.
2.2. Wind Turbine Model
The probabilistic characteristic of the output power of a wind turbine can be obtained from the relationship between wind speed and generated power. Figure 1 approximately represents the relationship between input wind speed and output active power for the variable speed type wind generators.
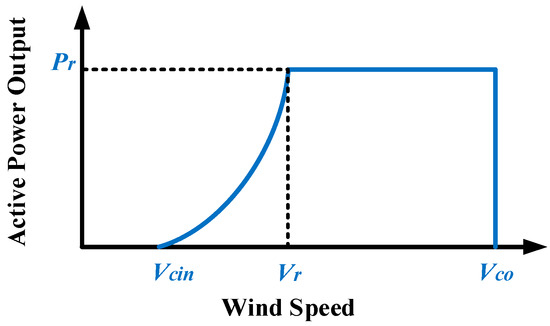
Figure 1.
Speed-power curve of a wind turbine.
The demonstrated probabilistic relationship can be expressed by the following equations:
where V, Vcin, Vco, Vr and Pr represent the wind speed, down-cutting speed, up-cutting speed, nominal wind speed and its rated power, respectively.
2.3. Wind Farm Output Power
The WF output power, assuming the availability of all wind turbines, is the summation of the output power of all individual wind turbines. The output power of each WT can be obtained by (3). Assuming all wind turbines are available, the output power of a WF can be determined by (4):
where PWTj and M are the output power of j-th wind turbine and the total number of wind turbines in the considered WF, respectively. In addition, represents the stochastic power of the wind farm.
3. Direct Probabilistic Load Flow Formulation
This section presents the proposed direct PLF formulation. Assuming stochastic output power from WF, the injected power of a WF connected bus can be calculated as follows:
where , and represent the power injection of bus i, stochastic generated power by the WF and the active power of the existent load in the WF-connected bus, respectively.
The equivalent stochastic current injection of i-th bus at the k-th iteration of the load flow solution will be given by (6):
where is the injected reactive power of the i-th bus and () is the equivalent stochastic current injection obtained by stochastic power injections. By applying Kirchhoff’s current law (KCL) in the radial distribution system, the relationship between branch currents and equivalent stochastic current injections in matrix form can be obtained, as follows:
where [BIBC] is the bus-injection to the branch-current matrix. The constant [BIBC] matrix is an upper triangular matrix and contains values of 0 and +1 only. The general form of relationship between the bus voltages and the branch currents is as follows:
where [BCBV] is the branch-current to the bus-voltage matrix. These two matrices (BIBC and BCBV) are combined to form a direct approach for solving load flow problems. By combining (7) and (8), the relationship between bus current injections and bus voltages can be expressed as:
The load flow solution of the distribution system in iteration k can be obtained by solving (10); this operation is performed until convergence is achieved.
Consequently, steps of load flow for a distribution system considering stochastic WF behavior can be specified as: calculation of using (6), calculating [BIBC] using (7), calculation of [BCBV] using (8), obtaining [PLF] using (9), obtaining using (10), checking the convergence condition given in (10), and repeating equations 6 to 10 if it does not converge, otherwise, stop.
4. Probabilistic Load Flow Evaluation Based on Monte Carlo Simulation
In the literature, there are several techniques for dealing with uncertain problems. These techniques may be classified into three main categories: MCS, analytical methods and approximate methods. The MCS method randomly generates values for uncertain input variables; then, these values are taken into account to solve a deterministic problem. This technique has been widely-used in power systems analysis to model uncertainties. However, it utilizes deterministic routines to solve the problem in each simulation [6]. Solving PLF through MCS is one of the utmost important applications of MCS in a power system. In this context, to solve PLF by MCS, a base case is selected, which includes network structure, output power of each generation unit and loads, in each bus. The steps of MCS application in PLF are as follows:
Step (1): randomly select wind speed and amount of load in one of the studied hours, for simulation purposes.
Step (2): determine the output active power of WF using (3).
Step (3): to keep the balance between generation and consumption (the balance might be violated because of contingencies), modify the output power of conventional generators. In this case, the active output power of conventional generation units are re-dispatched considering their appropriate contributions in the global generation.
Step (4): execute the proposed direct PLF.
Step (5): if a pre-specified number of iterations is executed, the simulation ends, otherwise, repeat Steps 1 to 4.
Finally, the voltage of buses can be calculated using the following equation:
where m is the f-th sample and M shows total number of MCS samples. Moreover, shows the probability of the f-th sample and represents the voltage resulting from f-th sample for bus i-th in load flow.
5. Data Clustering Approach
Data clustering is the task of grouping a set of objects in such a way that objects in the same group (known as a cluster) are more similar to each other than to those in other groups (clusters). It is a main task of exploratory data mining, and a common technique for statistical data analysis, used in many fields, including load flow patterns of renewable-integrated distribution systems. Data clustering itself is not one specific algorithm, but a general task to be solved. It can be achieved by various algorithms that differ significantly in their notion of what constitutes a cluster and how to efficiently find them.
Several methods have been employed by data clustering for grouping data, based on similarities or differences in observations. In this context, categorization of data is done in such a way that data placed in a given category have the most similarity to each other, or they are different [22,30]. After categorizing, the volume of processed data is significantly reduced. This is the main advantage of data clustering, which can be addressed as limitation of data processing. In this study, K-means clustering as a method of data clustering is utilized. This method is employed for clustering the output power of WF and the system load data in the studied research. In the following section, the K-means method and its applications are explained.
5.1. K-Means Algorithm
Introduced by Mac Queen in 1967 [31], the K-means algorithm can categorize a large amount of data in such a way that the sum of the distances to the nearest cluster of data is minimized. The steps of the algorithm are as follows:
Step (1): define the initial number of cluster members (k) from the whole observations, randomly, and assign them as agents of the clusters.
Step (2): dedicate the other remaining observations to the clusters with the adjacent representative, using (12):
where and are representative of cluster i and cluster h, N is the total number of observations, and represent the j-th observation and set of the h-th cluster members.
Step (3): calculate new cluster representatives, using (13):
where denotes the number of members of observation in cluster i.
Step (4): repeat steps 3 and 4 until the change in cluster representatives becomes less than a particular threshold.
Step (5): calculate the probability of each cluster, using (14):
Applications of unsorted data and K-means clustering-based data for MCS in the proposed direct PLF are shown by flowcharts in Figure 2a,b.
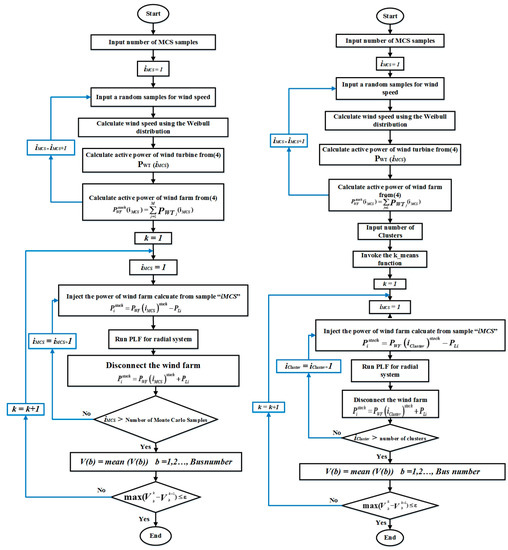
Figure 2.
Flowcharts of the proposed direct probabilistic load flow (PLF), (a) unsorted data, and (b) K-means data clustering.
5.2. Clustering Application in MCS for Probabilistic Load Flow
The MCS method is the most widely-used simulation method to study the PLF of a power system including wind integration. This approach is recognized as a system-dimension independent approach; however, its execution might be rather time-consuming. The main problem with MCS calculation is the wide range of input data from stochastic phenomena in the system. In this paper, to diminish the computation time associated with MCS, a data clustering method, based on K-means is employed to cluster the output power of WF and system load. The clustered data, as a limited version of data, is used in MCS calculations directly. After that, the data from data clustering-based MCS are utilized in a direct PLF. The results are compared with the simple data sent to MCS, to evaluate the efficiency of the proposed data clustering-based direct PLF approach. The steps of the clustering application in probabilistic load flow are as follows:
Step (1): determine the active power output of WF due to variations in wind speed.
Step (2): using the K-means clustering algorithm, the system load and output power of WF are clustered together in a desired range, and each cluster is characterized by the probability of its cluster and agent.
Step (3): i = 1 is selected as a counter of clusters.
Step (4): to keep the balance between generation and system load, the output power of conventional generation units is modified.
Step (5): proposed direct PLF is executed for the agent of the i-th cluster.
Step (6): if i is less than the number of clusters, repeat steps 4 to 5 for the next cluster, otherwise, stop.
Finally, calculate the mean voltage of buses using the following equation:
where c is the c-th cluster and M shows the total number of clusters. The shows the probability of the c-th cluster and represents the voltage resulting from the c-th cluster for the i-th bus in load flow.
6. Numerical Studies
6.1. IEEE 33-Bus Case Study
6.1.1. System Description
The IEEE 33-bus radial distribution system (Figure 3) is employed as the first case study to investigate the performance of the proposed method. In this system, a WF is connected to the system in bus-33. It should be mentioned, in the operation process of the K-means data clustering algorithm, the wind farm can be connected to the each of the buses in the considered distribution system. This means that the proposed algorithm is independent of the connected bus of the wind farm. Details about this test system are addressed in [32]. Table 1 lists the parameters of the wind turbines. Figure 4 shows the wind speed for 7000 samples. Base kV is taken as 12.66 kV and base MVA is considered to be 1 MVA. Figure 5 demonstrates the PDF of the wind speed samples, and the CDF of samples for wind speed and turbine output power. Also, the center of clusters after convergence achieved in data clustering is presented in Figure 6.
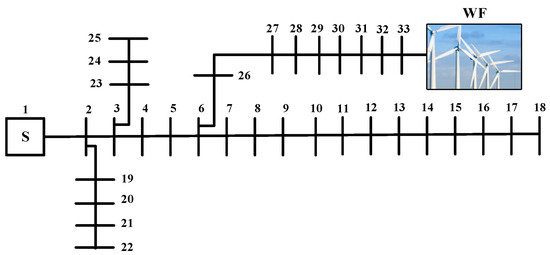
Figure 3.
IEEE 33-bus radial distribution system.

Table 1.
Wind turbine parameters.
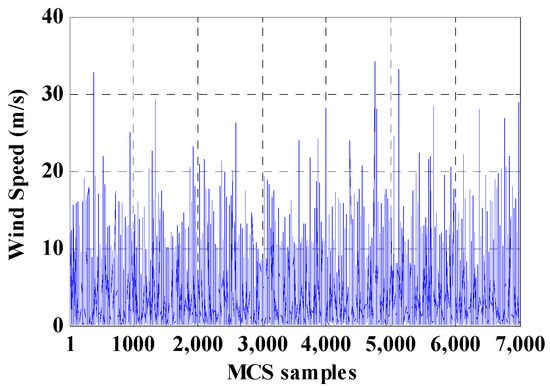
Figure 4.
Wind speed for each sample.

Figure 5.
Cumulative distribution function of wind speed and wind output power. (a) PDF of wind speed samples, (b) PDF of wind speed samples, (c) CDF of turbine output power.
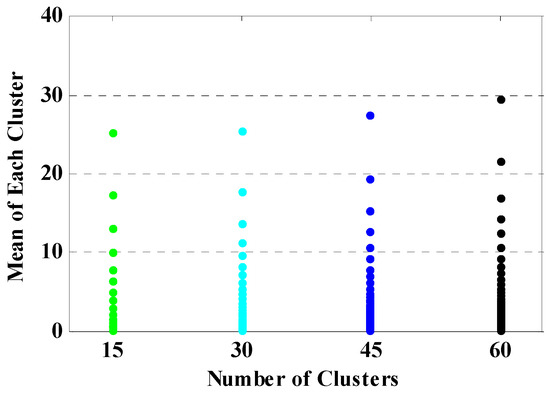
Figure 6.
Center of clusters after convergence achieved in data clustering.
In this part, different studies are investigated, to evaluate the proposed direct PLF and indirect PFBS methods, based-on K-means clustering data and unsorted data, for MCS. In both methods, a pre-specified number of iterations is used for MCS simulation. This number is selected to be large enough to ensure convergence to an acceptable coefficient of variation value.
6.1.2. Proposed Direct Probabilistic Load Flow Evaluation
In this section, the proposed direct PLF is executed by employing K-means clustering-based data and unsorted data in MCS. Accordingly, this study is carried out for the following two cases:
Case 1.1: evaluation of direct PLF, based on K-means clustering data for MCS.
Case 1.2: evaluation of direct PLF, based on unsorted data for MCS.
For Case 1.1, input data (output power of WF and system load) are classified into different amounts of clusters, including 15, 30, 45 and 60 clusters. For cases 1.2, the values for selective buses in the MCS process are obtained at the iteration 7000. For instance, Figure 7 illustrates a convergence trend of the voltage magnitude of bus-33 for 7000 iterations of MCS, using the proposed direct PLF. In addition, the voltage convergence of bus-33 for clustering-based MCS is demonstrated in Figure 8. As shown, in higher number of clusters, the convergence of clustering-based MCS is closer to unsorted data-based MCS.
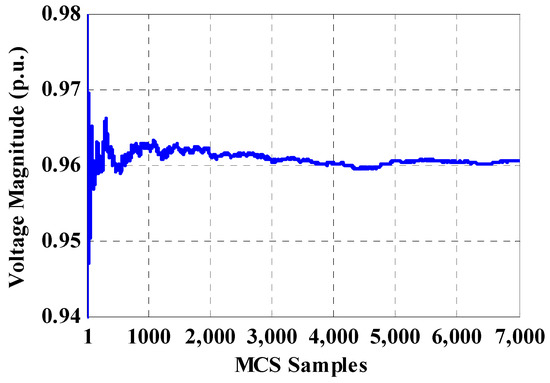
Figure 7.
Convergence process of bus-33 for unsorted data-based Monte Carlo Simulation (MCS).
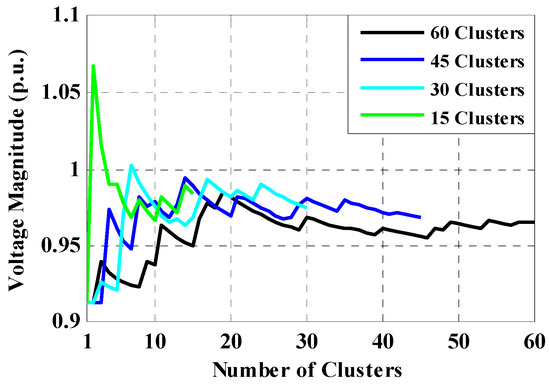
Figure 8.
Convergence process of bus-33 for clustering-based MCS.
6.1.3. Indirect Probabilistic Forward/Backward Sweep Method Evaluation
In this paper, the indirect probabilistic forward/backward sweep (PFBS) method is employed for comparison with the proposed direct PLF, from the standpoint of run-time. For this purpose, in this section, a study is performed on the following two cases:
Case 2.1: evaluation of the indirect PFBS, based on K-means clustering data for MCS.
Case 2.2: evaluation of the indirect PFBS, based on unsorted data for MCS.
For Case 2.1, input data (output power of WF and system load) are classified into 15, 30, 45 and 60 clusters. For Case 2.2, the values for selected buses are obtained at iteration 7000. The results of evaluations of Case 1.1, Case 1.2, Case 2.1 and Case 2.2 are shown in Table 2. This table demonstrates the results of the selected bus voltage magnitudes for each case. For Case 1.1 and Case 2.1, it is found that by increasing the number of clusters, the selected bus voltage (e.g., Bus 18) magnitudes are found close to the results of MCS using unsorted data. The results using direct PLF and indirect PFBS approaches are found to be pretty close. As is obvious in Table 2, for all buses shown, the V magnitude from clustered data, regardless of the number of clusters, is always higher than the unsorted data. This is because of the higher relative value of the center of clusters (representative of the clusters for the wind speed) in the data clustering approach in comparison with unsorted data, in MCS. Table 3 exhibits the simulation run-time for the proposed direct PLF method and PFBS approach. As shown, the run-time for the proposed direct PLF is much smaller than PFBS and the run-times for both of them are smaller than the unsorted data-based MCS approach, which illustrates the effectiveness of the K-means clustering algorithm. To be more accurate, the voltages of all buses with the proposed data clustering-based direct PLF are demonstrated in Figure 9, and the magnitudes are listed in Table 4. Figure 10 shows the CDF of voltage for samples and the mean of clusters for bus-33. It should be noted that if the number of clusters decreases, the accuracy of the results of selected bus voltage magnitudes decreases, and if the number of clusters increases, the run-time increases.
Table 2.
Comparison between the proposed direct PLF and the indirect probabilistic forward/backward sweep (PFBS) methods.
Table 3.
Calculation run-time results for the proposed method, based on both simple MCS and data clustering (33-bus system).
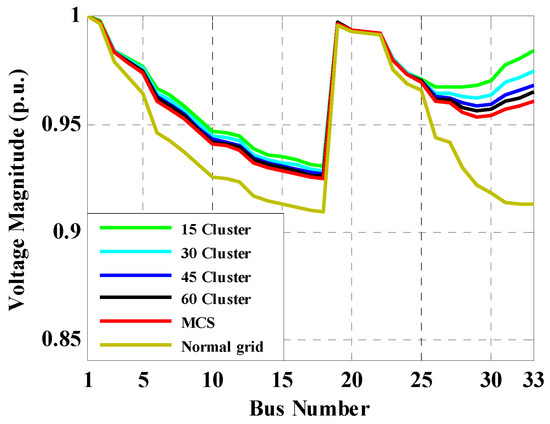
Figure 9.
Voltage profile with the proposed data clustering-based direct PLF with different number of clusters (33-bus system).
Table 4.
Voltage magnitudes with the proposed data clustering-based direct PLF (33-bus system).
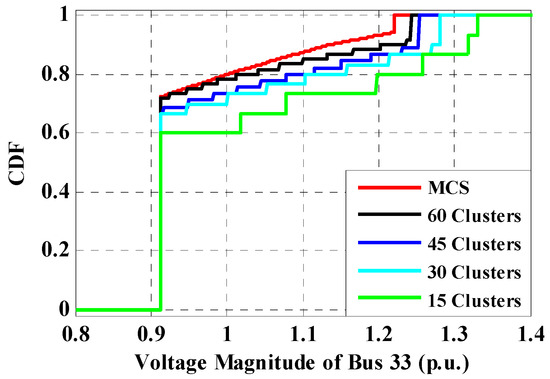
Figure 10.
Cumulative distribution function of voltage magnitude for bus-33.
6.2. IEEE 69-Bus Case Study
In the second case study, the IEEE 69-bus radial distribution system is selected to demonstrate the effectiveness of the proposed approach. This system contains a 12.66 kV radial distribution feeder, with 69 buses, seven laterals, and 47 load points, totaling 3.79 MW, with a 2.69 MVAr load. Figure 11 illustrates this system in which the wind farm is connected to the system in bus-53. The system data are given in [33]. Detailed numerical studies were described for IEEE 33-bus distribution system and same studies are repeated in this section for the new system. Figure 12 exhibits the convergence trend of voltage magnitude of bus-53 for 7000 iterations of the MCS by the proposed direct PLF. Also, the voltage convergence of bus-33 for clustering-based MCS is demonstrated in Figure 13. As shown, in higher number of clusters, the convergence of clustering-based MCS is closer to unsorted data-based MCS.
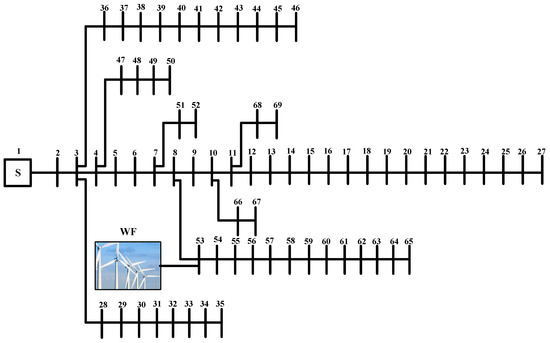
Figure 11.
IEEE 69-bus radial distribution system.
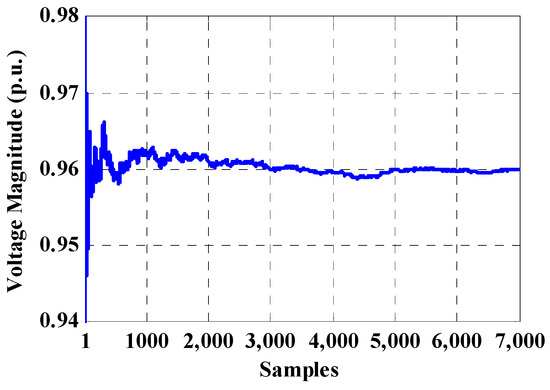
Figure 12.
Convergence process of bus-53 for unsorted data-based MCS.
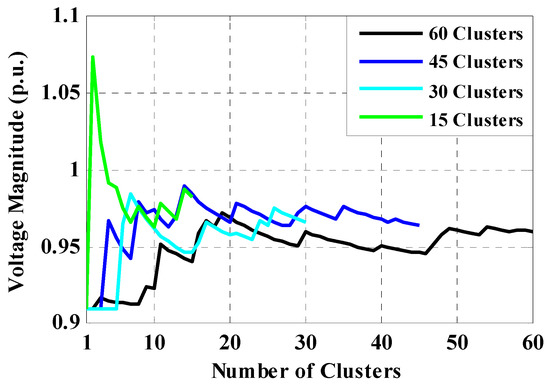
Figure 13.
Convergence process of bus-53 for clustering data-based MCS.
The results of the evaluations of Case 1.1, Case 1.2, Case 2.1 and Case 2.2 are shown in Table 5, for the 69-bus radial distribution system. This table demonstrates the results of the selected bus voltage magnitudes for each case. Again, for Case 1.1 and Case 2.1, it is found that by increasing the number of clusters, the selected bus voltage magnitudes are found to be close to the results of MCS. Table 6 exhibits the simulation run-time for the proposed direct PLF method and PFBS approach. As shown, the run-time of the proposed direct PLF is smaller than PFBS, and the run-times of both of them, using the clustered data-based method, are smaller than the unsorted data-based MCS approach, which illustrates the effectiveness of the K-means clustering algorithm. Similar to the 33-bus system, it is found that if the number of clusters decreases, the accuracy of results of selected bus voltage magnitudes decreases, and if the number of clusters increases, the run-time increases. It can be deduced from Table 6 that the convergence in the proposed direct PLF is faster than the indirect PFBS method. Voltages of all buses with the proposed data clustering-based direct PLF are demonstrated in Figure 14, and the magnitudes are listed in Table 7. Figure 15 shows the CDF of voltage for samples and the mean of clusters for bus-33.
Table 5.
Comparison between the proposed direct PLF and the indirect PFBS methods.
Table 6.
Calculation run-time results for proposed method, based on both simple MCS and data clustering (69-bus system).
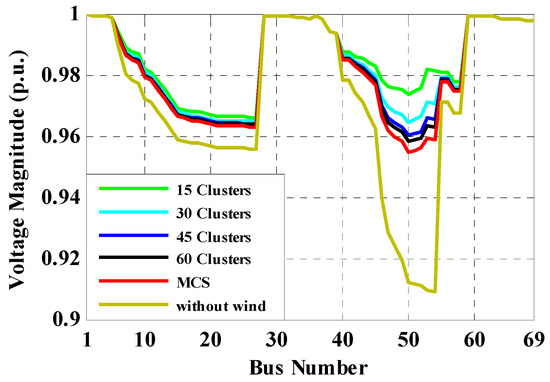
Figure 14.
Voltage profile with the proposed data clustering-based direct PLF.
Table 7.
Voltage magnitudes with the proposed data clustering-based direct PLF (69-bus system).
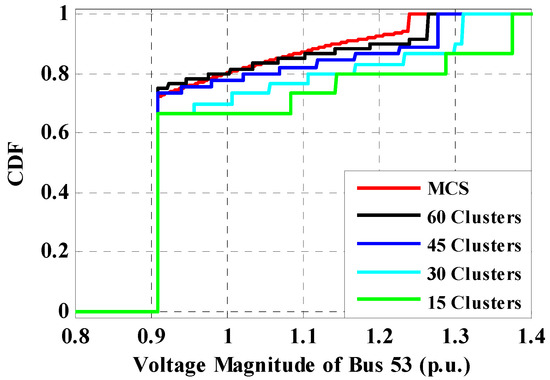
Figure 15.
Cumulative distribution function (CDF) of voltage magnitude for bus-53.
7. Discussion
It is completely accepted that unsorted data increases the run-times of computation process in grids with stochastic generations. Sampling of data can improve the processing in such systems. One of the best methods in data sampling, K-means data clustering, was employed. The main concern was the variation in wind speed and consequently, in wind farm generation, which added a kind of uncertainty to the system. The wind speed and generated power of WFs were utilized in the proposed K-means data clustering of sample data in the system.
The obtained results show the validity of K-means data clustering to solve the PLF problem in wind-integrated distribution systems. Four different cases were investigated to evaluate the proposed direct PLF and the indirect PFBS methods, based-on K-means data clustering and unsorted data for MCS. The results for the proposed K-means data clustering algorithm, produced for the IEEE 33-bus and 69-bus radial distribution systems, have been compared with results obtained from unsorted data-based MCS for the same distribution system. The comparison showed that the proposed direct PLF, based on data clustering, is efficient at decreasing the run-time calculation process and can provide a good convergence process for the voltage magnitude of buses.
To compare the direct and indirect PLF methods, it should be added that the aim of employing direct PLF is to develop a formulation, which takes advantage of the topological characteristics of distribution systems, and solves the distribution load flow directly. It means that the time-consuming lower upper decomposition and forward/backward substitution of the Jacobian matrix or the admittance matrix, required in the traditional Newton-Raphson and Gauss implicit matrix algorithms, are not necessary in direct PLF. In direct PLF, two developed matrices, the bus-injection to branch-current matrix and the branch-current to bus-voltage matrix, and a simple matrix multiplication are utilized, to obtain the load flow solutions in the system with uncertainties.
Furthermore, analysis of the obtained results revealed that increasing the number of clusters increases the run-time computation; however, it obtains more efficient results for the voltages of the buses. On the other hand, decreasing the number of clusters reduces the run-time computation in the clustering process; this covers the aim of this paper completely, but the problem is the voltage magnitude in the buses. The low number of clusters probably gets unacceptable voltage magnitudes for the buses. A compromise which obtains the optimal number of clusters for an accurate analysis could improve the operation process of the proposed method. Generally, the assessment of the optimal number for clusters was not the focus of this study, but it should be considered for future works.
8. Conclusions
This study intended to develop a fast and accurate PLF method for radial distribution systems interconnected with wind farms. Wind farm integrated radial distribution systems hold stochastic characteristics with lots of uncertainties and require special attention for their operation and planning. In this regard, the K-means data clustering-based Monte Carlo Simulation is proposed in this study, to mitigate the calculation run-time, without compromising the calculation accuracy. The method has been tested for direct PLF and indirect probabilistic forward/backward sweep (PFBS) methods. The results from both direct and indirect PLF approaches using clustered data were compared against unsorted data for a performance comparison. The test was carried out using two different networks (33-bus and 69-bus distribution systems), interconnected with a wind farm. It can be concluded from the extensive simulation analysis that K-means data clustering-based MCS is an effective method for reducing the calculation burden significantly in PLF, especially for bigger networks, compared to unsorted data-based MCS. Also, the run-time or calculation burden was found to be much smaller in the direct PLF approach, compared to indirect PFBS method when K-means data clustering-based MCS is used. Another obtained result was that decreasing the number of clusters decreases the run-time, and increasing the number of clusters increases the accuracy.
Author Contributions
Arman Oshnoei developed the model and simulated the case studies. Arman Oshnoei, Mehrdad Tarafdar Hagh and Omid Sadeghian analyzed the data. Rahmat Khezri wrote the manuscript. SM Muyeen and Kuaanan Techato provided their comments on the paper.
Conflicts of Interest
The authors declare no conflict of interest.
References
- Gatta, F.M.; Iliceto, F.; Lauria, S.; Masato, P. Modeling and Computer Simulation of in Dispersed Generation in Distribution Networks: Measures to prevent disconnection during system disturbances. In Proceedings of the 2003 IEEE Power Tech Conference, Bologna, Italy, 23–26 June 2003. [Google Scholar]
- Teng, J.H. A Direct Approach for Distribution System Load Flow Solutions. IEEE Trans. Power Deliv. 2003, 18, 882–887. [Google Scholar] [CrossRef]
- Tarafdar-Hagh, M.; Ahamadzadeh, T.; Muttaqi, K.M.; Sutanto, D. Load flow analysis of radial and weakly meshed distribution systems including distributed generations. In Proceedings of the 2014 Australasian Universities Power Engineering Conference (AUPEC), Perth, WA, Australia, 28 September–1 October 2014; IEEE: Piscataway, NJ, USA, 2014; pp. 1–6. [Google Scholar]
- Piccolo, A.; Siano, P. Evaluating the impact of network investment deferral on distributed generation expansion. IEEE Trans. Power Syst. 2009, 24, 1559–1567. [Google Scholar] [CrossRef]
- Borkowska, B. Probabilistic Load Flow. IEEE Trans. Power Appar. Syst. 1974, PAS-93, 752–759. [Google Scholar]
- Tao, C.; Franchetti, F. A Quasi-Monte Carlo approach for radial distribution system probabilistic load flow. In Proceedings of the IEEE PES Innovative Smart Grid Technologies (ISGT), Washington, DC, USA, 24–27 February 2013; pp. 1–6. [Google Scholar]
- Yu, H.; Chung, C.Y.; Wong, K.P.; Lee, H.W.; Zhang, J.H. Probabilistic load flow evaluation with hybrid latin hypercube sampling and cholesky decomposition. IEEE Trans. Power Syst. 2009, 24, 661–667. [Google Scholar] [CrossRef]
- Singhee, A.; Rutenbar, R.A. Why quasi-Monte Carlo is better than Monte Carlo or Latin hypercube sampling for statistical circuit analysis. IEEE Trans. Comput. Des. Integr. Circuits Syst. 2010, 29, 1763–1776. [Google Scholar] [CrossRef]
- Penuela, C.A.; Granda, M.; Mantovani, J.R.S. Probabilistic Analysis of the Distributed Power Generation in Weakly Meshed Distribution Systems. In Proceedings of the IEEE/IPES Transmission and Distribution Conference and Exposition: Latin America, Sao Paulo, Brazil, 8–10 November 2010; pp. 171–177. [Google Scholar]
- Dimitrovski, A.; Melhorn, A.C. Three-phase probabilistic load flow in radial and meshed distribution networks. IET Gener. Transm. Distrib. 2015, 9, 2743–2750. [Google Scholar]
- Liu, S.; Zhou, X.; Fan, M.; Zhang, Z. Probabilistic Power Flow Calculation Using Sigma-Point Transform Algorithm. In Proceedings of the International Conference on Power System Technology, Chongqing, China, 22–26 October 2006. [Google Scholar]
- Wu, H.; Zhou, Y.; Dong, S.; Song, Y. Probabilistic load flow based on generalized polynomial chaos. IEEE Trans. Power Syst. 2017, 32, 820–821. [Google Scholar] [CrossRef]
- Xiu, D.; Karniadakis, G.E. The Wiener-Askey polynomial chaos for stochastic differential equations. SIAM J. Sci. Comput. 2002, 24, 614–644. [Google Scholar] [CrossRef]
- Mohammadi, M.; Basirat, H.; Kargarian, A. Nonparametric Probabilistic Load Flow with Saddle Point Approximation. IEEE Trans. Smart Grid 2017, PP. [Google Scholar] [CrossRef]
- Morales, J.M.; Pérez-Ruiz, J. Point estimate schemes to solve the probabilistic power flow. IEEE Trans. Power Syst. 2007, 22, 1594–1601. [Google Scholar] [CrossRef]
- Ruiz-Rodríguez, F.J.; Hernández, J.C.; Jurado, F. Probabilistic Load-Flow Analysis of Biomass-Fuelled Gas Engines with Electrical Vehicles in Distribution Systems. Energies 2017, 10, 1536. [Google Scholar] [CrossRef]
- Xu, X.; Yan, Z. Probabilistic load flow evaluation with hybrid Latin Hypercube Sampling and multiple linear regression. In Proceedings of the Power & Energy Society General Meeting, Denver, CO, USA, 26–30 July 2015; pp. 1–12. [Google Scholar]
- Cai, D.; Shi, D.; Chen, J. Probabilistic load flow with correlated input random variables using uniform design sampling. Int. J. Electr. Power Energy Syst. 2014, 63, 105–112. [Google Scholar] [CrossRef]
- Liu, Y.; Gao, S.; Cui, H.; Yu, L. Probabilistic load flow considering correlations of input variables following arbitrary distributions. Electr. Power Syst. Res. 2016, 140, 354–362. [Google Scholar] [CrossRef]
- Mohammadi, M.; Shayegani, A.; Adaminejad, H. A new approach of point estimate method for probabilistic load flow. Int. J. Electr. Power Energy Syst. 2013, 51, 54–60. [Google Scholar] [CrossRef]
- Usaola, J. Probabilistic load flow in systems with wind generation. IET Gener. Transm. Distrib. 2009, 3, 1031–1041. [Google Scholar] [CrossRef]
- Cao, J.; Yan, Z. Probabilistic optimal power flow considering dependences of wind speed among wind farms by pair-copula method. Int. J. Electr. Power Energy Syst. 2017, 84, 296–307. [Google Scholar] [CrossRef]
- Ramezani, M.; Falaghi, H.; Singh, C. A Deterministic Approach for Probabilistic TTC Evaluation of Power Systems Including Wind Farm Based on Data Clustering. IEEE Trans. Sustain. Energy 2013, 4, 643–651. [Google Scholar] [CrossRef]
- Vita, V. Development of a decision-making algorithm for the optimum size and placement of distributed generation units in distribution networks. Energies 2017, 10, 1433. [Google Scholar] [CrossRef]
- Ameri, A.; Ounissa, A.; Nichita, C.; Djamal, A. Power Loss Analysis for Wind Power Grid Integration Based on Weibull Distribution. Energies 2017, 10, 463. [Google Scholar] [CrossRef]
- Shirmohammadi, D.; Hong, H.W.; Semlyen, A.; Luo, G.X. A compensation-based power flow method for weakly meshed distribution and transmission networks. IEEE Trans. Power Syst. 1988, 3, 753–762. [Google Scholar] [CrossRef]
- Bie, Z.; Li, G.; Liu, H.; Wang, X.; Wang, X. Studies on voltage fluctuation in the integration of wind power plants using probabilistic load flow. In Proceedings of the 2008 IEEE Power and Energy Society General Meeting Conversion and Delivery of Electrical Energy in the 21st Century, Pittsburgh, PA, USA, 20–24 July 2008; pp. 1–7. [Google Scholar]
- Feijóo, A.; Villanueva, D. Four-Parameter Models for Wind Farm Power Curves and Power Probability Density Functions. IEEE Trans. Sustain. Energy 2017, 8, 1783–1784. [Google Scholar] [CrossRef]
- Aien, M.; Fotuhi-Firuzabad, M.; Aminifar, F. Probabilistic load flow in correlated uncertain environment using unscented transformation. IEEE Trans. Power Syst. 2012, 27, 2233–2241. [Google Scholar] [CrossRef]
- Xu, R. Survey of clustering algorithms for MANET. IEEE Trans. Neural Netw. 2005, 16, 645–678. [Google Scholar] [CrossRef] [PubMed]
- MacQueen, J. Some methods for classification and analysis of multivariate observations. In Proceedings of the Fifth Berkeley Symposium on Mathematical Statistics and Probability, Statistical Laboratory of the University of California, Berkeley, CA, USA, 21 June–18 July 1965, 27 December 1965–7 January 1966; University of California Press: Berkeley, CA, USA, 1967; Volume 1, pp. 281–297. [Google Scholar]
- Ruiz-Rodriguez, F.J.; Hernandez, C.; Jurado, F. Probabilistic load flow for radial distribution networks with photovoltaic generators. IET Renew. Power Gener. 2012, 6, 110–121. [Google Scholar] [CrossRef]
- Chakravorty, M.; Das, D. Voltage stability analysis of radial distribution networks. Elect. Power Energy Syst. 2001, 23, 129–135. [Google Scholar] [CrossRef]


© 2018 by the authors. Licensee MDPI, Basel, Switzerland. This article is an open access article distributed under the terms and conditions of the Creative Commons Attribution (CC BY) license (http://creativecommons.org/licenses/by/4.0/).