1. Introduction
Microgrids are encouraging sources to solve the energy crisis and carbon emission problems around the globe. Microgrids usually consist of renewable energy sources (RESs), i.e., wind power generation, solar panel, tidal, etc. Due to the many advantages of microgrids, many countries have mandates for the utility companies to increase the power generation from renewable sources. The California government made a decision and signed a bill with utilities that all electricity providers must provide 33% of their total supply from renewable sources. Furthermore, a microgrid can operate in two modes: grid-connected mode and islanded mode. In a grid-connected mode, the microgrid is connected with external grids and able to share electricity with them; however, in an islanded mode, a microgrid is restricted to share energy with the external grid. Nowadays, both academia and industry are focusing on the challenges of microgrids, i.e., integration with the smart grid network, intermittent nature, optimal power flow, etc. A lot of solutions have been proposed to tackle the intermittent nature of microgrid energy generation [
1]. Weather (wind speed, temperature and irradiations) can be forecasted by the deep neural network (DNN), artificial neural network (ANN) or any other prediction model.
A lot of research studies focus on a novel concept sharing economy or power trading in a smart grid. A smart home that is powered by a microgrid for its own electricity generation can sell its extra electricity to neighbors or an external grid. Our previous paper [
2] proposes an optimization method for electricity consumers to earn a maximum profit through power trading, where smart homes try to purchase electricity in off-peak hours; however, they sell out when rates are the highest and, in this way, they earn the profit. In a sharing economy, smart homes share excess electricity with each other and alleviate imported electricity from the external grid. In this way, they minimize their electricity bills. For this purpose, a platform is required that provides secure communication and data storage services, and high computation power to deal with a huge amount of requests coming from several consumers from a community.
In this regard, cloud computing has been used as an efficient way for home energy management (HEM). Cloud computing provided three main services: Infrastructure-as-a-Service, Software-as-a-Service and Platform-as-a-Service to meet with storage and high computing issues [
3]. The cloud computing paradigm is a centralized computing model; this means that all the requests and data need to be sent to a centralized system. With the passage of time, data processing capabilities of the clouds are being improved; however, the network bandwidth has not been increased appreciably [
4]. To cope with such challenges of cloud computing, the concept of fog computing is introduced. It enhances the services of the cloud to the edge of the network and makes communication, computation and storage closer to end-users and edge devices. It also improves security, privacy, network bandwidth, mobility, low-latency, etc., [
5,
6]. Therefore, in this paper, fog computing is used as a platform to tackle energy management related issues in the smart grid.
The main contributions of our work are described below:
We formulate the energy management and sharing economy problem and present the optimal approach to tackle this problem based on fog computing.
We propose a cost and imported electricity minimization scheme to make the environment greener.
A fog based platform is developed to store data and share energy among smart users.
An ANN based model is developed in this work to forecast weather information for the microgrid.
The remainder of the paper is organized as follows. Related work is disclosed in the next section and
Section 3 describes the proposed system model.
Section 4 presents the performance evaluation and simulation results’ discussion. In the last,
Section 5 uncovers the conclusion and the future directions.
2. Related Work
In the last decade, a lot of research papers have been devoted towards the HEM systems in cloud and fog computing environments. In these articles, cloud/fog services have been used to tackle different power related issues.
Technological improvements, cost reduction and enhanced features of low power radio frequency devices have made their vast deployment possible in the form of the internet of things (IoT). Billions of devices can be part of an IoT network that can perform sensing, communication, computation and actuation. A huge amount of data generated by these massively deployed resource-constrained devices may increase the response time for delay sensitive applications and they require powerful computing resources for data management, processing and analysis. Powerful resources required by IoT may be provided by cloud computing; however, scalability and latency have become the potential bottleneck. To overcome the scalability and latency issues of cloud computing, the authors of [
7] have demonstrated energy management as a service over a fog computing platform in two different domains, namely: HEM and microgrid level energy management. Fog computing enables the IoT with pre-processing of data while meeting the low latency requirements. Considering the implementation cost and time to market, the authors of this paper have developed and experimented the affordable prototypes of HEM and microgrid level energy management having objectives of scalability, local and remote monitoring, interpretability, open architecture, ease of deployment and plug-n-play capability. The authors have concluded that the implementation of the proposed prototypes over fog computing provides connectivity, interpretability, flexibility and low latency features for the energy management system. In [
8], an electrical vehicle (EV) charging and discharging problem is solved based on cloud computing. placed at the cloud platform. The authors of this paper have categorized the EVs into calendar plug-in EVs (who have created their profiles on the cloud) and random plug-in EVs (who have not yet created their profiles on the cloud). Calendar plug-in EVs have higher priority than random plug-in EVs. Two algorithms, namely: EV calendar priority attribution (EV-CPA) for EVs with calendar plug-in and EV random priority attribution (EV-RPA) for EVs with random plug-in have been proposed and implemented through MATLAB by the authors for scheduling of charging and discharging of EVs. The authors have proposed a local station controller (LSC) for each group of public supply stations. All LSCs interact with a central station controller (CSC), placed at the cloud platform, which in turn interacts with smart grid utilities. Simulation results show that the implementation of the proposed algorithms assisted EVs to act as distributed storage sources and flexible loads that are beneficial for grid stability, especially during peak hours.
Electricity consumers are charged differently during different time periods. The authors of [
9] have considered a group of homes powered by the same substation. They have assumed that appliances installed in a group of homes are controlled by demand/response switches. Each appliance has been associated with the power consumption and service time for which a user has decided to switch ON the home appliances to reduce the peak power consumption. Considering a scheduling problem as an non-deterministic polynomial (NP)-hard problem, the authors have proposed a scheduling algorithm which works under both online and offline settings. For online settings, authors have adopted a greedy approach while a constant approximation algorithm has been proposed for offline settings. Simulation results show that the proposed schedulers perform better than existing heuristic techniques. The growth of societal awareness about environmental implications caused by fossil fuel consumption has urged the research community to work on green energy. As the cloud data centers are one of the major electricity consumers, it is thus a big challenge for cloud service providers to ensure their green service level agreements with their customers while maintaining their business objectives. In [
10], the authors have proposed the implicit and explicit integration of RESs with traditional power sources for green power management. The authors have handled the uncertainty of RESs through virtualization. For validation of the proposed scheme, they have performed real-time experiments that prove that, without incurring additional costs, green SLA can be successfully established.
The authors of [
11] propose an efficient resource management scheme based on the cloud-fog platform in the smart grid. They have used five heuristic algorithms for load balancing. Furthermore, a hybrid algorithm of an artificial bee colony (ABC) and ant colony optimization (ACO) named ABACO is developed for load balancing. Simulation results show that the proposed hybrid algorithm shows supremacy over other heuristic techniques. In [
12], a fog-based architecture is developed for the IoT applications in the smart grid. The purpose of this work is to provide latency sensitive monitoring, location-aware and intelligent control for IoT in the smart grid. Moreover, a novel fog based architecture is also developed to extend computing to the edge of a network. Experimental analysis shows the effectiveness of their proposed model over other counterparts.
In [
13], a business model is developed to share an economy that is based on an energy storage system. Their proposed approach helps to update storage systems’ operators and investors to make energy storage systems more economical. Storage systems are considered significant solutions to integrate intermittent RESs into the smart grid. Simulation results express that proper storage system management leads to maximum profit while energy sharing. Furthermore, they also provide a comparison with state-of-the-art schemes and their proposed approach shows effectiveness in terms of sharing the economy with maximum profit. Long et al. propose a peer-to-peer energy sharing scheme in a residential area, which is empowered by microgrids [
14]. They also develop an energy sharing coordinator (ESC) as a third party for managing RESs. According to their proposed method, first, to reduce the energy cost, a constrained nonlinear programming with the rolling horizon is implemented. Later, a rule based control is carried out to update the control set points on the basis of real-time measurements. It is confirmed from simulation results that the proposed peer-to-peer energy sharing method minimize the cost by 30% as compared to traditional method (home to grid energy trading).
In [
15], a new dynamic pricing method is proposed to offer decentralized power trading and optimize financial incentives for the owners of RESs. A price-responsive model for every type of RES is investigated and then an adaptive three-tiered framework is developed that considers the aggregator scheduling, microgrid balancing and power trading optimization. Their proposed framework is able to maximize the financial incentives for RES owners. A real-time case study is simulated in a Java agent development framework that is based on multi-agent modeling. Experimental results show that the proposed method provides decentralized power trading and easy marketization of microgrids. Sana et al. propose a game theory based technique for demand side management while incorporating storage systems and considering supply constraints [
16]. Their proposed game theory based approach not only minimizes the peak to average ratio (PAR) but also balances the demand and supply profile. They also present the case study for validation of the proposed approach. In addition, blockchain technologies are introduced to assure the secure implementation of a novel developed approach.
The authors of [
17] present a forecasting model to predict solar energy through a hybrid model that consists of wavelet transform and neural network. Root mean square error (RMSE) and mean absolute error (MAE) are used to evaluate the developed forecasting model. They validate the developed model through simulations. The proposed model is also validated on a 5 kW real-time system. Furthermore, the obtained results from their proposed model are compared with the existing systems and the proposed model shows efficacy over there.
A work presented in [
18] proposes the peer-to-peer energy trading among buildings, homes or offices in the residential sector. Furthermore, a novel hierarchical model is presented to explain key elements of peer-to-peer energy trading. This peer-to-peer trading problem is solved by the game theory. A power trading platform, namely “Elecbay”, is also developed for easy bidding of energy. Simulation results indicate that their proposed scheme balances between electricity generation and consumption. The authors of [
19] presents an economical sharing technique without considering any communication module for islanded microgrids. The voltage output phase is regulated by its corresponding incremental cost and further equal incremental rule is considered to guarantee the economic sharing. Furthermore, a modified method is also proposed while considering capacity constraints. They also perform stability analysis of the proposed scheme and optimal conditions for economic optimally are achieved. The total cost of the system is also minimal because communication modules are not needed. The effectiveness of their proposed scheme is validated by simulations and results describe the effectiveness of the developed scheme. Another new drop control strategy (DCS) is developed for power sharing between consumers in [
20]. All the system parameters, i.e., load disturbances and uncertainties are also taken into account while power sharing. The novel technique is developed by a sliding mode algorithm that is based on the Takagi–Sugeno (T–S) fuzzy model. Simulation results show that the load changes of the microgrid can be regulated more adaptively.
However, in [
18], selling excess energy through bidding is not possible for every end user and some prosumers are unable to trade due to time limitations, lack of expertise, lack of technology, etc. Furthermore, the authors of [
19,
20] concluded that the proportional load power sharing can be accurately achieved; however, practically, it is not possible to share power without any communication. In this research, we have proposed an energy efficient approach for cost and imported electricity alleviation. All prosumers are able to share their excess energy with each other through Fog services. We consider fog as a service in this work to store data and computational tasks.
3. System Model
This section explains the complete system model including energy consumption model, pricing model, microgrid integration model and the sharing economy model. Furthermore, we formulate the cost and imported electricity alleviation problem on the basis of these models.
In this paper, we develop a system for the future smart grid to alleviate the electricity cost and imported power from the commercial grid.
Figure 1 depicts our proposed system model in which we have
n number of smart homes connected with the fog server. The fog server is a platform that provides the services for the power sharing and trading. Each smart home has a smart meter that acts as a communication medium with the fog server. Each home has its own green energy sources, i.e., wind turbine and solar energy known as a home microgrid. Each user fulfills his energy demand from the home microgrid in the first step and deficit energy is shared by the neighbours and then, if any home still needs energy, it is provided by the commercial grid.
3.1. Electricity Pricing
The time of use (ToU) pricing signals are considered in this work to calculate the cost of electricity, which is imported from the commercial grid and it is shown by in time t . Actually, utilities provide different pricing schemes to motivate the consumers to manage their electricity consumption. Thus, in order to reduce electricity costs, consumers try to schedule their appliances in off-peak intervals. The ToU pricing scheme is divided into three blocks: on-peak, mid-peak and off-peak hours. In on-peaks, electricity rates are high and consumers pay a minimum cost in off-peak hours; however, in mid-peak, rates are a little bit higher than off-peak but less than on-peak hours.
3.2. Electricity Cost Calculation
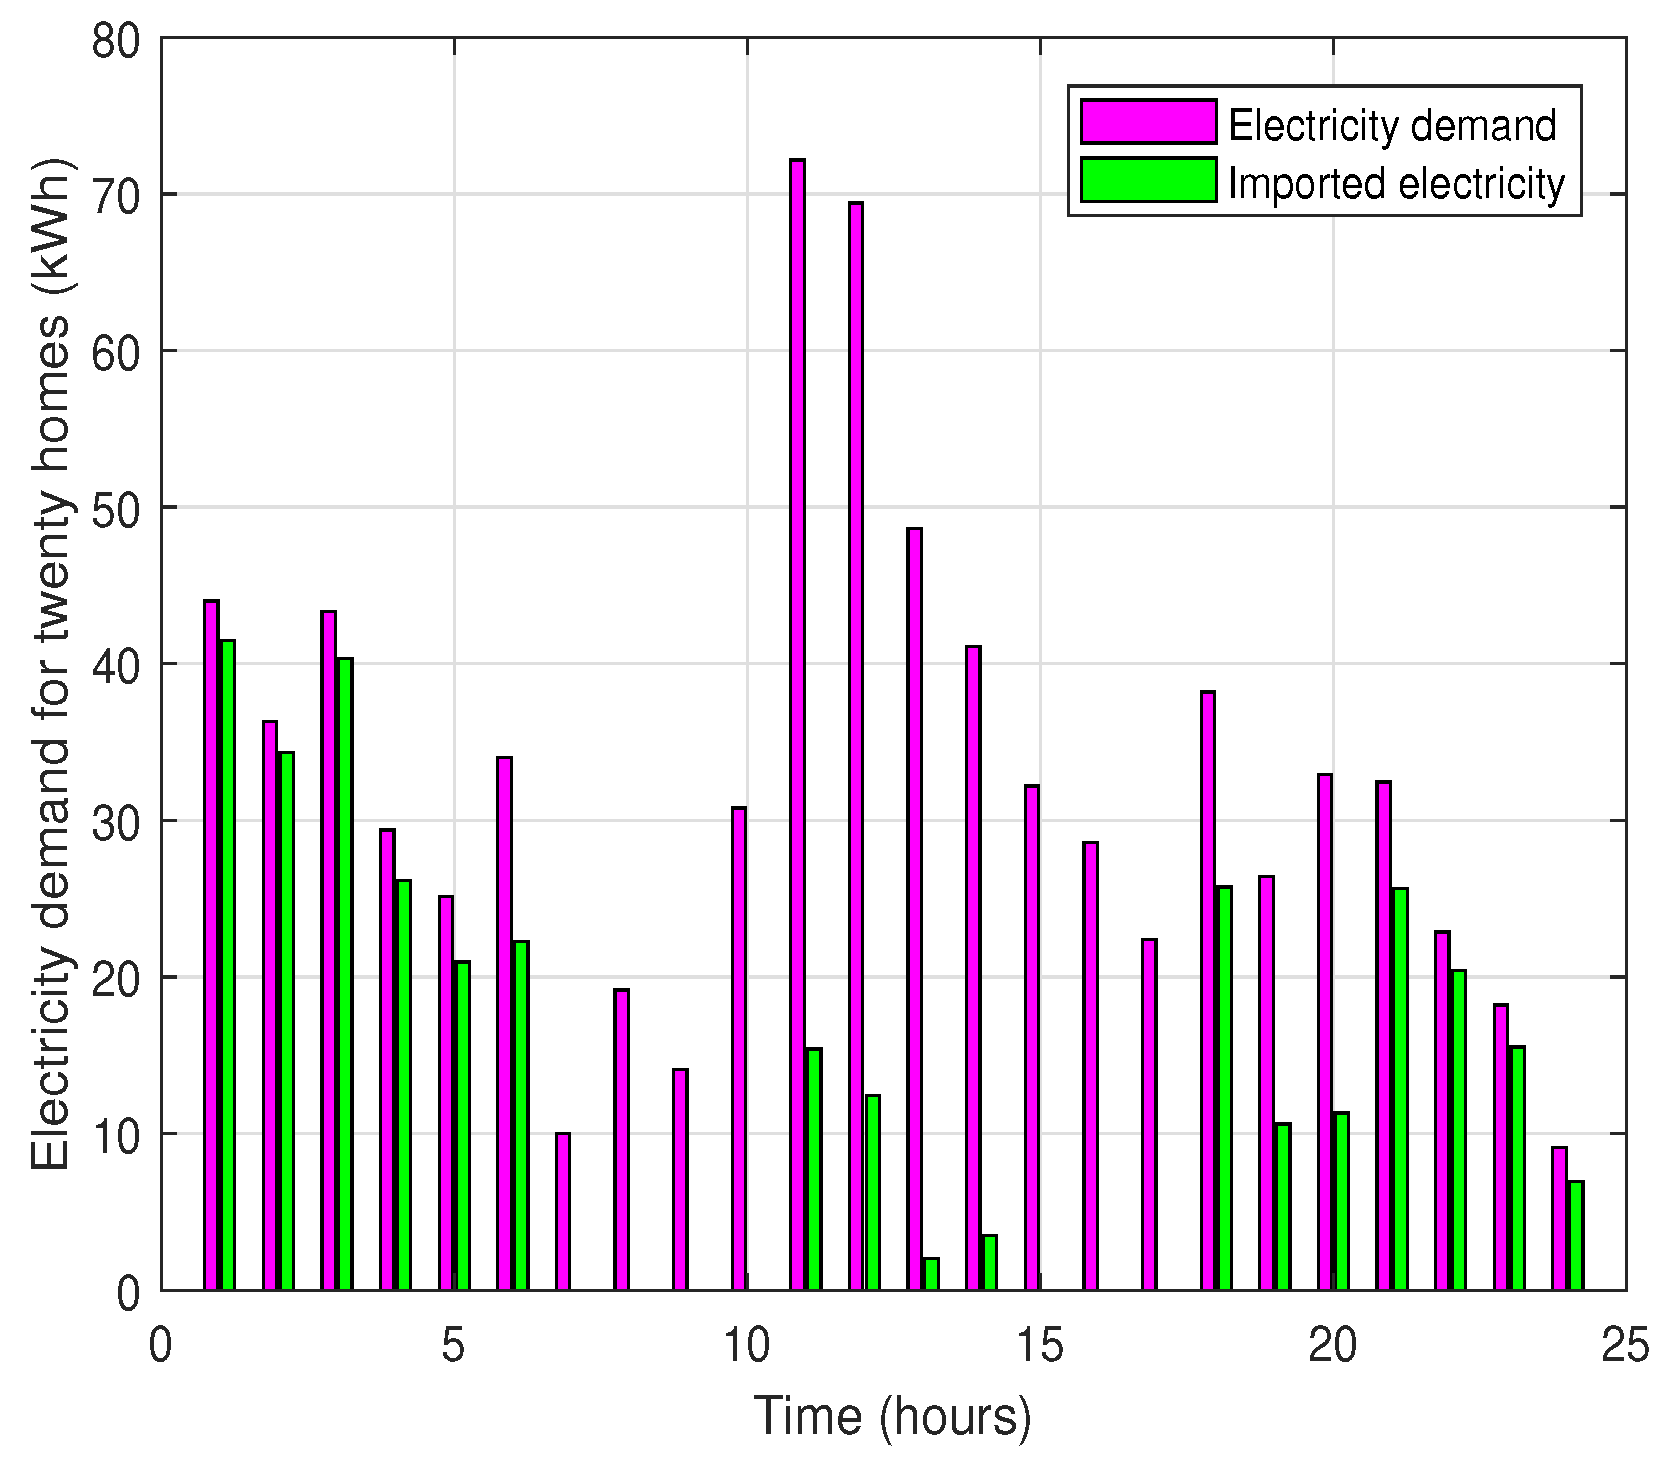
Each consumer pays electricity costs against purchased electricity from the utility company. However, according to our proposed model, we try to reduce the imported electricity by energy sharing among prosumers. First, they consume electricity from their own green sources, i.e., solar cell and wind turbine. The hourly power generated by microgrid is calculated as:
where
shows the energy generated by all microgrid units in time interval
t. The term
m presents the single microgrid unit and all units are indicated by
M.
is a generated electricity from any microgrid unit. Furthermore, the total hourly electricity generation by all smart homes is expressed by:
where
h and
H show the single and total homes, respectively. Thus, users can consume their own produced energy and deficit load is imported from the utility. The total load and imported energy of multiple homes are calculated by Equations (
3) and (
4), respectively:
where
In Equation (
5), 1 means that load is greater than generation and electricity is imported from the commercial grid. However, when
= −1, electricity is exported to other consumers and, in case of 0, no electricity will be exported or imported.
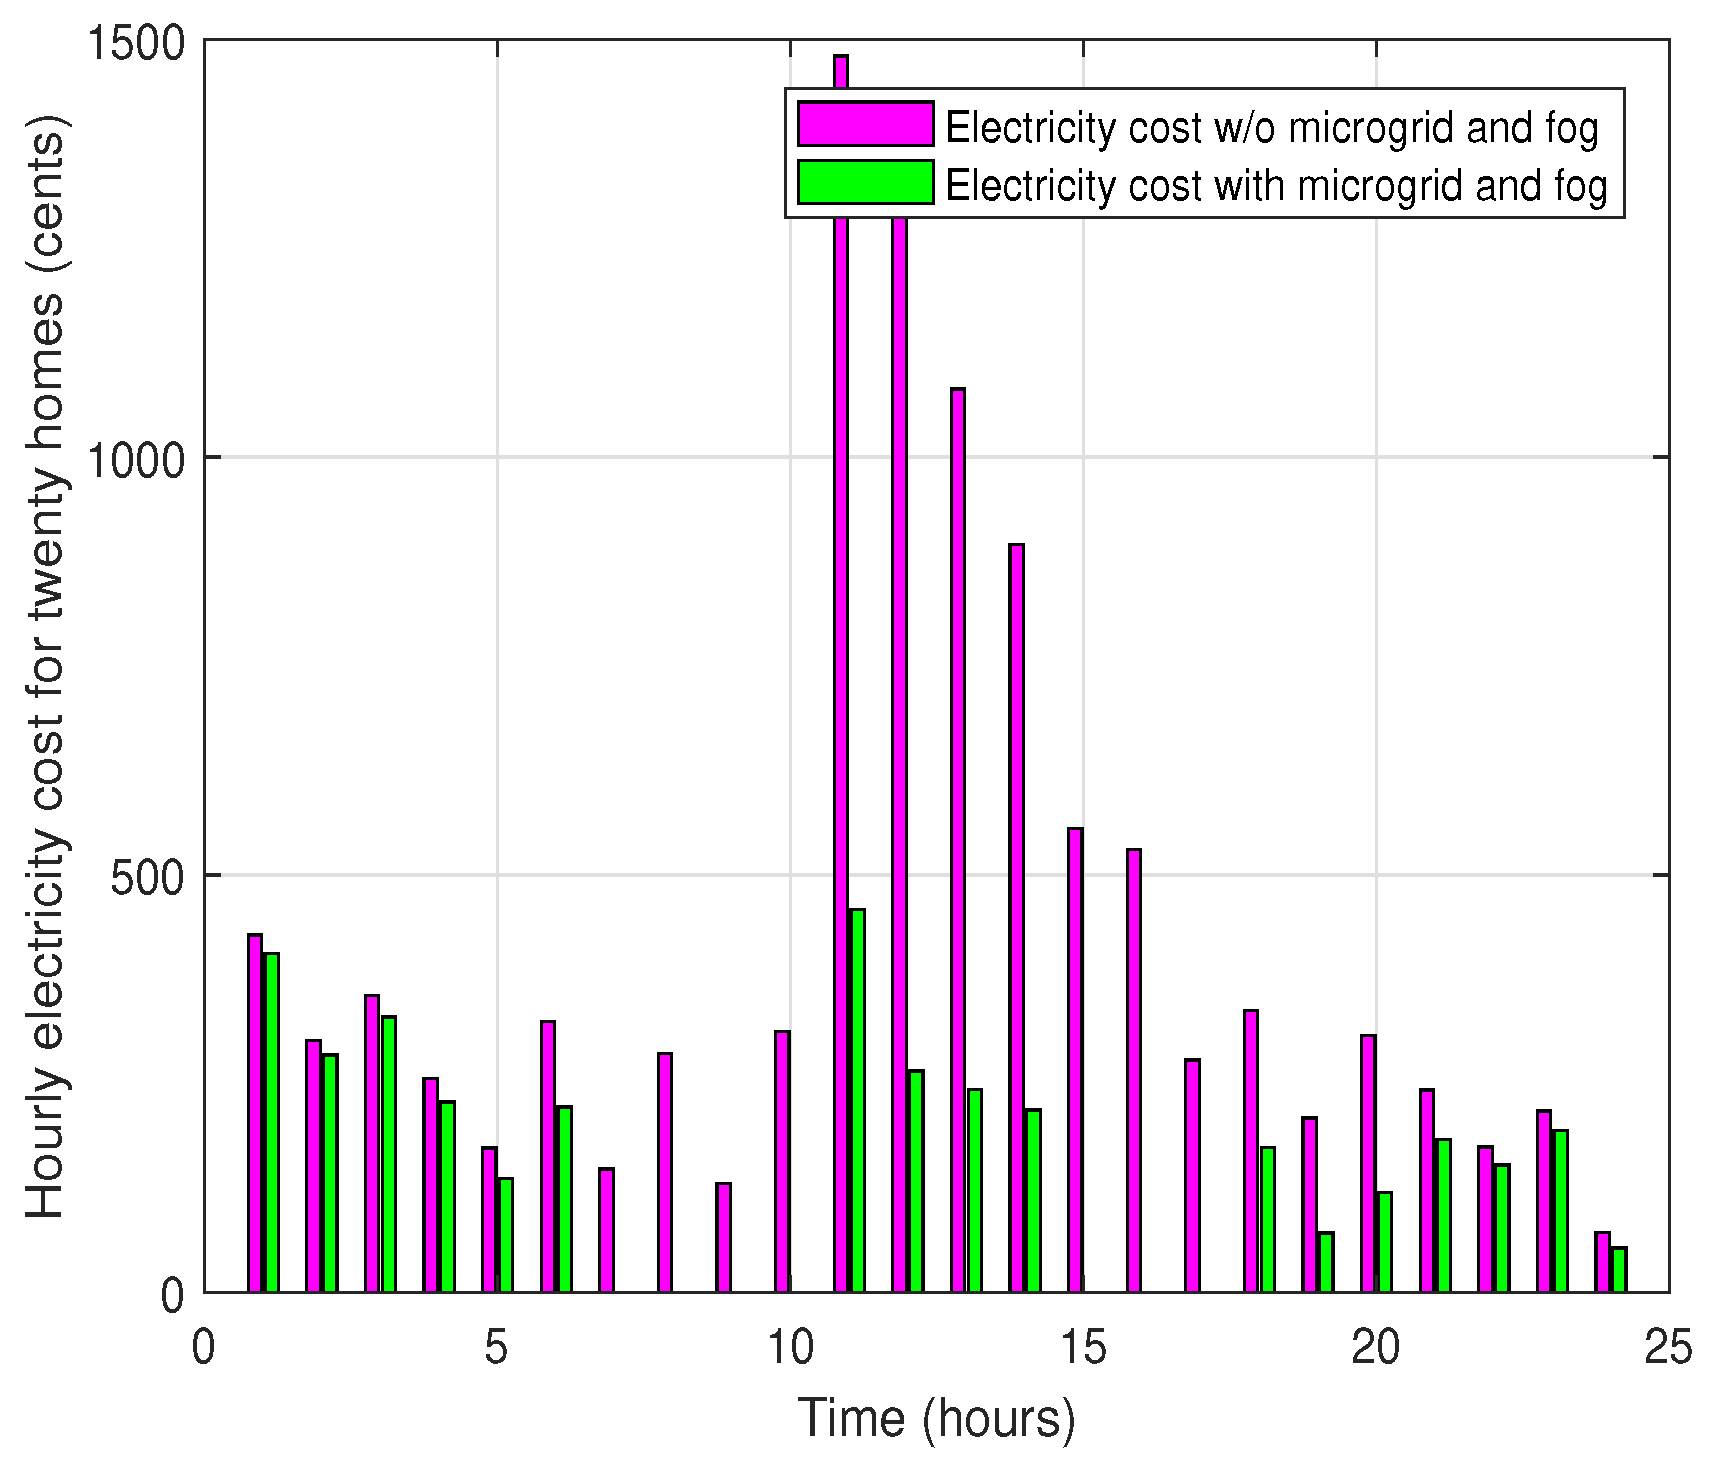
ToU pricing signals are taken into account for electricity cost calculation. The hourly electricity cost against all consumers is calculated as:
Here,
shows total electricity cost at time slot t and
describes a pricing signal at a specific time interval. Furthermore, the total cost for a whole day against all consumers is expressed by Equation (
7):
3.3. Microgrid
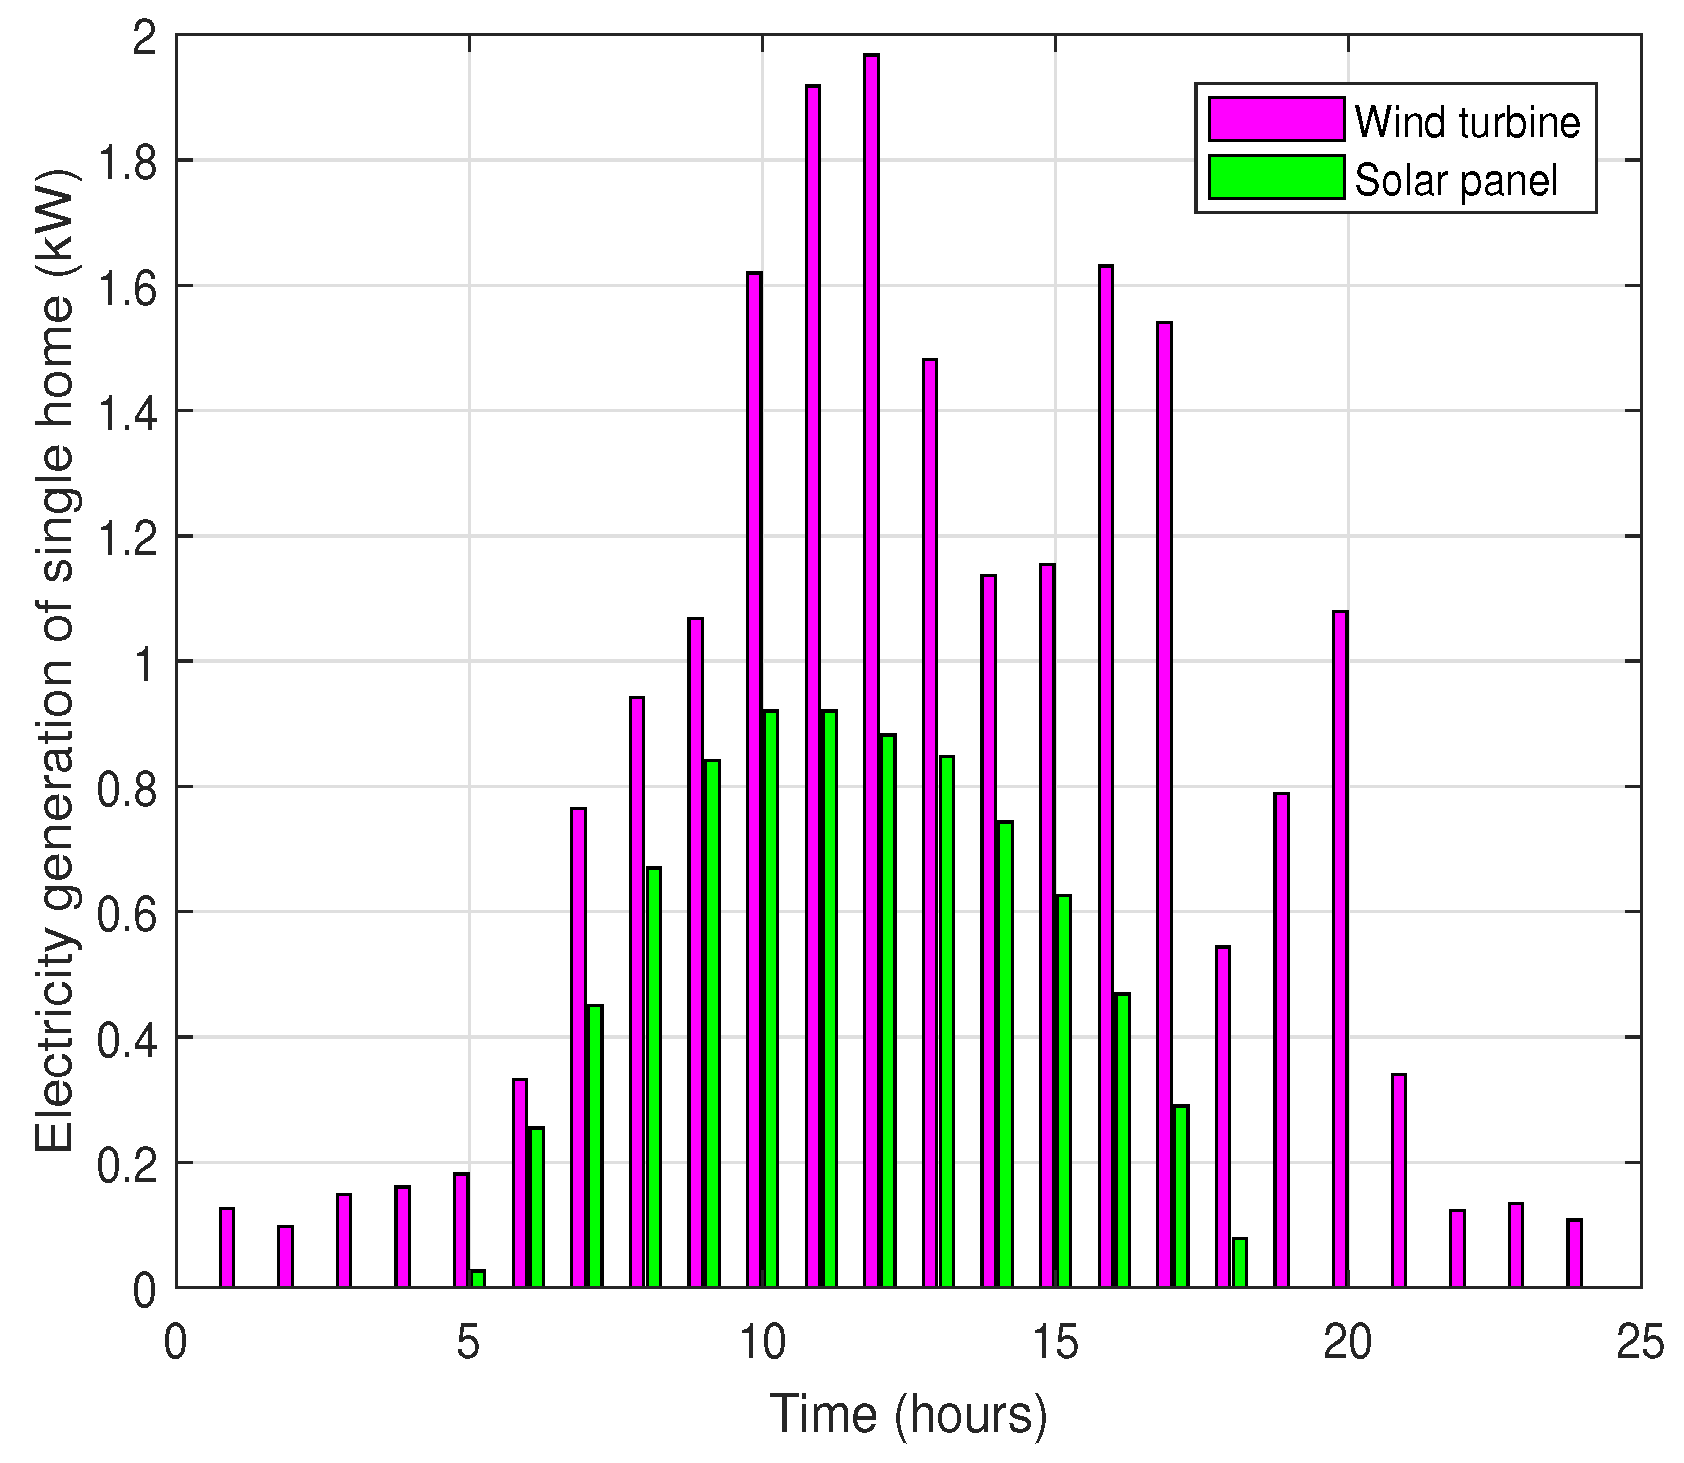
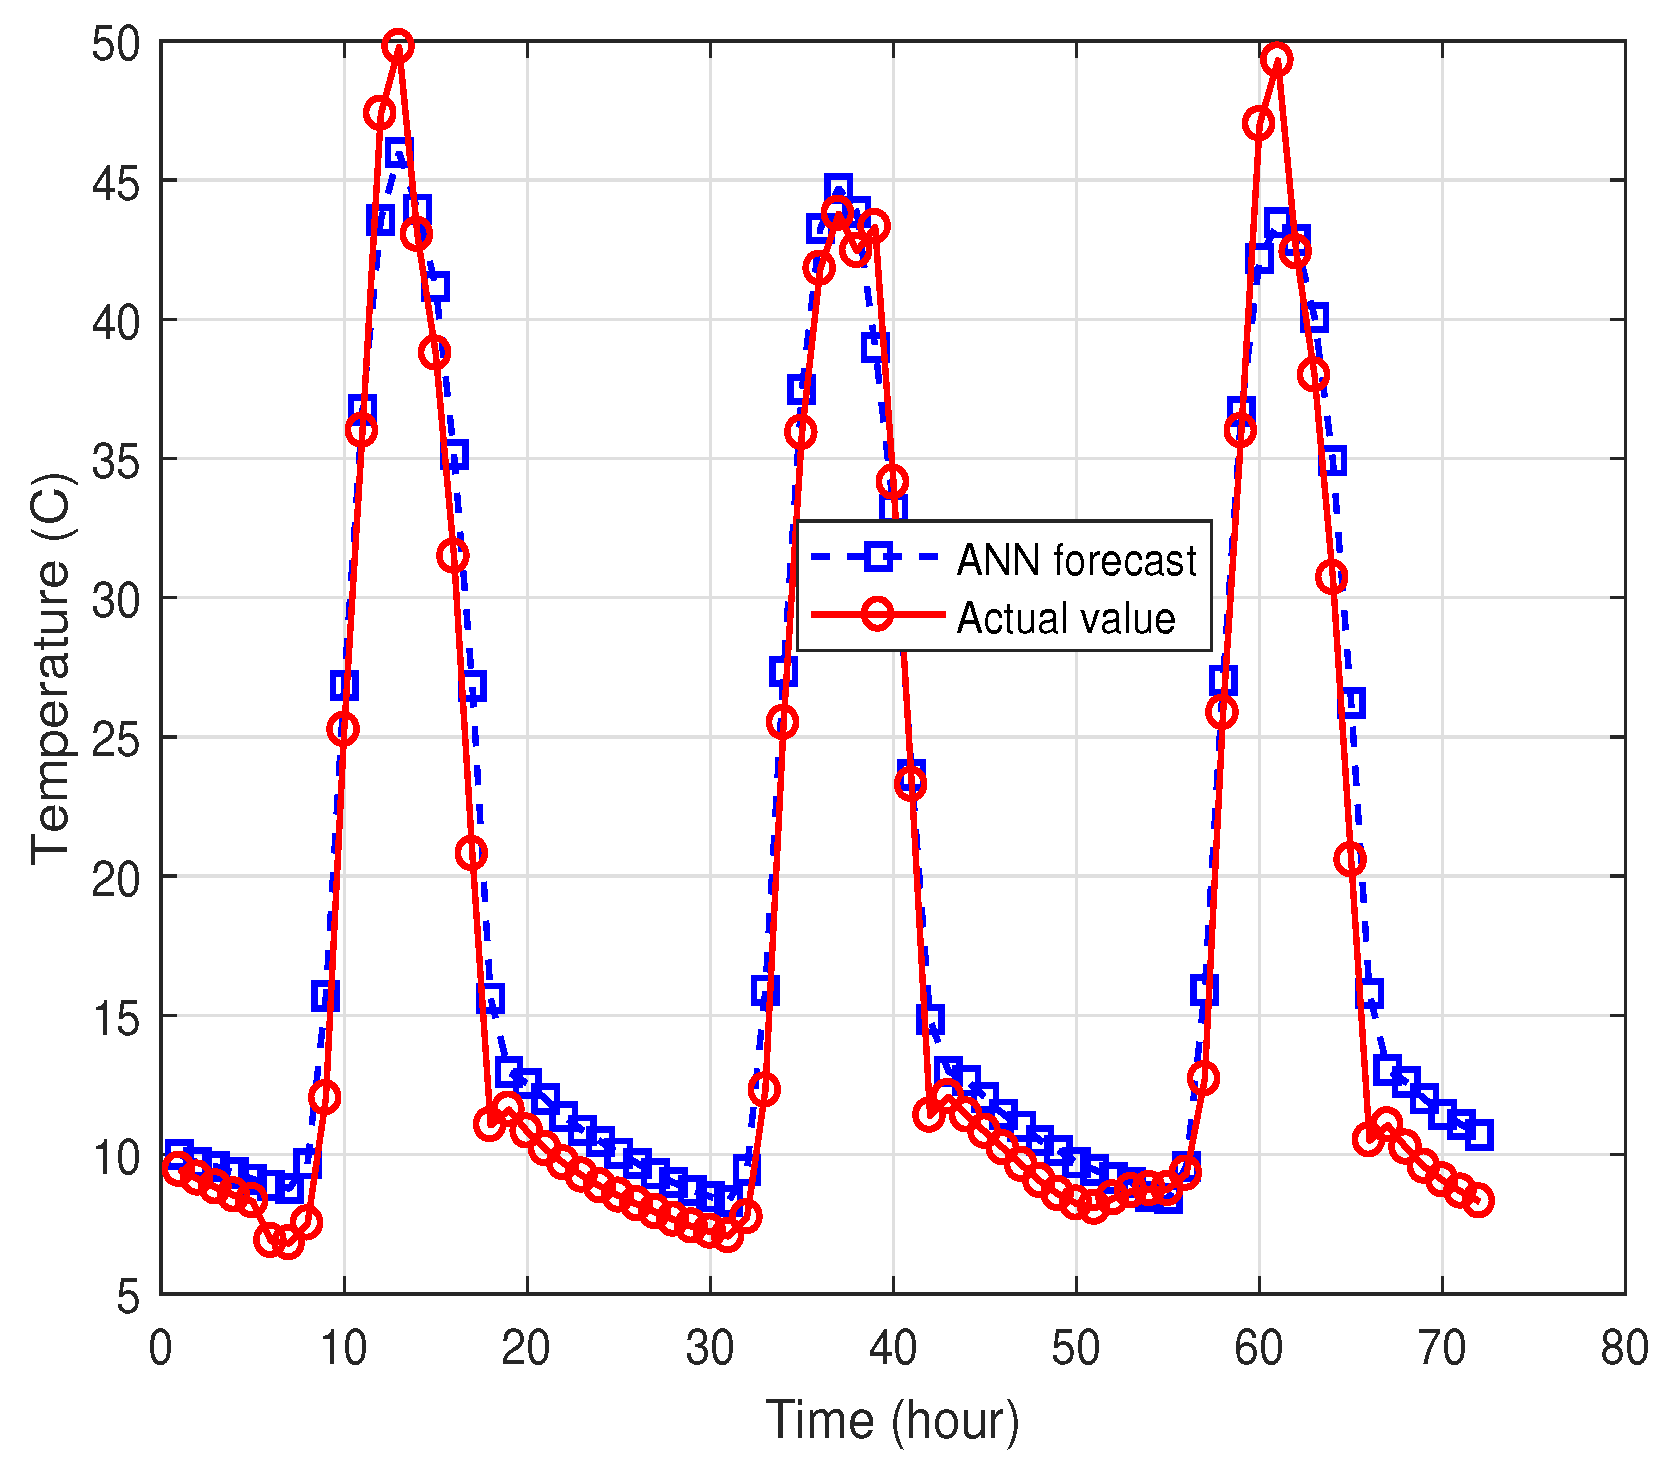
A microgrid is also integrated in this work to make the environment greener and minimize electricity cost. It contains a solar panel and a wind turbine. An ANN model is also developed to forecast wind speed and temperature for more accurate energy management in a fog environment. The microgrid units are explained below.
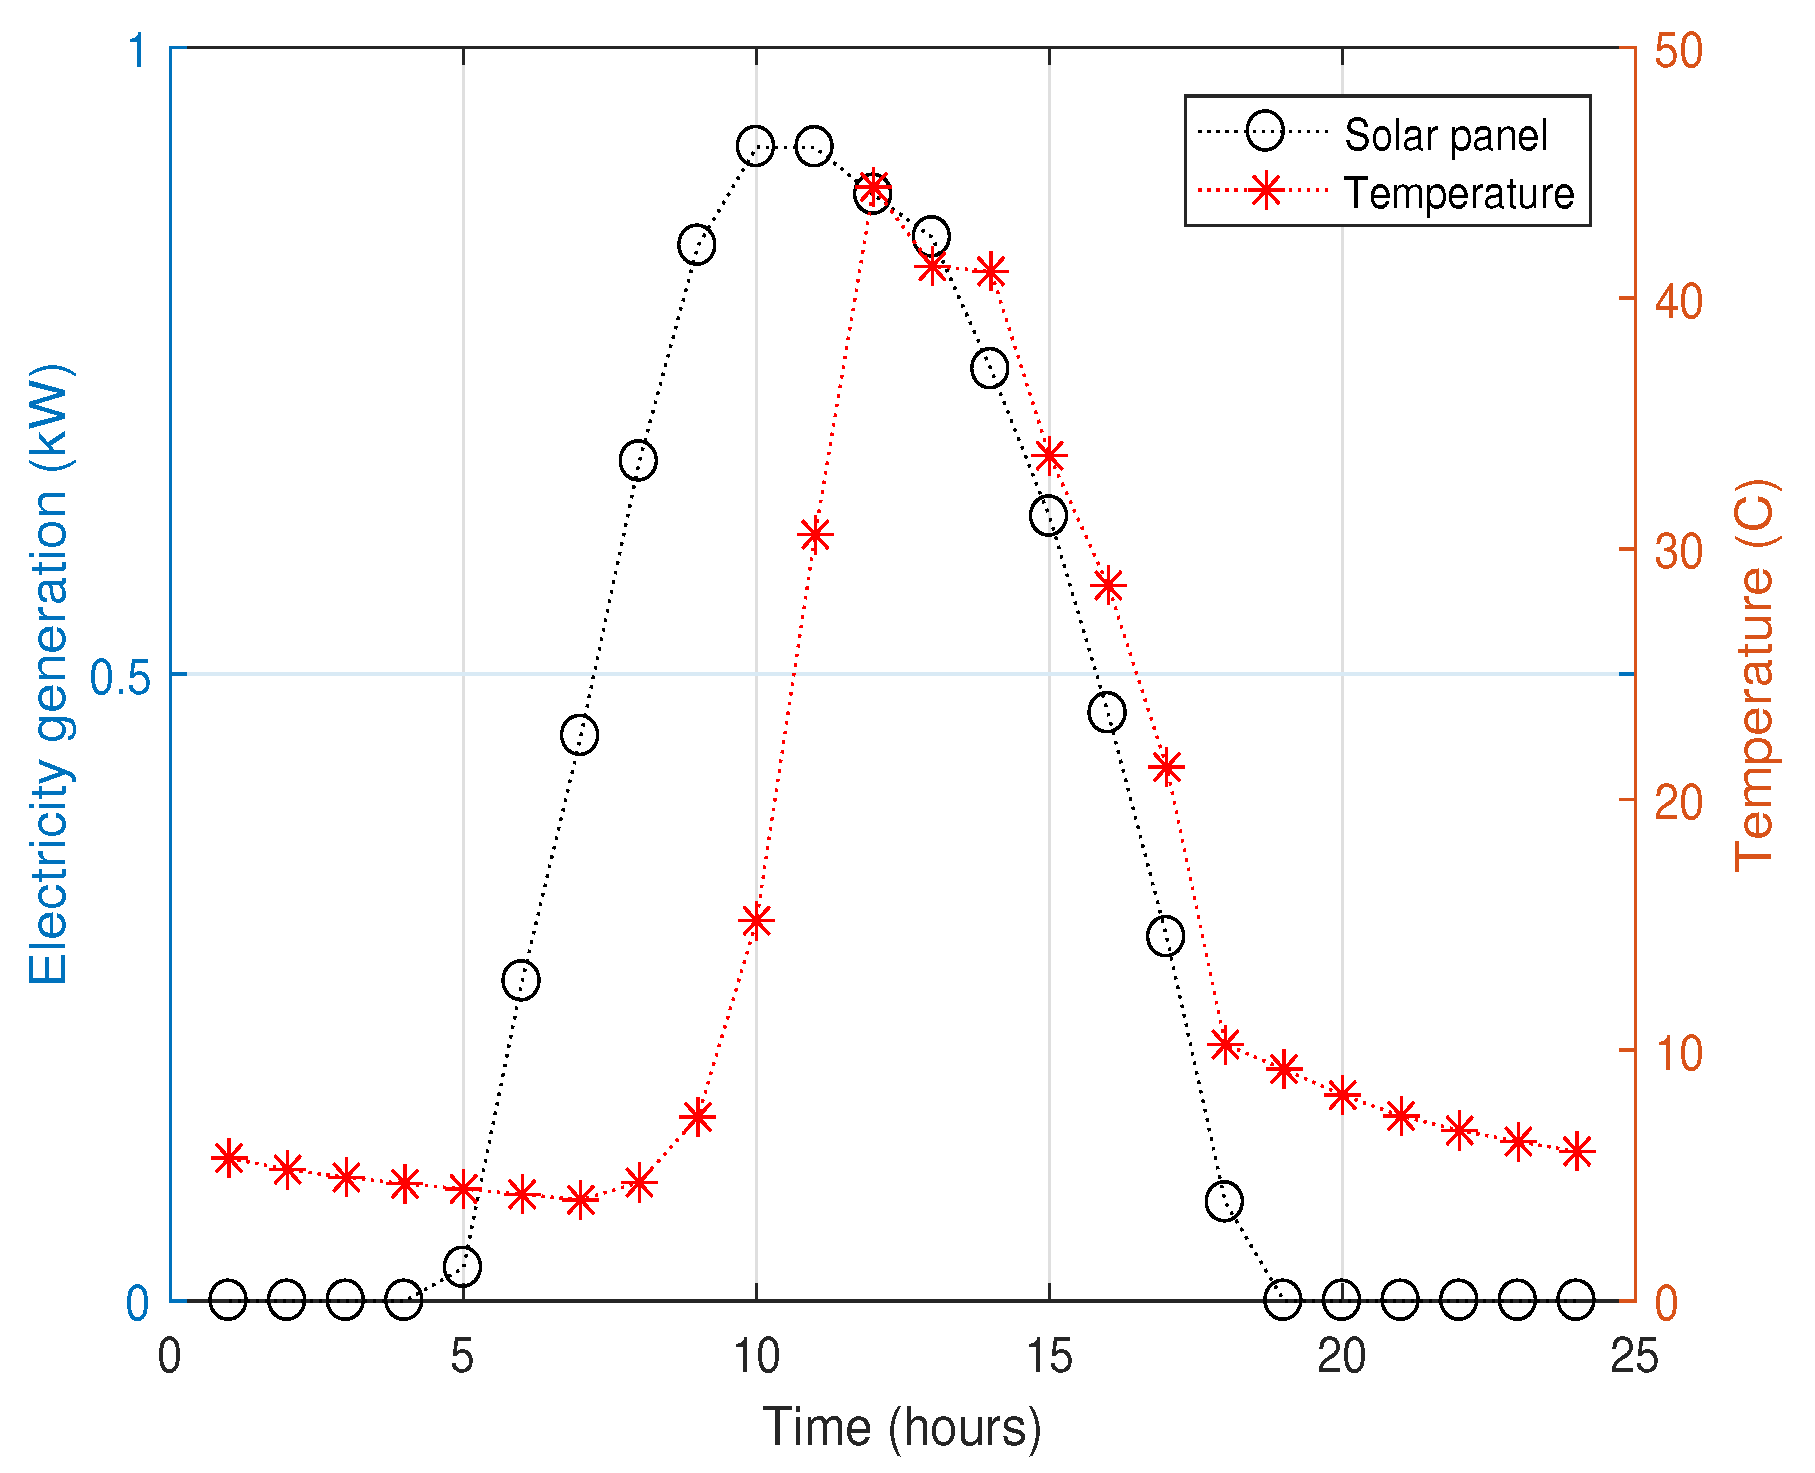
Solar panel: We integrate solar panels to convert solar energy into power. The electricity is generated by solar panel in direct current (DC); therefore, an inverter is also installed to convert generated electricity to alternating current (AC). Furthermore, a solar panel totally depends on irradiation and temperature. When solar has high irradiation, a panel generates maximum electricity and vice versa. We calculate the generated electricity from the solar panel by the following equation [
21]:
Here, presents the generated electricity from the solar panel on an hourly basis. The efficiency and the area of a solar panel are denoted by and , respectively. and show the irradiations and temperature, respectively.
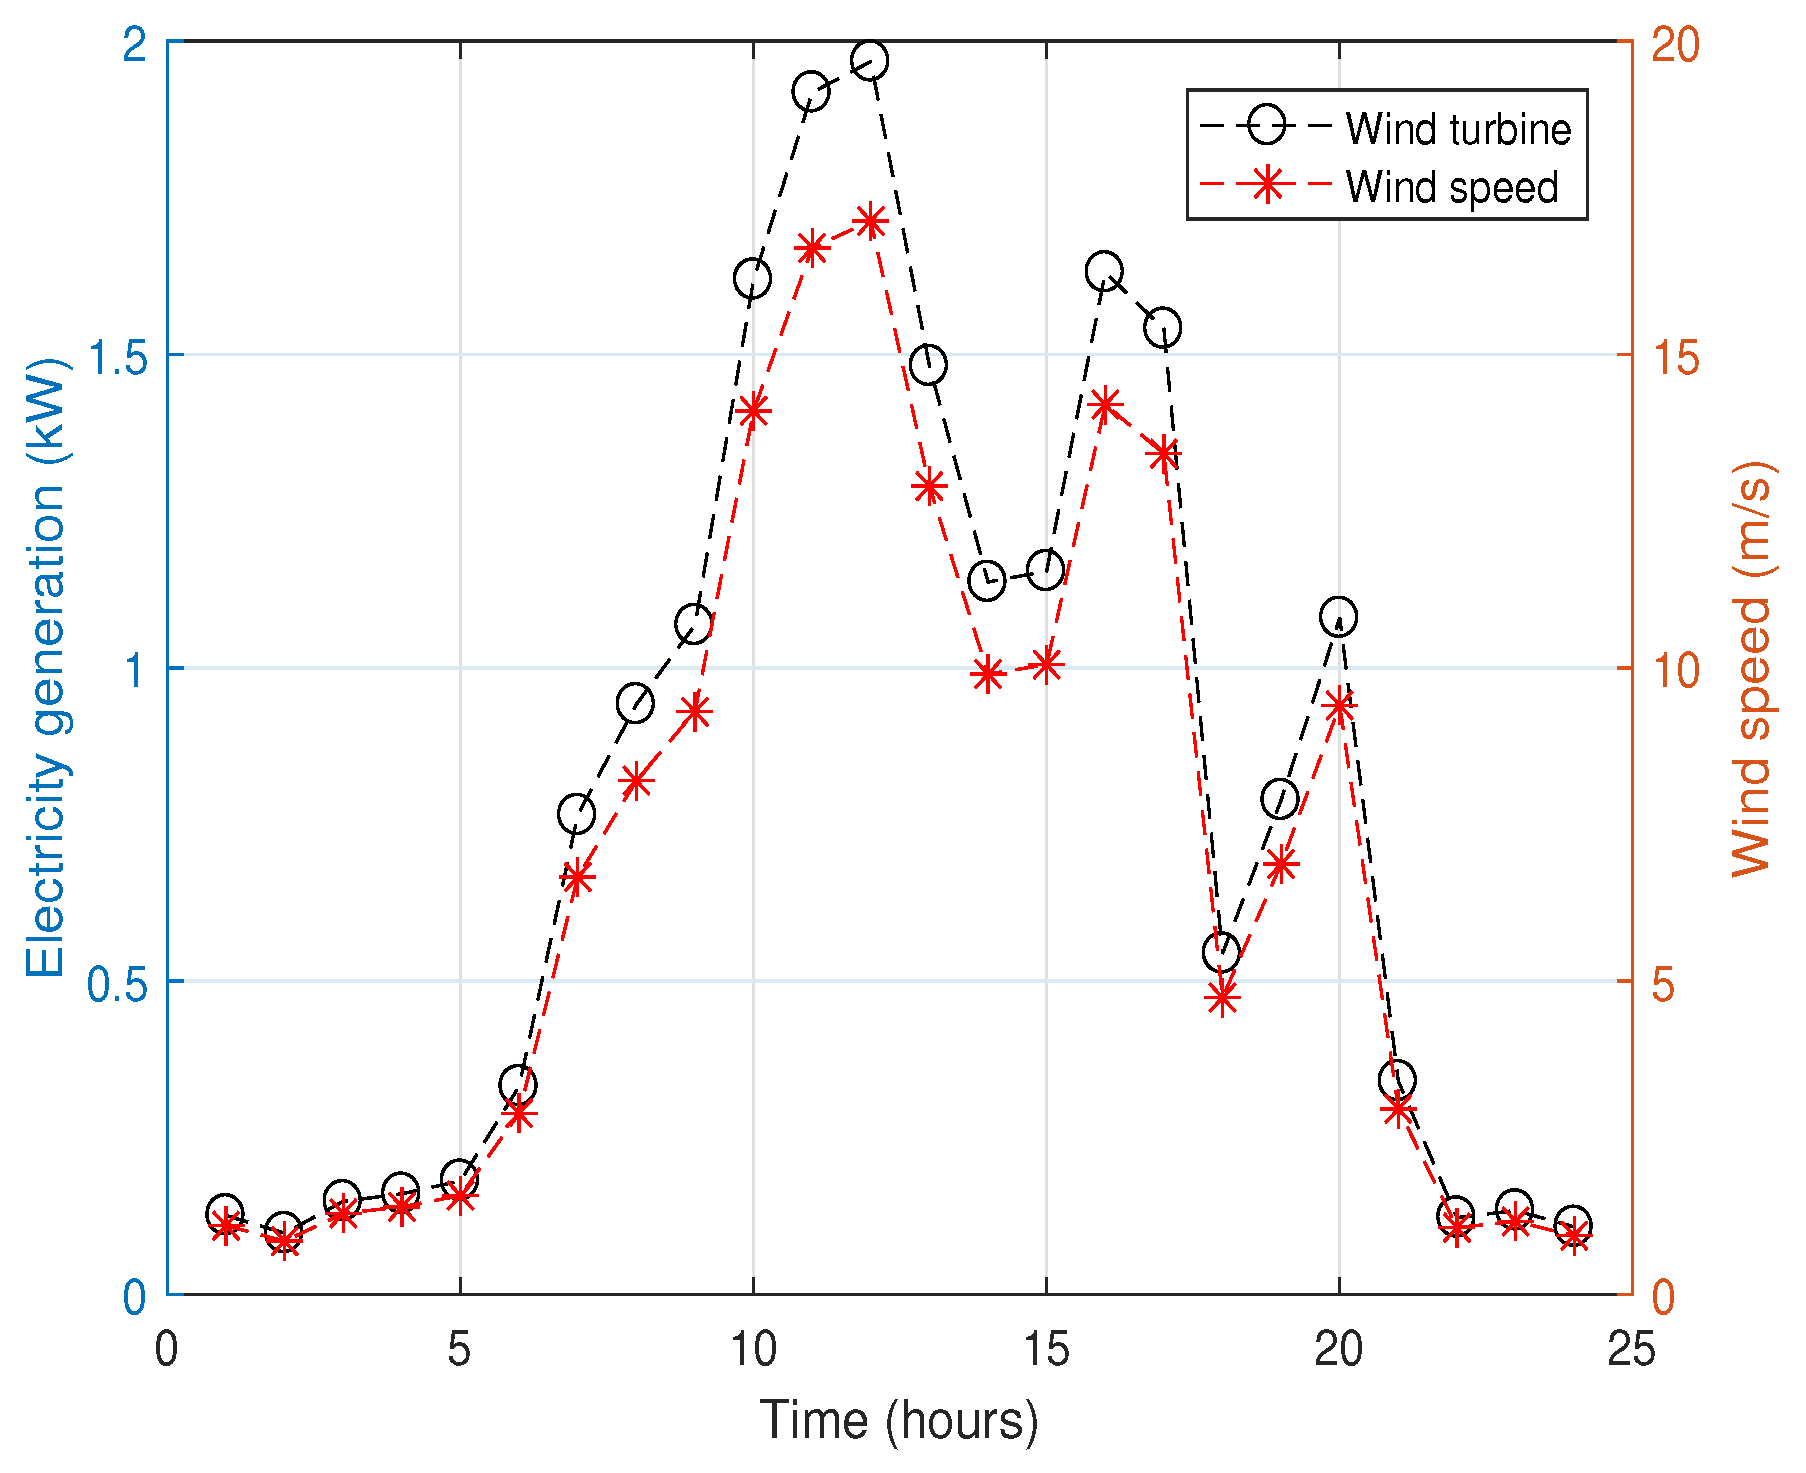
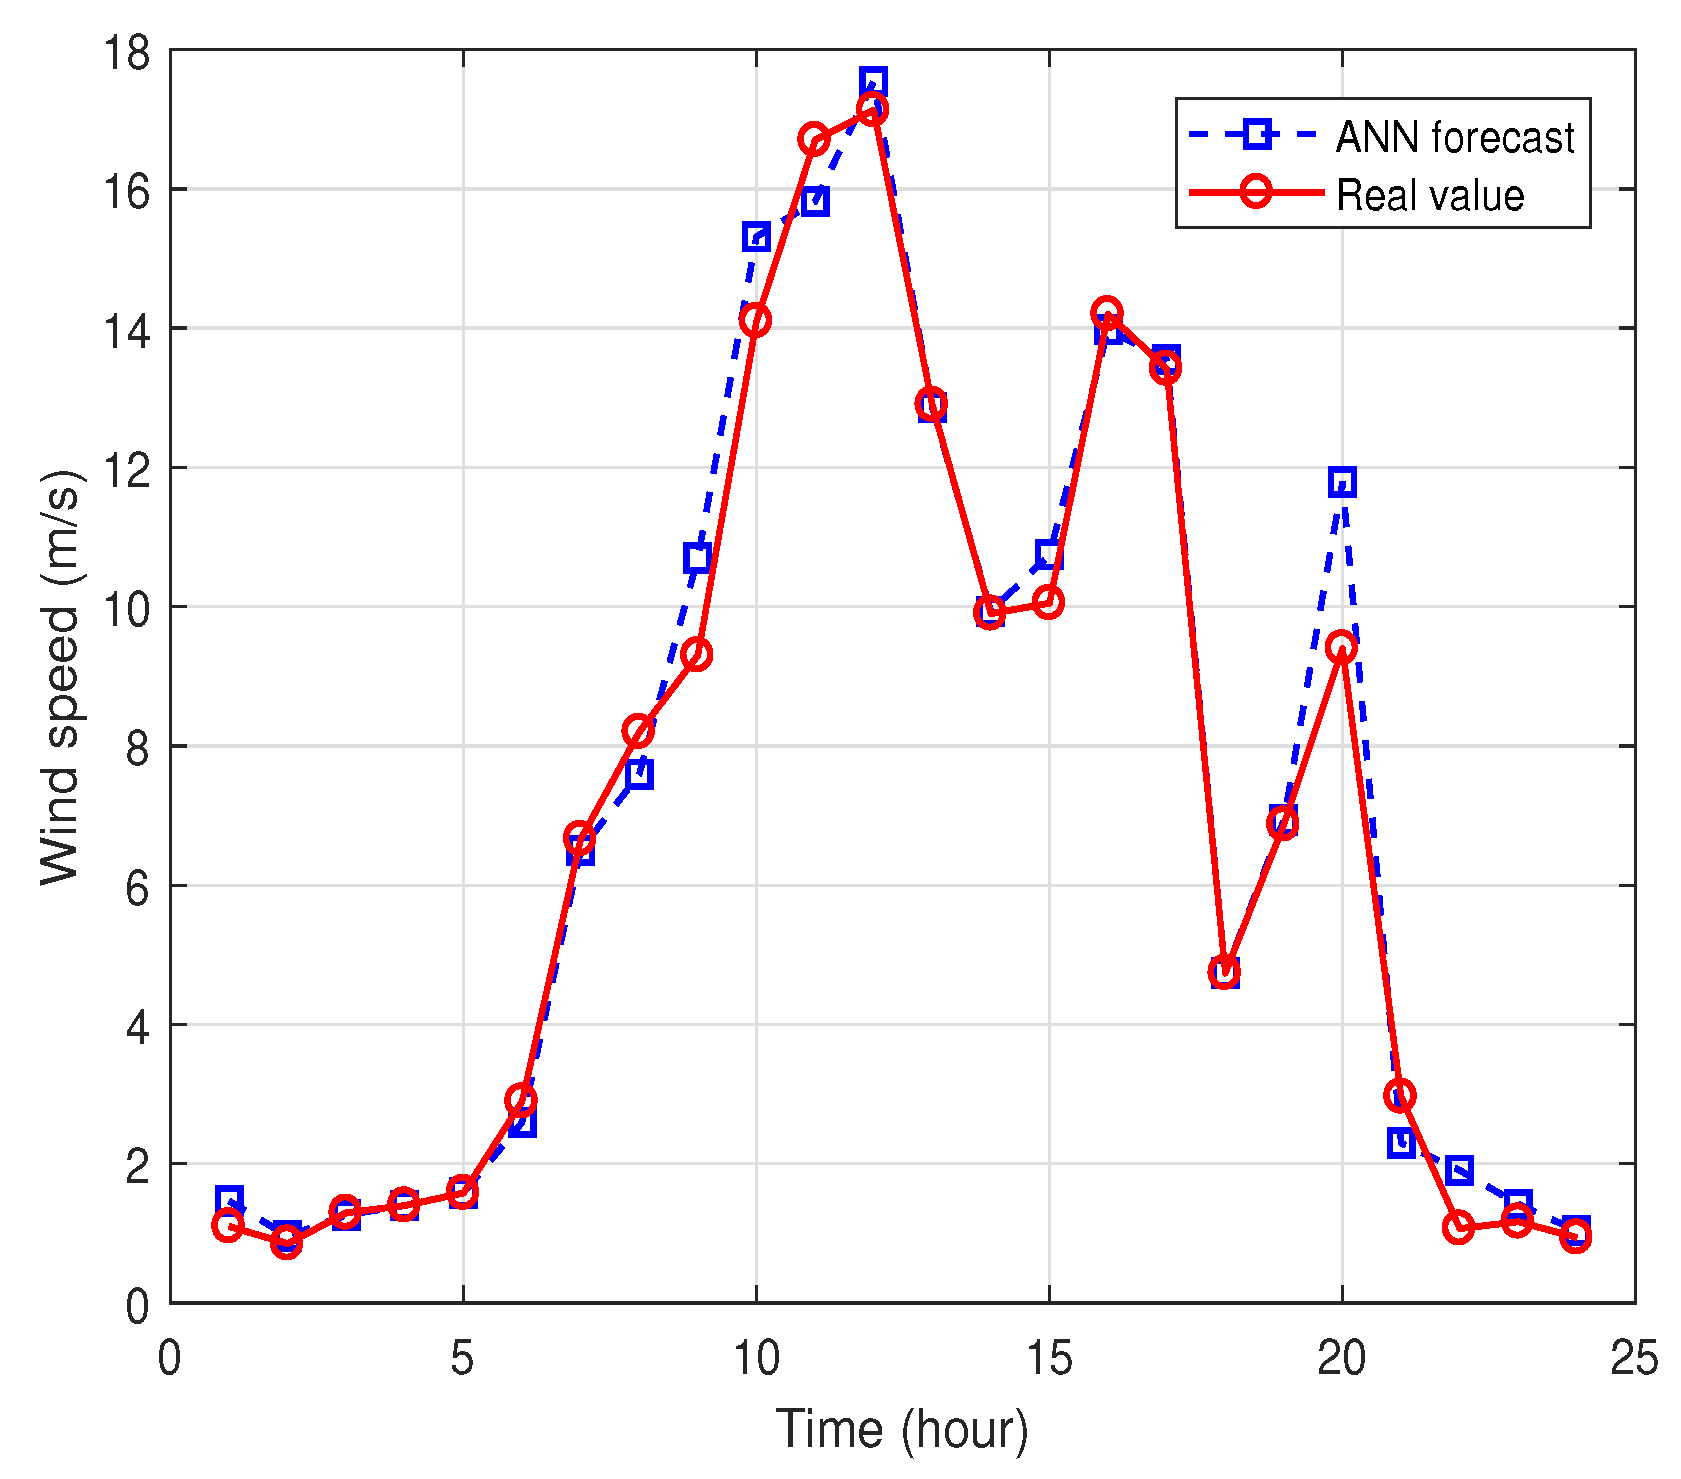
Wind turbine: A wind turbine is also installed at each residence to make the environment greener and reduce electricity cost. According to the survey of a global wind energy council, total worldwide electricity generation from the wind turbines reached 318,137 MW in 2013 with an increment of 200,000 MW in the last five years [
22]. Furthermore, there is a direct relation between wind speed and electricity generation from the wind turbine. When wind speed is high, the electricity generation is also maximal. However, manufacturers define the upper (cut-out) and lower (cut-in) bounds of wind speed for electricity generation. When wind speed is lower than cut-in speed or higher than cut-out speed, the wind turbines are shut down due to safety reasons and no electricity would be generated. We can calculate produced electricity from a wind turbine by the following equation [
21]:
where electricity generated from the wind turbine is shown by
and
shows the power coefficient. The wind turbine generates electricity on the basis of area swept by rotor blades
A, air density
and
(wind speed).
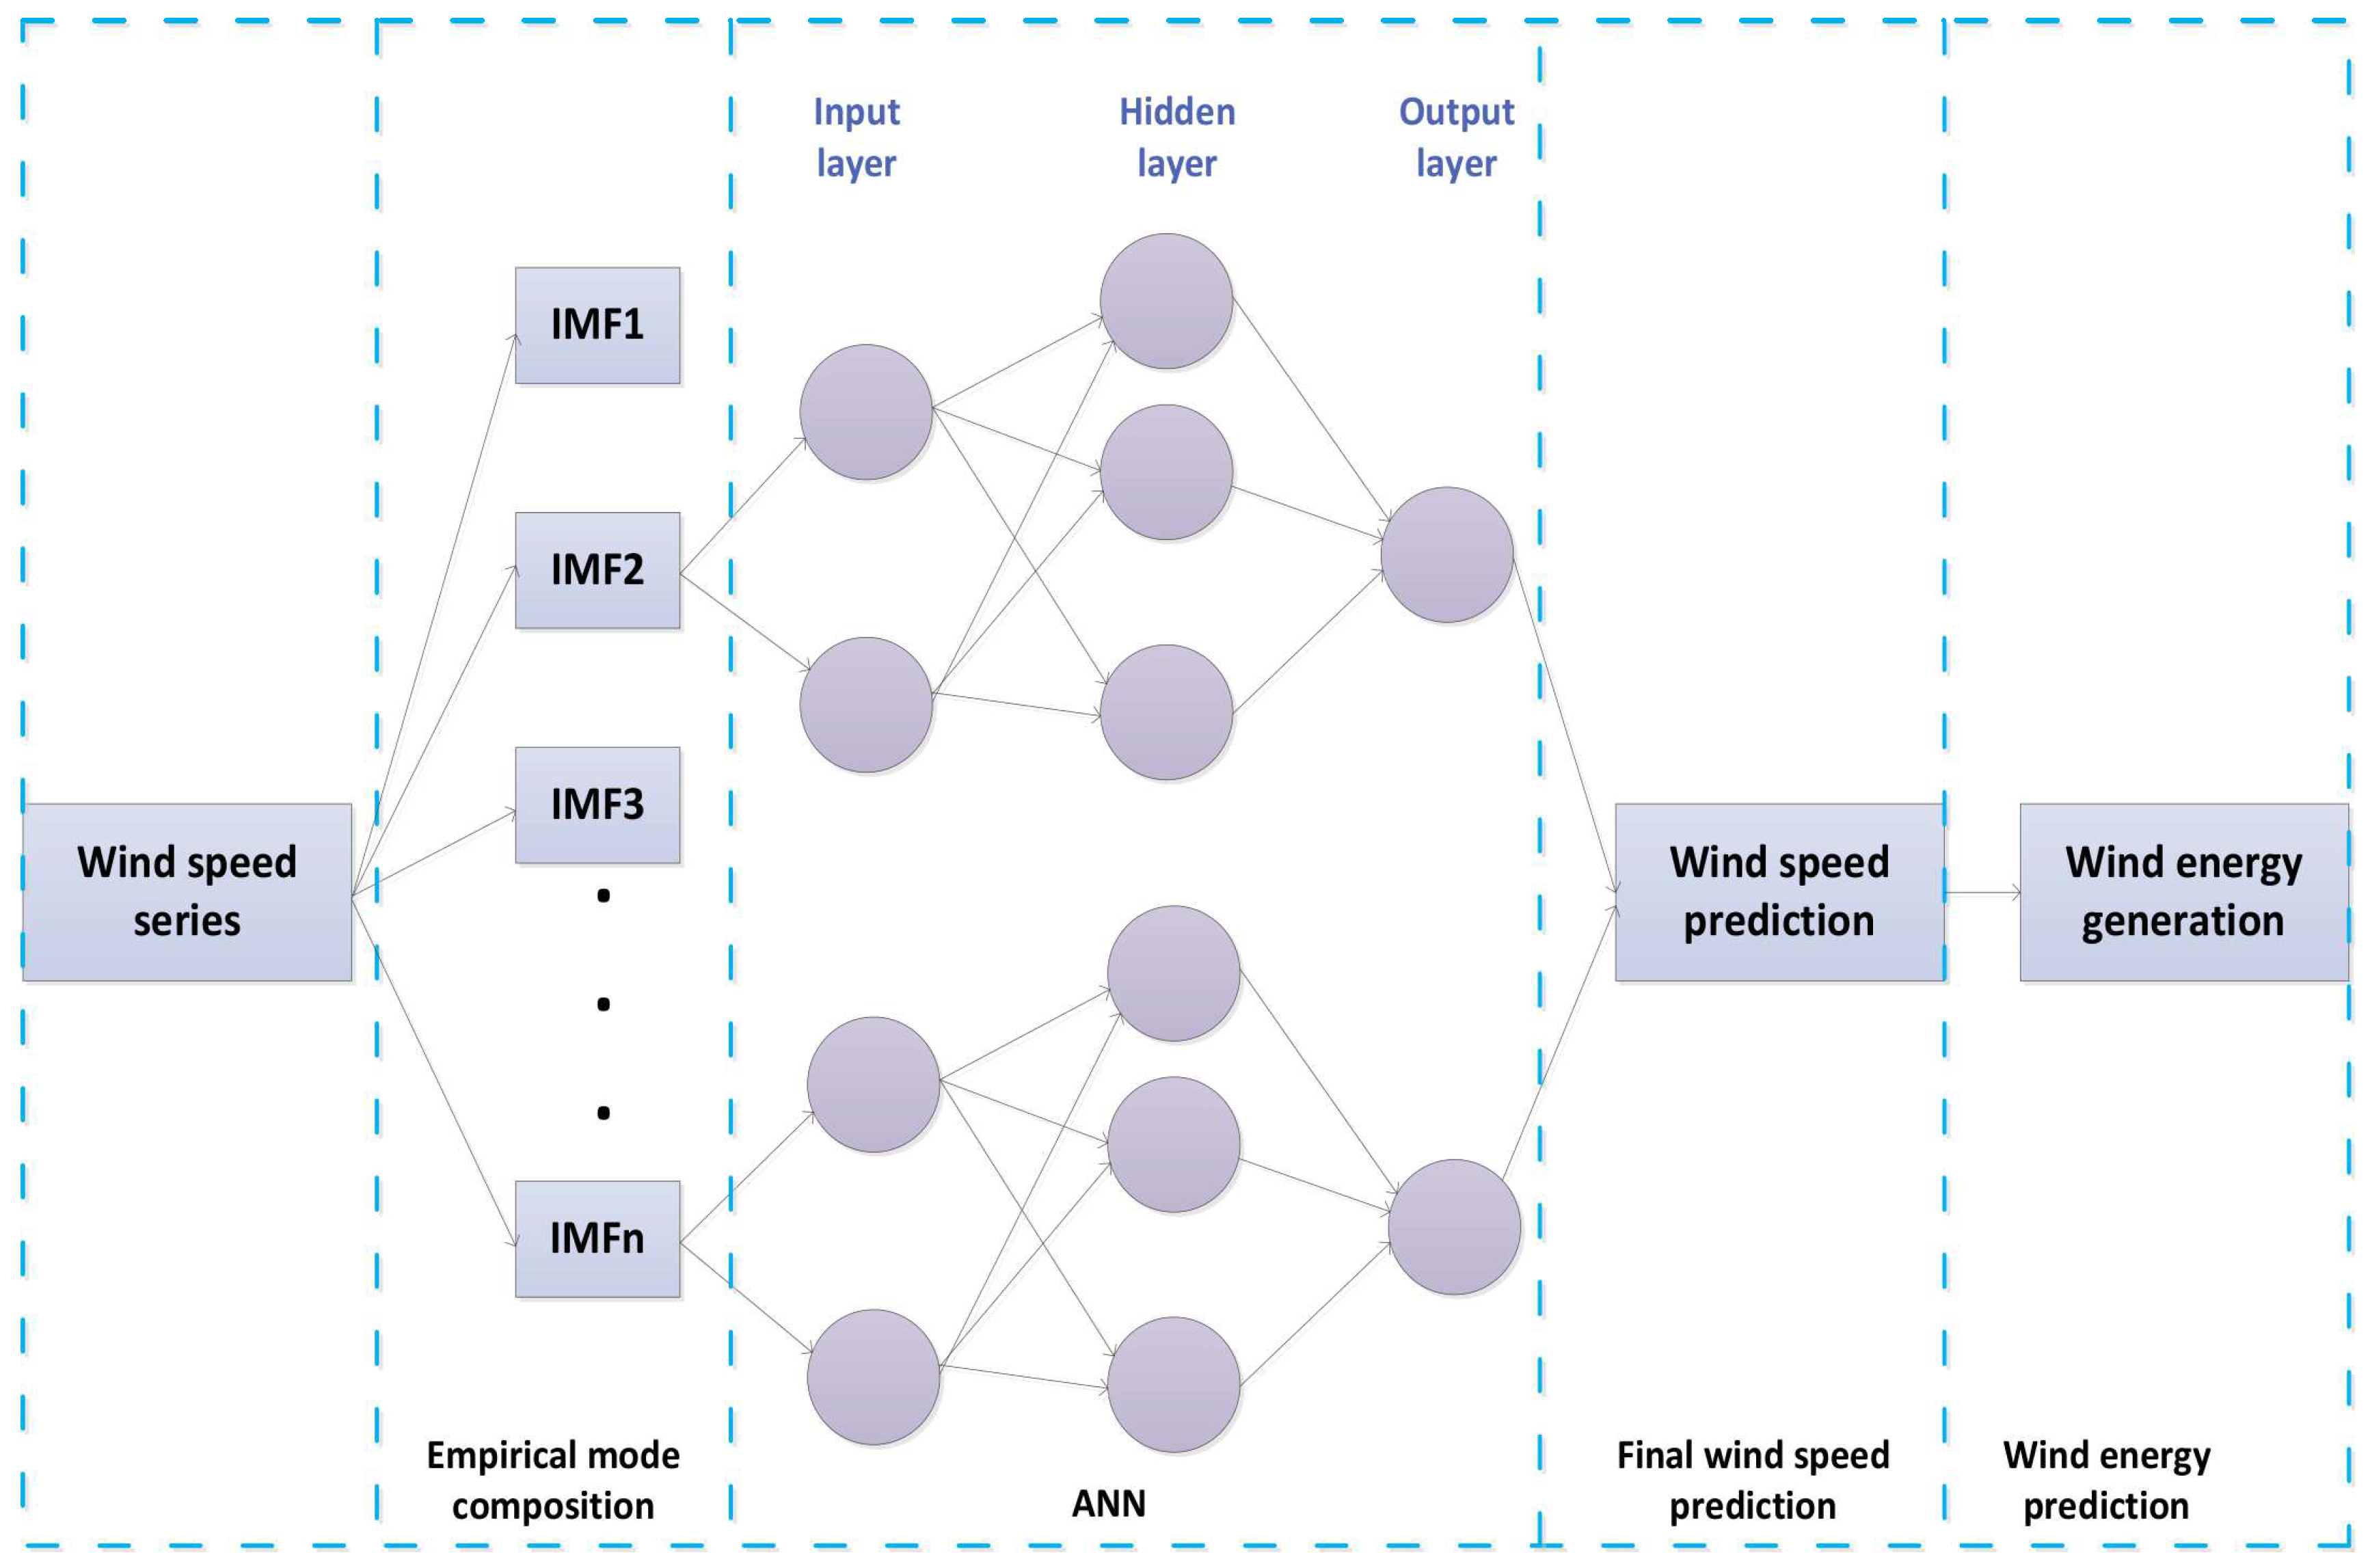
3.4. ANN Model for Weather Prediction
ANN is developed and inspired by the neural structure of the human brain. The neurons in ANN are trained the same as that of the human brain with the known (previous) data. To minimize the faulty learning, the errors are fed back and weights are optimized. An ANN consists of three basic layers: input layer, hidden layer and output layer. The input layer is the first layer of the ANN model and the data values exist in this layer. The output layer contains output nodes against each class and this is the last layer of ANN architecture. In addition, a hidden layer exists in between the input and output layer; it may be one or multiple hidden layers in ANN [
23]. In this work, we develop an ANN based prediction model for wind speed and temperature prediction, the same as [
23].
Figure 2 shows the general architecture of the wind speed prediction model.
3.5. Fog-as-a-Service Platform
We also have considered the fog-as-a-service platform for proper energy management in the residential community. Each smart consumer is connected with fog server to share information about excess or deficit energy. Fog stores data for all homes, i.e., energy generation from a solar panel and wind turbine, load demand, off-peak hours, on-peak hours and electricity tariffs. Our developed ANN model also takes data from the fog server for the prediction of weather. Furthermore, when any user has excess energy generation, the fog shares this energy to needy consumers and, because of this, electricity cost is reduced. Thus, in this way, every user shares his excess energy or, when traveling to another city, his complete generated energy is consumed by other users.
5. Conclusions and Future Work
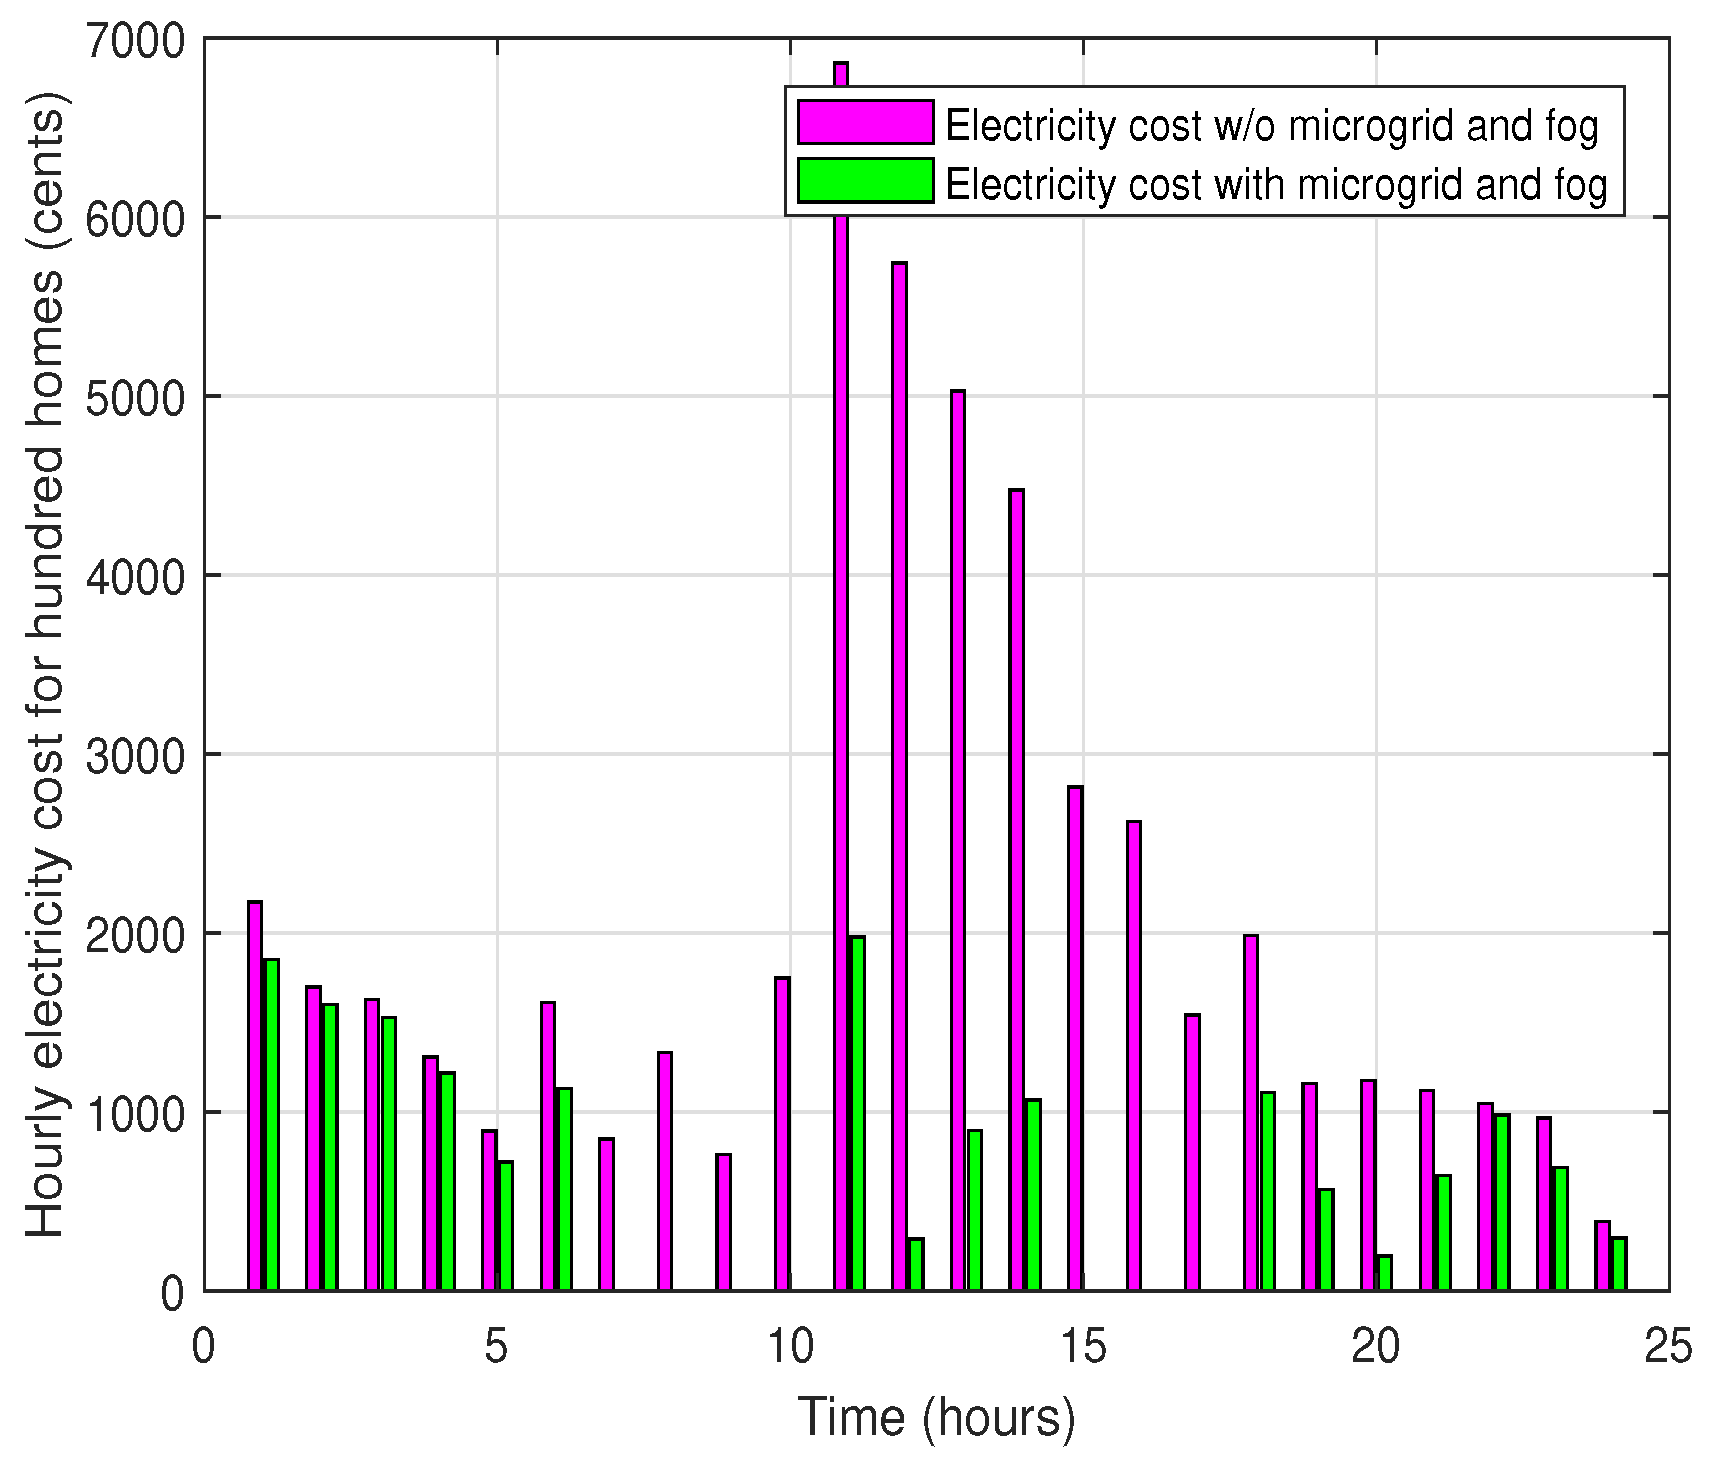
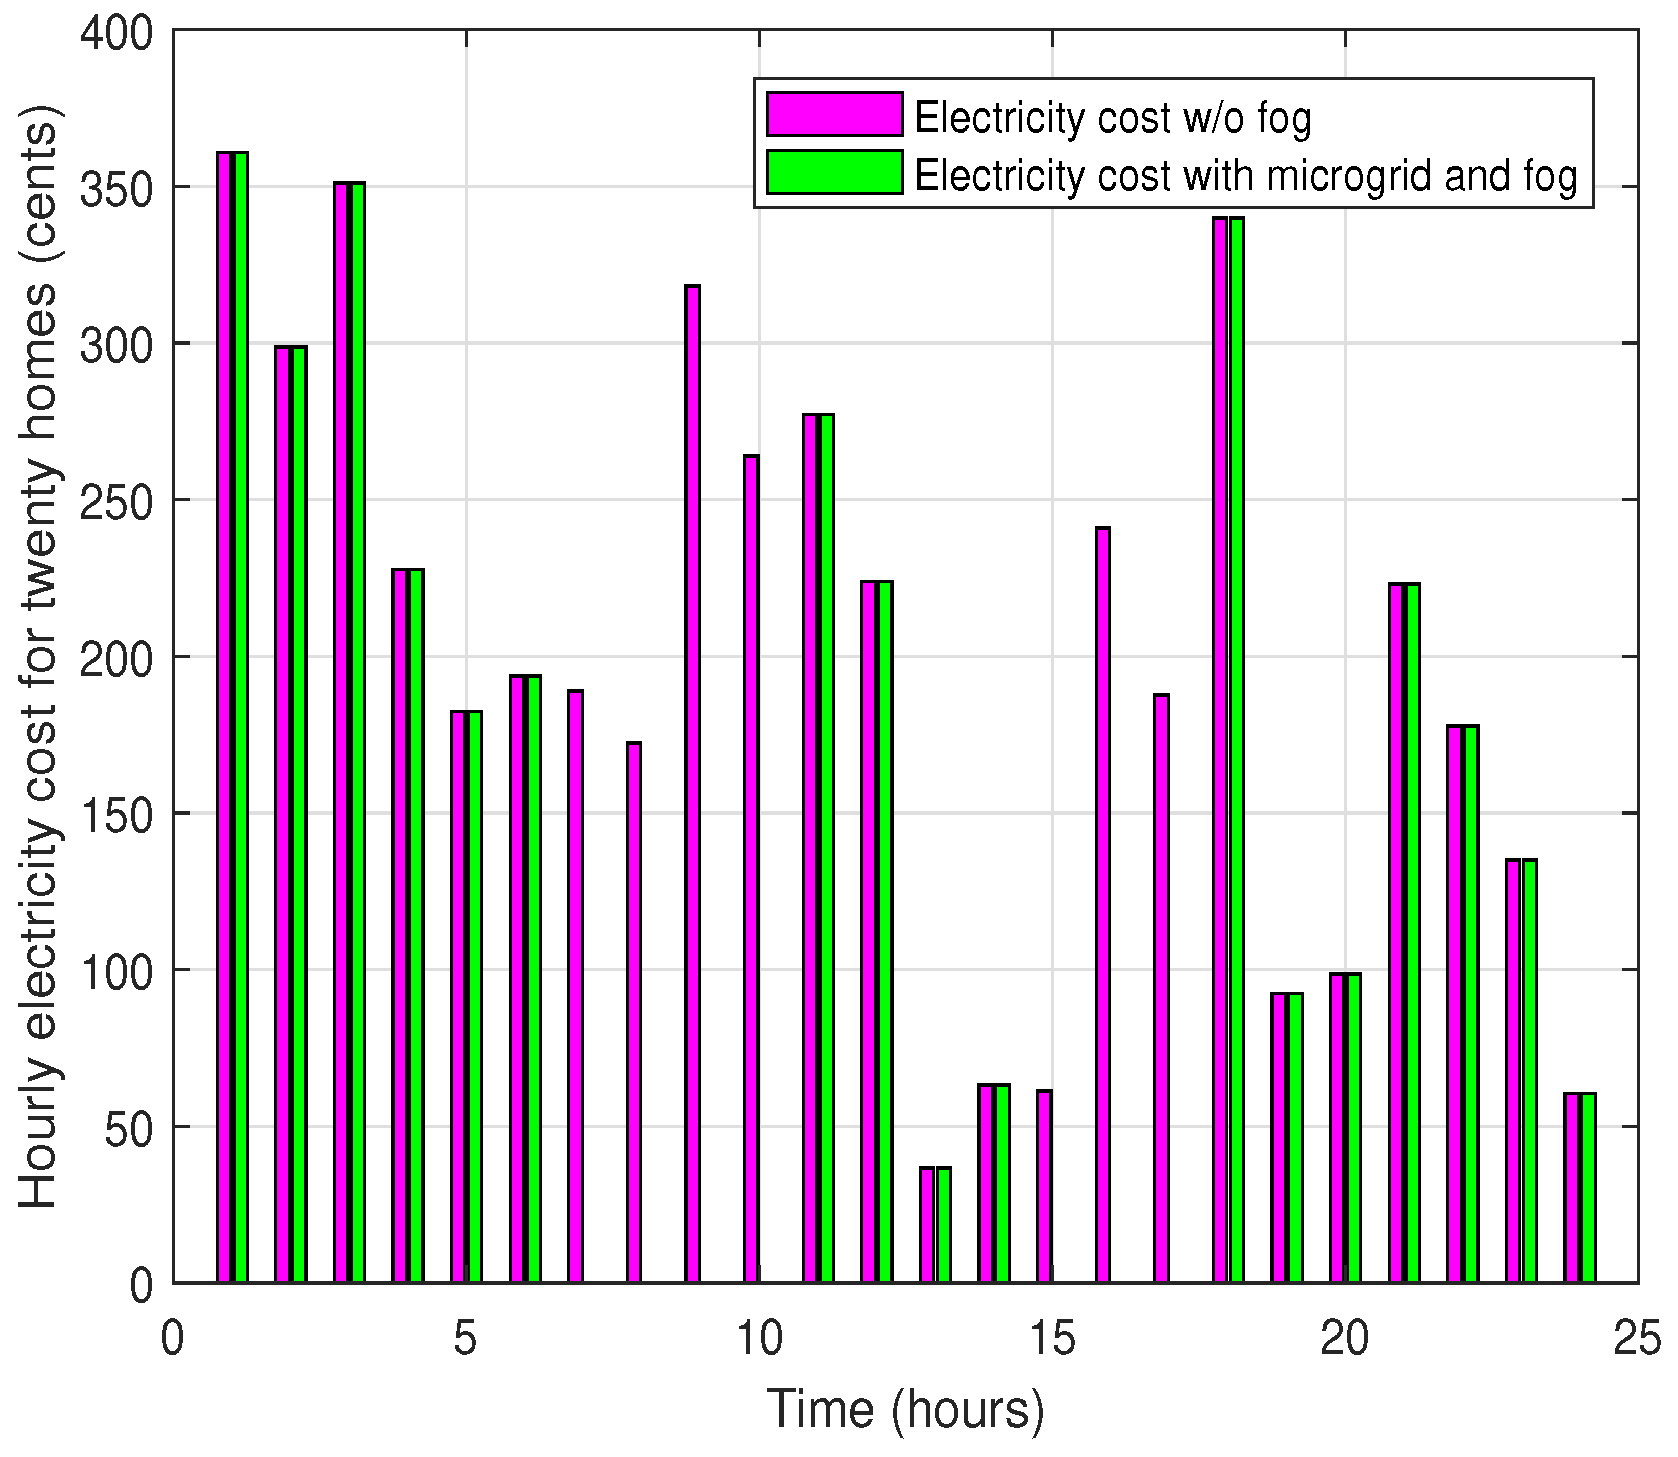
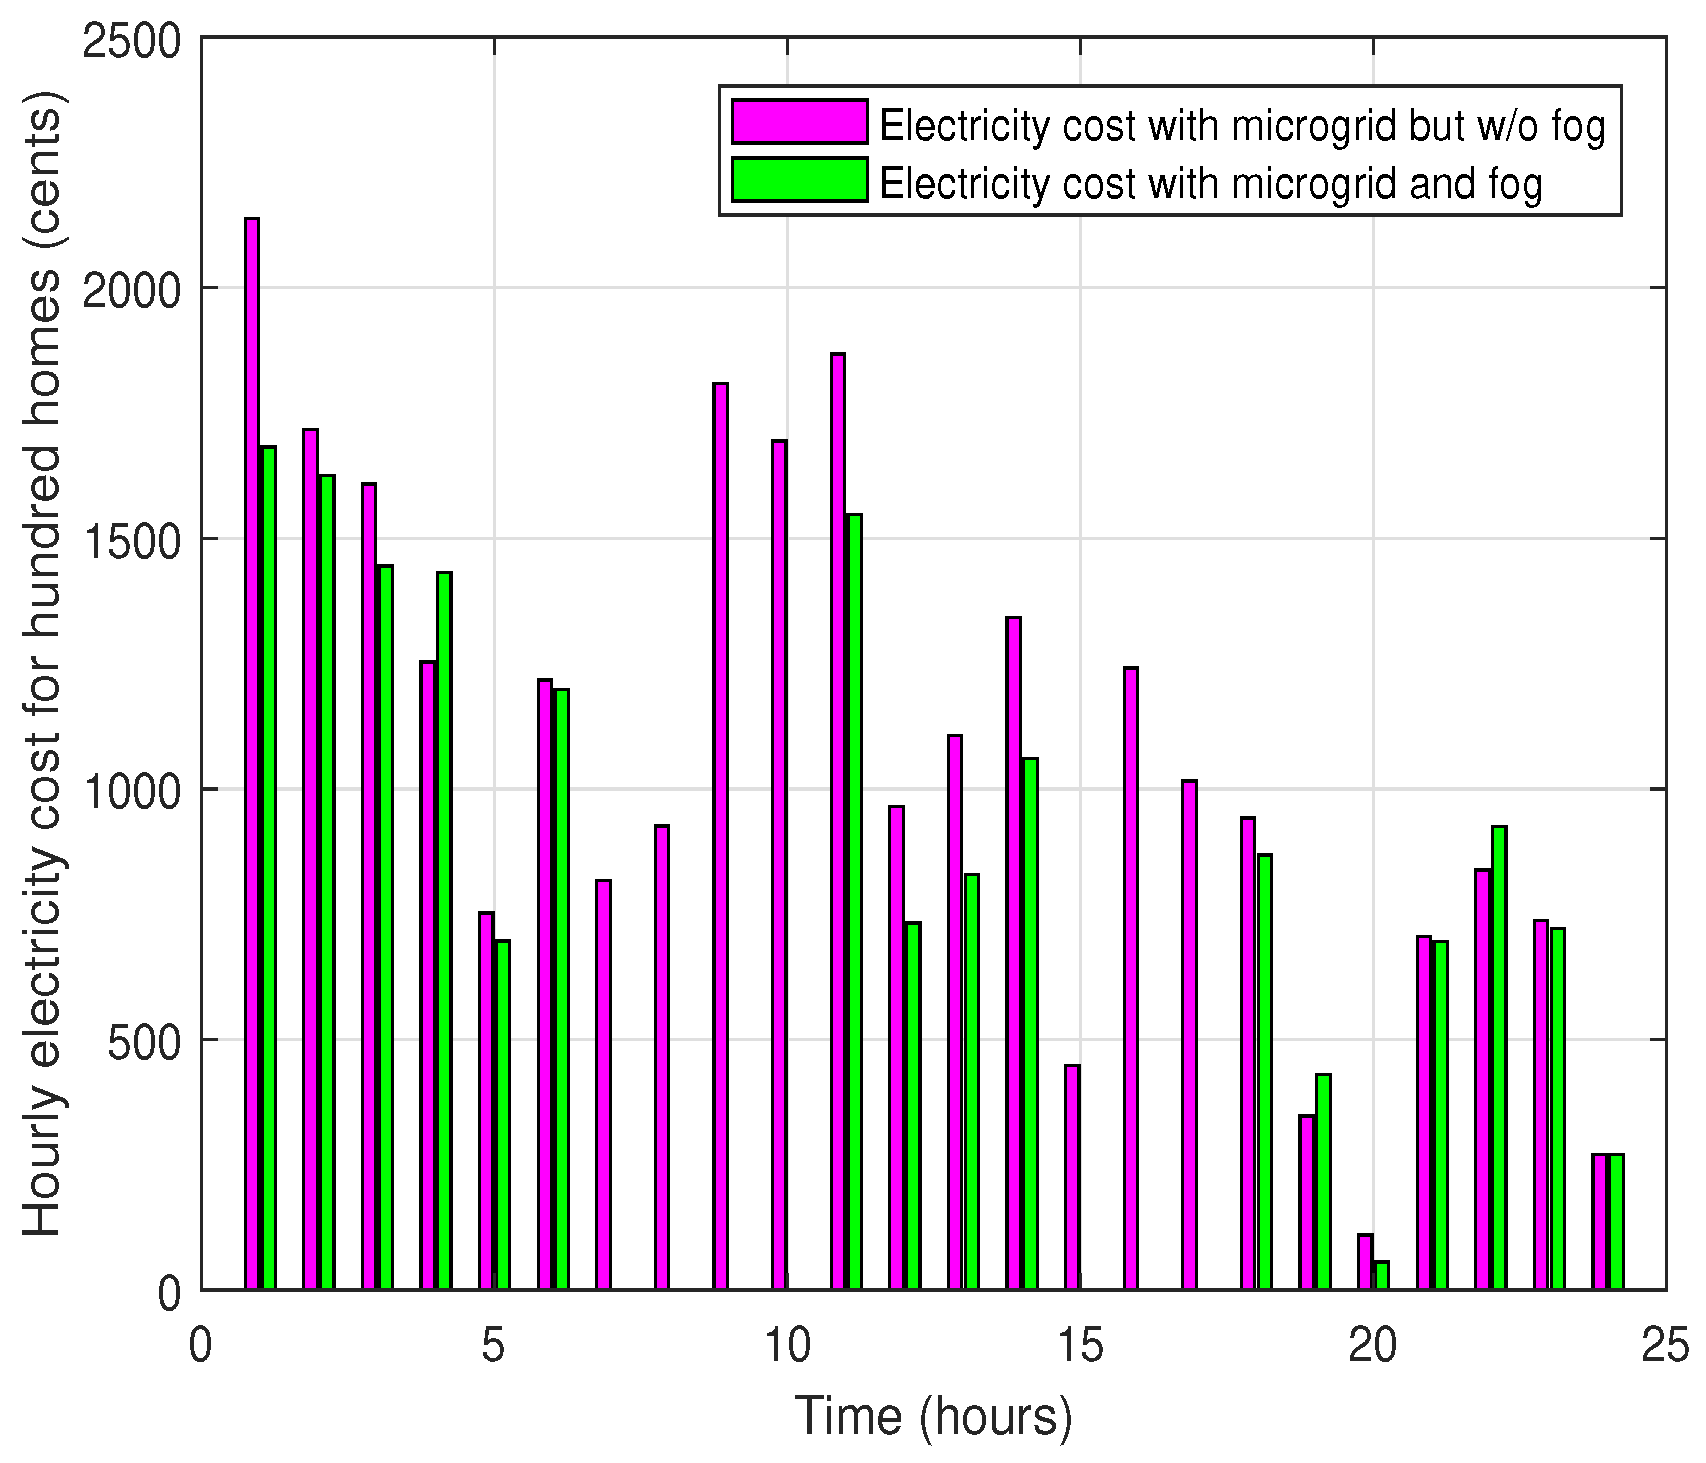
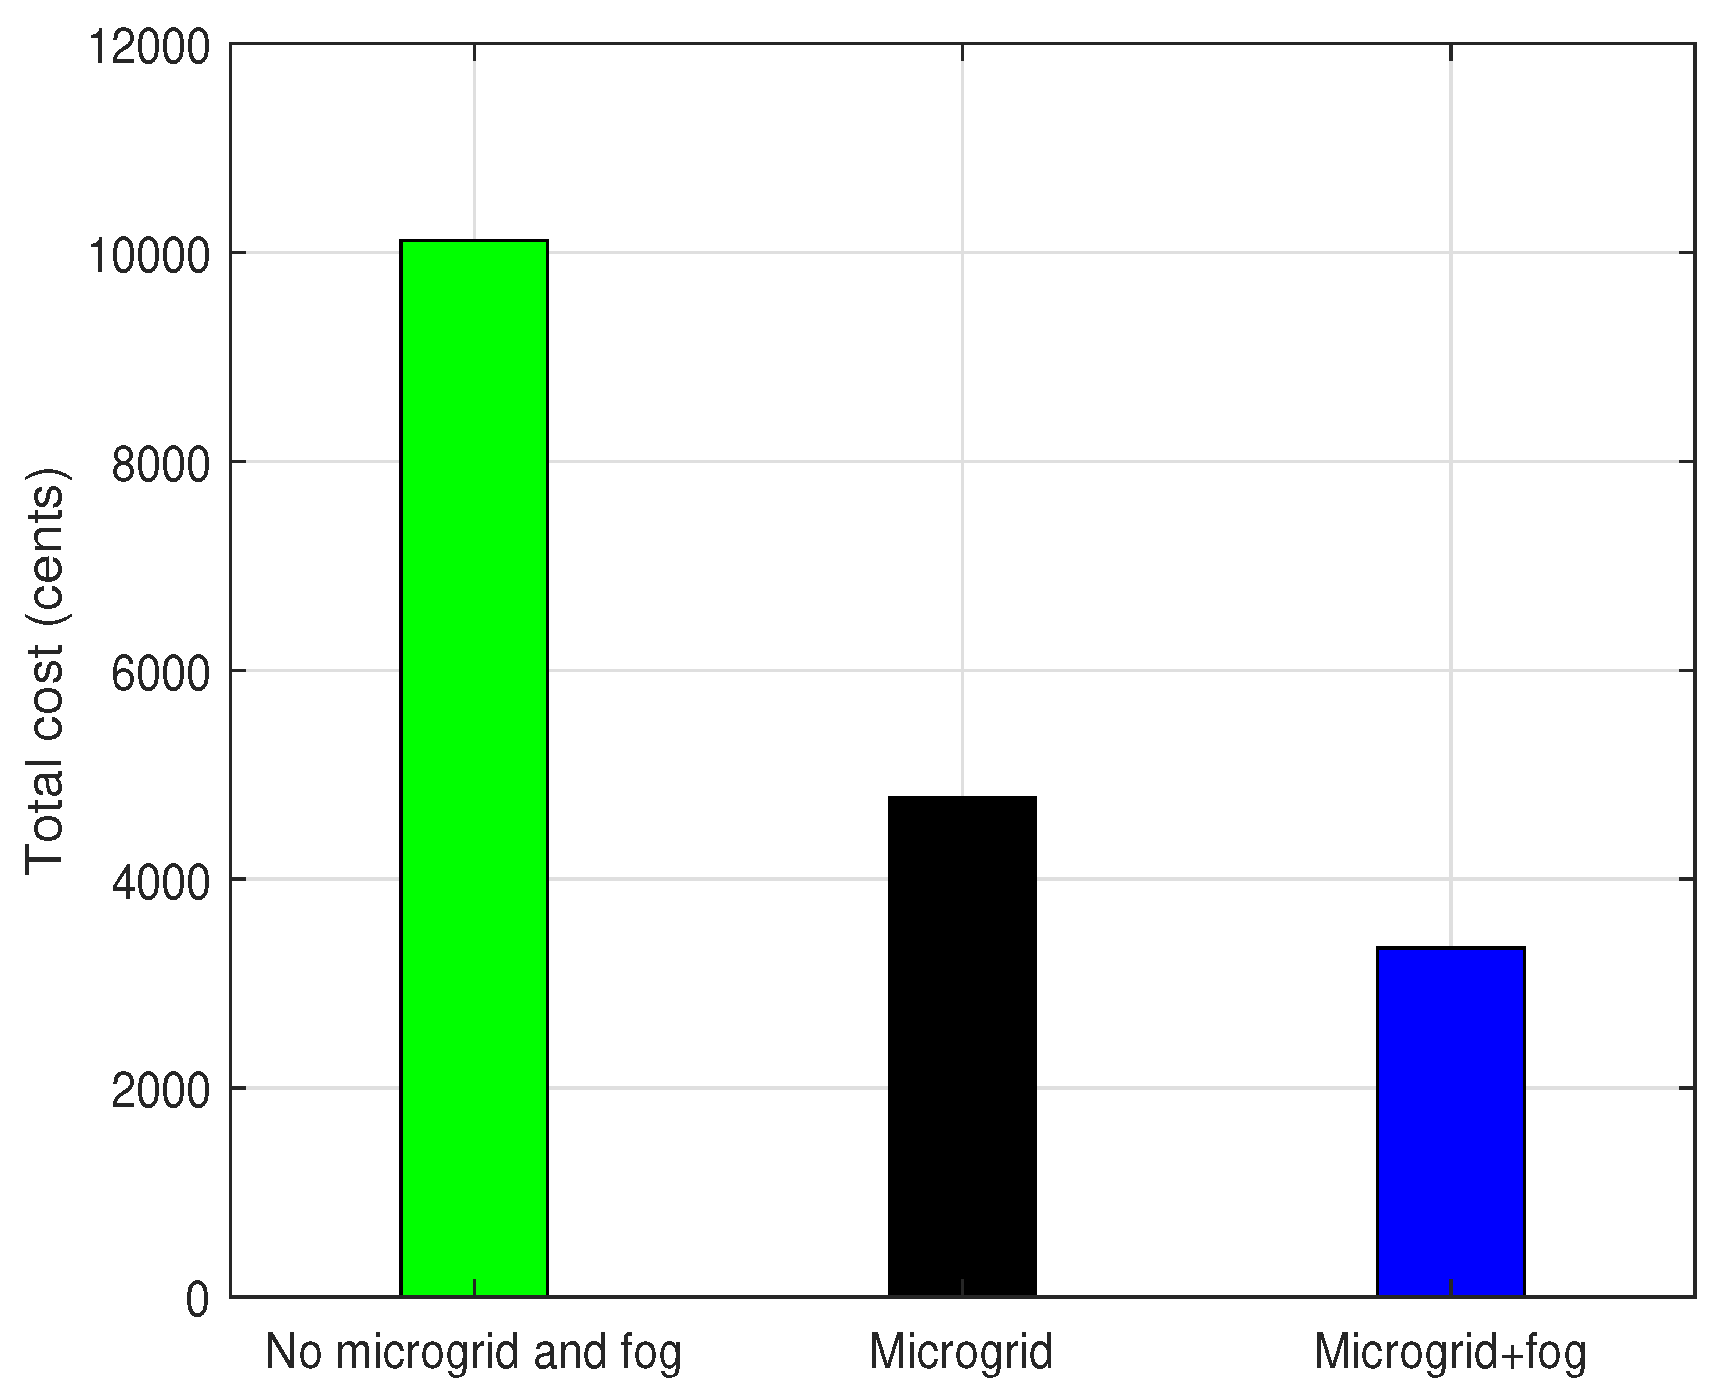
The evolution of cloud computing brings a big influence on old models of computing. The fog computing model is a powerful supplement of cloud computing. We can use fog-based computing models to solve multiple problems instead of using traditional methods. In this paper, we have proposed a fog based approach to share energy among consumers in the smart grid. All consumers are connected with the fog server to communicate with each other and store information. Furthermore, the microgrid is installed at each residence for power generation, which consists of the solar panel and the wind turbine. When any consumer has excess energy or is outside the city, his energy is shared with other users. In this way, imported electricity and cost are reduced. Simulation results disclose that our proposed novel fog based approach efficiently alleviates the imported electricity by 54.41% and energy cost by 65.85% for a community of 20 homes. The total cost and imported electricity are reduced up to 67.033% and 55.44% for 100 homes, respectively.
In the future, we will implement our proposed approach in the industrial sector. Furthermore, the implementation of the same approach in real-time problems will be another direction of our research.

 ,
, 


