Article

Life Cycle Assessment of the New Generation GT-MHR Nuclear Power Plant

1
Centre for Environmental Safety and Risk Engineering (CESARE), Victoria University, Melbourne 8001, Australia
2
Odessa National Academy of Food Technologies, 112 Kanatna St, Odesa 65000, Ukraine
*
Author to whom correspondence should be addressed.
Energies 2018, 11(12), 3452; https://doi.org/10.3390/en11123452
Submission received: 11 September 2018 / Revised: 27 November 2018 / Accepted: 5 December 2018 / Published: 10 December 2018
(This article belongs to the Section L: Energy Sources)

Abstract

:
This study describes a life cycle assessment (LCA) of a fourth generation (4G) nuclear power plant. A high temperature helium cooled reactor and gas turbine technology with modular helium reactor (GT-MHR) is used in this study as an example. This is currently one the safest design of a nuclear power plant. The study also takes into account impact of accidents and incidents (AI) which happened around the world at nuclear power generation facilities. The adopted method for the study is a hybrid LCA analysis. The analysis of each phase of the life cycle was done on the basis of process chain analysis (PCA). Where detailed data were not available, the Input/Output (I/O) databases was employed. The obtained results show that greenhouse gases (GHG) emissions and energy intensity per unit of electricity production are relatively low. In fact, these are even lower than emissions from a number of renewable energy sources. The results show considerably different greenhouse gases (GHG) emissions and energy intensity per unit of electricity production when effects of AI are taken into account.

1. Introduction

The constructive utilisation of energy is of paramount importance for the enhancement of society’s standard of living. The global demand for energy is growing even faster than the population. The escalating demand from developing countries will further exacerbate this situation. The current energy utilisation worldwide is about 14 TWh (1TWh = 1012 W·hour). By the end of the 21st century it may reach 50 TWh [1]. Today, approximately 80% of the world’s energy comes from fossil fuels [2]. About 30% of the primary energy is used for electricity production. Most of the remaining 70% is used either for transportation or converted into hot water, steam and heat. Nuclear energy is now being used to produce about 14% of the world electricity [3]
Over the next 50 years, unless patterns change dramatically, energy production and use will contribute to global warming through large scale greenhouse gas emissions. This amounts to hundreds of billions of tonnes of carbon dioxide. Nuclear power could be one option for reducing carbon dioxide emissions. An interest in nuclear power, despite the Fukushima disaster, has been revived. More than 40 developing countries have approached United Nations officials to express interest in starting nuclear power programs [4].
A number of countries (France, Argentina, Brazil, Canada, Japan, the Republics of Korea, South Africa, the US, UK, Russia, China, etc.) joined together on a mission to develop and implement the next wave of safe nuclear reactors. They created the Generation IV International Forum (GIF) to oversee this development [5]. The GIF takes a top-down approach in choosing which designs are most promising versus the challenges of sustainability, safety, economics, proliferation resistance and physical protection. The results of the efforts have been updated several times. The forum’s members agreed to concentrate their efforts and funds on six reactor designs seeking to become commercially viable between 2015 and 2025 [6]. Among those reactors the very high temperature reactor (VHTR) is the most attractive nuclear technology. The Next Generation Nuclear Plant (NGNP) prototype concept is based on what is judged to be the lowest risk technology. That technology should achieve the needed commercial functional requirements to provide an economically competitive nuclear energy source [5]. The technology has the following substantial gains:
(a)
coupling of gas turbine with a high temperature gas-cooled reactor (HTGR) allows a net electrical efficiency in the range of 50% to be achieved;
(b)
building modular HTGR (usually called GT-MHR) results in lower capital cost due to plant simplification and time reduction for construction;
(c)
use of the ceramic TRISO (triple coated small balls) fuel specifically developed for this type of reactors. This fuel has a high degree of passive safety and flexibility to adopt uranium/plutonium, thorium (Th) based fuel cycle and reprocess spent nuclear fuel (SNF) from currently used reactors;
(d)
high burn-up of the reactor (between 80–120 GWd/ton (1 GWd = 109 W·day)). This substantially decreases radioactive waste from SNF and makes its SNF much less radioactive [7];
(e)
high temperature, which allows HTGR to be applied to hydrogen production. Due to this circumstance HTGRs may be also applied to other high and low temperature process heat applications such as water desalination. In this way non-electric energy needs may be efficiently addressed [8]. Some such reactors already have been built, for example HTR-PM, China (first operation expected in 2019) [9] and GTHTR300, Japan (planned to test in 2020). Few such reactors are working in the Russian Federation (RF) (GT-MHR is working from 2014, MHR-T for hydrogen production is working from 2017).
Unfortunately, the risk of AI for complex technological systems cannot be minimised to zero. Highly cited sociologist Charles Perrow in his book says: “Multiple and unexpected failures are built into society’s complex and highly-coupled systems. Such accidents are unavoidable and cannot be designed around” [10]. The reasons for those AI may be not only human errors, but also adverse nature factors (tsunami, earth quakes, etc.) The environmental impacts of those AI can be substantial (e.g., Chernobyl, Fukushima) and also have a big social impact.

2. Purpose of the Study and Methodology

The overall objective of this study is to identify and analyse potential life cycle environmental impacts (GHG emissions, energy consumption) from the fourth-generation nuclear power plants. The evaluated impact also takes into account the impact from AI of the nuclear power plants and efforts required to eliminate the consequences of such AI based on available data. Only two stages of the nuclear power plants life cycle are taken into account in this study for evaluating environmental impact from AI, namely: electricity production and waste disposal (as the major contributors to the AI statistics). Unfortunately, the works done on mitigation of AI consequences are sparsely reported, however the costs of those works are broadly presented. Therefore, environmental impact from AI is assessed mostly using costs of those works.
The study uses also hybrid LCA, which is based on a mix of process LCA and input/output (I/O) LCA. Such an approach is an effective method for assessing environmental and other aspects associated with generation of electricity independently of its source over the whole life cycle—“from-cradle-to-grave”. Such approach allows fill all data gaps, which sometimes occur in the processes based LCA. The study follows the LCA standard developed by the International Organisation for Standardisation (ISO 14040) as guidelines [11]. This standard is required to meet another standard—ISO 14044, which presents more detailed sub-standards and procedures [12]. Following these standards ensures a measure of accuracy and therefore credibility.
To compare results of this study with LCA studies of other sources of energy that might meet power requirements in the world in an objective manner we assume that power station will be built in Australia. Thus, whenever it’s required the life cycle inventory (LCI) data are taken for Australian conditions.

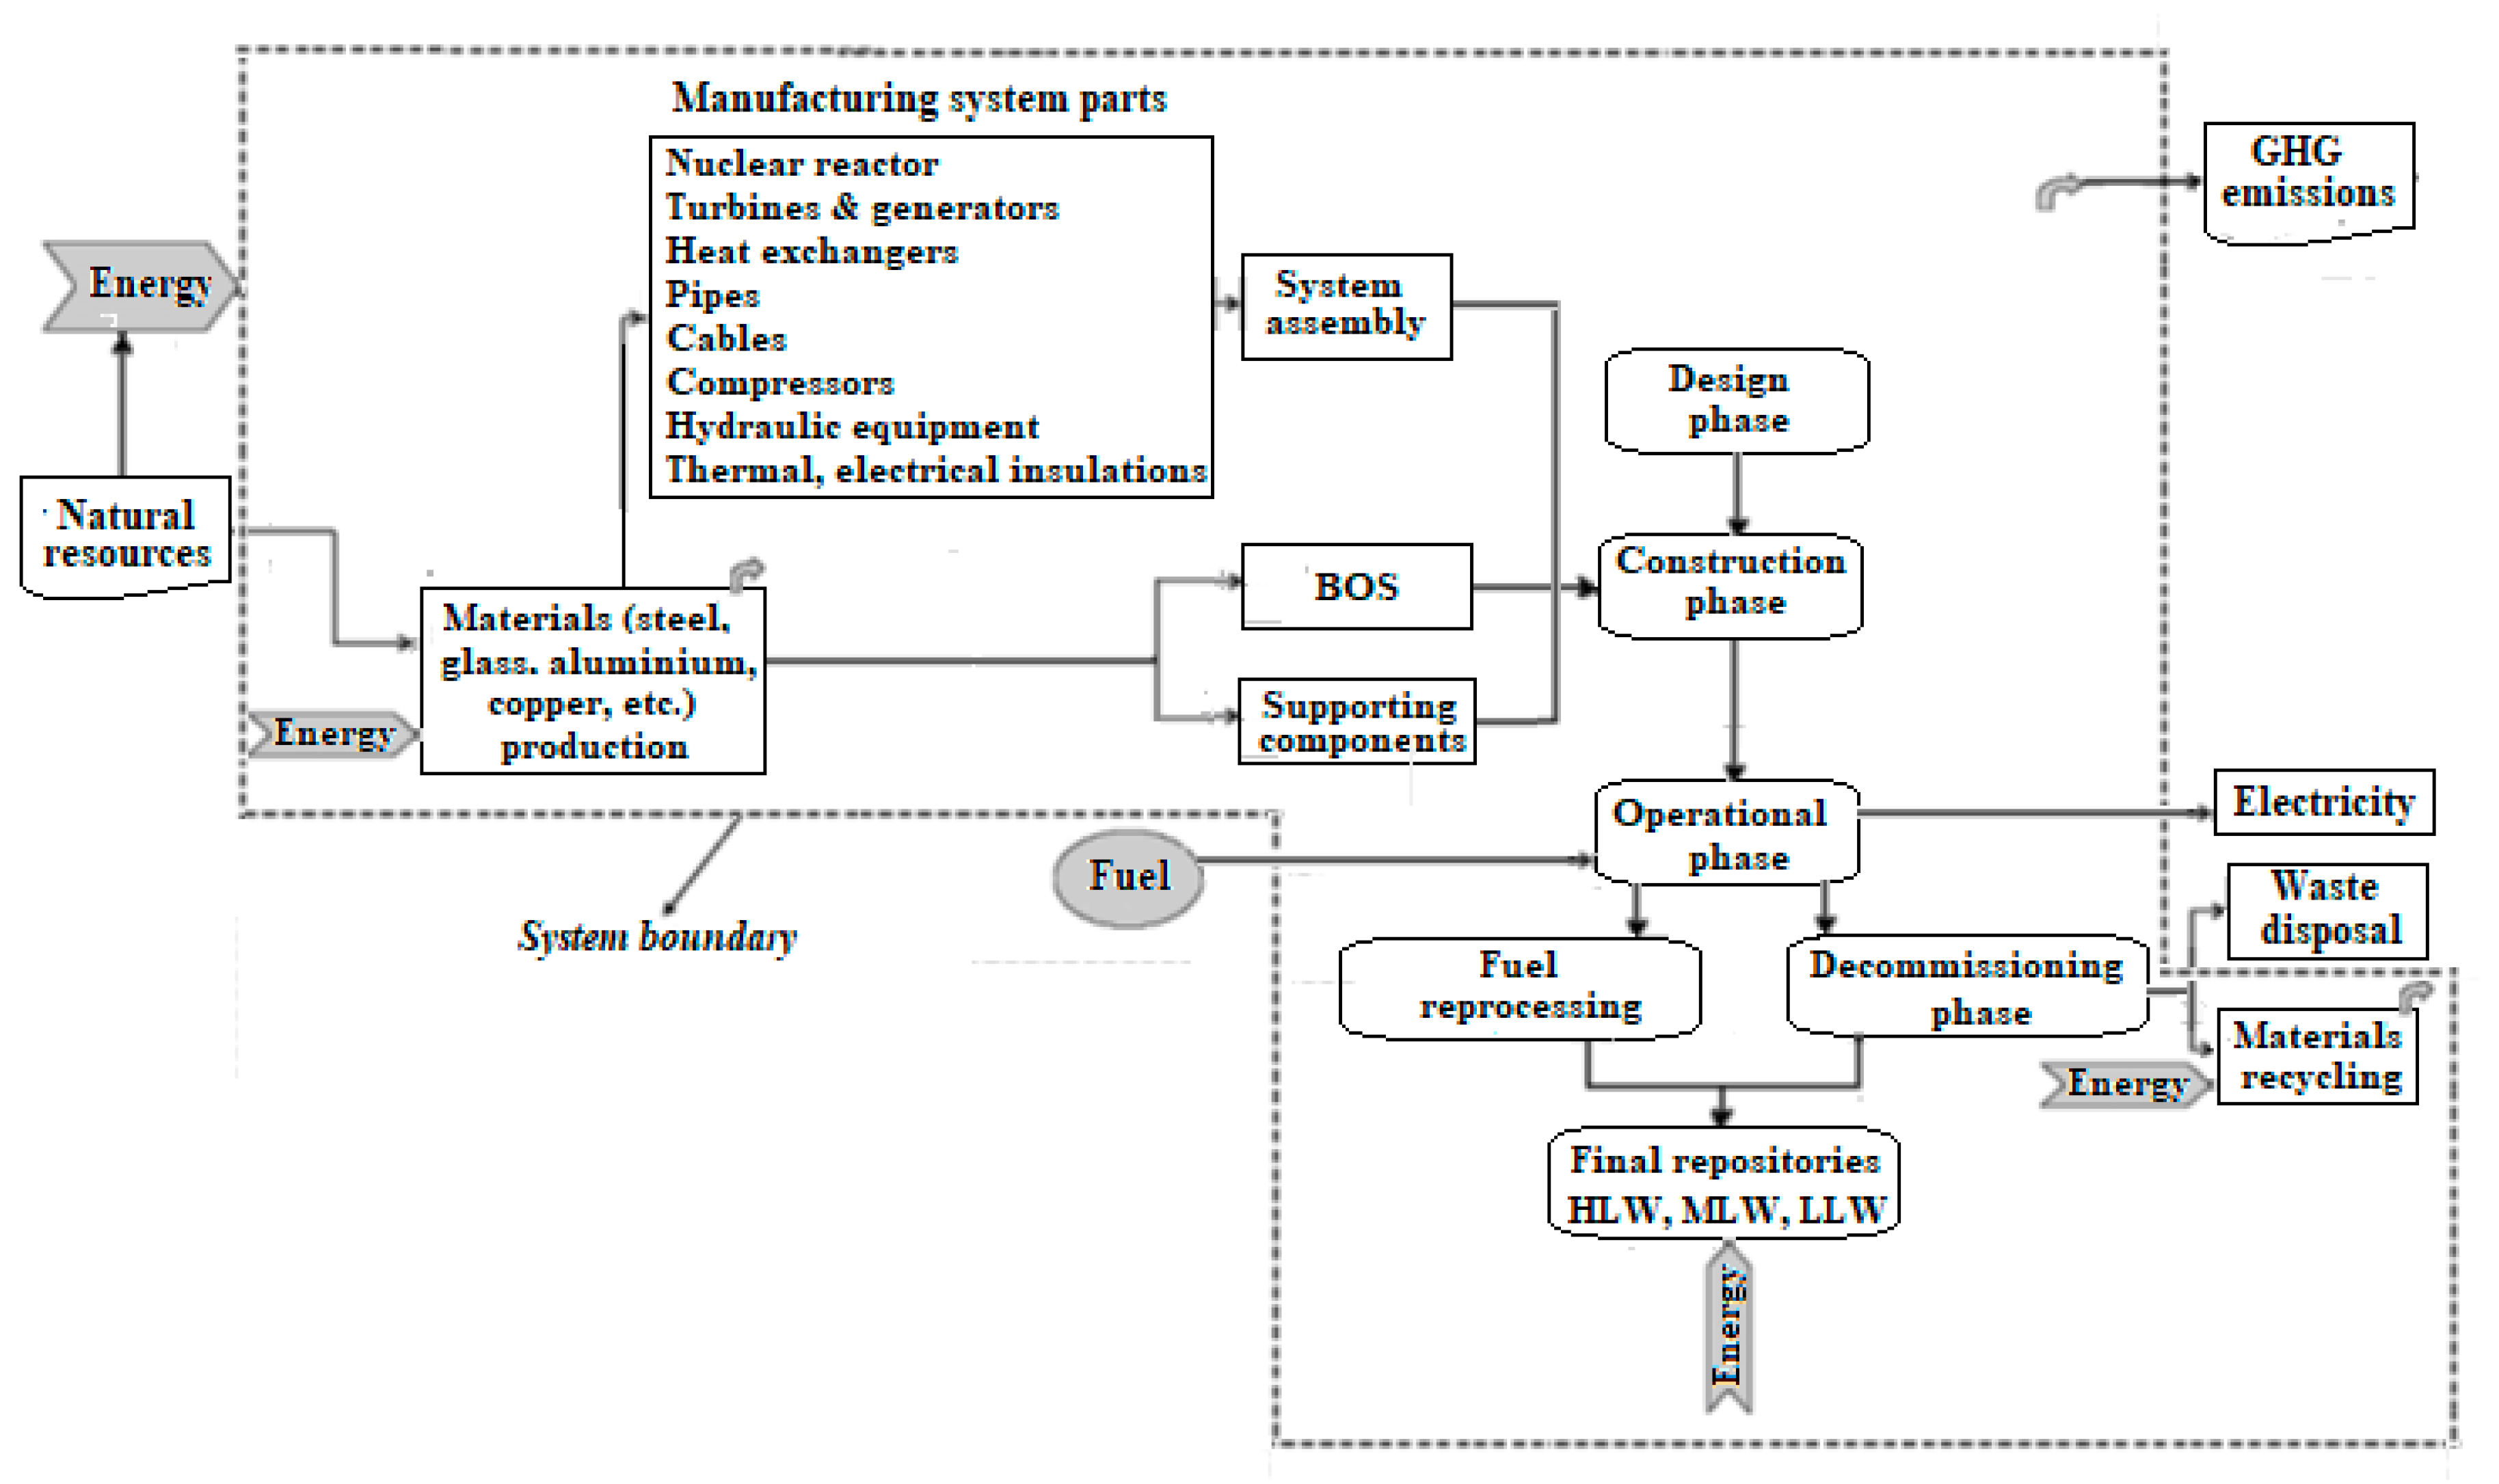
3. Nuclear Power Generation Life Cycle.

3.1. Main Phases of Nuclear Power (NP) Cycles

The reference concept under consideration for this LCA study includes a helium-cooled, graphite moderated, thermal neutron spectrum reactor. The reactor outlet temperature will be in the range from 900 to 950 °C. The reactor core technology will be a prismatic block concept. The NGNP can produce both electricity and hydrogen using an indirect cycle. However, for this study only the production of electricity is taken into account.
The LCA study described here is based on the following phases of the nuclear power generation cycle:
(a)
power plant design and construction;
(b)
power plant operation,
(c)
spent fuel storage;
(d)
back end of the cycle involving decommissioning the power plant, land reclamation, final storage (repository) of high, medium and low-level radioactive wastes (HLW, MLW and LLW) disposal. The LCA study of nuclear power generation cycle is also based on a production capacity of 1 Giga Watts of electricity (1 GWe) during life time span of the power plant (average 60 years) and a load factor during life span of the power plant of between 80–90% (average 85%). Such values are commonly used in designs of HTGR (for example, [13,14]).
The system boundaries for this study comprehensively cover all aspects of the included phases taking into account impacts from materials used in the manufacture of equipment and spares (during operation and maintenance), construction of buildings and repositories.
It is clear that judgment for possible nuclear power generation should be based not only on environmental impacts (including others not considered here), but also on other issues such as economic and social impacts. A more comprehensive LCA study with some assessment of the economic and social impacts would provide a scientific basis for examining the suitability of using state of the art nuclear technology for power generation.

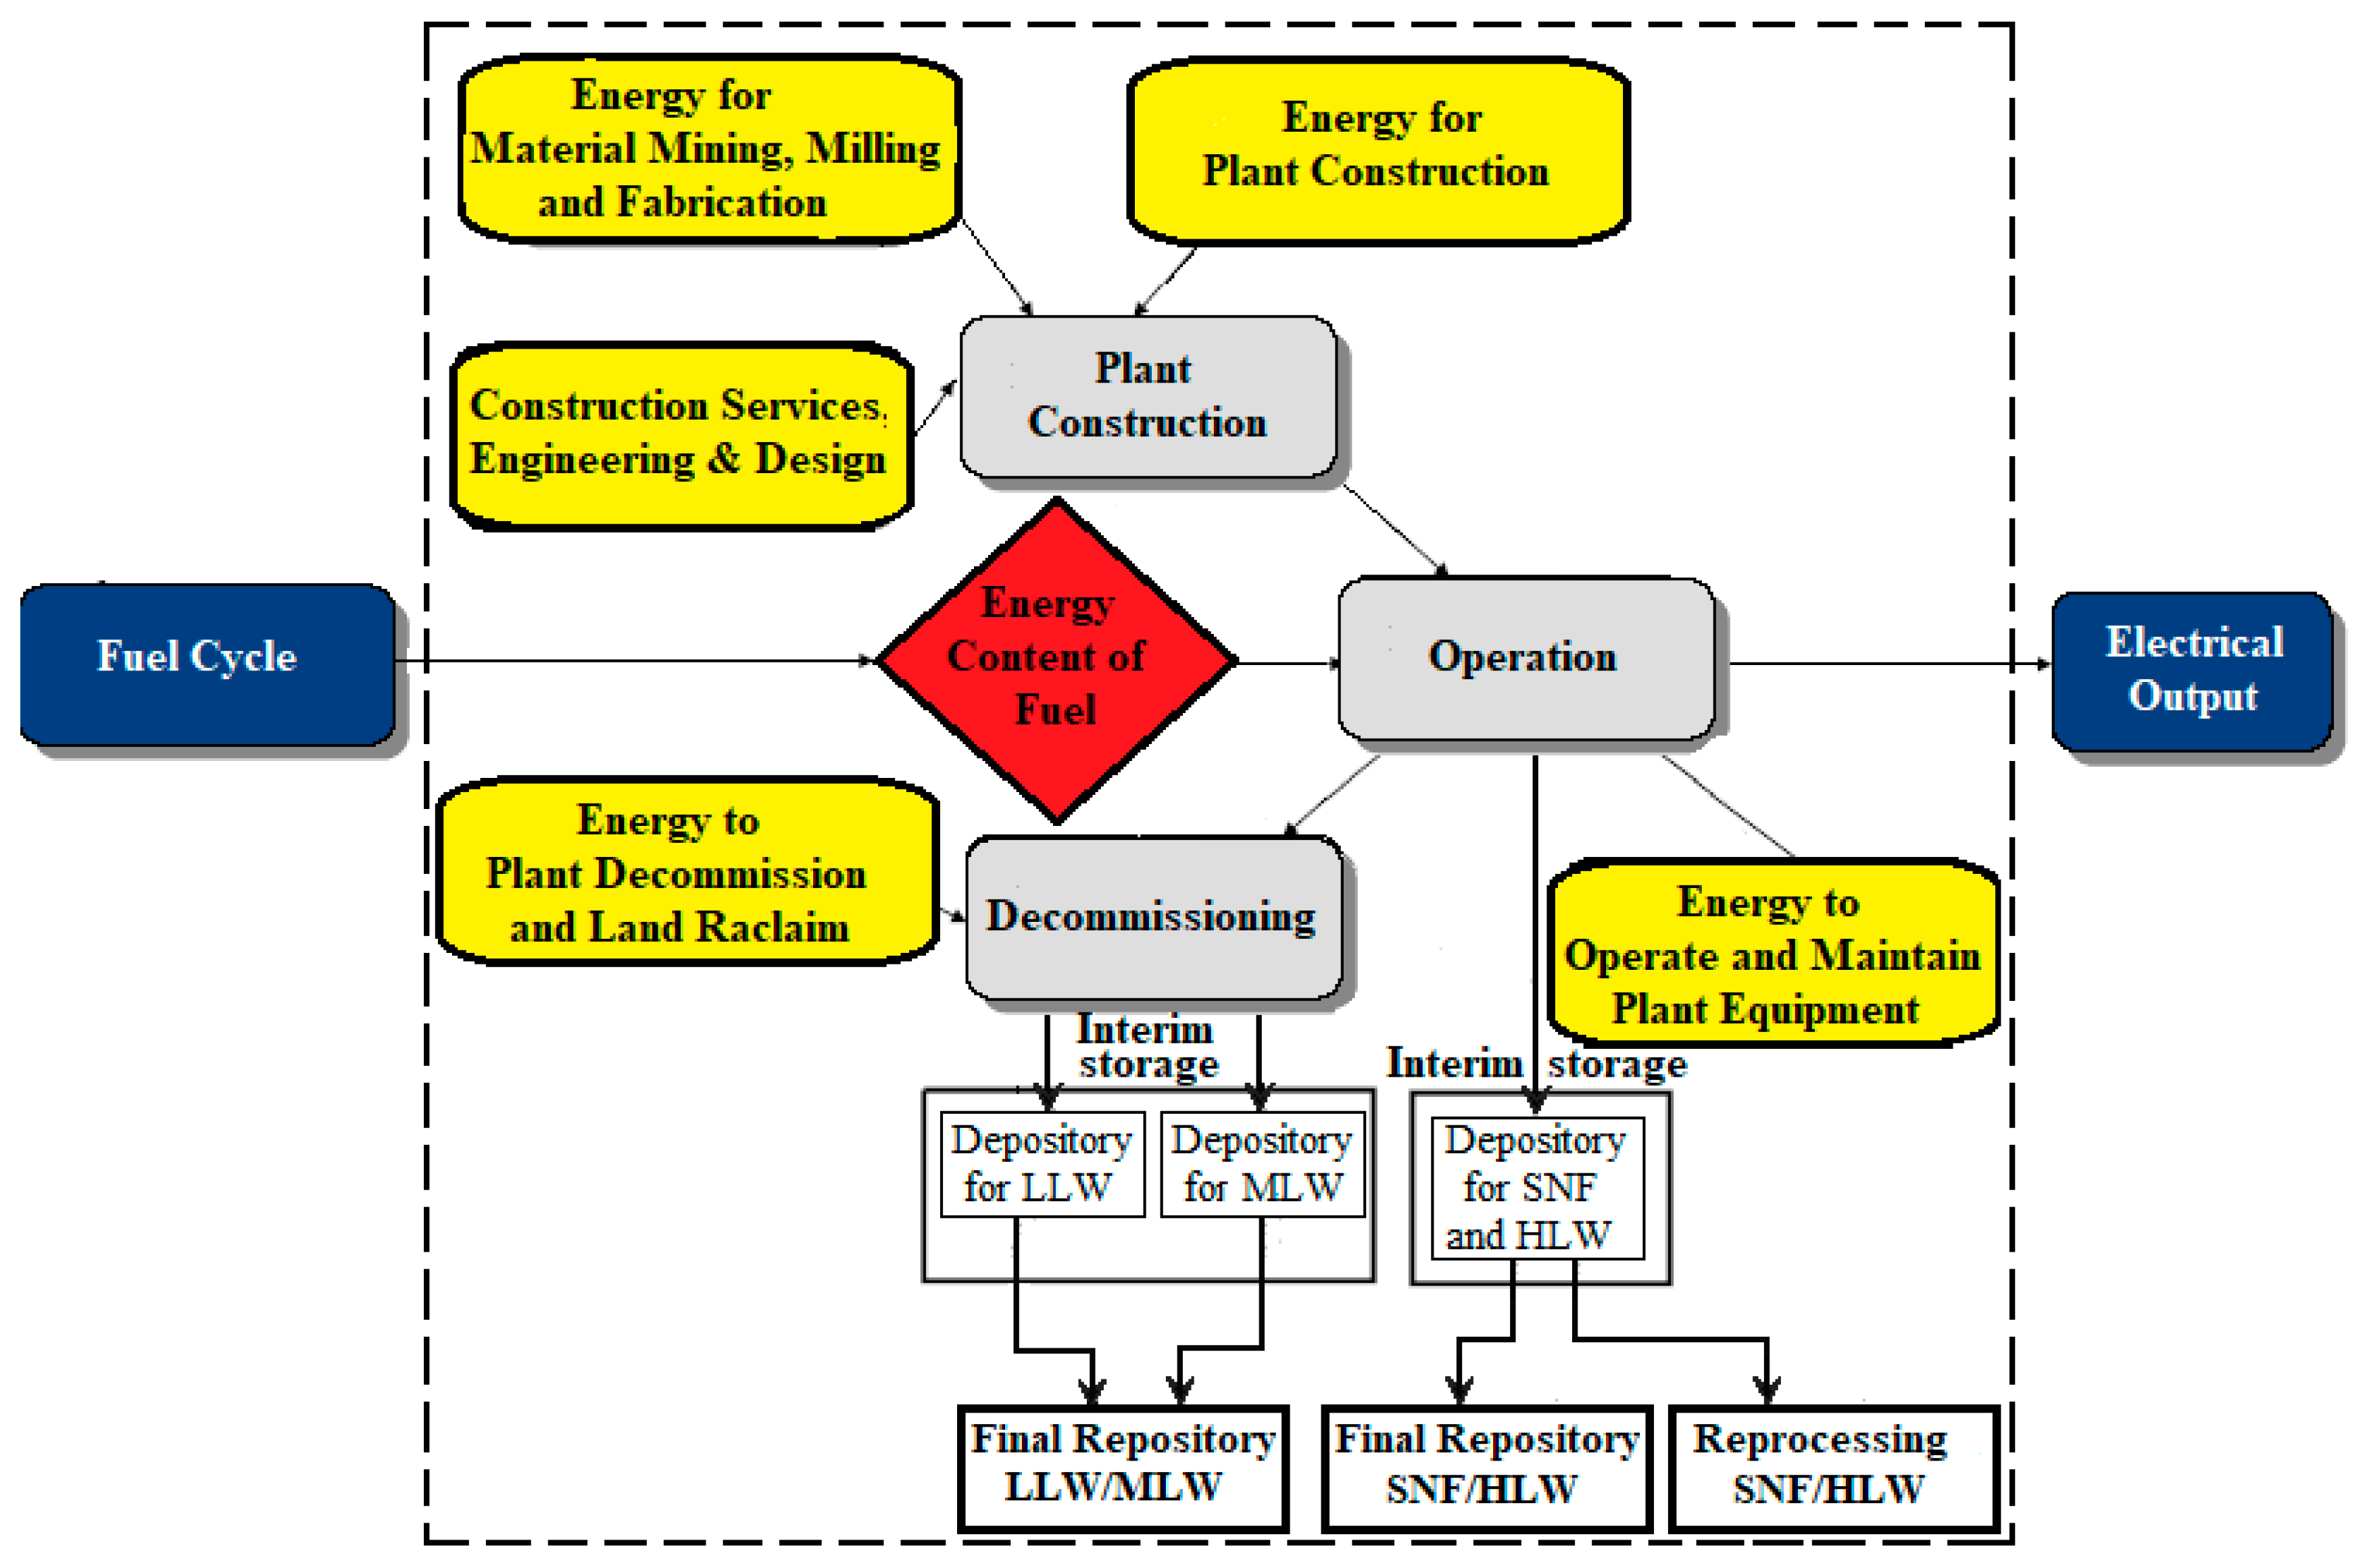
3.2. Main Phases of Nuclear Power (NP) Cycles

The scope of our material flow and energy analysis includes both direct and indirect material inputs. The scope for the energy requirements and emissions in this respect, however, is broader. It includes also the energy used for the production of materials used in the manufacture of capital equipment, energy used in the design phase of nuclear power plant construction, decommissioning and waste storage. Within the energy analysis for auxiliary materials which are used in relatively small quantities (i.e., solvents, balance of system (BOP) devices, joints, etc.) capital equipment was not taken into account. Figure 1 illustrates the definition of the system boundaries for the materials and energy analyses of the LCA study.
The functional unit for our LCA study for nuclear power was 1 Mega Watt hours of electricity (1MWhe). The power plant under consideration is capable to produce 26.8 PJ (1PJ = 1015 J) of electrical energy per annum (average) during 60 years.
The scope of this study is limited due to omitting the following factors:
(a)
local infrastructure impacts and related road modifications;
(b)
some subsidiary materials due to a lack of available data, such as personal protective equipment, solvents used in cleanup, etc.
(c)
material production burdens for office equipment, moveable partitions, and furniture;
(d)
custodial and small replacement materials (e.g., light bulbs, window glass, air filters, cleaning supplies, etc.).

3.3. Major Assumptions

The LCA study of the nuclear power cycle is based on already developed technology for the HTGR for power generation. The main characteristics of the power generation system (average) adopted in the study are taken from [15,16,17] and presented in Table 1 (for comparison the main characteristics of the mostly popular pressurised water reactors (PWR) are also presented in Table 1, taken from our previous study [18]). This study assumes that existing technologies (“off-shelf” technologies) are used for all phases of the power generation cycle including reactors, fuel fabrication, energy conversion, power plant, designs, etc. As Europe is one of the most advanced and experienced places for nuclear power generation in the world we have assumed that all main equipment for nuclear reactors were made there (thus the consumptions and emissions for reactors equipment production based on European technologies).
All data related to the nuclear power (NP) cycle based on HTGR technology in terms of power capacity, weights, materials, production processes, etc., where necessary have been scaled up or down using parameters of known models of NP cycles.
Collection of primary data sets for the study was quite a difficult process (not uncommon) and collection of detailed data for the specific technologies in terms of power capacity, weights, materials, production processes, etc. has been based on many different sources. It is unavoidable that data have been scaled up and down, averaged, some estimations have had to be performed on the basis of economic models. Arising uncertainties have been evaluated using a “pedigree matrix” approach [19].
We assumed within the study that power plant has four standard modules with a capacity of 0.285GWe each (see Table 1), however overall capacity of the power plant has been scaled back to 1GWe for this study to be able to make comparison with other LCA studies of the NP cycle and our previous study [18].
The power conversion system (PCS) adopted in this study is based on a gas turbine, which allows the use of a more efficient thermodynamically cycle (gas turbines use the Bryton cycle with an efficiency of high temperature cycle up to 50% and above). The intermediate heat exchanger (IHX) is also used for the PCS system. Although the IHX increases the complexity of the plant, it creates the possibility of using part of the heat for other purposes rather than for electricity generation (for example, hydrogen production) and also increases the safety of the system, as the second circuit is completely detached from the reactor.
Data for materials production, energy requirements, and GHG emissions related to the materials production have been taken from the SimaPro databases [20] for European conditions or using Australian conditions when those materials originated in Australia taking into account all necessary transportation.
Within the use phase of the nuclear power plant we assumed that the spent fuel will be stored as a solid material in spent fuel casks within a specifically designed building (such a scenario is used in currently designed HTGR power plants, for example, [15]). The spent fuel is being sent later to a reprocessing plant to Europe (for example, [21]) or to final repository depending upon the adopted scenario.
We also assumed within the study that all parts of the power plant except nuclear heat generation and conversion are similar to conventional power plant based on same technology (i.e., gas turbine power plant) with the same electrical capacity. Manufacturing of balance of plant (BOP) components such as heat exchangers, compressors, pipeline, valves, etc. and their accessories are also included in the LCA boundary (see Figure 1) and they are similar to conventional power plants, as well.
At the end of the power plant’s lifetime it will be decommissioned and an environmental remediation programme will be conducted, and the resulting waste will be disposed of in a responsible way. As this event can occur at least 60 years after the power plant begins operating, we assumed that the recycling rates for the major material will be at least similar to current recycling rates. Therefore 30% of construction materials, 50% of steels and 80% of copper, aluminium and glass will be recycled. Because it is hard to obtain any data on the recycling of auxiliary materials, we did not consider their recycling in our study.
The transportation of all necessary components to the construction site of the power plant and transportation of fuel and fuel reprocessing, as well as, final repository at the end of the system life have been also taken into account. The typical transport distances estimated for the nuclear power cycle phases under consideration are: (a) the manufacturing of main equipment and fuel (in Europe), (b) construction materials mainly produced locally. We also assumed that the power plant will be located near sea water to allow access for cooling (although this type of NP plant does need cooling water, it can be useful to supply heat for a desalination or hydrogen production plant) and integrated into the electricity grid. The transport distances for the phases in the nuclear power cycle are summarised in Table 2. The processes under consideration in the LCA study of the nuclear power cycle are shown in Figure 2.
All statistics for power generation by nuclear power plants and occurred AI are taken from 1965 up to the year 2012, when the nuclear power generation became a mature technology and reliable statistics on mitigation works exists. Data on AI of nuclear power generation plants and nuclear waste disposals in the world are presented in Table 3, which are extraction of data presented in [22,23]. The reported fatalities from the accidents were treated as reduction of the average population life span for the country where disaster has occurred. However, data on fatalities from nuclear power plants accidents are low [22] and have a negligible effect on human health of the whole population of the country in comparison, for example, with GHG emissions. Therefore, those data are not presented in LCA results of the study. Based on published data for the price of carbon dioxide abatement process (US$65 per 1 tonne of CO2) [24], the costs of the works done on mitigation of AI have been converted back to the GHG impact. The energy consumed for such works are estimated based on data from [25]: 5.86 MJ per 1 kg of CO2.

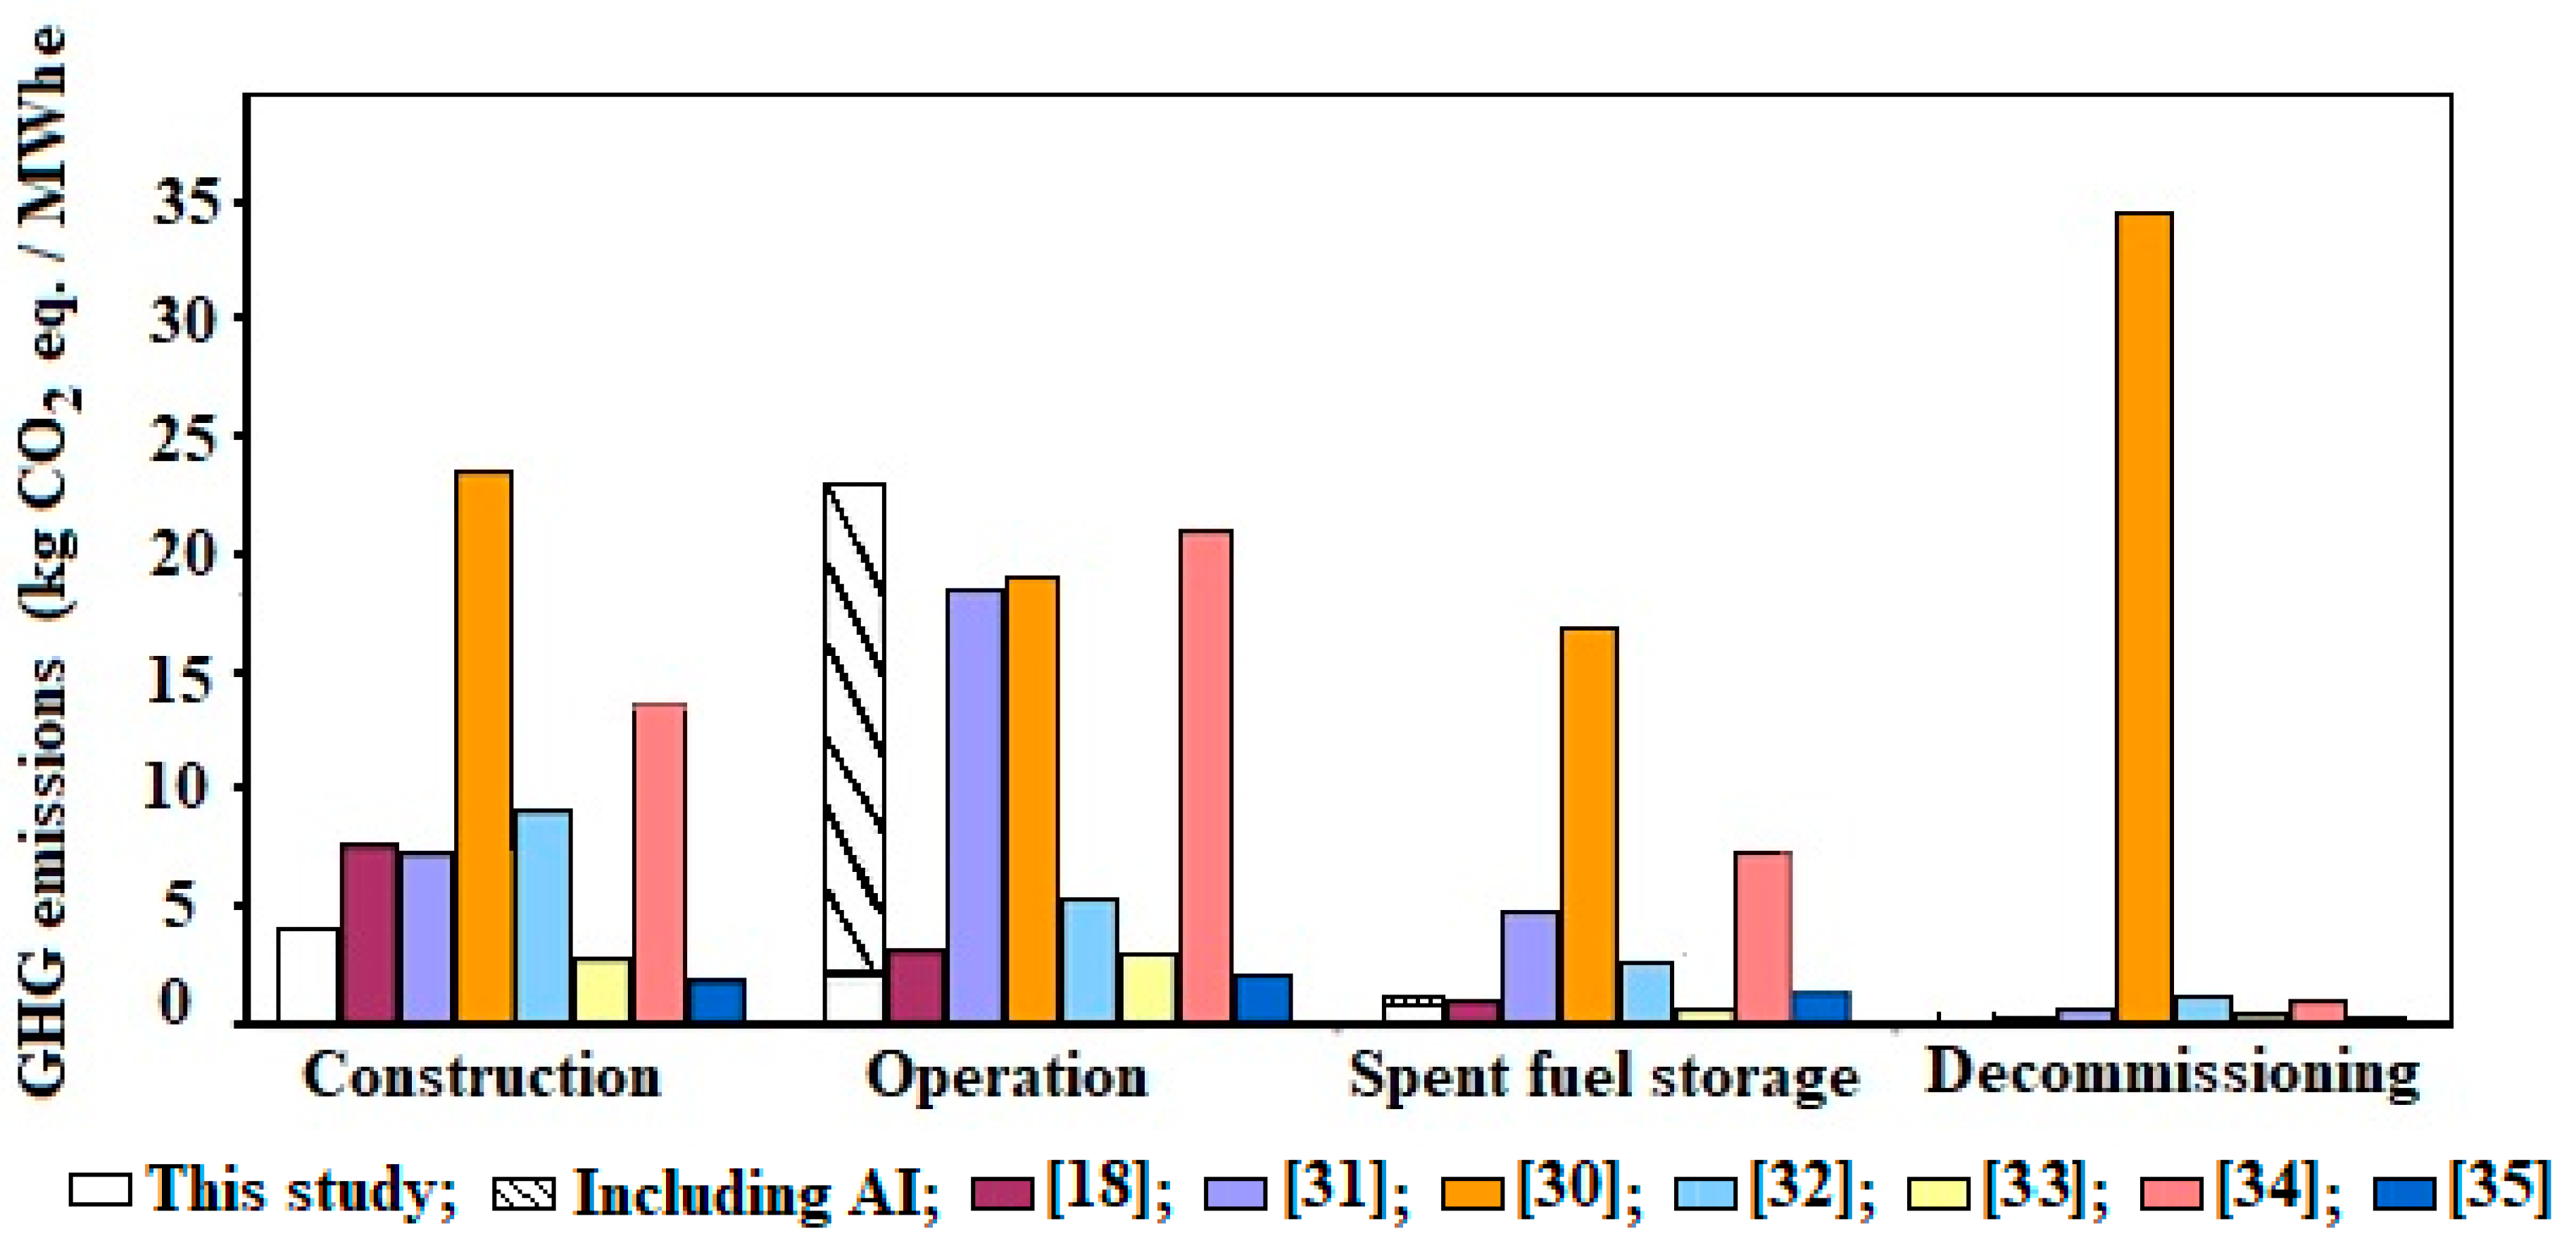
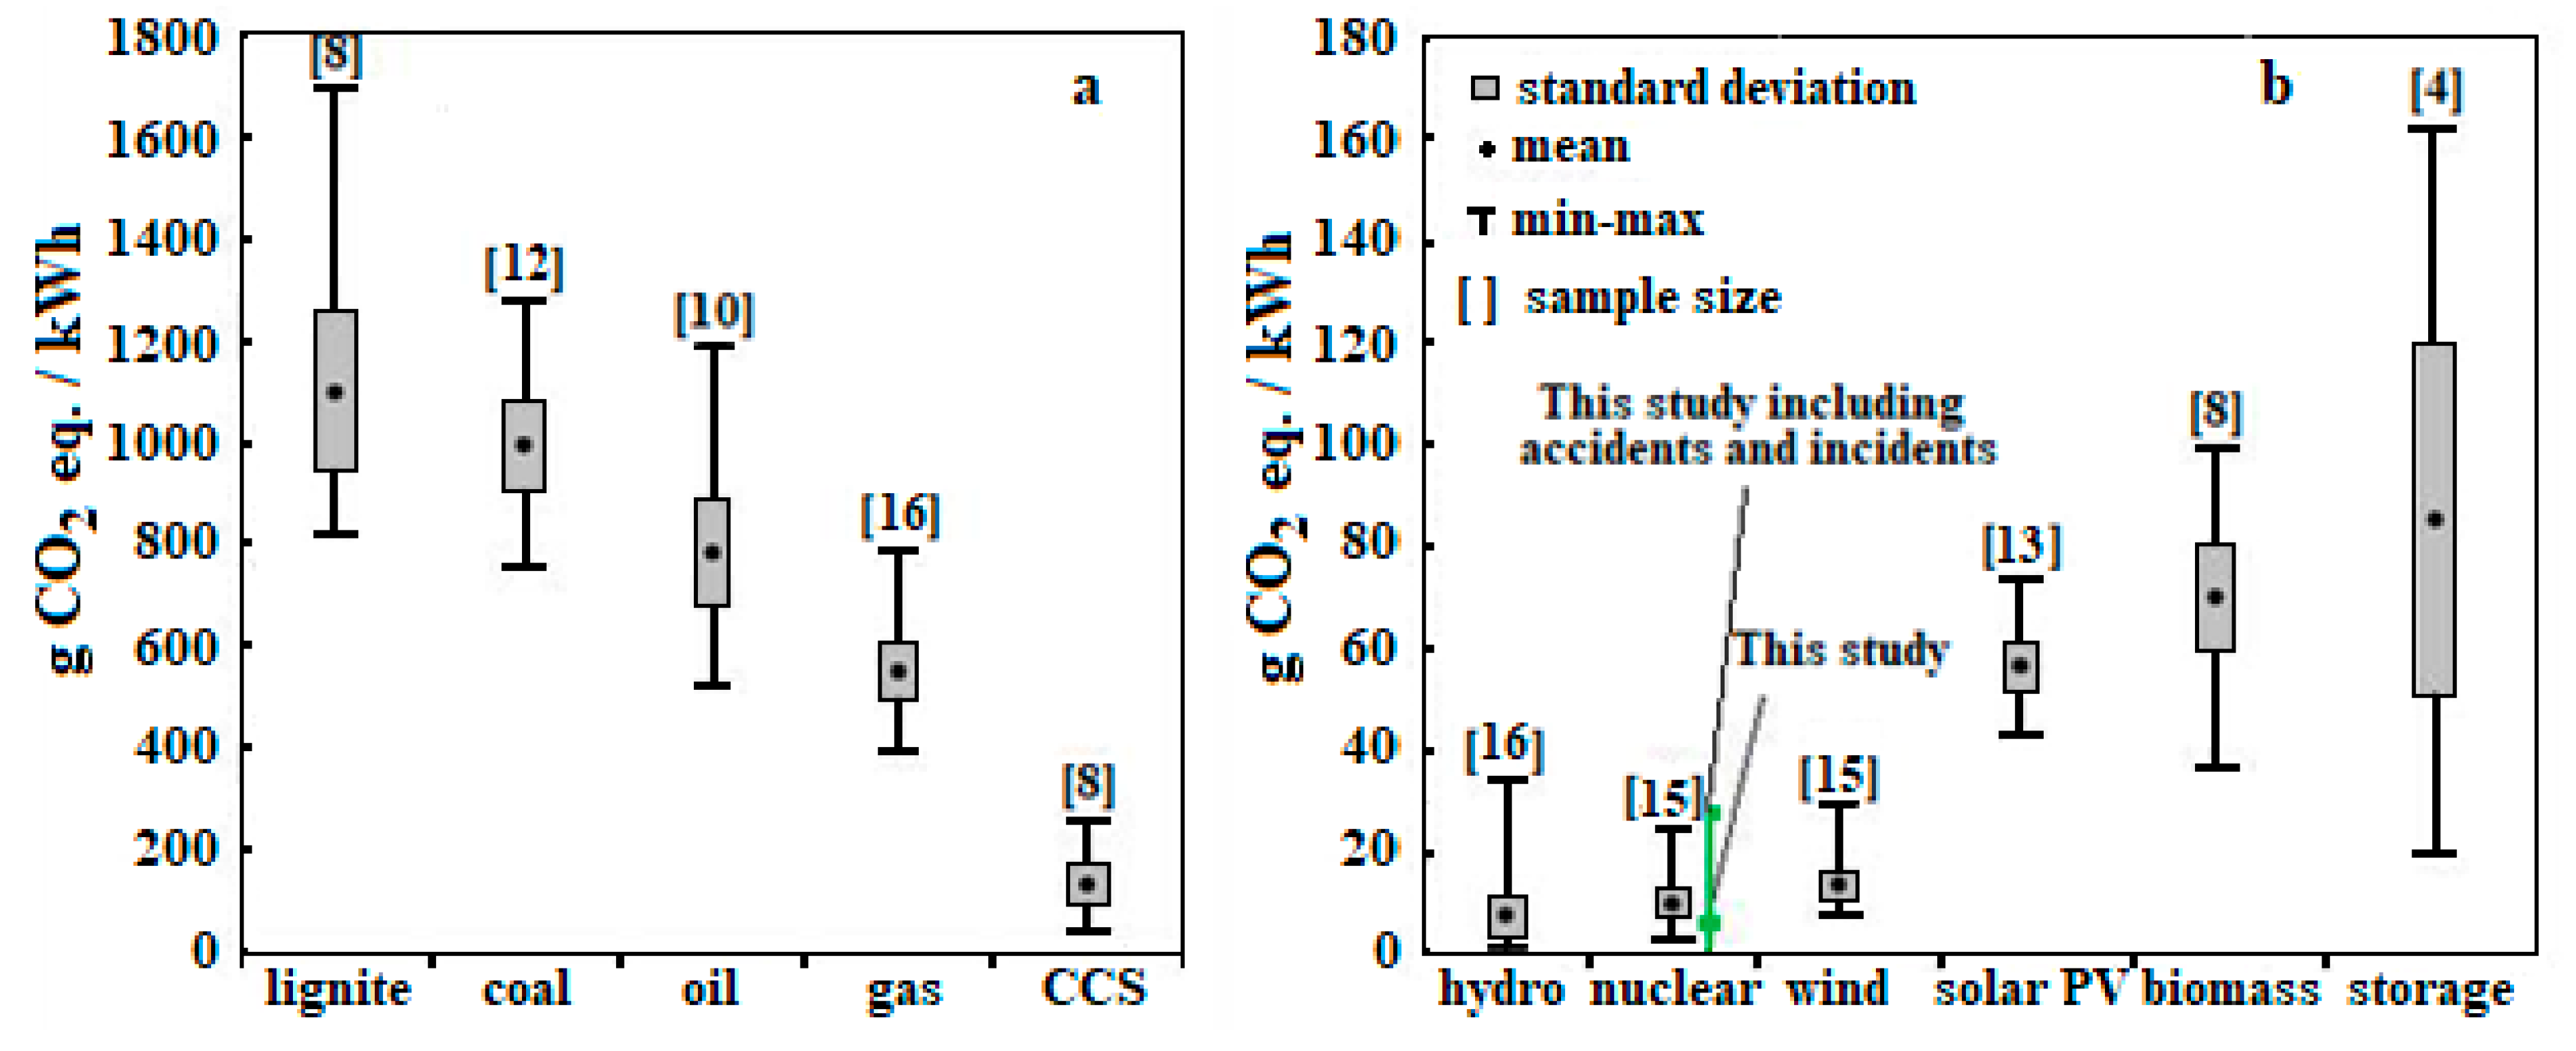
4. Results and Discussion

The amount of major required materials and produced waste for the whole life cycle of the GT-MHR power plant under consideration is presented in Table 4. (The amount of HLW presented is based on the once throughout cycle without reprocessing).
The results obtained for the primary energy consumption and GHG emissions during the LCA study are shown in Table 4. Based on the presented results the calculated GHG emissions per 1 MWhe produced are—6.42 kg of CO2 eq. and 6.72 kg of CO2 eq. with and without figures for recycling, respectively. To obtain values for the whole nuclear power cycle, the values for the front-end, i.e., ore mining, enrichment, fuel fabrication and delivery have to be added, as well as for any fuel reprocessing). The GHG footprint of the front-end (uranium mining and enrichment) was estimated previously [18] as 3.15 kg of CO2 eq./MWhe (10% U-235) with gas centrifuge enrichment technology. Thus, the overall GHG footprint of the NP cycle is 9.57 kg of CO2 eq./MWhe and 9.87 kg of CO2 eq./MWhe, respectively.
The impact of AI during power generation and waste disposal are calculated for this study based on table for AI relevant to electricity production [22] and radioactive waste disposal from nuclear power plants [23].
The costs for the LLW repository and MLW/HLW geological repository are based on averaged figures presented in [26], the cost of landfill disposal is taken from [27]; prices for recycling materials are based on data from different sources: metals from London Metal Exchange (LME) and concrete and glass are based on current market prices in Australia.
The results obtained for primary energy consumption and GHG emission through whole life cycle of NP plant (Table 5) have been used to calculate energy and GHG payback time based on a methodology developed in [28]. The calculated energy payback time for the NP plant under consideration is:
P B T E = E C × p ( E P E L ) × k / t = 35 , 511 × 0.33 ( 473.0 3.5 ) × 3600 / 60 = 1.26   ( year )
where, Ec—is total energy consumption through the whole life cycle of the NP plant (Table 5); p = 0.33—is adopted within the study as the efficiency of converting primary energy to electricity; Ep and t—are total energy production by the plant and its life time (Table 1); EL—is parasitic electric load (the energy consumed by the plant for its own needs); k = 3600—is coefficient for converting TWh to TJ. The calculated GHG payback time is:
P B T G H G = T G H G / c ( E P E L ) × k / t = ( 3018.57 × 10 3 ) / 262 ( 473.0 3.5 ) × 3600 / 60 = 0.41   ( year )
where TGHG—is total GHG emissions through the whole life cycle of the NP plant; c—is the GHG average emissions per 1GJ of produced electricity in Australia (c = 262 t of CO2 eq. per 1TJ [20]).
The energy and GHG payback time including data for AI calculated using Equations (1) and (2), are, respectively: PBTE(AI) = 2.69 year; PBTGHG(AI) = 1.32 year.
The contribution to the price of the unit of energy produced by the GT-MHR plant has also been calculated from data presented in Table 5 for the LCA cost of the NP plant life cycle, which is approximately 0.95 c/kWh (1.05 c/kWh including AI) for electrical energy in 2010 US dollars.
The obtained results of our study are in broad agreement with the majority of results of other reports and publications dealing with this subject (although there are some others which are contradictory to our results, e.g., [29]). A comparison of the results for GHG emissions per unit of electrical energy are shown in Figure 3.
Some reviews of the studies on the topic are done in [30], where results of GHG emissions from LCA studies for different energy production technologies are provided. This work presents life-cycle mostly emissions for current power generation technologies, although some estimation of GHG emissions for advanced and future technologies are also provided. Only original studies have been used to ensure that all data can be traced back to the original references. The LCA studies and reports used were published between 2000 and 2006. Figure 4 presents a summary of the surveyed results (it should be noted that figure shown for this study presents result using the following scenario: (a) at the front-end: only primary fuel (no reprocessed fuel) is used based on 10% U-235 enrichment with 100% centrifuge technology; (b) NP plant cycle and back-end is based on the results obtained in this report).

5. Conclusions

Australian energy demands, which are largely met by fossil fuel, keep growing along with associated greenhouse gas emissions. Electricity production from nuclear power could potentially be part of the solution to reduce these greenhouse gas emissions. The purpose of this LCA study was to evaluate the likely effect of the new reactor technology (HTGR) for the greenhouse gas footprint of nuclear power.
The GT-MHR design offers several advantageous performance characteristics. These include:
  • High Plant Efficiency—Use of the Brayton Cycle helium gas turbine in the GT-MHR provides electric generating capacity at a net plant efficiency of 47.5%. The high plant efficiency reduces power generation costs, thermal discharge to the environment and high-level waste generation per unit electricity produced.
  • Superior High-Level Waste Form—Coated particle fuel (TRISO) provides a superior spent fuel waste form for both long-term interim storage and permanent geologic disposal. As such, they provide defense-in-depth to ensure that the spent fuel radionuclides are contained for geologic time frames and do not migrate to the biosphere.
  • Low Carbon Impact—The GT-MHR has very low GHG emissions per unit of electricity production of about 6.5 g CO2 eq./kWh for the GT-MHR NP plant life cycle. With all fuel enrichment by gas centrifuge technology in combination with the GT-MHR, the overall GHG footprint of nuclear was estimated to be: −9.6 g CO2 eq./kWh.
Included in LCA study environmental impact (in terms of GHG emissions and energy requirements) based on available statistics of AI from nuclear power generation. It shows that although cost of power generation should be increased by about 10%, although, energy requirement is doubled and GHG emissions even tripled to about 30 g CO2 eq./kWh. However, even these figures are relatively small in comparison with current energy generation technologies (Figure 4). Thus, nuclear technology remains attractive in that respect, even taking into account data on AI happened so far.

Author Contributions

Conceptualisation: P.K. and A.T.; Methodology: P.K.; Software: P.K. and V.N.; Validation: P.K., A.T., V.N.; Investigation: P.K. and A.T.; Resources: V.N.; Data Curation: P.K., A.T., Writing—Original Draft Preparation: P.K., A.T., V.N.; Writing–Review and Editing: P.K., A.T., V.N.; Visualization: P.K. and A.T.; Supervision: A.T. and V.N.; Project Administration: V.N.

Funding

This research received no external funding.

Acknowledgments

The authors express their appreciation to Common Science and Industrial Research Organisation (CSIRO), Australia for the support of the main part of this research.

Conflicts of Interest

The authors declare no conflict of interest. The funders had no role in the design of the study; in the collection, analyses, or interpretation of data; in the writing of the manuscript, and in the decision to publish the results.

Abbreviations

4GFourth generation
AIAccidents and Incidents
BOPBalance of plant
CO2Carbon dioxide
GHGGreenhouse gases
GIFGeneration IV International Forum
GT-MHRGas-turbine modular helium reactor
GWd/tonGiga Watt*days/ton
HLWHigh level radioactive waste
HTGRHigh temperature gas-cooled reactor
HTR-PMThe name of a small modular nuclear reactor developed in China
I/OInput/Output
IHXIntermediate heat exchanger
ISOInternational Organisation for Standardisation
LCALife cycle assessment
LCILife cycle inventory
LLWLow level radioactive waste
LMELondon Metal Exchange
MLWMedium level radioactive waste
MWheMega Watt (109 Watt)*hours (electricity)
NGNPNext Generation Nuclear Plant
NPNuclear power
PBTPay back time
PCAProcess chain analysis
PCSPower conversion system
PWRPressurised water reactor
SNFSpent nuclear fuel
SWU/GWYSeparative work unit (the amount of separation done by an enrichment process)/Giga Watt*year
TRISOThe ceramic fuel: –triple coated small balls
TWTerra Watt = 1012 Watt
VHTRVery high temperature reactor

References

  1. Dresselhaus, M.S.; Crabtree, G.W.; Buchanan, M.V. Addressing Grand Energy Challenges through Advanced Material. Mater. Res. Soc. Bull. 2005, 30, 518–524. [Google Scholar] [CrossRef]
  2. Ashby, M.F. Materials and the Environment. Eco-Informed Materials Choice; Butterworth Heinemann: Boston, MA, USA, 2009. [Google Scholar]
  3. International Atomic Energy Agency. Design Features to Achieve Defence in Depth in Small and Medium Sized Reactors; Report, Vienna, STI/PUB/1399; International Atomic Energy Agency: Vienna, Austria, 2009. [Google Scholar]
  4. Reuters. Developing Countries Eye Nuclear Power. Report. 12 May 2010. Available online: http://uk.reuters.com/article/worldNews/idUKN1253956420080512 (accessed on 10 September 2018).
  5. Bouchard, J.; Bennett, R. Generation IV Advanced Nuclear Energy Systems. Nucl. Plant J. 2008, 26, 42–45. [Google Scholar]
  6. Adamantiades, A.; Kessides, I. Nuclear Power for Sustainable Development: Current Status and Future Prospects. Energy Policy 2009, 37, 5149–5166. [Google Scholar] [CrossRef]
  7. International Atomic Energy Agency. Technology Review; IAEA/NTR/2006; International Atomic Energy Agency: Vienna, Austria, 2006. [Google Scholar]
  8. Kuhr, R. HTR’s Role in Process Heat Applications. Nuclear Eng. Des. 2008, 238, 3013–3017. [Google Scholar] [CrossRef]
  9. IAEA. Advances in Small Modular Reactor Technology Developments. Available online: https://aris.iaea.org/publications/smr-book_2018.pdf (accessed on 10 September 2018).
  10. Perrow, C. Normal Accidents: Living with High Risk Technologies; Princeton University Press: New York, NY, USA, 1984; p. 441. ISBN 0-691-00412-9. [Google Scholar]
  11. International Organisation for Standardisation (ISO). Environmental Management—Life Cycle Assessment—Principles and Framework (ISO 14040); ISO: Geneva, Switzerland, 2006. [Google Scholar]
  12. ISO. Environmental Management—Life Cycle Assessment—Requirements and Guidelines (ISO 14044); ISO: Geneva, Switzerland, 2006. [Google Scholar]
  13. World Energy Council. Comparison of Energy Systems Using Life Cycle Assessment; A Special Report of the World Energy Council; World Energy Council: London, UK, 2004; ISBN 0-94612116-8. [Google Scholar]
  14. Massara, S.; Tetart, O.; Lecarpentier, D.; Garzenne, C. Prospective Scenarios of Nuclear Energy Evolution on the XXIst Century over the World Scale. Nucl. Eng. Des. 2009, 239, 1708–1717. [Google Scholar] [CrossRef]
  15. General Atomic. Pre-Conceptual Engineering Services for the Next Generation Nuclear Plant (NGNP) with Hydrogen Production; Executive Summary Report, Project 30283; General Atomic: San-Diego, CA, USA, 2007. [Google Scholar]
  16. Yan, X. GTHTR300 Design and Development. Nucl. Eng. Des. 2003, 222, 247–262. [Google Scholar] [CrossRef]
  17. Idaho National Laboratory. Next Generation Nuclear Plant, Pre-Conceptual Design; DOE, INL/EXT-07-12967; Idaho National Laboratory: Idaho Falls, ID, USA, 2007. [Google Scholar]
  18. Weidema, B.; Wesnaes, M. Data Quality Management for Life Cycle Inventories: An Example of Using Data Quality Indicators. J. Clean. Prod. 1996, 4, 3–4. [Google Scholar] [CrossRef]
  19. Norgate, T.; Koltun, P.; Tharumarajah, A.; Haque, N. Life Cycle Assessment of Uranium Nuclear Power Sycle, Part 1: Once Trough Cycle with Current Technologies; CSIRO, MDU: Canberra, Australia, 2010. [Google Scholar]
  20. Amersfoort, B.V. SimaPro 7.1: The Software Tool to Analyse and Develop Environmentally Sound Products; Pre Consultants: Amersfoort, The Netherlands, 2009. [Google Scholar]
  21. International Project on Innovative Nuclear Reactors and Fuel Cycles. Status and Trends of Nuclear Technologies; Report, IAEA-TECDOC-1622; International Atomic Energy Agency: Vienna, Austria, 2009. [Google Scholar]
  22. Nuclear Radiation Accidents and Incidents. Wikipedia. Available online: https://en.wikipedia.org/wiki/Nuclear_and_radiation_accidents_and_incidents#cite_note-critev-10 (accessed on 10 September 2018).
  23. List of Waste Disposal Incidents. Wikipedia. Available online: https://en.wikipedia.org/wiki/List_of_waste_disposal_ incidents (accessed on 10 September 2018).
  24. Global Carbon Capture & Storage Institute. Project Pioneer. Report, Published: 22 April 2012. Available online: https://hub.globalccsinstitute.com/publications/final-report-project-pioneer/cost-co2-abatement (accessed on 10 September 2018).
  25. Defulf, J.; van Langenhove, H.; Mulder, J.; van den Berg, M.M.D.; van der Kooi, H.J.; de Arons, J. Illustration towards quantifying the sustainability of technology. Green Chem. 2000, 2, 108–114. [Google Scholar]
  26. Jackson, I. Nukenomics: The Commercialisation of Britain’s Nuclear Industry; Nuclear Engineering International: Kent, UK, 2008; ISBN 978-1-903077-55-9. [Google Scholar]
  27. BDA Group. The Full Cost of Landfill Disposal in Australia. 2009. Available online: http://www.environment.gov.au/system/files/resources/685d170f-9275-4ab5-8fde-5015ef43920d/files/peer-review.pdf (accessed on 10 September 2018).
  28. Koltun, P.; Tharumarajah, A. Environmental Assessment of Small Scale Solar Thermal Electricity Generation Unit Based on LCA Study. In Proceedings of the 15th International Conference on Life Cycle Engineering, Sydney, Australia, 17–19 March 2008. [Google Scholar]
  29. Van Leeuwen, S. Nuclear Power—The Energy Balance; Report, Part E; Ceedata Consultancy: Cham, The Netherlands, 2007. [Google Scholar]
  30. Weisser, D. A Guide to Life-Cycle Greenhouse Gas Emissions from Electric Supply Technologies. Energy 2007, 32, 1543–1559. [Google Scholar] [CrossRef]
  31. ISA. Life-Cycle Energy Balance and Greenhouse Gas Emissions of Nuclear Energy in Australia; The University of Sydney: Sydney, Australia, 2006. [Google Scholar]
  32. Fthenakis, V.M.; Kim, H.C. Greenhouse-Gas Emissions from Solar Electric- and Nuclear Power: A Life-Cycle Study. Energy Policy 2007, 35, 2549–2557. [Google Scholar] [CrossRef]
  33. Hondo, H. Life Cycle GHG Emission Analysis of Power Generation Systems: Japanese Case. Energy 2005, 30, 2042–2056. [Google Scholar] [CrossRef]
  34. Tokimatsu, K. Evaluation of Lifecycle CO2 Emissions from the Japanese Electric Power Sector in the 21st Century under Various Nuclear Scenarios. Energy Policy 2006, 34, 833–852. [Google Scholar] [CrossRef]
  35. White, W.; Kulcinski, G.L. Birth to Death Analysis of the Energy Payback Ratio and CO2 Gas Emission Rates from Coal, Fission, Wind, and DT-fusion Electrical Power Plants. Fusion Eng. Des. 2000, 48, 473–481. [Google Scholar] [CrossRef]
Figure 1. System boundary for the part of nuclear cycle under consideration.
Energies 11 03452 g001
Figure 2. Processes for the nuclear power generation cycle adopted for this part of the study (The processes outside of dashed lines are out of scope of the study).
Energies 11 03452 g002
Figure 3. Comparison results for GHG emissions per unit of electrical energy production from different studies of nuclear power (NP) plant cycle: [18,30,31,32,33,34,35] and this study.
Energies 11 03452 g003
Figure 4. Results of life cycle GHG emissions from surveyed studies [32]. (a) fossil fuels; (b) renewables).
Energies 11 03452 g004
Table 1. The main characteristics of high temperature gas-cooled reactor (HTGR) power generation system (the characteristics of currently most popular pressurised water reactor system are shown for comparison).
Feature/ParameterUnitValue
HTGRPWR
Plant thermal powerGWth2.4 [2.1]3.12
Net power outputMWe1140 [1000]1000
Number of units per site-4 (600 MWth each)1
Thermodynamic efficiency%47.532
Load factor%9085
Plant life timeYears6040
Cycle LengthMonths1818
Lifetime gross (net)
electricity production
TWh539.2 (534.1)
[473.0 (469.5)]
297.8 (294.8)
Average burnupGWd/tU10035
Average uranium enrichment%10.03.2
Total (per GWh) mass of enriched uraniumt (kg/GWh)421.2 [369.5]
(0.781)
413.6 (1.389)
SWU Demand (average)103 kg-SWU/GWY221135
Turbine type-Gas (Brayton cycle)Steam (Rankine cycle)
Cooling/working primary (secondary) fluid-Helium (Nitrogen/Helium mixture)Water (Water)
Reactor safety system-No active emergency
system
3–4 independent emergency systems
Figures in square brackets are adjusted for 1 GWe capacity.
Table 2. Transport distances adopted by the study.
StageLocationTransportation Distance, kmForm of Transport
Main equipment manufacturing (reactor, turbines, etc.)Europe300 + 20,000Roads to ports + Sea
Auxiliary equipment (pipes, cables, BOS, etc.)Australia500Rails & Roads
ConstructionsAustralia300–500 (average)Roads
Waste disposal (radioactive waste disposal)Australia150 (1000-2000)Roads (Rails)
Table 3. Main Nuclear power plant and radioactive waste disposal accidents and incidents (with multiple fatalities and/or more than US$10 million in damage, 1965–2011) [22,23].
Date (Day/Month/Year)LocationDescriptionDeadCost ($US Mln)INES Level
05/10/1966Michigan, USAPartial core meltdown at the Enrico Fermi Nuclear Generating Station0132
21/01/1969Vaud, SwitzerlandLoss-of-coolant accident, leading to a partial core meltdown05
06/02/1975 and 15/03/1992Leningrad Oblast, RussiaPartial nuclear meltdown in reactor unit.
Leaked radioactive gases.
31500
07/12/1975Greifswald, GermanyElectrical error causes fire five main coolant pumps04433
05/01/1976 and 22/02/1977Bohunice, SlovakiaCorrosion of reactor and release of radioactivity217004
28/03/1979Pennsylvania, USALoss of coolant and partial core meltdown.024005
15/09/1984Alabama, USASafety violations, operator error.0110
09/03/1985Alabama, USASystems malfunction during start-up01830
11/04/1986Massachusetts, USARecurring equipment problems.01001
26/04/1986Chernobyl, UkraineOverheating, steam explosion.6167007
04/05/1986Hamm-Uentrop, GermanyExperimental THTR-300 reactor releases small amounts of fission products.0267
31/03/1987Pennsylvania, USAPeach Bottom units 2 and 3 shutdown due to cooling malfunctions.0400
19/12/1987New York, USAMalfunctions, force to shut down Nine Mile Point Unit 10150
17/03/1989Maryland, USAInspections at reveal cracks at pressurized heater sleeves0120
20/02/1996Connecticut, USALeaking valve, multiple equipment failures.0254
02/09/1996Florida, USABalance-of-plant equipment malfunction0384
30/09/1999Ibaraki, JapanRadiation levels above permissible limits.2544
16/02/2002Ohio, USASevere corrosion of control rod01433
09/08/2004Fukui, JapanSteam explosion491
25/07/2006Forsmark, SwedenAn electrical fault01002
11/03/2011Fukushima, JapanA tsunami flooded and damaged the plant’s 5 active reactors.2187,0007
12/09/2011Marcoule, FranceThe explosion took place in a furnace used to melt metallic waste.1101
Waste Disposal Accidents and Incidents
15/05/1988Cádiz, SpainRadioactive contamination in scrap metal processing plant by a caesium-137 (up to 1000 times higher than normal)0132
From 1951 up to 2016Lake Karachay, Cheliabinsk Oblast, RussiaThe lake accumulated about 4.44 exabecquerels (EBq) of radioactivity, including 3.6 EBq of caesium-137and 0.74 EBq of strontium-90.0263
From 1980 up to 2000SomaliaA criminal organisation from Calabria (Italy) has been involved in radioactive waste dumping00.26
Start 1949 up to nowRiver “Techa”, Cheliabinsk Oblast, RussiaThe Mayak complex dumped radioactive waste water, a cumulative dispersal of 102 Petabecquerel (PBq) of radioactivity.216
0 Data which have not been presented in this table at the referred source are taken from other sources on Wikipedia.
Table 4. Main materials used during life cycle of GT-MHR power plant (1GWe capacity).
Required Main MaterialsAmount (t)
Concrete440,000
Iron and Steel132,000
Other metals10,000
Uranium (10% enriched)369.5
Plastics3000
Other materials53,000
Main Waste StreamsAmount (t)
LLW18,600
MLW11,300
HLW2930
Inert waste460,000
Recyclable waste146,000
Table 5. Economic cost, energy consumption and greenhouse gas (GHG) emissions from the whole life cycle of HTGR power plant (1 GWe capacity).
LCA PhaseCost (M$)Energy Consumption (TJ)GHG Emissions (103 t CO2 eq.)
Pre-useEngineering & Design115.5381.360.17
Equipment fabrication1163.215014.21503.42
Construction materials286.23697.1239.08
Non-process equipment69.3553.545.87
Construction works462.8356.774.74
UseUse14529422.0739.00
Post-useDecommissioning (decontamination & demolition works)342.41638.7106.43
LLW disposalLLW waste site construction and maintenance31.701375.672.70
Drums &Cement66.9
Transportation3.8
MLW/HLW disposalGeological repository: construction & maintenance375.34803290.42
TAD and drums89.3
Transportation9.9
Non-radioactive waste disposalLandfill disposal13.813.30.73
Transportation1134623.37
Recycling creditsConcrete1.514917.9
Carbon Steel9.6614.426.88
Stainless Steel12209.414.36
Copper6.4211.518.43
Aluminium7.7878.458.51
Glass0.0327.61.28
Total (without recycling)4493.137,601.43155.93
Total (including recycling)4455.8735,511.13018.57
Additions (due to accidents and incidents)447.5840,351.06686.00

