Article

Energy Consumption and Life Cycle Costs of Overhead Catenary Heavy-Duty Trucks for Long-Haul Transportation

1
Electrochemical Energy Conversion and Storage Systems Group, Institute for Power Electronics and Electrical Drives (ISEA), RWTH Aachen University, Jaegerstr. 17/19, 52066 Aachen, Germany
2
Juelich Aachen Research Alliance, JARA-Energy, 52425 Juelich, Germany
3
Institute for Power Generation and Storage Systems (PGS), E.ON Energy Research Center, RWTH Aachen University, Mathieustr. 10, 52074 Aachen, Germany
*
Author to whom correspondence should be addressed.
Energies 2018, 11(12), 3446; https://doi.org/10.3390/en11123446
Submission received: 5 November 2018 / Revised: 1 December 2018 / Accepted: 6 December 2018 / Published: 9 December 2018
(This article belongs to the Section I: Energy Fundamentals and Conversion)

Abstract

:
The overhead catenary truck is an interesting technology for long-haul transportation with heavy-duty trucks because it can combine the advantage of energy supply via catenary while driving and the flexibility of a battery truck on routes without catenary using the traction battery. This study investigates the energy consumptions of overhead catenary trucks on German highways and considers different configurations for the traction battery and catenary power system. Afterwards the life cycle costs of overhead catenary trucks are calculated for a specified long-haul transportation scenario and the results are compared to battery electric truck and diesel truck using the findings of a previous study by the authors. The energy consumption of the considered overhead catenary trucks is approximately equal to that of a battery electric truck but only about a half of the equivalent energy consumption of a conventional diesel truck. According to the cost assumptions in this study, the total life cycle costs of overhead catenary trucks can be in the range of the conventional diesel truck, showing the competitiveness of this alternative truck technology.

1. Introduction

To reduce emissions in the transport sector, electric vehicles are considered as a viable solution [1,2,3]. The freight transport over long distances with electric vehicles is however challenging to realize as the energy requirements are high due to heavy loads and long daily routes [4]. To meet these requirements, the overhead catenary truck is an interesting technology that can combine the advantage of energy supply via catenary while driving and the flexibility of a battery truck on routes without catenary using the traction battery.
Some studies investigating the alternative heavy-duty trucks [3,5,6] also consider the overhead catenary truck as a possible option for long-haul transportation. In [3], the overhead catenary trucks are compared to the conventional diesel trucks, fuel cell trucks, and battery electric trucks in terms of technology, costs, and emissions. However, the costs for catenary infrastructure are not considered and there is no comparison to the battery trucks as they are not subject for long-haul trucks. In [5], plug-in hybrid electric trucks and trucks fueled with combined natural gas furthermore were investigated. The focus is on the vehicle components’ costs while the energy consumption is less explained. Also, here the infrastructure costs are not within the scope. Another study [6] gives a detailed analysis of overhead catenary trucks and compares them to conventional trucks and fuel cell trucks. However, the battery electric trucks are not considered as a viable solution for long-haul transportation since the payload restrictions, due to a large battery, are considered high.
To test the technical feasibility, the projects ENUBA 1 and 2 [7,8] were conducted where a catenary section was constructed on a test route and some diesel trucks converted to overhead catenary trucks by installing a battery, pantograph, and electronics. Subsequently, two test sections on public highways are planned to demonstrate and investigate the technology [9].
This study expands the scope of investigation to the detailed analysis of trucks energy consumption in a realistic long-haul transportation scenario and to the direct comparison to the battery electric truck and conventional diesel truck in the same scenario, including charging and catenary infrastructure. The results of the previous study on battery electric trucks [4] by the authors are incorporated in this study.
First, the methodology of the study is outlined, giving an overview of the used vehicle and costs model, which are explained in detail. The traction battery and the overhead catenary infrastructure are then dimensioned using the average energy consumption on German highways and different catenary configurations. The continuous and sectional catenary configurations are considered in combination with different traction batteries. Subsequently, the transportation scenario is specified according to the requirements of long-haul transportation and legislative European Union’s regulations on driving time. Finally, the life cycle costs for this transportation scenario are described with focus on infrastructure costs and total costs. The energy consumption and life cycle costs of overhead catenary trucks are also compared to that of a battery electric truck and diesel truck.

2. Materials and Methods

2.1. Methodology

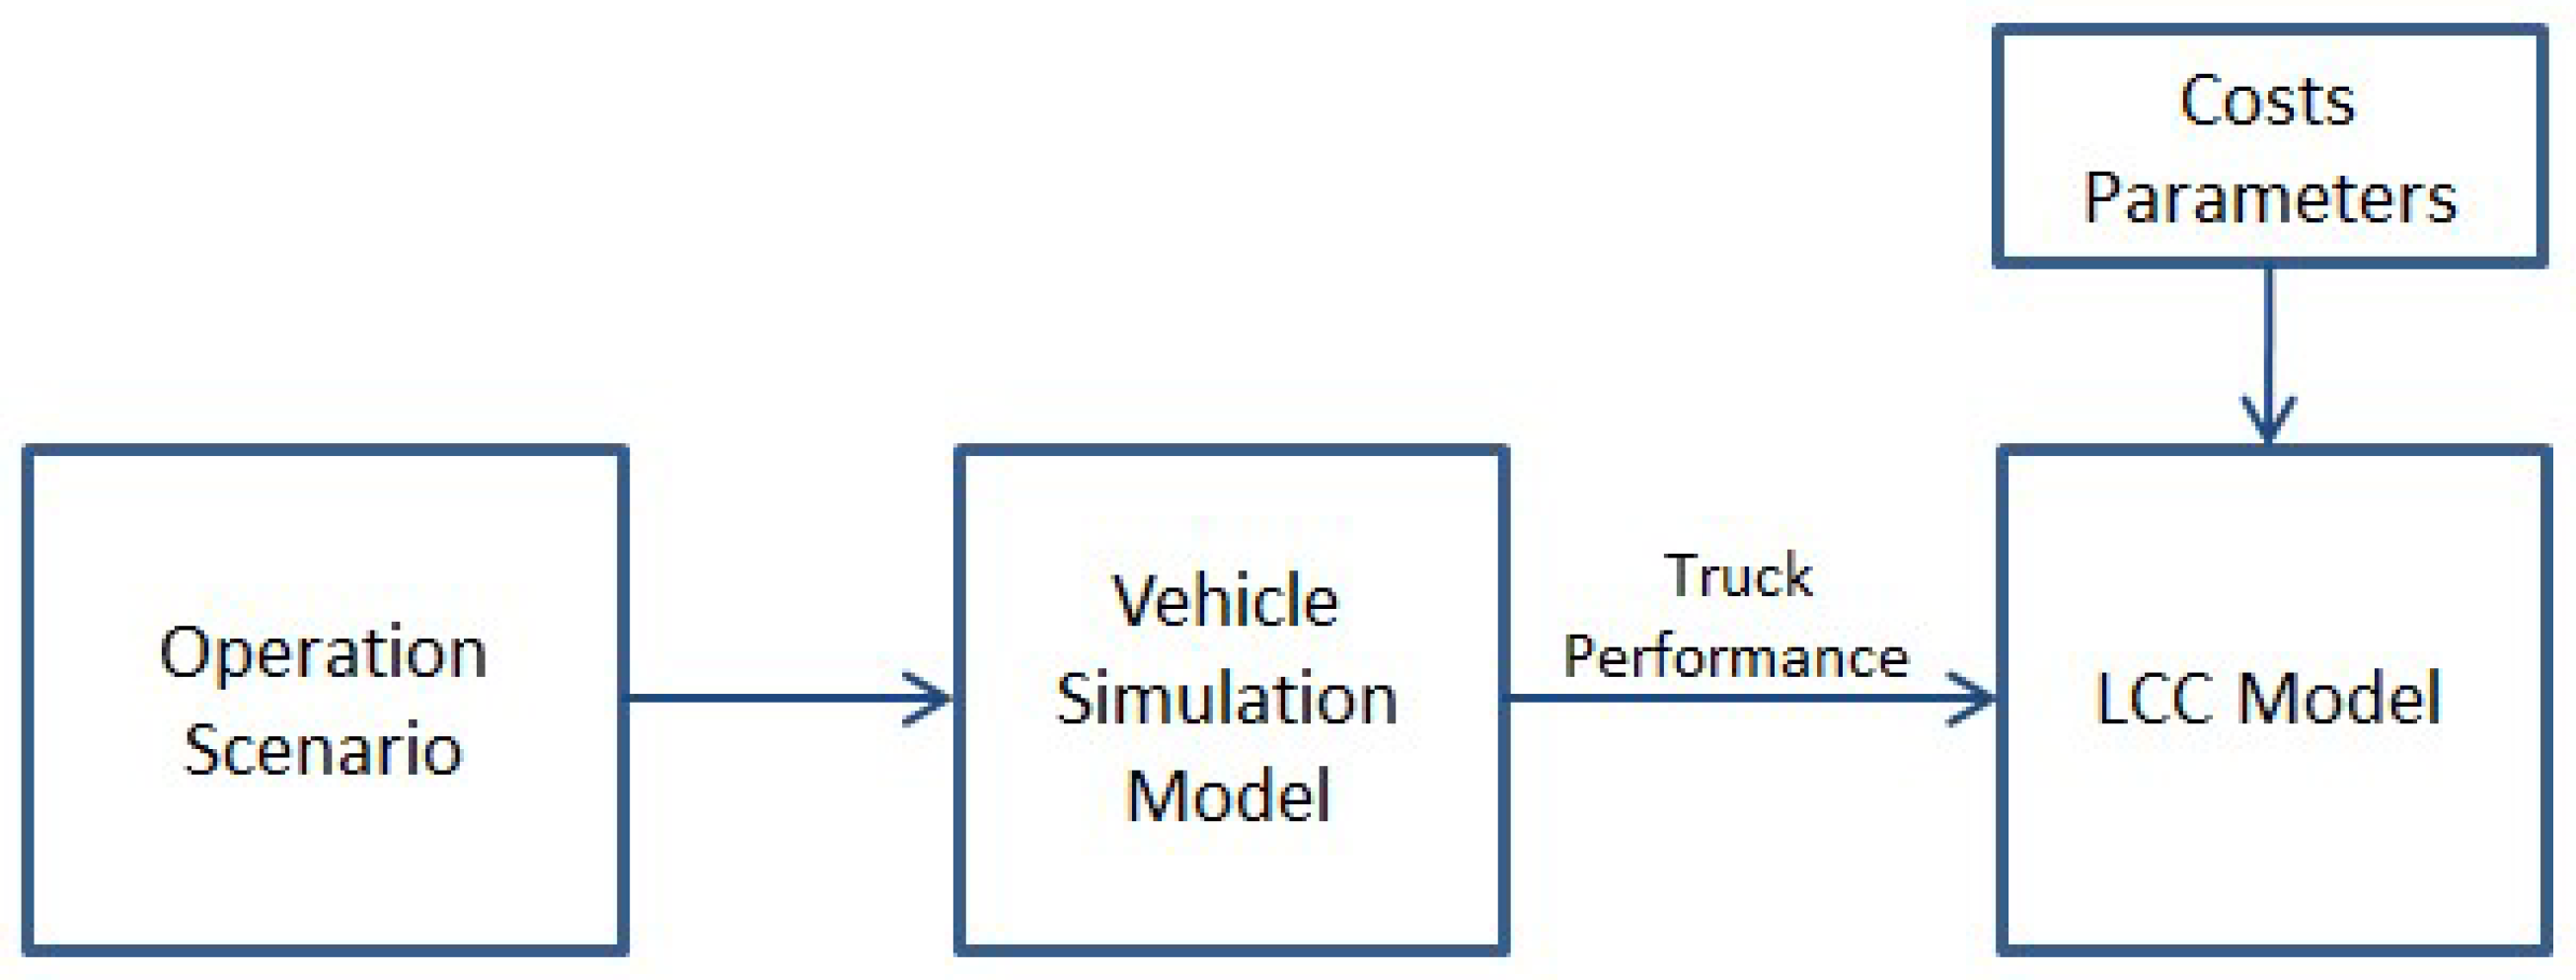
In order to investigate the energy consumption and life cycle costs of the overhead catenary trucks, a holistic model was created that contains a vehicle simulation model and a life cycle costs (LCC) model as the main components (Figure 1). The vehicle simulation model gets an operation scenario as input that consists of driving route and truck parameters. The driving route was specified considering typical driving routes for long-haul trucks in Germany and the legislative regulations for driving time (Section 3.4). The truck parameters apply to an average European Union heavy-duty truck with a total weight of up to 40 tons (Section 2.2.3).
The vehicle simulation model is first used to assess the energy consumption of the overhead catenary truck on the main German highways and to dimension the traction battery inside the vehicle and the catenary power system along the highways (Section 3.1 and Section 3.2). Afterwards, the vehicle simulation model is used to calculate the truck performance for the specified operation scenarios. In addition to the energy consumption, the truck performance data contains resulting speed profiles and power breakdown for the specific truck components as well as the expected lifetime for the traction battery.
The truck performance data and the cost parameters are fed as inputs into the LCC model that calculates the life cycle costs for the overhead catenary truck in the specified operation scenario. Section 2.3 describes the LCC model and parameterization in details. The results are compared to those of diesel trucks and battery electric trucks with parameters according to the Appendix A and the methodology of the previous study [4].

2.2. Modeling of Overhead Catenary Truck

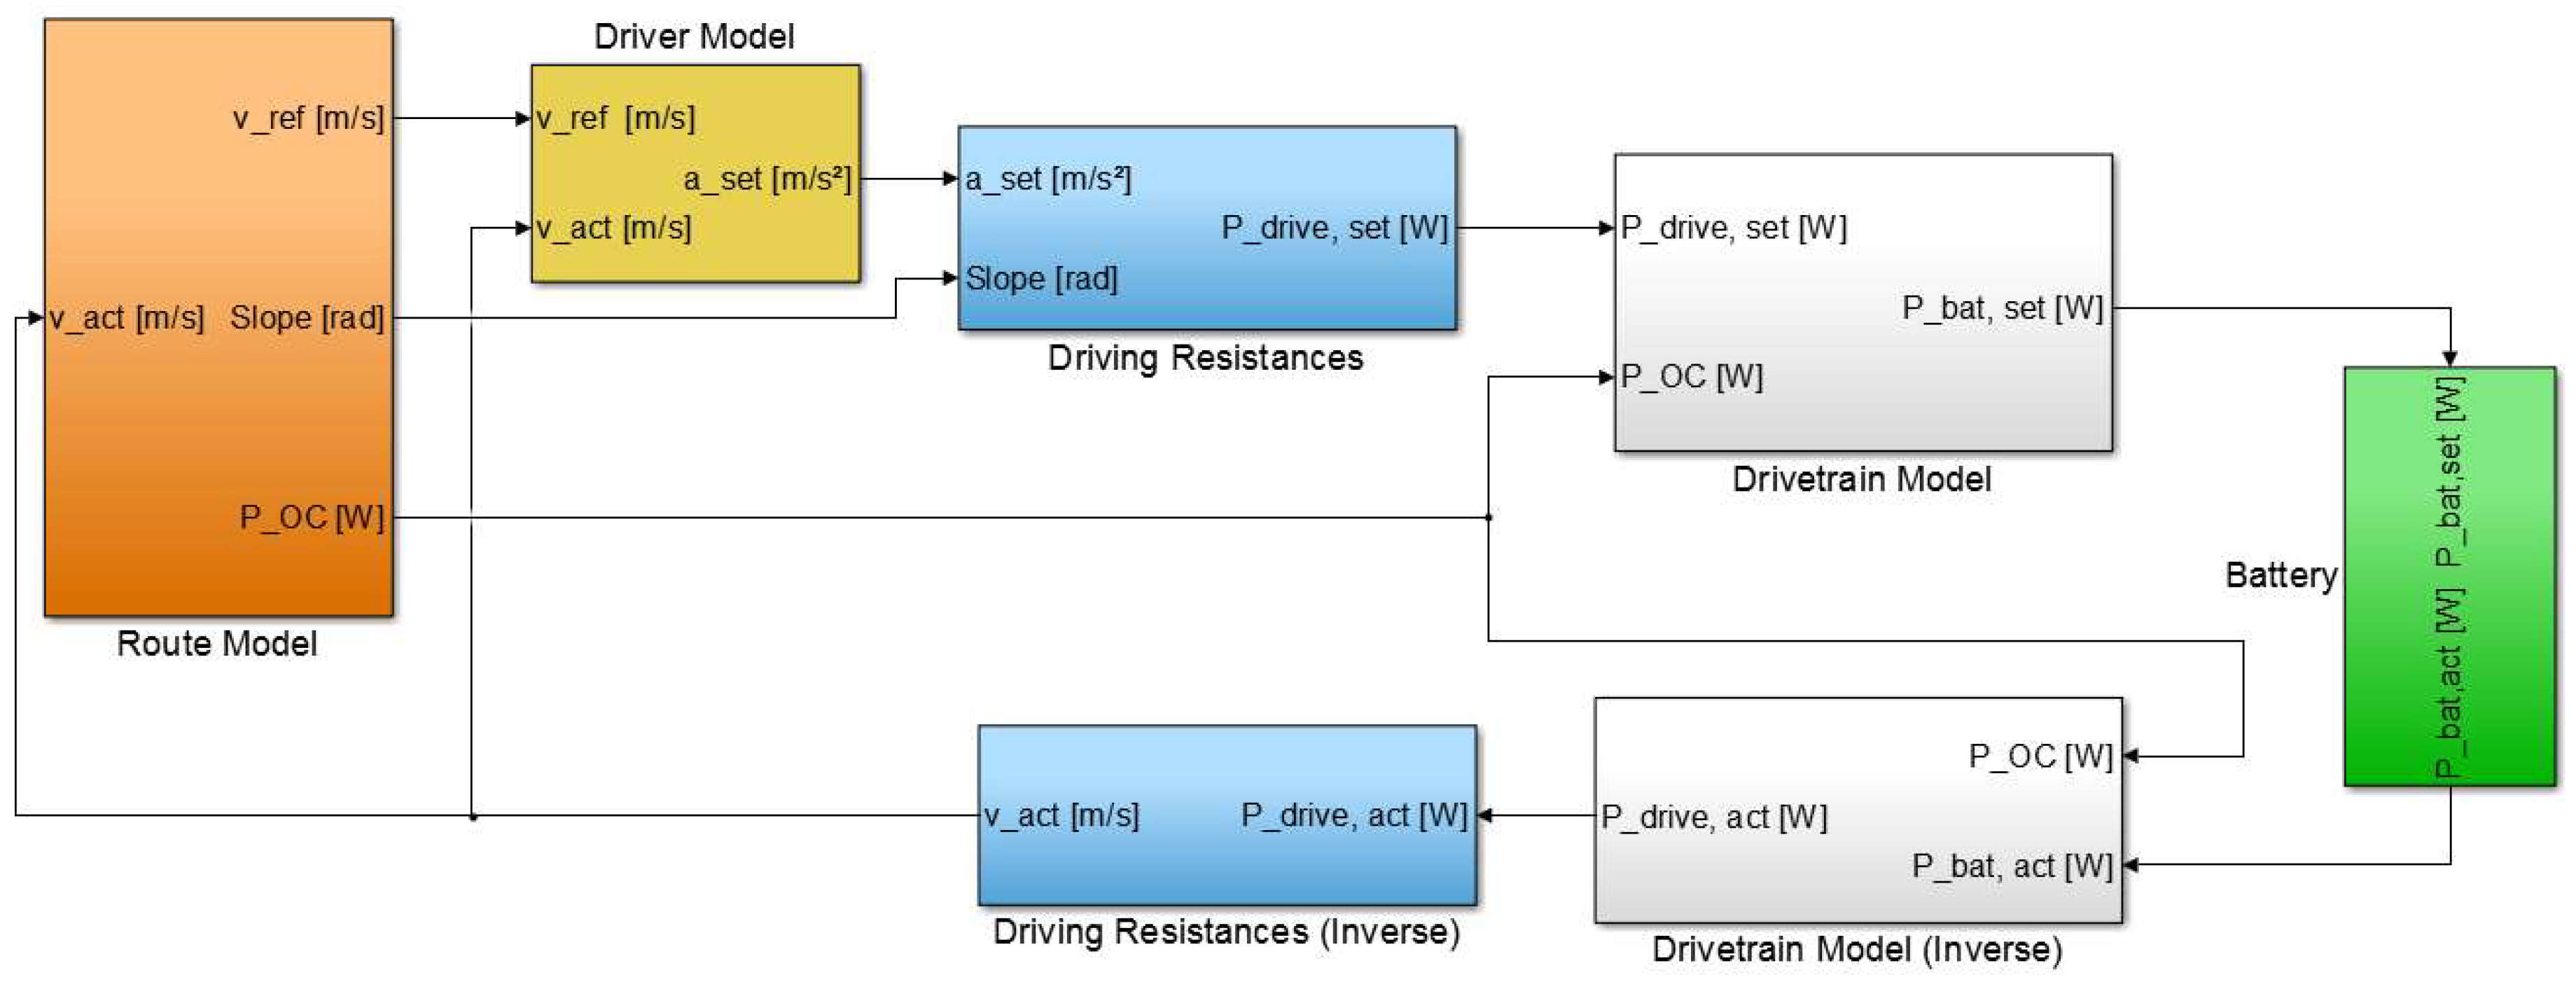
As mentioned in the previous chapter, the vehicle simulation model is used to simulate an overhead catenary truck on the specified driving profile and to obtain the truck performance data as input for the LCC model. The vehicle simulation model itself is implemented in Matlab/Simulink R2015b and its schematic structure is shown in Figure 2. It consists of route model, driver model, driving resistances model, drivetrain model, and battery model. These are described in the following subchapters.

2.2.1. Route Model

The route model processes the route data such as GPS coordinates, elevation data, maximum driving speed, catenary position, and available overhead catenary power POC. The actual position is calculated by integrating the actual speed vact over simulation time and the signal’s reference speed vref, slope, and maximum available catenary power POC are provided to the following blocks.

2.2.2. Driver Model

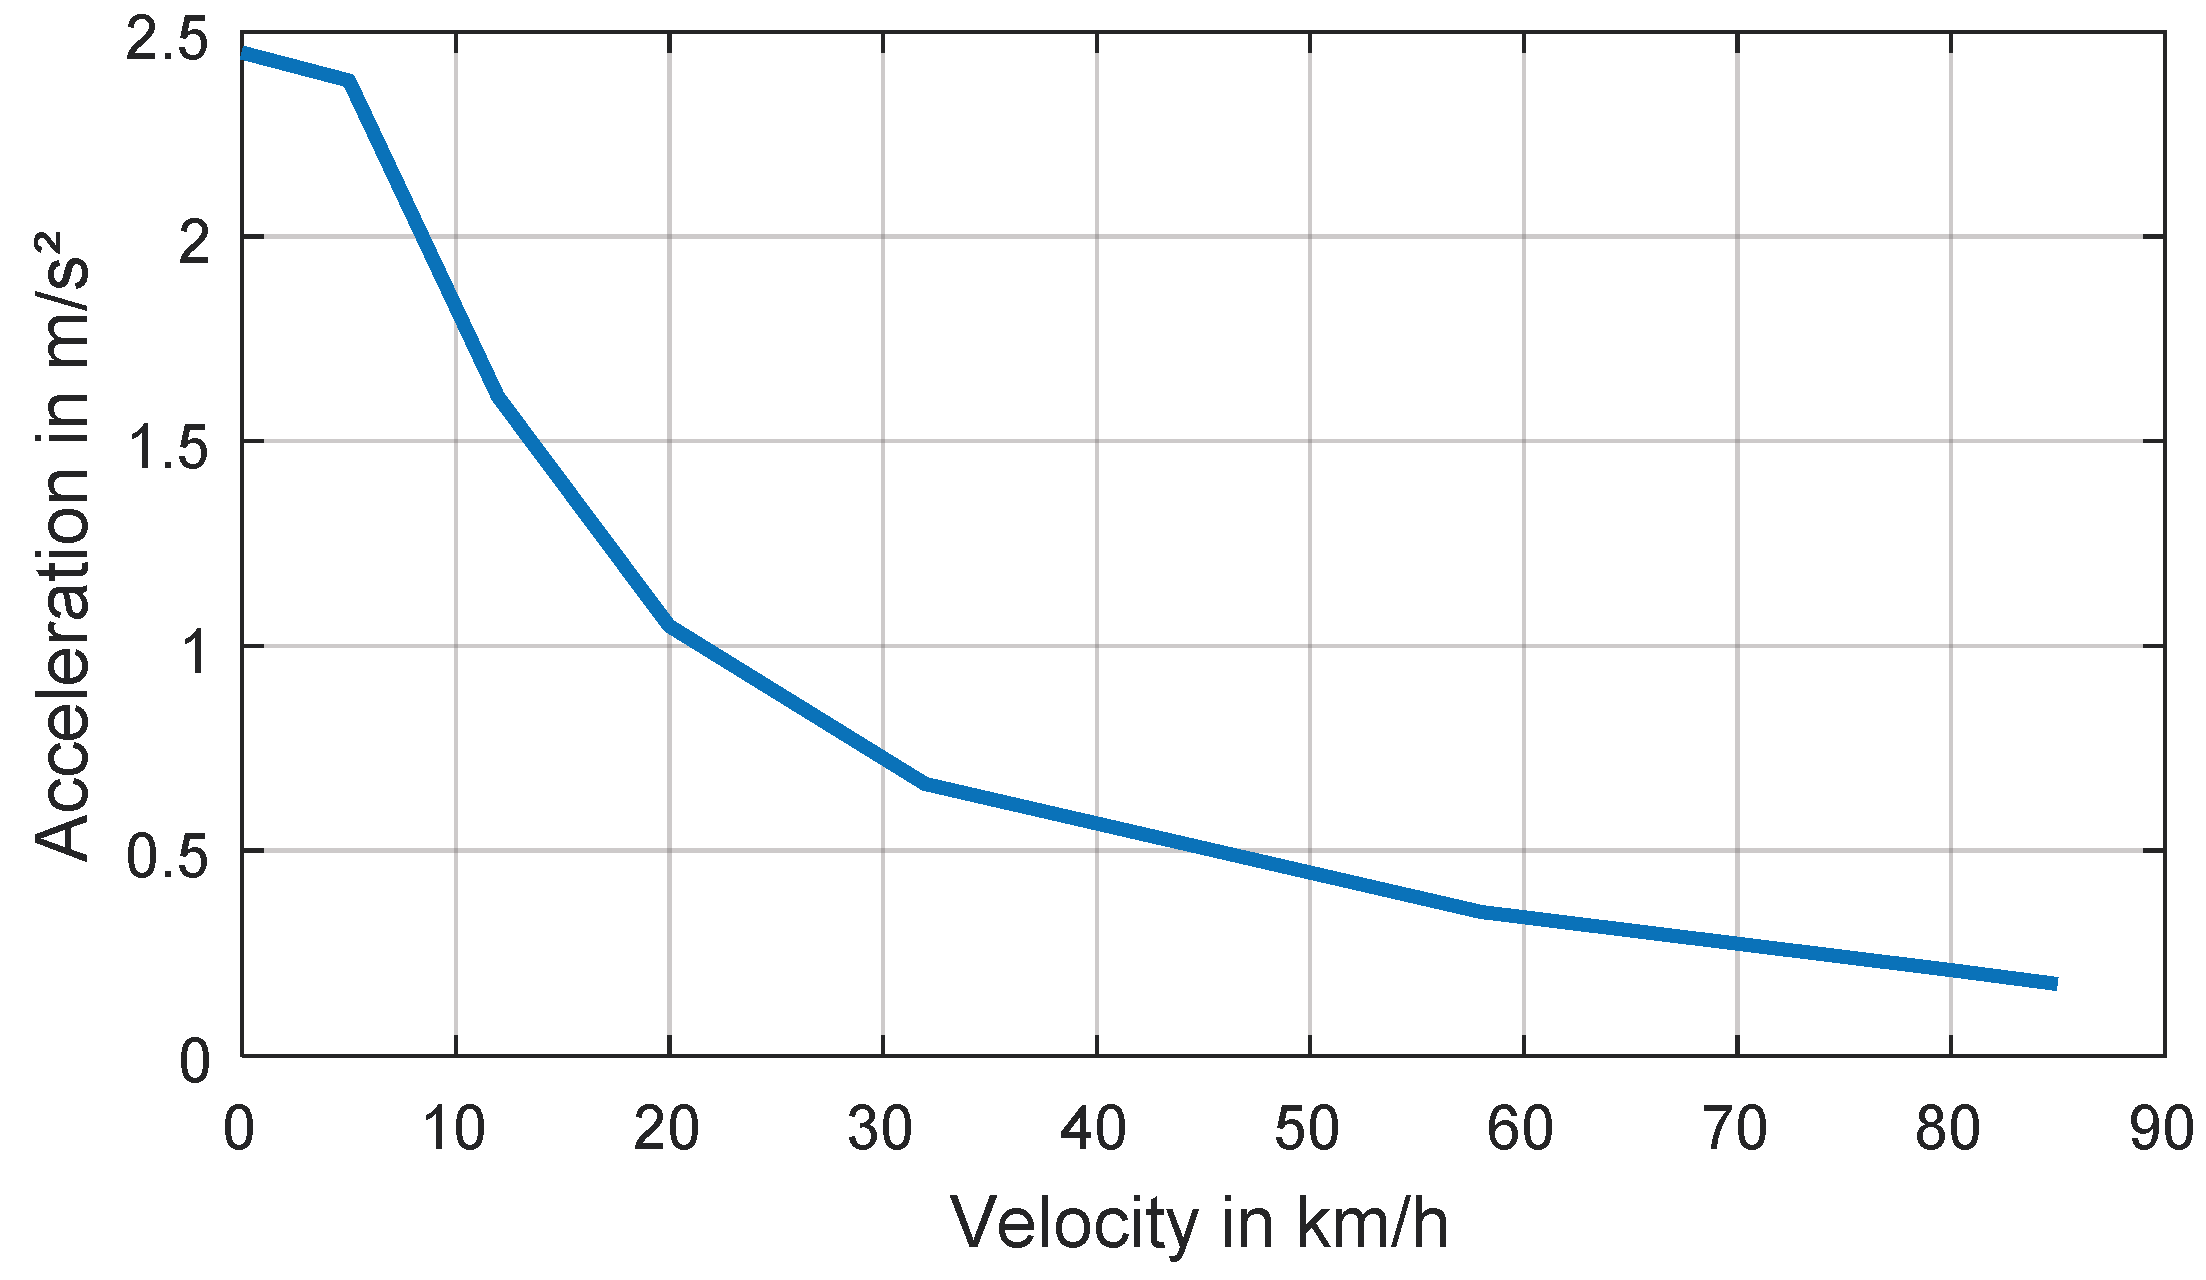
The driver model provides the set acceleration aset to meet the reference speed by accelerating or decelerating the vehicle. The set acceleration is shown in Figure 3. The value of the set acceleration varies depending on the actual velocity and corresponds to the acceleration of a 40 t diesel truck [10] multiplied by a factor 0.7, as it is assumed that the vehicle does not accelerate at full power at standard driving situation. The deceleration is assumed to be constant at 0.9 m/s2. Both the acceleration and the deceleration values were chosen to fit the typical acceleration and deceleration times of heavy-duty trucks on highways that can be observed.

2.2.3. Driving Resistances Model

The driving resistances model gets the set acceleration aset, the slope, and the actual velocity vact and calculates the set drivetrain power Pdrive,set to overcome the actual driving resistance. The actual driving resistance is the sum of air resistance, rolling resistance, slope resistance, and acceleration resistance. The driving resistances model is described in detail in the previous study [4].
The driving resistances model was parameterized for a heavy-duty semi-trailer truck with a gross vehicle weight of up to 40 t. The air drag coefficient and the rolling drag coefficient were set to 0.63 resp. 0.007 that corresponds to the average values in the range given in [11,12] for European semi-trailer truck.

2.2.4. Drivetrain Model

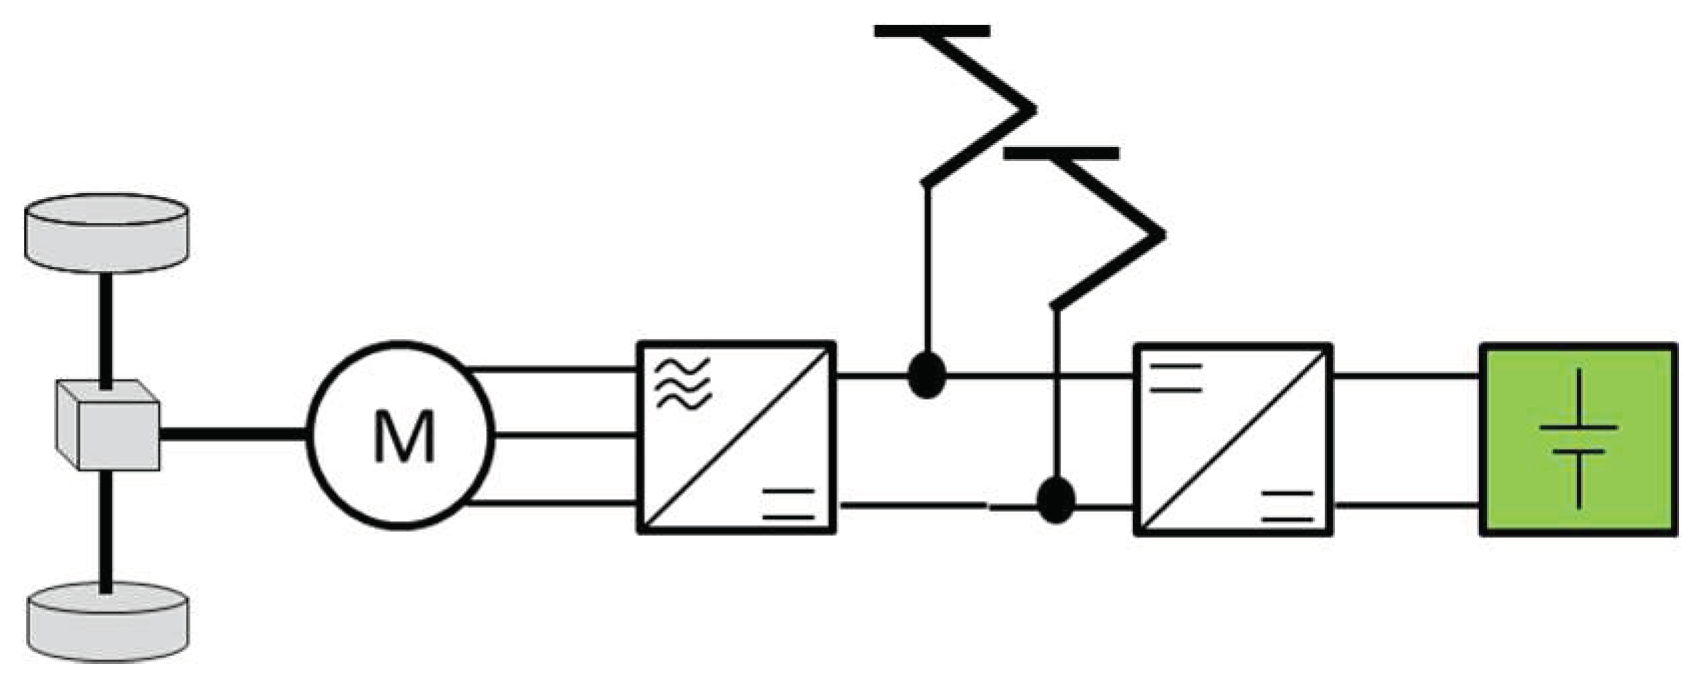
The drivetrain model simulates the drivetrain topology of an overhead catenary truck shown in Figure 4. It includes electric converters for the traction motor and the battery, pantographs, and an electric motor connected to the drive shaft via a gearbox. The pantographs are connected to the vehicle’s direct current link without a dedicated converter as the voltage in the catenary power systems is controlled to hold a constant value. The battery is connected to the direct current link via a converter to account for the variable battery voltage.
Considering the overhead catenary power POC, the battery power Pbat, the power Pdrive to overcome the driving resistances and the power Paux for auxiliary consumers, the following power balance at the direct current link results:
η pan P OC + η BC P bat = 1 / η gearbox 1 / η mot & conv P drive + P aux ,
where ηpan is the pantograph efficiency, ηBC is the efficiency of the battery converter, ηgearbox is the gearbox efficiency, and ηmot&conv is the efficiency of the electric motor and its converter. The pantograph efficiency ηpan is set to 0.99 according to the measurement results of a prototype overhead catenary truck in the project ENUBA 2 [8]. The efficiency ηBC of the battery converter is assumed in this study to 0.95. According to the gearbox efficiencies for heavy-duty trucks given in [13], the gearbox efficiency ηgearbox is assumed as 0.94. The electric machine and the traction converter were implemented as an efficiency map [14]. Their efficiency ηmot&conv depends on the shaft speed and torque. As the implemented three-phase permanent magnet electric motor has a nominal power of 188 kW, two these motors were implemented, providing a total power of 376 kW that is suitable for a heavy-duty truck. The auxiliary power Paux is assumed constant as 5 kW.
For providing the requested power to the electric motor and auxiliary from the traction battery or the catenary, an energy management system was implemented. In case the catenary is not available, the requested power is completely provided by the traction battery. In case the catenary is available, the requested power is provided by the catenary. The excess catenary power is used to charge the battery. If the catenary power is not sufficient to cover the requested power by the electric motor and the auxiliaries, the battery power is used.
During braking, the regenerated power from the electric motor is provided to auxiliaries and to the traction battery. If the battery is completely charged, the regenerated power is provided to the catenary grid. As the catenary power systems are designated for highway sections with high truck numbers, it is assumed in this study that the catenary grid is always able to receive power from regenerative braking and to provide it to other electric trucks.
First, the drivetrain model calculates the set battery power Pbat,set using Equation (1), the set drivetrain power Pdrive,set to overcome the actual driving resistance, and the overhead catenary power POC. Afterwards, the battery power Pbat,act is simulated by a separate block that is described in the next subsection. Finally, the inverse drivetrain model calculates the actual available drivetrain power Pdrive,act to overcome the driving resistances.

2.2.5. Battery Model

The battery model uses a holistic battery cell model described in [13] which consists of the impedance-based electric model, thermal model, and aging model. The impedance-based model calculates the cell voltage depending on the current, state of charge, and temperature. The results of the impedance model are passed to the thermal model that calculates the cell temperature due to ohmic losses inside the cell. Afterwards, the cell aging model calculates the cyclic aging and the calendar aging that are added to get the total cell aging.
In this study, the parameterizations for two cell types with data according to Table 1 [14,15] are used. Though the considered cells have the same chemistry, their application fields, capacities, current rates, and cyclic lifetimes are different. The first cell is designed as a cell with high energy density used in automotive applications like fully electric cars [14]. In contrast to the first cell, the second cell is designed as a high-power cell that can accept high charging and discharging currents but has a smaller energy density. In automotive applications, this cell is typically used in hybrid cars [15].
The current rate is useful to understand the magnitude of a current value compared to the cell capacity. It is calculated as the current divided by the cell capacity. High power cells usually have higher values of maximum charging and discharging current rates as it is the case for the cells in Table 1. Using the mathematical cell aging model [15], the maximum number of full cycles was calculated at the current rate of 1 C and the ambient temperature of 15 °C. The cell’s end of life is reached at 20% capacity loss or at doubled internal resistance. The battery pack costs given in Table 1 are assumed for battery packs using cells and considering the full cycles number of the cell and actual battery prices [16].
After running the vehicle simulation model including the battery model for a specified operation period, the cell data is passed to the cell aging model [13]. The cell aging model calculates the actual residual capacity and the actual internal resistance of the cell after operation in the simulated scenario period. After the aging calculation, the actual capacity and internal resistance are passed back to the vehicle simulation model to calculate the truck performance for the next operation period. The end of life of a battery cell is usually defined by reaching 80% of the initial capacity or by doubling the initial internal resistance of the cell. After reaching one of these conditions, LCC calculation is executed.
2.3. Modeling of Life Cycle Costs

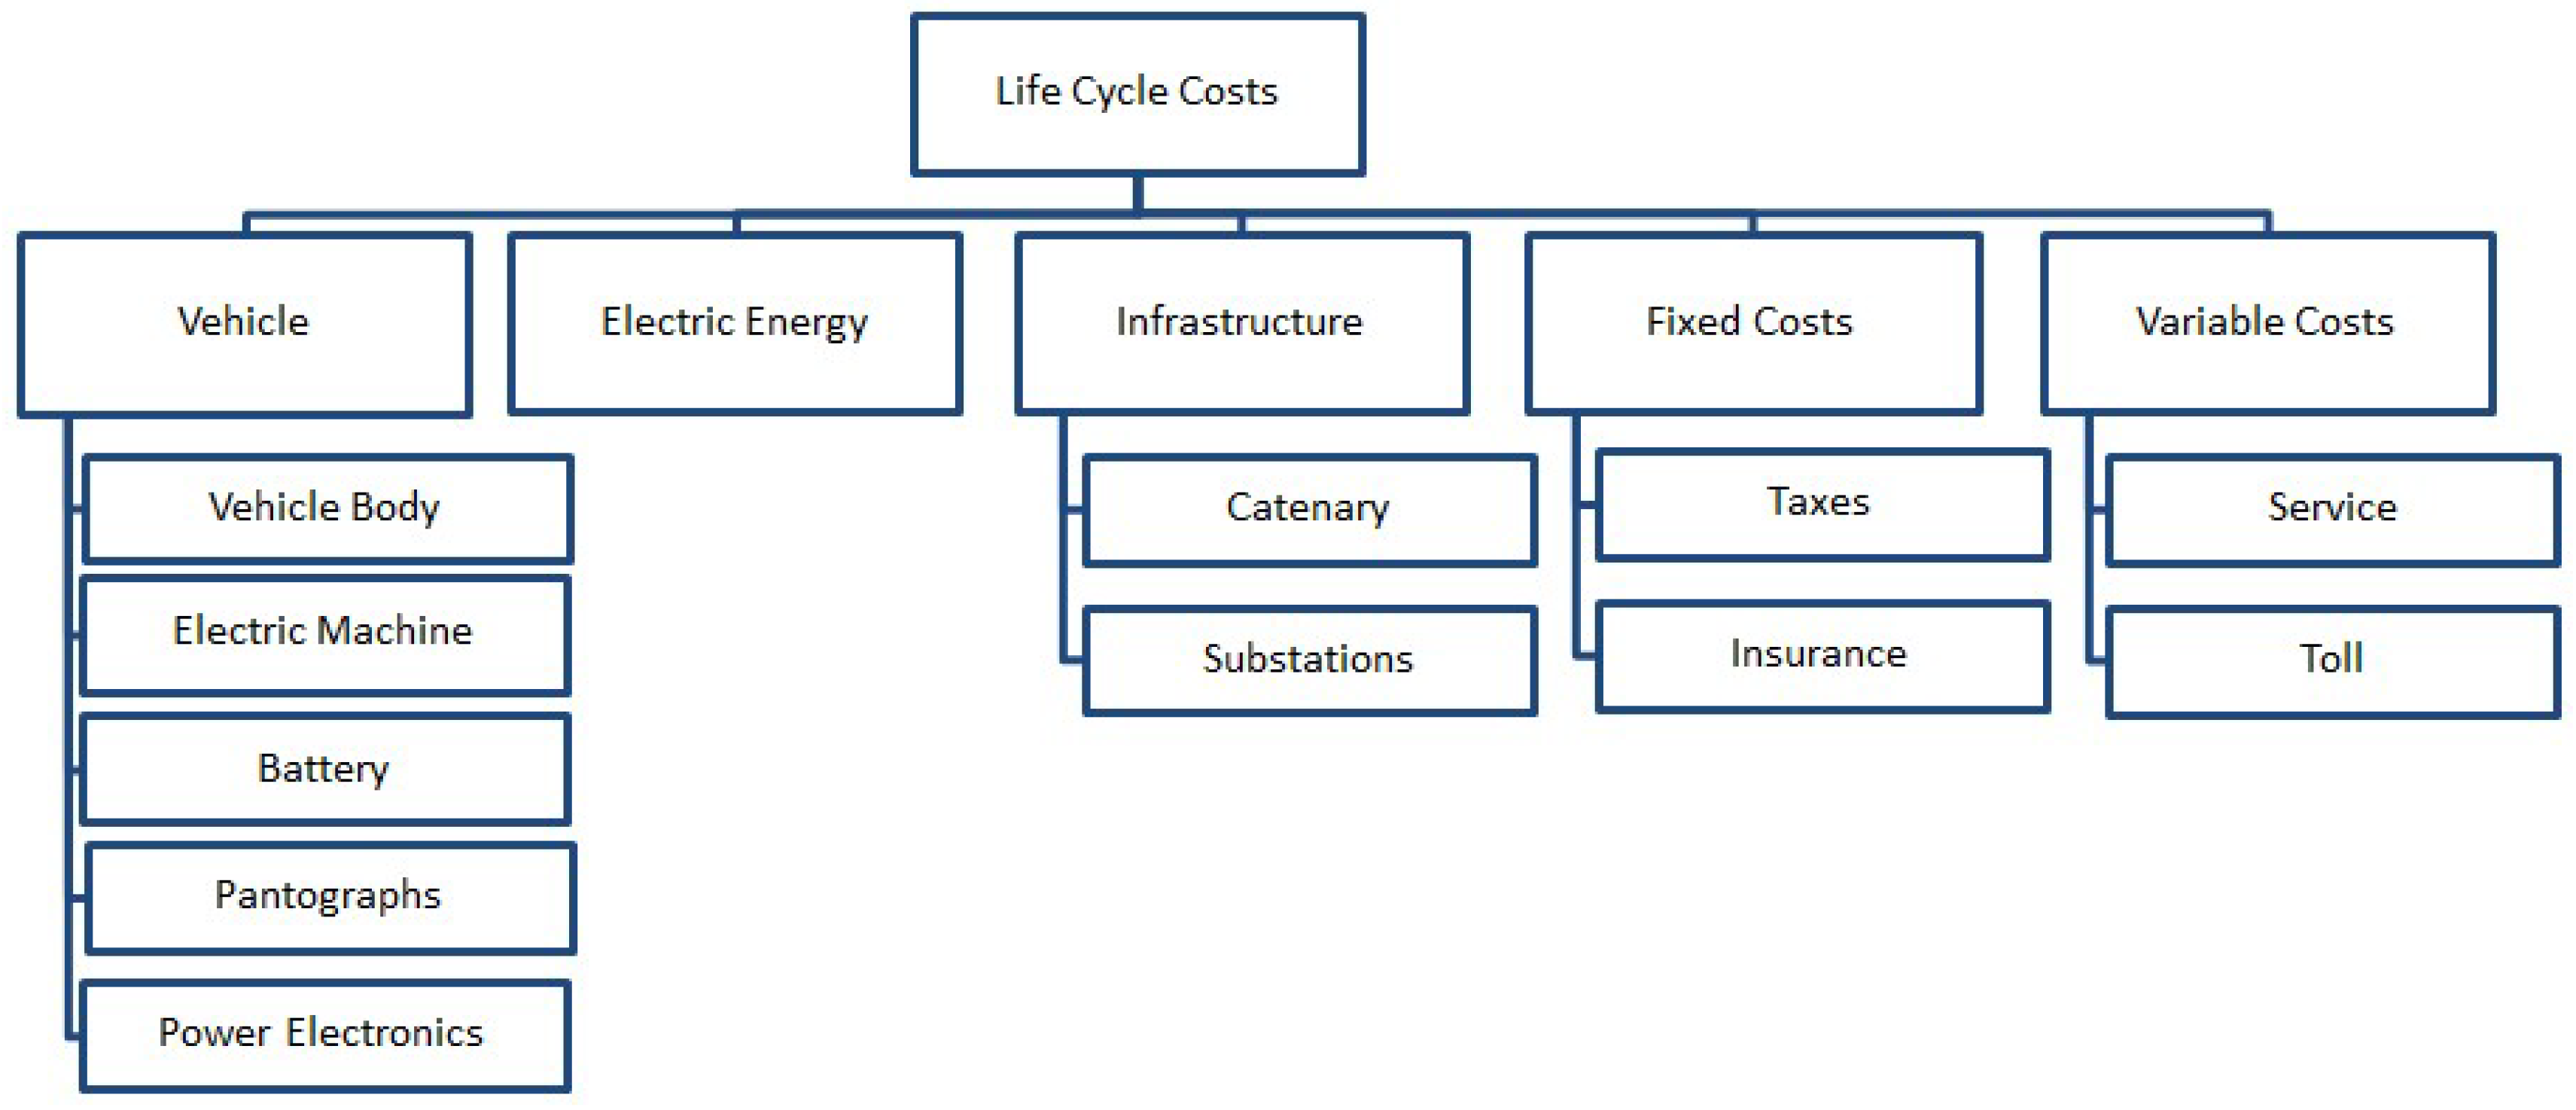
As shown in Figure 1, the LCC model gets truck performance data and costs parameters as inputs. Figure 5 gives an overview of cost components considered in the LCC calculation. Initially, the costs for the vehicle are paid, which consist of vehicle body, electric machine, battery, and electrical equipment, such as power electronics and pantographs. The electric energy consumption is calculated by the vehicle simulation model and scaled for the scenario duration. For overhead catenary trucks, the infrastructure is considered in terms of overhead catenaries and substations along the specified highway sections (Section 3.2). The fixed costs are independent of the driven mileage and consist of annual taxes and insurance fees. The variable costs are dependent on the mileage and consist of service fees and toll.
Appendix A shows the main parameters for calculation of life cycle costs. The vehicle costs of the overhead catenary truck and of the battery electric truck are depicted as the conventional vehicle body without drivetrain and the particular drivetrain components. The costs of the conventional diesel truck are stated for the complete vehicle including the drivetrain. The assumed electricity price applies for industrial consumers with large yearly electricity consumption over 160 MWh which is very likely due to high energy consumption of long-haul heavy-duty trucks (see Section 4.1).
The infrastructure costs for catenary power systems account for substations, catenary including pylons, and grid connections. The substation costs consist of components costs for the rectifier and transformer as well as finishing costs for construction works. The specific rectifier costs are assumed to approximately a half of the power electronics costs of the charging stations for the battery electric trucks. The finishing costs and the grid connection costs are assumed equal to that of a charging station. For the variable part of the grid connection costs, a distance of 2.5 km to the next grid connection point is assumed [6]. The assumed costs for catenaries and pylons account for one driving direction and imply a distance of 65 m between two adjacent pylons according to [17].
The infrastructure costs for the charging stations are stated for the fast and slow charging stations dimensioned in a previous study [4] to 880 kW and 50 kW charging power, respectively. The grid connection costs refer to an average charging place with 6 fast charging stations and 28 slow charging stations. The fast chargers are used to charge the trucks during the short rest period for drivers and the slow charging stations are used during the night rest period [4]. As no fast charging stations with the required power of 880 kW for heavy-duty trucks and catenary infrastructure exist, there is an uncertainty concerning the costs for these infrastructures. The assumed cost parameters are mainly based on communication with manufacturers of charging equipment with charging powers of up to 500 kW for public electric busses.
The diesel truck taxes are stated for a diesel truck with an actual emission standard and a total weight of up to 40 t. Electric trucks are currently excluded from truck taxes. The insurance costs for the electric trucks are assumed to be equal to those of conventional trucks. The service costs for electric trucks are assumed to be lower than for conventional trucks because electric vehicles tend to lower service intensity due to, e.g., having fewer mechanical parts and absence of motor oil.
The LCC model calculates the net preset values for the cost components shown in Figure 5. The different lifetime of truck components and infrastructure is addressed by the calculation of residual values using linear progression. The mathematic description is stated in a previous study [4]. The assumed inflation rate for the calculation is 1.39%/a and the assumed interest rate is 2.2%/a.

3. Calculation

3.1. Dimensioning of Traction Battery

The traction battery of an overhead catenary truck must provide sufficient capacity and power to drive route sections without catenary and a sufficient charging power to charge the battery from catenary sections. This means that the dimensioning of the traction battery and the catenary power system are interdependent. To investigate the impact of different catenary power systems, this study considers two different configurations of the catenary power system shown in Table 2. Continuous catenary means that the catenary power system is installed along all German highways with a total length of about 13,000 km. In this case, the battery capacity is defined by the length of the route sections that a truck has to drive on the secondary roads without catenary apart the highways. For a long-haul truck, these usually are route sections between the highway and an industrial zone with, for example, a distribution center. According to the database of industry and commercial zones [18], about 80% of the registered zones are placed within a 20 km distance from the next highway. Assuming that an overhead catenary truck is only charged via catenary (not using additional charging stations), the traction battery has to cover a distance of 40 km from highway with catenary to the industrial zone and back to highway.
In the previous study [4], the average energy consumption of a battery electric truck with average drag coefficients and total weight of 40 t was calculated as 1.83 kWh/km on the main German highways. For this, a trip on complete highways A1 to A9 was simulated in each direction and afterwards an average consumption value was calculated. The energy flow from the battery to the wheels in the battery electric truck is very similar to that in an overhead catenary truck when comparing the topologies of both trucks. The energy flow in the overhead catenary truck additionally passes the battery converter that is not included in the considered topology of the battery electric truck. Considering the assumed efficiency of the battery converter, the average energy consumption of 1.83 kWh/km, and adding a 20% capacity reserve due to battery aging, the required battery capacity results in ca. 96 kWh for a 40 km route section.
As mentioned before, the battery power has to cover the traction and auxiliaries power demand. The battery discharging power Pbat,dch is connected to the battery capacity Cbat via discharge current rate Rdch according to the equation:
P bat ,   dch = C bat R dch .
Using high energy cells HEa with a max. discharge current rate of 2 C (according to Table 1) in a 96-kWh battery, the battery discharging power results in 192 kW which is not sufficient to cover the sum of the electric machine’s and auxiliaries’ power of 381 kW. The required battery capacity to cover this power results in 190.5 kWh according to Equation (2). The required charging power for the continuous catenary configuration can be low because the larger part of the truck’s route takes place on the highway where the battery can be charged from catenary. So, the chosen capacity of the battery with HEa cells is 190.5 kWh, as stated in Table 2.
It is also possible to use HPa high power cells for the continuous catenary configuration. As the charging rate of this cell is higher (Table 1), it is sufficient to use a battery with 96 kWh capacity (Table 2).
The sectional catenary configuration provides route sections with catenary that are each followed by route sections without catenary. In this way, only route sections with higher truck appearance are equipped with catenary and the following section without catenary has to be covered by traction battery. Following the ENUBA 2 project [8], this study assumes that 1 km driving with catenary charges the battery for driving 2 km without catenary. The battery capacity is assumed to be 120 kWh as the traction battery capacity of the truck prototype built up in this project. This capacity is also sufficient to cover an average 40 km route section without catenary between highway and an industrial zone. As well as the continuous catenary, the sectional catenary is assumed to be installed along all German highways but the catenary length in this configuration is only one third of the total highway length.
The battery charging power for the sectional catenary configuration is determined by the required charging power during driving on the catenary section. Considering the average energy consumption of 1.83 kWh/km and assuming an average driving speed of 80 km/h, the average battery power results in ca. 150 kW. So, the traction battery must accept 300 kW charging power. Applying Equation (2) and using the chosen capacity of 120 kWh shows that only the battery with high power HPa cells can accept this charging power. Also, the power requirement for traction and auxiliaries is satisfied due to high discharging rate of this cell. For the battery with high energy HEa cells, the capacity is set higher to satisfy charging and discharging power requirements (Table 2).

3.2. Dimensioning of Catenary Power System

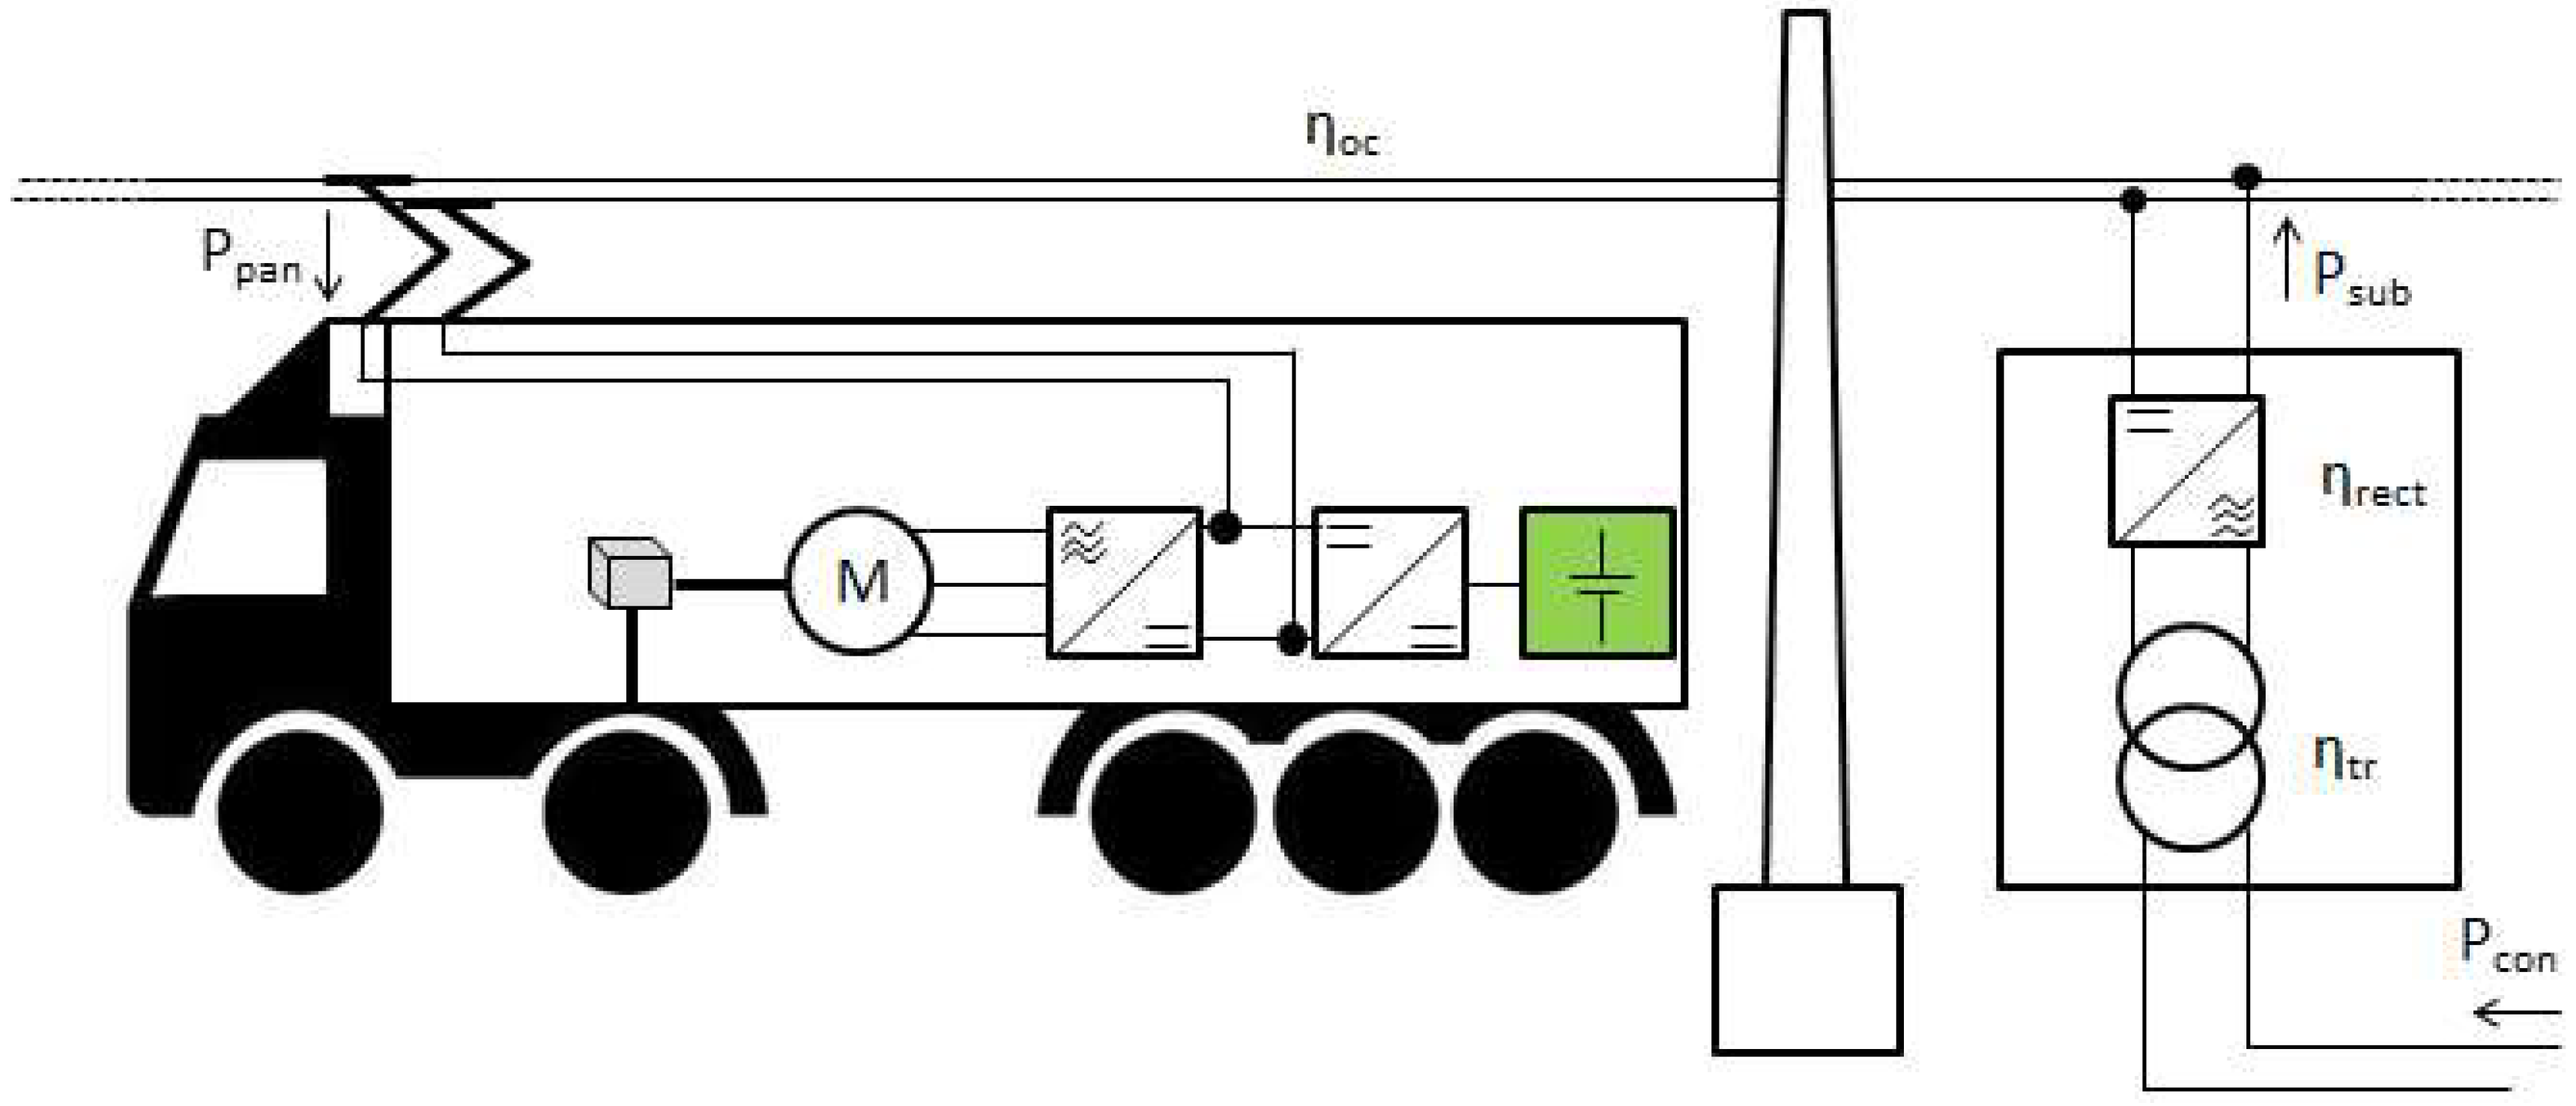
Figure 6 shows the main components of a catenary power system. The truck drivetrain is connected to the catenary via pantograph. The catenary power system consists of overhead catenary wires, pylons, and substations, including a rectifier and transformer that are connected to the electricity grid.
To calculate the required power Ppan provided to the pantograph in order to charge the battery and to cover the traction power, the following equation is used:
P pan = e v ( 1 + 1 η bat ,   cha η pan s bat s oc )
where e is the average consumption of 1.83 kWh/km, v is the average speed of 80 km/h, ηpan is the pantograph efficiency of 0.99, Sbat is the distance driven by battery, and Soc is the distance driven by the overhead catenary. For the battery charging efficiency ηbat,cha the previous simulations showed an efficiency of 0.97. The first summand in this formula gives the average traction power and the second summand gives the required power to charge the battery during driving on a catenary section.
Table 3 gives the required pantograph power Ppan for the considered catenary configurations assuming a daily driving distance of 720 km (Section 3.4). For the continuous catenary configuration, the distance Sbat driven with energy from battery is 40 km for the route sections apart the highway at the beginning and at the end of the daily route. The remaining distance of 680 km is driven with energy from catenary. Also, for the sectional catenary configuration, 40 km driving distance on route sections apart the highway is assumed. So, one third of the remaining 680 km distance is equipped with catenary. The resulting pantograph power for both catenary configurations using Equation (3) are stated in Table 3.
Finally, the substation components have to be dimensioned. This requires the value of traffic intensity ntrucks for trucks on highways and the substations number nsub per 100 km. According to [19], the average daily traffic intensity on a German highway is 8620 trucks per driving direction. Assuming that most trucks drive between 6 a.m. and 10 p.m. and disregarding the night traffic, the average hourly traffic intensity ntrucks results in ca. 540 trucks per driving direction. The substations number nsub is given in [7] as 20 substations per 100 km highway at 1.5 kV catenary voltage with direct current. Using the average hourly traffic intensity ntrucks, the substations number nsub per 100 km and the average speed v of 80 km/h, the trucks number ntrucks,sub fed from one substation on both driving directions can be calculated:
n trucks ,   sub = 2 n trucks v n sub
The resulting trucks number ntrucks,sub is 67.5 trucks that are fed from one substation. Taking the catenary line efficiency ηoc of 0.95, the rectifier efficiency ηrect of 0.98, the transformer efficiency ηtr of 0.97 [8] and the calculated pantograph power Ppan for the considered catenary configurations, the output power Psub and the electricity grid connection power Pcon of one substation can be calculated using the following equations:
P sub = 1 / η oc n trucks ,   sub P pan
P con = 1 / η rect 1 / η tr P sub
The results for the dimensioning of substation components are shown in Table 4. The substation output power Psub is equal to the rectifier output power (comp. Figure 6).

3.3. Calculation of Vehicle Weight

After dimensioning of the traction battery in Section 3.1, the vehicle weight can be calculated. Compared to a battery electric truck, the traction battery in an overhead catenary is expected to have a smaller capacity. This is the case for the configurations of catenary power systems and traction batteries considered in this study (Table 2).
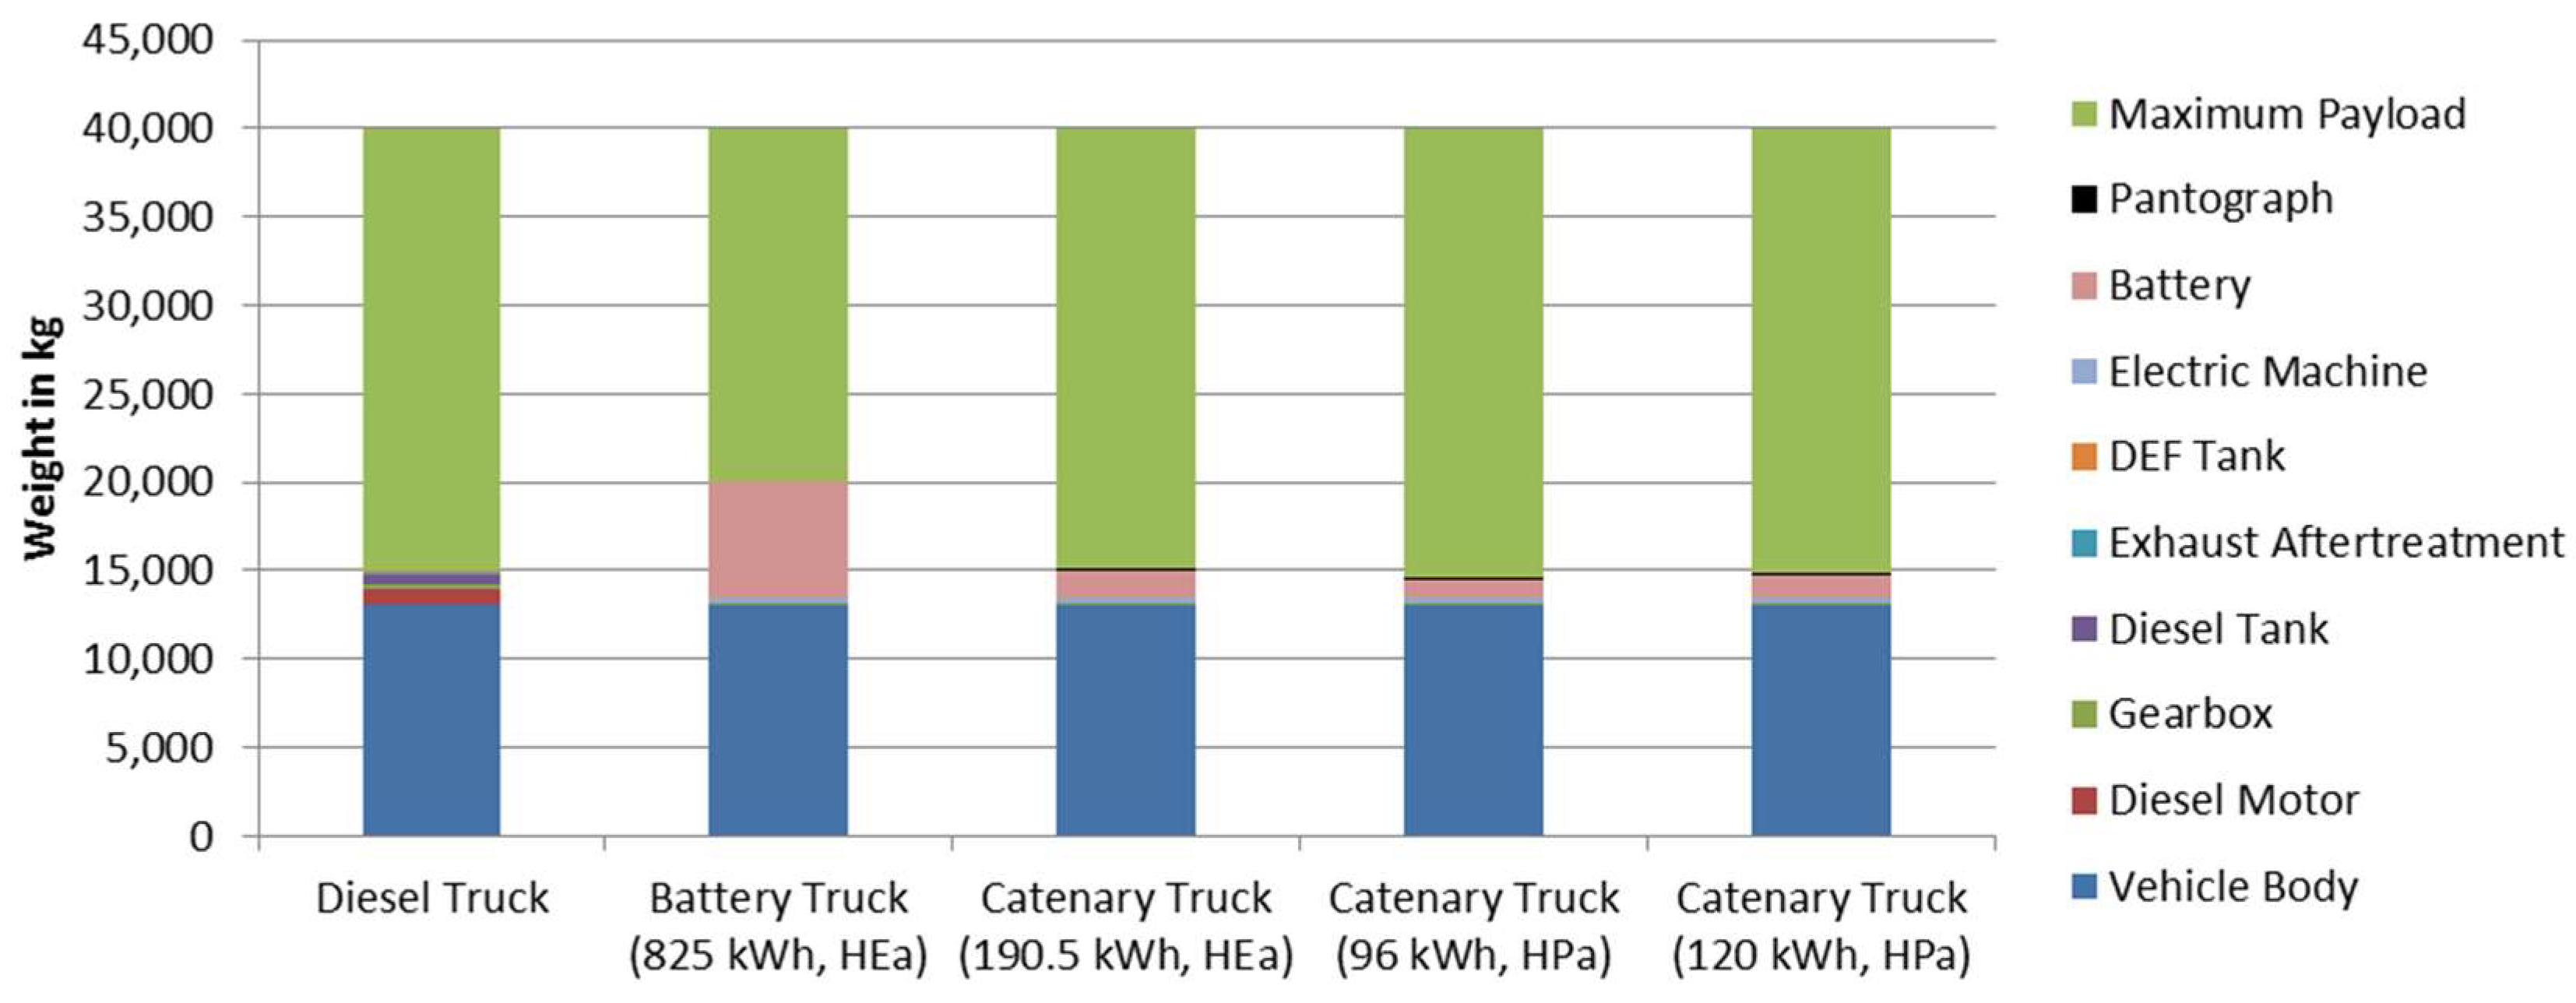
According to the components data sheets [20,21,22], the weight of diesel traction components (diesel engine, fuel tank, exhaust after treatment system, diesel exhaust fluid (DEF) tank) can be assumed as 1700 kg [4]. These diesel traction components become obsolete in an electric truck, releasing this weight for the electric drivetrain. The weights of the traction batteries are calculated assuming a battery energy density of 0.125 kWh/kg for high energy cells HEa and 0.90 kWh/kg for high power cells HPa. The weights of further electric drivetrain components, such as the electric motor, including power electronics [23] and gearbox [24], are considered altogether as 450 kg. Additionally, the pantograph weight is assumed as 100 kg. The gearbox weight is assumed equal for a diesel truck and for a battery truck. Figure 7 shows the results for the considered overhead catenary trucks compared to a diesel truck and a battery electric truck as calculated in the previous study [4].
The weight breakdown in Figure 7 shows that the battery weight in an overhead catenary truck is considerably lower than in a battery electric truck due to lower battery capacity. Thus, the maximum payload of an overhead catenary truck is approximately equal to that of a diesel truck.

3.4. Definition of Transportation Scenario

To calculate the life cycle costs of an overhead catenary truck, a transportation scenario has to be specified. Following the legislative regulations [25], a daily operation sequence of 4.5 h driving, 45 min rest period followed by the next 4.5 h driving period is assumed. This is the maximum daily driving time for a truck driver. The remaining daily time of 14 h 15 min is used for the rest period. Furthermore, the truck is supposed to drive this daily sequence 5 days per week and 52 weeks per year.
For the overhead catenary truck, it is assumed that the energy for driving and charging the battery is provided by the catenary. No additional charging (i.e., charging station at terminal) is assumed.
To compare the results with battery electric trucks and diesel trucks, the daily route with average consumption is selected from the previous study [4]. This route proceeds mainly on highway sections and has a total length of 723 km. The payload is assumed as 18.2 t for all truck technologies that corresponds to nearly 70% of the maximum payload of a conventional diesel truck.

4. Results

4.1. Truck Performance

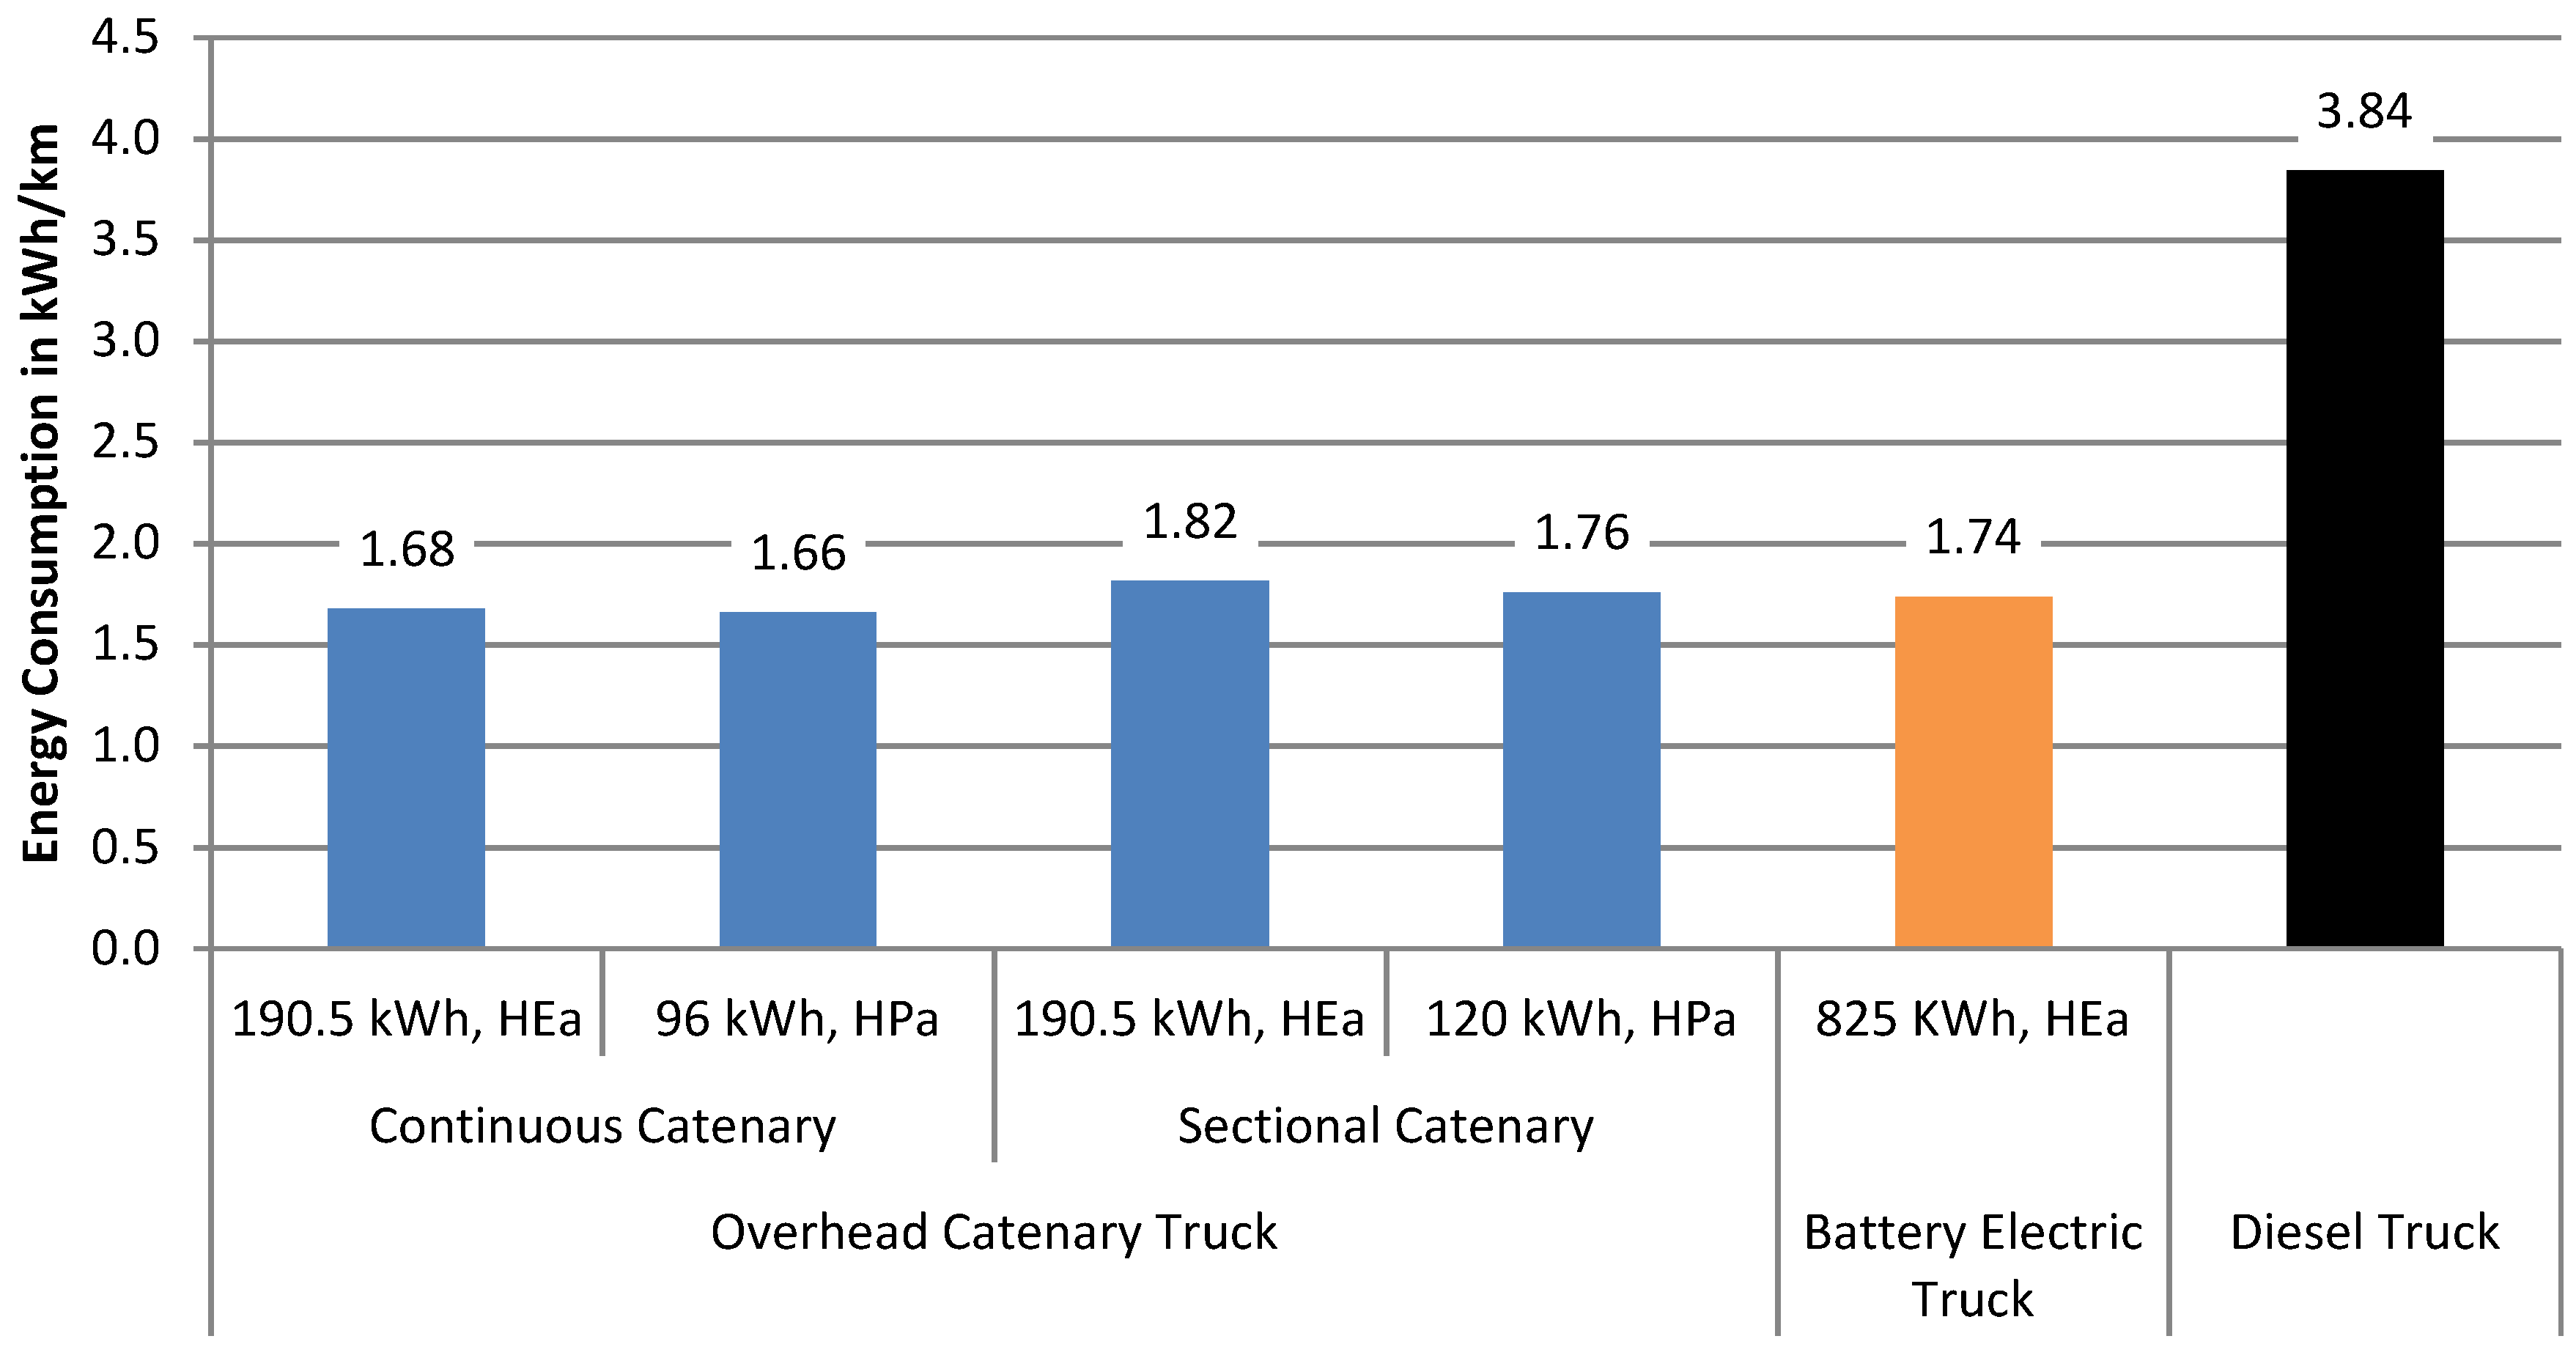
This section shows the truck performance results obtained from the vehicle simulation model for the specified transportation scenario (Section 3.2). Figure 8 shows the energy consumption from pantograph to the wheels of the considered overhead catenary trucks for different catenary and traction battery configurations. Although the values for overhead catenary trucks are very similar, the trucks using sectional catenary consume more energy than trucks using continuous catenary. This can be seen by comparing the trucks with the same 190.5 kWh battery and HEa cells. Using sectional catenaries causes higher energy losses due to charging and discharging the battery (through a battery converter) for longer sections without catenaries (Figure 4). In contrast, using continuous catenary, more energy is directly provided to the traction machine, thus avoiding the battery path.
Comparing the considered traction batteries in terms of energy consumption, the high-power HPa cells are more beneficial than the chosen high energy HEa cells as the traction battery capacity can be smaller. For example, using continuous catenary, the 96-kWh battery with HPa cells provides enough power and capacity, causing a lower vehicle weight and lower energy consumption than the 190.5 kWh battery with HEa cells.
The energy consumption of the battery electric truck from the previous study [4] is similar to that of overhead catenary trucks considered here due to the similarities of the electric drivetrain. However, the energy consumption of the battery electric truck is slightly higher than of the overhead catenary truck using the continuous catenary mainly due to higher vehicle weight of the battery electric truck (Figure 7). However, the energy consumption of the battery electric truck is lower than that of overhead catenary trucks using sectional catenary due to efficiency losses on the energy path from pantograph to the traction battery and to the traction machine.
The equivalent energy consumption of the diesel truck is calculated in the same transportation scenario using the vehicle simulation model for the diesel truck presented in the previous study [4]. The used simulation model for diesel trucks is equal to the vehicle model used for electric trucks (Figure 2), except for the drivetrain block and the battery block. The drivetrain block in this case contains the model for a diesel engine based on look-up table. The battery model is obsolete for diesel trucks. The diesel truck was parameterized with the same average drag coefficients and payload as the overhead catenary trucks. The assumed diesel energy density is 9.8 kWh/L. The diesel truck shows the highest energy consumption due to the low efficiency of the diesel drivetrain with an internal combustion engine compared to an electric drivetrain.
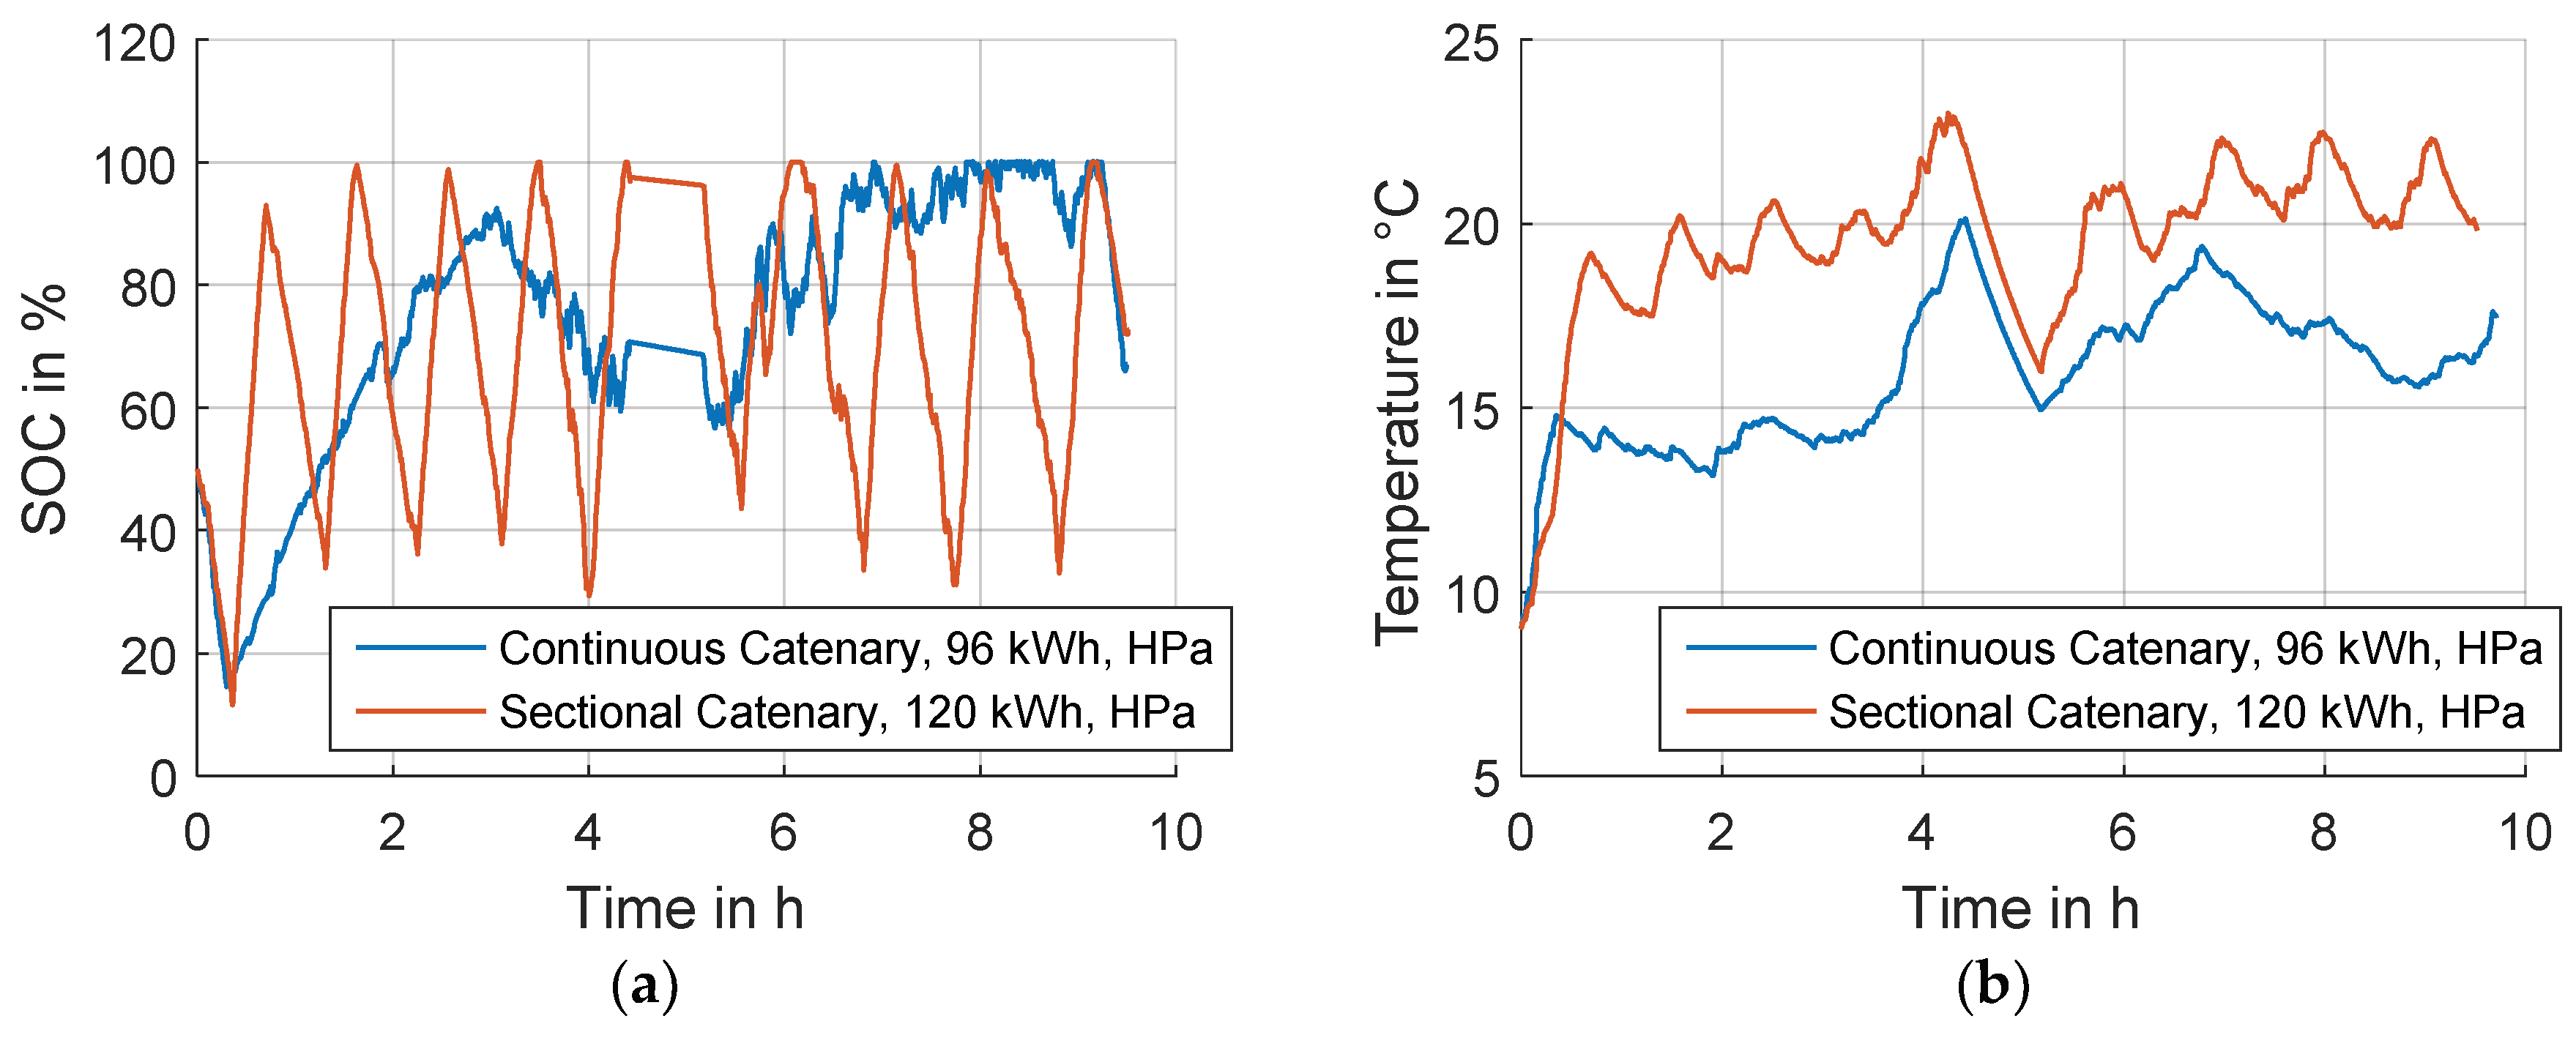
Figure 9 shows the batteries’ state of charge (SOC) and temperature during driving on the daily route. For the overhead catenary truck using continuous catenary, the battery is discharged during route sections without catenary apart highways at the beginning and at the end of the route. During driving on highway, the battery is slowly charged with excess energy from the catenary. So, the SOC curve shows many microcycles due to route topography and regenerative braking. For the truck using sectional catenary, the battery is charged on shorter catenary sections and subsequently discharged on sections without catenary. In this case, the SOC curve shows higher cycles. The faster recharging requires also higher battery cell currents that in turn result in higher cell temperature shown in Figure 9. This results in a lower expected lifetime of the traction battery in the configurations with sectional catenary. So, the expected lifetime of the traction battery is 12 years in scenarios with continuous catenary. In trucks using the sectional catenary configuration, the expected lifetime of the 190.5-kWh battery with HEa cells was calculated as 11 years and the lifetime of the 120-kWh battery with HPa cells as 9.9 years. For the continuous catenary configuration, the used mathematical aging model [13] yields even higher cell lifetimes over 12 years, showing the good cycling stability of the considered cells. In this case, the cell’s lifetime was restricted to 12 years to gain more realistic values corresponding to a calendar lifetime.

4.2. Life Cycle Costs

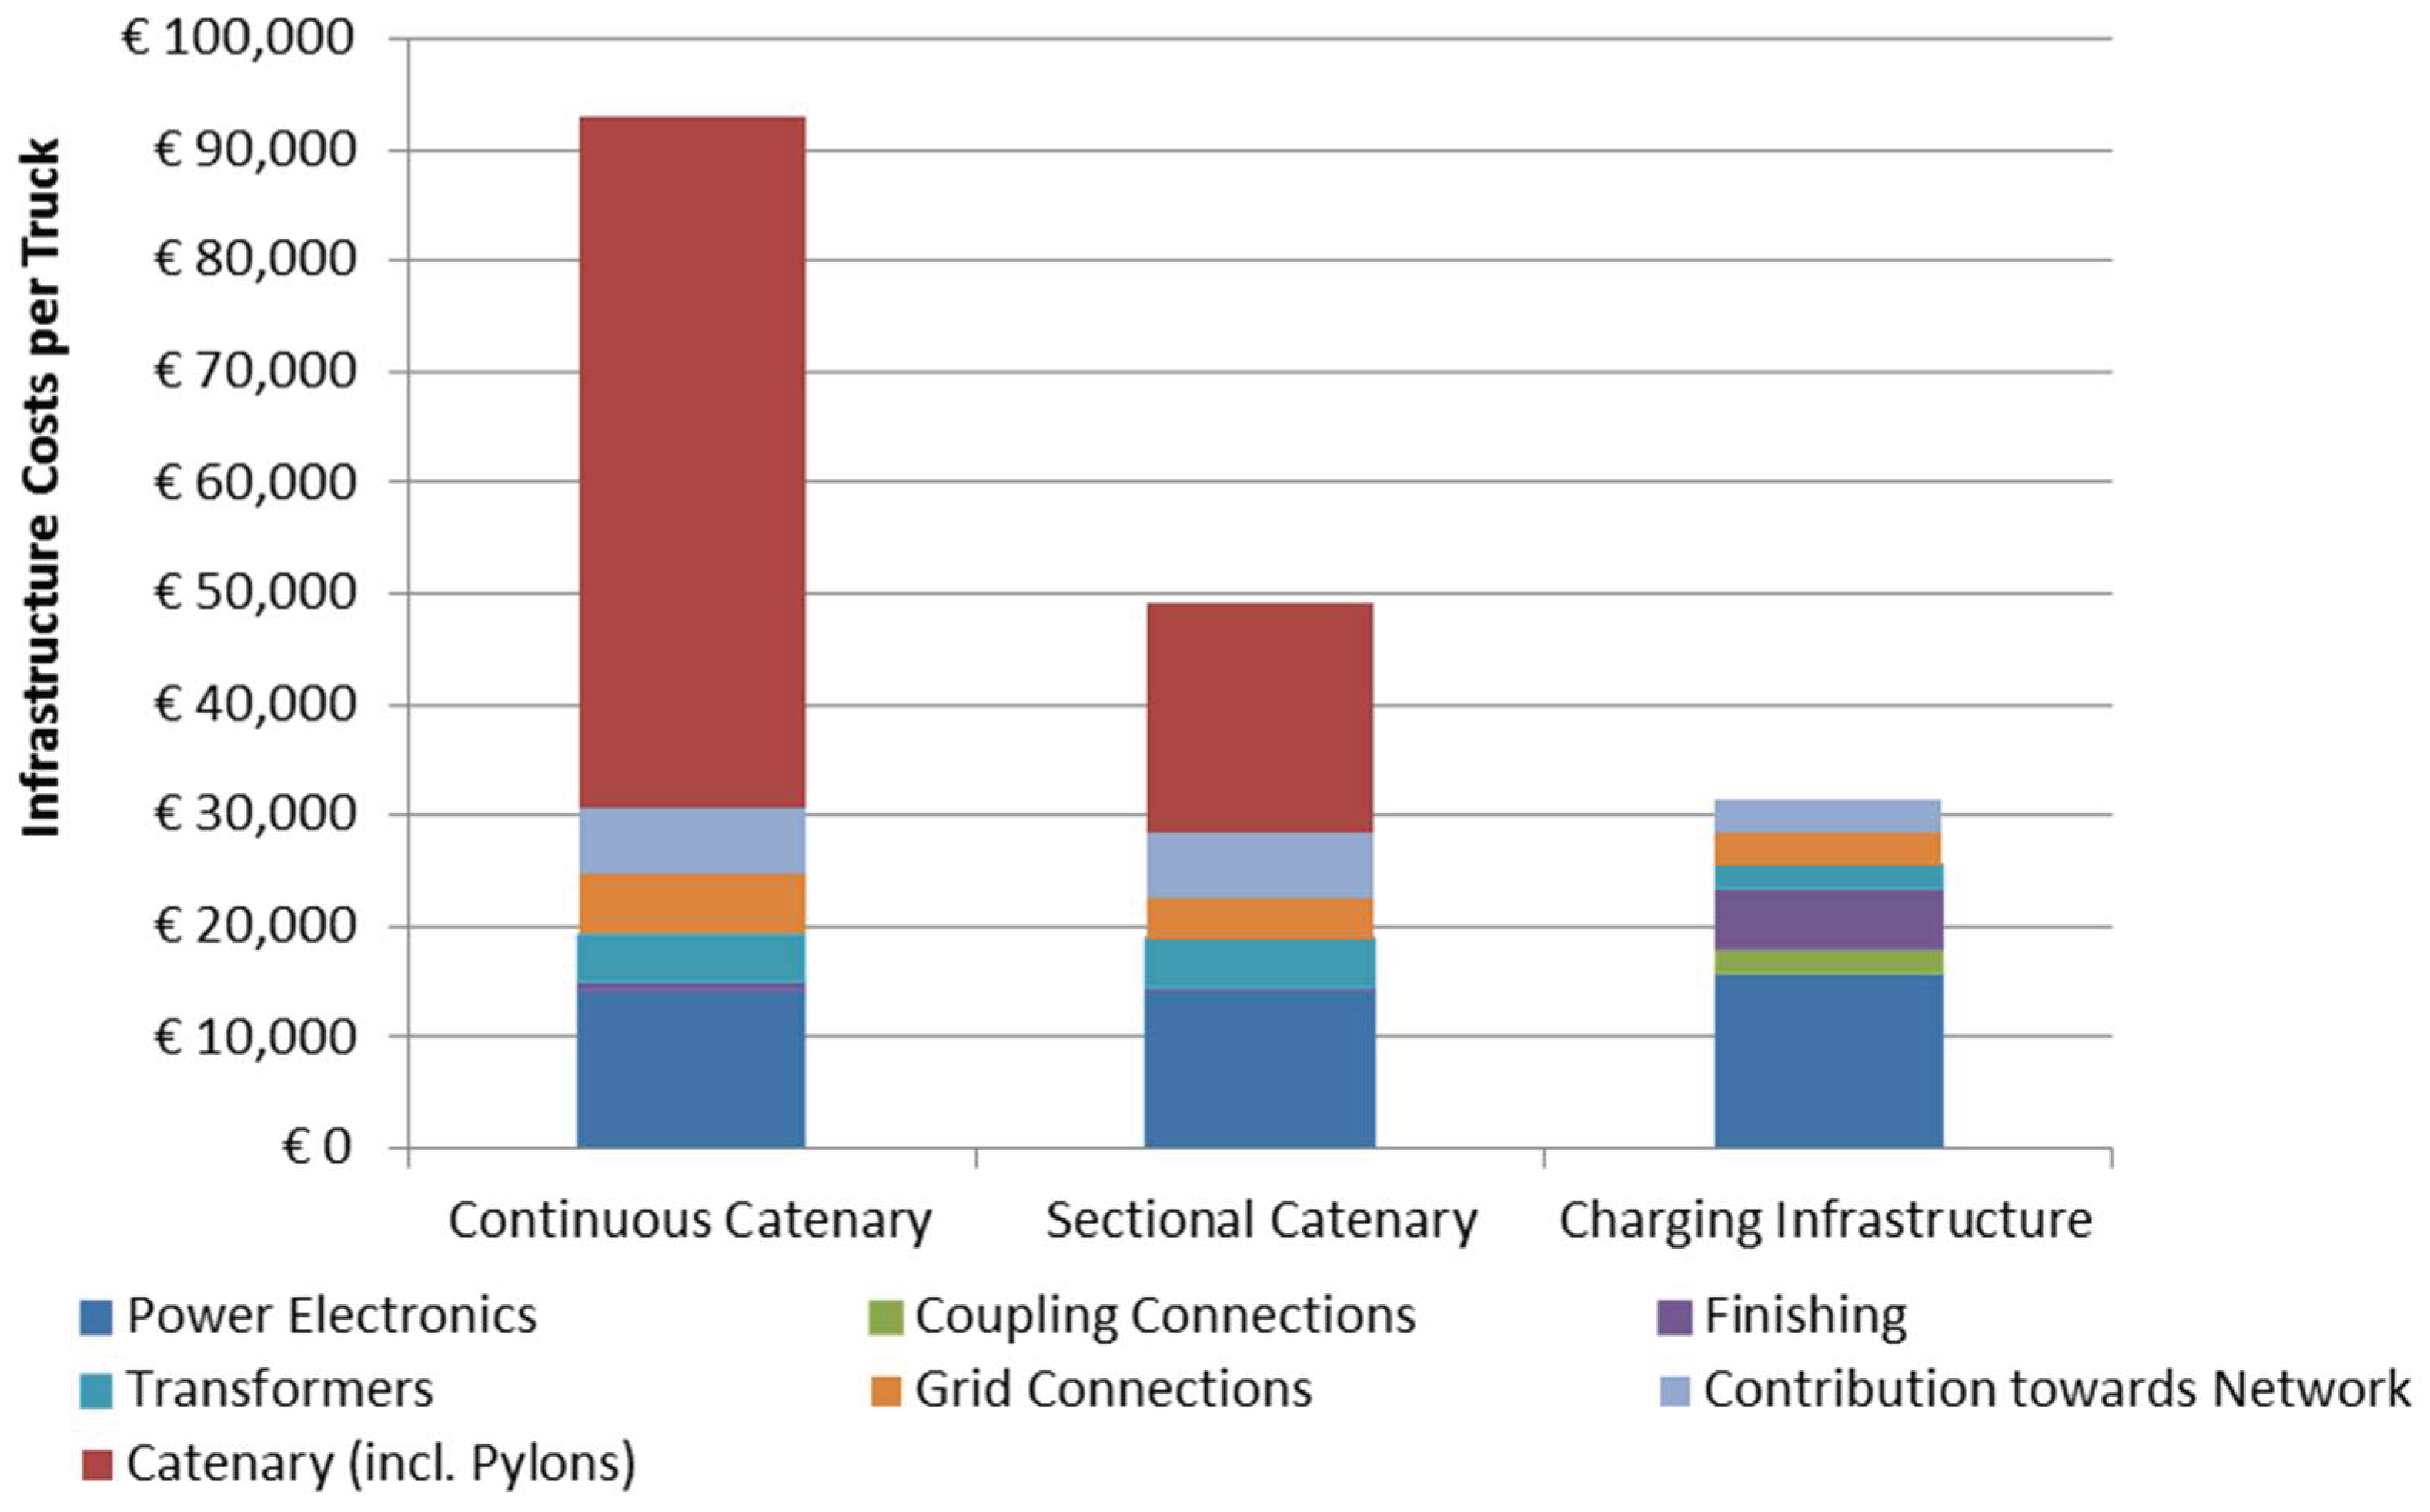
This section first discusses the life cycle costs results for the catenary infrastructure and afterwards the complete life cycle costs including vehicle and infrastructure (according to Figure 5). Figure 10 shows the net present values of the catenary infrastructure for the specified transportation scenario with 5 years duration. The net present values incorporate component lifetimes and residual values and they are split to the number of participating vehicles. The latter is assumed equal to the number of participating vehicles using charging infrastructure, so the catenary infrastructure costs can be compared to charging infrastructure costs (Figure 10). The assumed trucks number using the charging infrastructure is the number of heavy-duty trucks parked at highway rest areas during night (ca. 71,000 trucks [26]).
The highest infrastructure costs result for the continuous catenary configuration and consists, for the most part, of the costs for catenary wires, including pylons and rectifiers in substations. The infrastructure costs for the sectional catenary configuration are smaller as the highway sections equipped with catenary wires and pylons are shorter. The rectifier costs for this catenary configuration are approximately equal to the rectifier costs in the configuration continuous catenary. This results from approximately equal rectifier power installed in both configurations, but for the configuration continuous catenary the installed power is more distributed to a higher substations number along highways. However, this study doesn’t consider the effect of higher power transmission on the catenary wires and pylons in the configuration sectional catenary. Due to higher power a larger diameter of catenary wires or a higher voltage level may become necessary, requiring components with higher withstand voltage (i.e., isolators).
In contrast to the catenary infrastructure, the charging infrastructure (discussed in the previous study [4]) results in smaller costs per truck because of the absence of catenary and less installed total power in the charging stations. The catenary infrastructure requires a total grid connection power of ca. 30 GW (in both considered configurations) that can be calculated using the highway length, the assumed number of substations per 100 km, and the grid connection power of one substation, according to Table 4. The total grid connection power of charging stations results in ca. 15 GW calculating with the number of charging stations and their connection power [4]. This can be explained by considering the dwell times at catenary and charging stations. The daily dwell time at charging station corresponds to the total rest period of 15 h for truck drivers (Section 3.4) and the dwell time at catenary corresponds to a shorter drive time of 9 h.
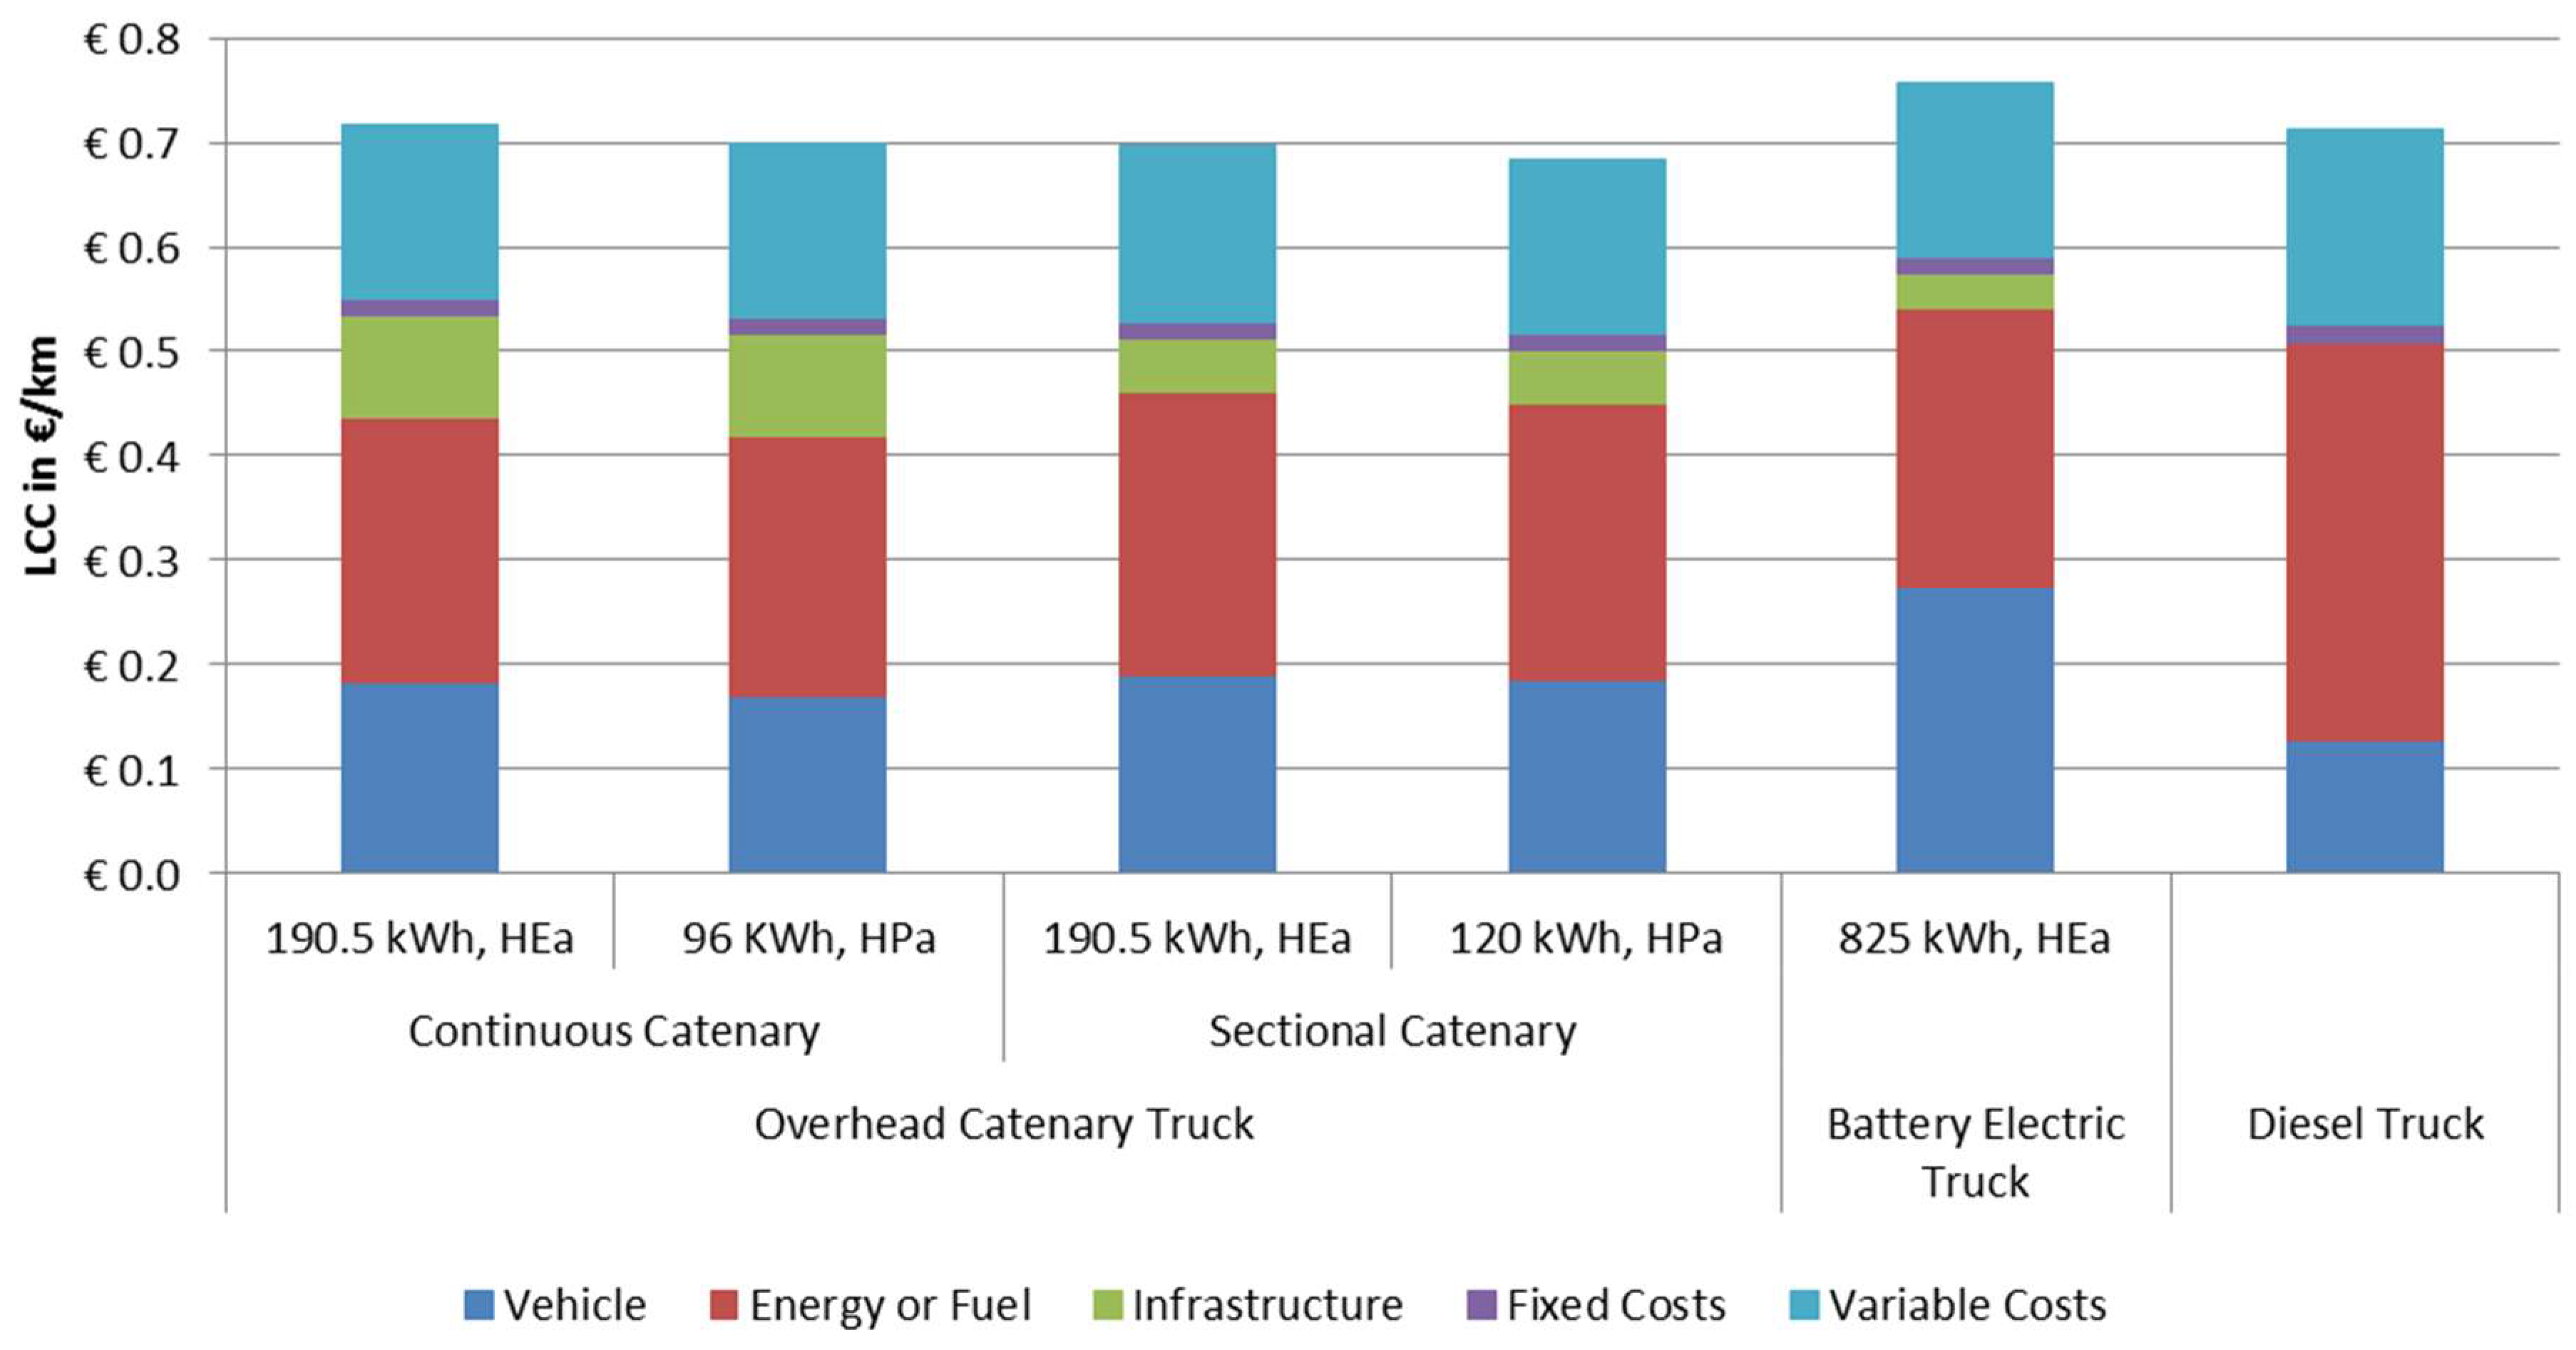
Finally, the total life cycle costs for the truck and catenary in the considered transportation scenario are shown in Figure 11. The values are related to the total scenario mileage of ca. 939,600 km. The total costs differ depending on the truck and catenary configuration but are in the range of the total costs of the conventional diesel truck calculated in [4]. The most important parts of life cycle costs of overhead catenary trucks are energy costs, vehicle costs, and variable costs. The vehicle costs are higher compared to a diesel truck but lower compared to a battery electric truck, where the high capacity battery induces a major costs part. The variable costs are equal for all alternative trucks and slightly lower compared to diesel trucks due to the absence of truck taxes for electric trucks. The infrastructure costs for overhead catenary trucks play a minor role similar to battery electric trucks as the infrastructure costs are split to all participating trucks and due to a higher infrastructure lifetime.
Among the considered overhead catenary trucks, the sectional catenary configuration and the truck with a 120-kWh high power battery shows the lowest life cycle costs of 0.68 €/km due to smallest catenary infrastructure costs and good battery lifetime. On the other hand, the overhead catenary trucks using continuous catenary configuration show lower vehicle costs and higher infrastructure costs. Altogether, the life cycle costs analysis of the overhead catenary trucks demonstrates that their costs can be in the same range as the life cycle costs of a conventional diesel truck or even slightly lower.

5. Conclusions

This study describes the energy consumption and the dimensioning of a traction battery and catenary infrastructure and the calculation of life cycle costs for overhead catenary trucks used for long-haul goods transportation. First, the route, vehicle, and life cycle costs models are discussed. Afterwards, the traction battery is dimensioned for the average consumption and route length without catenary. The battery capacity depends also on the battery cell type, so four different configurations of battery and catenary are chosen.
The catenary power system is dimensioned according to statistical data of average hourly traffic intensity, the energy consumption of overhead catenary trucks, and component efficiencies. The required pantograph power for continuous catenary and the considered truck is calculated as 155 kW, and for the sectional catenary as 480 kW. The output power of a substation with continuous catenary configuration is 11 MW and with sectional catenary configuration is 34 MW.
Subsequently, the transportation scenario was specified considering the requirements of long-haul transportation and truck performance was simulated. The energy consumption of the considered overhead catenary trucks is in the range of 1.66 to 1.82 kWh/km depending on the truck configuration. This is approximately equal to the energy consumption of a battery electric truck considered in the previous study [4] but only about a half of the equivalent energy consumption of a conventional diesel truck. Considering the traction battery, the sectional catenary configuration induces a higher stress for the traction battery as the battery is recharged more often and the charging currents are higher.
Finally, the life cycle costs for the specified transportation scenario and trucks are calculated. The infrastructure costs for the sectional catenary are smaller compared to that of the continuous catenary due to shorter catenary sections and thus lower costs for catenary wires and pylons. However, the impact of higher power on catenary costs has to be assessed as no appropriate data for this study was available. Considering the total life cycle costs in the specified transportation scenario, the infrastructure costs play a minor role. The main cost drivers are the energy and vehicle costs. The vehicle costs are higher than for diesel trucks but lower than for battery electric trucks. According to the cost assumptions, the total life cycle costs of overhead catenary trucks are in the range of 0.68 to 0.72 €/km. Altogether, this analysis shows that the costs of the considered overhead catenary electric trucks can be in the range of the conventional diesel truck, thus the overhead catenary trucks may be an interesting option for the long-haul transportation.
The results of this study can be used to compare the overhead catenary trucks to other upcoming technologies like fuel cell trucks and electric trucks dynamically charging during driving by inductive charging or by electric rail. Also, the ecological aspects of using alternative truck technologies can be compared to the conventional trucks. Using the general methodology of this study, the results can be adopted to the local conditions of other countries by adjusting the consumption and cost parameters.

Author Contributions

The research of the statistical data, simulation model development, and results analysis were done by I.M. D.U.S. contributed to all parts.

Funding

This research was funded by the Karl-Vossloh-Stiftung foundation (grant number S047/10038/2015).

Conflicts of Interest

The authors declare no conflict of interest. The founding sponsors had no role in the design of the study; in the collection, analyses, or interpretation of data; in the writing of the manuscript, and in the decision to publish the results.

Appendix A

Table A1. Cost parameters for overhead catenary trucks, battery trucks, and diesel trucks.
ParameterValueSource
Overhead Catenary Truck
Vehicle Body (w/o drivetrain)91,800 €[3]
Battery with HEa Cells 300 €/kWh[23] and own estimation
Battery with HPa Cells 400 €/kWh[23] and own estimation
Battery Price Development−6.7%/a[23]
E-Machine27.5 €/kW[3]
Power Electronics35 €/kW[3]
Pantograph38,000 €[3]
Battery Electric Truck
Vehicle Body (w/o drivetrain)91,800 €[3]
Battery with HEa Cells 300 €/kWh[23] and own estimation
Battery Price Development−6.7%/a[23]
E-Machine27.5 €/kW[3]
Power Electronics35 €/kW[3]
Diesel Truck
Diesel Truck120,000 €[3]
Table A2. Cost parameters for electricity and diesel fuel.
ParameterValueSource
Electricity
Electricity, net0.139 €/kWh[27]
Electricity Price Development5.3%/a[27]
Diesel Fuel
Diesel Fuel, net0.949 €/L[28,29]
Diesel Fuel Price Development2.3%/a[28]
Table A3. Cost parameters for the overhead catenary infrastructure.
ParameterValueSource
Substation
Rectifier80 €/kW[30]
Transformer45 €/kW[30]
Finishing Costs85,000 €[30]
Grid Connection
Connection to Grid (assuming 2.5 km distance)Fix: 25.9 €/kW, Var: 140 €/m[6,30]
Contribution towards Network60.44 €/kW[30]
Catenary
Catenary incl. Pylons (per Direction)730 €/m[8,17]
Lifetimes
Lifetime Transformer25 a[30]
Lifetime Power Electronics12 a[30]
Table A4. Cost parameters for charging station infrastructure. The source for the costs parameters in this table is private communication with manufacturers, who want to stay anonymous [30].
ParameterValue
Charging Station
Power Electronics (Fast Charging Station)149,000 €
Power Electronics (Slow Charging Station)9800 €
Coupling Connection (Fast Charging Station)21,000 €
Coupling Connection (Slow Charging Station)1400 €
Finishing Costs (Fast Charging Station)85,000 €
Finishing Costs (Slow Charging Station)10,000 €
Transformer45 €/kW
Grid Connection
Connection to Grid (assuming 2.5 km distance)Fix: 25.9 €/kW,
Var: 140 €/m,
Total: 609,000 €
Contribution towards Network60,44 €/kW
Lifetimes
Lifetime Transformer25 a
Lifetime Power Electronics12 a
Table A5. Cost parameters for the fixed and variable costs.
ParameterValueSource
Fixed Costs
Electric Truck Taxes0 €/a[31]
Diesel Truck Taxes556 €/a[31]
Insurance2936 €/a[32]
Variable Costs
Service for Electric Truck0.04 €/km[3]
Service for Diesel Truck0.06 €/km[3]
Tolls0.135 €/km[33]

References

  1. Yazdanie, M.; Noembrini, F.; Dossetto, L.; Boulouchos, K. A comparative analysis of well-to-wheel primary energy demand and greenhouse gas emissions for the operation of alternative and conventional vehicles in Switzerland, considering various energy carrier production pathways. J. Power Sources 2014, 249, 333–348. [Google Scholar] [CrossRef]
  2. Sen, B.; Ercan, T.; Tatari, O. Does a battery-electric truck make a difference?—Life cycle emissions, costs, and externality analysis of alternative fuel-powered Class 8 heavy-duty trucks in the United States. J. Clean. Prod. 2017, 141, 110–121. [Google Scholar] [CrossRef]
  3. Den Boer, E.; Aarnink, S.; Kleiner, F.; Pagenkopf, J. Zero Emissions Trucks: An Overview of State-of-the-Art Technologies and their Potential; CE Delft, DLR: Delft, The Netherlands, 2013. [Google Scholar]
  4. Mareev, I.; Becker, J.; Sauer, D.U. Battery Dimensioning and Life Cycle Costs Analysis for a Heavy-Duty Truck Considering the Requirements of Long-Haul Transportation. Energies 2018, 11, 55. [Google Scholar] [CrossRef]
  5. Hülsmann, F.; Mottschall, M.; Hacker, F.; Kasten, P. Konventionelle und alternative Fahrzeugtechnologien bei Pkw und schweren Nutzfahrzeugen—Potenziale zur Minderung des Energieverbrauchs bis 2050; Öko-Institut e.V.: Freiburg, Germany, 2014. [Google Scholar]
  6. Wietschel, M.; Gnann, T.; Kühn, A.; Plötz, P.; Moll, C.; Speth, D.; Buch, J.; Boßmann, T.; Stütz, S.; Schellert, M.; et al. Machbarkeitsstudie zur Ermittlung der Potentiale des Hybrid-Oberleitungs-Lkw; Fraunhofer ISI: Karlsruhe, Germany; Fraunhofer IML: Munich, Germany; PTV Transport Consult GmbH: Karlsruhe, Germany; TU Hamburg—IUE, M-Five: Harburg, Germany, 2017. [Google Scholar]
  7. Siemens, AG. ENUBA—Elektromobilität bei schweren Nutzfahrzeugen zur Umweltentlastung von Ballungsräumen; Siemens AG: Munich, Germany, 2012. [Google Scholar]
  8. Lehmann, M.; Arnd, S.; Mazzega, J. ENUBA 2—Elektromobilität bei schweren Nutzfahrzeugen zur Umweltentlastung von Ballungsräumen; Siemens AG: Munich, Germany; TU Dresden: Dresden, Germany; DLR e.V.: Cologne, Germany, 2016. [Google Scholar]
  9. NDR Pilotprojekt E-Highway: Lkw an der Oberleitung. Available online: /nachrichten/schleswig-holstein/Pilotprojekt-E-Highway-Lkw-an-der-Oberleitung,elkw120.html (accessed on 27 March 2018).
  10. Biermann, J.-W. Fahrzeugauslegung. In Energiemanagement im Kraftfahrzeug: Optimierung von CO2-Emissionen und Verbrauch Konventioneller und Elektrifizierter Automobile; Liebl, J., Lederer, M., Rohde-Brandenburger, K., Roth, M., Schäfer, H., Eds.; ATZ/MTZ-Fachbuch; Springer Vieweg: Wiesbaden, Germany, 2014; pp. 101–162. ISBN 978-3-658-04450-3. [Google Scholar]
  11. Fahrmechanik. Nutzfahrzeugtechnik: Grundlagen, Systeme, Komponenten; Hoepke, E., Appel, W., Eds.; ATZ-MTZ Fachbuch; Springer Vieweg: Wiesbaden, Germany, 2013; pp. 37–119. ISBN 978-3-8348-1795-2. [Google Scholar]
  12. European Union (EC). Regulation (EC) No 661/2009 of the European Parliament and of the Council of 13 July 2009 Concerning Type-Approval Requirements for the General Safety of Motor Vehicles, Their Trailers and Systems, Components and Separate Technical Units Intended Therefor; European Union: Brussels, Belgium, 2009. [Google Scholar]
  13. Schmalstieg, J.; Käbitz, S.; Ecker, M.; Sauer, D.U. A holistic aging model for Li(NiMnCo)O2 based 18650 lithium-ion batteries. J. Power Sources 2014, 257, 325–334. [Google Scholar] [CrossRef]
  14. Käbitz, S.; Gerschler, J.B.; Ecker, M.; Yurdagel, Y.; Emmermacher, B.; André, D.; Mitsch, T.; Sauer, D.U. Cycle and calendar life study of a graphite|LiNi1/3Mn1/3Co1/3O2 Li-ion high energy system. Part A: Full cell characterization. J. Power Sources 2013, 239, 572–583. [Google Scholar] [CrossRef]
  15. Ecker, M.; Gerschler, J.B.; Vogel, J.; Käbitz, S.; Hust, F.; Dechent, P.; Sauer, D.U. Development of a lifetime prediction model for lithium-ion batteries based on extended accelerated aging test data. J. Power Sources 2012, 215, 248–257. [Google Scholar] [CrossRef]
  16. Nykvist, B.; Nilsson, M. Rapidly falling costs of battery packs for electric vehicles. Nat. Clim. Chang. 2015, 5, 329–332. [Google Scholar] [CrossRef] [Green Version]
  17. Nießen, N. Umdruck Lehrveranstaltung Eisenbahnwesen I; RWTH Aachen: Aachen, Germany, 2015. [Google Scholar]
  18. Logivest Gewerbegebiete. Available online: https://www.gewerbegebiete.de/ (accessed on 12 October 2018).
  19. Fitschen, A.; Nordmann, H. Verkehrsentwicklung auf Bundesfernstraßen 2013; Bundesanstalt für Straßenwesen: Bergisch Gladbach, Germany, 2014. [Google Scholar]
  20. DAF Trucks Deutschland Modellbeschreibung XF 440 FT 4 x 2 Sattelzugmaschine. Available online: http://www.daftrucks.de/de-de/trucks/specsheets-search-page (accessed on 12 October 2018).
  21. DAF Components MX-11 Euro 6 Coach & Bus Engine 2013. Available online: https://www.google.com.sg/url?sa=t&rct=j&q=&esrc=s&source=web&cd=1&ved=2ahUKEwjrub7k3ZHfAhWJzLwKHQBqBswQFjAAegQIABAC&url=http%3A%2F%2Fwww.dafcomponents.com%2F~%2Fmedia%2Ffiles%2Fdaf%2520trucks%2Ftrucks%2Fcomponents%2Fmx-11%2Fcomponents_mx-11-my2017-70208.pdf&usg=AOvVaw3lRys30x0Y6reLepZCQ5xi (accessed on 12 October 2018).
  22. Volvo Trucks. Fahrzeugspezifikation Volvo FH 500 4 x 2 Sattelzugmaschine; Volvo Trucks: Gothenburg, Sweden, 2015. [Google Scholar]
  23. GKN Land Systems GKN Electric Motor and Generator Technology: Technical Datasheet. Available online: http://products.gknlandsystems.info/fileadmin/user_upload/pdf/Electrics/DS_GKN_electric_motor_technology_64_GB_1214.pdf (accessed on 12 October 2018).
  24. ZF Friedrichshafen. Truck & Van Driveline Technology—Product Overview; ZF Friedrichshafen: Friedrichshafen, Germany, 2015. [Google Scholar]
  25. European Union (EC). Regulation (EC) No 561/2006 of the European Parliament and of the Council of 15 March 2006 on the Harmonisation of Certain Social Legislation Relating to Road Transport and Amending Council Regulations (EEC) No 3821/85 and (EC) No 2135/98 and Repealing Council Regulation (EEC) No 3820/85 (Text with EEA Relevance)—Declaration; European Union: Brussels, Belgium, 2006. [Google Scholar]
  26. Kathmann, T.; Schroeder, S.; Bär, A. Lkw-Parken auf BAB—Auswertung der bundesweiten Erhebung der Parkstandnachfrage an BAB 2013; Bundesministerium für Verkehr, Bau und Stadtentwicklung: Berlin, Germany, 2014. [Google Scholar]
  27. Bundesverband der Energie- und Wasserwirtschaft e.V. (BDEW). BDEW-Strompreisanalyse; Bundesverband der Energie- und Wasserwirtschaft e.V. (BDEW): Berlin, Germany, June 2014. [Google Scholar]
  28. Statista GmbH Durchschnittlicher Dieselpreis in Deutschland bis 2017. Available online: https://de.statista.com/statistik/daten/studie/779/umfrage/durchschnittspreis-fuer-dieselkraftstoff-seit-dem-jahr-1950/ (accessed on 12 October 2018).
  29. Statista GmbH Zusammensetzung des Dieselpreises im Juni 2017. Available online: https://de.statista.com/statistik/daten/studie/803/umfrage/zusammensetzung---verbraucherpreis-fuer-diesel/ (accessed on 12 October 2018).
  30. Mareev, I. Personal Communication with Charging Equipment Manufacturers; RWTH Aachen: Aachen, Germany, 2016. [Google Scholar]
  31. KraftStG KraftStG—Kraftfahrzeugsteuergesetz. Available online: https://www.gesetze-im-internet.de/kraftstg/BJNR005090927.html (accessed on 12 October 2018).
  32. Hacker, F.; von Waldenfels, R.; Mottschall, M. Wirtschaftlichkeit von Elektromobilität in gewerblichen Anwendungen: Betrachtung von Gesamtnutzungskosten, ökonomischen Potenzialen und möglicher CO2-Minderung; Öko-Institut e.V.: Freiburg im Breisgau, Germany, 2015. [Google Scholar]
  33. Toll Collect GmbH Toll Collect—Toll Rates. Available online: https://www.toll-collect.de/en/toll_collect/bezahlen/maut_tarife/maut_tarife.html (accessed on 12 October 2018).
Figure 1. Overview of the holistic model including the vehicle simulation model and the life cycle costs (LCC) model.
Energies 11 03446 g001
Figure 2. Overview of the vehicle simulation model.
Energies 11 03446 g002
Figure 3. The set acceleration for the semi-trailer truck depending on the actual velocity.
Energies 11 03446 g003
Figure 4. The drivetrain topology of the modeled overhead catenary truck.
Energies 11 03446 g004
Figure 5. Composition of life cycle costs for an overhead catenary truck.
Energies 11 03446 g005
Figure 6. Scheme of a catenary power system and the drivetrain of an overhead catenary truck.
Energies 11 03446 g006
Figure 7. Weight breakdown of the main truck components for the overhead catenary trucks with different traction batteries and battery cells compared to diesel trucks and battery electric trucks.
Energies 11 03446 g007
Figure 8. Energy consumption for the overhead catenary trucks with different configurations of catenary and traction batteries compared to battery electric truck and diesel truck.
Energies 11 03446 g008
Figure 9. (a) State of charge (SOC) and (b) temperature of the traction battery during the daily transportation scenario for the overhead catenary trucks using the continuous and sectional catenary configurations.
Energies 11 03446 g009
Figure 10. Net present values for catenary infrastructure and charging infrastructure per one truck in the specified transportation scenario.
Energies 11 03446 g010
Figure 11. Life cycle costs of the considered overhead catenary trucks, battery electric trucks, and diesel trucks in the specified transportation scenario related to the total mileage.
Energies 11 03446 g011
Table 1. Technical data of cells contained in the electric cell model and assumed costs of battery pack containing the particular cell type.
Cell IdCell TypeChemistryNominal CapacityNominal VoltageMax. Charge Current RateMax. Discharge Current RateNumber of Cycles (15 °C, 1 C)Assumed Battery Pack Costs
Cell HEaHigh EnergyLi(NiMnCo)O210 Ah3.6 V2 C2 C6500 Cycles300 €/kWh
Cell HPaHigh PowerLi(NiMnCo)O26 Ah3.6 V5 C20 C20,000 Cycles400 €/kWh
Table 2. Investigated configurations of the catenary power systems and batteries.
Catenary ConfigurationBattery CellsBattery Capacity
Continuous CatenaryHEa190.5 kWh
HPa96 kWh
Sectional CatenaryHEa190.5 kWh
HPa120 kWh
Table 3. Required pantograph power for the investigated catenary configurations.
Catenary ConfigurationDriving Distance Soc with CatenaryDriving Distance Sbat without CatenaryPantograph Power Ppan
Continuous Catenary680 km40 km155 kW
Sectional Catenary230 km490 km480 kW
Table 4. Average substation components for the considered catenary configurations.
Average SubstationContinuous CatenarySectional Catenary
Substation Output Power Psub11.0 MW34.0 MW
Transformer Output Power11.3 MW34.7 MW
Grid Connection Power Pcon11.6 MW35.7 MW