Review

Review of Information Disclosure in Different Electricity Markets

1
College of Electrical Engineering, Zhejiang University, Hangzhou 310027, China
2
Department of Electrical and Computer Engineering, University of Macau, Macau 519020, China
*
Author to whom correspondence should be addressed.
Energies 2018, 11(12), 3424; https://doi.org/10.3390/en11123424
Submission received: 15 November 2018 / Revised: 28 November 2018 / Accepted: 30 November 2018 / Published: 6 December 2018

Abstract

:
Electricity markets have been established in many countries of the world. Electricity and services are traded in the competitive environment of electricity markets, which generates a large amount of information during the operation process. To maintain transparency and foster competition of electricity markets, timely and precise information regarding the operation of electricity market should be disclosed to the market participants through a centralized and authorized information disclosure mechanism. However, the information disclosure mechanism varies greatly in electricity markets because of different market models and transaction methods. This paper reviews information disclosure mechanisms of several typical electricity markets with the poolco model, bilateral contract model, and hybrid model. The disclosed information and clearing models in these markets are summarized to provide an overview of the present information disclosure mechanisms in typical deregulated power systems worldwide. Moreover, the various experiences for establishing an efficient information disclosure mechanism is summarized and discussed.

1. Introduction

Since the 1980s, many electric power industries have been deregulated to change the traditional structure of system operation and planning [1,2]. In electricity markets, energy and ancillary services are traded in the competitive environment to achieve efficiency [3]. Electricity market is a complex system, where information disclosure mechanism is a vital component to ensure efficiency and fairness of the whole market. Without information disclosure, it can be difficult for market members to understand accurately the operating condition of electricity market and the physical network, which may decrease market efficiency and stability.
Currently, numerous efforts have been devoted to the research of electricity markets, including basic design, structure, and operation of electricity markets [4,5,6,7,8,9,10,11,12]. In addition, some of the studies are focused on the information disclosure mechanisms in the electricity market. References [13,14] explain that disclosing critical information about electricity offerings and electricity price is important to improve market competition. References [15,16] find that the transaction and utilization of clean energy can be improved by disclosing mandatory information of clean energy to consumers. Reference [17] shows that disclosing electricity market information is advantageous, since the exercise of market power can be exposed and restricted by the disclosure of bidding data. In the previous studies, it is widely recognized that the information disclosure mechanism is crucial to the efficient operation of electricity markets. However, few researchers have studied the information disclosure in different electricity markets. The approach and extent of information disclosure in different electricity markets has not been clearly compared. Thus, additional efforts are required to study the information disclosure mechanisms in electricity markets in order to identify good practice and the potential scope for improvement. In this paper, the disclosed information, which is divided into generation information, grid information, load information, price information, and bidding information are introduced following the transaction process of different electricity markets.
Due to the difference of market models, the information disclosure mechanisms vary greatly in electricity markets. Generally, electricity markets can be divided into three categories: Poolco model, bilateral contract model, and hybrid model [8,18]. A pool is a centralized market that clears bids and offers submitted by sellers and buyers [19]. Buyers purchase electricity from the pool instead of trading directly with generation companies (GenCo). The poolco model is easy to realize the optimal resolution for the system with a centralized platform. However, it lacks the negotiation between buyers and sellers, limiting the flexibility of market. The bilateral contract model is a market-oriented design that encourages buyers to contract directly with GenCos [20]. However, the cost of negotiating contacts and the risk of the counter-parties credits might be higher. Even though the two market models are different, they can coexist. In the hybrid model, GenCos (or customers) can sell (or buy) electricity either from a centralized power pool or directly through bilateral contracts [21]. Before market clearing, bilateral contracts are required to be submitted to the system operator (SO). If transmission constraints are not satisfied, the bilateral contracts will be modified through system balancing actions. Loads that are not covered in the contracts would be supplied by an economic dispatch of unit in the pool. However, it is very costly to run the two separated markets [8]. Whereas each model has its own advantages and disadvantages, none of them is superior to the others. Figure 1 shows the difference of the three models. Table 1 lists several typical electricity markets and their corresponding market models around the world.
This paper reviews information disclosure mechanisms in different electricity markets. The importance of information disclosure system is discussed in Section 2. Pennsylvania-New Jersey-Maryland interconnection (PJM), British Electricity Trading, and Transmission Agreements (BETTA) and Nord Pool are very typical electricity markets corresponding to centralized model, bilateral contract model, and hybrid model, respectively. Considering the maturity of information disclosure mechanism and the abundance of disclosed information, electricity market models, and corresponding information disclosure mechanisms in PJM, Nord Pool, and BETTA are introduced, respectively in Section 3. Based on the information disclosure mechanisms of these typical electricity markets, some useful experience for developing an effective information disclosure mechanism is discussed and summarized in Section 4. Finally, Section 5 gives the conclusions of this paper.

2. The significance of Information Disclosure

The information disclosure mechanism is essential for increasing market transparency, reducing transaction costs, improving market fairness, and increasing electricity system security. The followings are some widely recognized advantages:

2.1. Increase Market Transparency

When developing trading strategies, it is necessary for market participants to consider costs, the supply and demand of electricity, etc. Market participants with large share of supply or consumption will have a natural information advantage over smaller market participants. When exposed to timely information, all market participants could be aware of the current situation of fast-changing electricity market and make correct decisions. Therefore, disclosing market information can reduce information asymmetries and enhance fairness.
With increased market transparency, it is much easier to access market information by third parties, such as market monitoring agencies and the public. The third parties can help to identify actual or potential market power abuse to assure the healthy development of the electricity market [27].

2.2. Improve Competition in Electricity Market

Information disclosure mechanism provides potential investors with useful information to evaluate electricity market and find out valuable signals for investment [28]. Thus, relevant parties such as investors are more positive to participate in electricity market and market liquidity is increased, which are the long-desired goal of market designers. Theoretically, information disclosure mechanism is the prerequisite of a perfect competitive electricity market.

2.3. Reduce Electricity Market Risk

In current market designs, spot market prices are driven by fuel prices. Besides, market participants arrange their forward contracts according to the spot market prices to hedge against the risk of high price. Disclosing fuel prices and historical prices can reflect the real value of electricity products, guide market participants to a consensus on future price trends, and enhance the stabilization of market price. As a result, the electricity market risk is reduced through information disclosure [15].

2.4. Improve Electricity System Security

The difference between electricity market and other commodity markets is that production and consumption must be balanced instantaneously. System imbalance may decrease the security of electric system or even lead to blackouts. To keep the security of interconnected systems, detailed information about current and forecasted power flow needs to be shared between neighboring system operators [29].

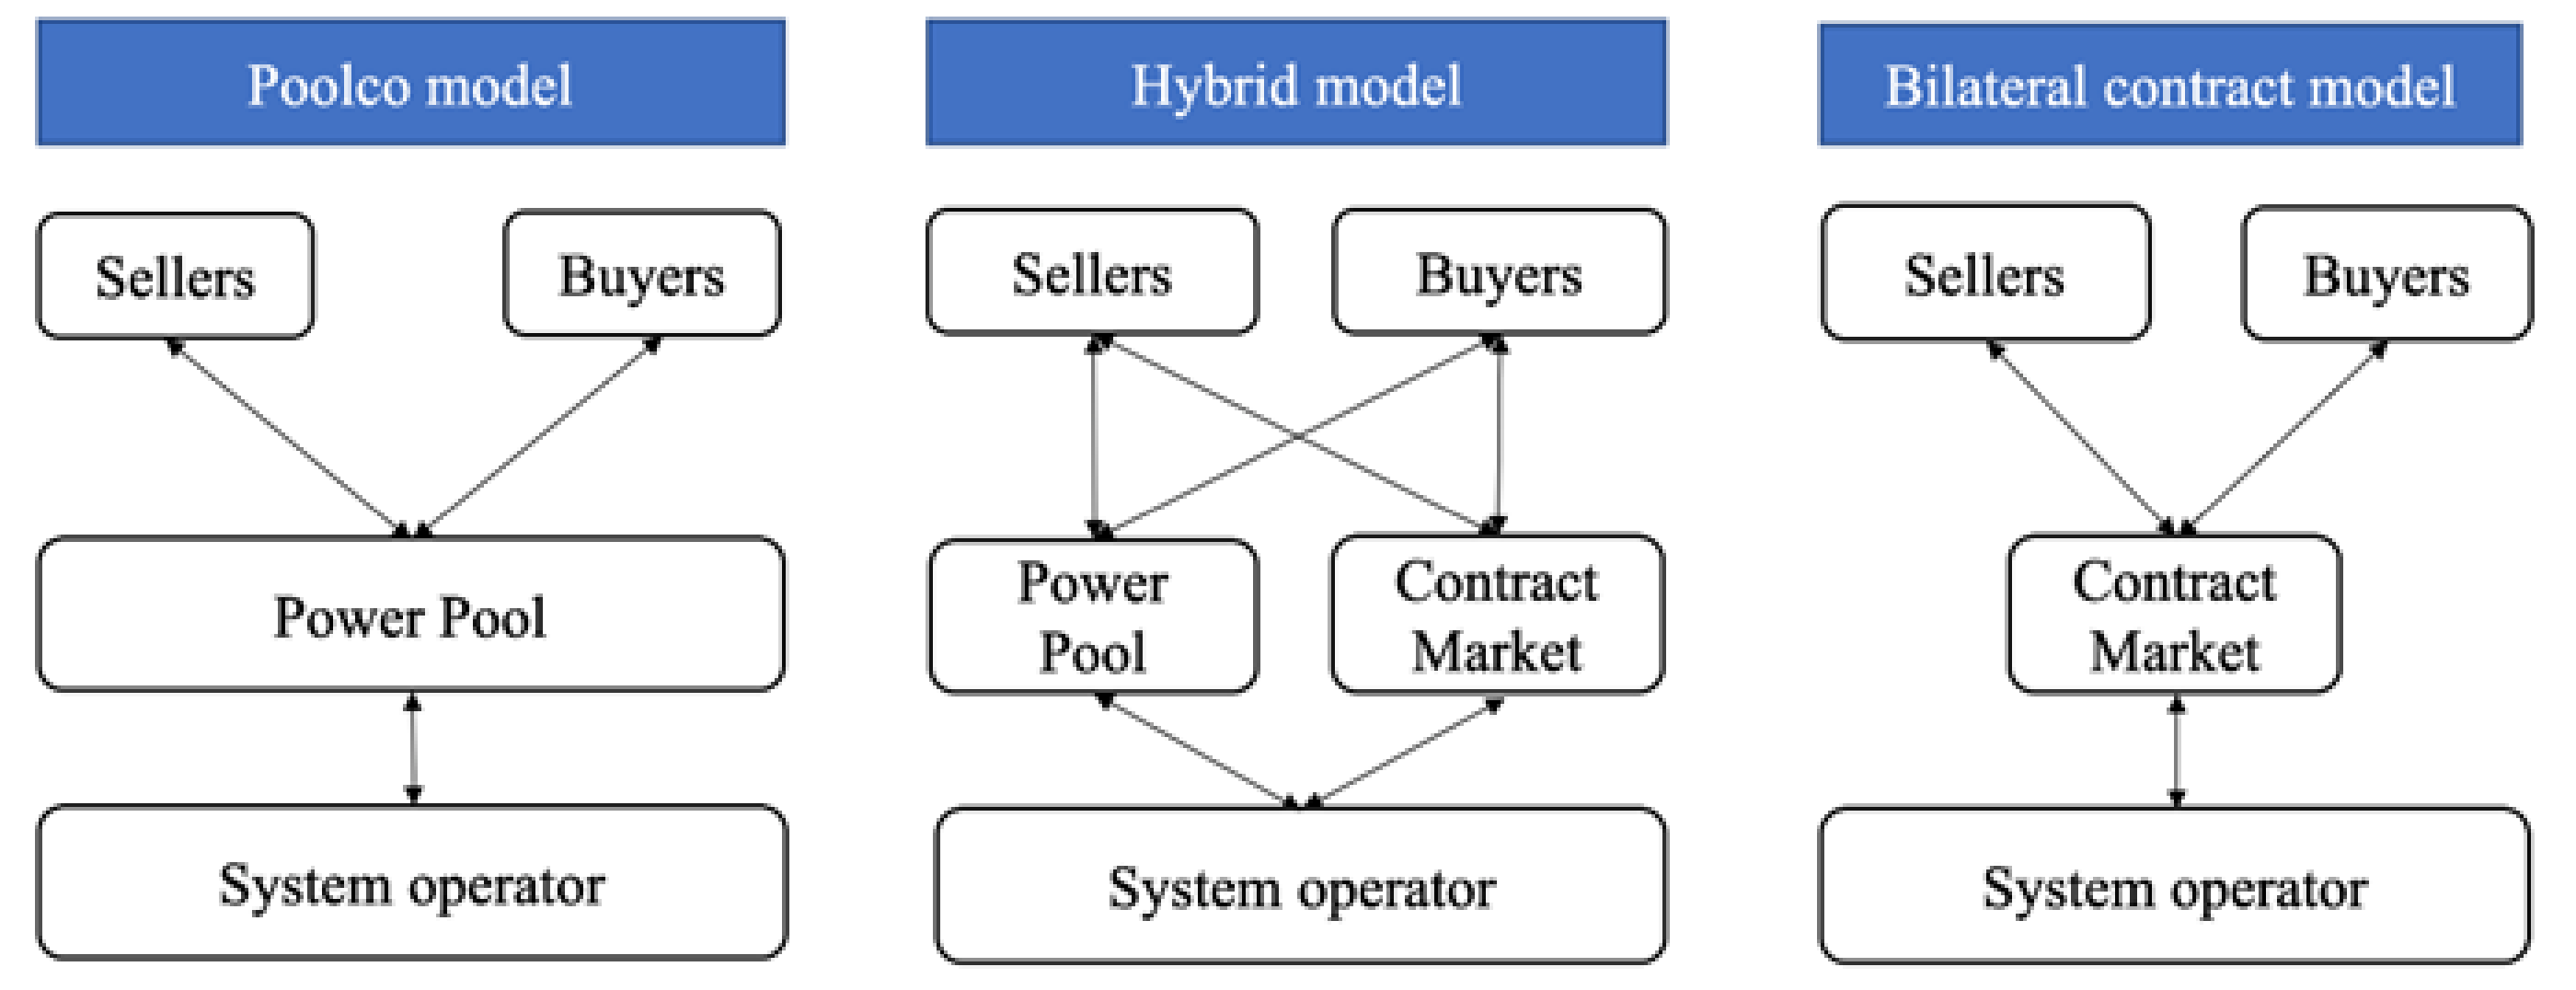
3. Information Disclosure in Different Electricity Markets

In different electricity markets, information generated during the clearing process varies greatly. The clearing process of the three power market models, as well as information generated and disclosed in electricity markets, will be presented in this section.

3.1. Poolco Model

In the poolco model, the independent system operator (ISO) is responsible for both the operation of market and power system. Buyers and sellers provide bids and offers for energy and ancillary services to the spot market. Based on the bids and offers, transmission congestions, and other information, the ISO clears the market using optimization models to maximize social welfare or minimum production cost while satisfying the constraints of the power system [19]. After the market clearing, the dispatch of units and prices for energy and ancillary service are calculated. The generating units will be dispatched and controlled based on clearing results by the ISO. Figure 2 shows the framework for the poolco model.

3.1.1. Information Disclosure in PJM

The PJM interconnection is a typical electricity market of the poolco model. The spot market of PJM is composed of a day-ahead energy market and real-time balancing market. A large amount of information is generated during the clearing process of spot market. Figure 3 shows the clearing process of PJM market.
At 08:00, the day-ahead market is open. Market participants submit information about generation offers, demand bids, demand response bids, and virtual bids of the next day to ISO. At 10:30, the day-ahead market is closed. The ISO will arrange electricity generation and calculate day-ahead locational marginal prices (LMPs), based on security constrained unit commitment (SCUC) and security constrained economic dispatch (SCED) models.
SCUC determines unit commitment (UC) status and schedules for generating units to satisfy demand. The objective function of SCUC is to minimize the start-up cost, shutdown cost, no-load cost, and energy cost, subject to power balance constraints, reserve requirements, transmission constraints, generation constraints, and ramp limits of units, etc.
In the optimization models, the input information includes load forecast data, forecasted reserve demand, energy market offer data, parameters of generating units such as minimum and maximum output, ramp rates, and transmission constraints, etc. The output information of SCUC is mainly UC decisions of each generating units. To introduce the input and output information, the SCUC model is shown as follows. The objective function of SCUC can be formulated as References [31,32]:
min t = 1 T i = 1 N P i , t B G , i + R i , t B R , i + N i , t I i , t + S U i , t + S D i , t
where P i , t is the quantity for energy offer of unit i at period t with price B G , i . R i , t being the quantity for reserve offer of unit i at period t with price B R , i . N i , t that is the no-load cost of unit i at period t , I i , t is the UC decision of unit i at period t . S U i , t and S D i , t denotes the start-up and shutdown cost of unit i at period t , respectively. N is the number of generating units. T is the number of periods.
It is subject to the following constraints:
Power balance constraints:
i = 1 N P i , t = P D , t
Reserve requirements:
i = 1 N R i , t R D , t
Transmission constraints:
F l min F l F l max , l
Generation constraints:
P G , i min I i , t P i , t + S R i P G , i max I i , t , i
Ramping limits:
P i , t P i , t 1 U R i I i , t 1 + U P i [ I i , t ( 1 I i , t 1 ) ]
P i , t 1 P i , t D R i I i , t 1 + D P i [ I i , t 1 ( 1 I i , t ) ]
Variable constraints:
I i , t { 0 , 1 }
where P D , t is the total forecasted load at period t . R D , t is the total day-ahead forecasted reserve demand at period t . P G , i max and P G , i min denote the maximum and minimum output of unit i ; D R i and U R i are the ramping down and up limits of unit i ; D P i and U P i are the shut-down and start-up ramping limits of unit i , respectively. F l is the power flow of transmission line l . F l max and F l min denote the upper and lower limits of power flow at transmission line l , respectively.
Based on the UC decisions I i , t obtained in (1)–(8), SCED is applied to determine generation dispatches and prices. The objective function of SCED can be formulated as:
min t = 1 T i = 1 N P i , t B G i + S R i , t B S R i , t + N S R i , t B N S R i , t + F R i , t B F R i , t
It is subject to constraints (2), (4)–(7) as well as the following constraints of reserve:
i = 1 N S R i , t S R D , t
i = 1 N N S R i , t N S R D , t
i = 1 N F R i , t F R D , t
where S R D , t and N S R D , t denote the total forecasted demand of synchronized reserve and non-synchronized reserve at period t , respectively. S R i , t and N S R i , t denote the synchronized reserve and non-synchronized reserve provided by unit i at period t , respectively. B S R i , t and B N S R i , t denote the bids of the synchronized reserve and non-synchronized reserve provided by unit i at period t , respectively. F R D , t is the total forecasted demand of frequency regulation at period t . F R i , t is the frequency regulation provided by unit i at period t . B F R i , t is the bid of frequency regulation provided by unit i at period t . The output information of SCED includes the outputs of each unit, synchronized and non-synchronized reserve of each unit, frequency regulation capacity of each unit, LMPs, and power flow, etc.
By 13:30, PJM posts hourly day-ahead LMPs on the information disclosure platform after implementing the optimization models. By 14:15, the rebidding period is opened, during which generating units can submit their bids for balancing energy. After 14:15, the rebidding period is closed, the ISO will implement the reliability unit commitment process based on updated offers, updated load forecast information, etc. [33]. During the real-time operation, the market will be continuously revaluated. Real-time LMPs and the dispatch plan are calculated per five minutes based on the SCED model [34]. The real-time LMPs will be continuously refreshed and disclosed to the market.
Besides publishing information of energy market, ancillary service, and demand response, PJM also publishes FTR and bidding information to the market. This information is refreshed timely with different frequencies from several minutes to annual. Financial transmission rights (FTR) are offered to the market through auctions to help participants to eliminate the LMP differences due to transmission constraints. The FTR auction result is published monthly [35]. Bidding information is disclosed with delay, because rivals could predict the participants’ bidding strategy by time series methods with the un-delayed bidding information [36]. To protect the privacy of market participants, bidding information is published with a several month delay in PJM. The information disclosed by PJM is listed in Table 2.

3.1.2. Information Disclosure in Other Electricity Markets with Poolco Model

US Federal Energy Regulatory Commission (FERC) issued a standard market model to be commonly adopted by all wholesale power markets in USA [26,39]. PJM, Electric Reliability Council of Texas (ERCOT), and ISO New England (ISONE) adopt this model, which contains centralized energy markets, ancillary services, and FTR, etc. With a similar market structure and clearing model, the information disclosed by ERCOT and ISONE are in accordance with that of PJM, including load information, grid information, price information, ancillary service information, and bidding information [40,41]. The comparison of information disclosed between PJM, ERCOT, and ISONE is presented in Table 3.
As shown in Table 3, the categories of information published by these markets are similar. However, the details of the information disclosed in these markets are different. For example, unlike seven-day load forecasts disclosed in PJM, ISONE publishes three-day load forecasts, whereas ERCOT publishes day-ahead load forecasts. Moreover, the bidding information is published with a masked ID in PJM and ISONE. ERCOT only publishes aggregated bidding information.

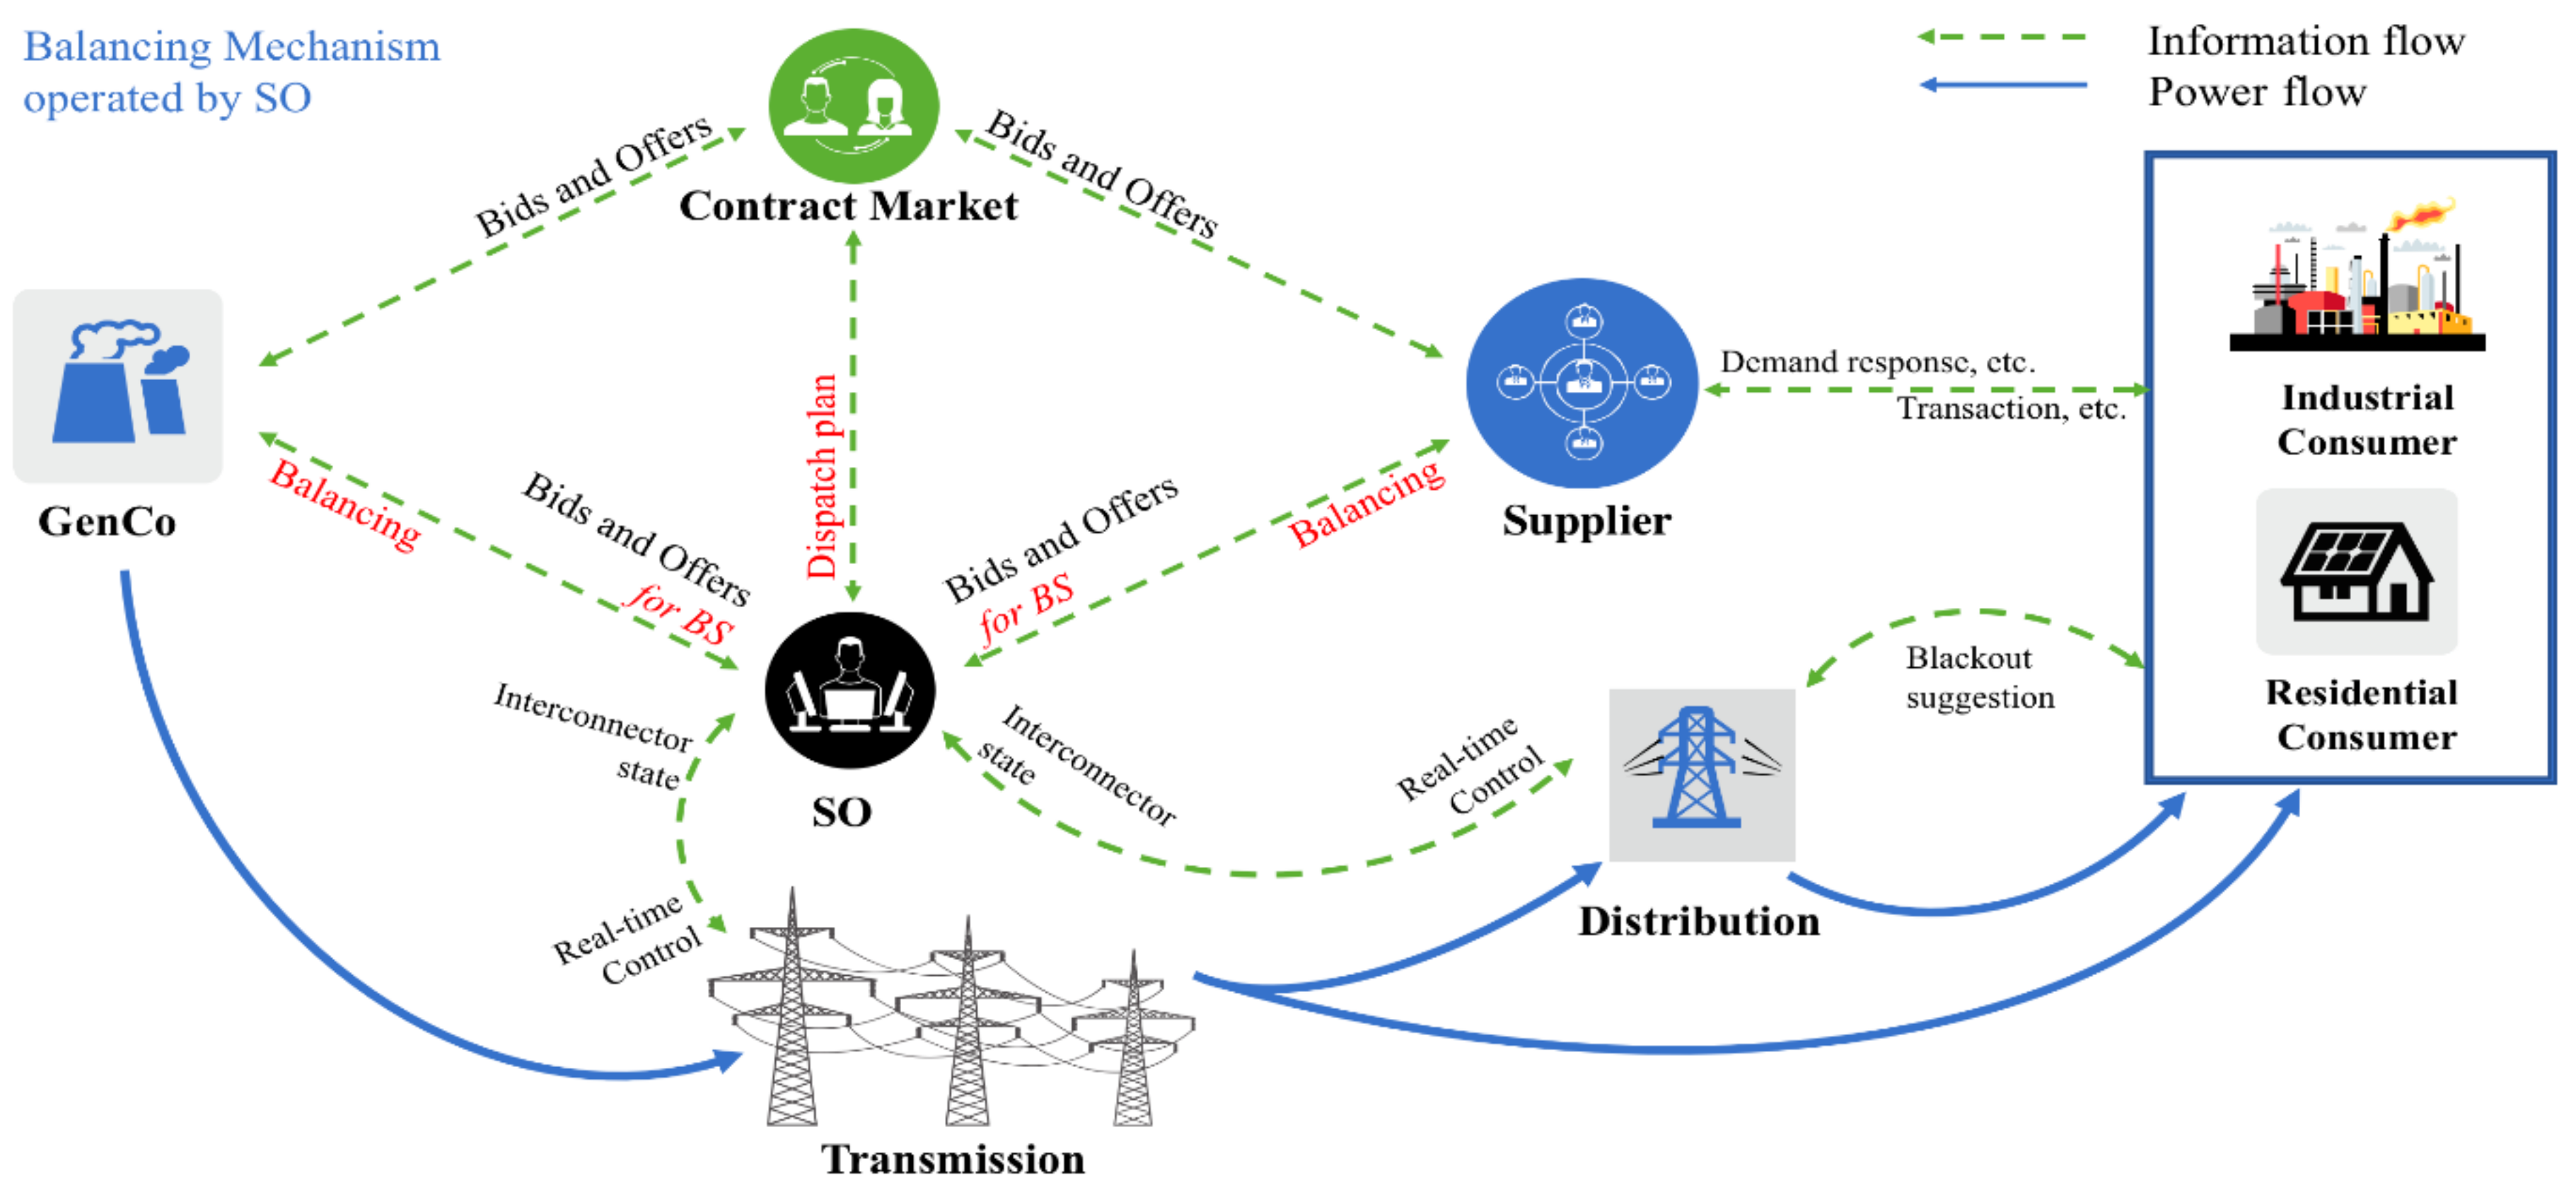
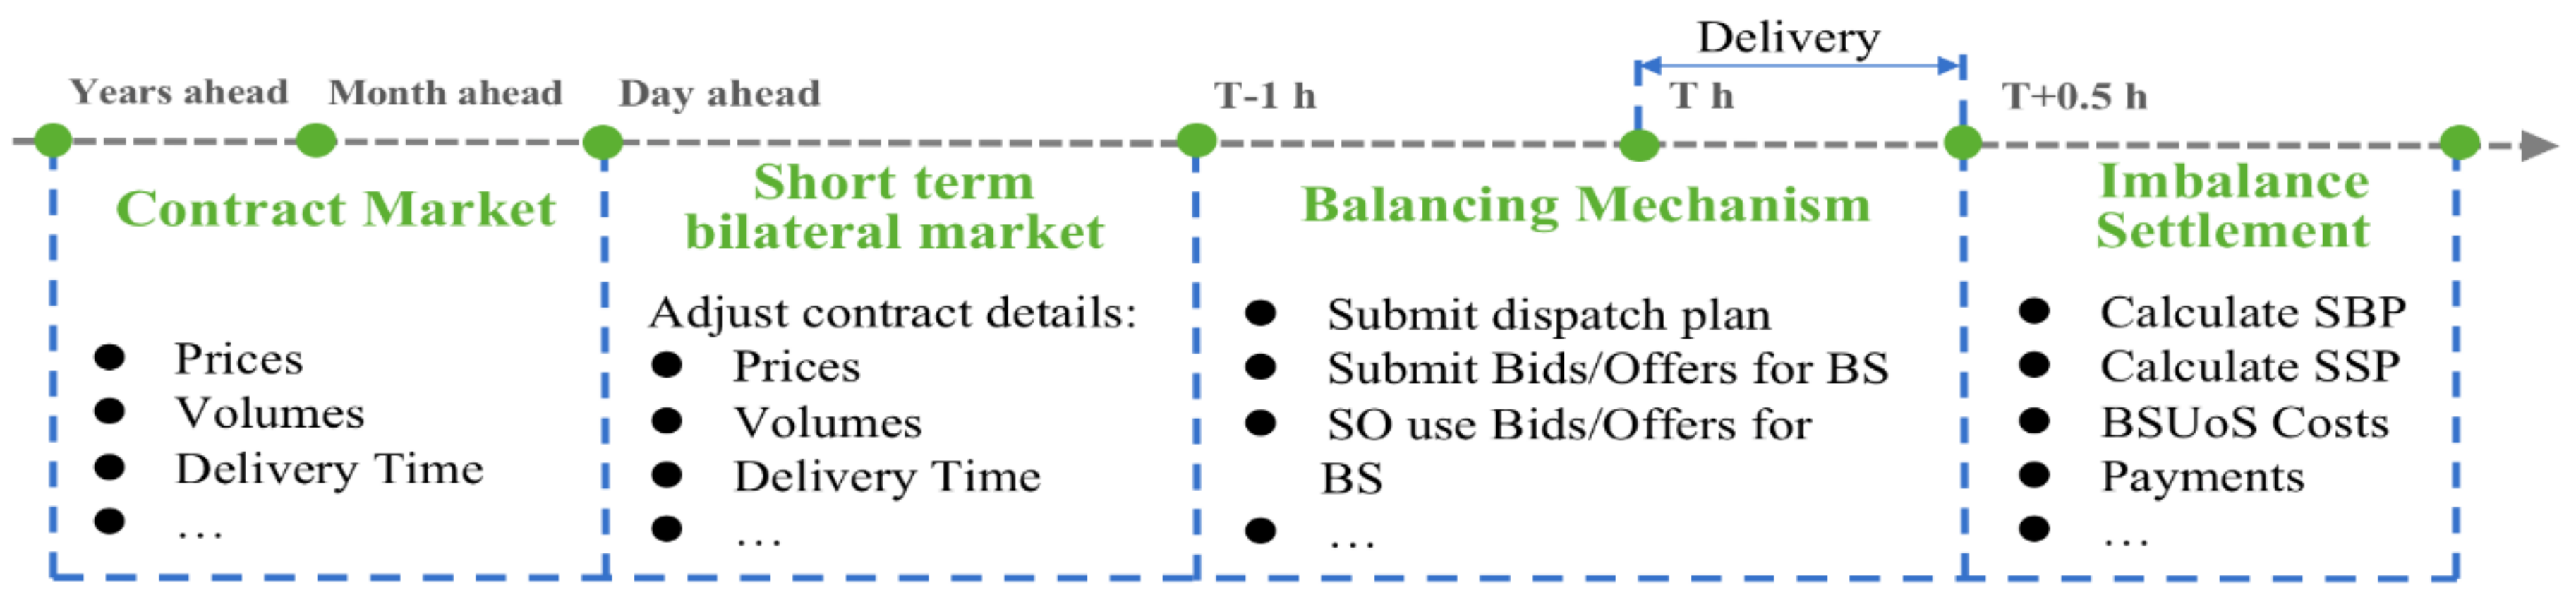
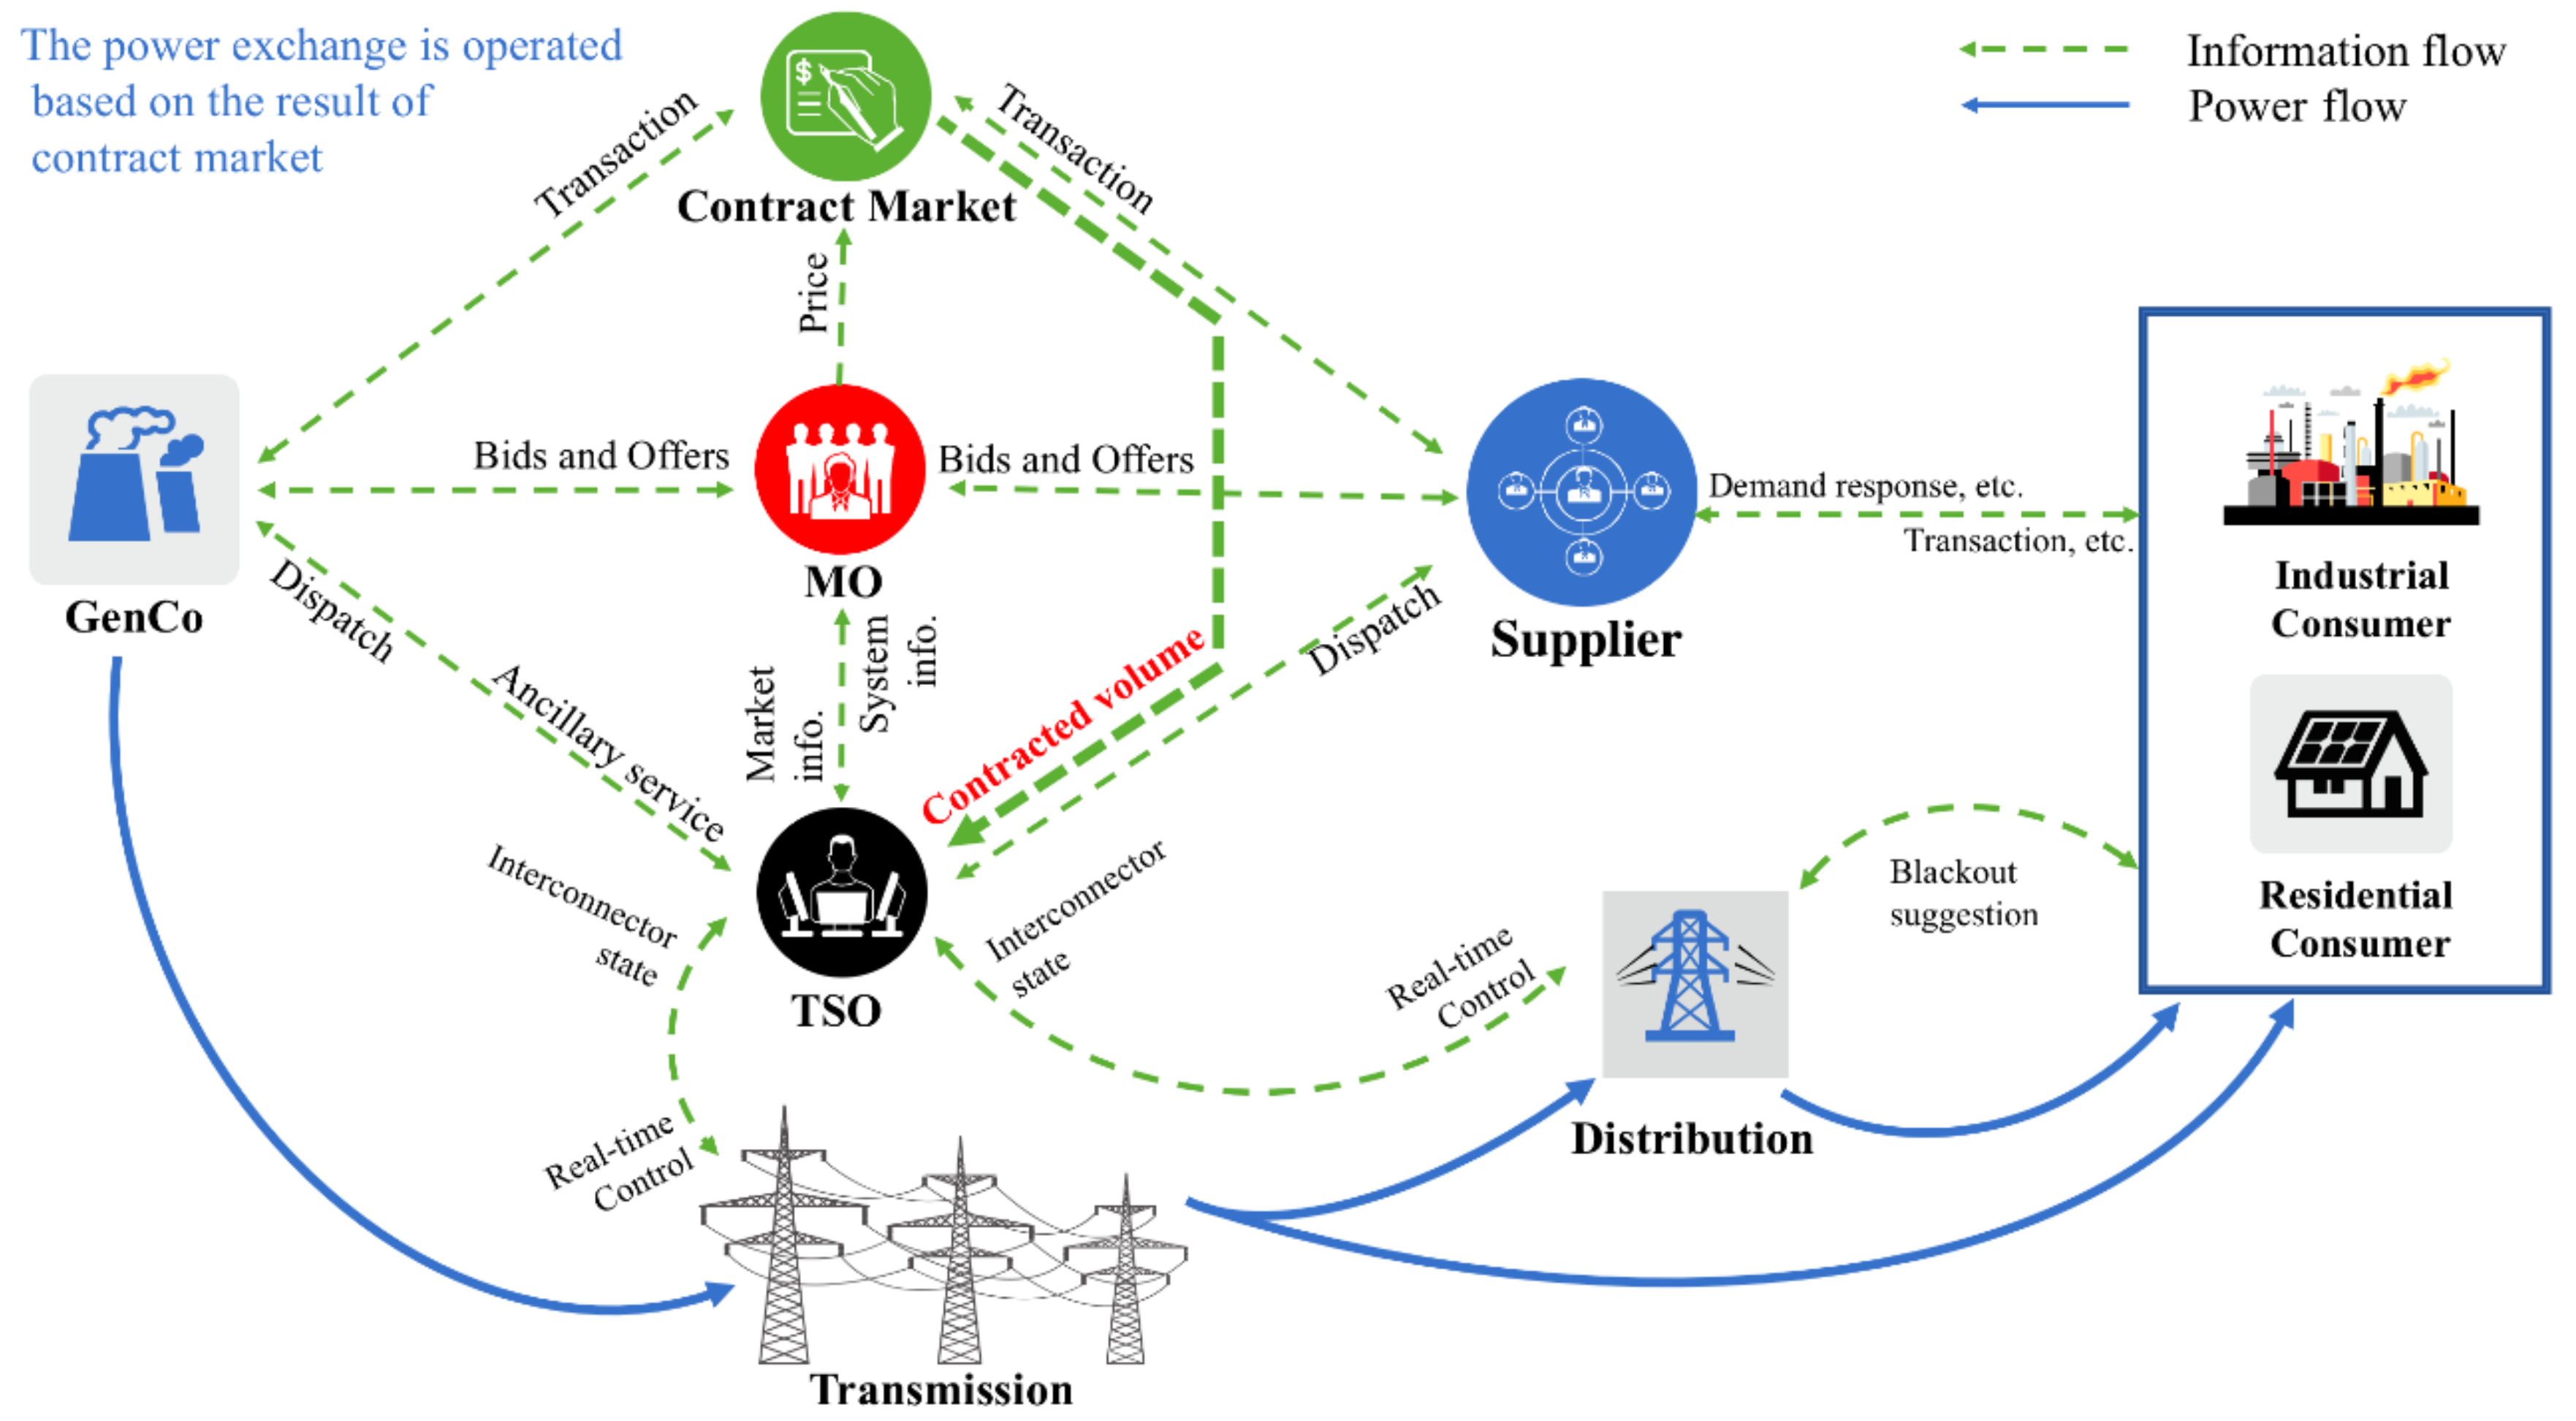
3.2. Bilateral Contract Model
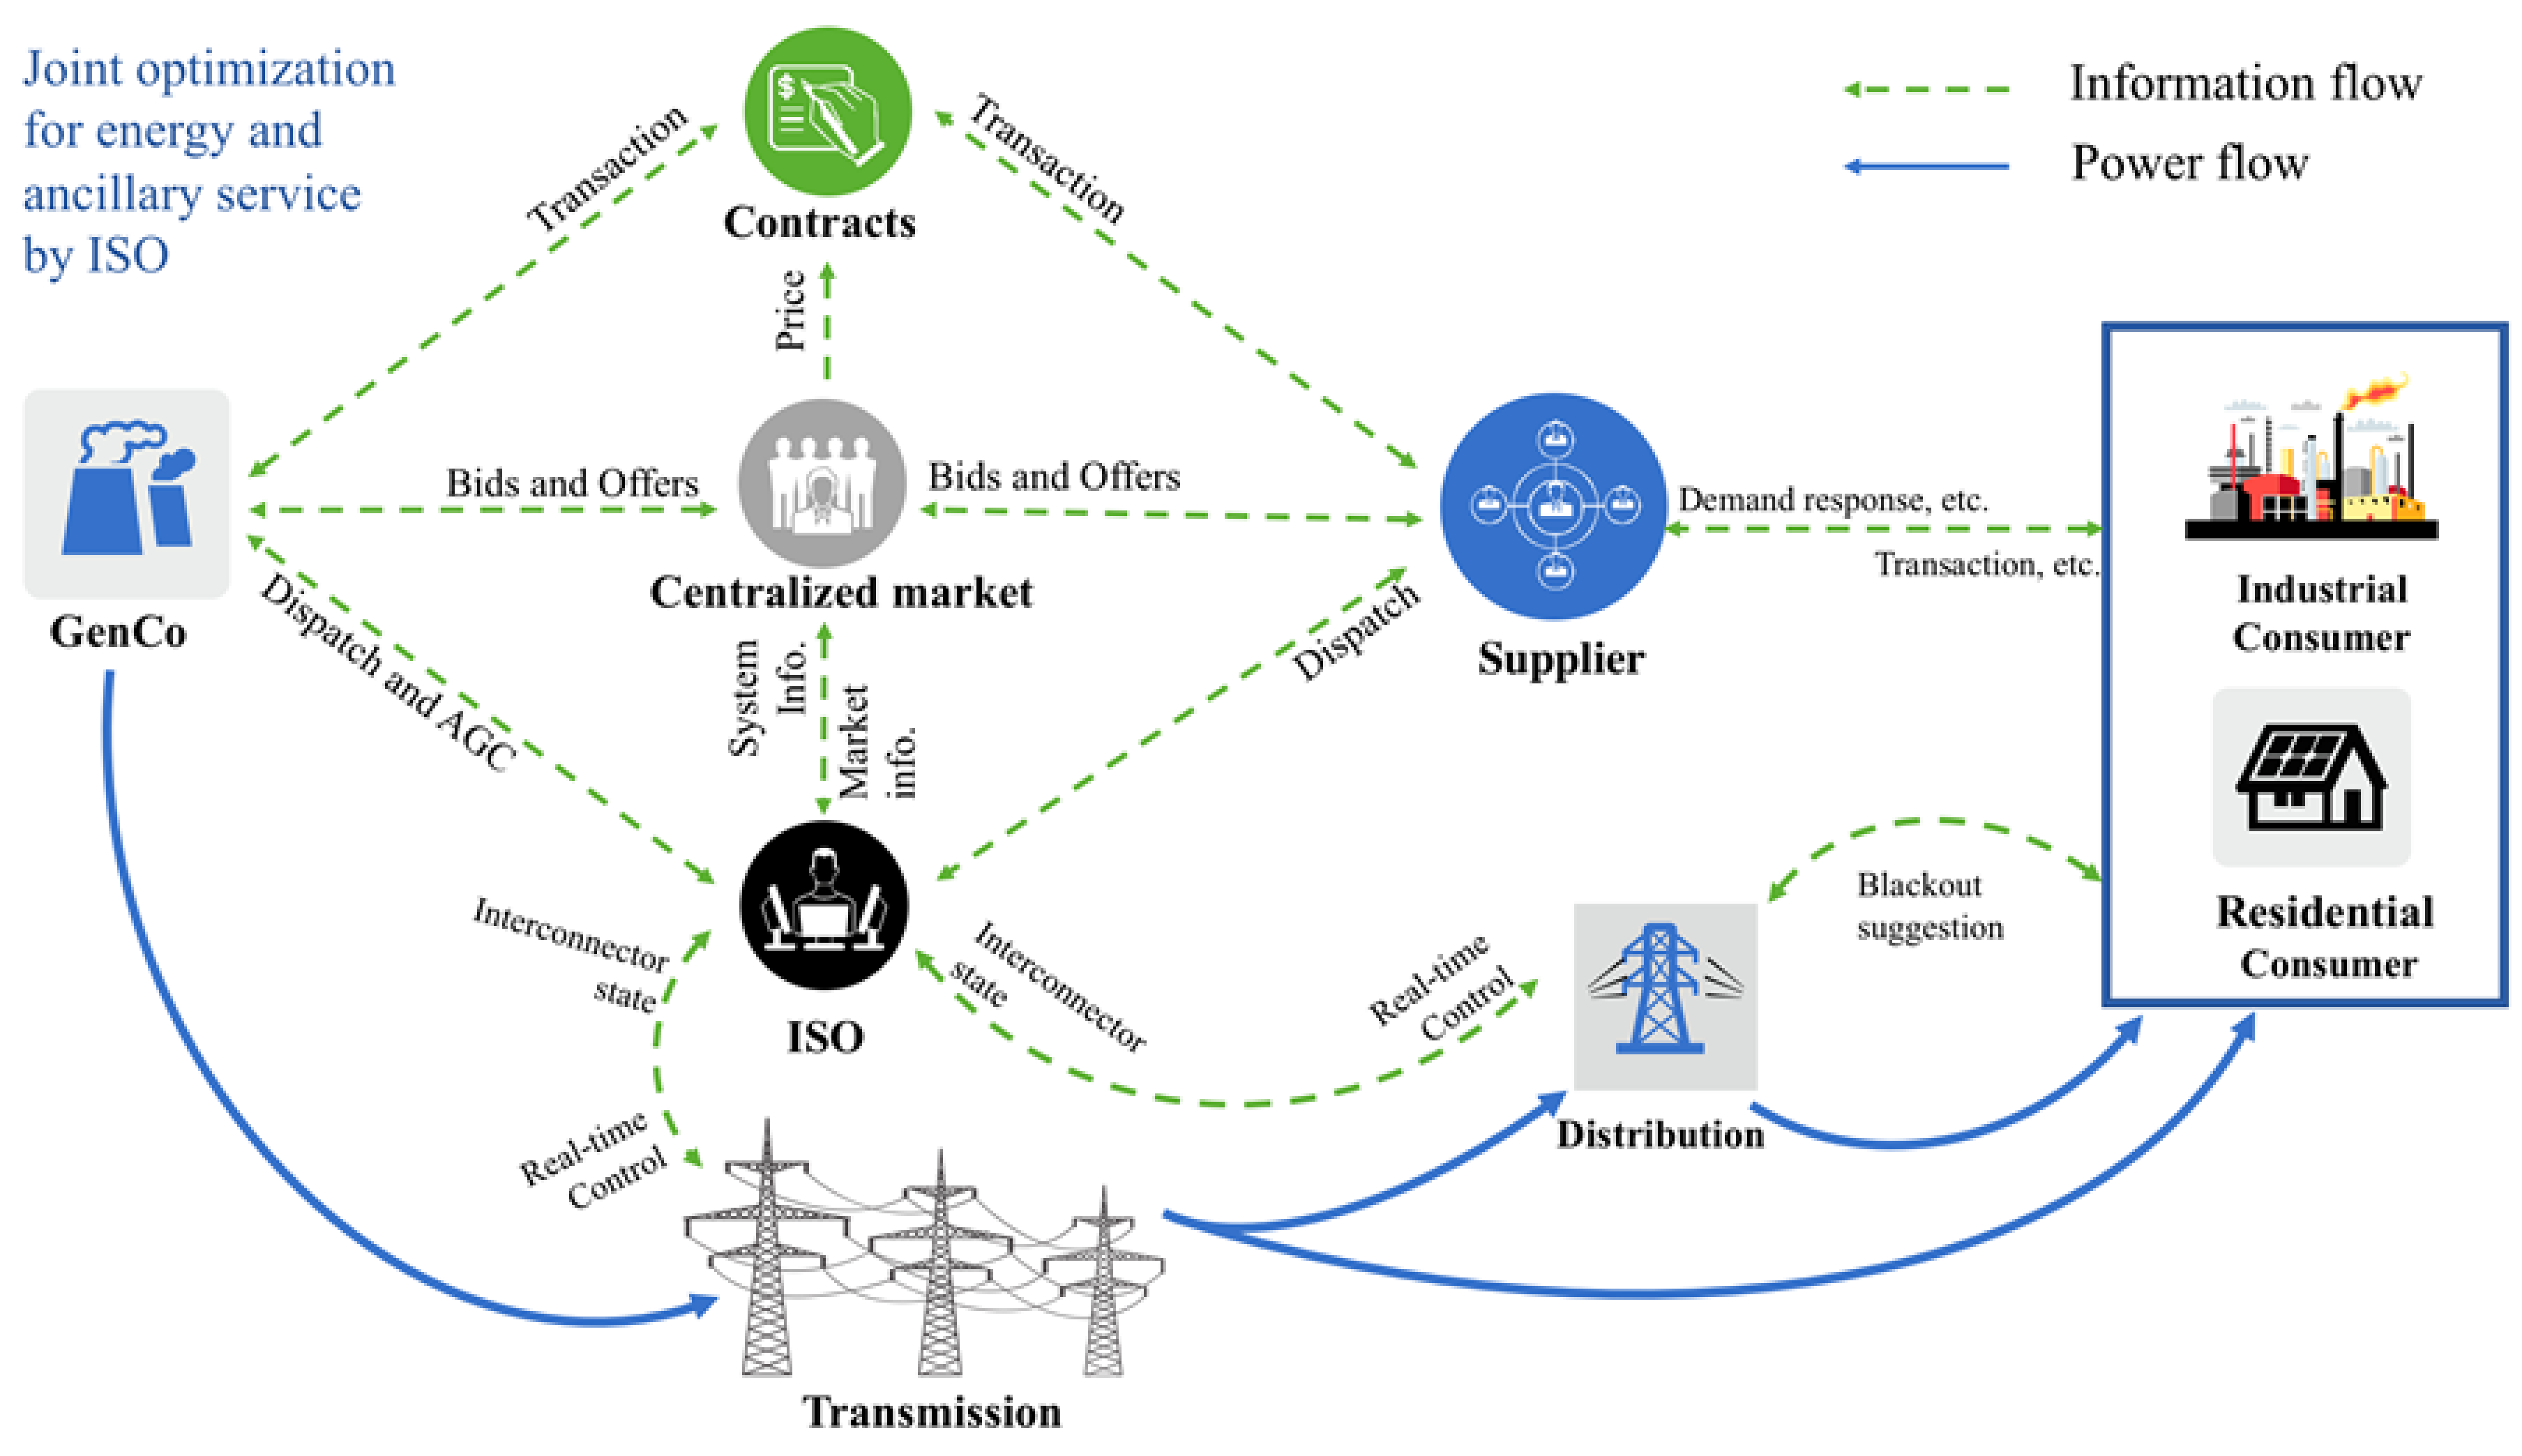
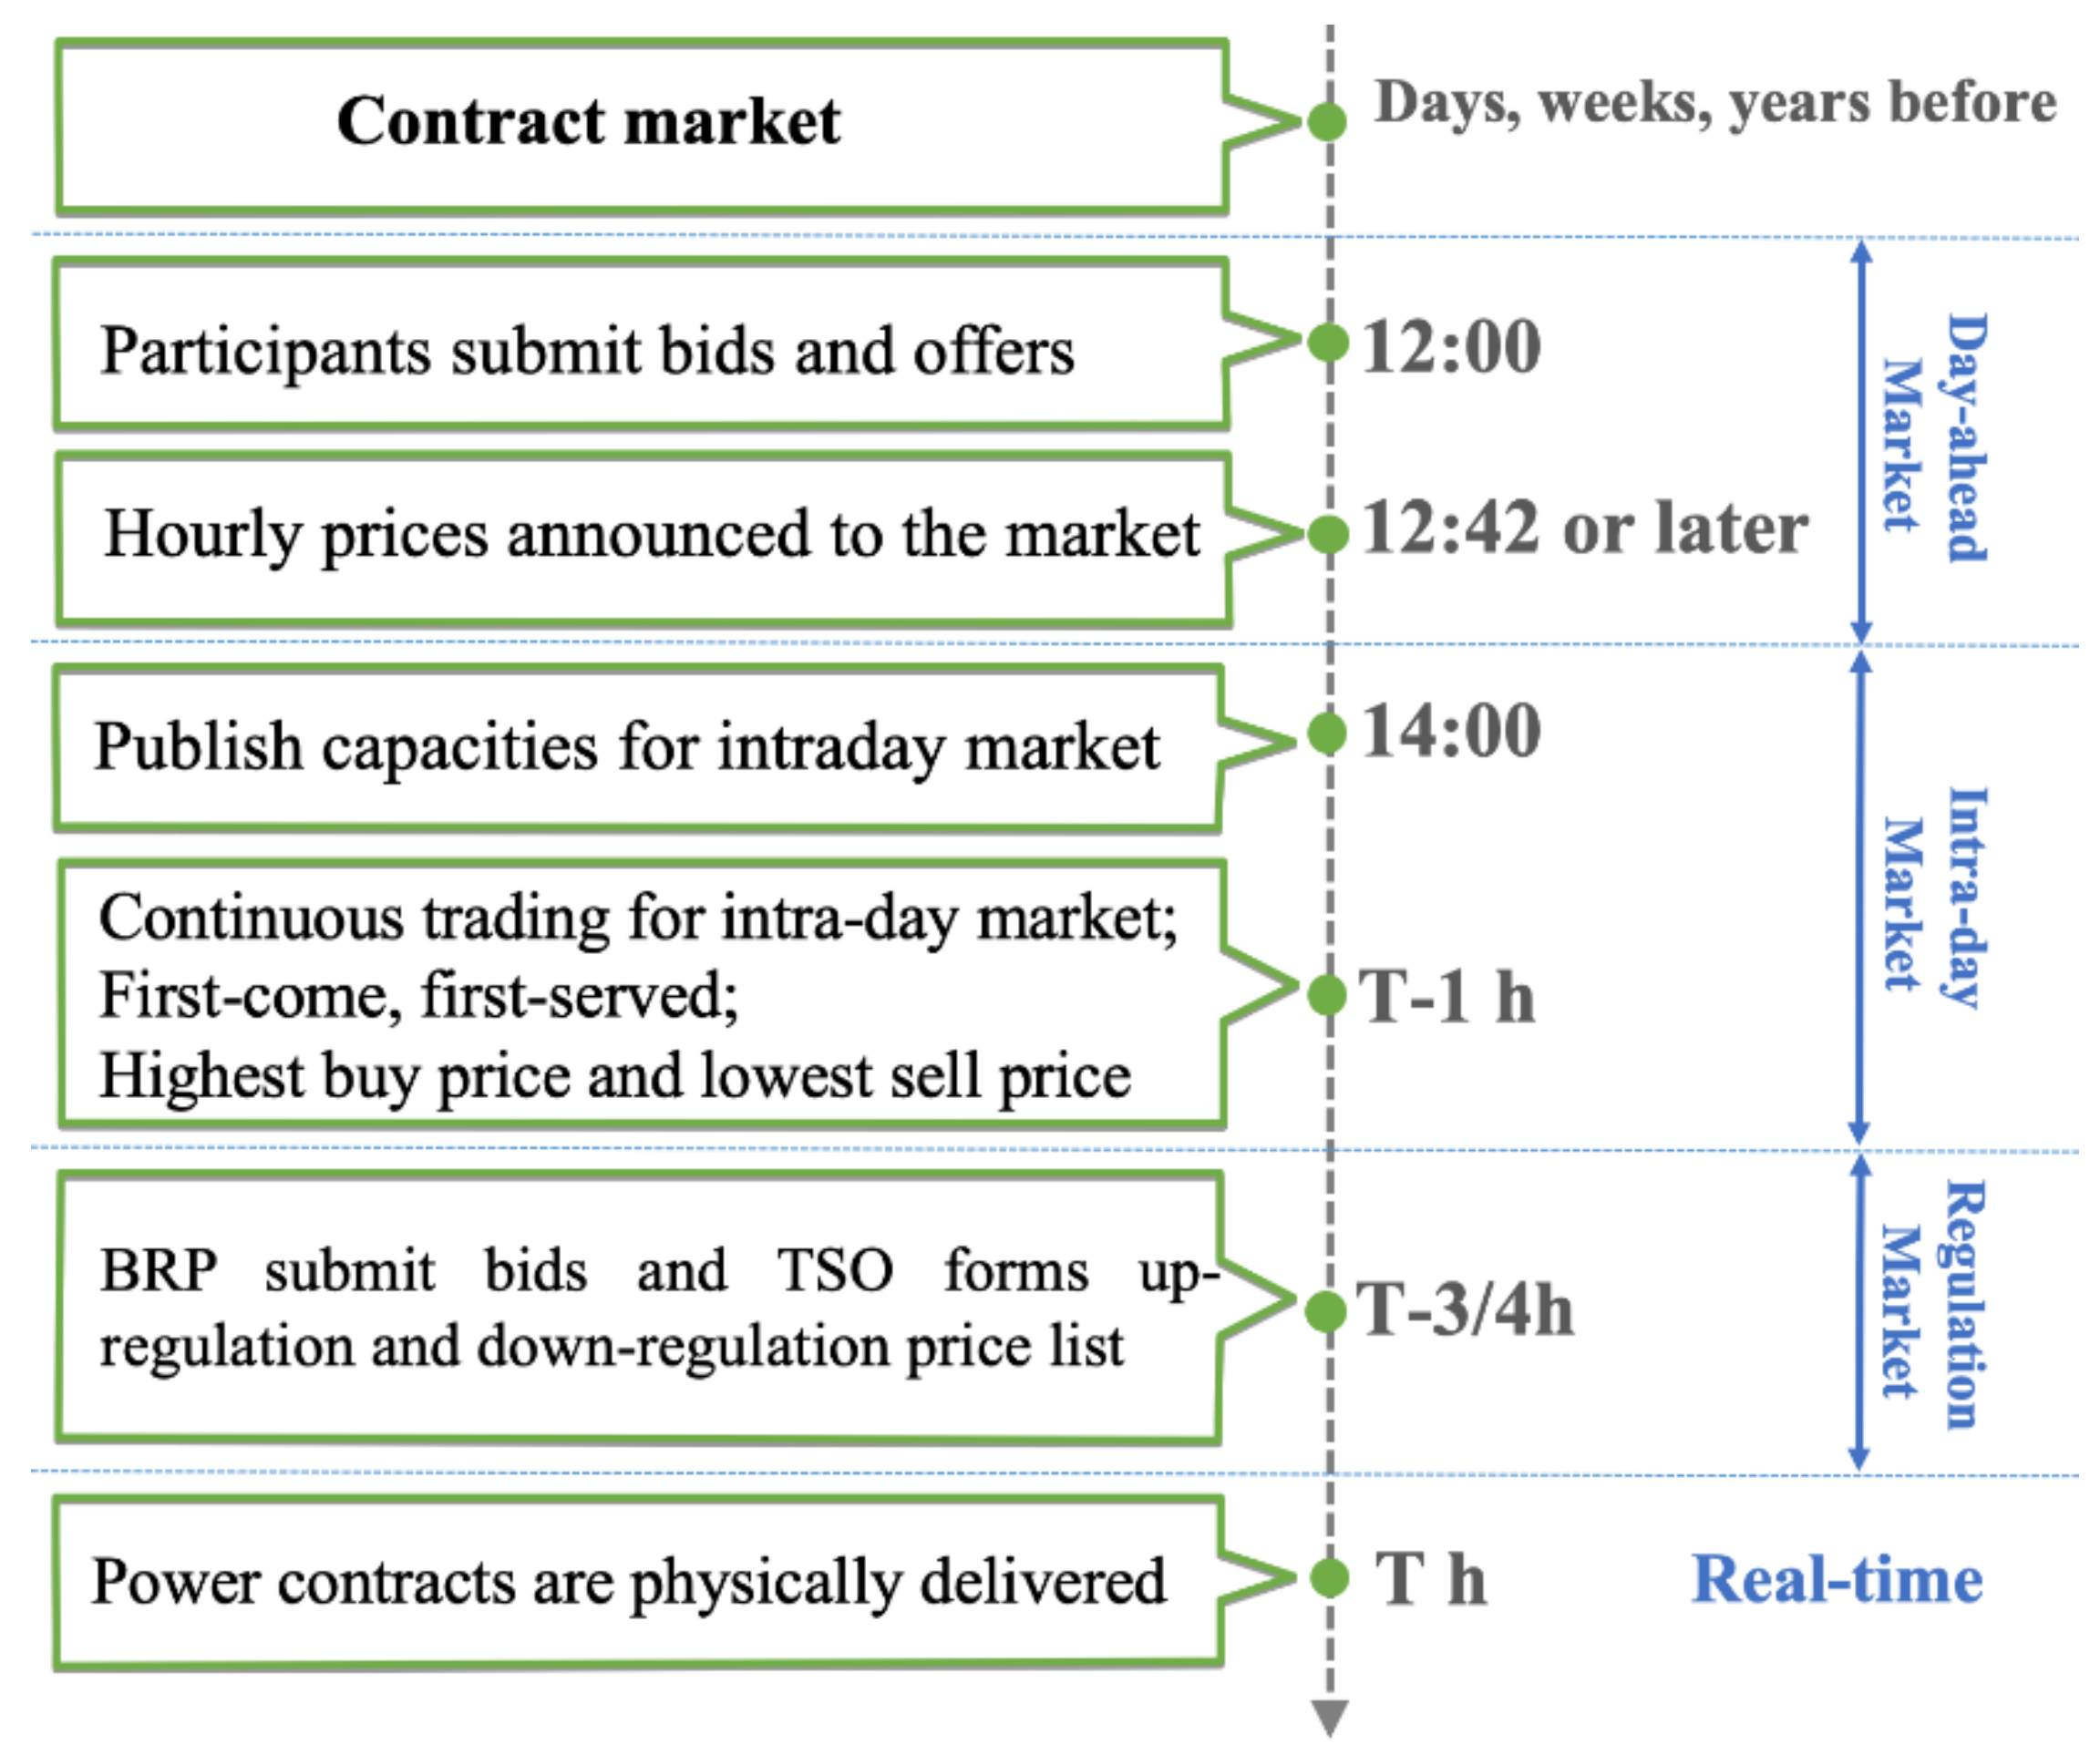
In the bilateral contract market, buyers and sellers can contract directly without entering a pool. At a certain time before electricity delivery, participants are required to inform the SO how generation and their contracted demand counterparties will be arranged [44]. Due to power flow congestion or contingencies, electricity contracts may not be delivered precisely according to the bilateral contracts in the real-time operation. Buyers and sellers will need to supply bids and offers for the balancing service (BS). Based on bids and offers, SO will implement the balancing mechanism (BM) to maintain real-time energy and system balance. Figure 4 shows the framework for the bilateral contract model.
The British Electricity Trading and Transmission Agreements (BETTA) adopt the bilateral contract model. The operation of BETTA is composed of four parts: Contract market, short-term bilateral market, balancing mechanism, and imbalance settlement (IS). Figure 5 shows the transaction process of BETTA [45].
In the contract market, participants are permitted to sign contracts in advance from days to years before the electricity delivery [46]. In short-term bilateral market, market participants can adjust their contracts according to the change of load requirements. Generators and suppliers are required to submit their final contracts to National Grid as the System Operator (SO) one hour before the real-time delivery. The contract information is not disclosed to protect participants’ confidentiality. Generators and suppliers may also submit bids and offers for the prices they would charge or pay for varying their generation or supply in the half-hour settlement period. Some of these bids and offers will be accepted by the SO for the energy balancing actions, which will be introduced in the following mathematical model.
During the period of BM, the SO will apply balancing actions to keep the reliable operation of power system. There are two types of balancing actions: Energy imbalance action and system imbalance action [47]. Energy imbalance action tackles the overall mismatches between generation and demand of the whole power system during the half-hour settlement period [48]. Energy imbalance actions mainly include bids and offers accepted in the BM. They may also include some of the utilization of the short term operating reserve (STOR). STOR is the increased generation or reduced demand in the case of generation unavailability or actual demand being greater than forecasted. The energy balance settlement is administered by ELEXON who publishes on the information disclosure platform energy balance information, including volumes and prices of bids and offers and STOR utilization. System imbalance action tackles local or regional constraints in the capacity of the transmission network, or short-term variations between demand and supply within a settlement period [48]. Even if total generation and demand are matched, system imbalance could take place because of transmission congestion, voltage deviation, and stability requirements. If congestion exists, the SO will change generation or demand in specific locations during the settlement period. The SO assigns contracts with market participants for the change of generation and demand. Reactive power services are also provided by generating units or other assets to maintain voltage levels. The contracted energy volume for changed generation and demand as well as the reactive energy volume for each settlement period are published.
Besides the above energy balancing actions, the SO manages system balance through bids (decrease generation or increase consumption) and offers (increase generation or decrease consumption) for the BS. The bids and offers are chosen by the SO, based on the following optimization model [49].
The objective function can be formulated as:
Min ( i = 1 N ( B G , i + Δ P G , i + B G , i Δ P G , i ) + j = 1 M ( B D , j Δ P D , j B D , j + Δ P D , j + ) )
where Δ P G , i + is the upward output of unit i with price B G , i + . Δ P G , i is the downward output of unit i with price B G , i . Δ P D , j + is the upward consumption of load j with price B D , j + . Δ P D , j is the downward consumption of load j with price B D , j . M being the number of loads.
It is subject to the following constraints:
Power balance constraints:
i = 1 N ( P G , i c + Δ P G , i + Δ P G , i ) j = 1 M ( P D , j c + Δ P D , j + Δ P D , j ) = 0
Line flow constraints:
F l min F l F l max
Generation limits:
P G , i min P G , i c + Δ P G , i + Δ P G , i P G , i max
Load limits:
P D , j min P D , j c + Δ P D , j + Δ P D , j P D , j max
Adjustment requirements:
Δ P G , i + , Δ P G , i , Δ P D , i + , Δ P D , i 0
where P G , i c is the contracted output of unit i , P D , j c is the contracted demand of load j . P D , j max and P D , j min represent the maximum and minimum demand of load j , respectively.
The input information of the model includes the contracted volumes at the delivery time, bids, and offers for BS, minimum and maximum output of units, transmission constraints, etc. The output information of the model includes the accepted offers and bids for the BS. Consequently, accepted offers will be paid with system buy price (SBP) and accepted bids will be charged with system sell price (SSP).
Besides the energy balancing information mentioned above provided by Elexon, the SO publishes information about system balancing activities such as bids and offers used in the BM to address constraints, ancillary services including reactive energy, STOR, and reserve requirements. Furthermore, the balancing activities will generate costs such as IT costs, operating costs and balancing service contract costs. The SO charges the balancing services use of the system (BSUoS) to recover the costs of its balancing activities. The BSUoS charge information is disclosed to the market. This information could provide effective guidance for the transaction of market participants. Table 4 shows the information disclosed in BETTA.

3.3. Hybrid Model

The hybrid model combines the characteristics of the poolco model and bilateral contract model. Hybrid electricity market provides customers with flexibility to buy electricity either from the pool or directly from suppliers in the contract market. Therefore, it could be more complicated to operate these two individual markets while keeping the security of power systems.
In the hybrid model, the transmission system operator (TSO) is required to arrange the generation schedules considering the contracted electricity capacity. After market participants submit bilateral contracts, the TSO will calculate the rest transmission capacity that will be allocated to the pool. The market operator (MO) applies the economic dispatch (ED) method to maximize total social welfare. The TSO applies contingency analysis to check whether the ED results satisfy security constraints. If not, the ED results will be adjusted. Adjustments should be minimized to approach the initial ED results as much as possible. However, the re-dispatching to alleviate congestion may result in significant deviation from optimality in practice [53,54]. Figure 6 shows the framework for the hybrid model.
One of the typical hybrid markets is Nord Pool where electricity is traded in a spot market with bilateral contracts [55]. Before the spot market opens, participants need to submit information about the bilateral contracts to the TSO to calculate the rest transmission capacity. The spot market is composed of the day-ahead market, intraday market, and real-time regulating market, which will be operated based on the transmission capacity left [56]. The clearing process of Nord Pool is shown in Figure 7.
Most of electricity handled by Nord Pool is traded on the day-ahead market. By 12:00, market participants submit hourly bids and offers for electricity that will be delivered on the next day [57]. All purchase and sell orders are aggregated into demand curve and supply curve for each delivery hour. The hourly system prices are determined by the intersection of the two curves [58]. If transmission capacity is sufficient, the system price is equal to the wholesale trading price in the Nordic area. However, transmission constraints are not always satisfied during the dispatch. As a result, zonal prices are formed to balance the power system and relieve congestion. The price zones of Norway, the largest among all regions in Nord Pool, have values of five. Sweden is divided into four price zones, whereas there is only one price zone in Finland, Estonia, Latvia, Lithuania, and two price zones in Denmark, respectively [59].
Zonal prices and dispatch plan are determined based on the optimization model in Equations (19)–(24). The input information of this model includes the contracted volumes, bids, and offers in the pool, minimum and maximum output of units, transmission capacities, etc. The output information includes the aggregated volumes bought and sold in each zone, zonal prices, and power flow, etc. The output information and transmission constraints are published in the information disclosure platform.
The objective function is to maximize the total social welfare, which can be formulated as Reference [60]:
max k = 1 K ( B D , k P D , k B G , k P G , k )
where k is the index of zones. K is the number of zones. P G , k is the quantity for aggregated energy offers of zone k with prices B G , k . P D , k being the quantity for aggregated demand bids of zone k with prices B D , k .
It is subject to the following constraints:
Zonal price formation:
{ B G , k P G , k = i Z k B G , i P G , i B D , k P D , k = j Z k B D , j P D , j , i , j Z k , k = 1 , , K
Power balance constraints:
k = 1 K i , j Z k ( P G , i + P G , i c P D , j P D , j c ) = 0
Generation constraints:
P G , i min P G , i + P G , i c P G , i max
Transmission constraints between different zones:
F l min F l F l max
Variable constraints:
P G , i c , P D , j c , P G , i , P D , j 0
where j is index of loads. Z k is the aggregation of units and loads in zone k . P G , i are the quantity for energy offer of unit i with prices B G , i and P D , j being the quantity for demand bids of load j with prices B D , j .
Hourly prices calculated in the day-ahead market are usually announced at 12:42 or later. Once market prices have been calculated, trades for each bidding area are settled. At 14:00, capacities available for intraday trading are published. Incidents may take place during the period between day-ahead market and real-time delivery. The intraday market provides chances for participants to trade volumes until one hour before the real-time delivery and brings the market back to balance. In this market, prices are set based on a first-come, first-served principle, where the best prices come from the first-highest buy price and lowest sell price [61]. With the volume bought and sold in the intraday market, the planed zonal flow, and the total scheduled flow will be continually updated and published to the market.
The regulating power market is designed to ensure the real-time power balance and system security, rather than to carry out electricity transactions [62]. The balance response parties (BRP) submit regulating bids consisting of volume and price. These bids can be submitted, adjusted, or removed until 45 min before the operation hour [63]. The TSOs will form a list with increasing prices for up-regulation and decreasing prices for down-regulation to clear the regulating market. The cleared regulation prices and volumes in each bidding area are published hourly. Furthermore, the volume of regulating bids, special regulation volume, and automatic activated reserve are also published to the market. Nord Pool publishes information generated during the clearing process after the transaction day. To reflect the situation of power system and provide investment signals, Nord pool also publishes information about power system such as production and consumption, electricity exchange between countries as well as hydro reservoirs. The disclosed market information is shown in Table 5.

4. Discussion and Summary

As introduced in previous sections, there is a widespread commitment to the necessity of information transparency among market participants and policy makers. Several issues about information disclosure are discussed here:

4.1. Categories of Disclosed Information

Based on the description of the three typical markets, the information disclosed is mainly divided into the following categories: Generation information, grid information, load information, price information, and bidding information.
Grid information helps market participants understand the development tendency of power system, which provides a reference to the investment of power system. For example, publishing congestion information can guide the investment in electricity network to increase transmission capacities. Load information informs market participants of the peaks and valleys of the power system and guides users to optimize electricity consumption behavior. Together with forecasted wind turbine outputs under various periods, forecasted load information can guide the SO to arrange the dispatch plan. Price is the key information to guide the optimal allocation of resources. Moreover, transaction settlement is based on the precise and timely price in electricity market. With different levels of congestion, the electricity price is mainly divided into three types: Uniform price, zonal price, and nodal price [65]. The typical regions that adopt nodal prices are mainly located in USA, including PJM, NYISO, ISONE and ERCOT. There are also typical regions adopting zonal prices, such as Nord Pool and Australia’s National Electricity Market. As for uniform price, one typical region is BETTA [66]. Bidding information enables supervisors to analyze the existence of market power. Besides, publishing the bidding information enables participants to simulate the operation of electricity market and be more aware of the market clearing process. Based on the previous analysis, an empirical summary of information disclosed in the electricity market is shown in Table 6.

4.2. Relationship between Information Disclosure and Market Model

The poolco model is designed to optimize market economic efficiency considering the security of power system. The clearing results are based on a joint optimization of energy and ancillary service to find the optimal allocation of resources, which requires detailed and precise input information including bids and offers, congestion, ancillary service, and load information, etc. As a result, the clearing results contain detailed information, including dispatch plan, ancillary service volume and price, power flow, and LMPs, etc.
The bilateral contract market emphasizes the rights to trade directly between buyers and sellers who can self-dispatch their generation and consumption while submitting incremental bids and offers to the SO for real-time balance. The responsibility of SO, instead of organizing total energy volume trades, is to keep the energy balance and to maintain the security of power system by using the incremental energy bids and offers, as well as ancillary services. In BETTA, the energy balance and power system security are achieved through joint optimization in the process of BM. However, the clearing process for energy balance and system balance are separately run by Elexon and the SO, respectively. Disclosed information is generated during the process of BM and provided by these two parties.
The hybrid model combines the characteristics of bilateral contract model and poolco model. In hybrid model, clearing results are obtained based on the information from bilateral contracts and power pool. The input information includes information from energy market, regulation market, bilateral contracts, etc. The output information includes electricity volumes and prices for the energy market and regulation market, etc. It can be found that the disclosed information can reflect the results of pool and bilateral contracts.
Due to the difference of clearing models and transaction methods in electricity markets, the input information and output information varies. Therefore, the information generated during the operation of the electricity market varies accordingly, as shown in Table 6. This is the reason why the information disclosure mechanism is related to market models.
In the future, power systems are expected to have two main characteristics [67]. First, a growing portion of the energy supply will be more volatile in real-time. Second, the distributed energy resources will raise challenges for system operators to maintain the balance between generation and demand of the whole system. The information disclosure mechanism should be evolved to cope with these challenges. First, publishing the eco-label of electricity producer is becoming necessary. Recent experience shows that many customers are willing to pay more for renewable energy [16]. Eco-labeling of electricity can help customers to find renewable energy producer and foster the transaction of renewable energy. Second, information should be refreshed more frequently to cope with the fast-changing energy supply. For example, load forecast information and wind output information can be forecasted and disclosed to the market with a higher frequency. Third, information about energy storage and demand-side response should be integrated into the information disclosure mechanism.

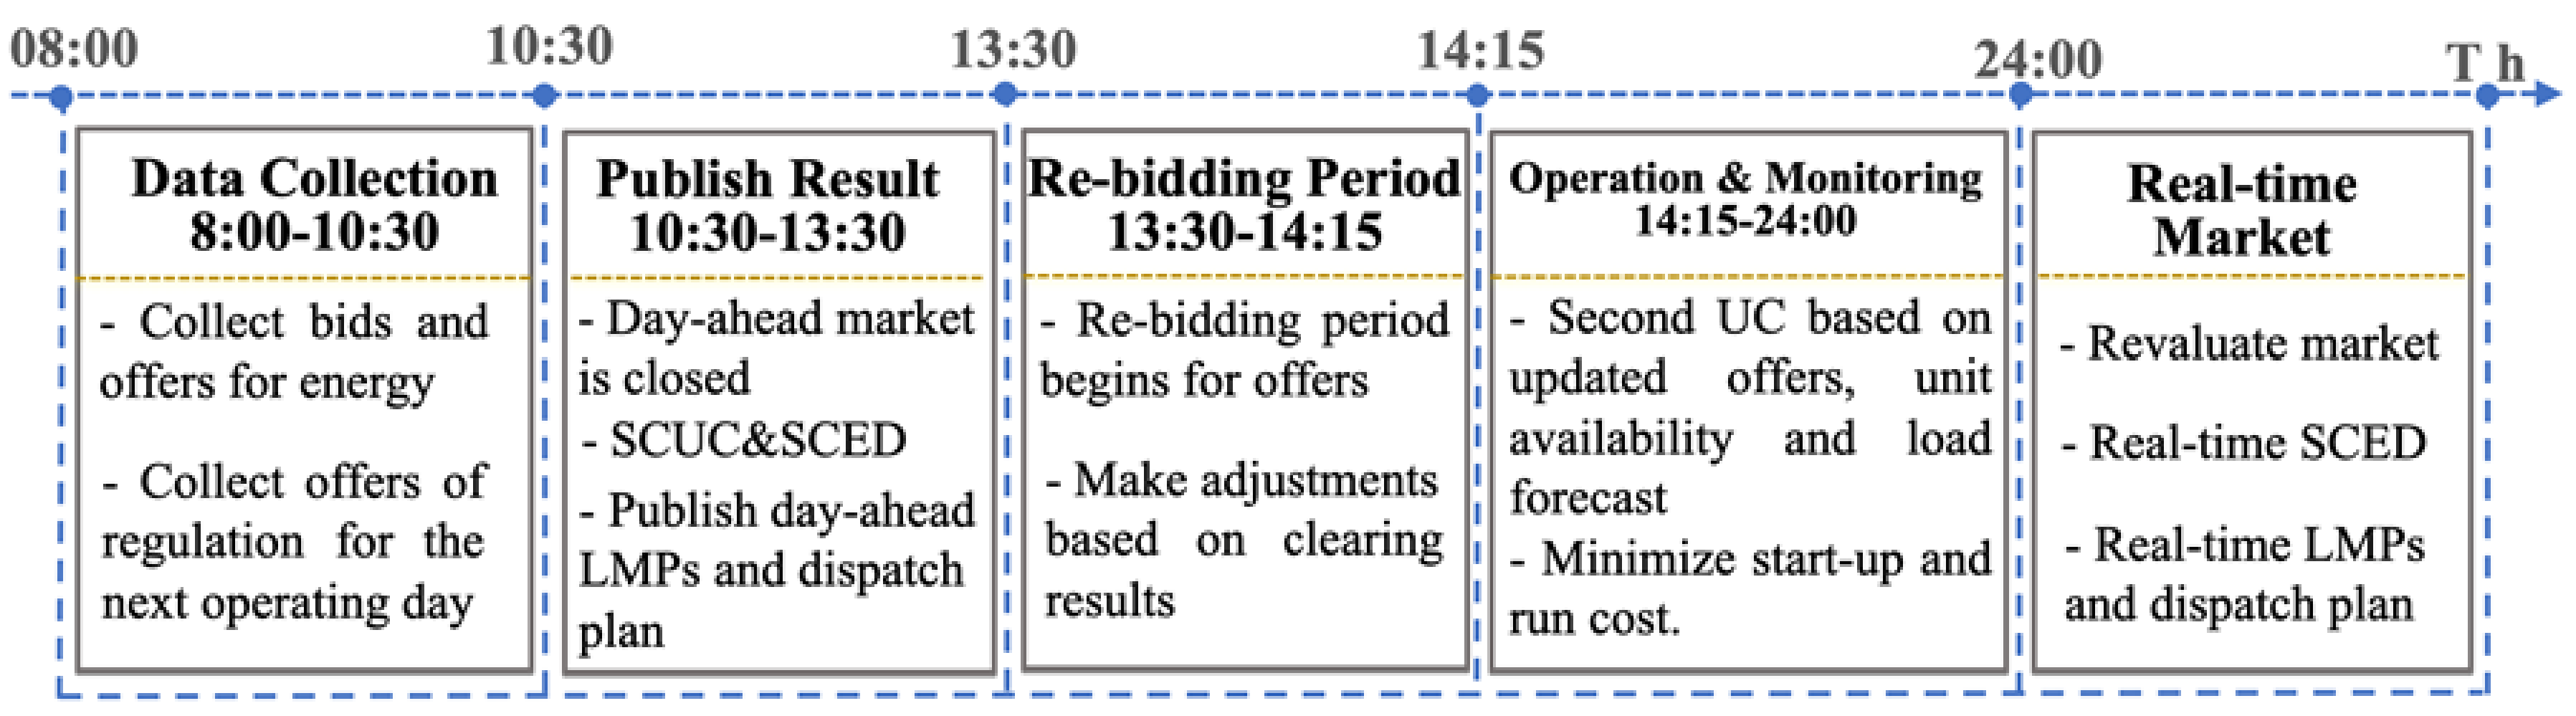
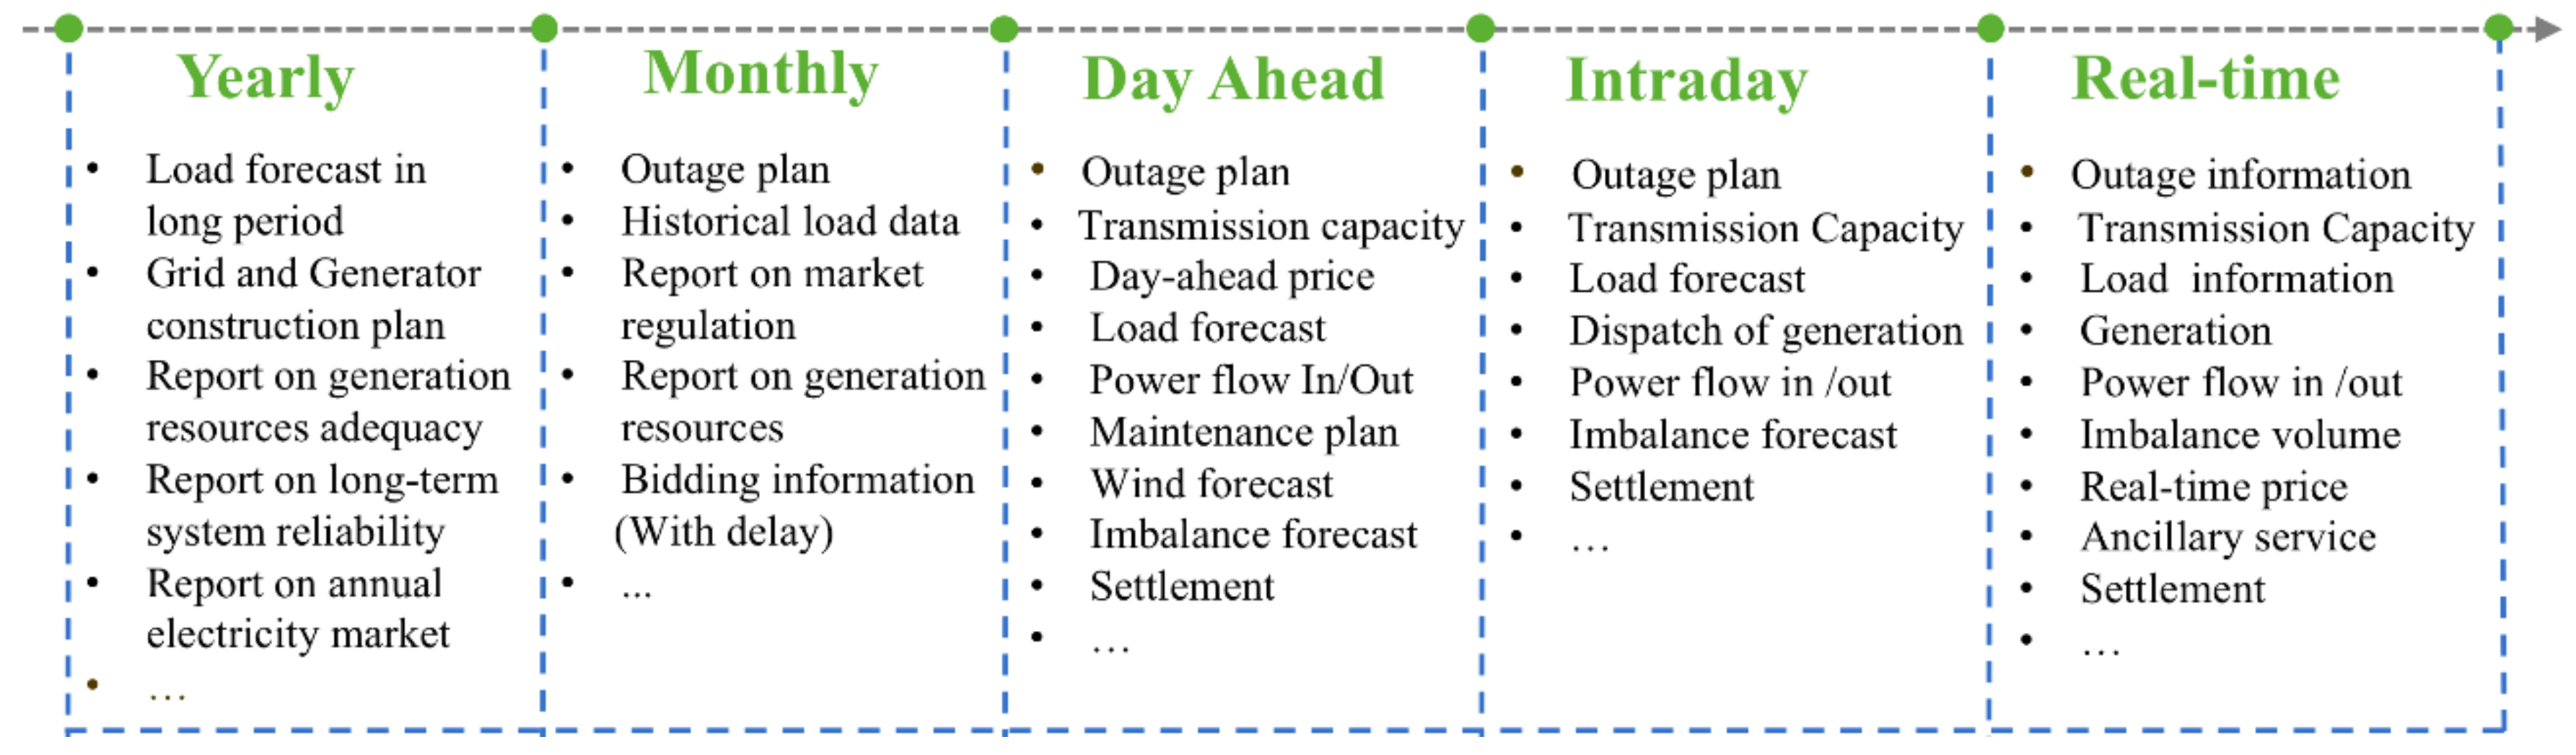
4.3. Information Disclosure Occasion

Information can be divided into ex-ant and ex-post information. Forecasting information is released in advance to facilitate the formation of market participants’ bidding strategy. The information containing clearing results is released right after the clearing process. Market reports, which provide important references to market participants, should be released and updated frequently. Since the information disclosure process differs in various electricity markets, a general timeline for the information disclosure process is illustrated in Figure 8.
Furthermore, the electricity market information should be disclosed in a timely manner to market participants in accordance with procedures prescribed by market rules. Many electricity transactions have very strict requirements on transaction speed, which requires that the issuing and delivery time be up to a certain standard. Otherwise, the information obtained will be expired and there will not be enough time to make transaction decisions for market participants. Therefore, it is necessary to publish the market information as soon as possible, such as electricity price information, to ensure the timeliness of information. In addition, electricity market reports and new policies need to be announced frequently, such as market surveillance reports and power system planning report so that participants can better understand the current situation of market.

4.4. Extent of Information Disclosure

Whether a piece of information should be disclosed deserves careful assessment. Market designers need to carefully define the boundary of transparency and confidentiality, to prevent it as an excuse to reject disclosing information to the public.
Certain information regarding individual market member’s activities may be commercially sensitive and its disclosure may lead to disadvantage to participants. This is an important consideration in making relevant information available in a non-discriminatory manner [68]. Information that could threaten the competitiveness of the market or system security should be disclosed with enough delay or with some filtering such as anonymization. One solution is hiding the ID numbers, names, or identifiers when publishing sensitive information that could be used to speculate the rival’s confidential information.
Even though the publishing market information is widely approved, excessive information disclosure may be harmful and even bring information asymmetries [69]. Excessive information might lead to a collusion in bidding price and increased electricity prices, which may lead to market failure [70,71]. Furthermore, excessively disclosed information with poor structure makes it difficult for market participants to retrieve information relevant for their business decision. This will reduce market efficiency. One solution is publishing information under clearly demarcated dimensions, such as disclosure time, information categories, and information origin.

5. Conclusions

This paper reviews the information disclosure mechanism in different market models, including the poolco model, bilateral contract model, and hybrid model. The information disclosure mechanism is essential for a transparent and efficient electricity market. Besides, the information disclosure mechanism is closely related to market model. Most of the disclosed information are the input and output data of market clearing model. Hence, different market models, which have different input and output information, leads to different information disclosure methods. It can be found that generation information, power system information, load information, ancillary service information, and price information are disclosed in most electricity markets. However, details of this information, such as disclosure occasion, disclosure frequency, and anonymization, vary greatly because of difference in the trading, operation, and settlement of market models. Moreover, the extent of information disclosure, the information disclosure occasion and the corresponding disclosure method should be carefully examined to improve market transparency and protect participants’ confidentiality. Furthermore, as the renewable energy and distributed energy resources are increasingly integrated into power systems, the information disclosure mechanism should be evolved to cope with these changes. This paper aims to provide a helpful reference for establishing information disclosure mechanism in the design of a new electricity market as well as improving such a mechanism in existing markets.

Author Contributions

Conceptualization and methodology by Y.D. and Y.Y.; validation and writing by Y.Y., M.B., Y.D. and Z.L.; supervision by Y.S.

Conflicts of Interest

The authors declare no conflict of interest.

Nomenclature

Acronyms
GenCogeneration companies
SOsystem operator
ISOindependent system operator
TSOtransmission system operator
MOmarket operator
LMPlocational marginal prices
UCunit commitment
SCUCsecurity constrained unit commitment
SCEDsecurity constrained economic dispatch
FTRfinancial transmission right
BSbalancing service
BMbalancing mechanism
ISimbalance settlement
STORshort term operating reserve
SBPsystem buy price
SSPsystem sell price
BSADbalancing service adjustment data
BRPbalance response parties
FERCFederal Energy Regulatory Commission
PJMPennsylvania-New Jersey-Maryland interconnection
BETTABritish Electricity Trading and Transmission Agreements
NGCNational Grid Company
Variables and parameters
i generating unit index (subscript)
j load index (subscript)
t period index (subscript)
l transmission line index (subscript)
k zone index (subscript)
T number of periods
N number of generating units
M number of loads
K number of zones
Z k aggregation of nodes in zone k
P i , t quantity for energy offer of unit i at period t
P D , t total forecasted load at period t
P G , i c contracted output of unit i
P D , j c contracted demand of load j
Δ P G , i + upward outputs of unit i
Δ P G , i downward outputs of unit i
Δ P D , j + upward demand of load j
Δ P D , j downward demand of load j
P G , i max maximum output of unit i
P G , i min minimum output of unit i
P D , j max maximum demand of load j
P D , j min minimum demand of load j
I i , t UC decision of unit i at period t
R i , t quantity for reserve offers of unit i at period t
B G , i price for energy offer of unit i
B D , j price for demand bid of load j
F l power flow of transmission line l
F l max power flow upper limit of transmission line l
F l min power flow lower limit of transmission line l

References

  1. Jamasb, T.; Pollitt, M. Electricity Market Reform in the European Union: Review of Progress toward Liberalization & Integration. Energy J. 2005, 26, 11–41. [Google Scholar]
  2. Sioshansi, F.P.; Pfaffenberger, W. Electricity Market Reform: An International Perspective; Elsevier: Amsterdam, The Netherlands; Boston, MA, USA, 2006. [Google Scholar]
  3. Stoft, S. Power System Economics: Designing Markets for Electricity; IEEE Press, Wiley-Interscience: Piscataway, NJ, USA; New York, NY, USA, 2002. [Google Scholar]
  4. Lin, J.; Magnago, F.H. Design, Structure, and Operation of an Electricity Market, in Electricity Markets: Theories and Applications; John Wiley & Sons, Inc.: Hoboken, NJ, USA, 2017; pp. 173–209. [Google Scholar]
  5. Van der Veen, R.A.C.; Hakvoort, R.A. The electricity balancing market: Exploring the design challenge. Util. Policy 2016, 43, 186–194. [Google Scholar] [CrossRef]
  6. Biggar, D.R.; Hesamzadeh, M.R. The Economics of Electricity Markets; Wiley: Hoboken, NJ, USA, 2014. [Google Scholar]
  7. Bower, J.; Bunn, D.W. Model-Based Comparisons of Pool and Bilateral Markets for Electricity. Energy J. 2000, 21, 1–29. [Google Scholar] [CrossRef]
  8. Shahidehpour, M.; Alomoush, M. Restructured Electrical Power Systems: Operation, Trading, and Volatility; M. Dekker: New York, NY, USA, 2001. [Google Scholar]
  9. Sioshansi, F.P. Competitive Electricity Markets: Design, Implementation, Performance; Elsevier: Amsterdam, The Netherlands, 2008. [Google Scholar]
  10. Chao, H.; Huntington, H.G. Designing Competitive Electricity Markets; Springer: Boston, MA, USA, 2012. [Google Scholar]
  11. Catalao, J. Smart and Sustainable Power Systems: Operations, Planning, and Economics of Insular Electricity Grids; CRC Press: Boca Raton, FL, USA, 2015. [Google Scholar]
  12. Karampelas, P.; Ekonomou, L. Electricity Distribution, Intelligent Solutions for Electricity Transmission and Distribution Networks; Springer: Berlin/Heidelberg, Germany, 2016. [Google Scholar]
  13. Markard, J.; Holt, E. Disclosure of electricity products—Lessons from consumer research as guidance for energy policy. Energy Policy 2003, 31, 1459–1474. [Google Scholar] [CrossRef]
  14. Simon, P.; Gianluca, G.; Stefano, Z.; Stefano, D. Forecasting Electricity Market Price for End Users in EU28 until 2020—Main Factors of Influence. Energies 2018, 11, 1460. [Google Scholar]
  15. Delmas, M.; Montes-Sancho, M.J.; Shimshack, J.P. Information disclosure policies: Evidence from the electricity industry information. Econ. Inq. 2010, 48, 483–498. [Google Scholar] [CrossRef]
  16. Truffer, B.; Markard, J.; Wustenhagen, R. Eco-labeling of electricity—Strategies and tradeoffs in the definition of environmental standards. Energy Policy 2001, 29, 885–897. [Google Scholar] [CrossRef]
  17. Darudi, A.; Moghadam, A.Z.; Bayaz, H.J.D. Effects of bidding data disclosure on unilateral exercise of market power. In Proceedings of the International Congress on Technology, Communication and Knowledge (ICTCK), Mashhad, Iran, 11–12 November 2015. [Google Scholar]
  18. Mohammadi, M.; Hosseinian, S.H.; Gharehpetian, G.B. Optimization of hybrid solar energy sources/wind turbine systems integrated to utility grids as microgrid (MG) under pool/bilateral/hybrid electricity market using PSO. Sol. Energy 2012, 86, 112–125. [Google Scholar] [CrossRef]
  19. Kumar, A.; Gao, W. Optimal distributed generation location using mixed integer non-linear programming in hybrid electricity markets. IET Gener. Transm. Distrib. 2010, 4, 281–298. [Google Scholar] [CrossRef]
  20. Singh, H.; Hao, S.; Papalexopoulos, A. Transmission congestion management in competitive electricity markets. IEEE Trans. Power Syst. 1998, 13, 672–680. [Google Scholar] [CrossRef]
  21. Ding, Y.; Wang, P. Reliability and price risk assessment of a restructured power system with hybrid market structure. IEEE Trans. Power Syst. 2006, 21, 108–116. [Google Scholar] [CrossRef]
  22. Introduction to AESO. Available online: https://www.aeso.ca/aeso/training/guide-to-understanding-albertas-electricity-market/ (accessed on 12 November 2018).
  23. Philpott, A.; Guan, Z.; Khazaei, J.; Zakeri, G. Production inefficiency of electricity markets with hydro generation. Util. Policy 2010, 18, 174–185. [Google Scholar] [CrossRef] [Green Version]
  24. Introduction to the National Electricity Market of Singapore. Available online: https://www.ema.gov.sg/cmsmedia/Handbook/NEMS_111010.pdf (accessed on 12 November 2018).
  25. Barroso, L.A.; Cavalcanti, T.H.; Giesbertz, P.; Purchala, K. Classification of electricity market models worldwide. In Proceedings of the International Symposium CIGRE/IEEE PES, New Orleans, LA, USA, 5–7 October 2005. [Google Scholar]
  26. Comparison of Market Designs. Available online: https://sites.hks.harvard.edu/hepg/Papers/Zhou-Market%20Design%20Report-010703.pdf (accessed on 12 November 2018).
  27. Niefer, M.J. Information and Competition in Electric Power Markets: Is Transparency the Holy Grail? Energy Law J. 2014, 35, 375. [Google Scholar]
  28. Healy, P.M.; Palepu, K.G. Information asymmetry, corporate disclosure, and the capital markets: A review of the empirical disclosure literature. J. Account. Econ. 2001, 31, 405–440. [Google Scholar] [CrossRef] [Green Version]
  29. Hooper, L.; Twomey, P.; Newbery, D. Transparency and Confidentiality in Competitive Electricity Markets. Available online: http://pdf.usaid.gov/pdf_docs/Pnadq695.pdf (accessed on 12 November 2018).
  30. Two Settlement Markets. Available online: https://www.pjm.com/-/media/training/nerc (accessed on 12 November 2018).
  31. Lin, J. Market-based transmission planning model in PJM electricity market. In Proceedings of the 6th International Conference on the European Energy Market, Leuven, Belgium, 27–29 May 2009. [Google Scholar]
  32. Chen, H. Power Grid Operation in a Market Environment; Wiley-IEEE Press: Piscataway, NJ, USA; New York, NY, USA, 2016. [Google Scholar]
  33. PJM Manual 11. Available online: http://www.pjm.com/-/media/documents/manuals (accessed on 12 November 2018).
  34. 5 Minute Settlements. Available online: http://www.pjm.com/markets-and-operations/billing-settlements-and-credit/5-minute-settlements.aspx (accessed on 12 November 2018).
  35. PJM FTR Center. Available online: http://www.pjm.com/markets-and-operations/etools/ftr-center.aspx (accessed on 12 November 2018).
  36. Energy Market Authority. Review of Market Information to Facilitate Efficient Electricity Spot and Future Trading. 2014. Available online: https://www.ema.gov.sg/cmsmedia/Consultations/Electricity/Proposed%20Modifications%20to%20the%20Transmission%20Code/22July2014Decision_Paper__Review_ofMarket_Information_Disclosure.pdf (accessed on 12 November 2018).
  37. PJM Data Directory. Available online: http://www.pjm.com/markets-and-operations/data-dictionary.aspx (accessed on 12 November 2018).
  38. PJM Ancillary Services. Available online: http://www.pjm.com/markets-and-operations/ancillary-services.aspx (accessed on 12 November 2018).
  39. Imran, K.; Kockar, I. A technical comparison of wholesale electricity markets in North America and Europe. Electr. Power Syst. Res. 2014, 108, 59–67. [Google Scholar] [CrossRef]
  40. NYISO Market & Operation. Available online: http://www.nyiso.com/public/markets_operations/index.jsp (accessed on 12 November 2018).
  41. ISONE Markets Data and Information. Available online: https://www.iso-ne.com/markets-operations/markets (accessed on 12 November 2018).
  42. ERCOT. Market Information. Available online: http://www.ercot.com/mktinfo (accessed on 12 November 2018).
  43. Shuttleworth, G. Hot Topics in European Electricity: What Is Relevant and What Isn’t? Electr. J. 2002, 15, 25–39. [Google Scholar] [CrossRef]
  44. Lai, L.L. Power System Restructuring and Deregulation: Trading, Performance and Information Technology; John Wiley & Sons, Ltd.: Hoboken, NJ, USA, 2002. [Google Scholar]
  45. Electricity Balancing Services. Available online: https://www.nao.org.uk/wp-content/uploads/2014/05/Electricity-Balancing-Services.pdf (accessed on 12 November 2018).
  46. Alikhanzadeh, A.; Irving, M. Bilateral electricity market theory based on conjectural variations equilibria. In Proceedings of the International Conference on the European Energy Market (EEM), Zagreb, Croatia, 25–27 May 2011. [Google Scholar]
  47. ELEXON Imbalance Pricing Guidance. Available online: https://www.elexon.co.uk/wp-content/uploads/2016/10/Imbalance_Pricing_guidance_v11.0.pdf (accessed on 12 November 2018).
  48. Gan, D.; Feng, D.; Xie, J. Electricity Markets and Power System Economics; CRC Press: Boca Raton, FL, USA, 2014. [Google Scholar]
  49. Zhao, J.; Lu, J.; Lun, L.K. A Transmission Congestion Cost Allocation Method in Bilateral Trading Electricity Market. Energy Power Eng. 2017, 9, 240–249. [Google Scholar] [CrossRef]
  50. ELEXON Data Summary. Available online: https://www.bmreports.com/bmrs/?q=eds/main (accessed on 12 November 2018).
  51. National Grid UK Data Explorer. Available online: https://www.nationalgrid.com/uk/electricity/market-operations-and-data/data-explorer (accessed on 12 November 2018).
  52. National Grid UK Forecast Volumes and Costs. Available online: https://www.nationalgrid.com/uk/electricity/market-operations-and-data/forecast-volumes-and-costs (accessed on 12 November 2018).
  53. Conejo, A.J.; Galiana, F.D. Economic inefficiencies and cross-subsidies in an auction-based electricity pool. IEEE Trans. Power Syst. 2003, 18, 221–228. [Google Scholar] [CrossRef]
  54. Design of Wholesale Electricity Markets. Available online: http://web.mit.edu/esd.126/www/StdMkt/ChaoWilson.pdf (accessed on 12 November 2018).
  55. Herguera, I. Bilateral contracts and the spot market for electricity: Some observations on the British and the Nord Pool experiences. Util. Policy 2000, 9, 73–80. [Google Scholar] [CrossRef]
  56. Wangensteen, I. Power System Economics: The Nordic Electricity Market; Tapir Academic Press: Trondheim, Norway, 2007. [Google Scholar]
  57. Nord Pool Day-Ahead Market. Available online: https://www.nordpoolgroup.com/the-power-market/Day-ahead market (accessed on 12 November 2018).
  58. Nord Pool Price Formation. Available online: https://www.nordpoolgroup.com/the-power-market/Day-ahead market/Price-formation/ (accessed on 12 November 2018).
  59. Nordic Power Flow. Available online: http://www.statnett.no/en/market-and-operations/data-from-the-power-system/nordic-power-flow/ (accessed on 12 November 2018).
  60. Bjørndal, M.; Jørnsten, K. Zonal Pricing in a Deregulated Electricity Market. Energy J. 2001, 22, 51–73. [Google Scholar] [CrossRef]
  61. Nord Pool Intraday Market. Available online: http://www.nordpoolspot.com/the-power-market/Intraday-market/ (accessed on 12 November 2018).
  62. Skytte, K. The regulating power market on the Nordic power exchange Nord Pool: An econometric analysis. Energy Econ. 1999, 21, 295–308. [Google Scholar] [CrossRef]
  63. Bang, C.; Fock, F.; Togeby, M. The Existing Nordic Regulating Power Market; Ea Energy Analyses: København, Denmark, 2011. [Google Scholar]
  64. Nord Pool Financial Market. Available online: https://www.nordpoolgroup.com/the-power-market/Financial-market/ (accessed on 12 November 2018).
  65. Nord Pool Market Data. Available online: https://www.nordpoolgroup.com/Market-data1/Intraday/Volumes/ALL/Hourly/?view=table (accessed on 12 November 2018).
  66. Wang, Q.; Zhang, C.; Ding, Y. Review of real-time electricity markets for integrating Distributed Energy Resources and Demand Response. Appl. Energy 2015, 138, 695–706. [Google Scholar] [CrossRef]
  67. Conejo, A.J.; Sioshansi, R. Rethinking restructured electricity market design: Lessons learned and future needs. Int. J. Electr. Power Energy Syst. 2018, 98, 520–530. [Google Scholar] [CrossRef]
  68. Ding, F.; Fuller, J.D. Nodal, uniform, or zonal pricing: Distribution of economic surplus. IEEE Trans. Power Syst. 2005, 20, 875–882. [Google Scholar] [CrossRef]
  69. Guidelines of Good Practice on Information Management and Transparency in Electricity Markets. Available online: https://www.ceer.eu/documents/104400/-/-/f587e759-76f7-728a-685c-84b11f4db312 (accessed on 12 November 2018).
  70. Baziliauskas, A.; Sanderson, M.; Yathew, A. Electricity Market Data Transparency Prepared for: Alberta Market Surveillance Administrator. Available online: https://albertamsa.ca/uploads/pdf/Archive/2011/Market%20Data%20Transparency/CRA%20Report%20for%20MSA%2011-22%202011.pdf (accessed on 12 November 2018).
  71. Woo, C.K.; Lloyd, D.; Tishler, A. Electricity market reform failures: UK, Norway, Alberta and California. Energy Policy 2003, 31, 1103–1115. [Google Scholar] [CrossRef]
Figure 1. Difference between poolco model, hybrid model, and bilateral contract model.
Energies 11 03424 g001
Figure 2. Framework for poolco model.
Energies 11 03424 g002
Figure 3. Clearing process of Pennsylvania-New Jersey-Maryland interconnection (PJM) market [30].
Energies 11 03424 g003
Figure 4. Framework for bilateral contract model.
Energies 11 03424 g004
Figure 5. The transaction process of British Electricity Trading, and Transmission Agreements (BETTA).
Energies 11 03424 g005
Figure 6. Framework for hybrid model.
Energies 11 03424 g006
Figure 7. The clearing process of Nord Pool.
Energies 11 03424 g007
Figure 8. A general example of information disclosure process.
Energies 11 03424 g008
Table 1. Market models of different electricity markets [8,22,23,24,25,26].
Market ModelsElectricity MarketsCountries
Poolco ModelPJMUSA
NYISOUSA
ISONEUSA
CAISOUSA
AESOCanada
NEMSSingapore
NZEMNew Zealand
Hybrid ModelNord PoolNordics
EPEXEuropean Continent
Bilateral Contract ModelBETTAUK
Table 2. List of information disclosed by PJM [37,38].
CategoriesDisclosed InformationFrequencyLagging
Load
Information
7-day load forecast dataseveral times per dayno
real-time load datadailyno
historical metered load datamonthlyno
Grid
Information
real-time transmission constraintsn/ano
flow into and out of PJM area5 minno
Generation
Information
forecasted generation outagesdailyno
capacity by fuel typeyearlyno
historical generationdaily2 weeks
Ancillary
Service
frequency regulation capacity and pricedailyno
synchronized reserve capacity and pricedailyno
non-synchronized reserve capacity and pricedailyno
day-ahead scheduling reserve capacity and pricedailyno
black start revenuemonthlyno
Price
Information
real-time LMP5 minno
hourly day-ahead LMPdailyno
Bidding
Information
FTR auction bid datamonthly6 months
daily energy market offer datamonthly4 months
hourly day-ahead demand bid datamonthly6 months
hourly day-ahead virtual bid datamonthly4 months
monthly demand side response bid datamonthly6 months
Table 3. List of information disclosed in PJM, ERCOT, and ISONE [42,43].
CategoryInformation DisclosedPJMERCOTISONE
Load informationhistorical/real-time load
forecasted load data
Grid Informationtransmission constraints
power system maintenance plan
Generation Informationgeneration capacity
historical generation
outage information
total energy bought and sold
Ancillary service informationancillary service volume
ancillary service price
Price informationhistorical/real-time LMP
day-ahead LMP
Bidding informationancillary service bidding
bids and offers for energy
demand side response bid
Table 4. List of information disclosed in BETTA [50,51,52].
CategoriesDisclosed Information
Demand informationreal-time demand
historical demand
demand incentive forecasts
Generation informationgeneration forecasts
actual generation by fuel type
generation capacity
Transmission informationavailability of transmission lines
congestion costs
Outcome System servicesreactive energy volume
contracted energy volume
Outcome Energy servicesSTOR cost and volume
frequency response volume
SSP and SBP
aggregated imbalanced volume
aggregated bid and offer volume
accepted bid and offer volume
Forecast volumes and costsdaily BSUoS forecast
monthly BSUoS report
reserve requirement
Table 5. Information disclosed in Nord Pool [64].
CategoriesDisclosed Information
Day-ahead Markethourly zonal price
aggregated volume bought and sold
day-ahead capacity
zonal power flow
Intra-day Marketintraday volume bought and sold
planed zonal power flow
transmission capacity
total scheduled flow
Regulating Marketregulating power per area
regulating prices and volumes
volume of regulating bids
special regulating volume
automatic activated reserve
Electricity systemproduction and consumption
electricity exchange of countries
hydro reservoir
Table 6. Summary of information disclosure.
CategoriesInformation DisclosurePJMNord PoolBETTA
Generation Informationgeneration capacity
historical/real-time generation
outage information
ancillary service volume
Grid Informationtransmission constraint
power system maintenance plan
Load informationhistorical/real-time load
forecasted load information
Price informationhistorical/real-time electricity price
day-ahead price
ancillary service price
Bidding informationancillary service bids
bids for energy
demand side response bid data

