Abstract
In this study, activated carbons (ACs) were produced from oil palm leaves (OPL) and palm kernel shells (PKS) using different concentrations (0%, 11%, and 33%) of H3PO4 as the activating agent. The Brunauer–Emmett–Teller (BET) results indicated that surface area decreases with the decreasing of the concentration of the H3PO4 in the following order: AC from oil palm leaves was (OPLAC-0% H3PO4) < (OPLAC-11% H3PO4) < (OPLAC-33% H3PO4), with the BET surface area values of 37, 760, and 780 m2/g, respectively. Similarly, the PKS-derived AC followed the same trend of (PKSAC-0% H3PO4) < (PKSAC-11% H3PO4) < (PKSAC-33% H3PO4), with the BET surface area values of 3, 52, and 1324 m2/g, respectively. Based on this finding, it was observed that H3PO4 had exhibited an influential role on enhancing the surface properties of the AC. On the contrary, it slightly decreased the graphitic trait of the AC by considering their IG/ID trends, which were generated from the Raman spectral analysis. The energy storage capacity of the AC was further tested using cyclic voltammetry. Three of the samples were found to have high capacitance values of 434 F g−1, 162 F g−1, and 147 F g−1 at 5 mVs−1. The first (434 F g−1) is much higher than the specific capacitance value (343 F g−1) of the only oil palm leaf-derived porous carbon nanoparticles ever reported in the literature.
1. Introduction
Fossil carbon sources generated from oil residue, peat, and lignite have been in use for many decades as the primary materials for commercial activated carbon production [1]. Unfortunately, one of the greatest disadvantages of using fossil fuels for any reason is the pollution that they cause when they are burned. The chemical combustion process produces huge amounts of water vapor and other greenhouse gases, primarily carbon dioxide, nitrous oxides (NOX), ozone (O3), methane (CH4), and various unburned hydrocarbons, which are released directly into the atmosphere. As a consequence, these gases absorb (capture) and discharge electromagnetic waves (in the form of radiant energy) within the thermal infrared range, thus making them very hazardous to the good health of our planet [2,3]. Many studies reveal that CO2 concentration in the atmosphere is the main cause of global temperature rise (i.e., global warming) [3]. These problems, coupled with the general global energy crisis and the growing fear of fossil fuel extinction, has resulted into new advances in the field of renewable energy. This has indeed encouraged scientists and researchers to use biomass-based precursors for activated carbon production, as it could be applied as a carbon source for carbon-based electrodes for supercapacitors and other energy storage applications. It is believed that proper utilization of the bio-agricultural waste, as we did in this work, is a logical way to minimize the global energy, environmental, and economic crises [4,5]. This is the key reason that compelled us to carry out this research, which is also aimed at supporting the global paradigm shift towards sustainable development.
Despite a monumental effort made by diverse governments and policy makers around the world to address energy and environmental issues, it is; however, worrying that the global energy crisis still remains humanities’ concern, owing to the rapidly growing population expansion and deplorable sustainability and reliability issues associated with fossil fuel reserves. It is widely speculated that the conventional sources that are used to power the industrial society are waning as the demand rises [6]. For example, in 2013, about 87% of the energy produced was generated from fossil fuels (i.e., oil, gas, and coal). Although, these resources were provided by the nature, it takes hundreds of thousands of years to produce them [5,7]. For this reason, they are not reliable, renewable, and sustainable. Therefore, scientists, researchers, and policy makers around the globe are working tirelessly to make the use of renewable sources a preference. In this context, there is a serious call for an effectual constant energy supply at low cost and a way to store it. One of the quick options is to use electrochemical energy as a power source using an electrochemical capacitor, batteries, and fuel cell devices [8,9]. These devices were found to be promising for the conversion and storage of electrochemical energy. The suitability of their usage might be different but their electrochemical properties remain nearly the same [10].
The preference given to electrochemical capacitors (also called supercapacitors or electric double layer capacitors (EDLCs)), over their counterparts (batteries and fuel cells), was based on the capacity of this device to store charge using ion absorption or redox reactions [10,11]. It has been observed that the excellent charge accumulation capability of supercapacitors is derived from an electrostatic attraction of polarized electrodes in an electrolytic solution, which the complete performance of the supercapacitors relied on [11,12]. Unlike batteries, supercapacitors store energy in an electric field rather than in a chemical reaction. This enables them to charge and discharge more rapidly than batteries and withstand over a million charge and discharge cycles, which in turn paves the way to much longer life cycles. Therefore, supercapacitors are the perfect example of materials that can be used in place of batteries and fuel cells due to their high energy and power storage capacities. In effect, this is another way to slam the under-performance that was alleged to exist among batteries and fuel cells.
Apparently, the use of sustainable and commonly available raw materials to produce carbon-based materials, like activated carbon (AC), has increased recently [13,14]. The demand for these materials is expanding owing to the vast applicability of carbon-based materials, globally, as energy-storage and conversion-electrode enhancing materials [15]. This could also be the reason for the increased cost of activated carbon in the global market. Therefore, it is essential to devise a means of producing these materials at a relatively low cost as the majority of the commercial activated carbons are manufactured from fossil sources, which are not only non-renewable but also non-sustainable. For this reason, green wastes derived from oil palm by-products, like the oil palm leaves and palm kernel shells (as used in this research), are generally rich in lignocellulosic constituent [8,16], and; therefore, are very strong candidates to prepare AC for the aforementioned targeted application. The biomass precursors contained a substantial proportion of volatile matter, which play a significant role towards producing a very porous structure of AC, which made it suitable as an energy storage material [17,18]. This “green” approach is environmentally benign and incredibly essential towards stimulating economic growth, especially in the developing Southeast Asian countries [19], where oil palm by-products are generated in huge quantities.
A survey of previous literature reveals that different types of precursors, including but not limited to coconut shell [20], walnut shell, almond shell, olive stone, almond tree pruning, [21] and orange peel, mung bean husk, hemp, date palm tree, saw dust, etc., have been experimented on as the source materials towards the fabrication of AC [22]. Chemical or physical activation of the precursors using different types of chemicals, including phosphoric acid, zinc chloride, sodium hydroxide, potassium carbonate, and potassium hydroxide, has been reported [16,23,24,25,26,27]. The decomposition of the complex molecules of the starting materials by heat (in other words pyrolysis) is usually performed in a furnace at a particular temperature under inert atmosphere.
In spite of the fact that several works have been conducted on the synthesis and applications of activated carbon, it is worth emphasizing that there are very few works on the energy storage potentials of oil palm leaf- and palm kernel shell-derived activated carbons in particular. In effect, we have taken advantage of using economical, eco-friendly, commonly-available, and effective biomass materials to prepare activated carbons by way of the chemical activation process using H3PO4. This will, conversely, replace the use of non-eco-friendly materials that were previously used to commercially produce activated carbon for energy storage and many other purposes.
2. Materials and Methods
2.1. Sample Collection and Pretreatment
The precursors exploited in this study were byproduct materials generated by oil palm plantation industries in Selangor, Malaysia. The OPL (oil palm leaves) were procured from an agricultural garden (Taman Pertanian Universiti, Ladang 8) at Universiti Putra Malaysia, Serdang, Selangor; whereas the PKS (palm kernel shells) were procured from Seri Ulu Langat Palm Oil Mill, Dengkil, Selangor, Malaysia. Deionized water was used, scrupulously, to wash all of the samples. Afterward, the samples were allowed to dry in an oven at 60 °C and pulverized into powder using a stable arm grinder.
2.2. Chemical Activation Coupled with the Carbonization—Activation of the Precursors
The chemical activation of the starting materials was carried out using 85% phosphoric acid at various concentrations, as will be mentioned in the following paragraph.
An aqueous solution with concentrations of 0%, 11%, and 33% (w/w) were prepared for the impregnation of the samples. About 10 g of the powdered raw materials (sample) was weighed and impregnated in 100 mL concentration of phosphoric acid, overnight. The calculated impregnation ratio was 1:0, 1:1.1, and 1:3.3 respectively, and it was the amount of activating agent integrated with the sample [26].
After impregnation, the moist samples were kept in an oven at 95 °C for 12 h, or until complete dryness was achieved. The carbonization of the resulting impregnated sample was performed in a furnace at 500 °C under a nitrogen atmosphere at a constant heating speed of 10 °C/min. After cooling, the samples were then cleansed (at ambient temperature) in succession, with hot and cold deionized water, up to the time when the filtrate reached a pH of 7. The samples, after these extensive washings, were oven dried at 85 °C until all the infused moisture was completely removed. The dried (carbonized) samples were further activated in a furnace at 900 °C at a constant heating speed of 10 °C/min. The activated samples were cooled in a stream of gaseous nitrogen to ambient temperature. Finally, the samples were ready for further analysis and characterizations.
2.3. Optimization and Initial Temperature Investigation
The analytical combustion or pyrolysis of the samples was performed under an inert atmosphere of nitrogen gas in a tube furnace. About 6.0 g of the powdered sample was taken and deposited into the quartz boat and stationed in the quartz tube, and into the center of the furnace cubicle (as depicted in Figure 1). During the pyrolysis process, a stream of nitrogen gas was permitted to surge through the system throughout the period. The starting feedstock (OPL and PKS) were pyrolyzed at a constant heating speed of 10 °C/min, to the temperatures ranging between 400 to 1000 °C of each, respectively, and maintained for 3 h. This was to find the optimum activation temperature. Afterward, the heating system was paused, but the nitrogen gas flow was continued until the chamber temperature gradually subsided to 100 °C. Upon cooling to room temperature, the sample was reweighed to evaluate the yield rate. Based on the excellent graphitic nature of the materials at the temperature of 900 °C, obtained from the Raman analysis, it was chosen as the working temperature to activate the precursors after being chemically activated with phosphoric acid.
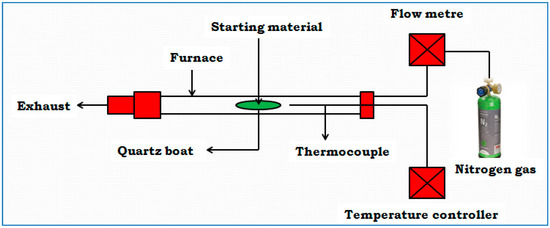
Figure 1.
A simple diagram describing how the impregnated precursors were carbonized and activated in the furnace.
2.4. Characterization of the Activated Carbon
The surface area, pore volume, and pore size distribution analysis of the activated carbon samples were conducted with Brunauer–Emmett–Teller (BET) and N2 adsorption–desorption isotherms method at 77 K, using a Micromeratics Tristar II plus (Micromeratics, Norcross, GA, USA). Initially, the AC samples were outgassed according to the International Union of Pure and Applied Chemistry IUPAC recommendation [28,29] to remove volatile impurities from the sample. Finally, the specific surface area of the AC was evaluated using the BET equation, and pore size distribution was evaluated using the BJH (Barrett–Joyner–Halenda) method. The powdered X-ray diffraction patterns of the OPL- and PKS-derived activated carbons (OPLAC and PKSAC) were acquired with a Shimadzu XRD-6000 diffractometer (Tokyo, Japan) at ambient temperature. A scanning speed of 4° min−1 and a range of 5 to 35° (2θ), at 30 kV and 30 mA, were adopted when acquiring all the X-ray diffraction patterns. The Raman spectroscopic study, of all of the activated carbon samples, was done with a WiTec Raman spectrometer, Alpha 300R (WiTec, Ulm, Germany), at a laser excitation wavelength of 532 nm. The pulverized AC sample was taken and packed onto a glass slide (sample holder), and a controlled laser beam was focused at a point inside the sample to irradiate the overlying surface of the material, by way of the laser beam. The information generated from the intensity ratio between the D-line, at around 1345 cm−1, and the G-line, at around 1590 cm−1, of the Raman spectra, was applied to analyze the graphitization trait and the trends of the carbonized OPL and PKS samples and their resulting activated carbons, respectively.
The chemical functional groups of the OPLAC and PKSAC (i.e., OPL- and PKS-derived AC), prepared at different concentrations, were studied by means of Fourier-transform infrared spectroscopy (FTIR) method on a Thermo Nicolet, Nicolet 6700 model, (Thermo Scientific, Waltham, MA, USA), at a resolution of 4 cm−1. The absorbance was recorded between the range of 400 to 4000 cm−1. In order to reduce the concentration of the samples and achieve high-quality spectra, pellets were prepared by way of blending, and compacting of the samples with potassium bromide (KBr) powder, using manual hydraulic press, prior to the experiment [30]. The analysis was done at ambient temperature.
Lastly, the thermogravimetric and differential thermogravimetric (TGA/DTG) analyses were done with a TGA/DSC 1HT model (Mettler Toledo, Schwerzenbach, Switzerland), to evaluate the transformational changes of the as-produced materials as they were thermally treated. The analysis was conducted at a heating rate of 10 °C/min and within a temperature range of 25 and 1000 °C, under constant nitrogen gas flow.
2.5. Electrochemical Studies
The electrochemical performance of the as-produced materials was carried out using the cyclic voltammetry (CV) measurements in concert with the galvanostatic charge and discharge profile measurements. CV experiments were conducted at different scan rates of 5, 10, 50, 100, and 200 mV/s, respectively, in 1 M potassium chloride (KCl), which served as a supporting electrolyte. All of the voltammetric experiments and analyses were performed with the aid of a µAutolab Type III electrochemical analyzer apparatus (PGSTAT204/FRA32M module, Eco Chemie, The Netherlands), which was connected to a computer and controlled by general-purpose electrochemical systems, software (Nova 1.11, Metrohm Autolab B.V., Utrecht, The Netherlands.). All of the other electrochemical-related experiments were executed in an electrochemical cell at room temperature. A “triplet” electrode arrangement system was used in the electrolyte solution. A glassy carbon electrode (GCE), encrusted with the activated carbon sample, was used as the working electrode, while an Ag/AgCl electrode worked as the reference electrode and a platinum electrode functioned as the supporting or counter electrode.
From the CV plot, the specific capacitance (SC) was determined by integrating the area under the CV curves:
where Q is the integrated area under the CV curves, ΔV is the potential window, δv/δt is the scan rate (mVs−1), and m (g) is the mass of the activated carbon sample coated on the GCE.
It is noteworthy that the same instrument (with similar setup) was utilized for the galvanostatic charge and discharge experiments.
2.6. Preparation of the Glassy Carbon Working Electrode
Briefly, about a 10 µL droplet of the sonicated activated carbon was carefully pasted on the center of the glassy carbonelectrode surface using a micropipette. It was allowed to dry in an oven at 35 °C for 3 h. The optimum coating process described above was achieved by sonicating about 0.01 g of the sample in 10 mL of deionized water for 15 min. Subsequently, 10 µL (equivalent to 1.0 × 10⁻⁵ g) of the sample was immediately taken and applied on the GCE, as described above. The resulting modified electrodes or samples were abbreviated as: OPLAC-11% PA, OPLAC-33% PA, PKSAC-11% PA, and PKSAC-33% PA for easy identification.
3. Results and Discussion
The most perceptible effect when H3PO4 is reacted or mixed with a biomass-based lignocellulosic compound at an elevated temperature is crosslinking reactions by means of the cyclization and condensation process. Therefore, in the course of preparing activated carbon using H3PO4 as an activating agent, phosphate groups are generally introduced or incorporated into the matrix of the impregnated material. As a consequence, the matrix is forced to enlarge by the introduction of these groups. Eventually, when the acids are eliminated, a porous structure is unrestrainedly developed. After impregnation, the chemical reaction is further induced or initiated by a controlled heating process. The acid (which is a combination of phosphorus pentoxide with H2O) serves as a catalyst and consequently stimulates the joining of two or more molecules through a (chemical) covalent bond, which, as earlier described, is achieved through cyclization and condensation processes [18,20]. In a nutshell, the acid is believed to react with the lignocellulosic compound (which are in the form of organic matter and are comprised of 35%–50% of cellulose) to generate phosphate and polyphosphate bridges that are bonded and cross linked with biopolymer fragments. It is fascinating to observe from other studies that phosphoric acid and alkanols exert the same effects when dehydrating cellulosic materials [24]. It was evident that the formed phosphorus oxides act as Lewis acids to produce C–O–P linkages [24].
It is worth emphasizing that the heating of the impregnated feedstock further speeds up the thermal disintegration and the volatilization process. In effect, this paves the way for surface area to increase, pores to develop, and the subsequent loss of mass of the material. Many factors, including the nature of the starting material (precursor) and the activating reagent (chemical agent), affect the selection of the activation temperature. It is important to note that the temperature of activation for most biomass feedstocks range between 400 to 800 °C, whereas coal-related materials, on the other hand, can reach as high as 900 °C [27]. Nonetheless, the optimal activation temperature for high surface area and good graphitic nature was found to be between 800 to 900 °C for our samples that were impregnated with phosphoric acid.
3.1. BET and N2 Adsorption and Desorption Isotherm Analyses
Table 1 demonstrates the effects of the impregnation ratio (H3PO4/OPL and H3PO4/PKS) on the porous structure of the as-produced activated carbons. Formation of porosity was known or linked with the significant fraction of volatile matters that were contained in the biomass precursors. These volatile matters functioned as a powerful driver for fabricating a highly-porous, structured material for energy storage application [31]. Thus, for PKSAC-33%-H3PO4, owing to the higher lignin content of the precursor and absorption of the impregnation and activating agent, as well as adequate carbonization, the BET surface area of 1324 m2 g−1 and total pore volume of 0.711 cm3 g−1 were, comparatively, much higher than those of the remaining samples. Surprisingly, on the other hand, OPLAC-33%-H3PO4 with the BET surface area of 780 m2 g−1 and total pore volume of 0.575 cm3 g−1, which was much lower as compared to the former, was observed to have the highest specific capacitance value (434 F g−1). It is presumed that the compatibility of the pore sizes at the entrance of the pores might have affected the appropriate admittance of the electrolyte to the overall porosity of PKSAC-33%-H3PO4, which could be the main cause of the discrepancy observed. When this is added to the general fact that the materials were prepared from different precursors (i.e., OPL and PKS), it can be concluded that the different accessibility powers of the electrolyte ions (through diffusion), into the pores of these carbon-based electrodes, could be the main reason for the difference in the specific capacitance observed between the two samples.

Table 1.
Surface area, pore volume, average pore size, and specific capacitances of the as-prepared activated carbons.
It is a known fact that structure and high surface area normally plays an integral role in attaining high energy and power densities for supercapacitors. Figure 2 and Figure 3 show the nitrogen adsorption and desorption isotherms and pore size distributions of the OPLAC and PKSAC samples. Based on the isotherm, OPLAC-11% PA, OPLAC-33% PA, and PKSAC-33% PA showed the Type I adsorption–desorption isotherms (typical for the microporous type of carbon), and a sheer increase in N2 adsorption of low pressure was noted due to micropore filling. Concomitantly, the OPLAC-11% PA exhibited a BET specific surface area of 760 m2 g−1, which was slightly lower than OPLAC-33% PA (780 m2 g−1), but significantly lower than PKSAC-33% PA (1324 m2 g−1), owing to its high mesopore-to-micropore ratio (Table 1). The average pore size (Å), determined using the desorption data by way of BJH method, was 105, 19, 19, 430, 103, and 24 for OPLAC-0% PA, OPLAC-11% PA, OPLAC-33% PA, PKSAC-0% PA, PKSAC-11% PA, and PKSAC-33% PA, respectively. Remarkably, a richer mesoporosity was formed for PKSAC-33% PA with a large pore volume. As observed from the BET analysis, the surface area of the samples increased with the increase in H3PO4 concentration during the OPLACs and PKSACs preparation process. For this reason, OPLAC-0%-H3PO4, PKSAC-0%-H3PO4, PKSAC-11%-H3PO4, and OPLAC-11%-H3PO4 exhibited lower surface areas than the other two samples.
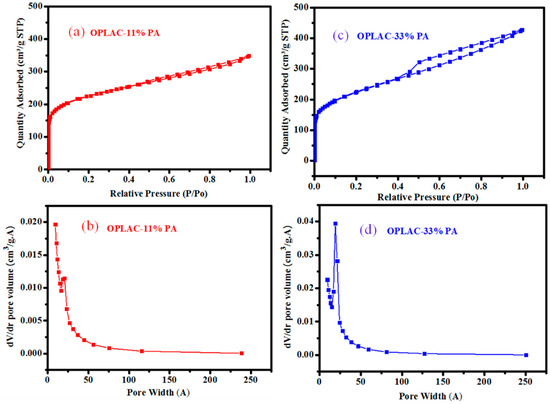
Figure 2.
(a,c) The nitrogen adsorption–desorption isotherms, at 77 K, of OPLAC-11% PA and OPLAC-33% PA, respectively; and (b,d) represents their corresponding pore size distributions. “OPLAC: Oil Palm Leaf-derived Activated Carbon; PA: Phosphoric Acid”.
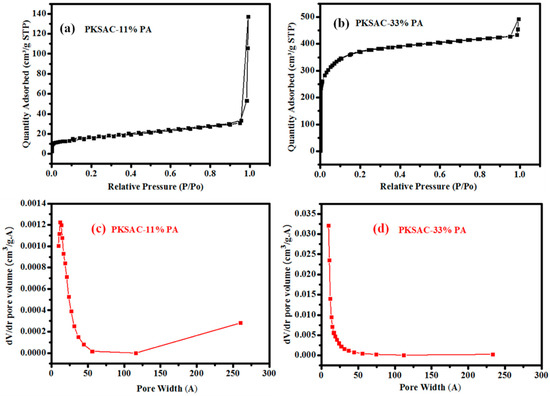
Figure 3.
(a,b) The nitrogen adsorption–desorption isotherms, at 77 K, of PKSAC-11% PA and PKSAC-33% PA, respectively; and (c,d) represents their corresponding pore size distributions. “PKSAC: Palm Kernel Shell-derived Activated Carbon; PA: Phosphoric Acid”.
From the BET results in Table 1, the surface area of untreated OPL and PKS feedstocks, 37 and 3 m2/g, respectively, were observed to increase to 760 and 780 m2/g and 51 and 1342 m2/g, respectively, after chemical treatment with phosphoric acid. The general trend for all the precursors was that when the concentration of the activating reagent increased the surface area also increased, which is in agreement with previous reported literature [32]. Spectacular pores, which conform to a good or high surface area, could be observed as more acids were applied. And when the pores attained a particular size (in the range between mesopore to nearly macropore), they did not add to the surface area considerably. The most commonly-used industrial activated carbon has been reported to have a specific surface area varying from 800 to about 1500 m2/g, as widely investigated using nitrogen gas adsorption BET analysis [33]. It is worth noting that the adsorption capacity for molecules of different sizes and shapes is principally affected by pore size distribution, and this is frequently used as a yardstick by which activated carbons are selected for a particular type of application.
3.2. X-ray Diffraction Analysis
The typical XRD pattern (Figure 4) of the as-prepared samples clearly revealed the non-appearance of strong and sharp peaks in the majority of the as-prepared materials. This signifies the dominance of amorphous carbon structures in the samples [34], although the presence of graphitic crystalline phase cannot be totally ruled out, as the sample is possibly dominated by non-crystalline carbon phase [35] and other crystalline inorganic compounds [36,37]. Thus, the emergence of a broad and low intensity diffraction peak at around 2θ = 22°, 24°, and 25° (Figure 4), which is attributed to the graphite (002) plane [38] or the diffraction patterns of amorphous graphitic carbon (obtainable in virtually any XRD pattern of typical activated carbon), portrayed a low degree of graphitization [34,39]. These peaks were identified to possibly emerge from the low-curvature graphite face found in graphite [40].
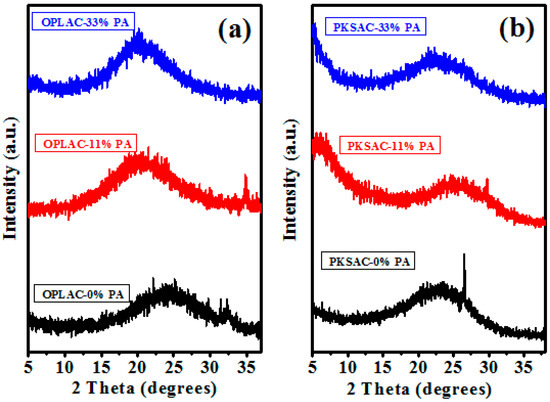
Figure 4.
X-ray diffraction pattern of: (a) As-prepared activated carbon, synthesized from OPL-derived feedstock at various chemical concentrations (weight %); and (b) PKS-derived AC, prepared under the same conditions as in (a).
The sharp peak observed at 26.9° on PKSAC-0% PA suggest the presence of crystalline inorganic compounds that may be attributed to the trace elements within the palm kernel shell precursor [36,37]. This peak disappears after impregnation with phosphoric acid (PA) and subsequent carbonization-activation at 900 °C due to the waning of the trace elements.
In a nutshell, it can be deduced and summarized from the peak positions in the XRD pattern that the as-prepared materials resemble the graphitic phase of the carbon [34], even though the broader intensity peak emerged at a low-angle, which connotes the presence of high density micropores in the carbonized-activated samples [41]. The presence of these high density micropores is one of the common qualifications that are usually needed for electrochemical energy storage application. This is owed to the fact that it increases the surface area, which contributes to the high capacitive performance of AC. As a result, it is often used as a yardstick for selecting an appropriate electrode material.
3.3. Raman Spectral Analysis
This analysis (Raman spectroscopy) is currently one of the broadly-utilized investigative, analytical methods to study the bonding formation or structure of carbon-related materials. The equipment usually inflicts inconsequential constraint on the substrate size and is generally non-destructive [42,43]. We therefore incorporated this technique to evaluate the carbon quality of the as-prepared samples. As displayed in Figure 5, the majority of the samples demonstrated a broad disorder-induced D-band (~1345 cm−1) and in-plane vibrational G-band (~1590 cm−1). The latter is generated or formed from the bond stretching of sp2 carbon pairs in both rings and chains, connoting graphitic formation, while the former is aroused or induced by the breathing mode of aromatic rings, implying the lattice defects as a result of structure distortion [44,45]. For this reason, the peak intensity ratio of G-line to D-line is widely used as a gauge for graphitization degree or disorder degree [34].
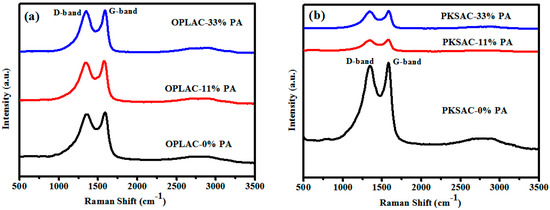
Figure 5.
The Raman spectra of: (a) OPL-derived activated carbon (AC); and (b) PKS-derived activated carbon (prepared using different concentrations of H3PO4), showing D- and G-bands.
Tuinstra and Koenig were the first notable researchers that brought to light the concept of applying the intensity of the D-peak to that of the G-peak (ID/IG), or vice versa, to evaluate the level of the graphitic cluster size [46]. In this light, in our previous work [35], we also used the IG/ID ratio, generated from the Raman spectral analysis, as one of the parameters or criterion to initially optimize the preparation condition for graphite-like carbon at different carbonization (annealing) temperatures. This optimized preparation condition was also adopted here. It is worth emphasizing that the process of carbonization helps in the development of porosity through the selective removal of the more reactive carbon in the structure. When the precursors are pyrolytically decomposed through carbonization, all of the non-carbon materials are eliminated. The first group of materials to be eliminated is the lower molecular weight compounds, such as CH4, CO2, CO, H2O, etc., followed by the light aromatic and hydrogen gas. This allows the atoms of the elementary carbon to move without restraint and grouped into organized elementary graphitic crystallites. Concurrently, structure distortion resulted due to the contraction and expansion of the ring, triggered by the influence of the pyrolysis temperature, which forces the atoms to randomly and frequently alter their positions leaving behind empty lattice sites. The empty spaces or vacancies created are where the atoms are originally supposed to be, but lost along the process. As a result, the lattice defects or structure distortion occurs.
Based on the correlation that exists between Figure 5 and Figure 6 (generated from the Raman spectral analysis), the calculated ratio of the integral intensity (IG/ID) was found to be 1.05, 1.04, 1.02, 1.07, 1.04, and 1.02 for OPLAC-0% PA, OPLAC-11% PA, OPLAC-33% PA, PKSAC-0% PA, PKSAC-11% PA, and PKSAC-33% PA, respectively. Thus, it was deduced that the PKSAC-0% PA had a relatively higher graphitization degree than the rest of the samples, signifying a possible superior electrical conductivity, owing to the absence or zero concentration of the activating agent (phosphoric acid) used. This was corroborated by the fact that conductivity enhancement mostly occurred with the increasement of the graphitic trait of the material, which is ascribed to the elimination of chemical functional groups and the formation of six-fold rings [47].
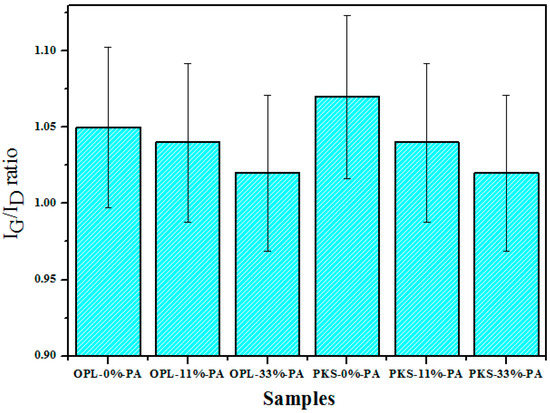
Figure 6.
Plot of the ratio of the intensity of the Raman G and D peaks IG/ID of the as-prepared OPL- and PKS-derived activated carbons, produced at various concentrations of the activating reagent. (n = 3)
In line with the trend of the IG/ID ratios (Figure 6), it can be deduced that the phosphoric acid (PA), used as the chemical activating agent, moderately or slightly decreased the graphitic features of the samples and outstandingly improved the surface properties, especially the BET surface area. This non-linear relationship, between the surface area and the degree of the graphitization, represents the influence of numerous structural properties and surface functional groups, which is also consistent with the non-crystalline nature of the as-prepared AC samples. However, the possibility of correlating the two cannot be totally ruled out [48].
It is worth emphasizing that there are limitations as to the correlation between porosity, specific surface area, electronic conductivity, and strength of the carbon-based materials. Basically, an excellent porosity of a carbon-based material is an indication that the material will exhibit a larger specific surface area, but the carbon also becomes weaker and less conductive [49].
In summary, from the initial temperature investigation conducted on the precursors (Figure 7), it can be deduced that the graphitization formation of the two materials (though different slopes were exhibited) were all influenced or decided on by temperature, which linearly extend up to 800 °C. The excellent convergence of the ratios observed at 900 °C indicates a clear resemblance between the two precursors at an elevated temperature, when all the non-carbon components are eliminated. In addition, this also connotes the optimum graphitic nature formation of the materials. Thus, this temperature (900 °C) was adopted as the working temperature to activate the precursors after being chemically impregnated with phosphoric acid.
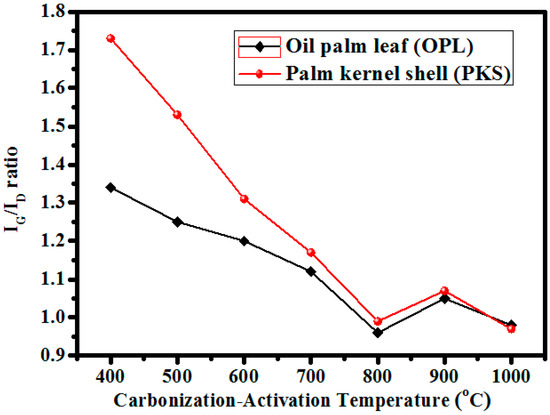
Figure 7.
The graphitic trends of the precursors (measured using IG/ID ratio) in relation to the carbonization-activation temperatures.
3.4. FTIR Analysis
The FTIR spectra (Figure 8 and Figure 9) were recorded for the raw OPL and PKS powders and their resultant activated carbon, which were obtained after H3PO4 treatment and carbonization-activation preparation at a temperature of 900 °C.
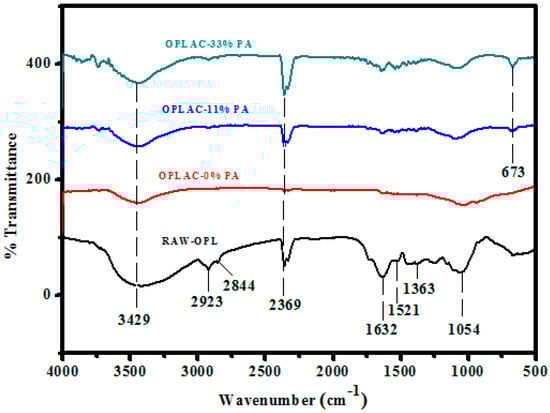
Figure 8.
Fourier-transform infrared (FTIR) spectra of OPL-derived activated carbon, impregnated with different concentrations of phosphoric acid.
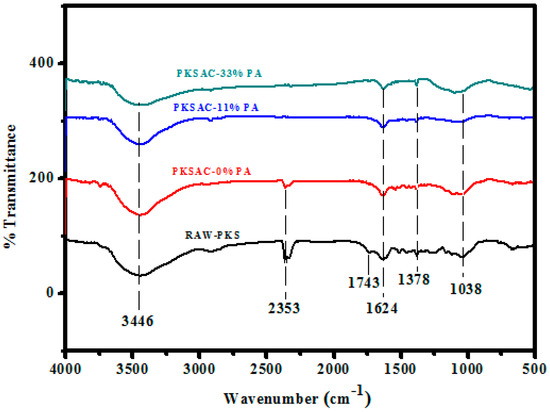
Figure 9.
Fourier-transform infrared (FTIR) spectra of PKS-derived activated carbon, prepared using different concentrations of phosphoric acid.
General assessment of all the spectra revealed that the raw samples had a greater number of transmittance peaks in the fingerprint region (1600–650 cm−1). This could imply the existence of more chemical functional groups in the raw samples, in contrast to their resultant activated carbon [50]. The dominant chemical functional groups contained in the raw OPL and PKS powders were primary aliphatic alcohol ν(O–H) 3429 cm−1 and 1054 cm−1, ester ν(C=O) 1632 cm−1, and aliphatic hydrocarbons ν(C–H) for –CH3 2923 cm−1, O–CH3 2844 cm−1, and gem-dimethyl 1363 cm−1.
Following the conversion of raw OPL and PKS precursors into activated carbon with phosphoric acid (H3PO4), the surface functional groups transformed to aliphatic carboxylic acid salt ν(C=O) 1561 cm−1 and 1363 cm−1, aliphatic hydrocarbons ν(C–H) 2923 cm−1 (C–H symmetric/asymmetric stretching), aliphatic phosphates ν(P–O–C) 1054 cm−1, and secondary aliphatic alcohols ν(O–H) 3419 cm−1 and 1159 cm−1.
In summary, the bands observed at 1587 cm−1 were attributed to the strong stretching of conjugated C=C in the aromatic ring, or the oxygen–aromatic bonding in the aromatic ether. The bond observed at 3349 cm−1 (in the activated carbon spectra), which surfaced owing to the –OH stretching vibration, was weaker than the –OH vibration of the raw sample. This could have been due to the loss of hydroxyl groups and the elimination of the volatile substances of the raw OPL sample during carbonization. The band at 1374 cm−1 was assigned to the C–H bending vibrations. The band observed at 1743 cm−1, allotted to C=O stretching, was also weakened, and the reduction of the complex band at 1260–1000 cm−1 was detected, which involved the reduction of alcohol, ester, and carboxylic acids.
3.5. Electrochemical Energy Storage Analysis
One, identifiable, important feature of an energy storage device (supercapacitor) is its ability to supply energy density. The energy density of the device largely depends on the physical and chemical properties of the electrode and the electrolyte used. Here, we used the as-produced activated carbons as the carbon source for the electrode. It should be noted that the performance of a supercapacitor (which is an excellent energy storage device) heavily relies on the carbon material used to make-up the electrode. It is imperative to also note that the energy storage ability could be enhanced using materials with excellent morphological, electrical, optical, and mechanical properties. Essentially, the physico-chemical properties of activated carbon, such as surface area, pore size, pore size distribution, and pore structure, are paramount for the aforementioned application. It is interesting to note that all these parameters, as illustrated in (Table 1), were adequately found in our material and, thus, used in this present study.
The cyclic voltammogram (CV), acquired between 0.1 and 1 V potential range at different scan rates, and the GCD profiles are presented in Figure 10 and Figure 11, respectively. For these supercapacitors, rectangular-shaped cyclic voltammograms (with good capacitor-like characteristics) were successfully achieved. Fascinatingly, this trend is what is generally needed for useful applications relating to high energy and power density [51]. To determine the specific capacitance, the areas under the curves were integrated. Thus, the highest value achieved was discovered to be 434 F g−1 at 5 mV s−1 and tended to reduce with an increasing scan rate (Figure 12). This result (finding) is considerably higher than those established for porous carbon nanoparticles (PCNs) produced by single-step pyrolysis of oil palm leaves under a nitrogen atmosphere [12] (Table 2). It is understood that the adequate time taken for the electrolyte ions (at a lower scan rate) to diffuse into the micropores of the OPLAC-33%-PA sample is ascribed to the immense increase in the specific capacitance values of this sample (Figure 12). At a higher scan rate, on the other hand, the electrolyte ions may not have such ample time to disseminate into the micropores, and this could be attributed to an extremely slow increase in the specific capacitance value [12] (Figure 12).
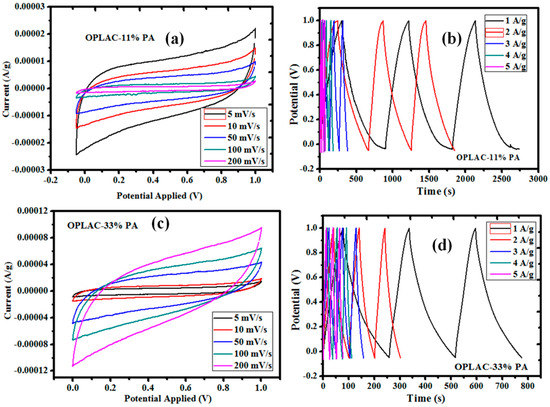
Figure 10.
Cyclic voltammogram (CV) and galvanostatic charge and discharge (GCD) curves of the as-fabricated activated carbon obtained from oil palm leaf-derived precursors. (a) Represents the CV curves of the OPLAC-11% PA, measured at different scan rates; (b) represents the GCD profile of OPLAC-11% PA, measured at different current densities; (c) CV curves of the OPLAC-33% PA, measured at different scan rates; (d) GCD profile of OPLAC-33% PA, measured at different current densities.
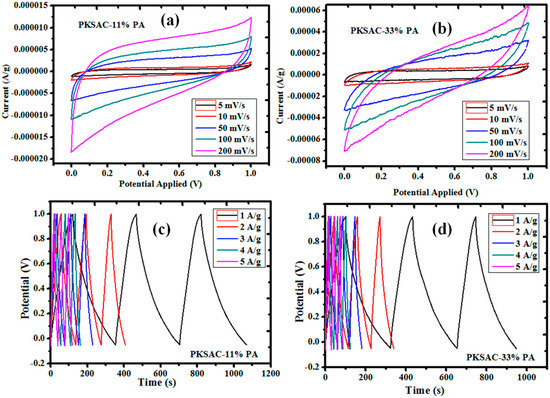
Figure 11.
Cyclic voltammogram (CV) and galvanostatic charge and discharge (GCD) curves of the as-fabricated activated carbon obtained from palm kernel shell-derived precursors. (a) and (b) represents the CV curves of the PKSAC-11% PA and PKSAC-33% PA, respectively, measured at different scan rates; While (c) and (d) represents the GCD profiles of PKSAC-11% PA and PKSAC-33% PA, respectively, measured at different current densities.
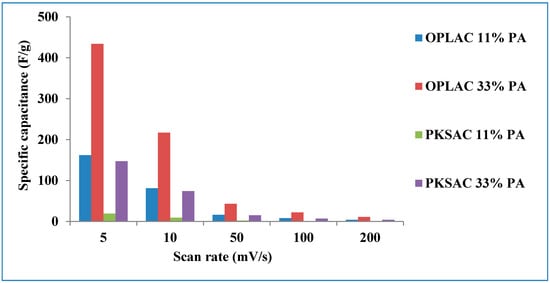
Figure 12.
The specific capacitance, measured at different scan rates, of the different activated carbon samples derived from the two precursors.
Table 2.
Literature description combined with a comparative review of the features of various carbon-based materials, fabricated from waste biomass, and the application of their supercapacitors.
Concurrently, it was also inferred that the charge–discharge responses of the electric double layer were very much reversible. It was noticeably exposed that, at a scan rate of 5 mV s−1, the rectangular shape was not maintained on the CV, and this is generally alleged to be caused by the time constant. By definition, at τ not equal to 0, it is considered that some fraction of the current has a transient part, which falls exponentially with an RC time constant, where R = ESR (equivalent series resistance), and a steady-state current [51]. Usually, when τ increases from zero to higher numbers, it allows the transient part to be held for longer periods. In effect, this indicates that a lot of time is needed to charge the capacitor and, in turn, pave the way for the collapse of the rectangular shape of the current profiles. Capacitance, ESR, and leakage or self-discharge are three of the major parameters applied to evaluate an ultracapacitor’s performance as an energy storage device; they characterize the capability to store the electrical charge (energy), the efficiency during charge or discharge, and the ability to hold the energy after charge.
In summary, the electrochemical potentials of each material were assessed, of which portrayed usual capacitive features with nearly rectangular CV curves at 5–200 mVs−1 (Figure 10a,c and Figure 11a,b). Similarly, the resultant charge and discharge profiles at relatively higher current densities of 1–5 A/g (Figure 10b,d and Figure 11c,d), depicting typically perfect triangular morphologies, are presented.
The cycling performance of the EDLC based on the OPLAC33%-PA electrode was also evaluated and is presented in Figure 13a. It is graspable that about 82% (118 F/g) of the initial specific capacitance was maintained, even after 1000 cycles, which implied that the OPLAC33%-PA had a good stability in the three-electrode system.
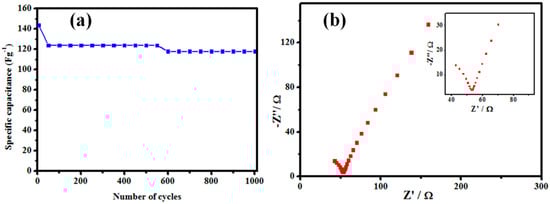
Figure 13.
(a) The cycling performance of the OPLAC33%-PA at a current density of 60 µA/g; and (b) the Nyquist plot for the OPLAC33%-PA electrode using a sinusoidal signal of 10 mV over the frequency range from 0.01 Hz to 1 mHz. The real impedance is symbolized as Z′ and the imaginary impedance as Z″.
A Nyquist plot of OPLAC-33% PA carbon electrode materials in 1 M KCl, in a frequency range from 0.01 Hz to 1 mHz (Figure 13b), was also assessed. The sample exhibited a straight line in the low frequency region and a curve in the high frequency region. This was used to determine the resistivity and susceptibility for electrolyte ions motion or movement, via diffusion, into the electrode particle interface, within the narrow pores. The diameter of this curve in the high frequency region connotes to the ESR. By description, a smaller curve indicates a smaller ESR, and vice versa [52]. Therefore, the relatively smaller curve observed from the Nyquist plot (Figure 13b) means a lower ESR value of the OPLAC-33% PA based carbon electrode. Consequently, this caused the electrode potential to slightly drop and increased the capacitance.
3.6. Thermogravimetric Analysis
Thermogravimetric analysis (TGA), and its derivatives (ΔTG), is one of the useful techniques employed to study the combustion and thermal behavior of biomass materials. The analysis serves as the basis or initial guideline for determining the exact temperature range in which the activation is to be carried out. Therefore, the data and results obtained from this analysis are very critical for evaluating the kinetic behavior of the materials during its disintegration in the oxidizing medium. It is worth remembering that the precursors used to prepare our activated carbon were wastes from typical plant or biomass materials generated from the oil palm plantation industry. Like any other biomass, oil palm leaves and palm kernel shells, as used in this study, consist mainly of hemicellulose, lignin, and cellulose, with some biopolymer extractives being inconsequential components. In effect, the presence of those former components in the precursors (biomass) has a considerable effect on the physical properties and thermal disintegration reaction of the materials. Therefore, the combustion and decomposition of these components, as the feedstock is pyrolyzed, will give greater insight as to the thermal characteristics of the as-produced materials, which was the main objective of these analyses. The broad peaks at around 74, 85, 96, and 100 °C, as in all the ΔTG curves (Figure 14), are ascribed to the elimination of physically adsorbed water [37] and the dehydration of oil palm precursors. It is widely described that the thermal decay of hemicelluloses occurs at temperatures between 150 to 350 °C, whereas cellulose and lignin are decomposed in the temperature ranges 275–350 °C and 250–500 °C, respectively [73]. However, in some cases, decomposition of lignin may occur even beyond 700 °C, of which is varied from one precursor to another, and the bond type involved (sp2 or sp) that would be broken. In this light, the peaks observed at 392 °C in OPLAC-0% PA could be ascribed to the thermal disintegration of hemicelluloses, whereas those at above 700 °C (Figure 14a–d) could be attributed to lignin disintegration. In general, this analysis provided an important data that is essential in the activated carbon preparation, processing, characterization, and application [74].
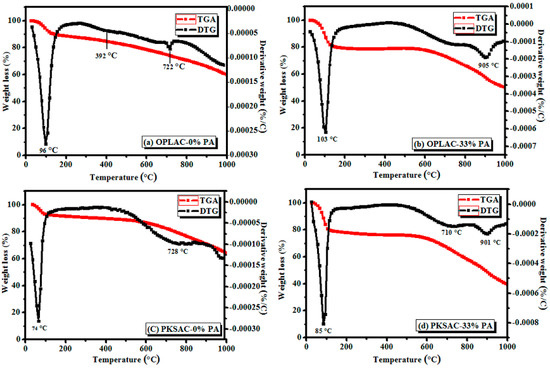
Figure 14.
Thermogravimetric and differential Thermogravimetric (TGA and ΔTG) curves of the OPL- and PKS-derived activated carbons (OPLAC and PKSAC), prepared by impregnation with 33% phosphoric acid (PA); carbonization-activation was performed at 900 °C.
4. Conclusions
On the whole, it can be concluded that oil palm by-products, namely OPL and PKS, as used in this research, are excellent and cost effective precursors for the fabrication of activated carbon. The large surface area and pore size and good charge-holding capacity of the as-produced AC makes it a suitable material for the carbon electrode of supercapacitors. This project has successfully converted bio-waste materials into high-value products, of which were easy to produce. Consequently, by using oil palm wastes as the feedstock, a lot of money can be saved on feedstock for the industrial production of activated carbon.
The notable surface area of the activated carbon played an integral role as an absorber for solvent impurities and for species desorbed from the glassy carbon surface. This paves the way for a carbon electrode surface with higher capacitance values.
Author Contributions
Conceptualization, S.N. and M.Z.H.; data curation, M.Z.H. and Z.Z.; formal analysis, S.N. and S.A.M.Z.; funding acquisition, M.Z.H. and N.A.Y.; investigation, S.N. and S.A.M.Z.; methodology, S.N. and S.A.M.Z.; project administration, M.Z.H., Z.Z., and N.A.Y.; resources, M.Z.H.; supervision, M.Z.H., Z.Z., and N.A.Y.; writing—original draft, S.N.; editing, Z.Z., M.Z.H., and N.A.Y.
Funding
This work was funded by Universiti Putra Malaysia and the Ministry of Higher Education of Malaysia under the Putra grant, GP-IPS/2018/9627200. The article processing charge (APC) was funded by Universiti Putra Malaysia (UPM).
Acknowledgments
Salisu Nasir would also like to thank the Federal University Dutse, Nigeria, for his Ph.D. study leave.
Conflicts of Interest
The authors declare no conflicts of interest.
References
- Khadiran, T.; Hussein, M.Z.; Zainal, Z.; Rusli, R. Activated carbon derived from peat soil as a framework for the preparation of shape-stabilized phase change material. Energy 2015, 82, 468–478. [Google Scholar] [CrossRef]
- Oreskes, N. The scientific consensus on climate change. Science 2005, 306, 1686. [Google Scholar] [CrossRef] [PubMed]
- Liverani, A. Climate Change and Individual Behavior: Considerations for Policy; World Bank Policy Research Working Paper Series No. 5058; The Word Bank: Washington, DC, USA, 2009; pp. 1–16. [Google Scholar]
- Deng, J.; You, Y.; Sahajwalla, V.; Joshi, R.K. Transforming waste into carbon-based nanomaterials. Carbon N. Y. 2016, 96, 105–115. [Google Scholar] [CrossRef]
- Kalyani, P.; Anitha, A. Biomass carbon & its prospects in electrochemical energy systems. Int. J. Hydrogen Energy 2013, 38, 4034–4045. [Google Scholar] [CrossRef]
- Notarianni, M.; Liu, J.; Vernon, K.; Motta, N. Synthesis and applications of carbon nanomaterials for energy generation and storage. Beilstein J. Nanotechnol. 2016, 7, 149–196. [Google Scholar] [CrossRef]
- Kumar, R.; Singh, R.K.; Singh, D.P. Natural and waste hydrocarbon precursors for the synthesis of carbon based nanomaterials: Graphene and CNTs. Renew. Sustain. Energy Rev. 2016, 58, 976–1006. [Google Scholar] [CrossRef]
- Deng, J.; Li, M.; Wang, Y. Biomass-derived carbon: Synthesis and application on energy storage and conversion. Green Chem. 2016, 18, 4824–4854. [Google Scholar] [CrossRef]
- Dai, L.; Chang, D.W.; Baek, J.-B.; Lu, W. Carbon nanomaterials for advanced energy conversion and storage. Small 2012, 8, 1130–1166. [Google Scholar] [CrossRef]
- Wang, H.; Li, Z.; Tak, J.K.; Holt, C.M.B.; Tan, X.; Xu, Z.; Amirkhiz, B.S.; Harfield, D.; Anyia, A.; Stephenson, T.; et al. Supercapacitors based on carbons with tuned porosity derived from paper pulp mill sludge biowaste. Carbon N. Y. 2013, 57, 317–328. [Google Scholar] [CrossRef]
- Zhu, Y.; Murali, S.; Stoller, M.D.; Ganesh, K.J.; Cai, W.; Ferreira, P.J.; Pirkle, A.; Wallace, R.M.; Cychosz, K.A.; Thommes, M.; et al. Carbon-based supercapacitors produced by activation of graphene. Science 2011, 332, 1537–1541. [Google Scholar] [CrossRef]
- Ali, G.A.M.; Manaf, S.A.B.A.; Kumar, A.; Chong, K.F.; Hegde, G. High performance supercapacitor using catalysis free porous carbon nanoparticles. J. Phys. D Appl. Phys. 2014, 47, 495307. [Google Scholar] [CrossRef]
- Demiral, H.; Demiral, I.; Karabacakoĝlu, B.; Tümsek, F. Production of activated carbon from olive bagasse by physical activation. Chem. Eng. Res. Des. 2011, 89, 206–213. [Google Scholar] [CrossRef]
- Nasir, S.; Hussein, M.; Zainal, Z.; Yusof, N. Carbon-based nanomaterials/allotropes: A glimpse of their synthesis, properties and some applications. Materials 2018, 11, 295. [Google Scholar] [CrossRef] [PubMed]
- Titirici, M.-M.; White, R.J.; Brun, N.; Budarin, V.L.; Su, D.S.; Del Monte, F.; Clark, J.H.; MacLachlan, M.J. Sustainable carbon materials. Chem. Soc. Rev. 2015, 44, 250–290. [Google Scholar] [CrossRef] [PubMed]
- Hussein, M.Z.; Abdul Rahman, M.B.; Yahaya, A.H.; Taufiq-Yap, Y.H.; Ahmad, N. Oil palm trunk as a raw material for activated carbon production. J. Porous Mater. 2001, 8, 327–334. [Google Scholar] [CrossRef]
- Nasri, N.S.; Hamza, U.D.; Ismail, S.N.; Ahmed, M.M.; Mohsin, R. Assessment of porous carbons derived from sustainable palm solid waste for carbon dioxide capture. J. Clean. Prod. 2014, 71, 148–157. [Google Scholar] [CrossRef]
- Jagtoyen, M.; Derbyshire, F. Activated carbons from yellow poplar and white oak by H3PO4 activation. Carbon N. Y. 1998, 36, 1085–1097. [Google Scholar] [CrossRef]
- Umar, M.S.; Jennings, P.; Urmee, T. Generating renewable energy from oil palm biomass in Malaysia: The Feed-in Tariff policy framework. Biomass Bioenergy 2014, 62, 37–46. [Google Scholar] [CrossRef]
- Gratuito, M.K.B.; Panyathanmaporn, T.; Chumnanklang, R.A.; Sirinuntawittaya, N.; Dutta, A. Production of activated carbon from coconut shell: Optimization using response surface methodology. Bioresour. Technol. 2008, 99, 4887–4895. [Google Scholar] [CrossRef]
- González, J.F.; Román, S.; Encinar, J.M.; Martínez, G. Pyrolysis of various biomass residues and char utilization for the production of activated carbons. J. Anal. Appl. Pyrolysis 2009, 85, 134–141. [Google Scholar] [CrossRef]
- González, G.P. Activated carbon from lignocellulosics precursors: A review of the synthesis methods, characterization techniques and applications. Renew. Sustain. Energy Rev. 2018, 82, 1393–1414. [Google Scholar] [CrossRef]
- Dolas, H.; Sahin, O.; Saka, C.; Demir, H. A new method on producing high surface area activated carbon: The effect of salt on the surface area and the pore size distribution of activated carbon prepared from pistachio shell. Chem. Eng. J. 2011, 166, 191–197. [Google Scholar] [CrossRef]
- Benaddi, H.; Legras, D.; Rouzaud, J.N.; Beguin, F. Influence of the atmosphere in the chemical activation of wood by phosphoric acid. Carbon N. Y. 1998, 36, 306–309. [Google Scholar] [CrossRef]
- Abdel-Ghani, N.T.; El-Chaghaby, G.A.; ElGammal, M.H.; Rawash, E.S.A. Optimizing the preparation conditions of activated carbons from olive cake using KOH activation. New Carbon Mater. 2016, 31, 2–10. [Google Scholar] [CrossRef]
- Molina-Sabio, M.; Rodríguez-Reinoso, F. Role of chemical activation in the development of carbon porosity. Colloids Surf. A Physicochem. Eng. Asp. 2004, 241, 15–25. [Google Scholar] [CrossRef]
- Karacan, F.; Ozden, U.; Karacan, S. Optimization of manufacturing conditions for activated carbon from Turkish lignite by chemical activation using response surface methodology. Appl. Therm. Eng. 2007, 27, 1212–1218. [Google Scholar] [CrossRef]
- Sing, K.S.W. Reporting physisorption data for gas/solid systems with special reference to the determination of surface area and porosity (Recommendations 1984). Pure Appl. Chem. 1985, 57, 603–619. [Google Scholar] [CrossRef]
- Thommes, M.; Kaneko, K.; Neimark, A.V.; Olivier, J.P.; Rodriguez-Reinoso, F.; Rouquerol, J.; Sing, K.S.W. Physisorption of gases, with special reference to the evaluation of surface area and pore size distribution (IUPAC Technical Report). Pure Appl. Chem. 2015, 87, 1051–1069. [Google Scholar] [CrossRef]
- Nasar, M.; Salisu, N. Investigation of effect of KBr matrix on drift infrared spectra of some minerals. ChemSearch J. 2014, 5, 14–19. [Google Scholar]
- Wu, M.; Li, P.; Li, Y.; Liu, J.; Wang, Y. Enteromorpha based porous carbons activated by zinc chloride for supercapacitors with high capacity retention. RSC Adv. 2015, 5, 16575–16581. [Google Scholar] [CrossRef]
- Bhati, S.; Mahur, J.S.; Dixit, S.; Chobey, O.N. Study on effect of chemical impregnation on the surface and porous characteristics of activated carbon fabric prepared from viscose rayon. Carbon Lett. 2014, 15, 45–49. [Google Scholar] [CrossRef]
- Yahya, M.A.; Al-Qodah, Z.; Ngah, C.W.Z. Agricultural bio-waste materials as potential sustainable precursors used for activated carbon production: A review. Renew. Sustain. Energy Rev. 2015, 46, 218–235. [Google Scholar] [CrossRef]
- Song, Y.; Liu, J.; Sun, K.; Xu, W. Synthesis of sustainable lignin-derived mesoporous carbon for supercapacitors using a nano-sized MgO template coupled with Pluronic F127. RSC Adv. 2017, 7, 48324–48332. [Google Scholar] [CrossRef]
- Nasir, S.; Hussein, M.Z.; Yusof, N.A.; Zainal, Z. Oil palm waste-based precursors as a renewable and economical carbon sources for the preparation of reduced graphene oxide from graphene oxide. Nanomaterials 2017, 7, 182. [Google Scholar] [CrossRef] [PubMed]
- Wang, R.; Wang, P.; Yan, X.; Lang, J.; Peng, C.; Xue, Q. Promising porous carbon derived from celtuce leaves with outstanding supercapacitance and CO2 capture performance. ACS Appl. Mater. Interfaces 2012, 4, 5800–5806. [Google Scholar] [CrossRef] [PubMed]
- Wang, K.; Zhao, N.; Lei, S.; Yan, R.; Tian, X.; Wang, J.; Song, Y.; Xu, D.; Guo, Q.; Liu, L. Promising biomass-based activated carbons derived from willow catkins for high performance supercapacitors. Electrochim. Acta 2015, 166, 1–11. [Google Scholar] [CrossRef]
- Li, Z.; Wu, D.; Liang, Y.; Xu, F.; Fu, R. Facile fabrication of novel highly microporous carbons with superior size-selective adsorption and supercapacitance properties. Nanoscale 2013, 5, 10824–10828. [Google Scholar] [CrossRef]
- Hu, Y.; Tong, X.; Zhuo, H.; Zhong, L.; Peng, X. Biomass-based porous n-self-doped carbon framework/polyaniline composite with outstanding supercapacitance. ACS Sustain. Chem. Eng. 2017, 5, 8663–8674. [Google Scholar] [CrossRef]
- Kumar, A.; Hegde, G.; Manaf, S.A.B.A.; Ngaini, Z.; Sharma, K.V. Catalyst free silica templated porous carbon nanoparticles from bio-waste materials. Chem. Commun. 2014, 50, 12702–12705. [Google Scholar] [CrossRef]
- Zequine, C.; Ranaweera, C.K.; Wang, Z.; Singh, S.; Tripathi, P.; Srivastava, O.N.; Gupta, B.K.; Ramasamy, K.; Kahol, P.K.; Dvornic, P.R.; et al. High per formance and flexible supercapacitors based on carbonized bamboo fibers for wide temperature applications. Sci. Rep. 2016, 6, 31704. [Google Scholar] [CrossRef]
- Ferrari, A.; Robertson, J. Interpretation of Raman spectra of disordered and amorphous carbon. Phys. Rev. B 2000, 61, 14095–14107. [Google Scholar] [CrossRef]
- Budde, H.; Coca Lopez, N.; Shi, X.; Ciesielski, R.; Lombardo, A.; Yoon, D.; Ferrari, A.C.; Hartschuh, A. Raman Radiation Patterns of Graphene. ACS Nano 2016, 10, 1756–1763. [Google Scholar] [CrossRef] [PubMed]
- Li, H.; Yuan, D.; Tang, C.; Wang, S.; Sun, J.; Li, Z.; Tang, T.; Wang, F.; Gong, H.; He, C. Lignin-derived interconnected hierarchical porous carbon monolith with large areal/volumetric capacitances for supercapacitor. Carbon N. Y. 2016, 100, 151–157. [Google Scholar] [CrossRef]
- Fang, Y.; Lv, Y.Y.; Che, R.C.; Wu, H.Y.; Zhang, X.H.; Gu, D.; Zheng, G.F.; Zhao, D.Y. Two-Dimensional Mesoporous Carbon Nanosheets and Their Derived graphene nanosheets: Synthesis and efficient lithium ion storage. J. Am. Chem. Soc. 2013, 135, 1524–1530. [Google Scholar] [CrossRef] [PubMed]
- Tuinstra, F.; Koenig, L. Raman spectrum of graphite. J. Chem. Phys. 1970, 53, 1126–1130. [Google Scholar] [CrossRef]
- Su, C.Y.; Xu, Y.; Zhang, W.; Zhao, J.; Liu, A.; Tang, X.; Tsai, C.H.; Huang, Y.; Li, L.J. Highly efficient restoration of graphitic structure in graphene oxide using alcohol vapors. ACS Nano 2010, 4, 5285–5292. [Google Scholar] [CrossRef] [PubMed]
- Sun, Y.; Shen, J.; Rice, G.; Atanassova, P.; Moeser, G.D. High Surface Area Graphitized Carbon and Processes for Making Same. WO2009/105076A1, 27 August 2009. [Google Scholar]
- Chen, G.Z. Understanding supercapacitors based on nanO–Hybrid materials with interfacial conjugation. Prog. Nat. Sci. Mater. Int. 2013, 23, 245–255. [Google Scholar] [CrossRef]
- Danish, M.; Hashim, R.; Ibrahim, M.N.M.; Sulaiman, O. Optimized preparation for large surface area activated carbon from date (Phoenix dactylifera L.) stone biomass. Biomass Bioenergy 2014, 61, 167–178. [Google Scholar] [CrossRef]
- Prabaharan, S.R.S.; Vimala, R.; Zainal, Z. Nanostructured mesoporous carbon as electrodes for supercapacitors. J. Power Sources 2006, 161, 730–736. [Google Scholar] [CrossRef]
- Chang, B.; Guo, Y.; Li, Y.; Yang, B. Hierarchical porous carbon derived from recycled waste filter paper as high-performance supercapacitor electrodes. RSC Adv. 2015, 5, 72019–72027. [Google Scholar] [CrossRef]
- Elmouwahidi, A.; Zapata-Benabithe, Z.; Carrasco-Marín, F.; Moreno-Castilla, C. Activated carbons from KOH-activation of argan (Argania spinosa) seed shells as supercapacitor electrodes. Bioresour. Technol. 2012, 111, 185–190. [Google Scholar] [CrossRef] [PubMed]
- Lin, G.; Jiang, J.; Wu, K.; Sun, K. Preparation and characterization of bamboo-based activated carbon by phosphoric acid activation. Carbon N. Y. 2014, 70, 321. [Google Scholar] [CrossRef]
- Subramanian, V.; Luo, C.; Stephan, A.M.; Nahm, K.S.; Thomas, S.; Wei, B. Supercapacitors from activated carbon derived from banana fibers. J. Phys. Chem. C 2007, 111, 7527–7531. [Google Scholar] [CrossRef]
- Bichat, M.P.; Raymundo-Piñero, E.; Béguin, F. High voltage supercapacitor built with seaweed carbons in neutral aqueous electrolyte. Carbon N. Y. 2010, 48, 4351–4361. [Google Scholar] [CrossRef]
- Ismanto, A.E.; Wang, S.; Soetaredjo, F.E.; Ismadji, S. Preparation of capacitor’s electrode from cassava peel waste. Bioresour. Technol. 2010, 101, 3534–3540. [Google Scholar] [CrossRef] [PubMed]
- Sun, L.; Tian, C.; Li, M.; Meng, X.; Wang, L.; Wang, R.; Yin, J.; Fu, H. From coconut shell to porous graphene-like nanosheets for highpower supercapacitors supercapacitors. J. Mater. Chem. A 2013, 1, 6462–6470. [Google Scholar] [CrossRef]
- Balathanigaimani, M.S.; Shim, W.G.; Lee, M.J.; Kim, C.; Lee, J.W.; Moon, H. Highly porous electrodes from novel corn grains-based activated carbons for electrical double layer capacitors. Electrochem. Commun. 2008, 10, 868–871. [Google Scholar] [CrossRef]
- Wu, F.C.; Tseng, R.L.; Hu, C.C.; Wang, C.C. Physical and electrochemical characterization of activated carbons prepared from firwoods for supercapacitors. J. Power Sources 2004, 138, 351–359. [Google Scholar] [CrossRef]
- Wu, F.C.; Tseng, R.L.; Hu, C.C.; Wang, C.C. Effects of pore structure and electrolyte on the capacitive characteristics of steam- and KOH-activated carbons for supercapacitors. J. Power Sources 2005, 144, 302–309. [Google Scholar] [CrossRef]
- Luan, Y.; Wang, L.; Guo, S.; Jiang, B.; Zhao, D.; Yan, H.; Tian, C.; Fu, H. A Hierarchical porous carbon material from a loofah sponge network for high performance supercapacitors. RSC Adv. 2015, 5, 42430–42437. [Google Scholar] [CrossRef]
- Biswal, M.; Banerjee, A.; Deo, M.; Ogale, S. From dead leaves to high energy density supercapacitors. Energy Environ. Sci. 2013, 6, 1249–1259. [Google Scholar] [CrossRef]
- Wang, X.; Gao, Z.; Chang, J.; Wu, D.; Wang, X.; Xu, F.; Guo, Y.; Jiang, K. Electrochemical energy storage and adsorptive dye removal of Platanus fruit-derived porous carbon. RSC Adv. 2015, 5, 15969–15976. [Google Scholar] [CrossRef]
- Abioye, A.M.; Noorden, Z.A.; Ani, F.N. Synthesis and characterizations of electroless oil palm shell based-activated carbon/nickel oxide nanocomposite electrodes for supercapacitor applications. Electrochim. Acta 2017, 225, 493–502. [Google Scholar] [CrossRef]
- Liu, M.C.; Kong, L.B.; Zhang, P.; Luo, Y.C.; Kang, L. Porous wood carbon monolith for high-performance supercapacitors. Electrochim. Acta 2012, 60, 443–448. [Google Scholar] [CrossRef]
- Guo, Y.; Qi, J.; Jiang, Y.; Yang, S.; Wang, Z.; Xu, H. Performance of electrical double layer capacitors with porous carbons derived from rice husk. Mater. Chem. Phys. 2003, 80, 704–709. [Google Scholar] [CrossRef]
- Raymundo-Piñero, E.; Cadek, M.; Béguin, F. Tuning carbon materials for supercapacitors by direct pyrolysis of seaweeds. Adv. Funct. Mater. 2009, 19, 1032–1039. [Google Scholar] [CrossRef]
- Rufford, T.E.; Hulicova-Jurcakova, D.; Khosla, K.; Zhu, Z.; Lu, G.Q. Microstructure and electrochemical double-layer capacitance of carbon electrodes prepared by zinc chloride activation of sugar cane bagasse. J. Power Sources 2010, 195, 912–918. [Google Scholar] [CrossRef]
- Li, X.; Xing, W.; Zhuo, S.; Zhou, J.; Li, F.; Qiao, S.Z.; Lu, G.Q. Preparation of capacitor’s electrode from sunflower seed shell. Bioresour. Technol. 2011, 102, 1118–1123. [Google Scholar] [CrossRef]
- Rufford, T.E.; Hulicova-Jurcakova, D.; Zhu, Z.; Lu, G.Q. Nanoporous carbon electrode from waste coffee beans for high performance supercapacitors. Electrochem. Commun. 2008, 10, 1594–1597. [Google Scholar] [CrossRef]
- Kalpana, D.; Cho, S.H.; Lee, S.B.; Lee, Y.S.; Misra, R.; Renganathan, N.G. Recycled waste paper—A new source of raw material for electric double-layer capacitors. J. Power Sources 2009, 190, 587–591. [Google Scholar] [CrossRef]
- Chen, W.H.; Kuo, P.C. A study on torrefaction of various biomass materials and its impact on lignocellulosic structure simulated by a thermogravimetry. Energy 2010, 35, 2580–2586. [Google Scholar] [CrossRef]
- Nasir, S.; Hussein, M.Z.; Zainal, Z.; Yusof, N.A.; Zobir, S.A.M.; Alibe, M.I. Potential valorization of by-product materials from oil palm: A review of alternative and sustainable carbon sources for carbon-based nanomaterials synthesis. BioResources 2019, 14. [Google Scholar] [CrossRef]
© 2018 by the authors. Licensee MDPI, Basel, Switzerland. This article is an open access article distributed under the terms and conditions of the Creative Commons Attribution (CC BY) license (http://creativecommons.org/licenses/by/4.0/).