1. Introduction
Developing countries with rapid urbanization in high buildings construction and the high power demand are a reason for the need for conversation and efficient energy program. The program requires monitoring of customer appliances energy consumption in real-time. Using smart meter had led to NILM enables estimation of individual power consumption used for aggregate power consumption in energy management recently.
In the factory field, researchers are working on Factory Energy Management System (FEMS) for efficient electric energy use. In recently, FEMS has been linked with to the Cyber-Physical Systems (CPS) of Industry 4.0. And the related researches will be more significant in this area [
1]. At resident homes, NILM provides the households understand their consumption usage via a cost-effective real-time monitoring appliances system. The customers need giving up unwanted activities to avoid producing unnecessary energy consumption such as the appropriate appliances usage time and appliances usage optimization. These activities can be obtained showing to customers the consumption of each appliance in the sum of the total billing to detect excesses or malfunction [
2]. Furthermore, it could be possible notify users of possible savings in their billing electricity. In contrary to this, Kelly et al. [
3] have argued that it is not proven yet that above activity and the additional feedback which become saving energy. In addition, there is an increase in micro-grids and renewable energy facility installation also continuous growth in recently. In purpose of increasing efforts these saving, automating energy measurement, energy monitoring, and the power management system are needed. In the load measurement of a power system, load monitoring has the main role that the process of acquiring and identifying the load [
4]. This load monitoring will determine the status of appliances and their consumption. Besides, it supports to understand the behavior of each load in the whole power system. There are two types of the load monitoring including Intrusive Load Monitoring (ILM) and Non-Intrusive Monitoring (NILM).
In ILM, the term “intrusive” means that there is the meter device in the resident house and close to the appliances to monitor. ILM deploys a measurement of the energy consumption of one or more household appliances using meter devices. In the ILM ecosystem, more low-end meter devices are needed. This makes hard to install, maintain, expand as well as expensive. In contrary to ILM, the term “non-intrusive” in NILM means that no extra equipment is installed in the house. NILM is a process which gives data from whole house energy consumption. This process includes installing a sensor device at the panel level and then the appliances will be inferred with being used. NILM preferred using than ILM because it is cheaper and easier installation. Instead of at least one-meter device per room, this technique requires only one-meter device for each energy entrance to the house. Energy disaggregation is another synonym for NILM. This technique estimates the power demand for each appliance from a single meter which contains the overall demand for several appliances.
A NILM system has three roles including capturing the signals from the aggregate consumption, extracting the feature uniquely from the load signal and classifying to identify which appliances are turned ON based on these features extracted. To identify the individual signature of each device, the NILM system requires several steps such as signal sampling (data acquisition), feature extraction based on signal analysis from the electrical signals. This paper presents a NILM framework including data acquisition, data feature extraction, and classification model. The contributions in this NILM study are: (1) propose a NILM framework, (2) collect the household appliances energy consumption data set in low-frequency sampling rate, (3) propose the algorithm to extract a new transient signal in low-frequency sampling rate, (4) improve the performance of NILM model in event detection as well as load identification.
The main contribution to be presented in this paper is a new approach to extract the transient uniquely. The proposed transient signal is extracted from the active power signal in the low-frequency sampling rate. This transient signal is used to detect the event of household appliances. Besides, an embedded board, Jetson TX2, is used to build the proposed NILM application system. This board has two roles to use in this research. The first role is to connect with the sensor to request and storage energy data (data acquisition). The second one is to build machine learning and deep learning models with high-performance training and testing. It is integrated Graphic Processing Unit (GPU) related to deep learning and its performance such as LSTM model. Furthermore, NILM Web application can be built for visualizing NILM result at this board. On the other hand, it can be replaced Jetson TX2 by other hardware that integrated GPU or normal personal computer (PC) without accelerated computing. Hence, the roles of Jetson TX2 is the same role with PC that integrated GPU to perform deep learning model. In summary, Jetson TX2 can connect to the sensor to storage data. Besides, it can build the machine learning, deep learning models, training, predicting and visualizing the result Jetson board or the PC has GPU with support high computation in a deep neural networks.
This paper is organized as follows. The next Section introduces the NILM system concept and presents a related literature works. In
Section 3, a NILM framework is proposed. The core of this NILM framework is to propose the algorithm to develop a new transient signal from power signal in low-frequency sampling rate. The experimental setup is described and experimental results are presented in
Section 4. Finally, conclusions and future works are drawn in
Section 5.
2. Related Works
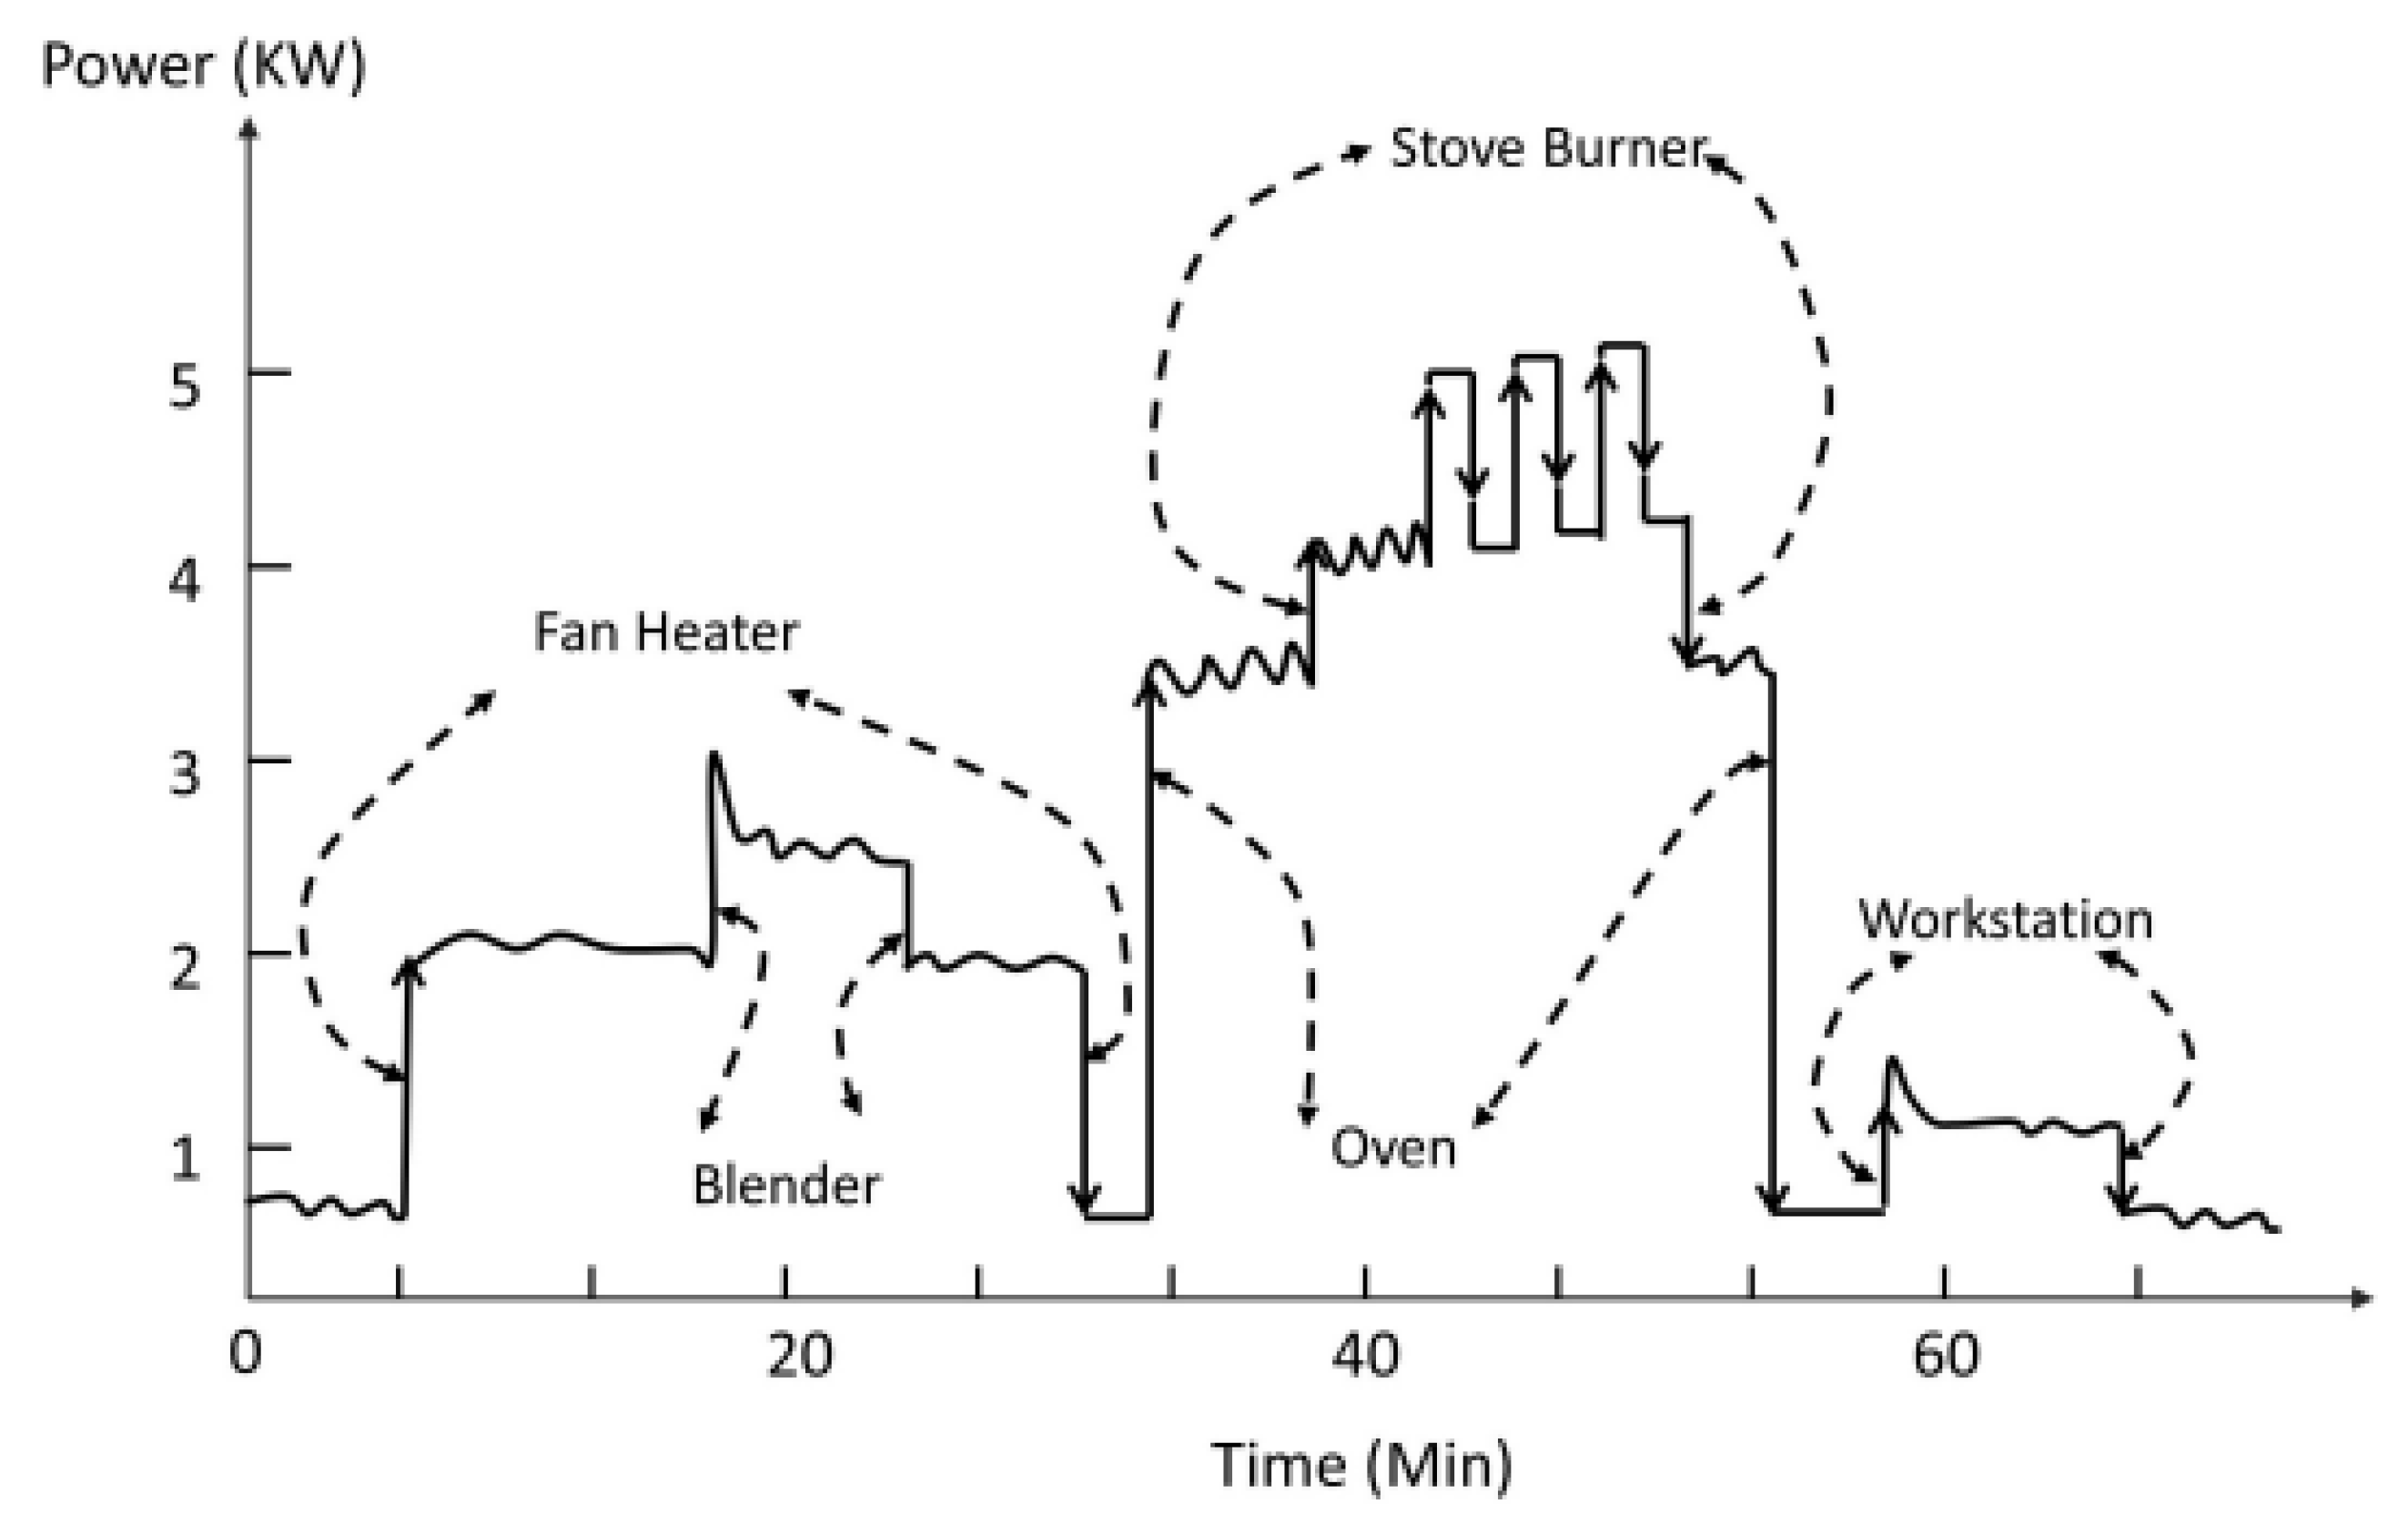
The initial NILM approach was proposed by Hart in 1990s [
5]. The author introduced the Non-Intrusive Appliance Load Monitor(NALM) is a software which was able to analyze single point electrical data and then obtained energy used correspond to individual electrical appliances.
Figure 1 shows the first concept of general NILM.
In recently, there are a number of studies have applied and extended this approach by using directly sampled which is increased the resolving power of the
space such in [
6,
7]. This approach has a limitation which cannot distinct appliances has similar in power signal and their operational principles, for example, hairdryer and iron. Hence, Laughman et al. [
8] proposed another advanced solution. The capable of this idea based on the transient shapes of appliances to recognize individual load. Besides, they proposed the analysis of the spectral envelopes for continuously variable loads. However, they have not solved the electric noise of appliance usage yet. Therefore, Patel et al. [
9] proposed a method to avoid the electric noise via combination software and hardware in household-level current sampling task at 1 MHz. They applied Support Vector Machine (SVM) model to trained the data to achieve accuracy at 90%. However, this technique has a limitation which requires high sampling rate with more kHz. Because of the meter device limitation, it is hard to apply in the real world environment. Furthermore, the need for an adjusting the prediction models on different data on training data is another drawback. The NILM algorithm needs to detect the appliance operation status (ON and OFF) from the power measurements. The NILM approaches can be classified as
event-based or
state-based based on different event detection strategies.
Event-based methods generated the state transient edges of appliances. This approach uses a change detection algorithm to determine the start and end of an event such in [
10,
11]. The significant information needs to extract to identification the event has occurred, for example, appliance signatures such as active power, rising or falling edge etc. These extracted features are analyzed to detect the event based on the appliances and their power consumption estimated. The researcher [
12] has used different classification methods such as K-Means, K-Nearest Neighbour (KNN), SVM, Hidden Markov Model (HMM) and HMM’s variations to detect event appliance. However, the performance of the event-based approach is not high because of the fixed threshold in the change detection algorithm, the large noise, and the similar among steady state signatures. Furthermore, false positive rate or false alarm rate may arise in the detection of edges methods.
State-based methods do not base on event detection. The idea is how to determine each appliance operation based on a state machine which is a different state transient using usage pattern of appliances [
13]. When the appliance is turned ON/OFF or is changed running states, the method creates new state power signal through a probability distribution to match to the original power signal of the appliance. HMM and its variants [
14,
15,
16,
17] are used in state-based NILM. However, state-based approaches have several limitations. Firstly, the need for expert knowledge to set a prior value for each appliance by long training periods. Secondly, they have the complexity to compute [
13,
18]. Finally, there is not a good way to handle states may stable unchanged for long time intervals [
19]. The requirement for an effective NILM algorithm is unique features or signatures have to characterize appliance behavior. Appliance signatures are a unique energy consumption pattern of all appliances. Ahmed Z., et al. [
17] used appliance signatures to uniquely identify and recognized appliance operations from the aggregated load measurements. In feature selection, two main appliance features are used by NILM research to identify loads including
steady-state and
transient state [
20].
Steady state is extracted when an appliance changes its running states related to sustained changes in power characteristics. The factors are used in this method including active power, reactive power, current, and voltage. The steady state signatures extraction of current and voltage do not demand high-end meter devices. Features at low frequency are used in the most commonly in steady state features in advance researches. However, the performance of this approach is limited by similarities among steady state signatures. In recently, deep neural network (DNN) in deep learning field becomes more attractive and widely system recognition applied in several areas such as handwritten recognition, speed recognition etc. Specifically, LSTM model is a kind of DNN model which is applied to classification applications have time series data. In NILM, this model is applied to load identification on the UK Domestic Appliance-Level Electricity (UK-DALE) dataset using active power by Kelly et al. [
21]. However, the author pointed out the performance limitation on the appliances have informative events in power signal can be many time steps such as washing machine. Besides, Kim et al. [
22] applied LSTM model on the variant power signals are generated from active power in low frequency on several public datasets. This method overcomes the long gaps between event may present a challenge in LSTM. In future NILM works, LSTM model may become more and more promising and effecting learning method for researchers.
Contrary to the
steady state features, before settling into a steady state value,
transient state features are short-term fluctuations in current or power. To create transient feature uniquely, the authors [
17] defined appliance state transients which are shapes, size, duration, and harmonics by sampling current and voltage waveforms at high frequency. Hence, these transient features can achieve signal uniquely to a high degree. Besides, they capture all operation cycles in high sampling rates in longer monitoring time [
23]. For example, Patel et al. [
9] proposed a custom hardware built to detect the transient noise in range 0.001 kHz to 100 kHz frequency. Then, the authors used the fact that each appliance in-state operation transmits noise back to the power line. However, the high sampling rate required is the major drawback to obtain transient features such as current spikes, transient response time, repeatable transient power profiles, spectral envelopes, etc. [
24]. When using a high sampling rate, the system demands a costly hardware and complicated to be installed in the home to detect these transient features [
24]. The cause is smart meters report only low-frequency power. In the transient state analysis, the researchers [
25,
26] analyzed and captured the load signatures based on wavelet transform and transient energy algorithm. Artificial Neural Network (ANN) and HMM are used to improve the performance of NILM in these researches, respectively. Although the results were very much significant, there are still the little drawbacks. For example, the authors [
25] sampled at high frequency for current and voltage waveform data to capture the transient effect. Nevertheless, doing this will increase the cost of energy meters because modern energy meters are not equipped with such functionality. Besides, the authors [
26] used the data which have the repeatable transient energy signature for load identification because of the varying transient with these waveforms. Therefore, the sampling of the instantaneous load profile for each turn ON transient is required much diligence. In addition, the authors [
27] applied the Wavelet Transform Coefficient (WTC) based on ON/OFF transient signal identification in data acquisition. Although WTC works better than Fourier Transform, WTC requires much longer computation time. Besides, it needs larger machine resource like memory usage.
In summary, the low-frequency or high-frequency data collected is used in classifying appliance recognition systems based on signature feature extraction. A low-frequency data sampling rate is implemented in without additional installation by using existing meter infrastructure. Contrary to this, high-frequency data sampling rate needs adding more hardware installing in data acquisition. Especially, the limitations of high sampling rate data acquisition are more expensive cost and more complex in signature database management [
28,
29]. However, a more accurate and precise analysis can be provided with more information and assistance [
30]. Hence, using a low-frequency sampling rate is more promising in event detection appliances based on analysis the active power and/or reactive power. A new necessary technique of NILM has valid three most important factors to introduce into services for end-users. First thing is an ability to widely appropriately applied in household. The second thing is the usage of the low-cost device to retrieve the energy consumption. The third thing is able to recognition appliances with the same power signal and appliances with variable power signals in the low-frequency sampling data. Hence, in this work, new transient signal is extracted from the active power signal in the low-frequency sampling rate to overcome the problem in advance studies.
3. The Proposed NILM Framework
The proposed NILM framework is introduced in this Section.
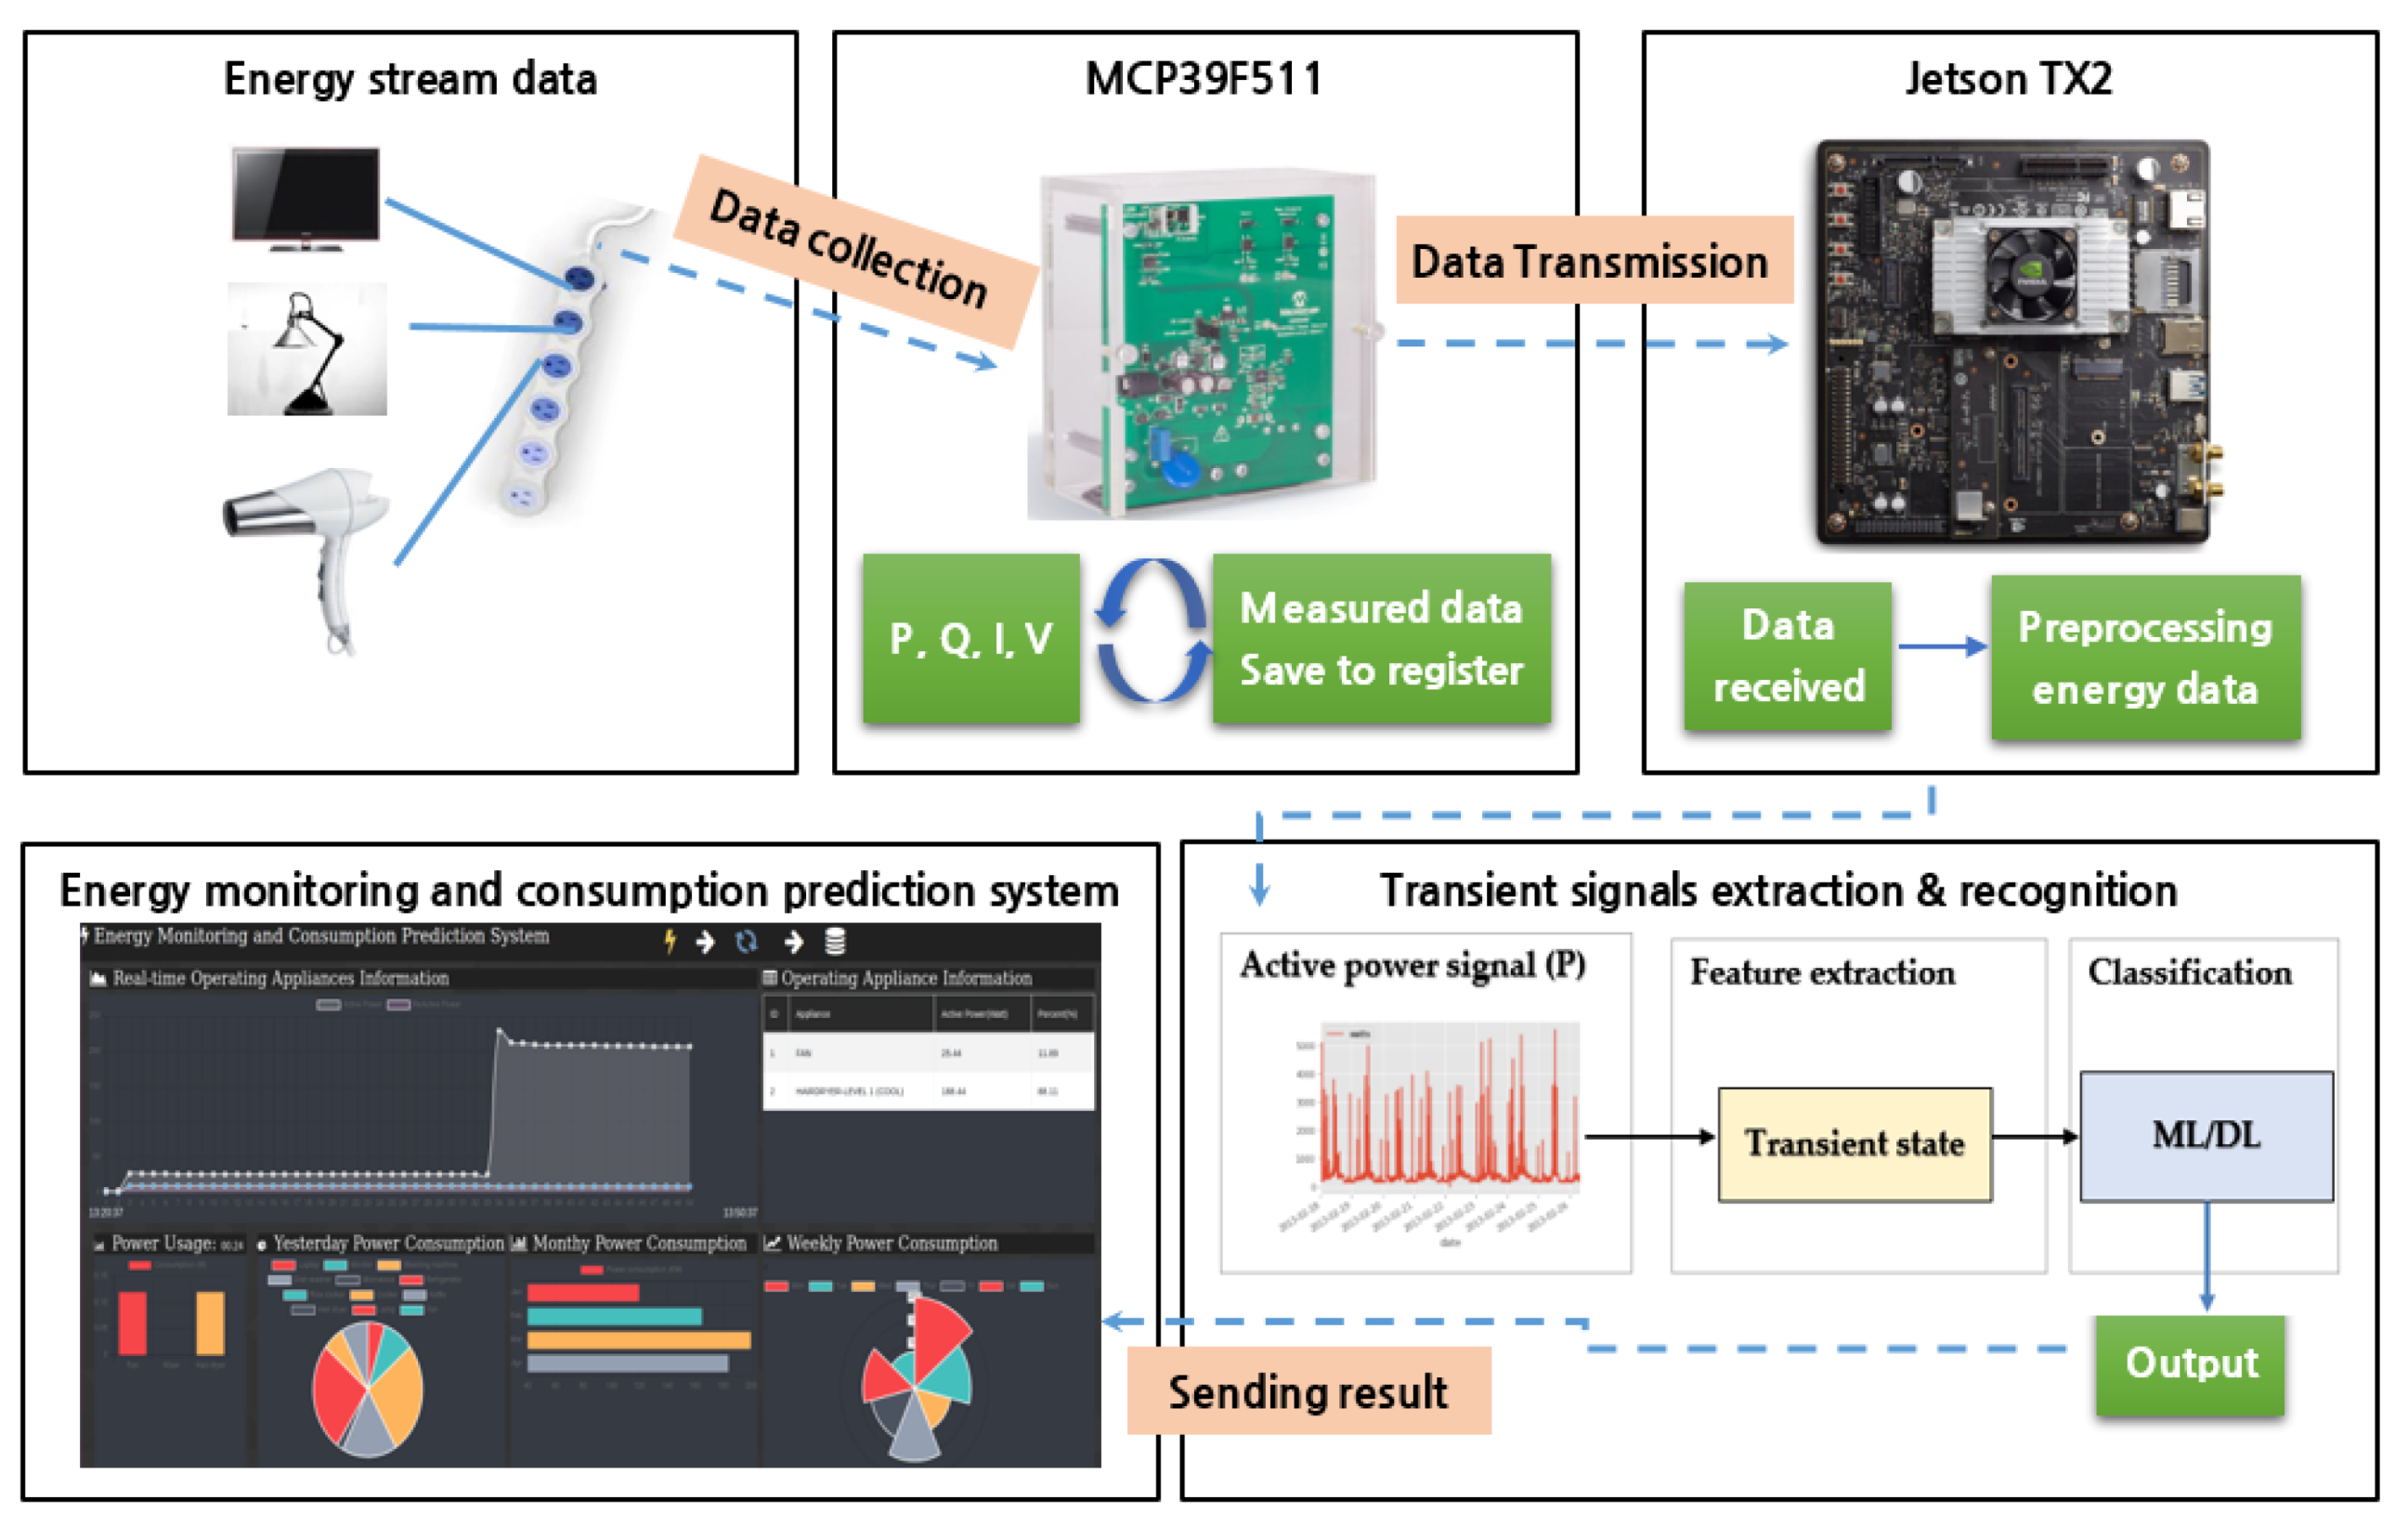
Figure 2 shows the proposed NILM system. The proposed NILM system includes several components such as energy stream data, sensing device MCP39F511 (Microchip Technology Inc., Chandler, AZ, USA), an embedded board Jetson TX2 (NVIDIA Corporation, Santa Clara, CA, USA), transient signal extraction and recognition, and energy monitoring and consumption prediction system.
3.1. Energy Stream Data
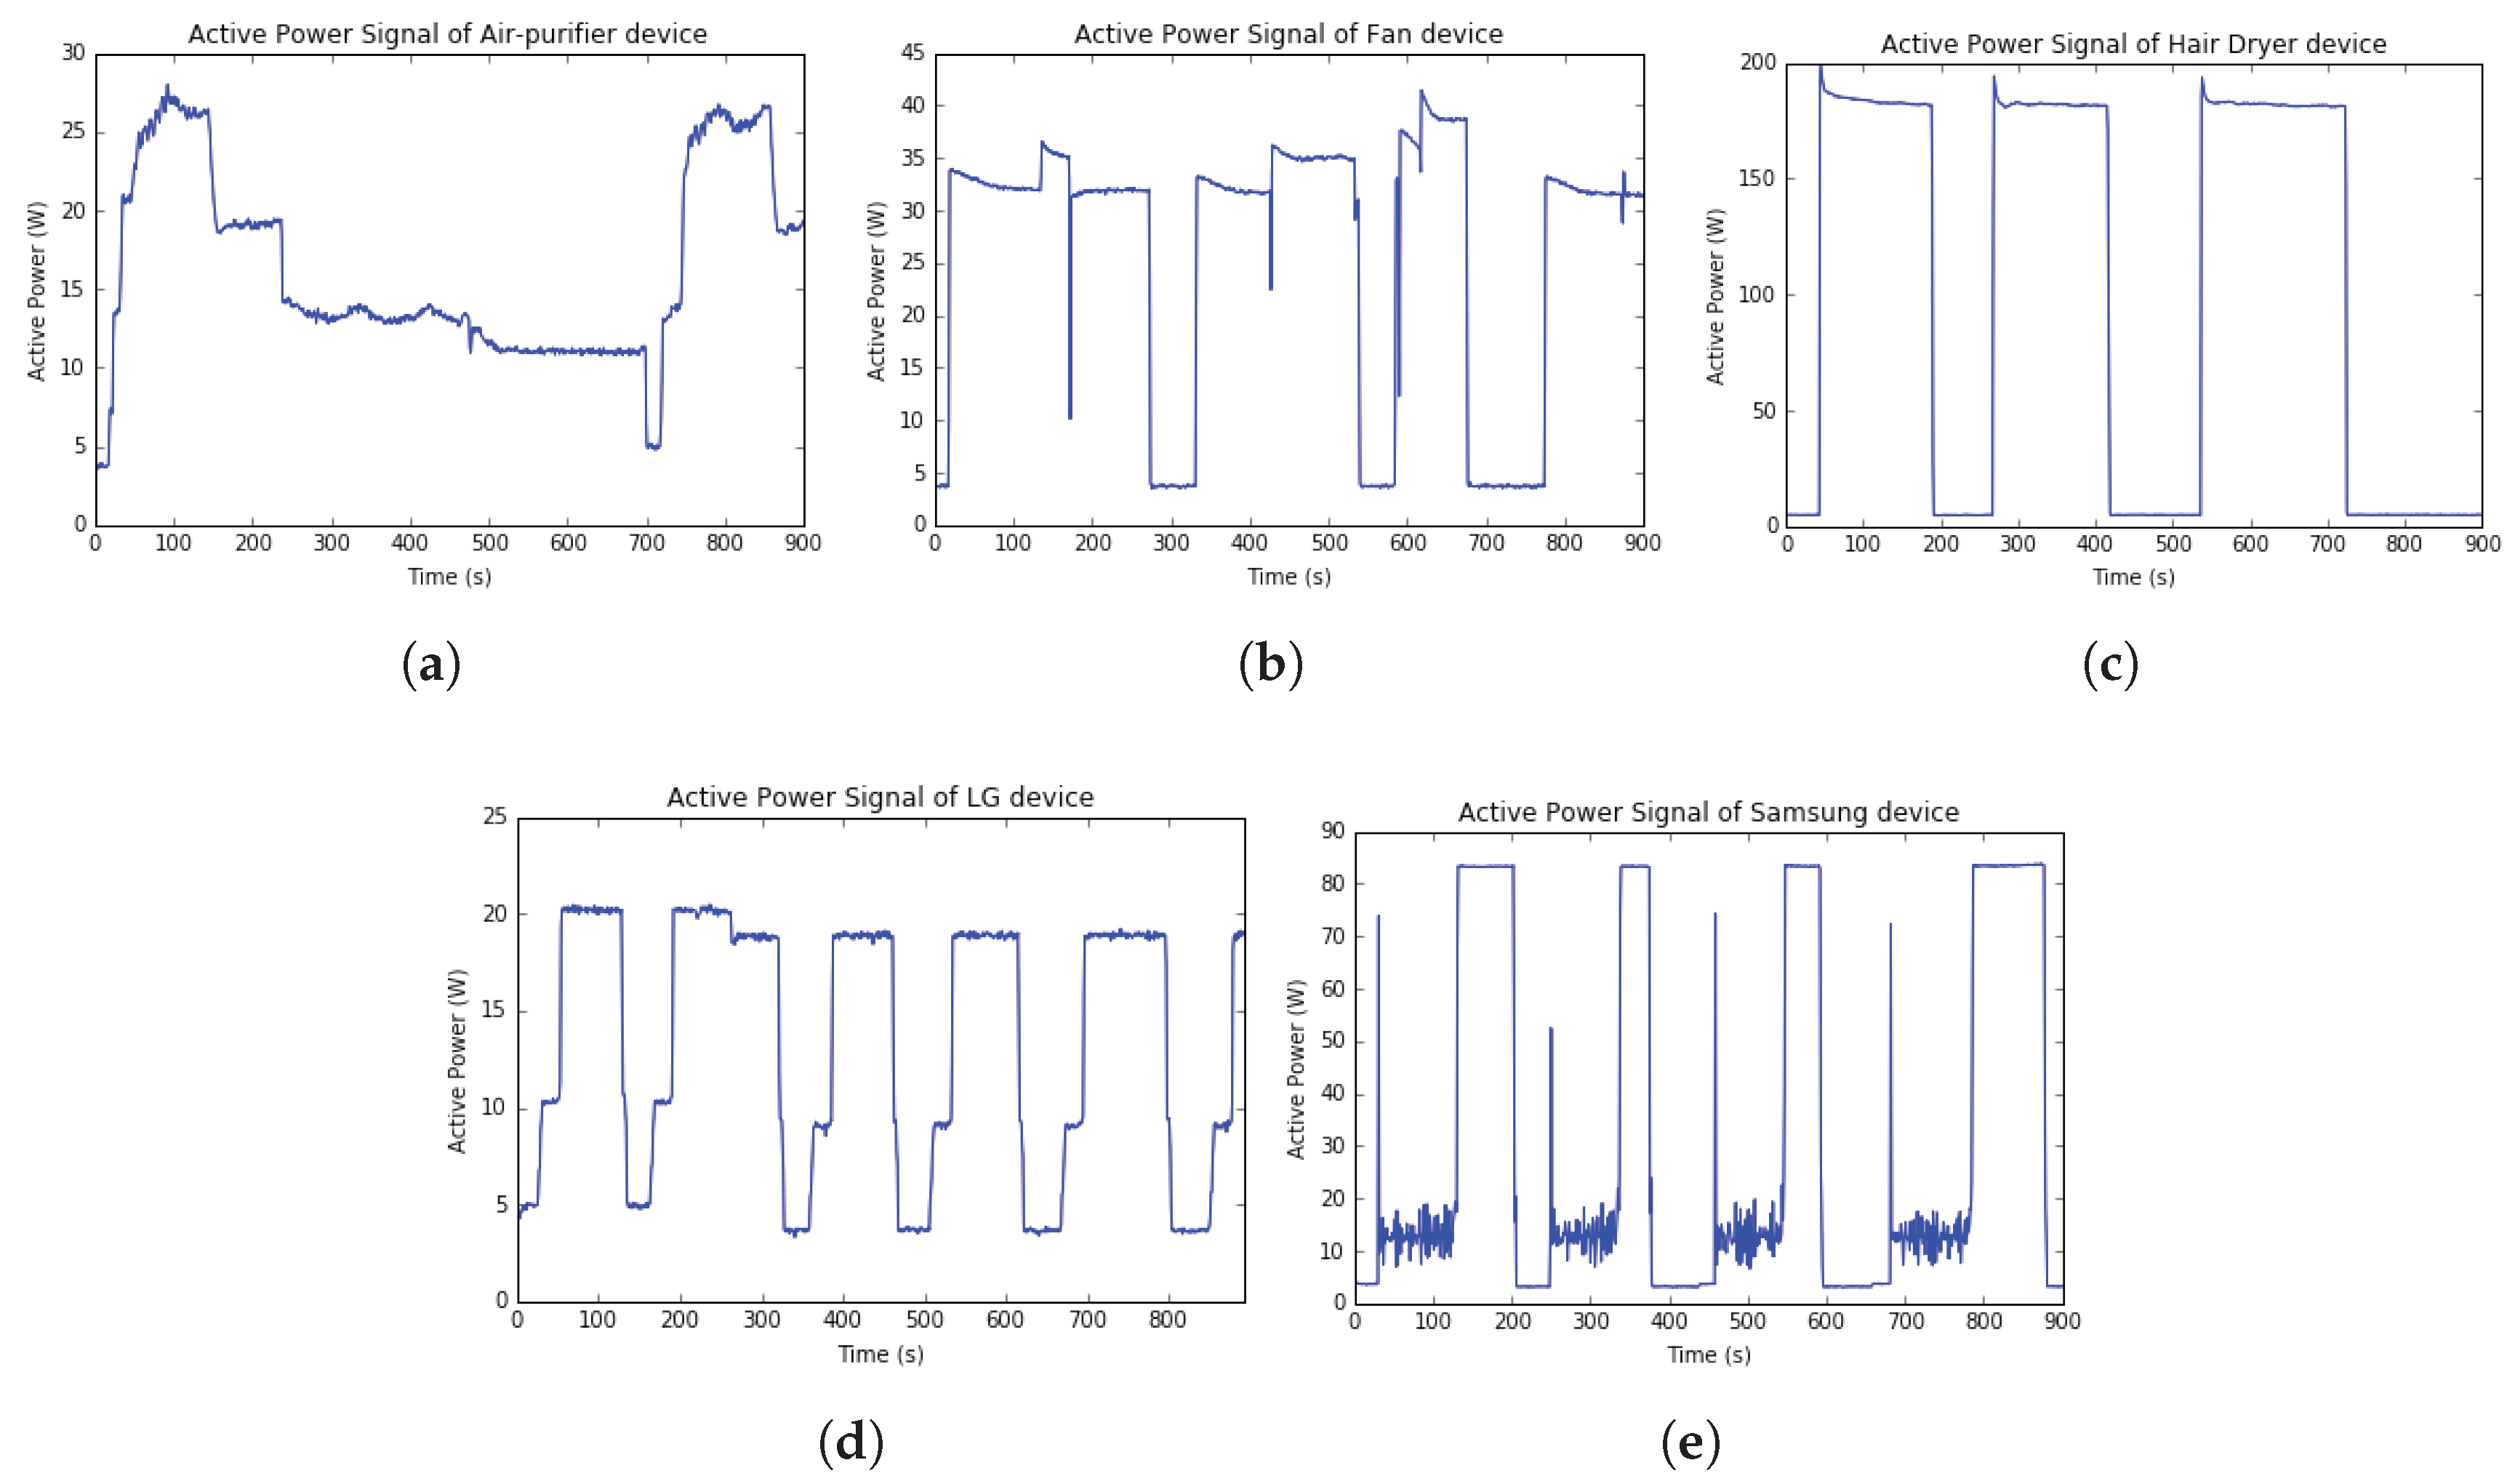
In data acquisition, several household appliances and the multi-tab power (HJ04009-10010C, KC Electric Company, Seoul, Korea) to collect energy data are prepared. Five appliances are collected including Air-purifier (LG Electronics Inc., Seoul, Korea), Fan (Cixi Xiongsheng Electrical Appliances Co., Ltd., Ningbo, China), Hairdryer (Korea Hanil Electronics, Seoul, Korea), LG monitor (LG Electronics Inc., Seoul, Korea), and Samsung monitor (Samsung Electronics Inc., Suwon, Korea). These appliances are connected to sensing device MCP39F511 via a multi-tab and the sensor’s port.
Table 1 describes models and power consumption of five appliances which are used to collect energy data.
Besides, twenty test cases data are also collected. The purpose of testing data collection is to obtain variant transient signals of five appliances. Each test case corresponds to set up that require the number of appliances is different. To each appliance, four combinations between this appliance and 1, 2, 3, or 4 other appliances are create in this work. Therefore, each appliance has four different transient signals in this collecting process. The process to collect testing data includes two steps as follows. The first step is to turn ON simultaneously all appliances required for each test. The second step is to make one appliance transient by turn OFF and then turn ON while other appliances are still ON.
Table 2 presents the process to collect twenty test cases in detail.
3.2. MCP39F511
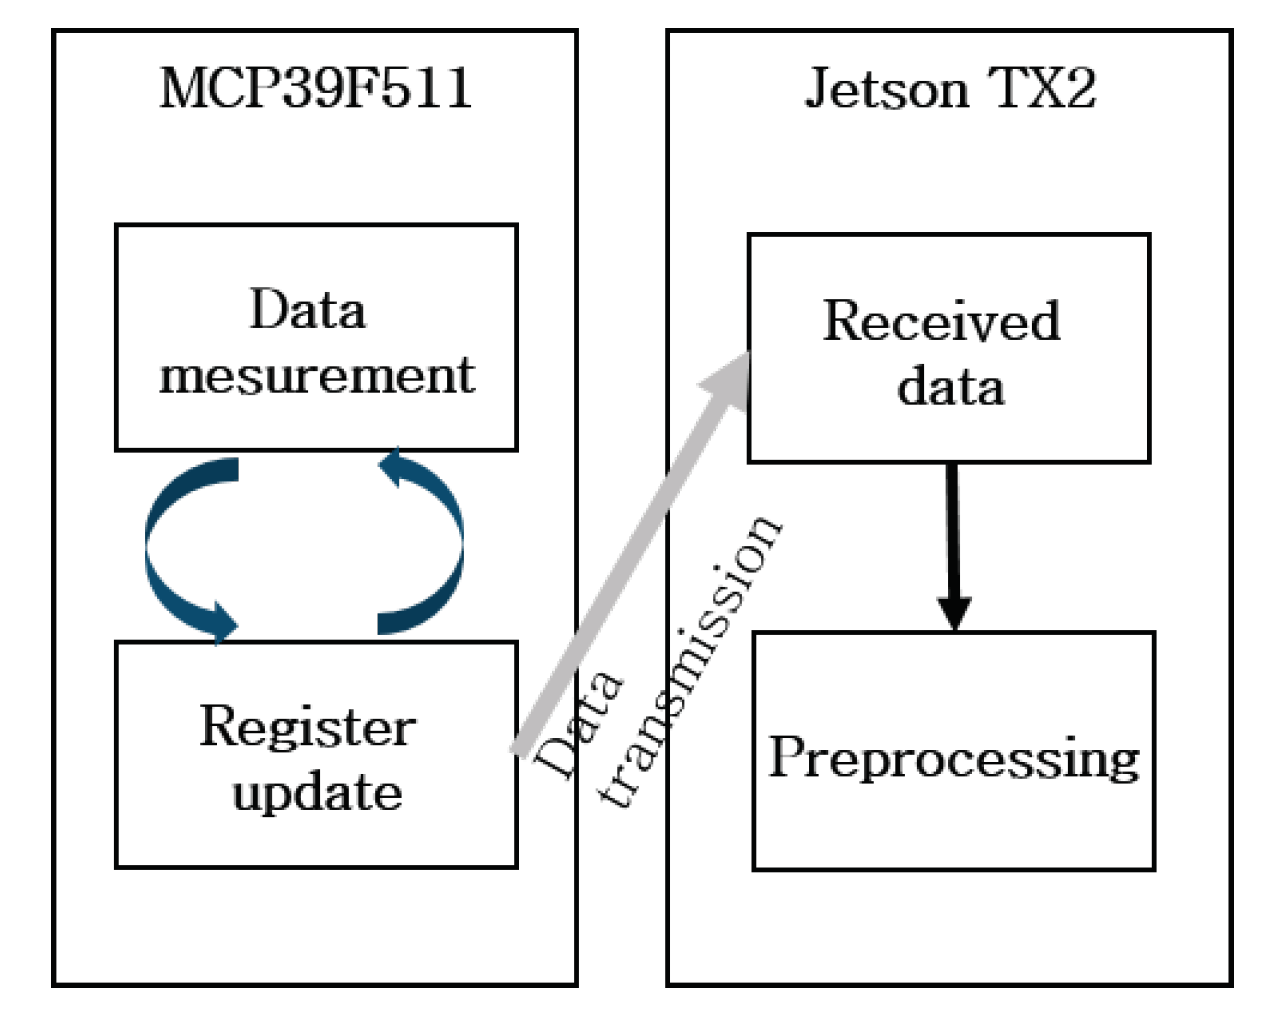
The MCP39F511 is a power monitoring device that can measure input power in real time for the consumer, power distribution units, AC/DC power supplies. This sensor supports 2-wire serial protocols and Universal Asynchronous Receiver/Transmitter (UART)with enabling select full speed at up to 115.2 kbps. This sensor has a Power Monitor Demonstration Board which is a fully functional single-phase power. The system calculates and displays active power, reactive power, RMS current, RMS voltage, active energy (both import and export), and four quadrants reactive energy. MCP39F511 changes data acquisition mode compare to a conventional method. In the conventional method, data acquisition mode is getting energy data stored in registers by sending a command from PC. In this sensor device, the mode is getting energy data via connecting to Jetson TX2 (see
Figure 3) via some steps as follows.
Step 1: Jetson TX2 sends a command to switch to single wire mode. This single wire mode includes twenty bytes such as Header Byte (0 × AB), Header Byte 2 (0 × CD), Header Byte 3 (0 × EF), Current RMSs with Byte 0 to Byte 3, Voltage RMSs with Byte 0 to Byte 1, Active Power with Byte 0 to Byte 3, Reactive power with Byte 0 to Byte 3, Line Frequency with Byte 0 to Byte 1, and final is check sum.
Step 2: Single wire mode is automatically sent whenever the sensing device updates energy data.
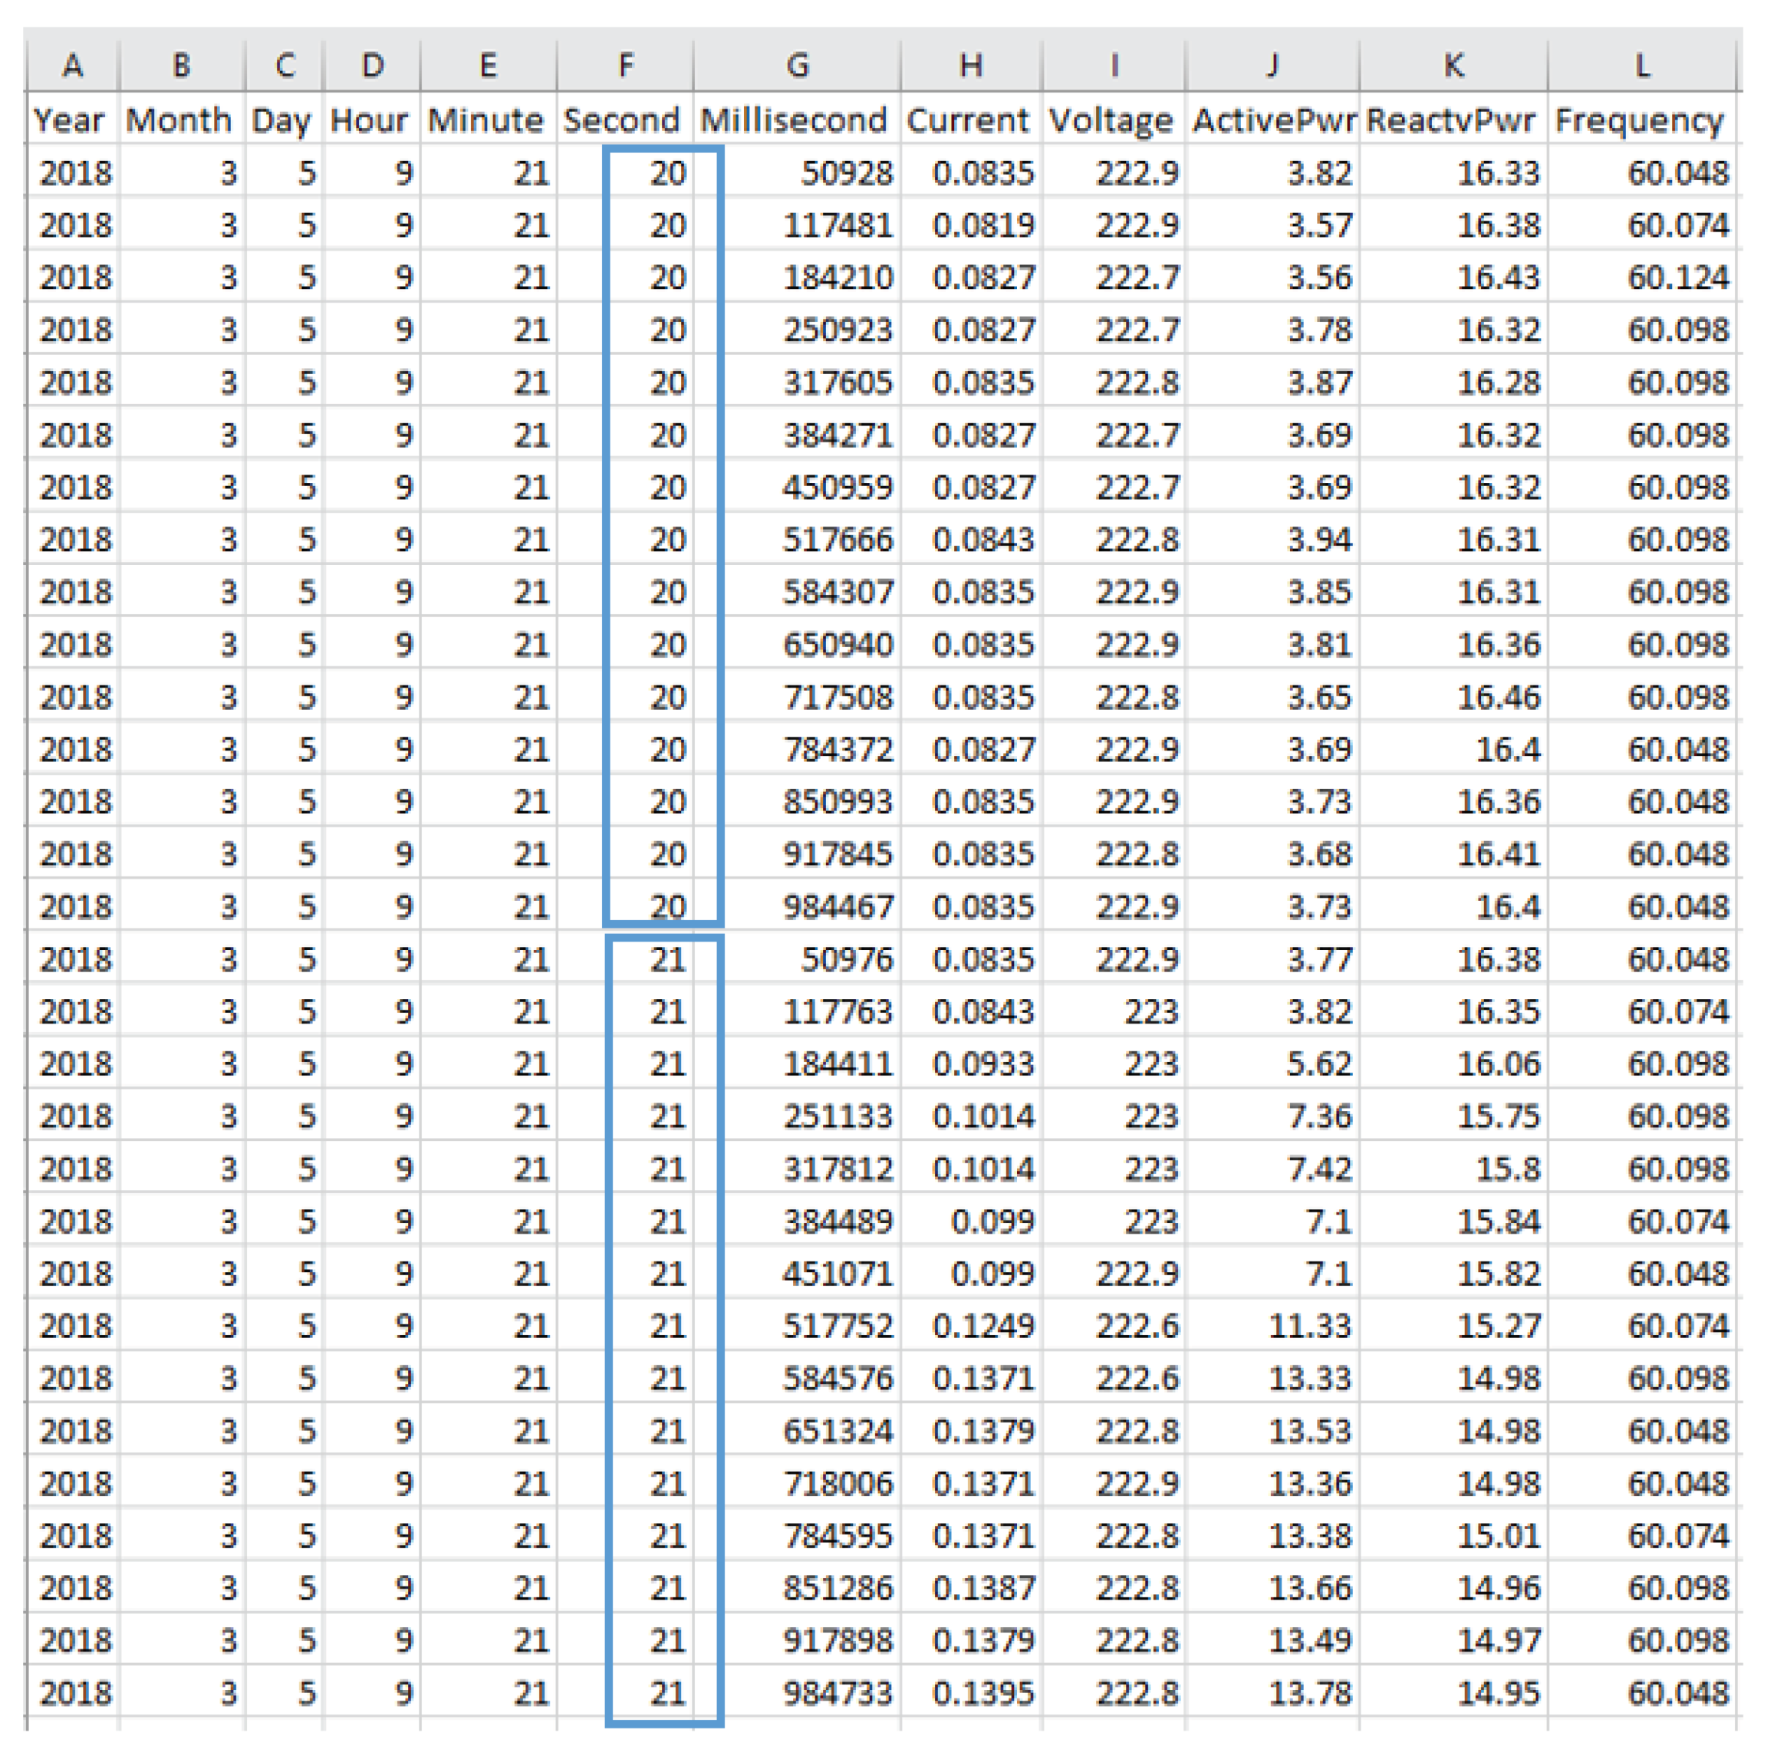
Step 3: The sampling rate is in 15 Hz (see
Figure 4).
There is a coherent sampling algorithm to phase lock the sampling rate to the line frequency based on an integer number of sample per line cycle in the computation cycle of MCP39F511. After that, it reports all power output quantities at a number of line cycles. The power outputs include RMS current, RMS voltage, apparent power, active power. The accumulation interval is defined as an number of line cycles, where N is the value in the Accumulation Interval Parameter register. Equations (1)–(5) system calculate and display RMS current (), RMS voltage (), Apparent power (S), Active power (P), Reactive power (Q), and Power factor as follows.
RMS current equation (
) with unit is Amps (A):
RMS voltage equation (
) with unit is Volt (V):
Apparent power equation (
S) with unit is Volt-Amps (VA):
Active power equation (
P) with unit is Watts (W):
In the MCP39F511, Reactive power (
Q) with Volt-Amps-Reactive unit (VAR) is measured based on a
-degree phase shift in the voltage channel. The common degree is 90-degree phase shift. Accumulator Unit (ACCU) acts as the accumulator where has the similar accumulation principles applied to Active power (
P). In the Gain Reactive power register, Gain is corrected. In the Reactive power register, an unsigned 32-bit value is located which is the final output. P is measured by the formula below.
The ratio of
P to
S or Active power divided by Apparent power is Power factor (
) measurement.
3.3. Jetson TX2
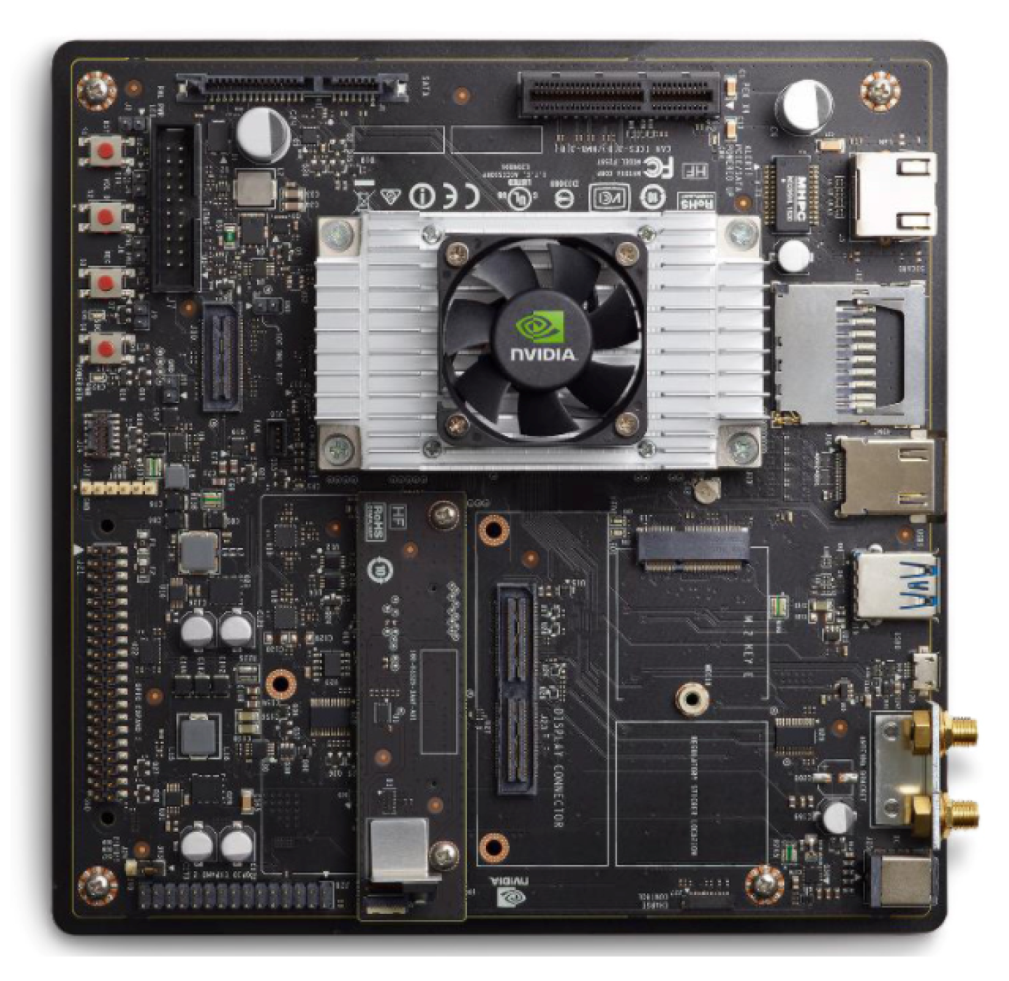
Jetson is the low-power embedded platform in the world’s leading. Besides, it enables server-class AI to compute performance everywhere. Jetson’s features include an integrated 256-core NVIDIA Pascal GPU, a hex-core ARMv8 64-bit CPU complex, and 8GB of LPDDR4 memory with a 128-bit interface.
Figure 5 shows the CPU complex which combines a dual-core NVIDIA Denver 2 alongside a quad-core ARM Cortex-A57.
Table 3 shows Jetson TX2 technical specifications in detail. The installation files of Jetson TX2 are set up including,
GPU includes Cuda, cudnn
Machine learning/ deep learning with Tensorflow 1.3
Python 3rd party lib with Pandas, numpy, jupyter, pyserial, matplotlib etc.
Power Sensor Interlock is CDC ACM module
Server includes Node.js 6.11.3, Npm 3.10.10, MongoDB-enterprise
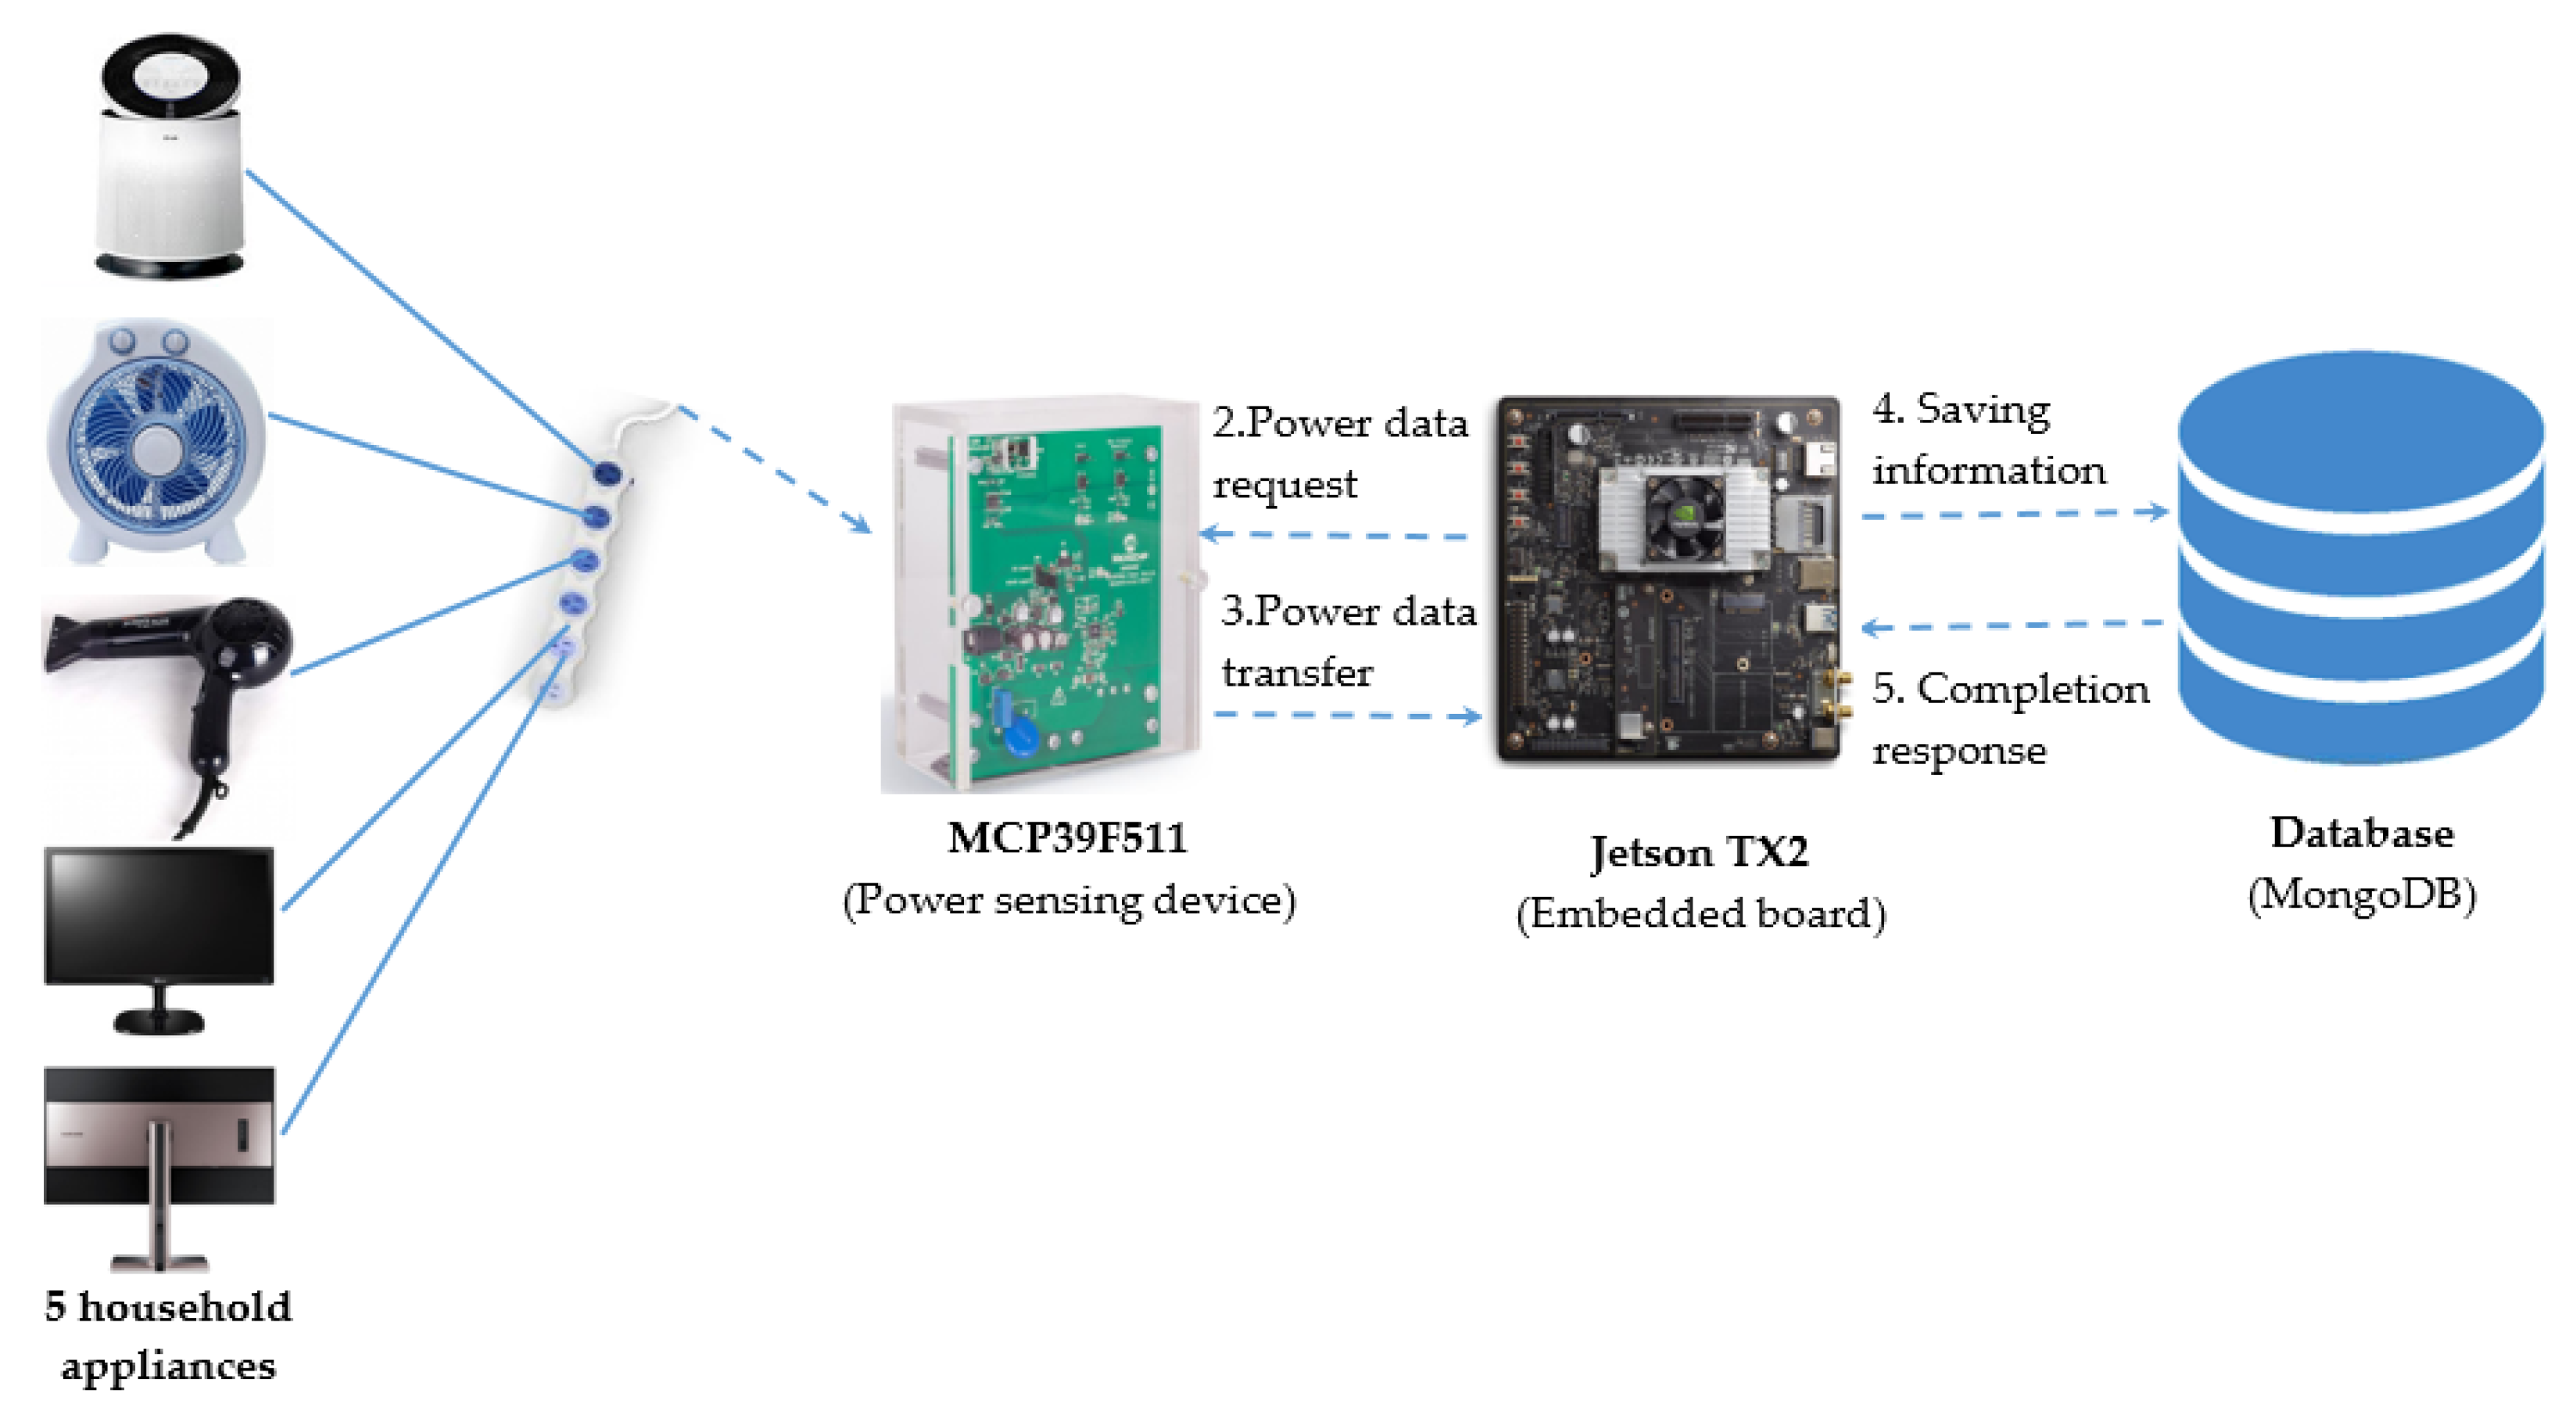
It is a necessary to configure the system for collecting energy data from the appliances. The stream energy data is calculated in the power sensing device (MCP39F511). When the embedded board (Jetson TX2) sends a power data request, the sensing device will transfer power data via a single wire mode transmission frame 15 times per second. After that, Jetson TX2’s processor operates to sort data received from MCP39F511 and save the data result to database management (MongoDB). For instance,
Figure 6 shows the system configuration diagram to collect data from five household appliances (Air-purifier, Fan, Hairdryer, LG monitor, and Samsung monitor).
To collecting and storing the energy data, this paper proposes Algorithm 1. The algorithm consists of four steps as follows.
Step 1. Setting up serial connect from NVIDIA Jetson TX2 to MCP39F511
Step 2. Checking frame with 20-byte frame
Step 3. Calculating power data including current, voltage, active power, reactive power, frequency
Step 4. Storing data into NVIDIA Jetson TX2
| Algorithm 1 The requesting and storing energy data of Jetson TX2 |
- Require:
- Ensure:
current (I), voltage (V), activepwr (P), reactivepwr (Q), frequency (F)
- 1:
if. is Connected () then - 2:
. write () - 3:
else - 4:
print ("serial connection error!") - 5:
exit() - 6:
end if - 7:
while. is Connected() do - 8:
= .read() - 9:
= check_frame () - 10:
if = True then - 11:
I, V, P, Q, F = calculate_power_data () - 12:
save_to_database (I, V, P, Q, F) - 13:
end if - 14:
end while
|
In this algorithm, it defines two functions. The first function is check_frame() to check frame with 20-byte frame in single wire mode. The second one is calculate_power_data() to measure energy data information in Root Mean Square (RMS).
3.4. Transient Signal Extraction and Recognition
Based on literature observation above, this paper states three problems needing solve as follows.
Problem 1. Analyzing and extracting new transient signal from original power signal in low sampling rate data in feature extraction.
Problem 2. Labeling ON/OFF data on new transient signals extracted.
Problem 3. Improving the performance for event detection as well as load identification using a new transient signal results and machine learning/deep learning models.
This study selects active power factor which is a unique input in this approach.
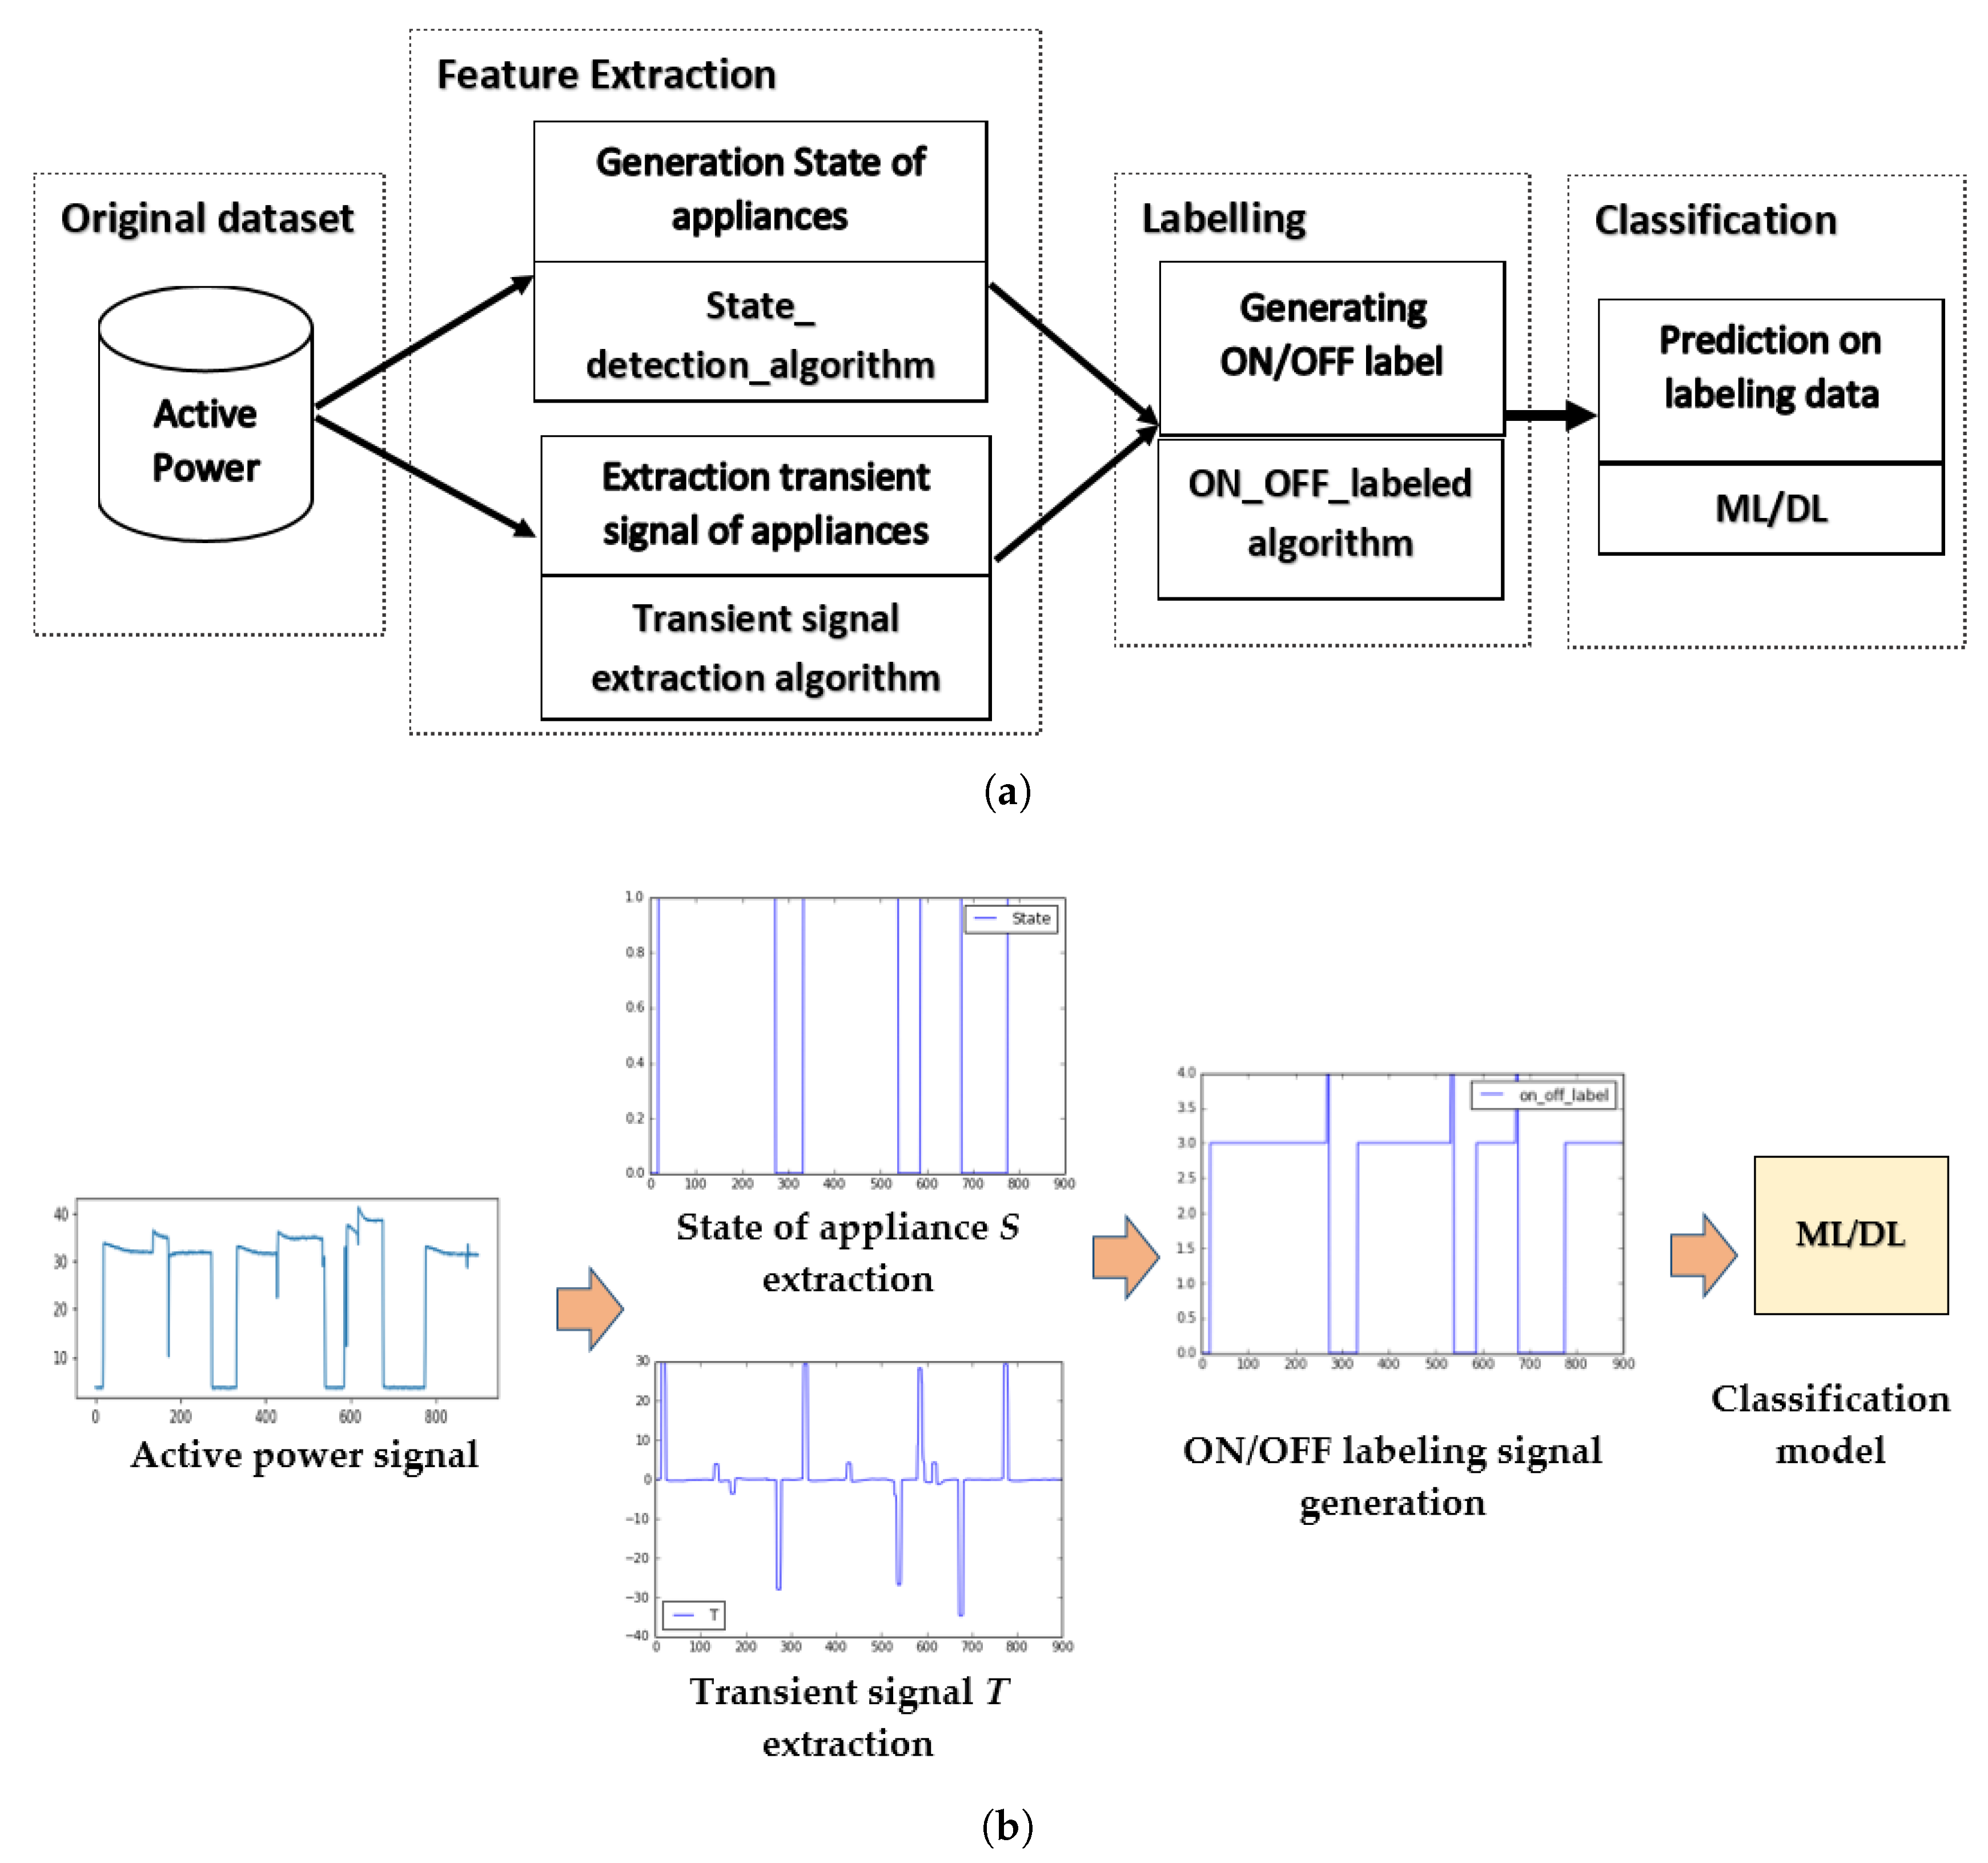
Figure 7 shows in detail of the proposed solution. The
Figure 7a displays the process of this solution. The
Figure 7b is to illustrate the process in
Figure 7a, respectively. The proposed method includes three processes, such as feature extraction, labeling, and classification. The first, the feature extraction task is to generate the state of the appliance and to extract the transient signal of appliances. The second, labeling task is to label ON/OFF data with state and transient signals of appliance after extracting. The final, classification task is to learn and classify the ON/OFF appliance based on the transient signal and ON/OFF label signal.
In feature extraction task, to label ON/OFF for appliance data, this work generates two signals including State of appliance signal and Transient signal. Hence, this paper proposes two algorithms, Algorithms 2 and 3.
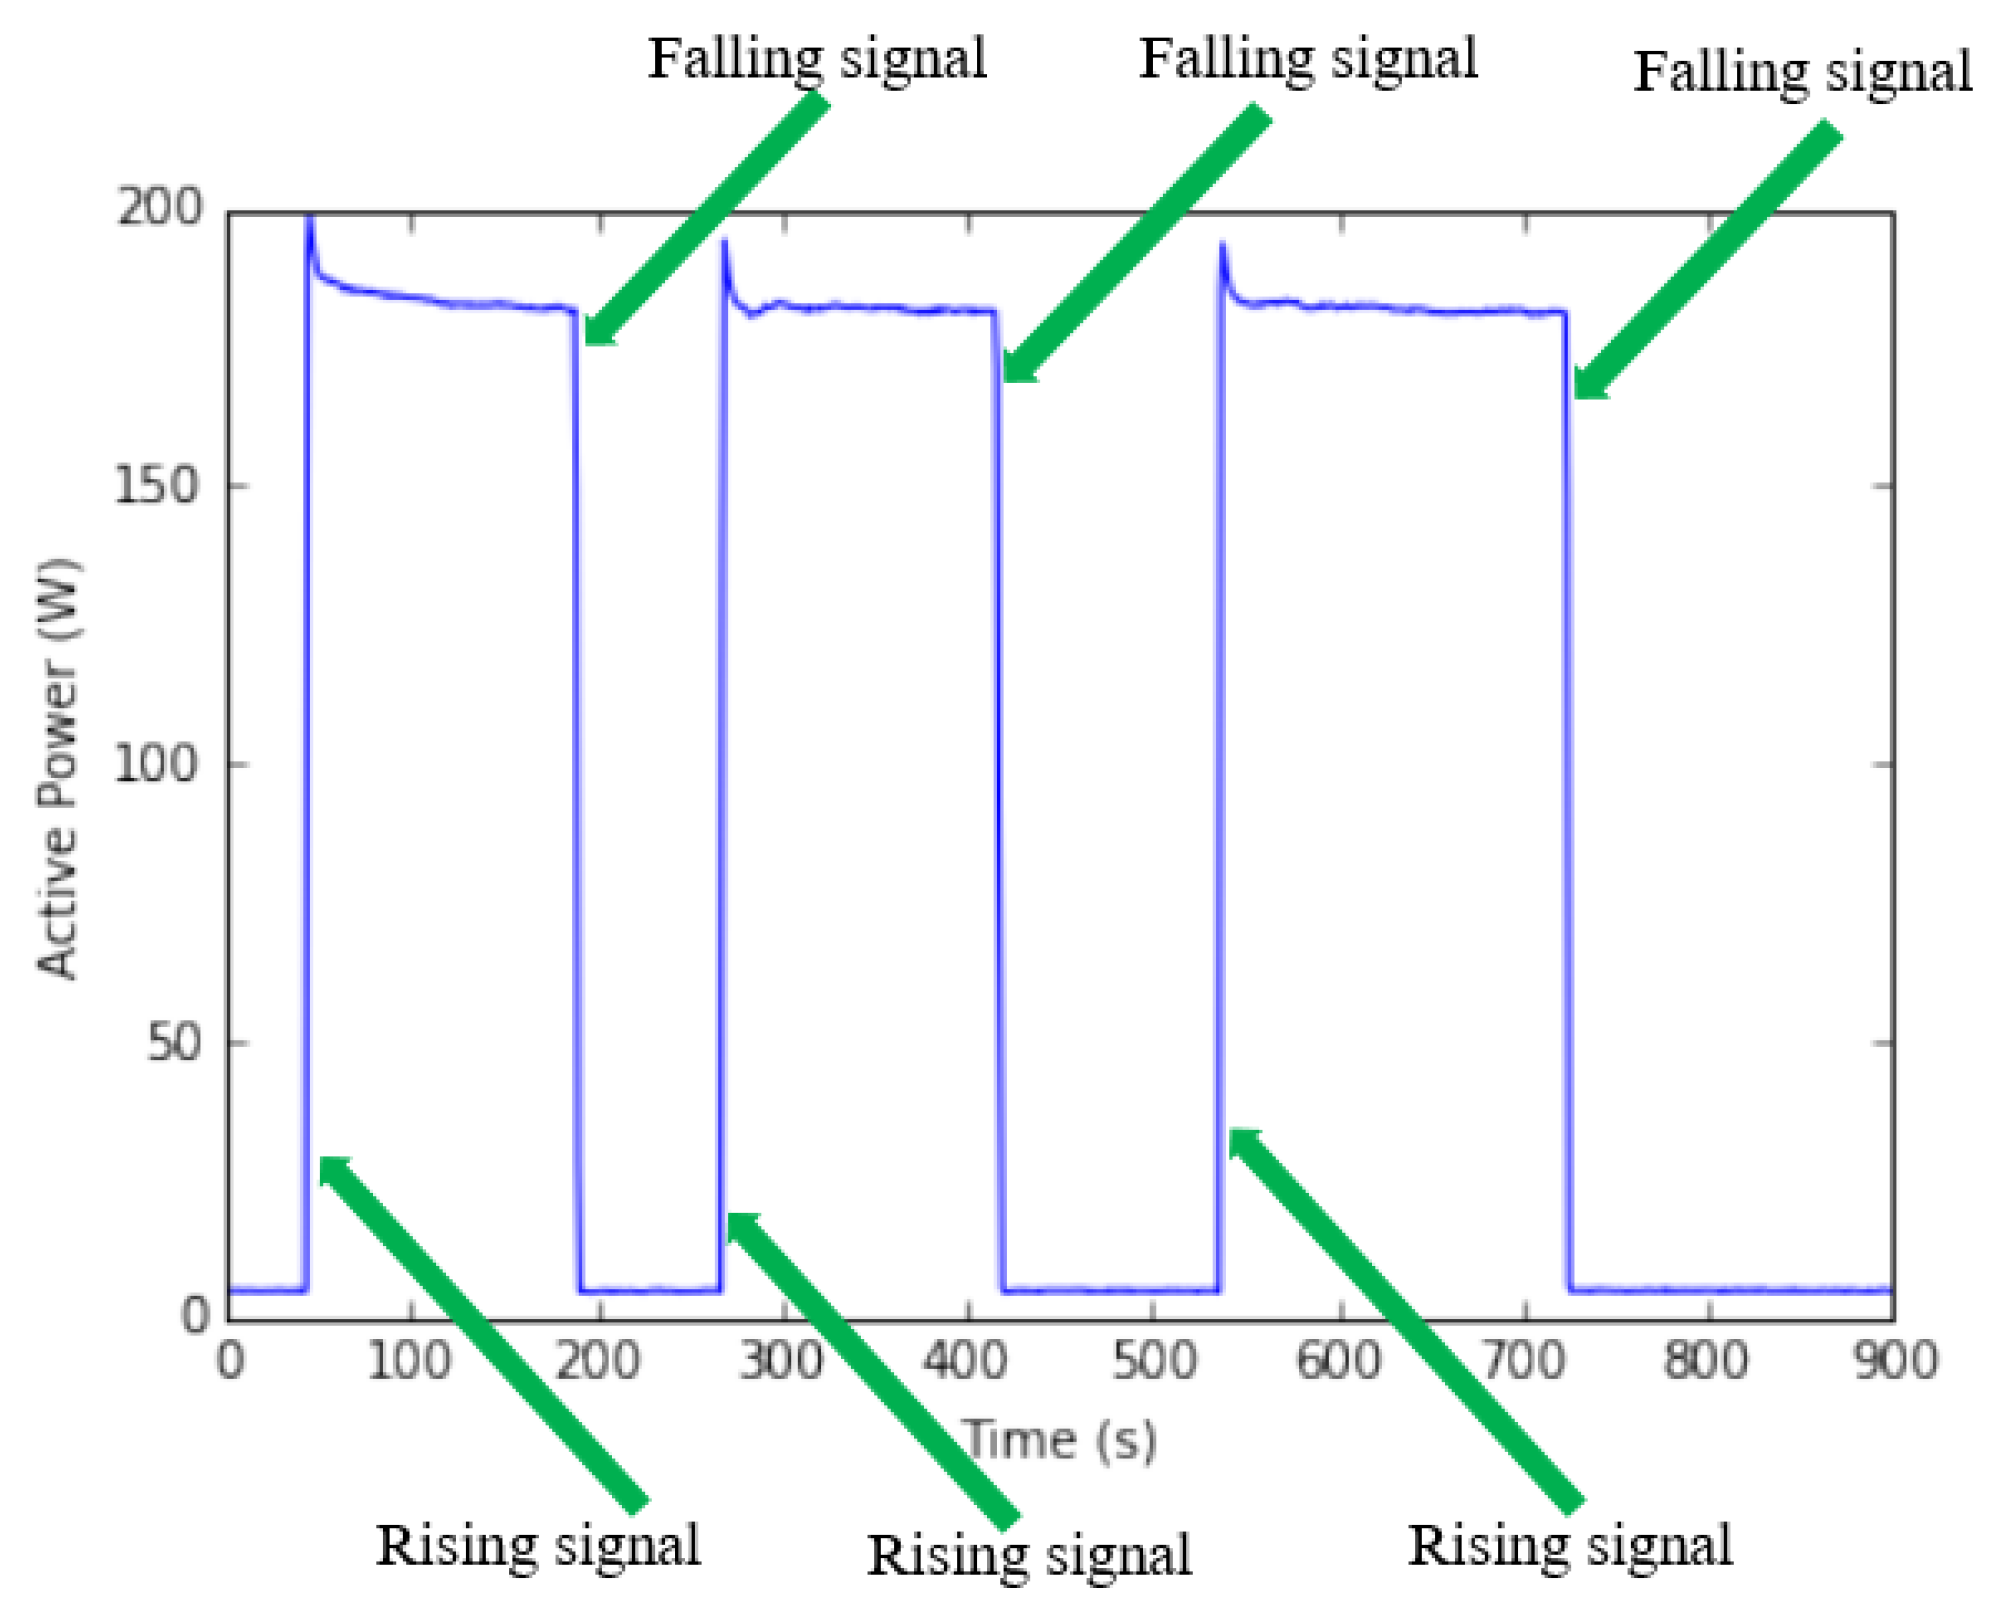
The main idea of this task is how to detect whether or not rising and falling signals from the active power signal. The rising signal means appliance is operating (ON state). The falling signal means appliance is changing state from ON to OFF. Sliding window size of time series data is used to trace power signal to detect changing signals. Hence, the performance of the changing detection algorithm does not depend on the fixed or adaptive threshold, the large measure noise, and similarities among steady state signatures.
Figure 8 shows the changing signals from active power signal of the appliance.
Algorithm 2 is to generate State of the appliances, denoted by S. S value extracted is used for the input of Algorithm 4.
| Algorithm 2 State of the appliances generation algorithm |
- Require:
Activepwr - Ensure:
State of appliance (S) - 1:
length of P - 2:
histogram (P) - 3:
- 4:
⟵ 0 - 5:
⟵ 1 - 6:
fori in range ) do - 7:
if 0 then - 8:
S0 - 9:
else if < then - 10:
S - 11:
else - 12:
S - 13:
end if - 14:
end for - 15:
returnS
|
Algorithm 3 is to extract new transient signal from active power signal, denoted by T. T value is determined based on calculating prior P data () and post P data (). To assign and values, the requirement is to use the window size w of P time series data and time shifting time series data of P is +1 for value. The size of w depends on the sample size of P and periodicity of the data. To get smaller smoothing moving the average of time series data, there is an initialization of w value is 5. Hence, confidence intervals for the smoothed values are get. T signal extracted from this algorithm becomes to the input of Algorithm 4. If T value has negative value it means corresponding to P active power has falling signal, and then setting appliance’s label is OFF event. In contrast to this, the active power has a rising signal, and then setting appliance’s label is ON event.
| Algorithm 3 Transient signal extraction algorithm |
- Require:
Activepwr - Ensure:
Transient signal extraction (T)
- 1:
length of P - 2:
- 3:
[0] - 4:
fori in range do - 5:
0 - 6:
for j in range (15) do - 7:
- 8:
- 9:
- 10:
- 11:
end for - 12:
T - 13:
end for - 14:
returnT
|
In labeling task, this paper generates ON/OFF labeling by the proposed Algorithm 4. T signal and state of the appliances are extracted by Algorithms 2 and 3, respectively. They become to the input of this algorithm. The task of Algorithm 4 is to generate ON_label or OFF_label from T signal. This study defines value is −5 which is a maximum threshold value to determine whether event status changing from ON to OFF event. If T value extracted at time t smaller than −5 it means that at that time has occurred event changing from ON to OFF. In case S variable has 0 value, it means that no event operation. If T value is smaller than , it is assigned label is ; else it is assigned label is . value or value of each appliance are different values. For example, there are two appliances including Air-purifier and Fan. This paper defines sets of ON/OFF labels of these appliances as follow. Labels of Air-purifier device are = 1 and = 2. And labels of Fan device are = 3 and = 4. For setting ON/OFF labeling values of each appliance and twenty-test cases data, this paper mentions the labels for testing data in next Section.
| Algorithm 4 Labeling ON/OFF algorithm |
- Require:
Transient signal extracted (T), State of appliance (S) - Ensure:
- 1:
length of (T) - 2:
[] - 3:
- 4:
fori in range do - 5:
if 0 then - 6:
0 - 7:
else if then - 8:
- 9:
else - 10:
- 11:
end if - 12:
end for - 13:
return
|
In the classification task, this paper evaluates the proposed method using the models in both Machine Learning (ML) and Deep Learning (DL) fields. For learning T signal and ON/OFF labeling signal, Decision Tree and Long Short-Term Memory (LSTM) models are selected in ML and DL, respectively.
Decision Tree is a supervised learning method. It is used in both classification and regression tasks. The input feature of this model is used to infer the output feature by learning simple decision rules. CART [
31] (Classification and Regression Trees) is similar to C4.5, however, two different to C4.5 are it supports the regression task in numerical target variable and does not need to compute rule sets. This algorithm builds binary trees based on the feature and threshold with the largest information gain at each node. In a decision tree algorithm, it needs training vectors
and a vector
. This algorithm needs to recursively partition such that grouping the same labels in a group together. A feature
f and threshold
, partition the data into
and
subsets are contained in each candidate split
The impurity is the choice of the classification or regression task. The impurity at
j is calculated based on an impurity function
.
Select the parameters that minimizes the impurity is formulated by
as follows.
Recurse for subsets
and
reaching the maximum allowable depth,
or
. In the classification task, the output classification represents a region
with
observations taking on value
, for node
j.
be the proportion of class
k observations in node
j.
is a spitting criterion that makes used of the impurity measure.
Common measures of impurity are Gini index which is calculated as follows.
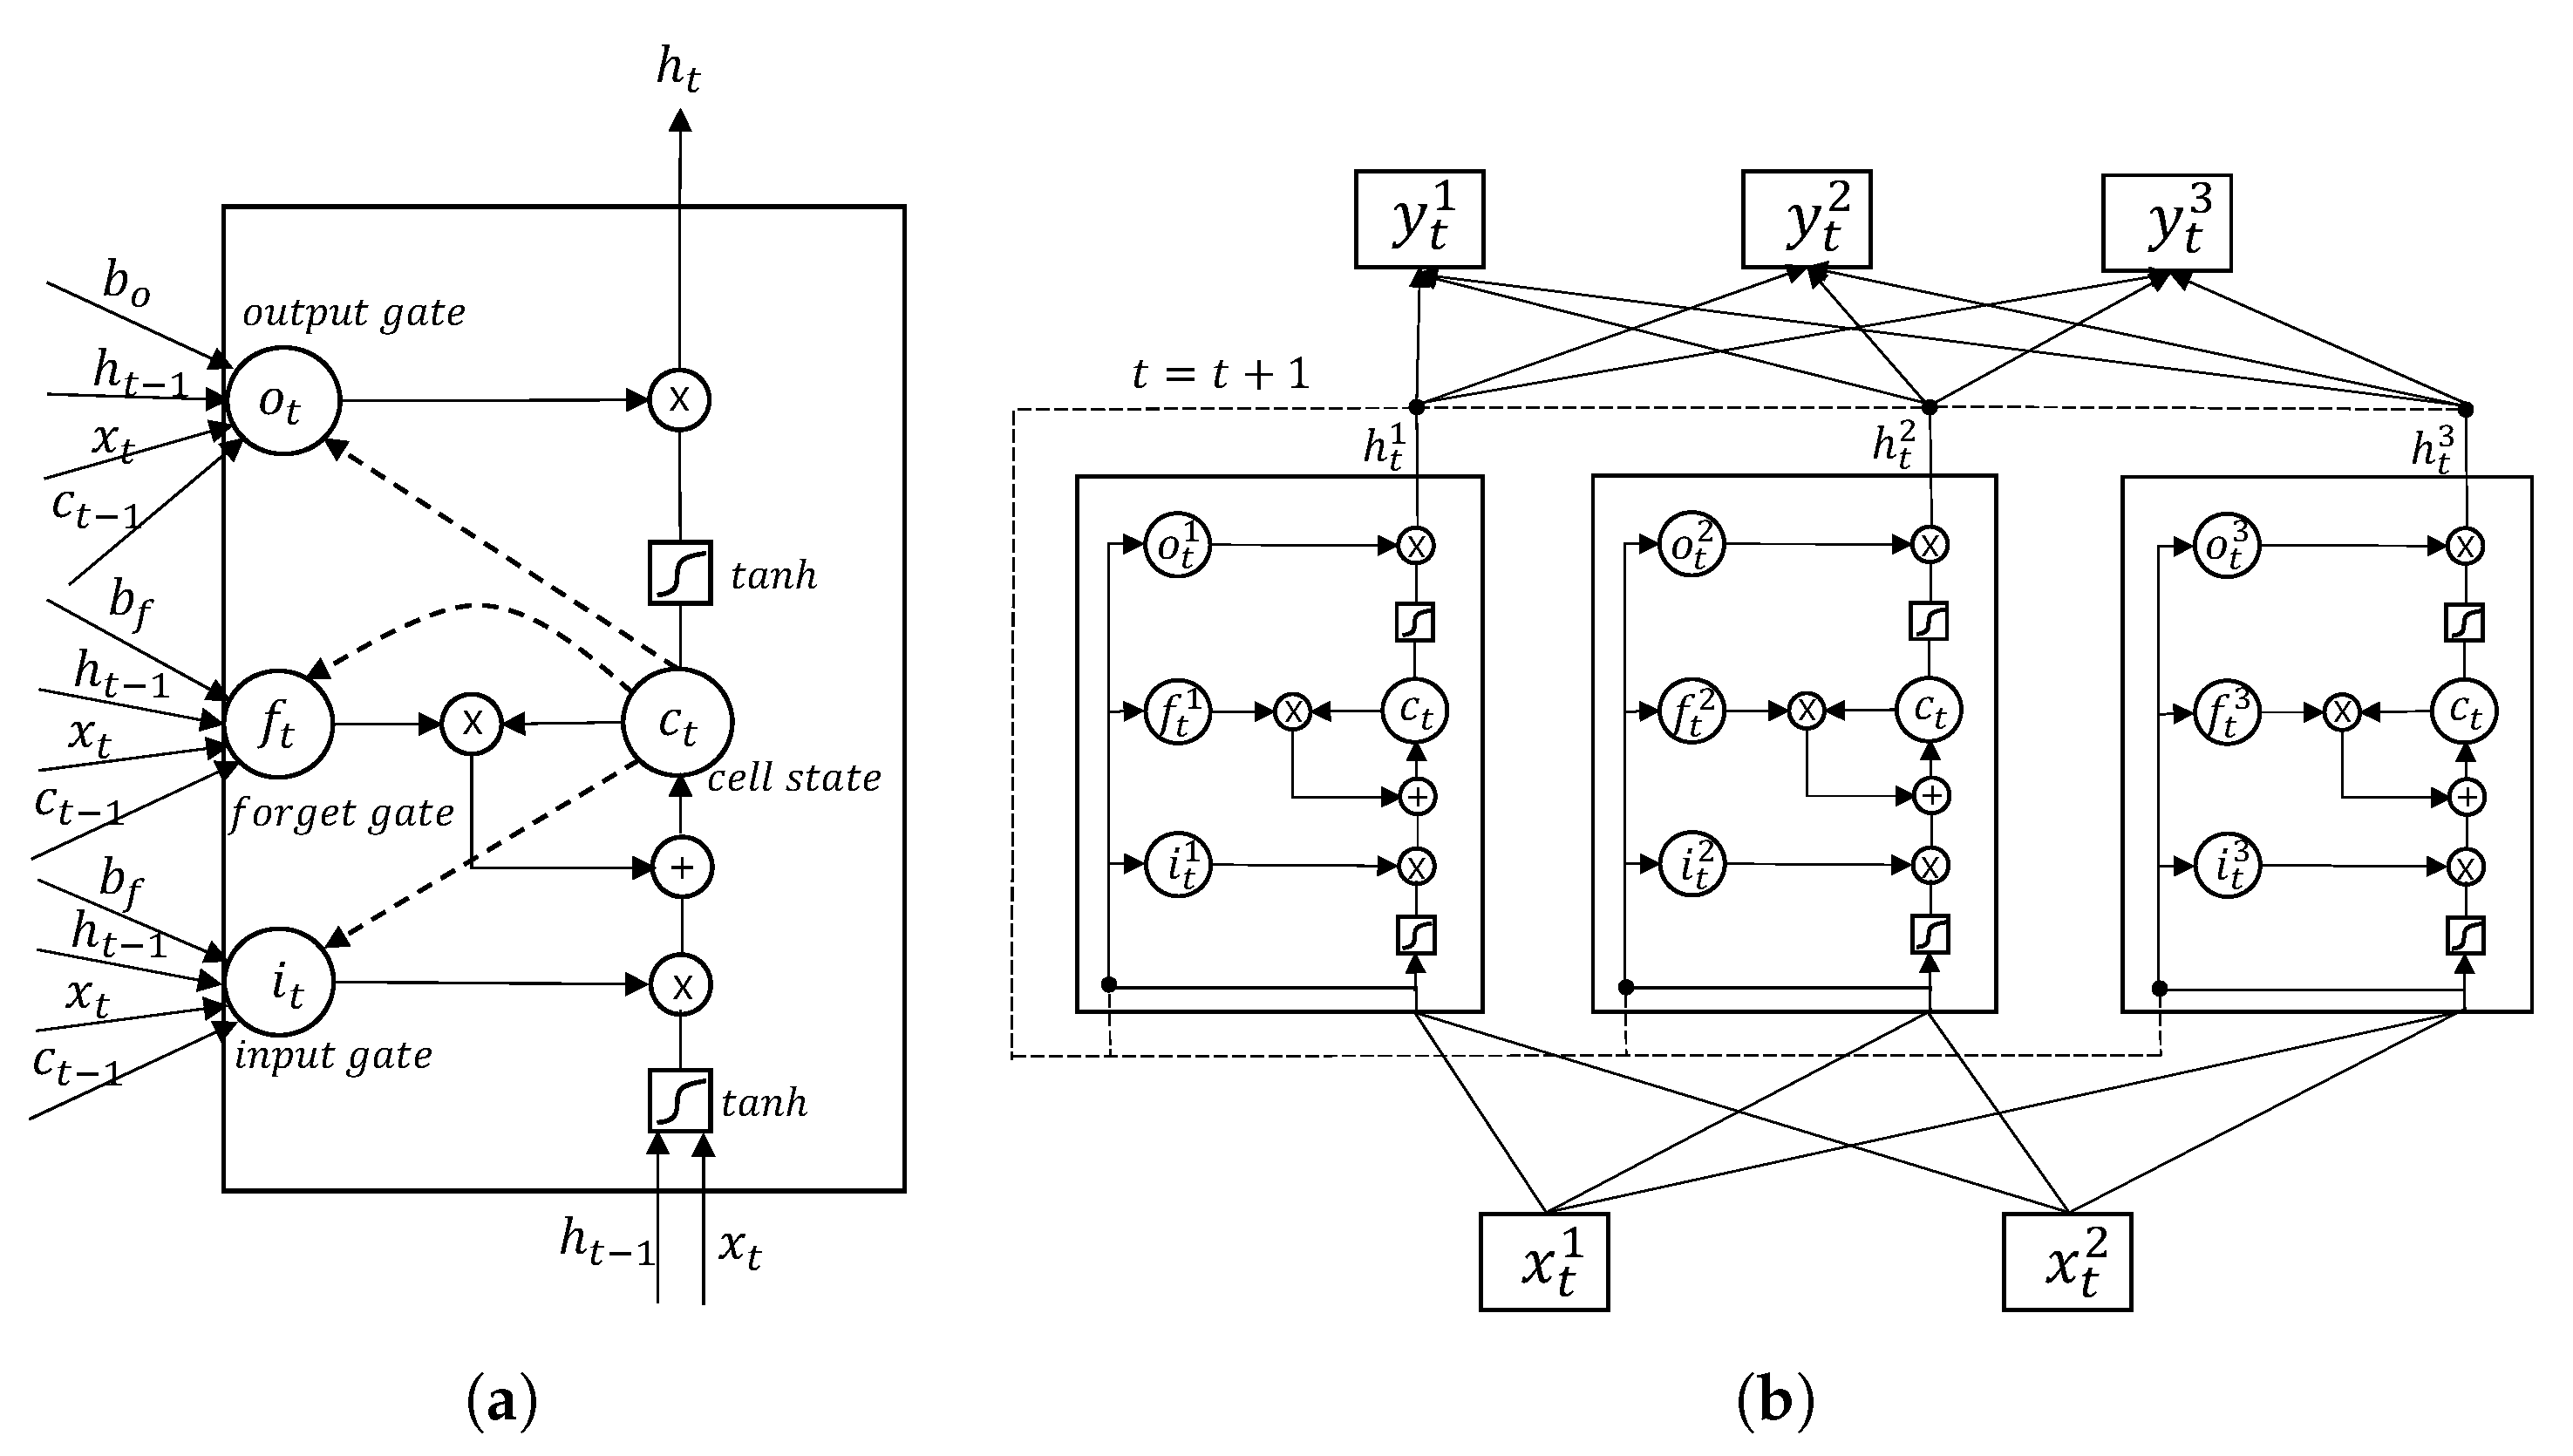
LSTM has been designed by Hochreiter and Schmidhuber in 1997 [
32]. LSTM is an elegant Recurrent Neural Network (RNN). The LSTM architecture is combined memory cells by replacing the regular units of the neural network. A memory cell consists of three gates: an
input gate, a
forget gate, an
output gate and the state of memory cell is called
cell state (
Figure 9a). In particular, at the
input gate, it allows incoming signal to alter the
cell state or block it. On the other hand, the
output gate can allow the
cell state to have an effect on other neurons or prevent it. Finally, the
forget gate can modulate
cell state of the memory cell. Besides, it allows the cell to remember or forget its previous state as needed.
The difference between LSTM and the original RNN is hidden units. In LSTM, the hidden units are replaced by LSTM cells.
Figure 9b shows an architecture of LSTM having two input units, three LSTM cells as hidden units and three output units. The equations below describe how LSTM processes data. Assumption that
is an input vector and
,
,
are hidden, output and cell vector, respectively. The elements of each vector are units for layers of LSTM.
,
,
and
are a number of each units.
is the logistic sigmoid function, and
i,
f and
o are the input gate, forget gate and output gate, respectively. The weight matrix superscripts have the obvious meaning. For example,
is the hidden-input gate weight matrix and
is the input-output gate weight matrix.
,
,
and
are bias terms at time
t.
First is to compute the value for
, the activation of the forget gate. The output range of
is from 0 to 1 and the output value will be multiplied by
when calculating
. Therefore,
means an activation rate of the previous cell state.
Second is to compute the value for the input gate
. In common with
,
is the activation ratio of the input value
.
Third is to compute the value for the cell state
. Two factors are combined. The first factor is the previous cell state activated by the forget gate and the second factor is the input value activated by the input gate.
Final is to compute the value of their output gates and use it for the memory block output.
Equations (
13)–(
17) are processed in one LSTM cell. After all process are done in the hidden layer, it can be calculated for the output units with the hidden vector
.
3.5. Energy Monitoring and Consumption Prediction System
This is a web application to display the energy disaggregation results. This paper uses Node.js, Javascript, and HTML to build the user interface for NILM system. The results of classification are passed to energy monitoring system.
4. Experiments
This section points data preparation for experiment and experiment results in this approach. The results including T signals extracted and classification ON/OFF event. This study sets up the environment for implementation as following Intel ® CoreTM i7-4790 CPU @3.60 GHz; GPU: NVIDIA GeForce GTX 750 (NVIDIA Corporation, Santa Clara, CA, USA); RAM: 16GB and Operating System (OS): Windows 10; the language programming in Python.
Besides, this paper uses confusion matrix (CM) to evaluate the approach classification model. CM includes four categories such as True Positive (TP), False Positive (FP), True Negative (TN) and False Negative (FN). This paper assumes that the positive event means an appliance is turned ON and when the appliance is turned OFF that it is the negative event. Hence, Recall, Precision, Accuracy, F1-score are calculated for evaluating the NILM model based on CM.
Recall is a ratio of the number correctly classified to the total number of actual positive samples.
Precision is a ratio of the number of correctly classify to the total number of predicted positive samples.
Accuracy is a ratio of correctly classify to the total test data.
F1-score is the harmonic average of Recall and Precision.
Furthermore, this paper measures loss of NILM model using Loss function such as Mean Squared Error (MSE).
where
is the expected output of sample data,
is the predicted output of sample data by NILM approach model.
4.1. Data Preparation for Experiment
Five appliances data individual and twenty test cases are collected and saved in *.csv files. As mentioned in the previous Section, this paper selected active power data for input feature in the experiments.
Figure 10 illustrates the active power signals from five active power data of five appliances.
In testing data, this paper named twenty-test cases data files following in
Table 4.
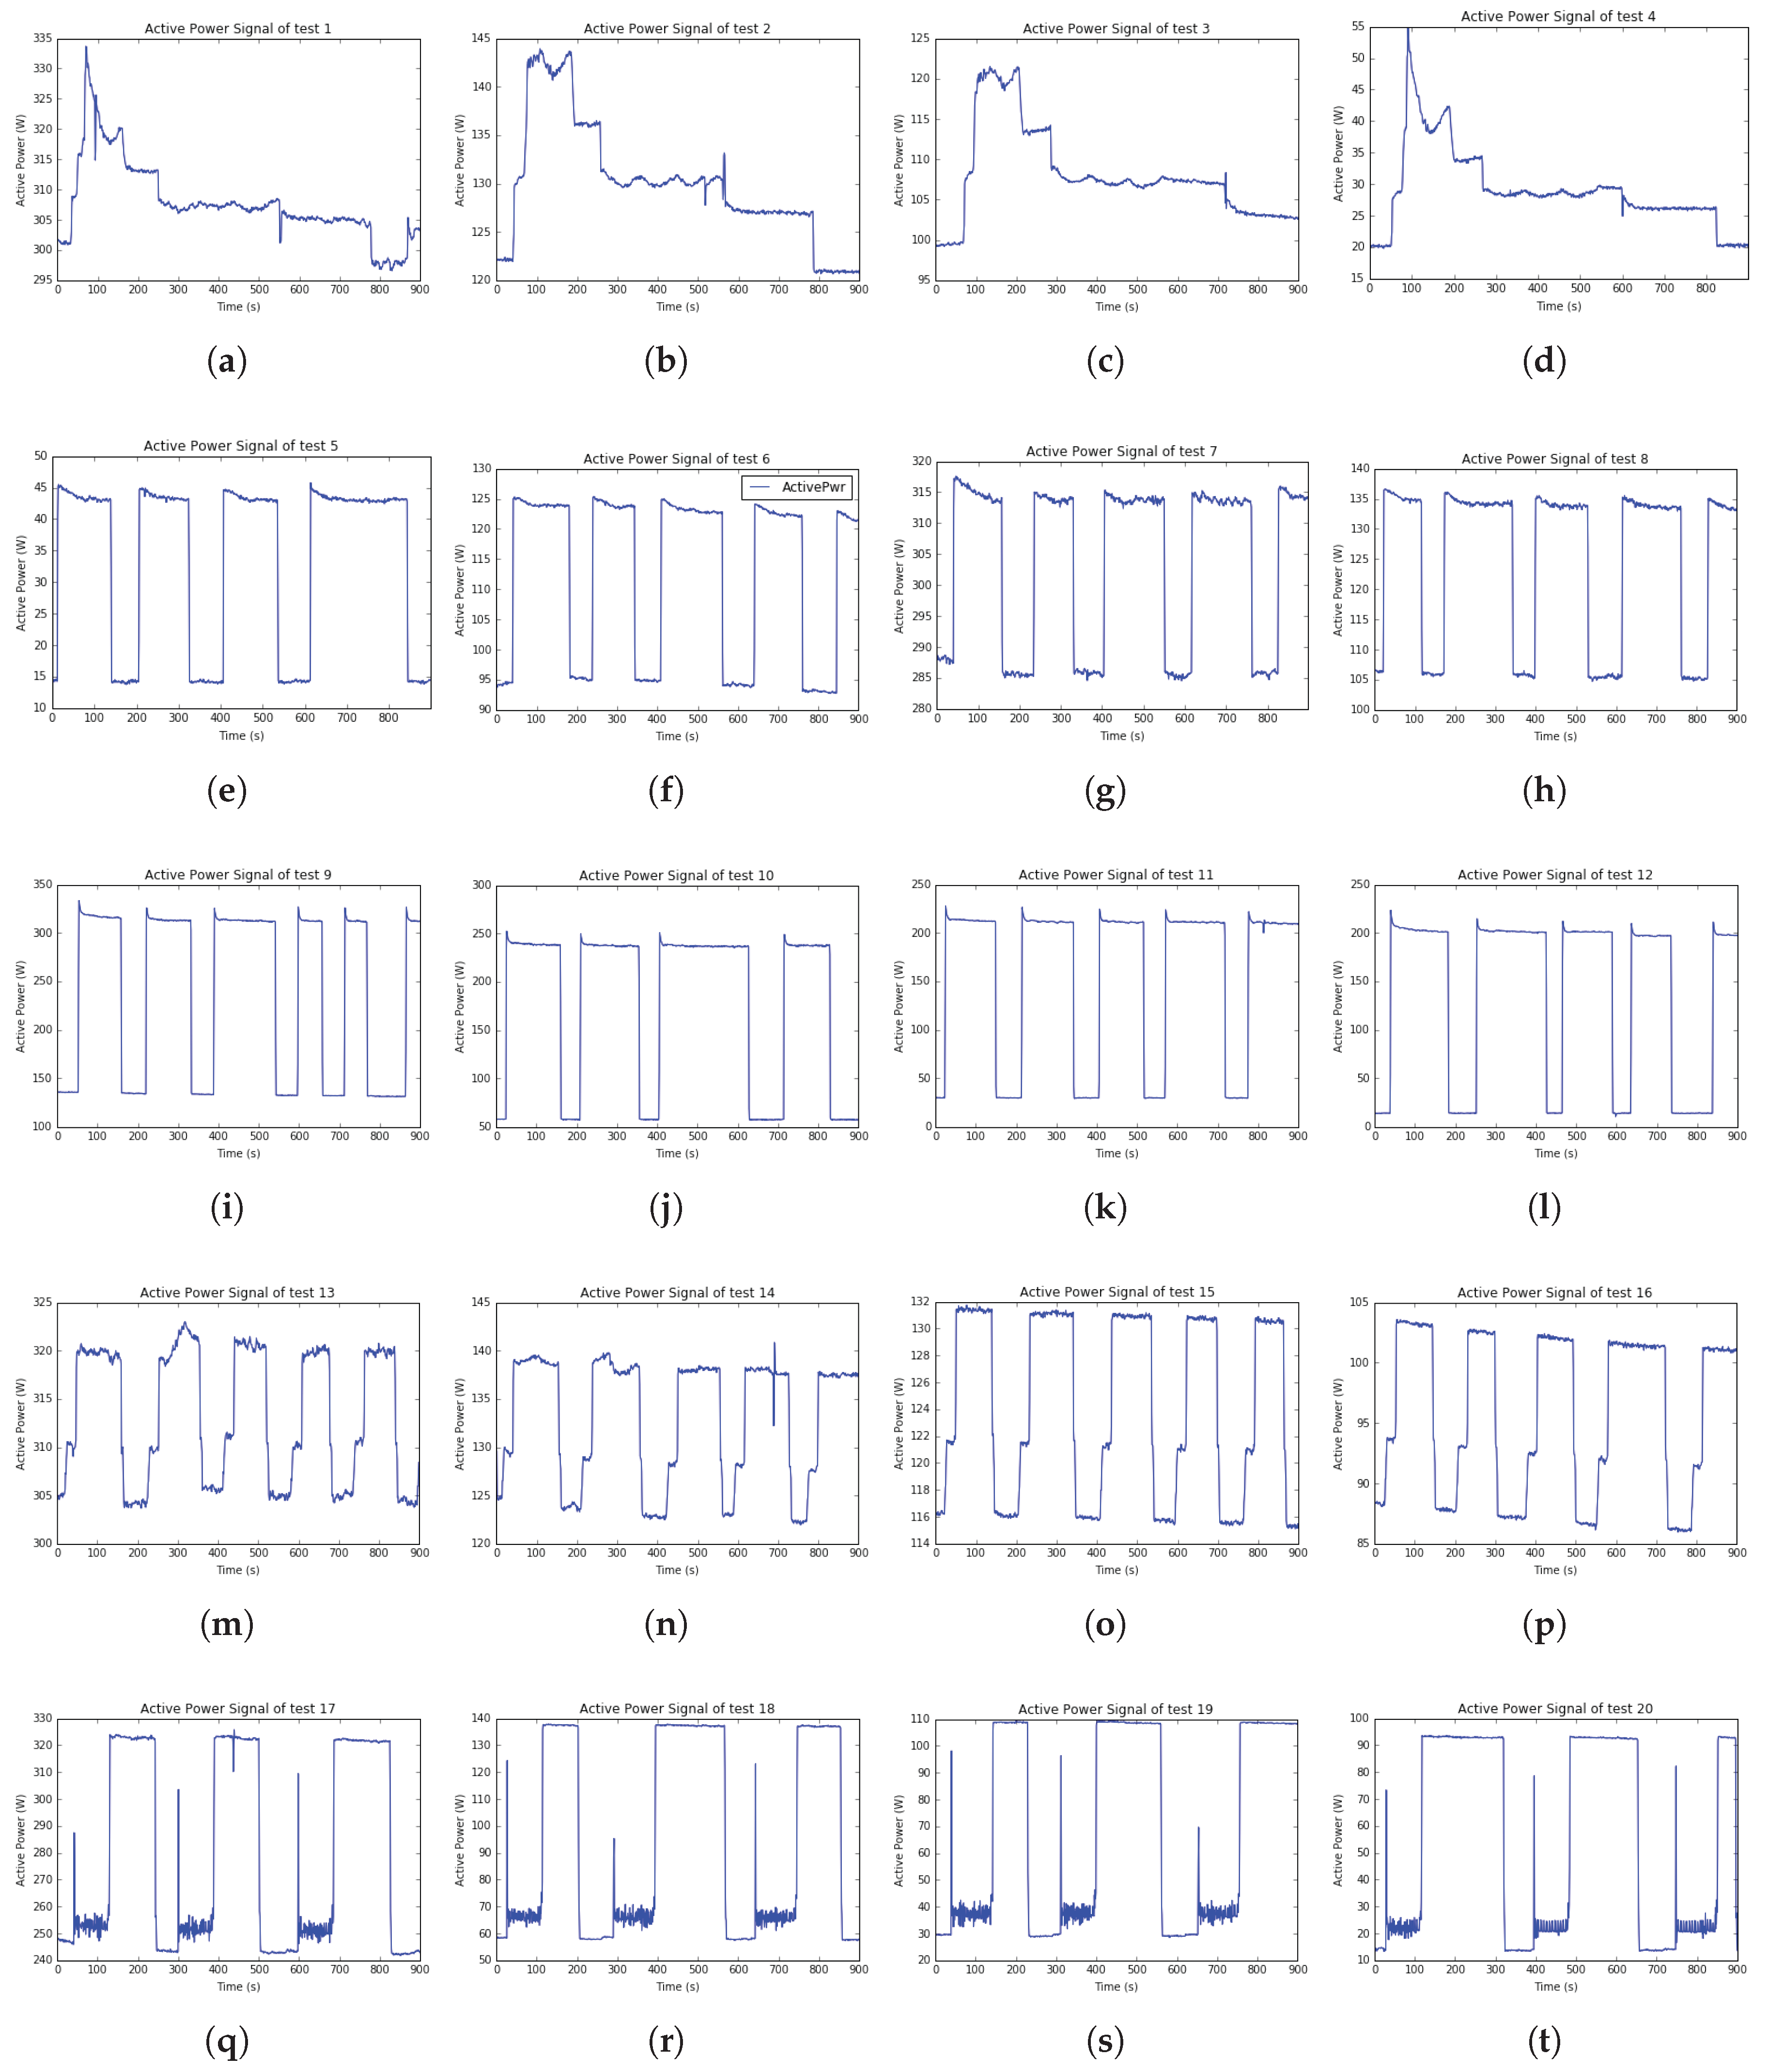
Besides, this paper plotted twenty active power signals from twenty test cases in
Figure 11.
4.2. Experiment Results
4.2.1. State of Appliance, Transient Signal and ON/OFF Label Results
Firstly, this paper determined and declared ON/OFF label value to use in Algorithm 4.
Table 5 and
Table 6 show ON/OFF labels for five appliances and twenty test cases, respectively.
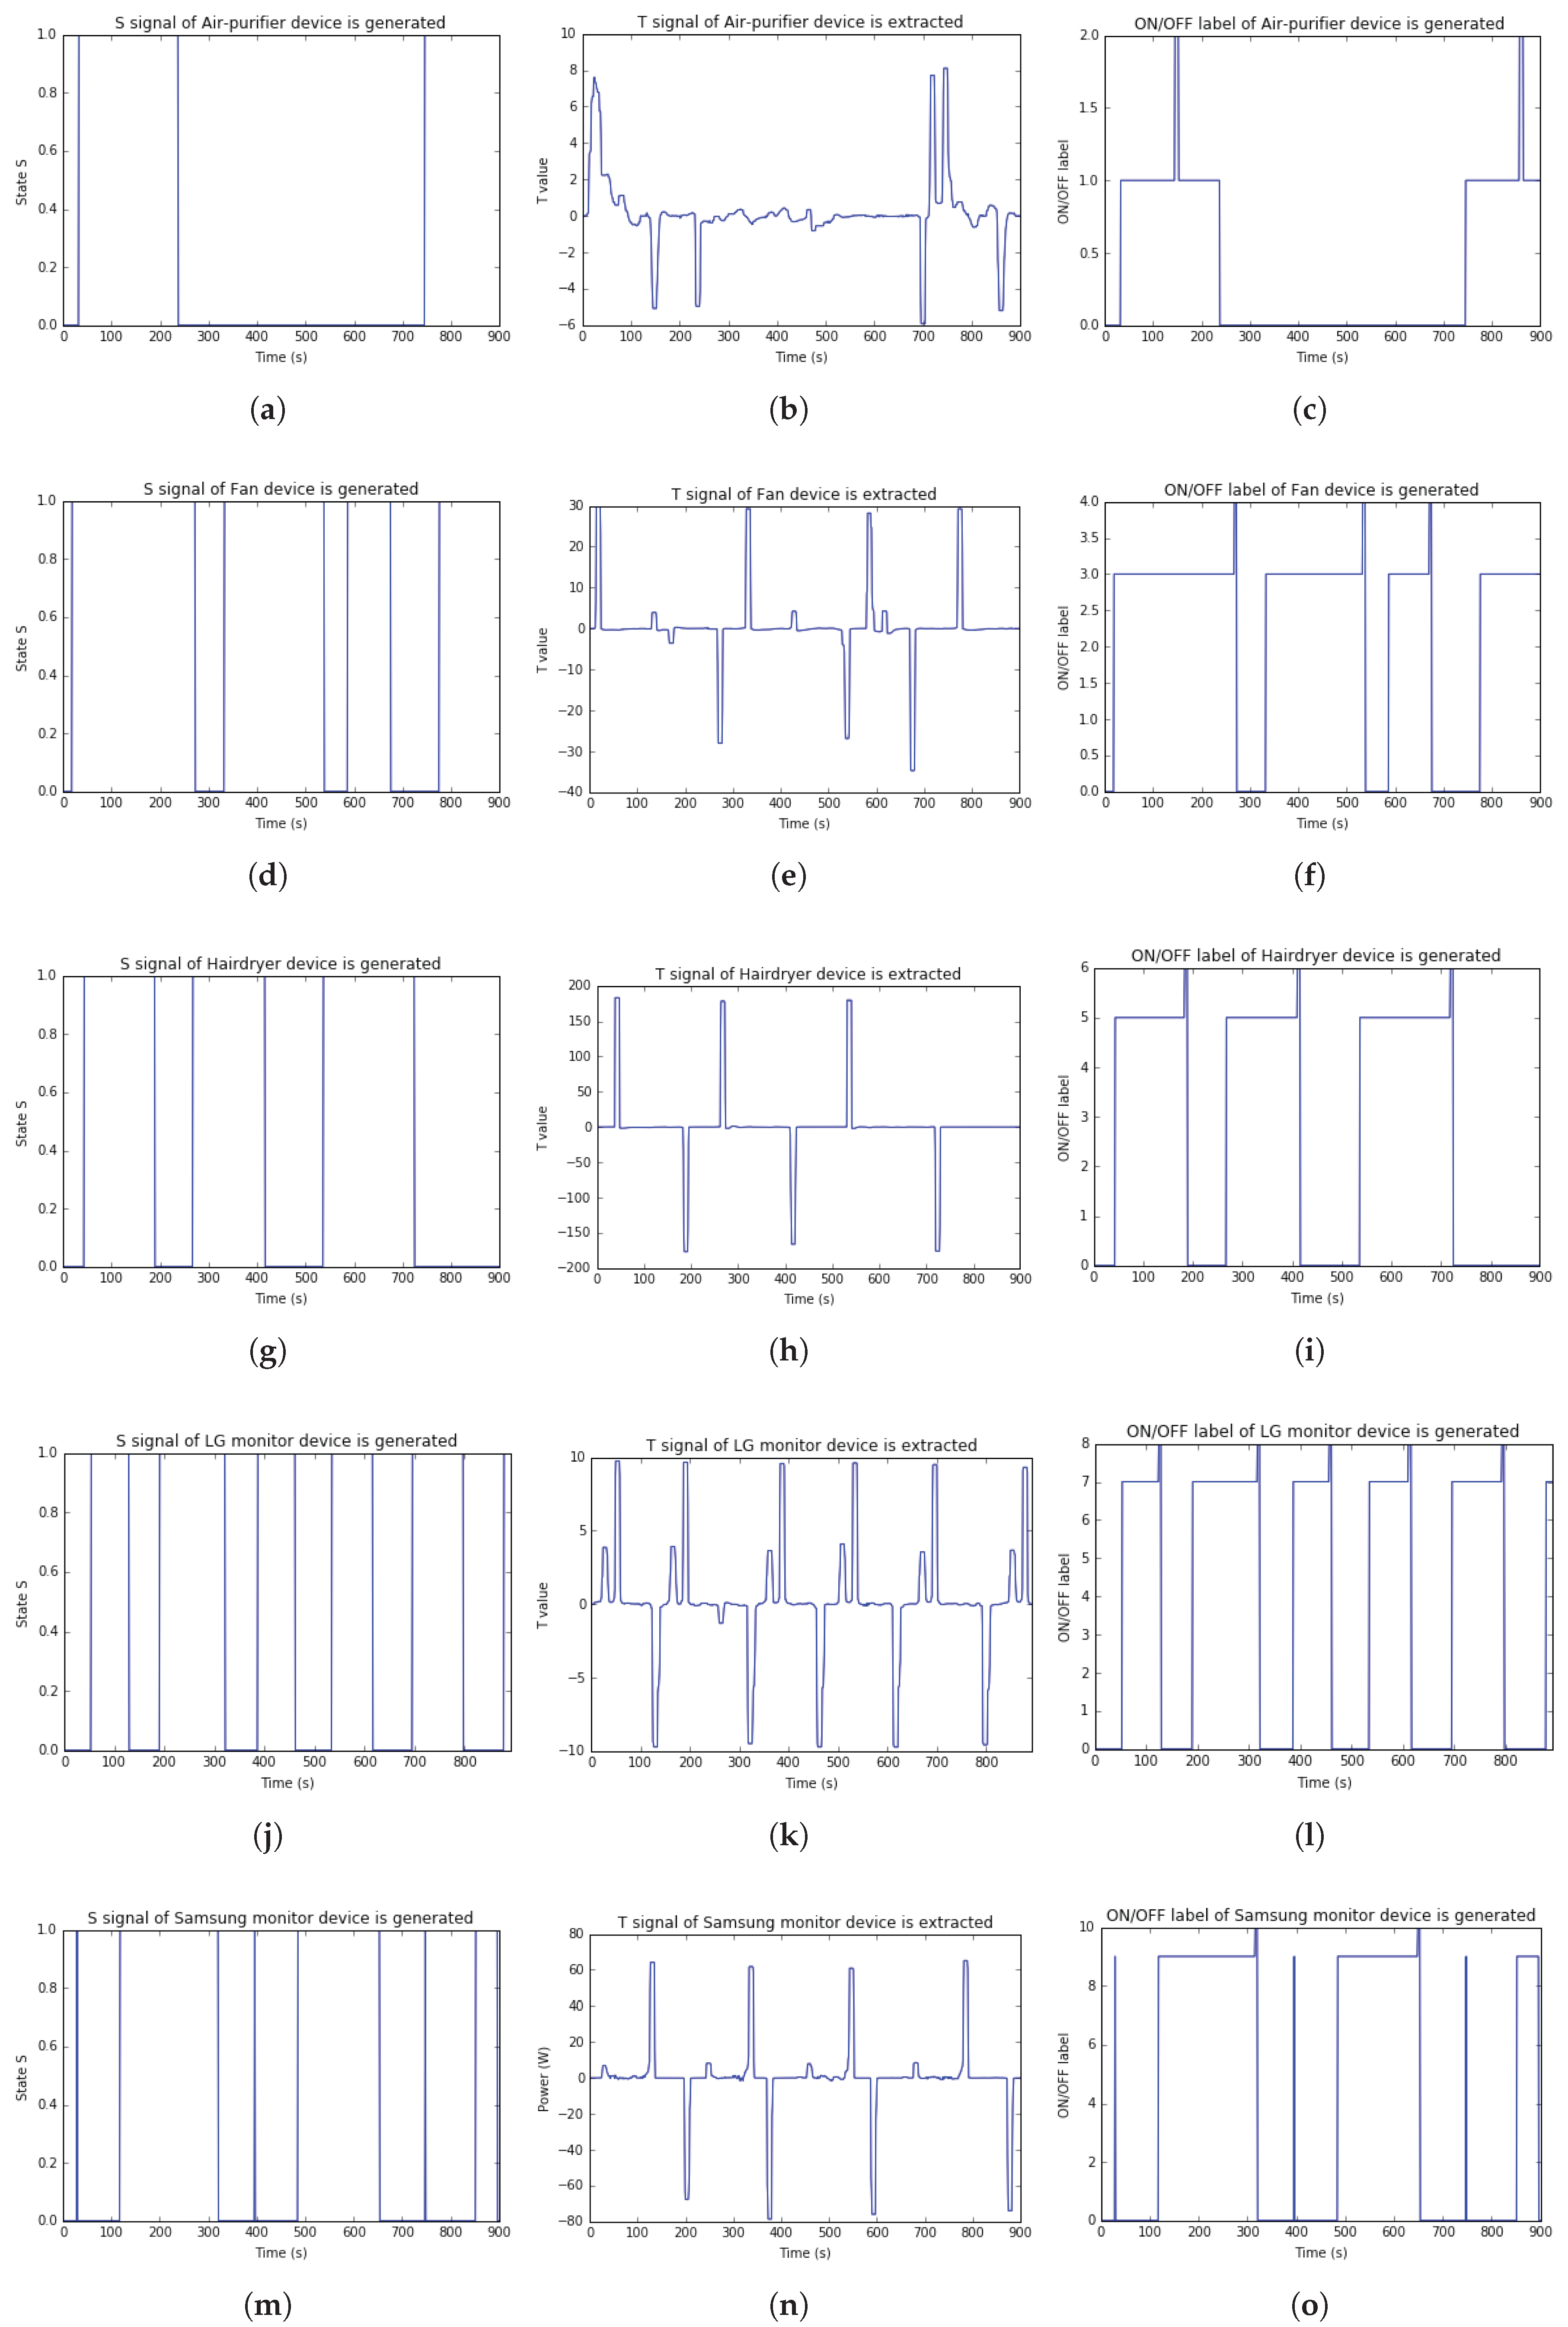
Secondly, this paper implemented Algorithms 2 and 3 to extract
of the appliance and
T signals, respectively. After that, the Algorithm 4 are implemented to label ON/OFF based on each
T signals from five appliances and twenty test cases data. The left, middle, and right of
Figure 12 are
S,
T and
signals obtained from five appliances data, respectively. From observing these
T signal results in this figure, this paper can determine the number of changing status of event ON/OFF in each appliance. There are two, three, three, five, and four times changing status from ON to OFF corresponding to air-purifier, fan, hairdryer, LG monitor, and Samsung monitor.
In summary, this paper recognizes that when T signal changes the value from positive to negative value and smaller than − 5, the event ON/OFF on device will occur. In particular, when the T signal obtains positive values, it means that the appliance is operating (ON). Contrast to this, the appliance switches to OFF.
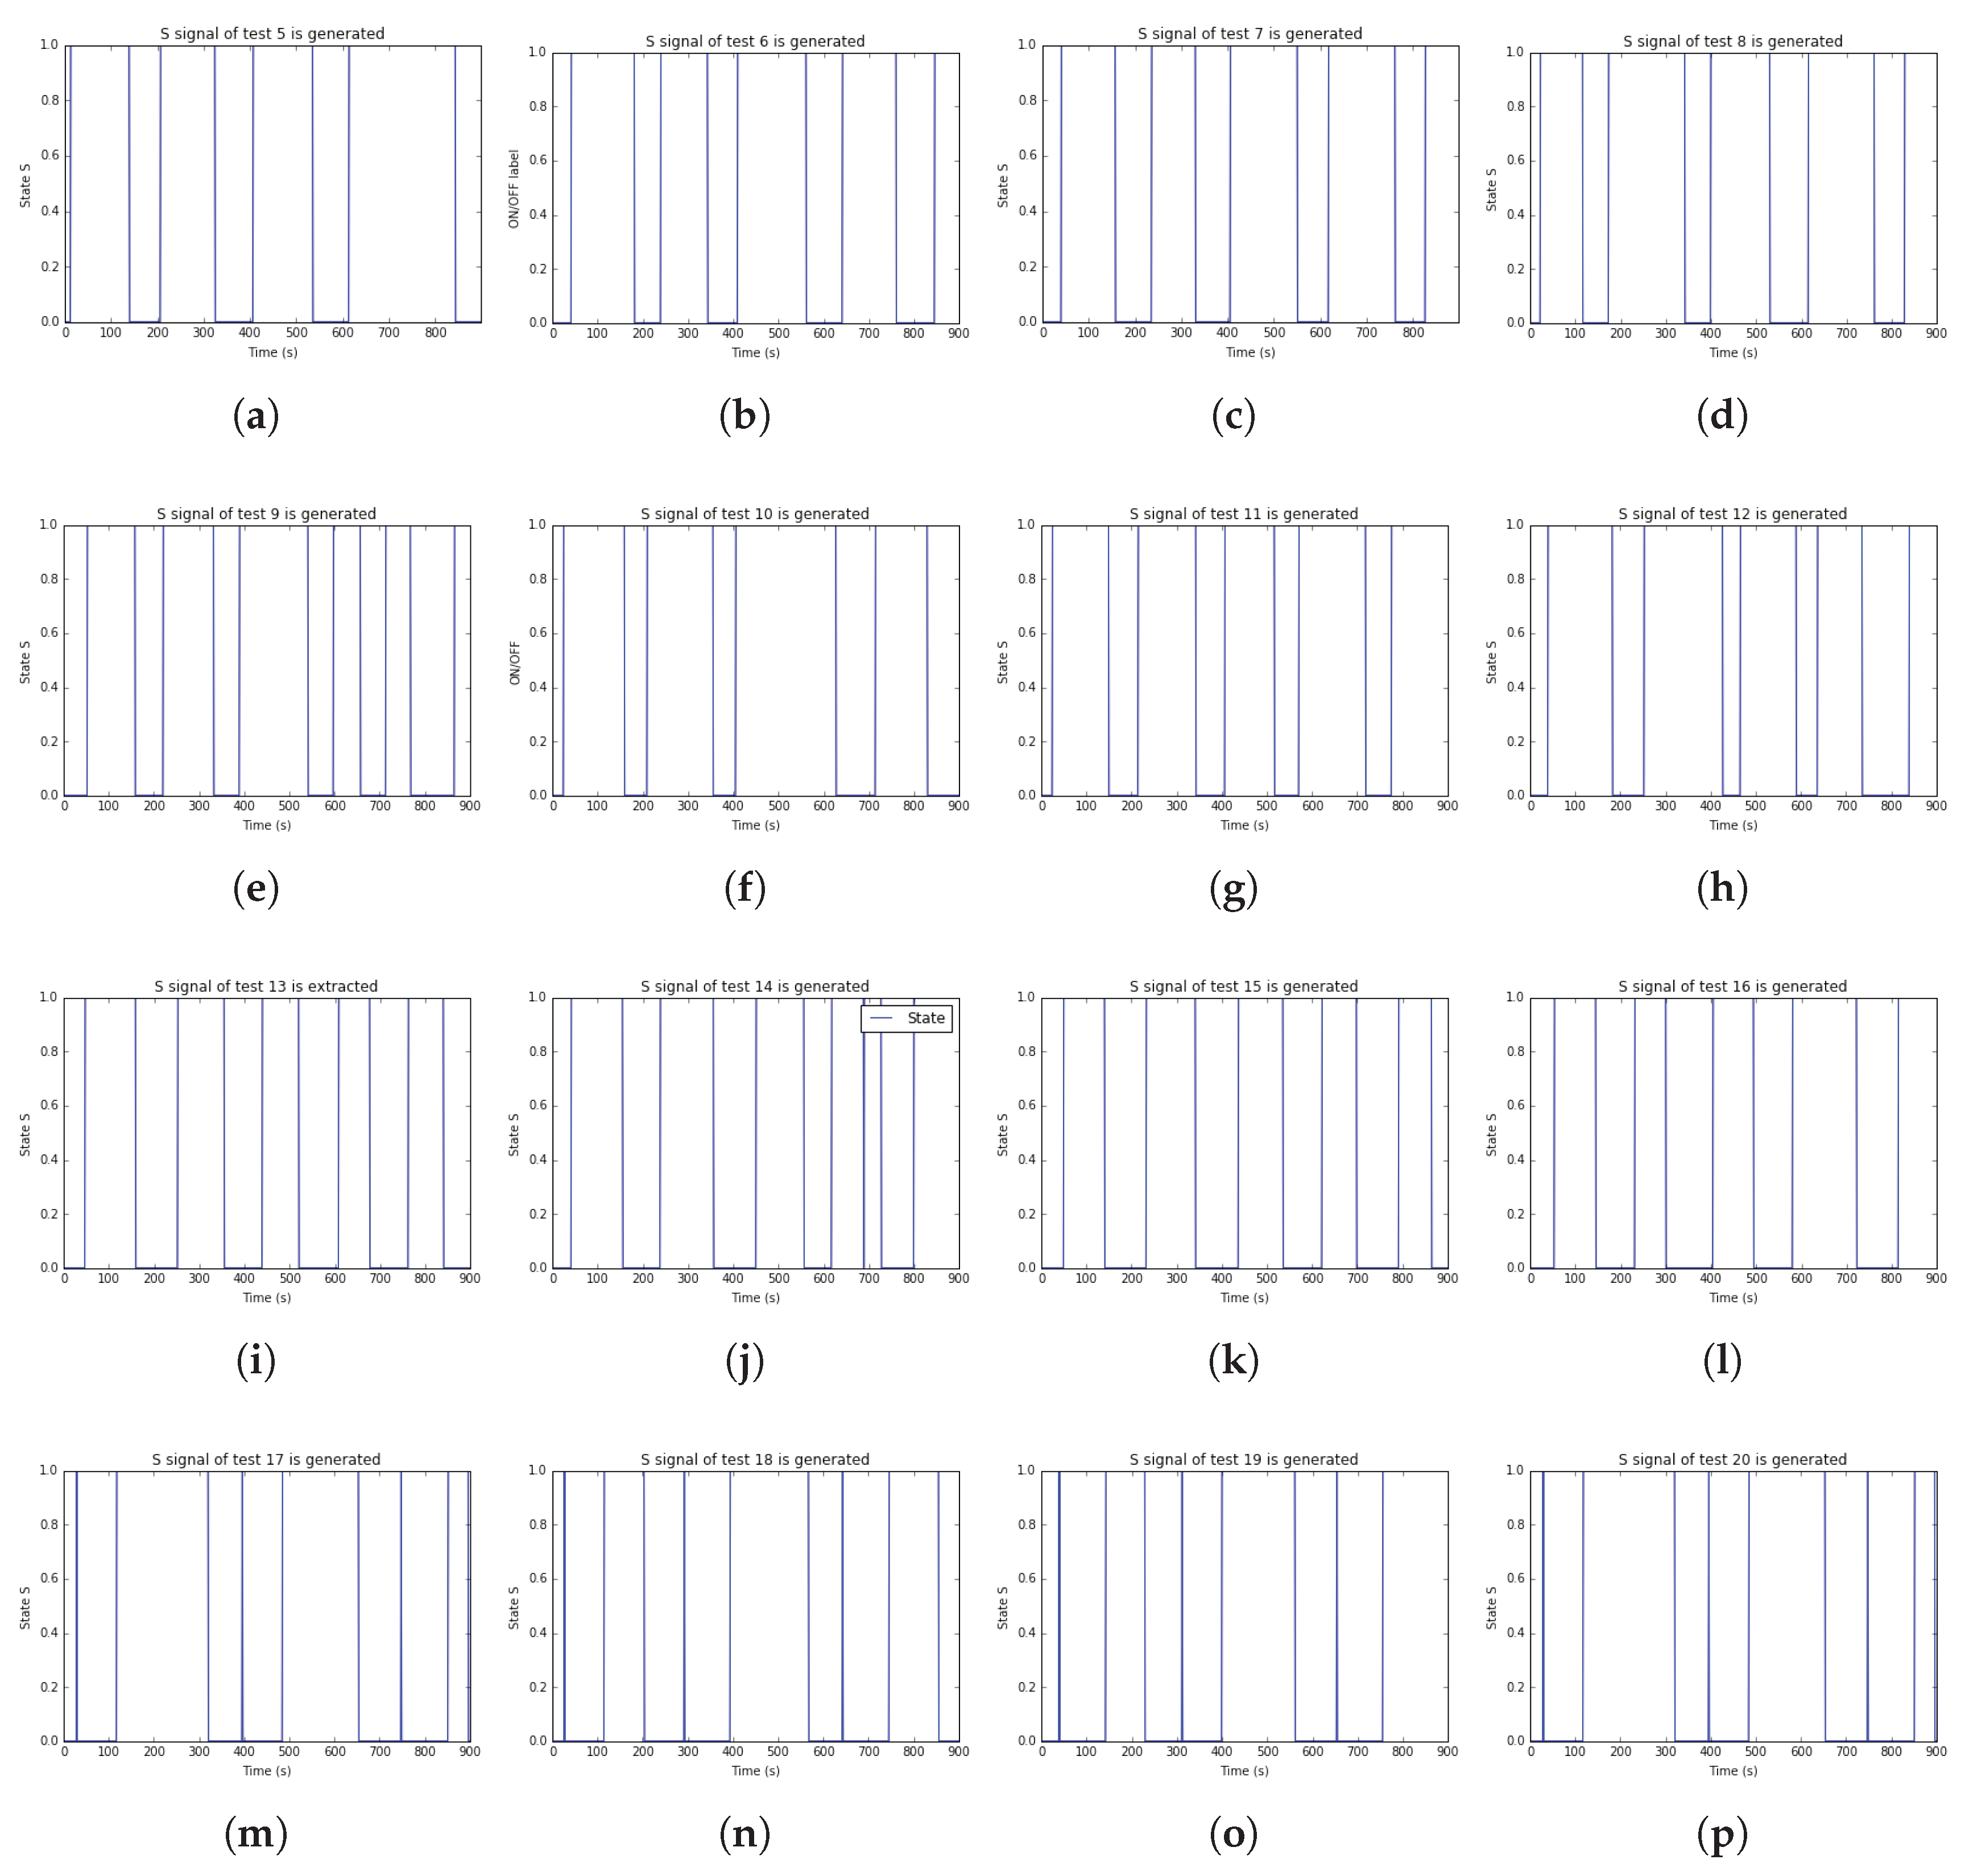
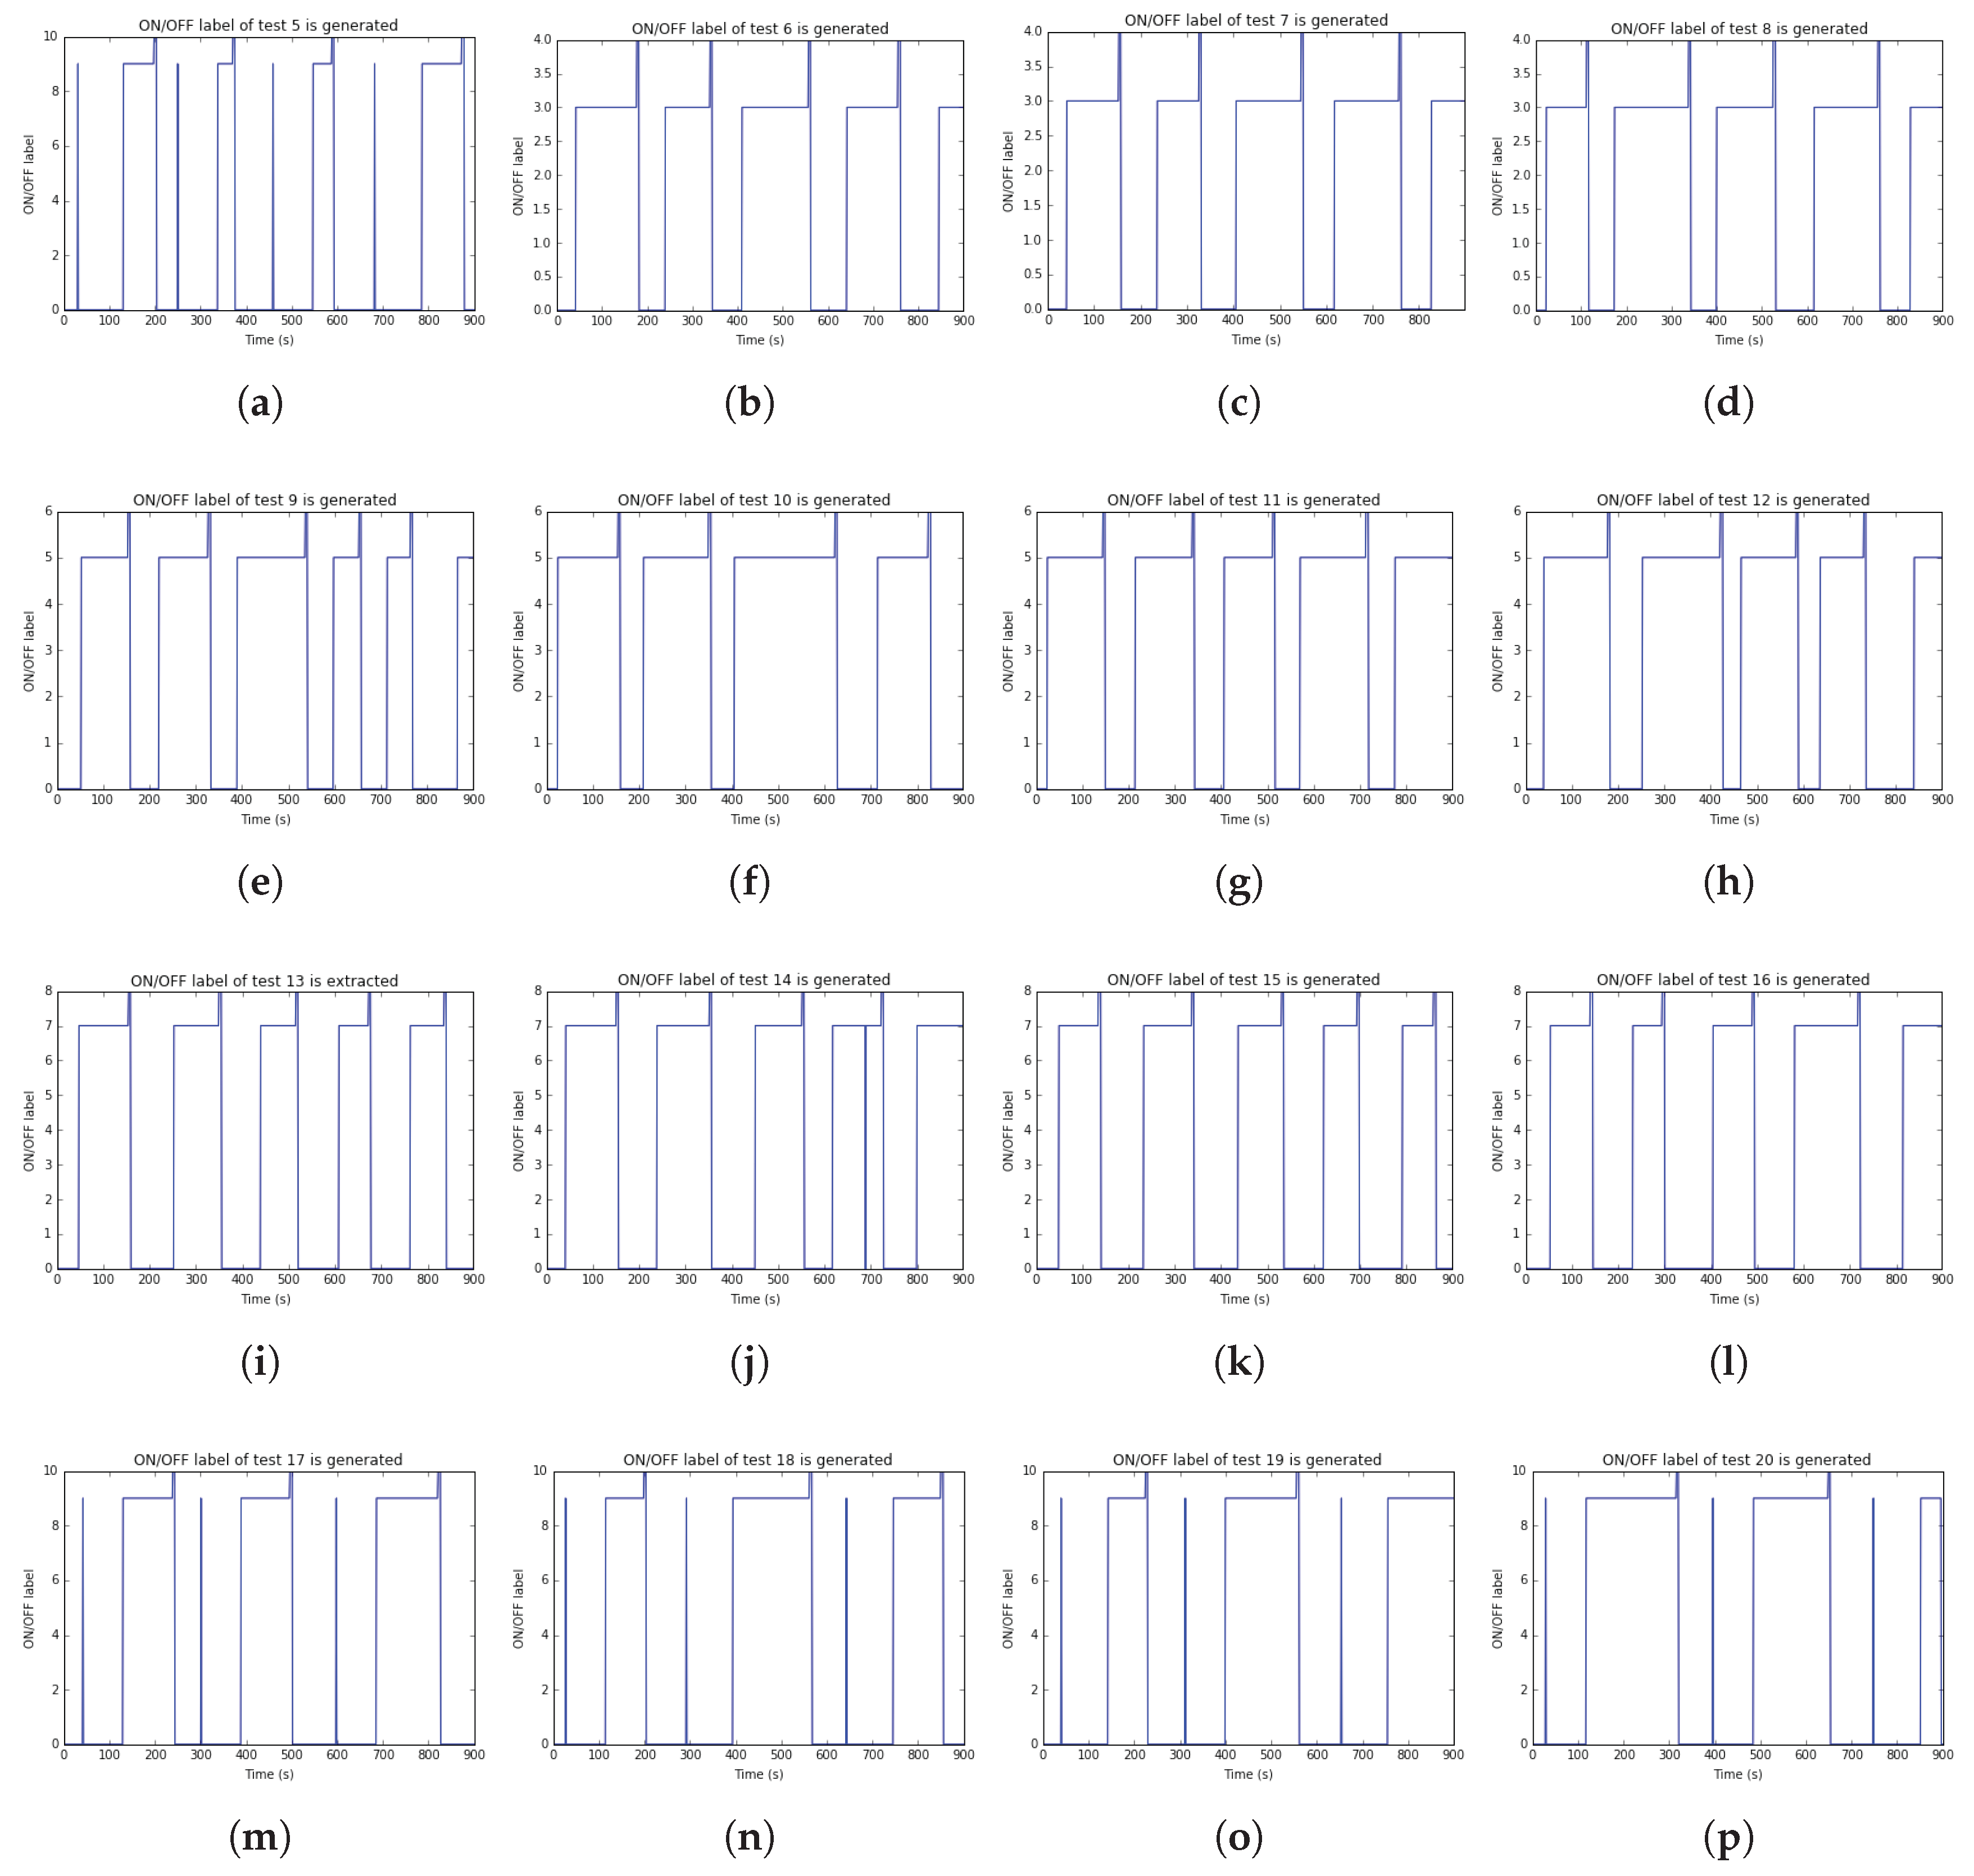
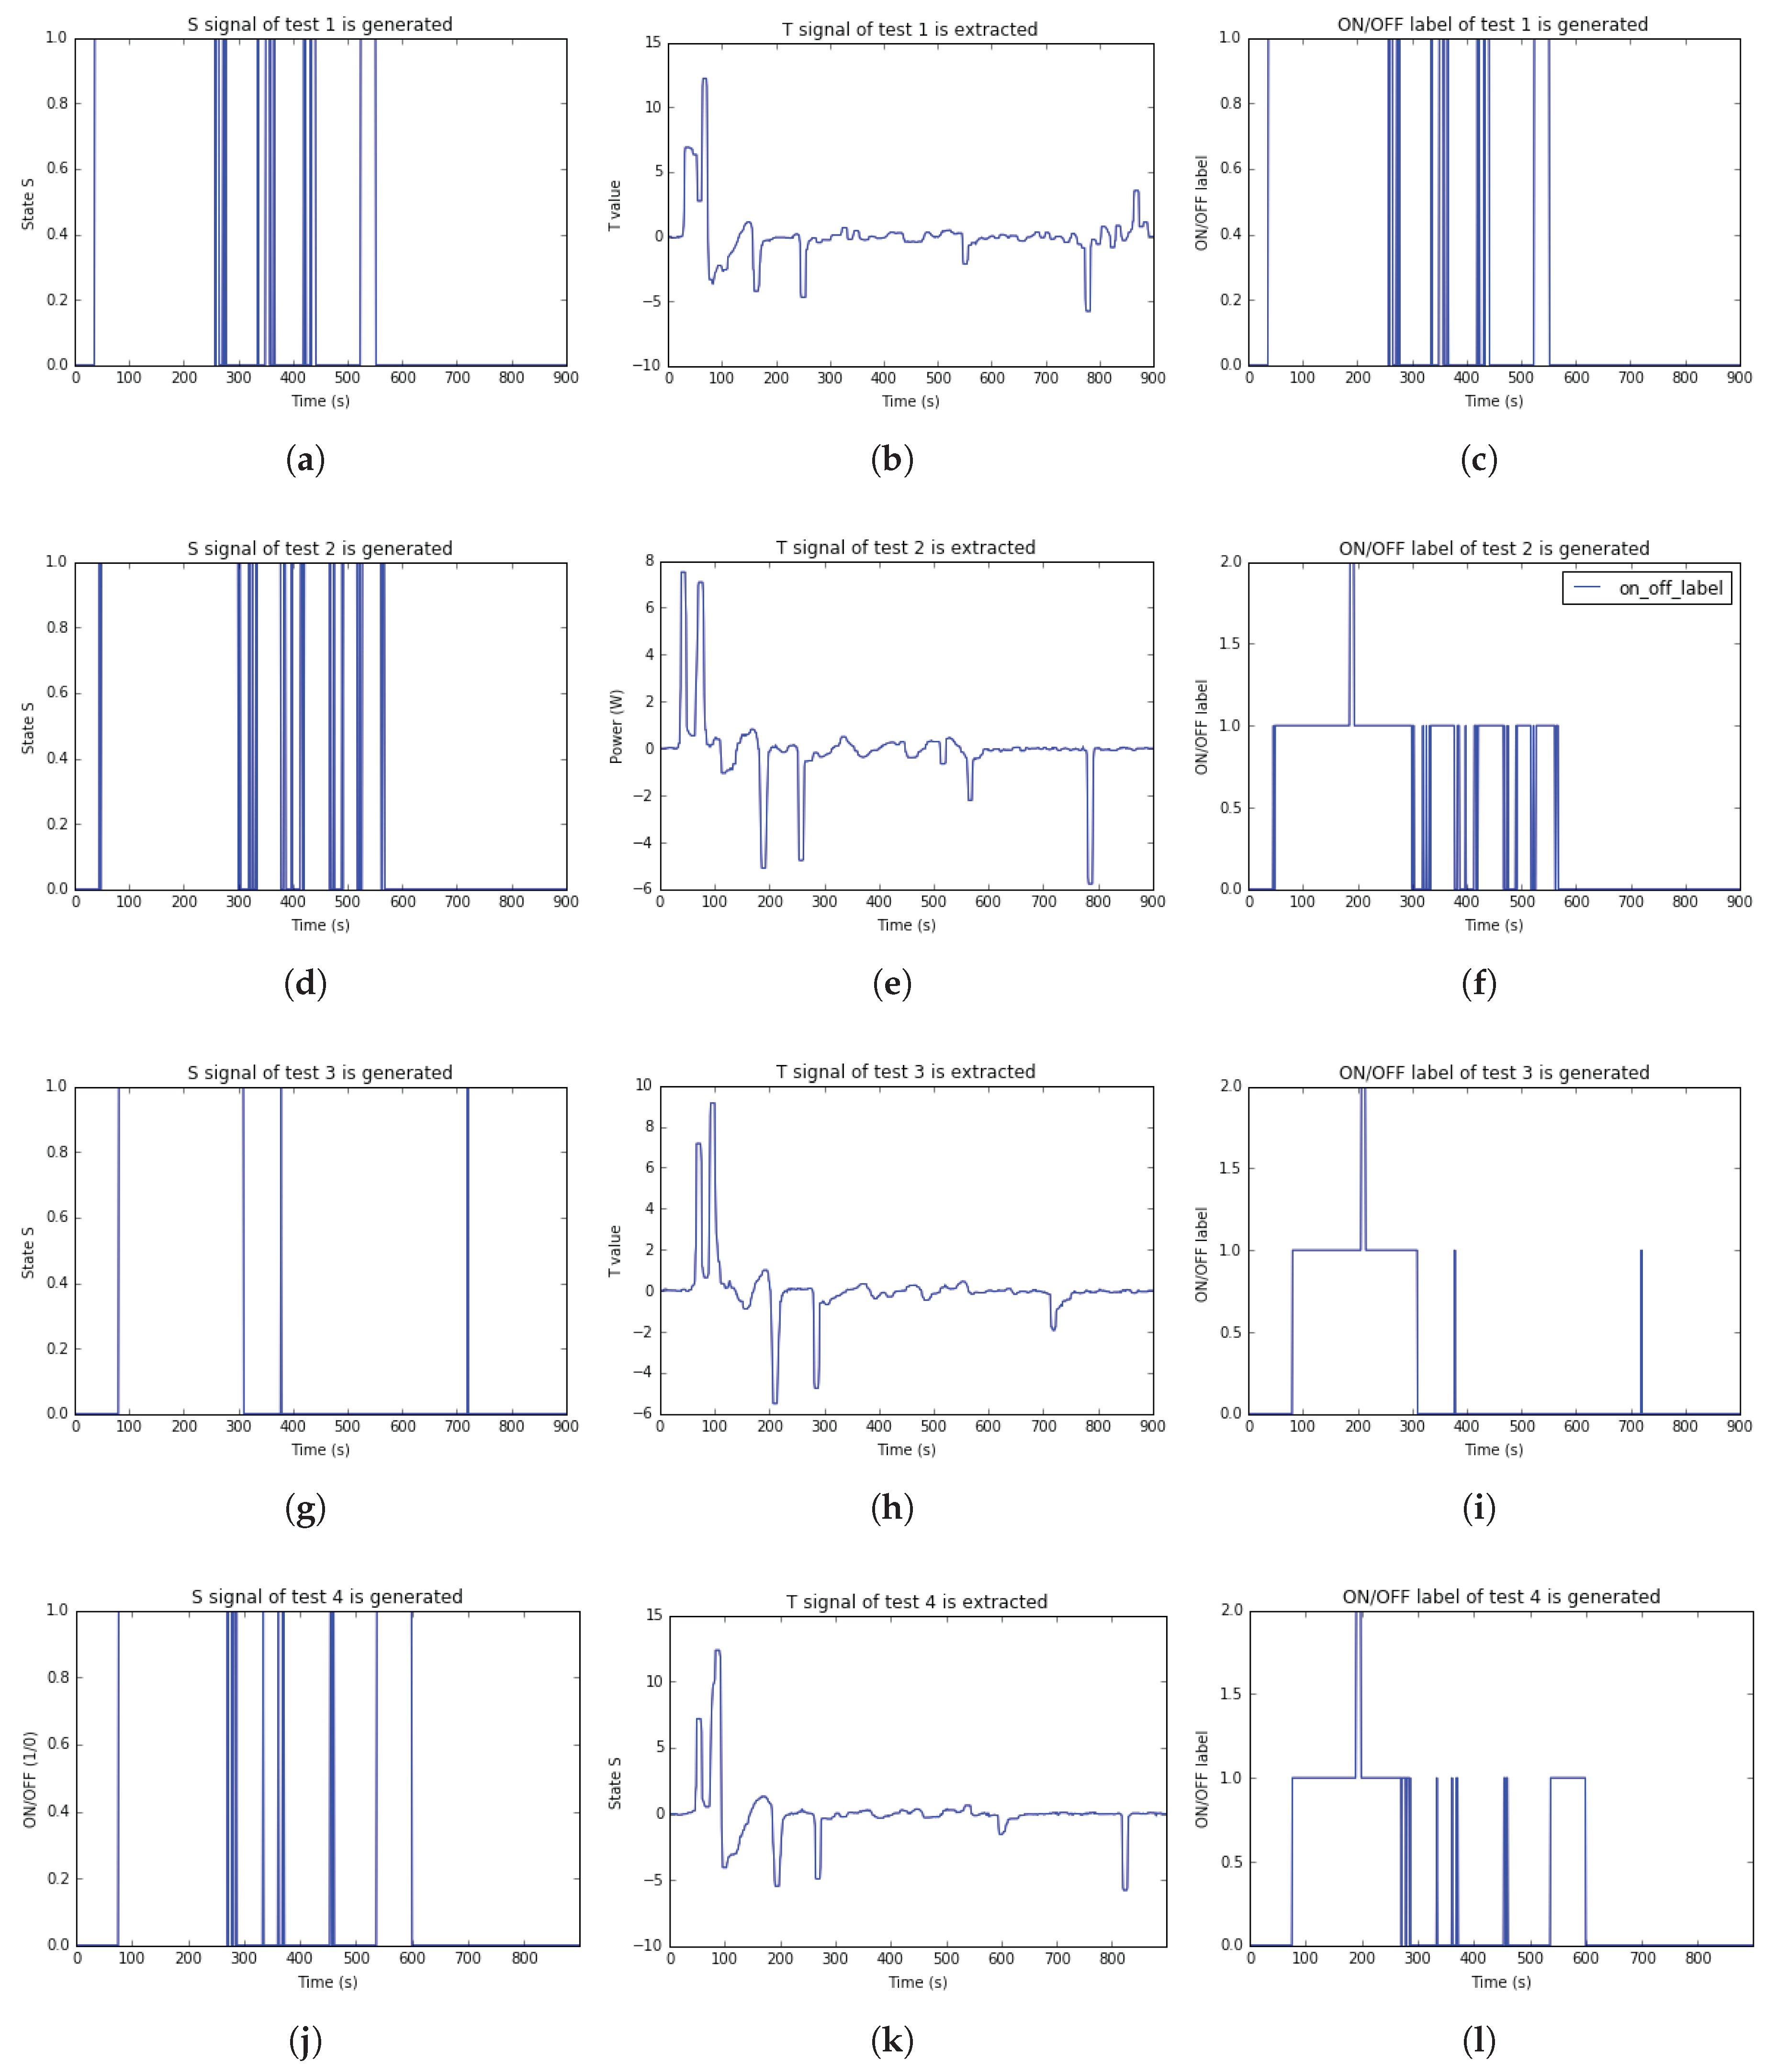
For visualizing the results of twenty test cases, this paper pointed the
S,
T, and ON_OFF label results of test 1 to test 4 in
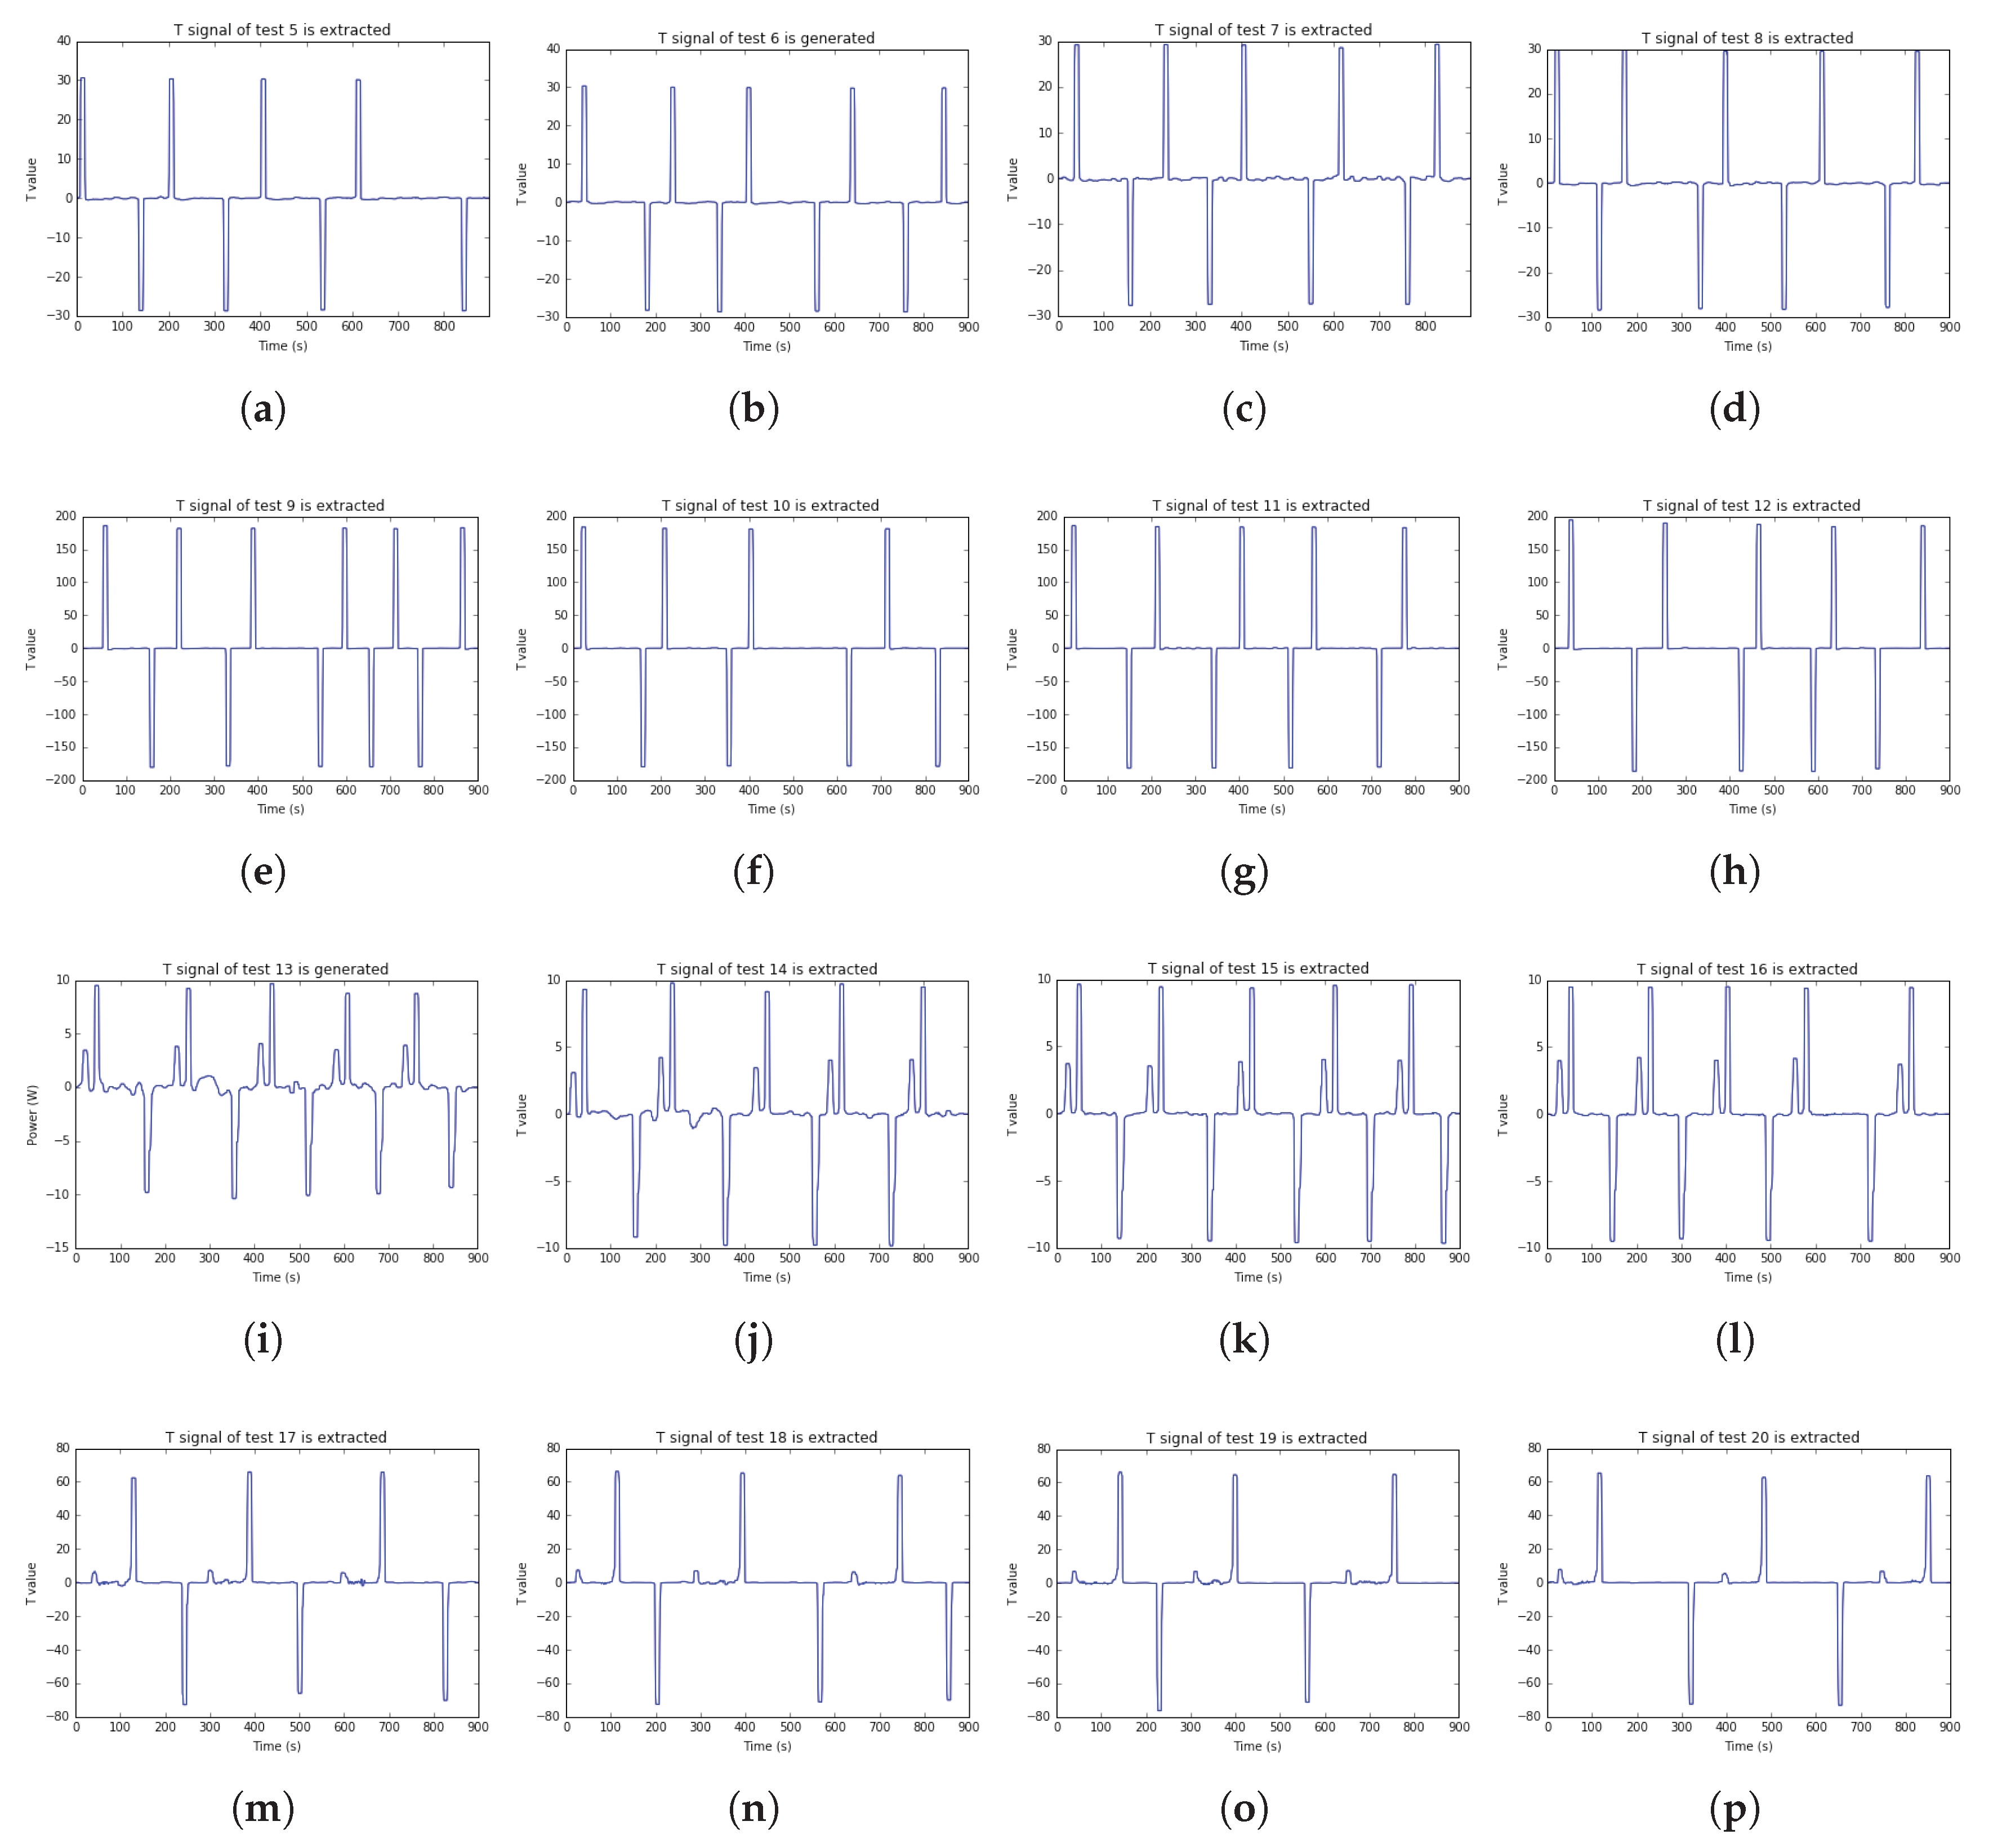
Figure 13. Besides, the
S,
T, and ON_OFF label results of test 5 to test 20 are plotted in
Figure A1,
Figure A2 and
Figure A3 at
Appendix A, respectively.
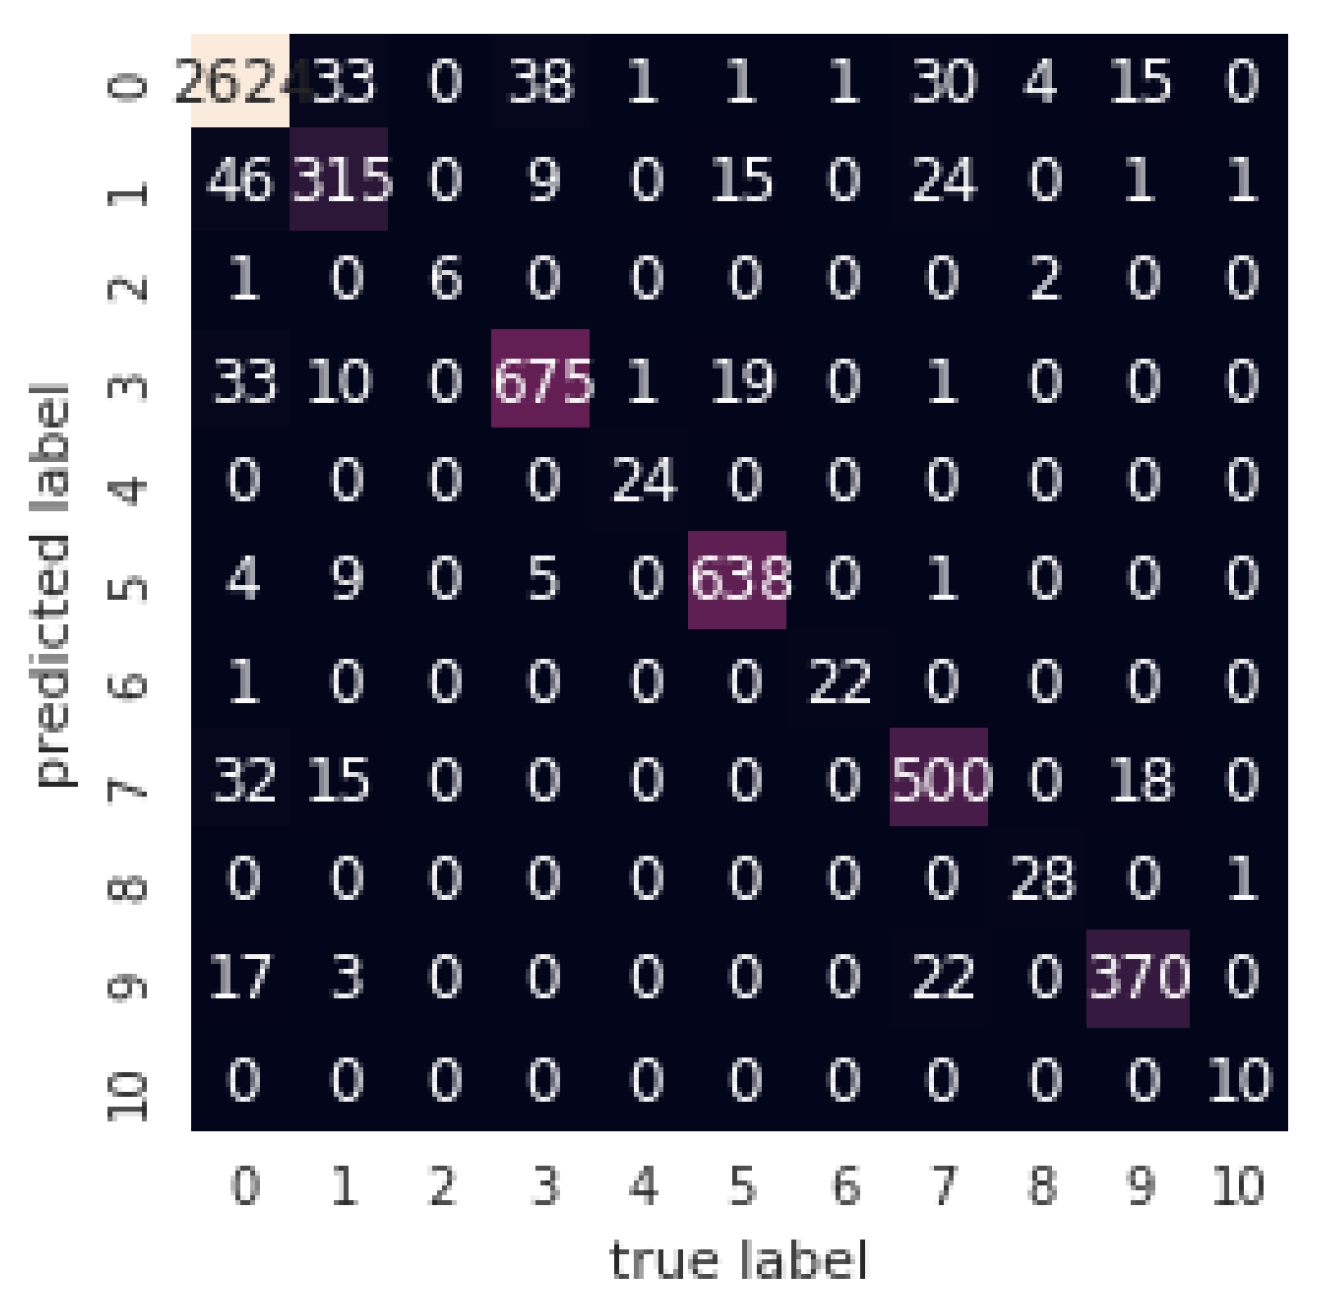
4.2.2. Classification Results
In ML, this paper applied Decision Tree model for classification ON/OFF event of the household appliance in this study. The reason for selecting Decision Tree model in classification task related to classification accuracy. This study tried to apply other models such as SVM, Random Forest, Multilayer Perceptrons (MLP), etc., however, the result of them obtained not well. This paper used
T signals for input feature and output feature is ON/OFF labeling for the approached models. Five
T signals extracted from five appliances are training data. The testing data is twenty
T signals extracted from twenty tests data. This paper used CM to display the classification result. The performance classification results for detecting ON/OFF of Decision Tree model are shown in
Figure 14. The main diagonal of confusion matrix represents the number of correctly samples are predicted by the applied model.
Table 7 is classification report for each event detection of five appliances using other performance metrics such as precision, recall, F1-score. The average accuracy of event detection model on these appliances data obtained 93%.
In summary,
Table 8 pointed the average performance of the approached model. The performance classification of our approach model achieved 92.64% and loss rate was 1.67.
In DL, LSTM model is used for classification ON/OFF event of appliances. Similar to Decision Tree model, this paper used
T signals and ON/OFF labeling for input and output features, respectively. For testing data, this research also used twenty
T signals of twenty tests data. Setting up hyper-parameters of LSTM model are described in
Table 9 as follows.
To evaluate LSTM model, this paper uses accuracy metric and Root Mean Square Error (RMSE) for measuring performance and loss of the model, respectively. RMSE is the standard deviation of the residuals (prediction errors). The formula to calculate RMSE is as follows.
where
is predicted output and
is expected output.
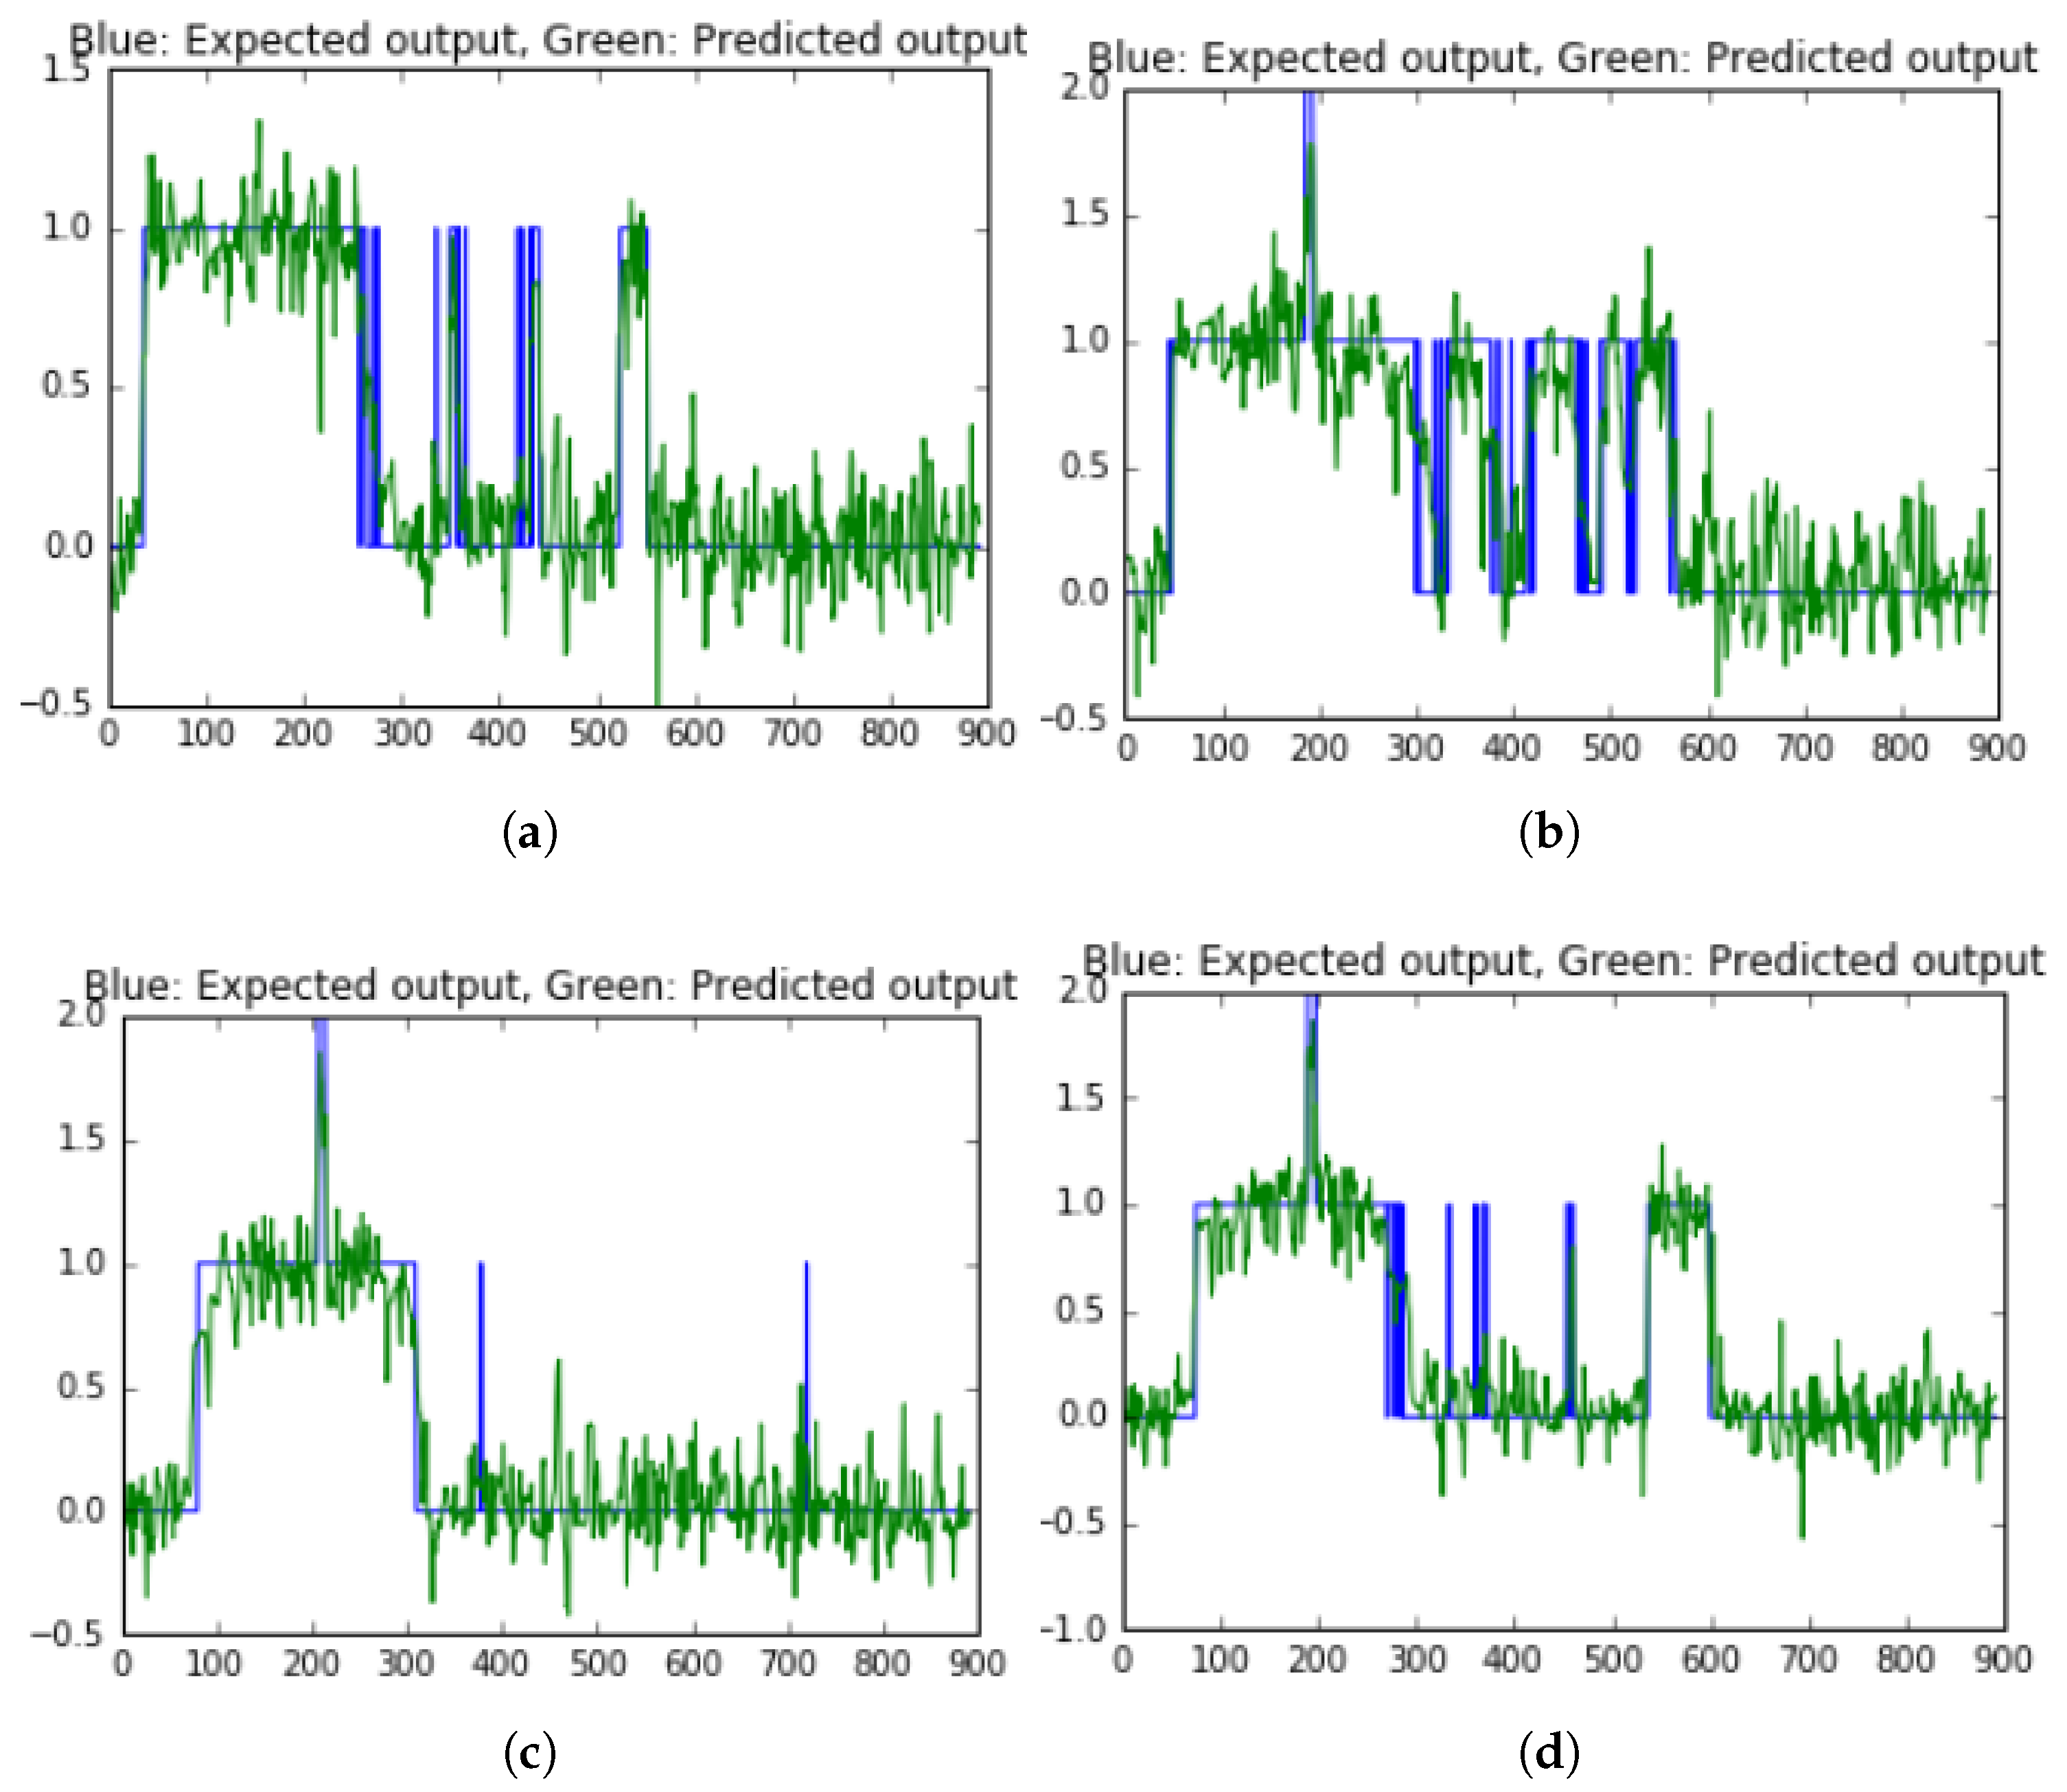
Figure 15 presents the results of LSTM model for classification ON/OFF of five appliances data. Besides, LSTM model’s results on test 1 to test 4 data are shown in
Figure 16 and the others tests’ results in
Figure A4 at
Appendix A. The average accuracy of LSTM model obtained 96.85% for detecting ON/OFF appliances. The loss of LSTM model (RMSE) obtained 0.60632.
4.2.3. Applying the Proposed Method on a Publicly Available Dataset
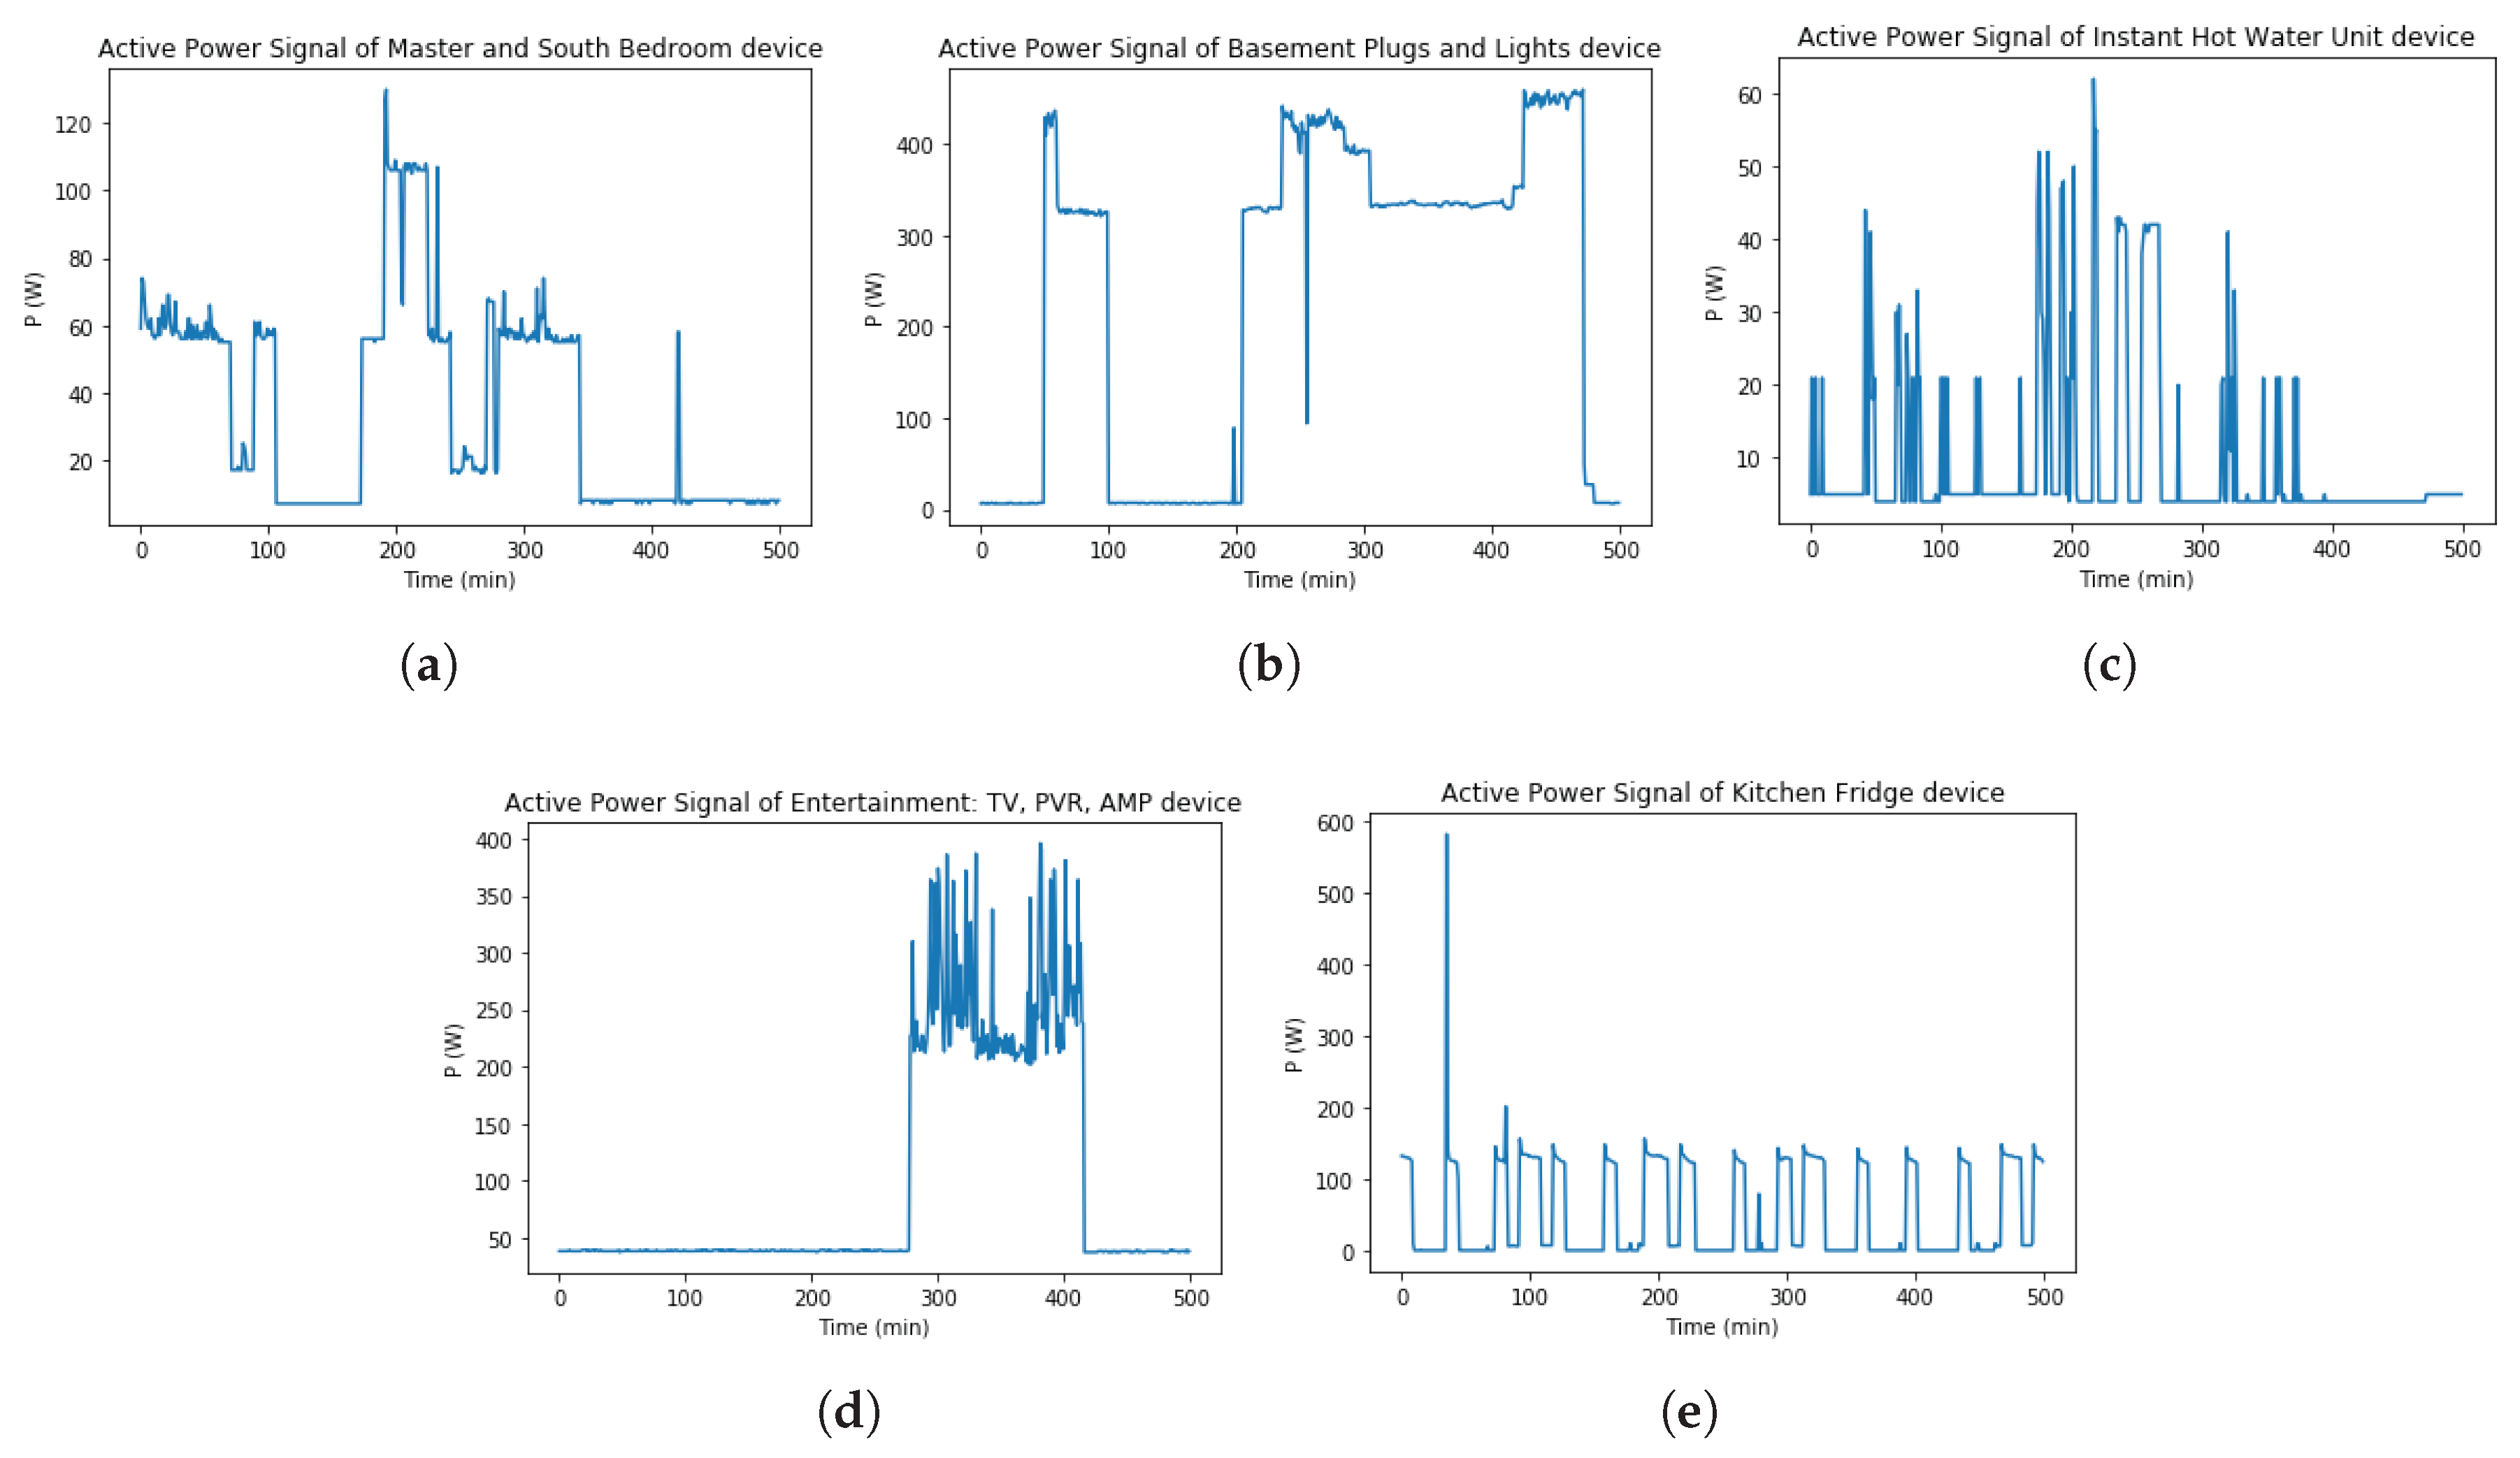
There are several NILM available datasets such as Building-Level fUlly-labeled dataset for Electricity Disaggregation (BLUED), UK-DALE, Residential Energy Disaggregation Dataset (REDD), The Almanac of Minutely Power dataset (Version 2) (AMPds2) etc. This paper applied the proposed method on AMPds2 [
33] dataset which is low sampling rate data. Although several data file formats are published such as Original file format, Tab-delimited, Rdata format, Variable metadata, etc. The original file format in CSV is used in this paper. In this dataset, there are 19 appliances data in isolation have already collected and tested in electricity data. There are no publicly aggregated data between the loads in this dataset. Therefore, this paper only performed and tested on individual load. Among available loads, 5 appliances data are randomly selected to use in this experiment. These appliances are Master and South Bedroom, Basement Plugs and Lights, Instant Hot Water Unit, Entertainment: TV, PVR, AMP, Kitchen Fridge. Besides, ON/OFF label value are determined and declared from 1 to 10 corresponding to each appliance. The information of these appliances and their ON/OFF labels are described in
Table 10 as follows.
About processing dataset, in this dataset, there are 11 electric data features in each appliance data. Timestamp (TS) feature is Unix timestamp value in this dataset. Electricity measurement is at one minute intervals. This dataset was collected to total of 1,051,200 readings per meter for 2 years of monitoring from 2012 to 2014. Therefore, these loads data are big dataset. In testing performance of the presently proposed methodology, the range of TS in the first 500 readings/samples value data from 1333263600 to 1333323540 is selected. This range of TS value is converted to Universal Time Coordinated (UTC) corresponding to the date time range from 2012-4-01 7:00 a.m. to 2012-4-01 15:19 p.m. The total of time series data is 500 min. Because real power
P is active power data, hence
P is selected for the input data in the experiment.
Figure 17 visualizes five real power
P signals time series data were selected.
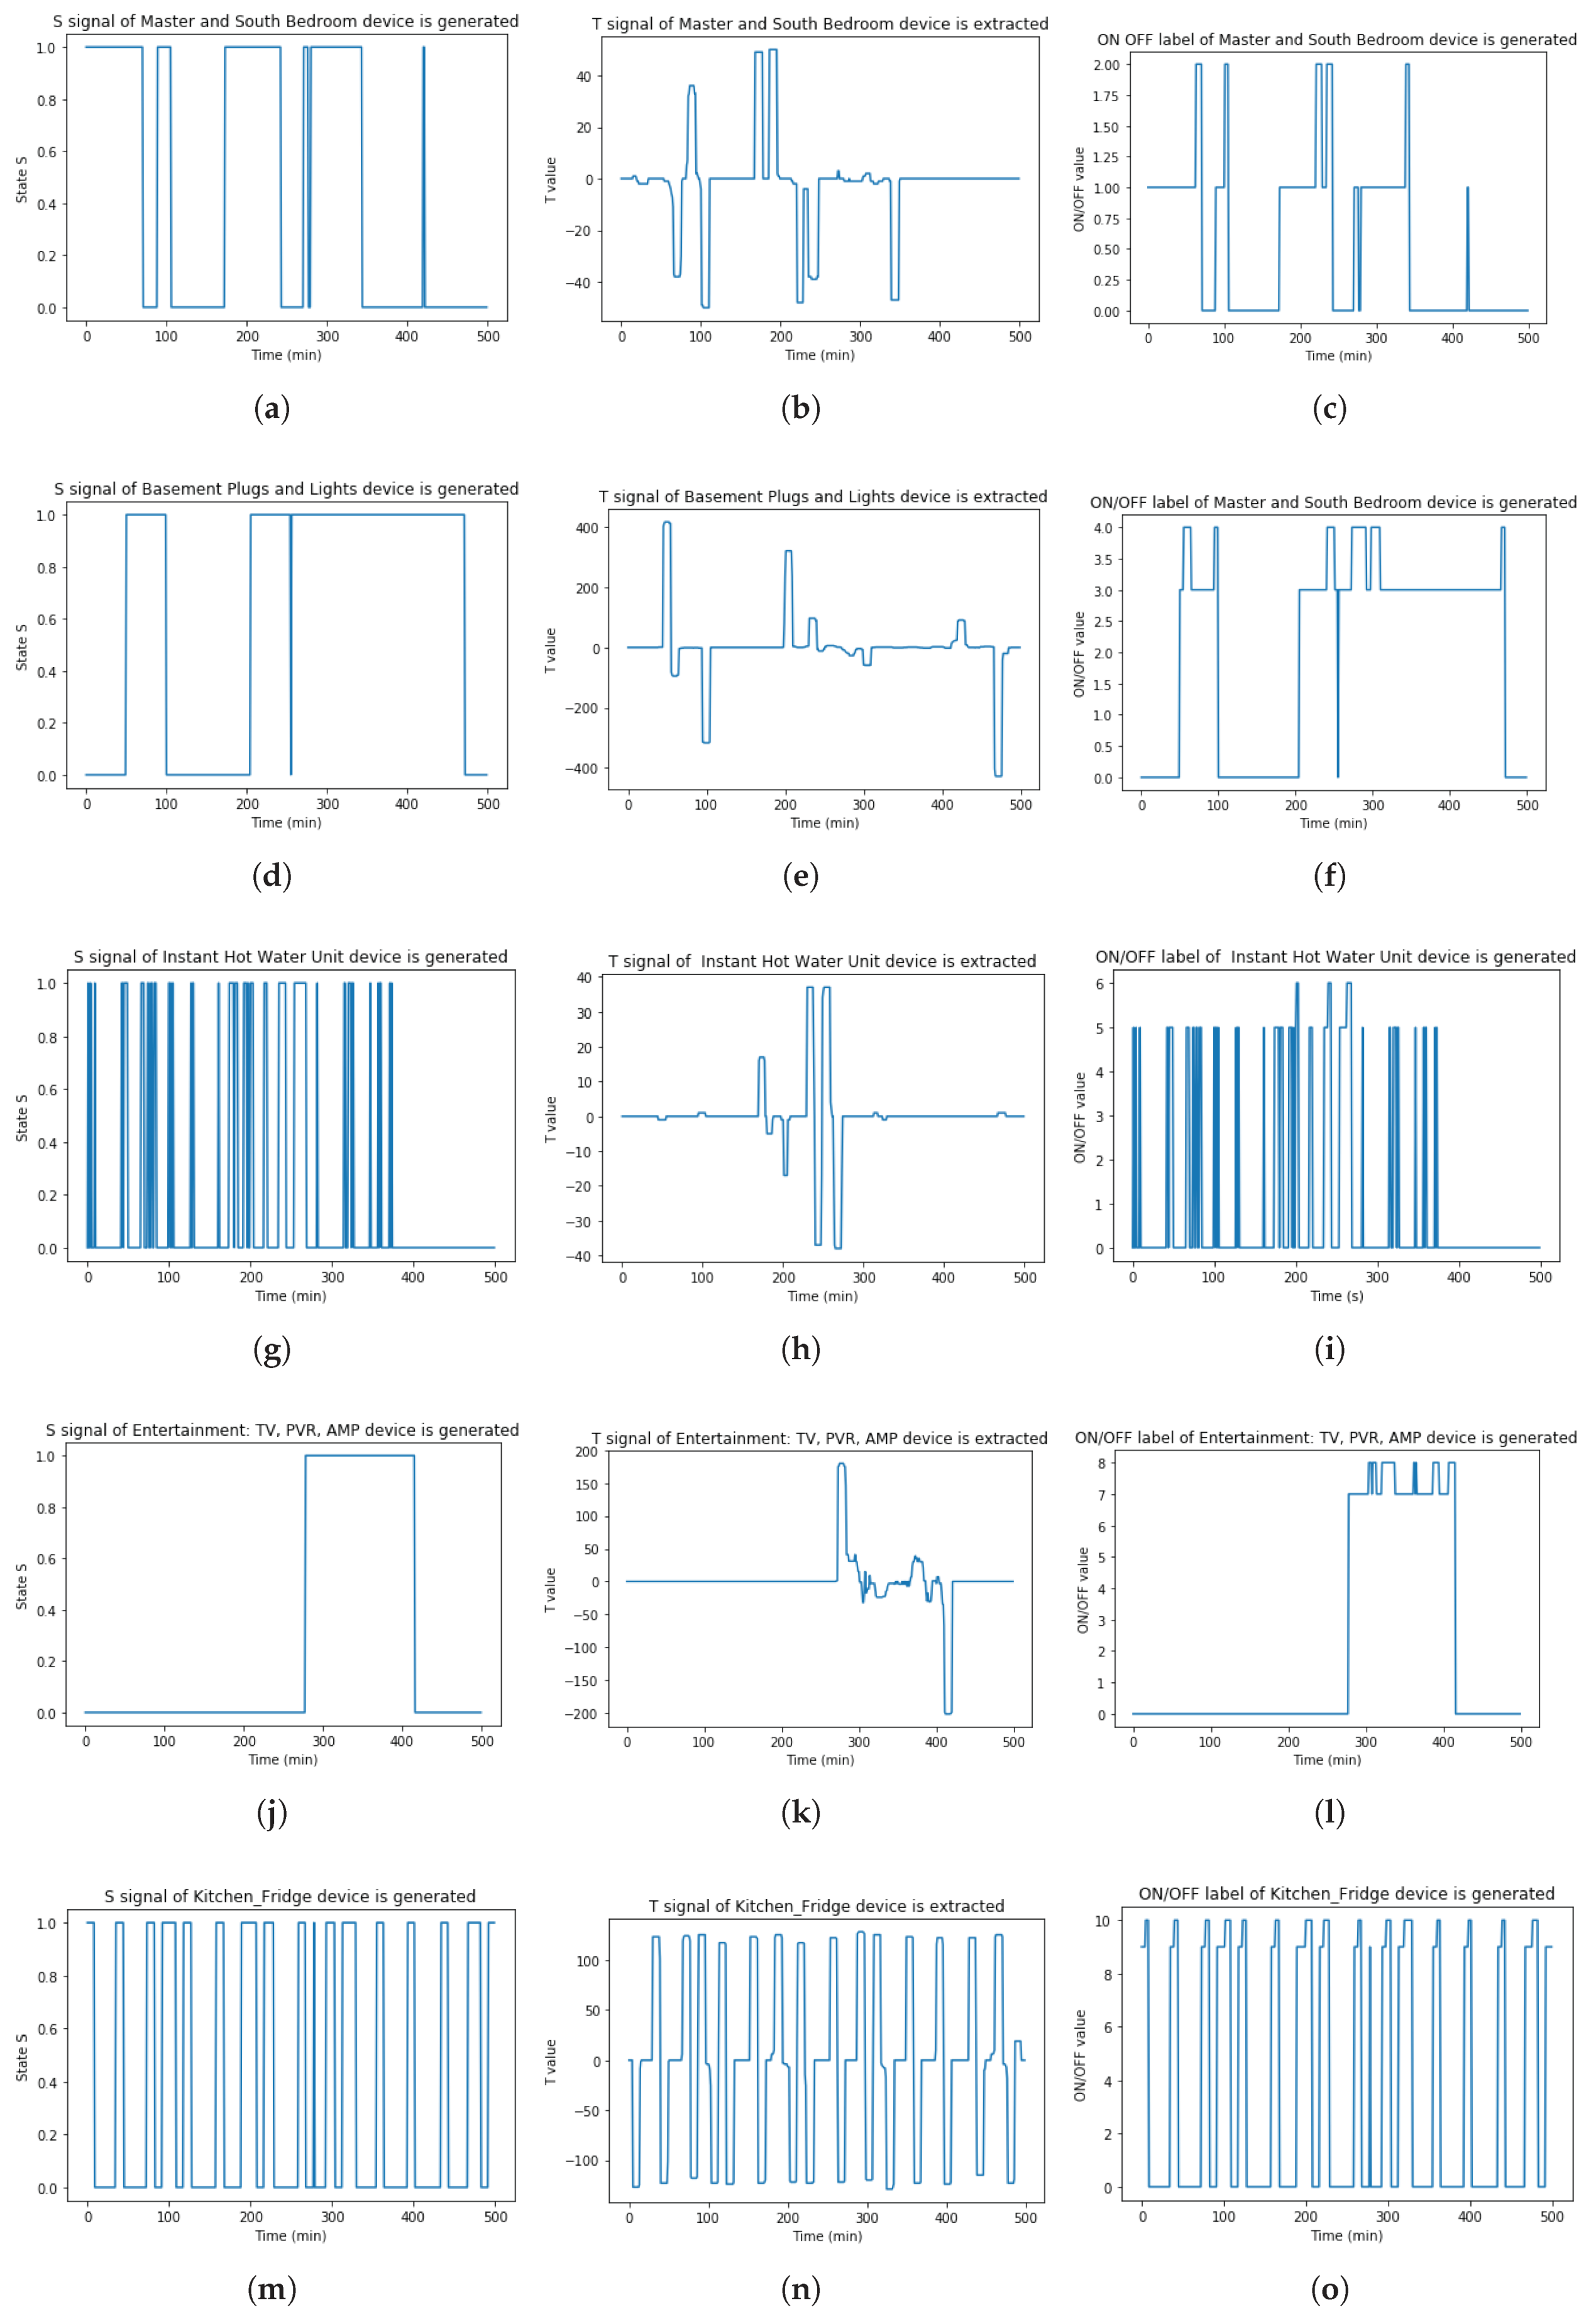
About feature extraction result, this paper applied the proposed solution to generate and extract
S,
T, ON/OFF label signals of each appliance.
Figure 18 illustrates these results of each appliance.
About classification result, this paper applied two approached learning models on this selected dataset.
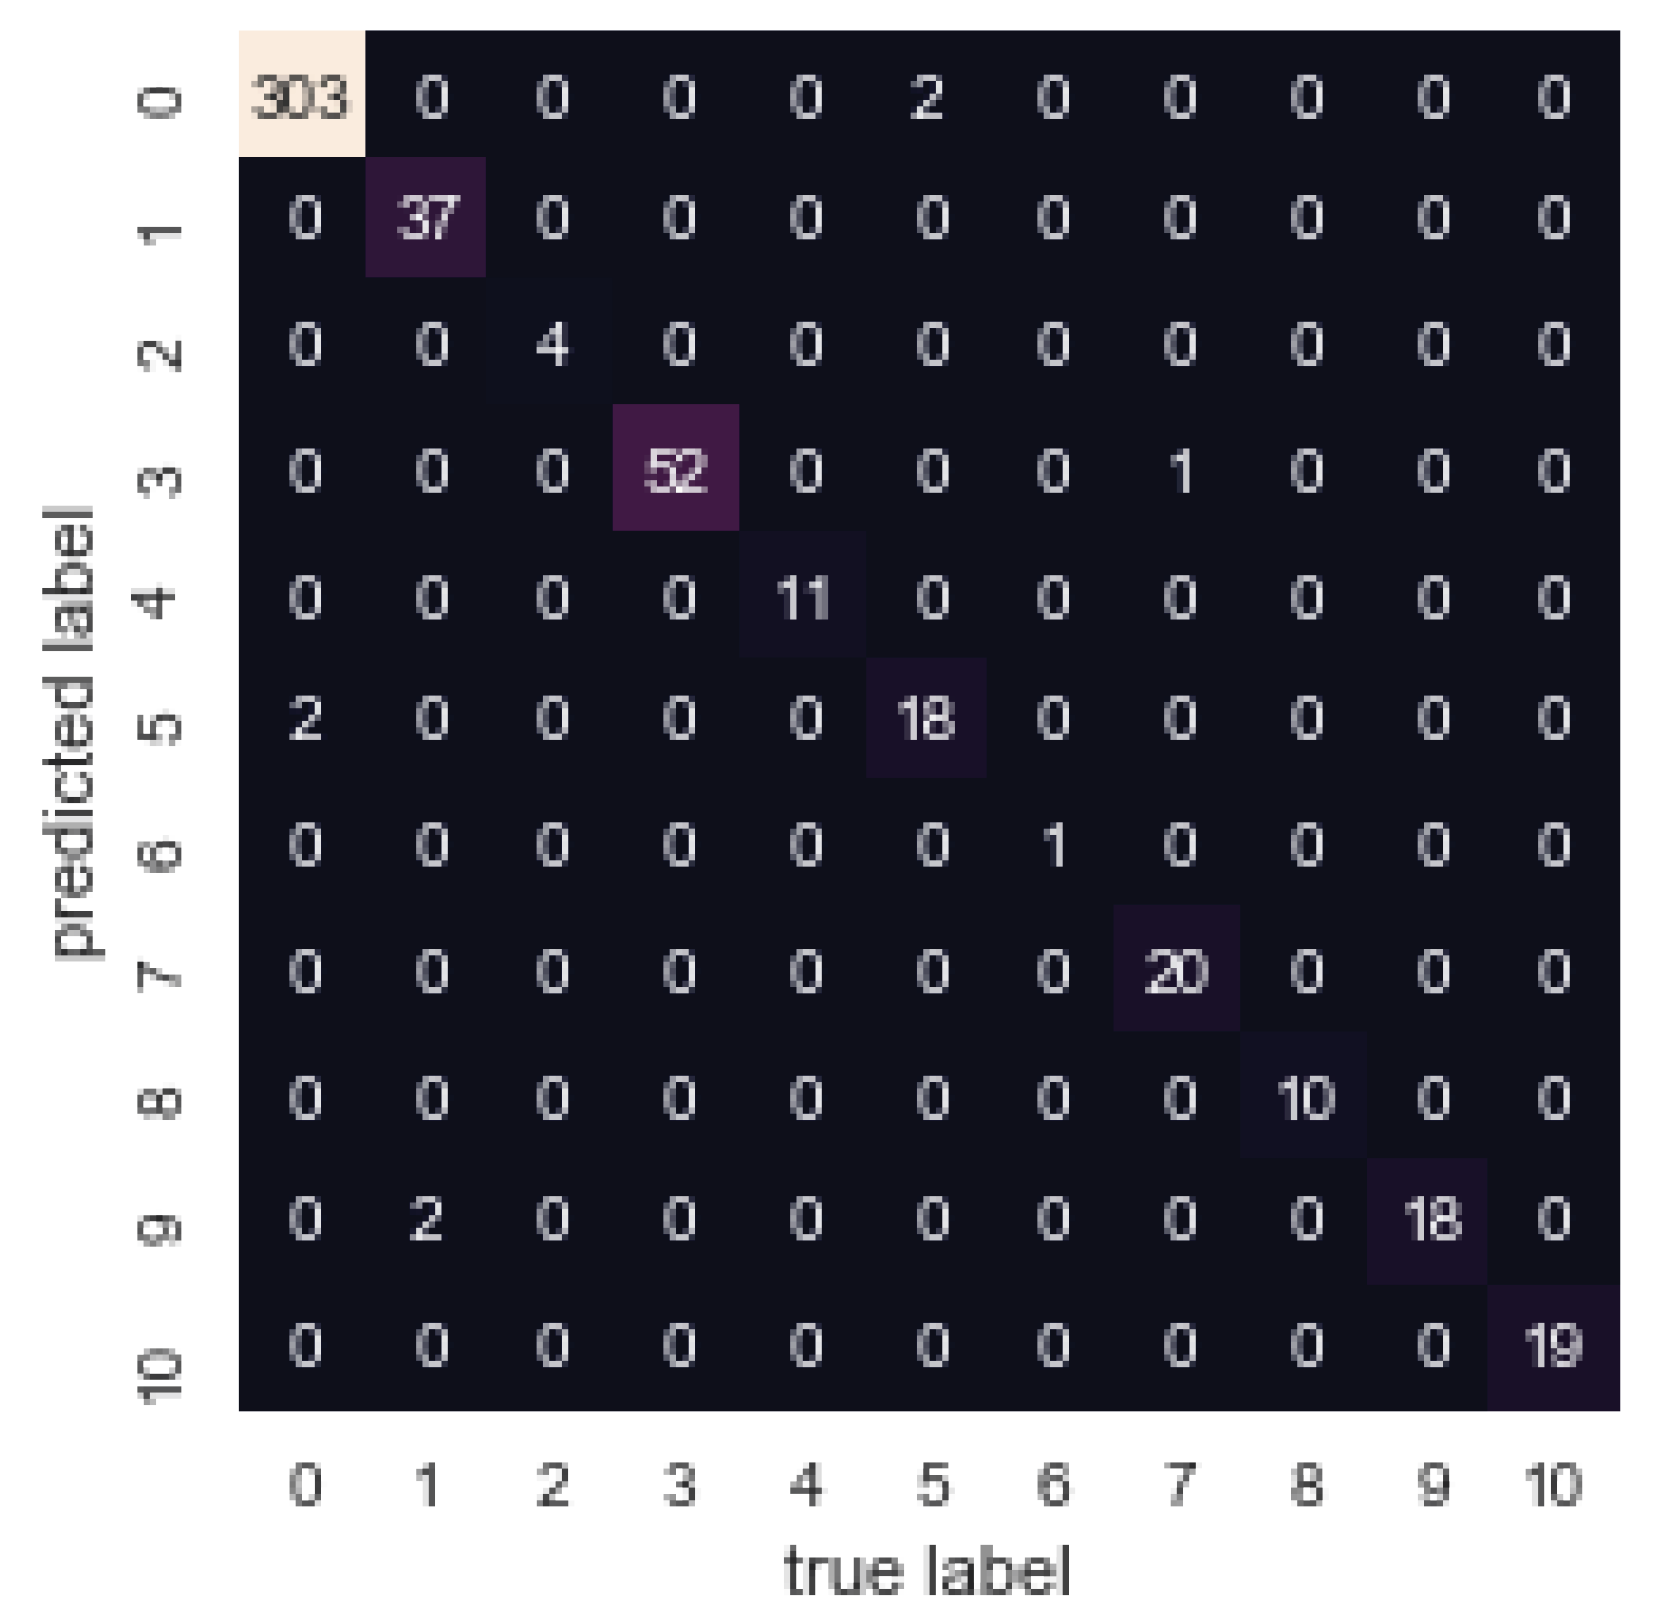
In ML, the classification result of Decision Tree model is presented in
Figure 19. Furthermore,
Table 11 presents the event detection results in detail of this confusion matrix result. The average classification performance of Decision Tree model on this dataset achieved 98.6% accuracy and loss rate was 0.488.
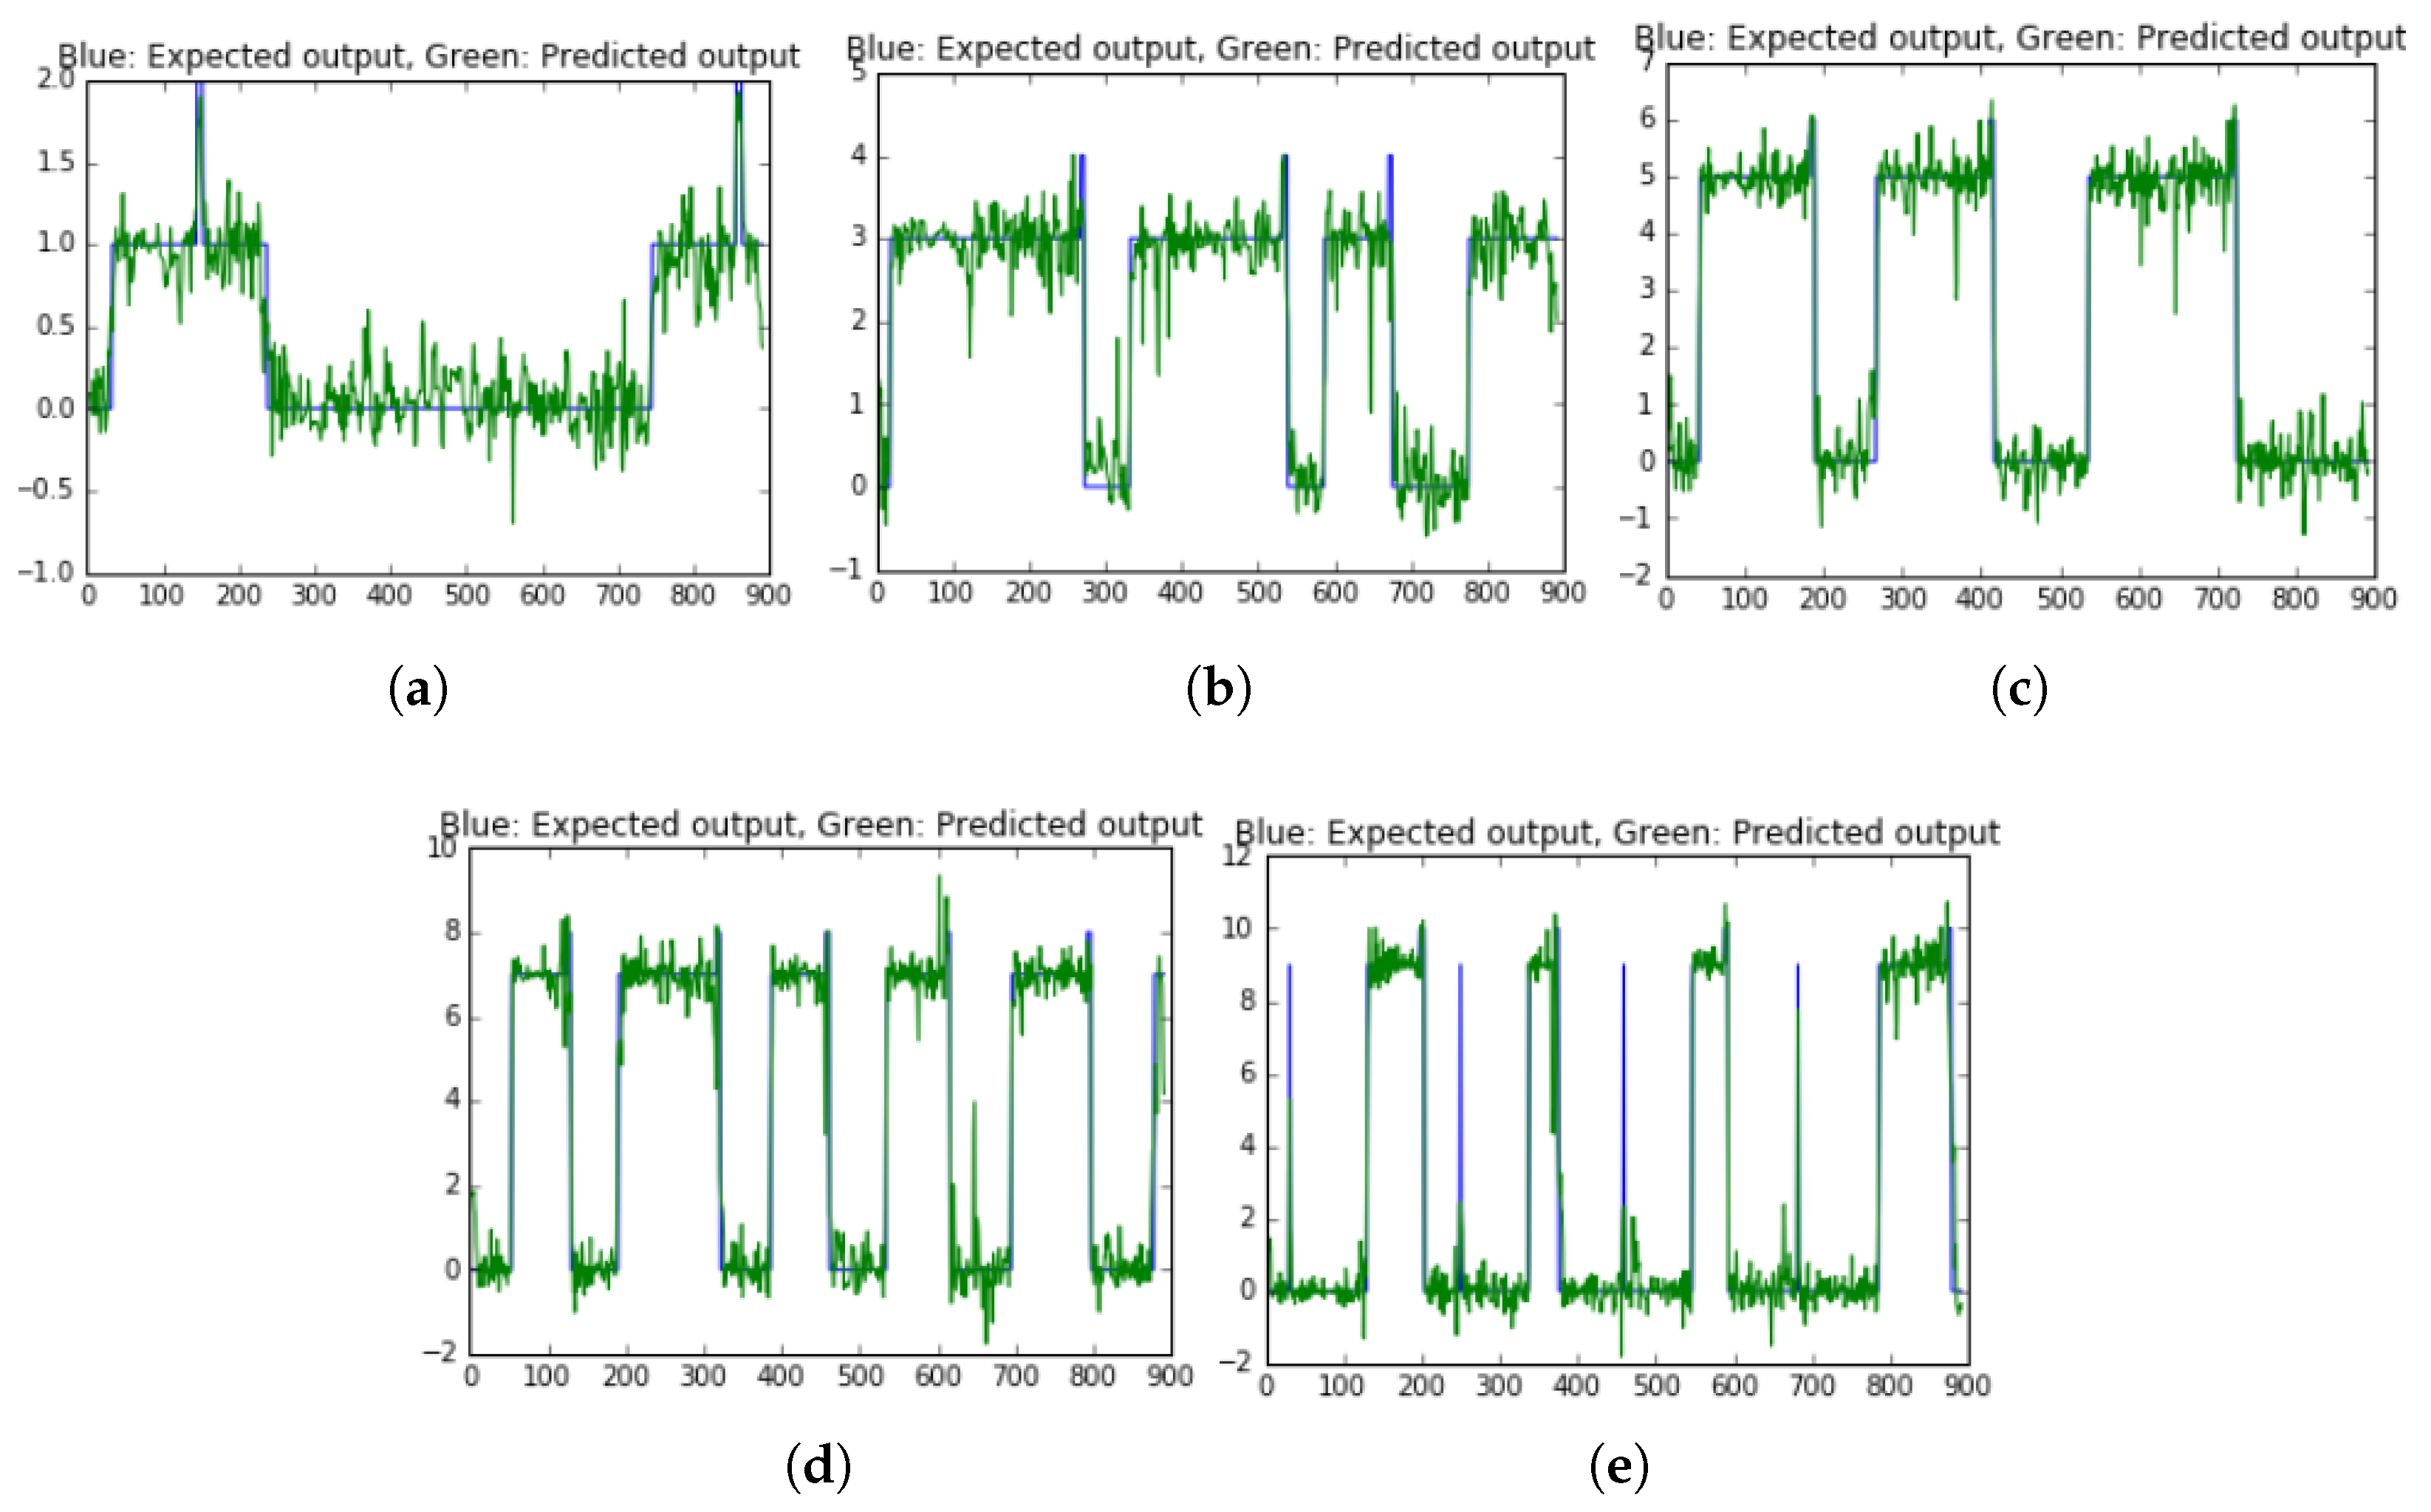
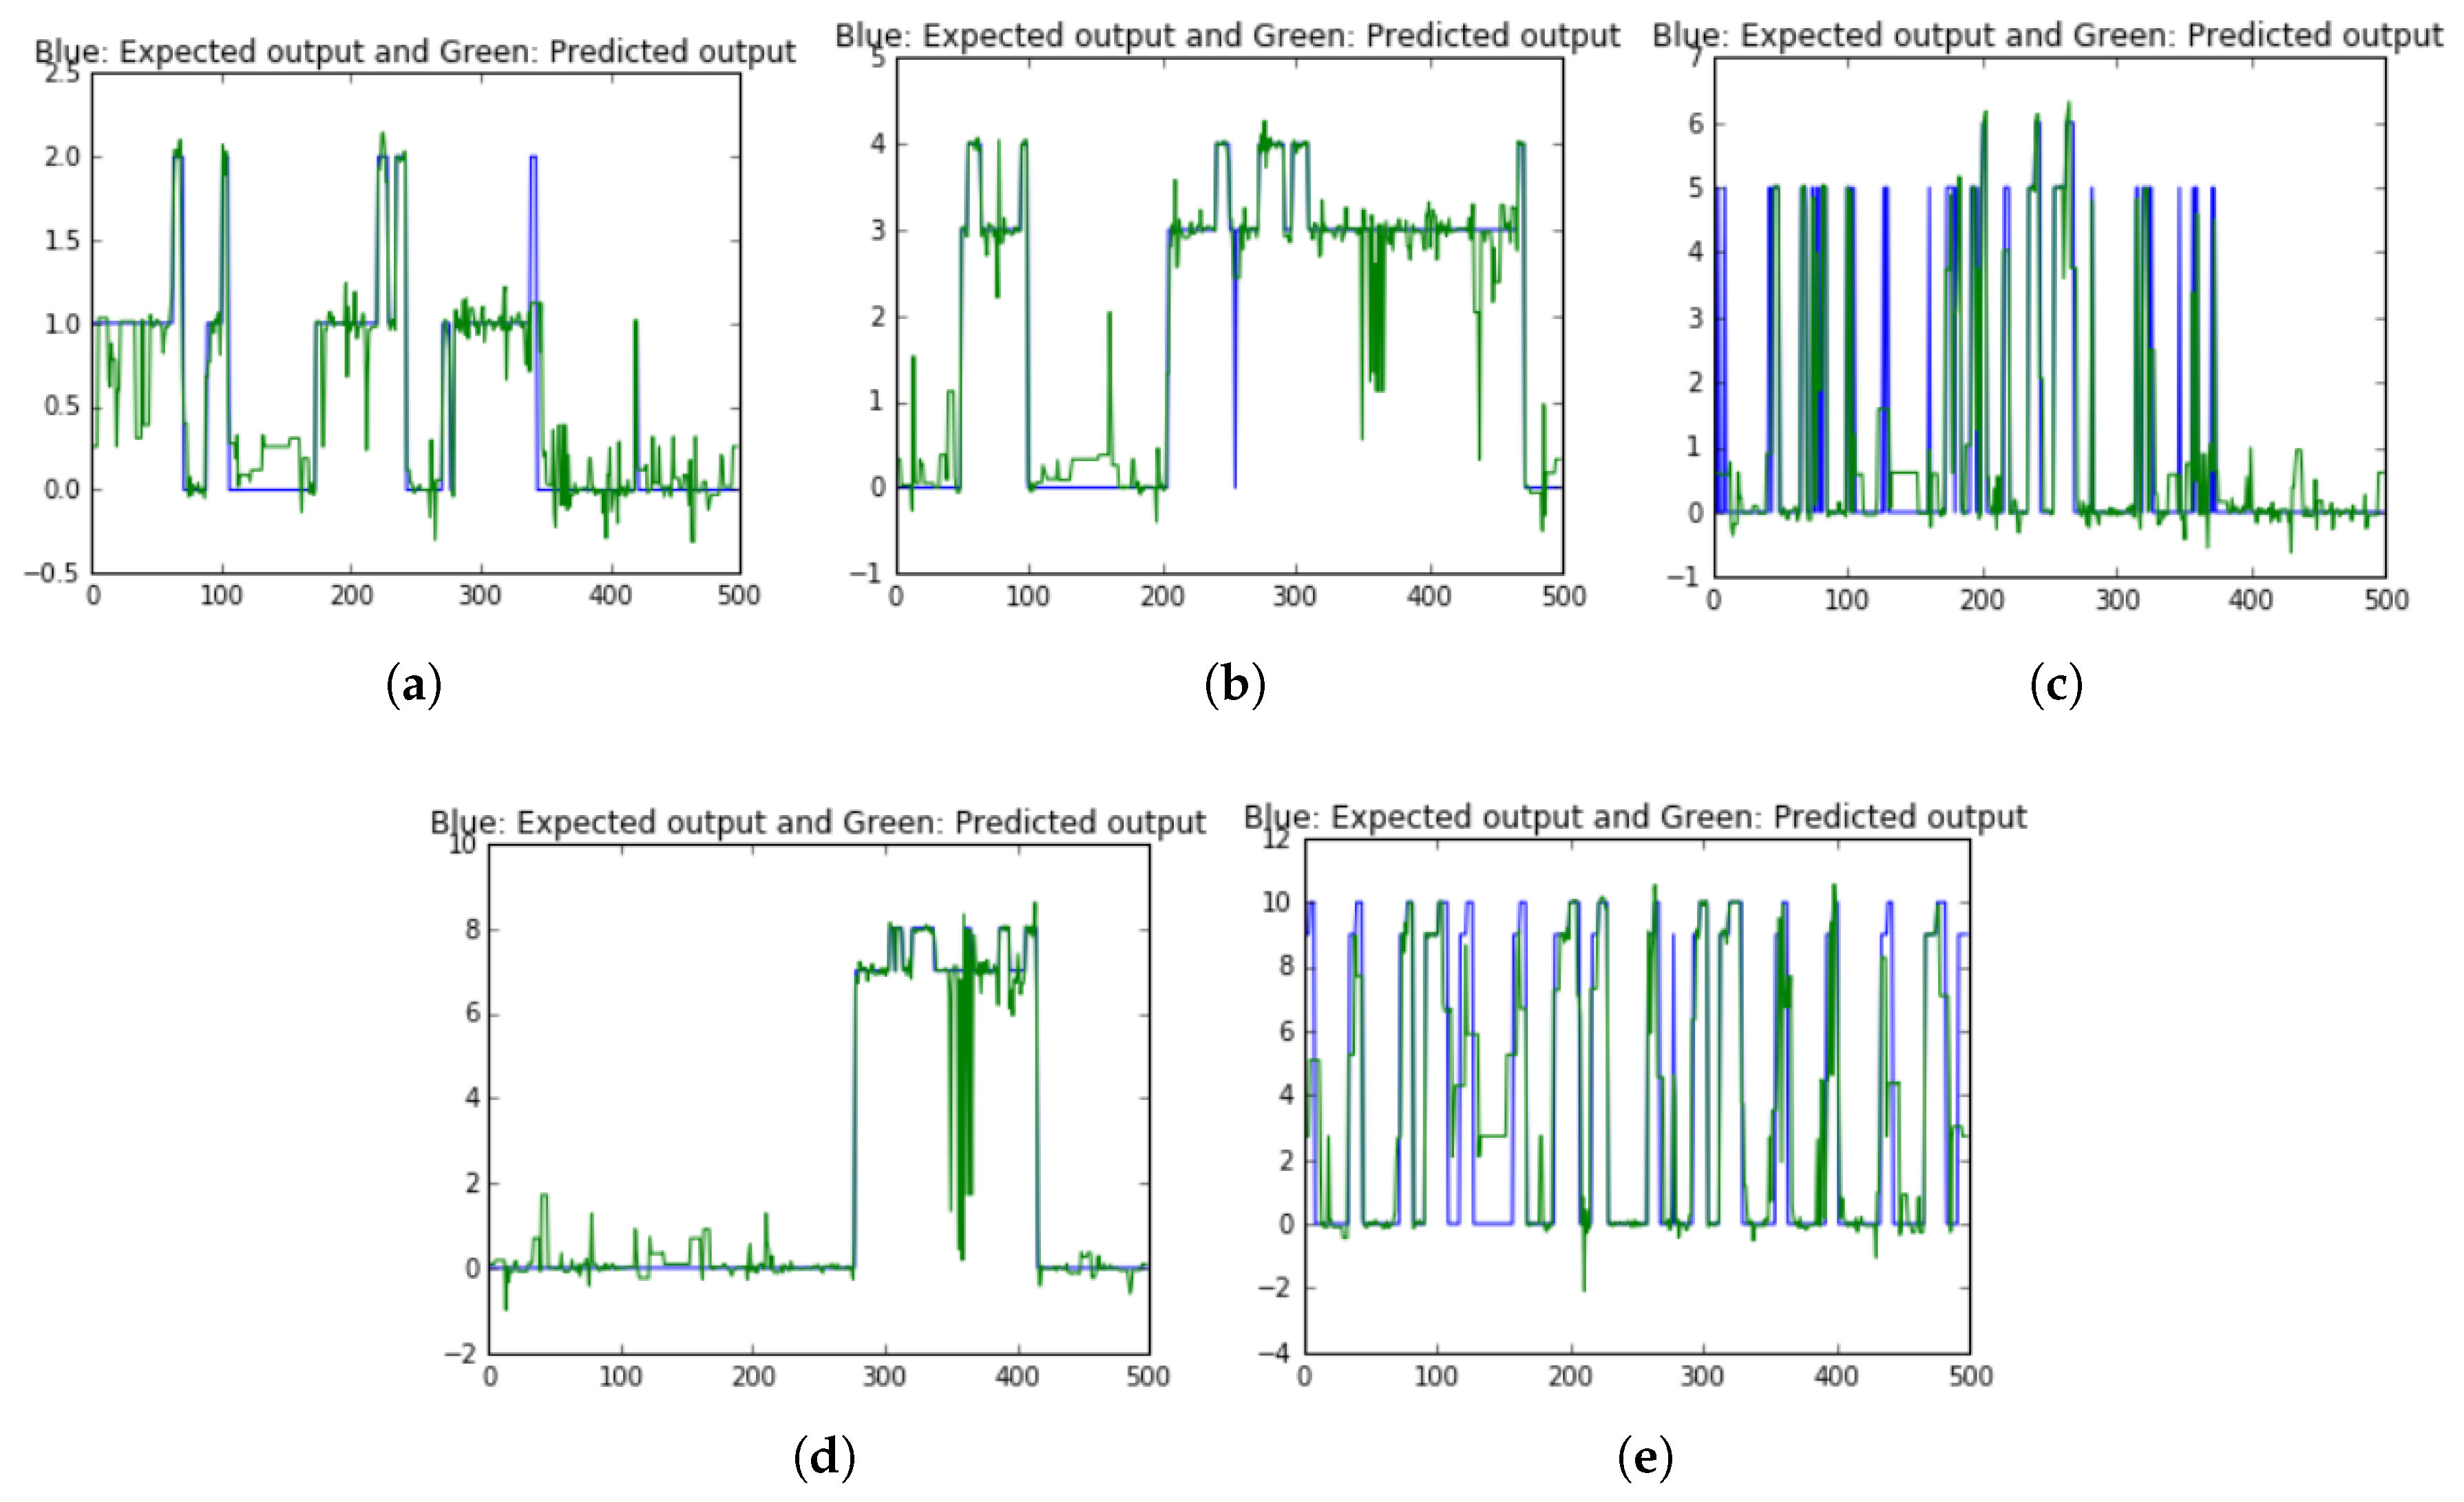
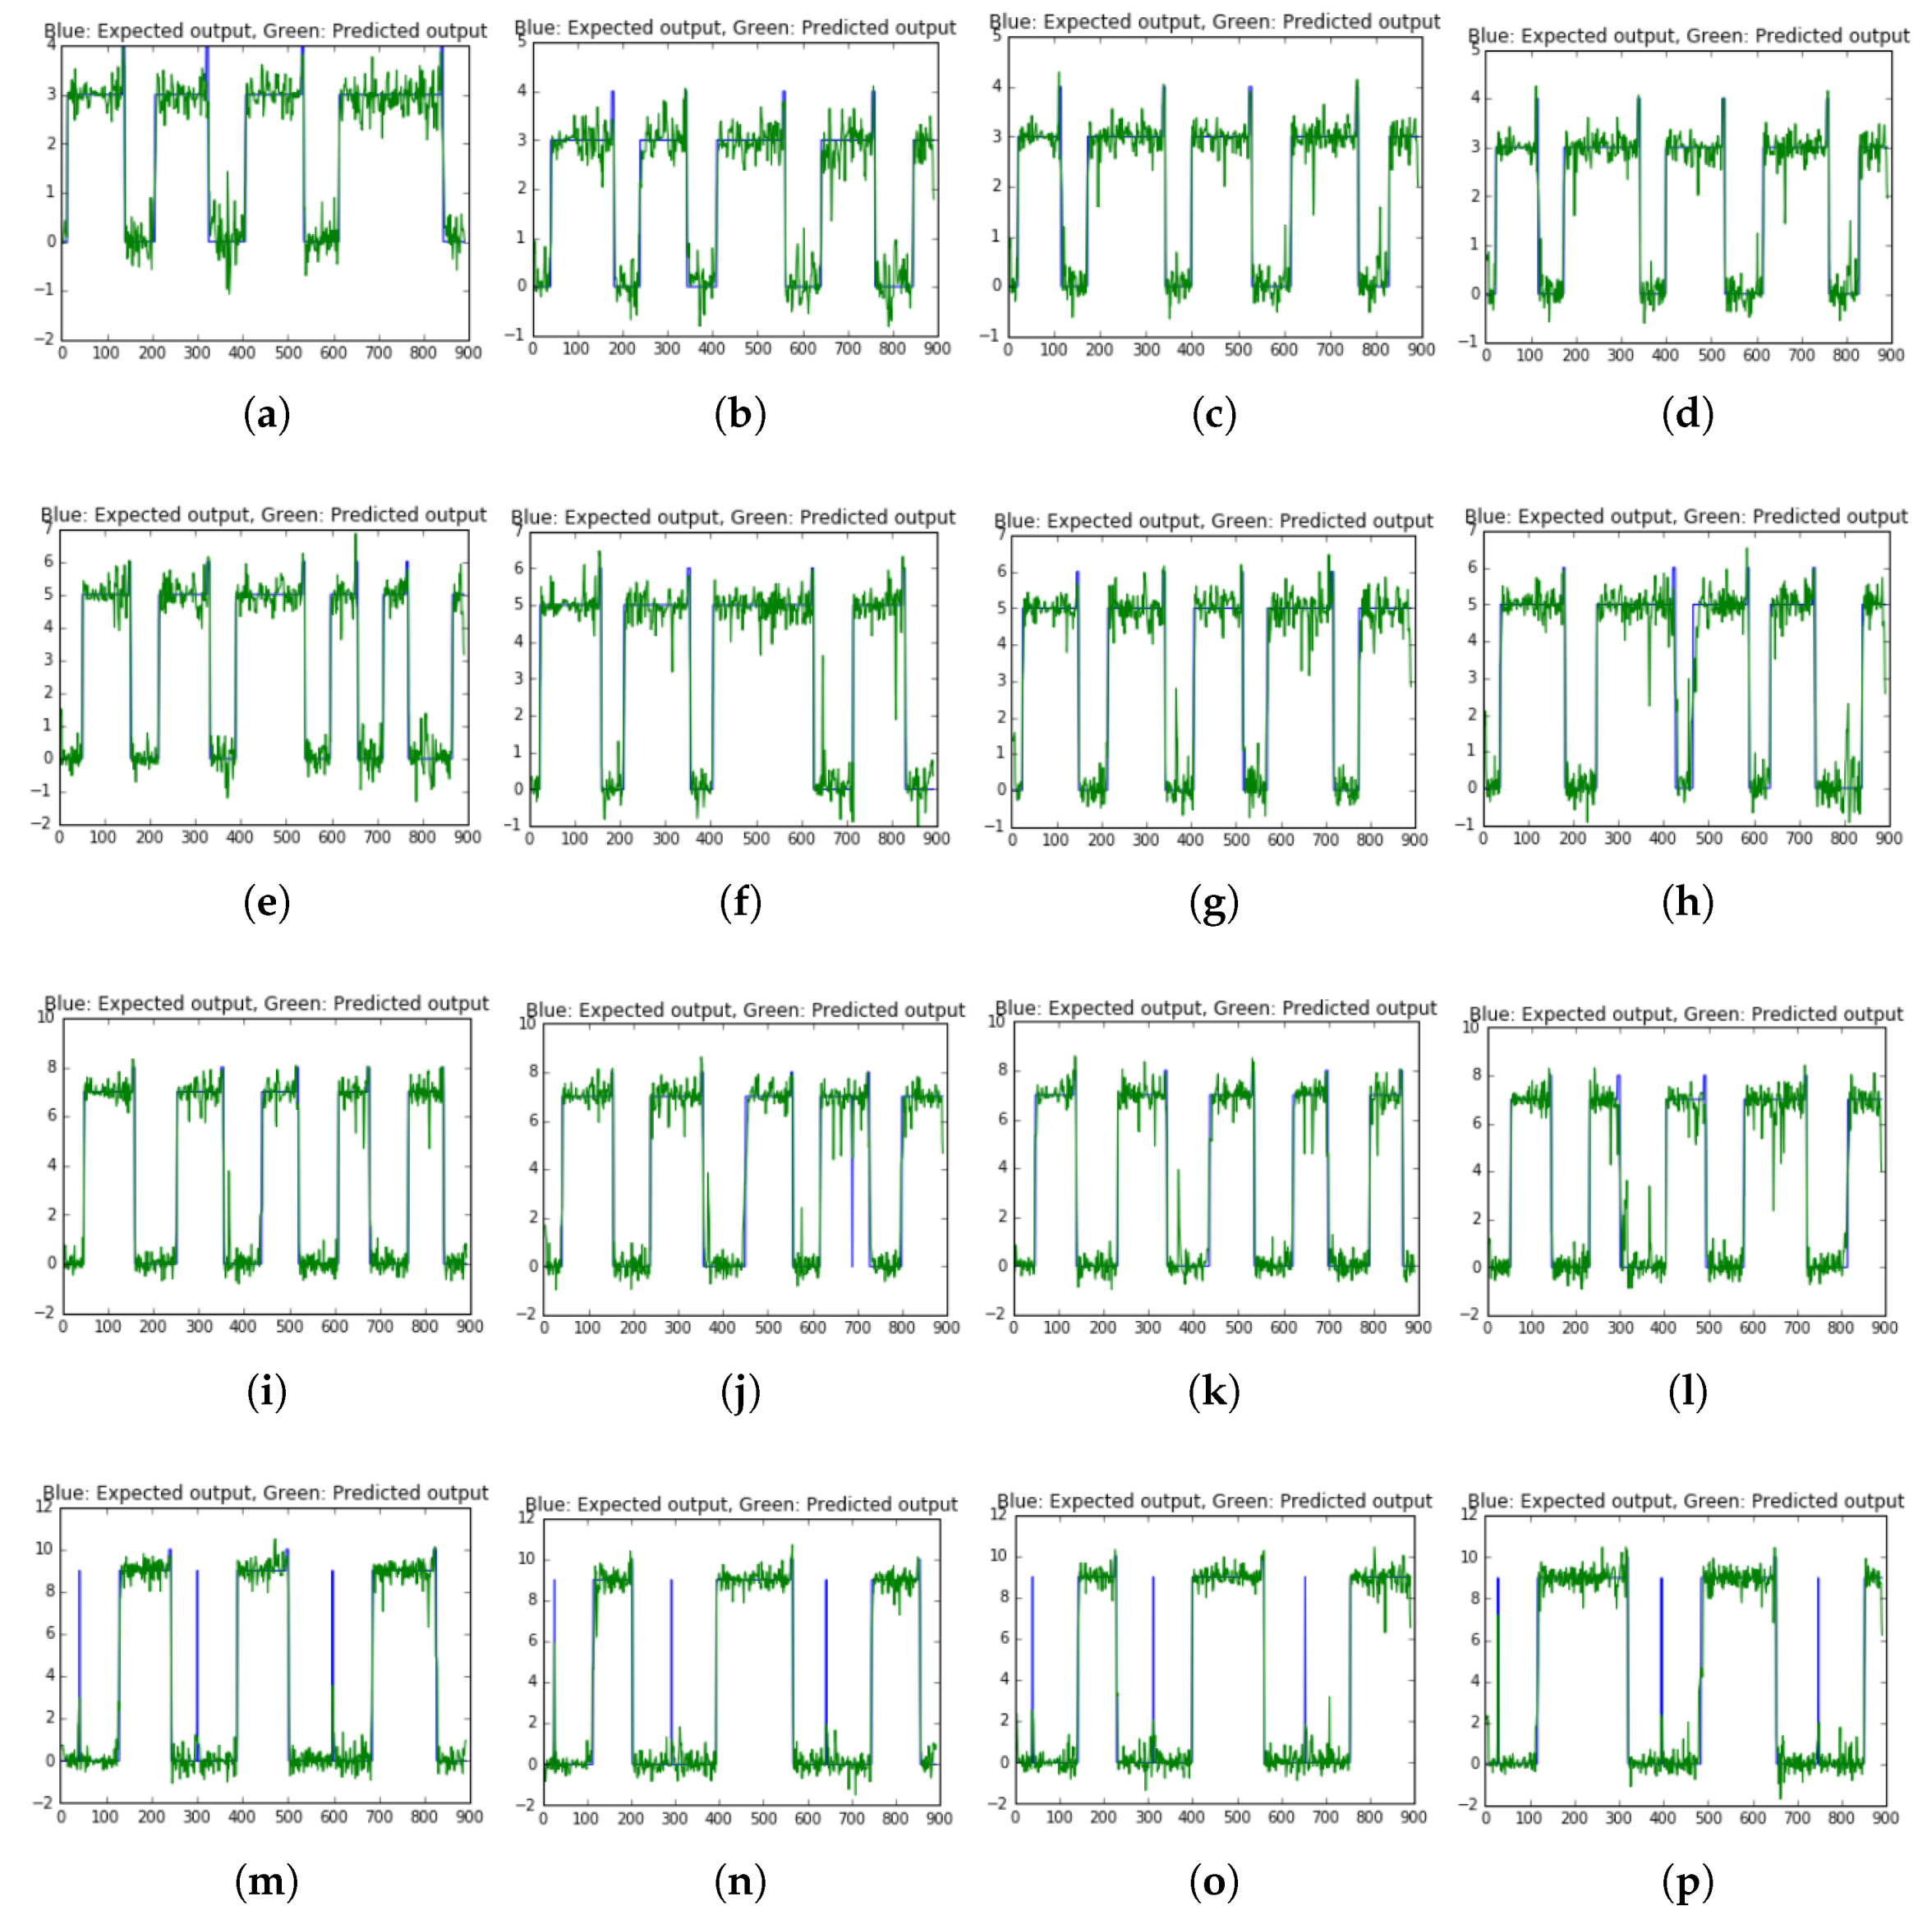
In DL, the classification result of LSTM model obtained 96.78% accuracy and RMSE was 0.5124.
Figure 20 illustrates the predicted results ON/OFF label of 5 appliances compare to the expected outputs.
In summary, the presently proposed method achieved high-performance accuracy for load identification on the AMPds2 dataset with over 96% accuracy on both approached learning models.


