Prospects of a Meshed Electrical Distribution System Featuring Large-Scale Variable Renewable Power

 , and
, and 
Abstract
:1. Introduction
1.1. Framework and Motivation
1.2. Literature Review
1.3. Contributions and the Paper’s Organization
2. Mathematical Model
2.1. Objective Function
2.2. Constraints
3. Results
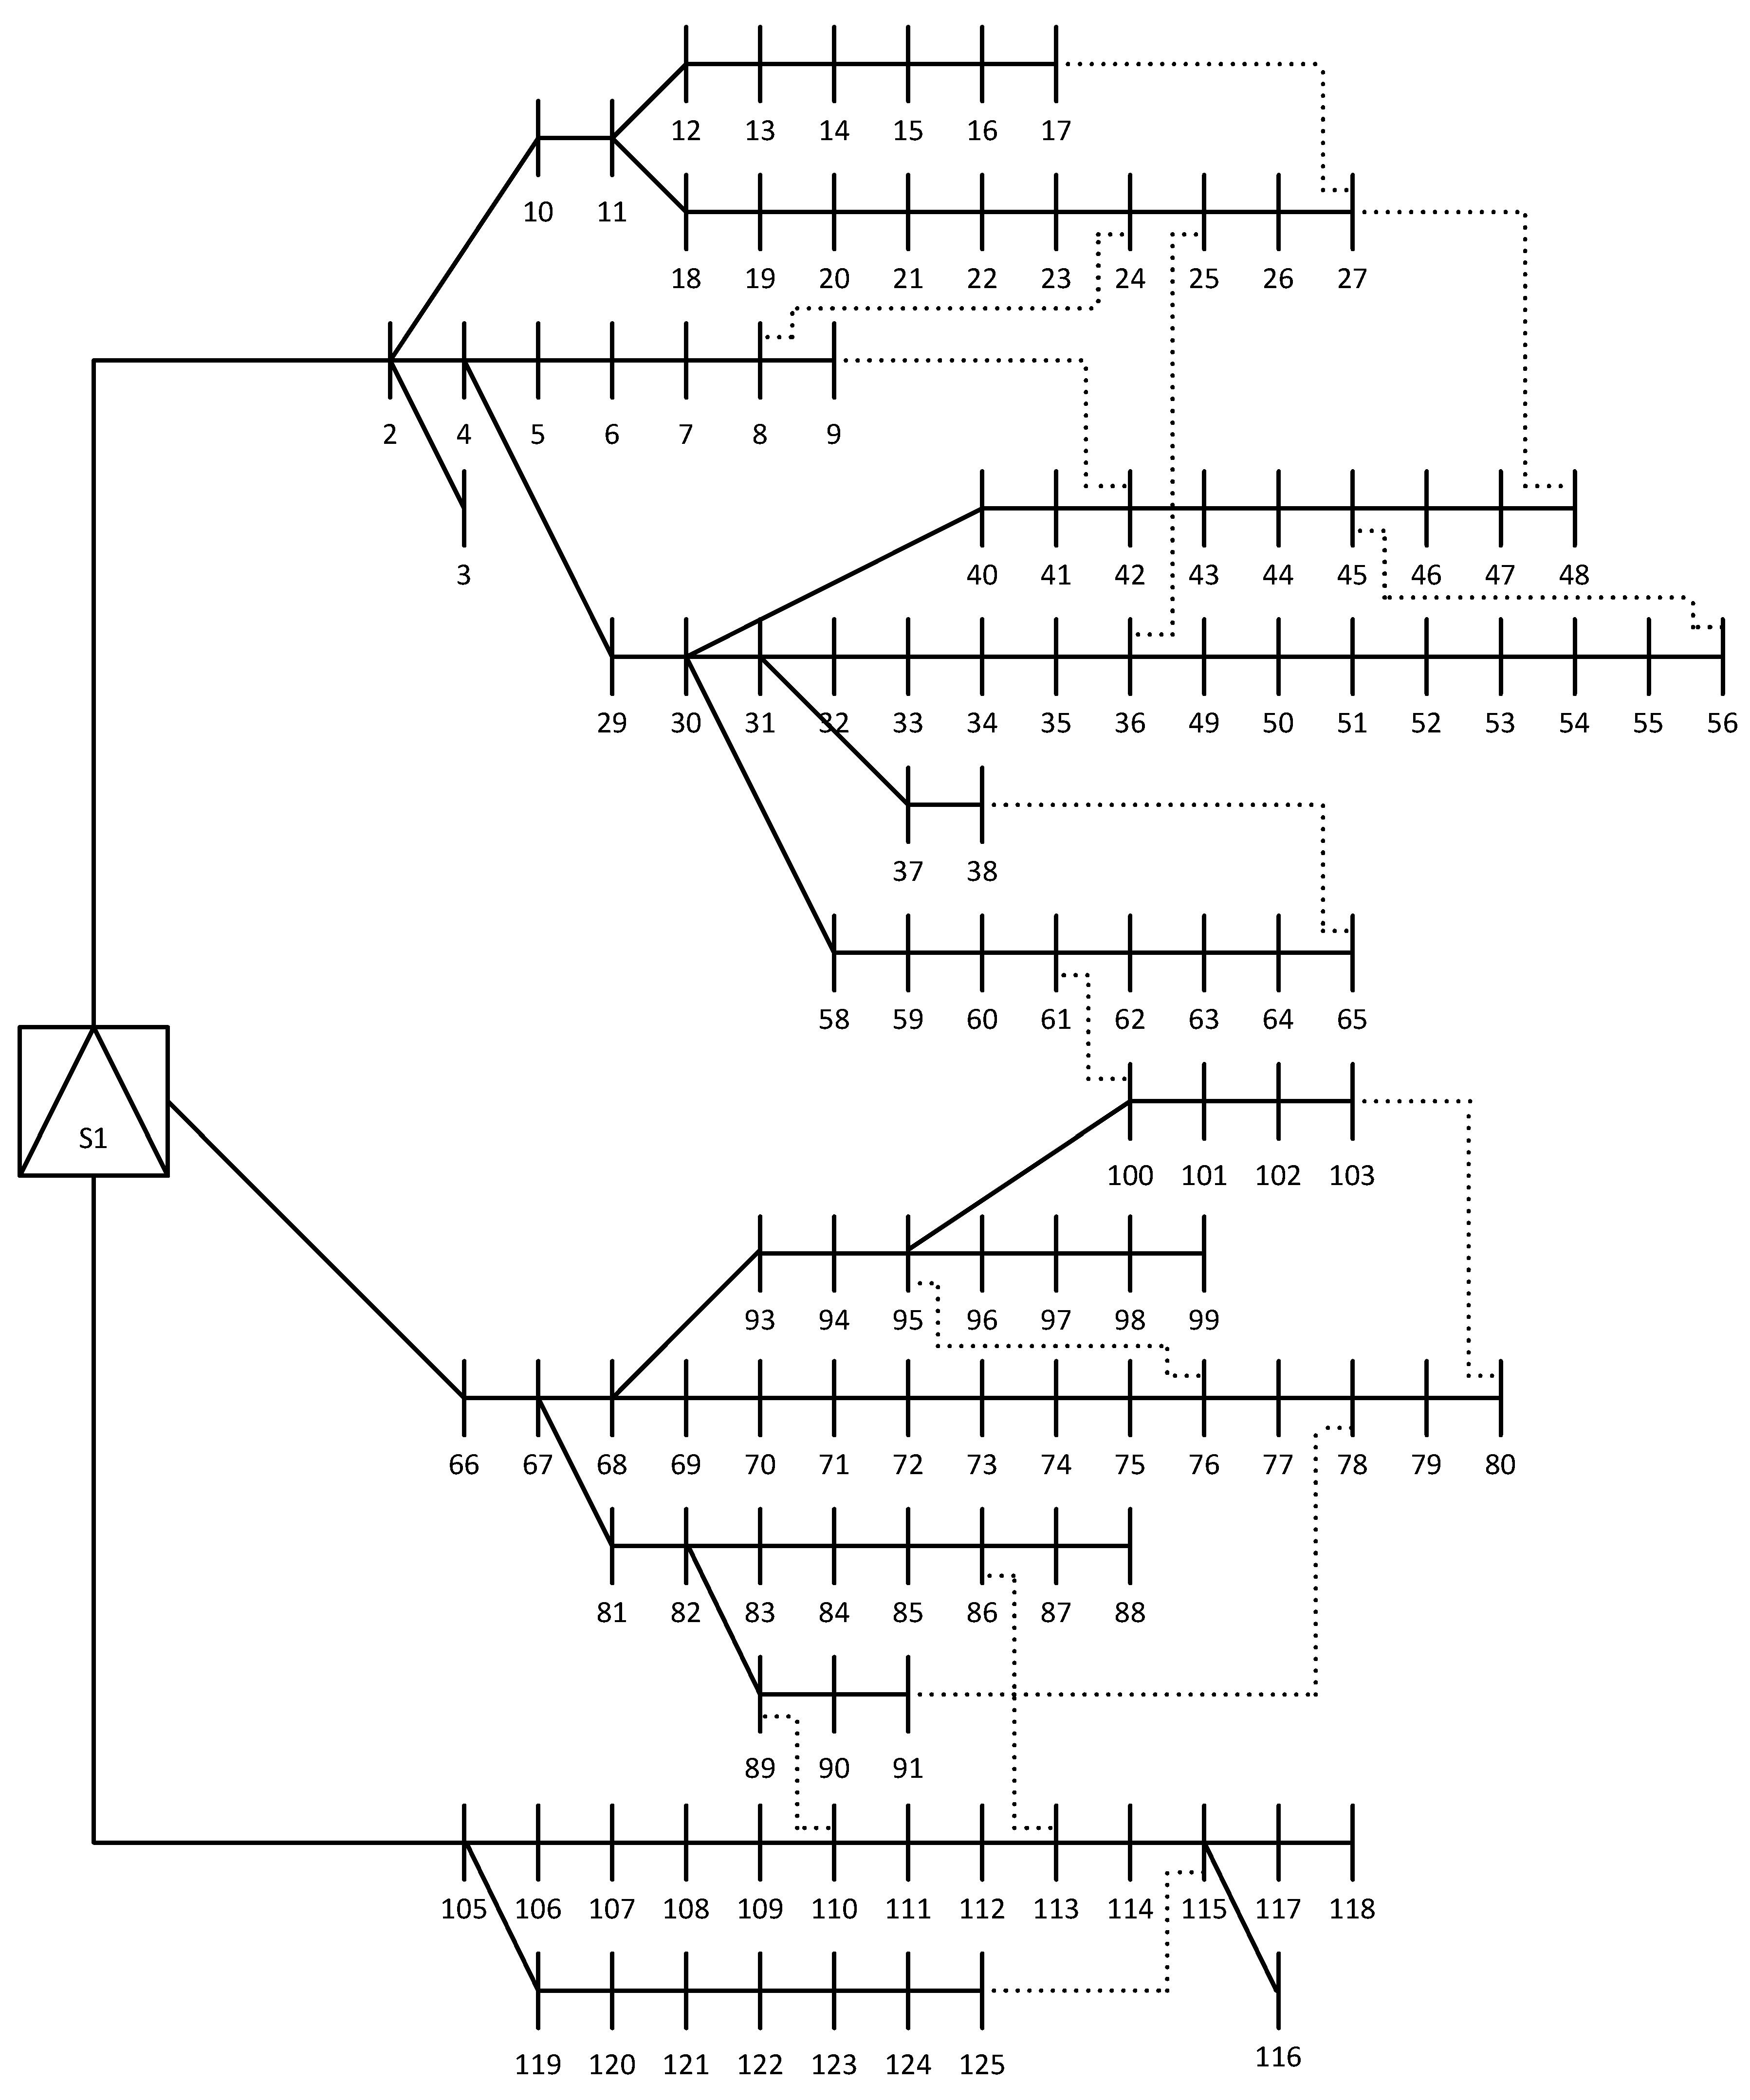
3.1. Data and Assumptions
- The operational analysis is based on a 24-h period, subdivided on an hourly basis.
- The maximum voltage deviation at each bus is set to ±5% of the nominal value (which, in this case, is 11 kV).
- In all simulations, the substation is treated as the reference node, in which both the voltage deviation and the angle are set to zero.
- The number of partitions considered for linearizing quadratic terms is 5, which is in line with the findings in [26].
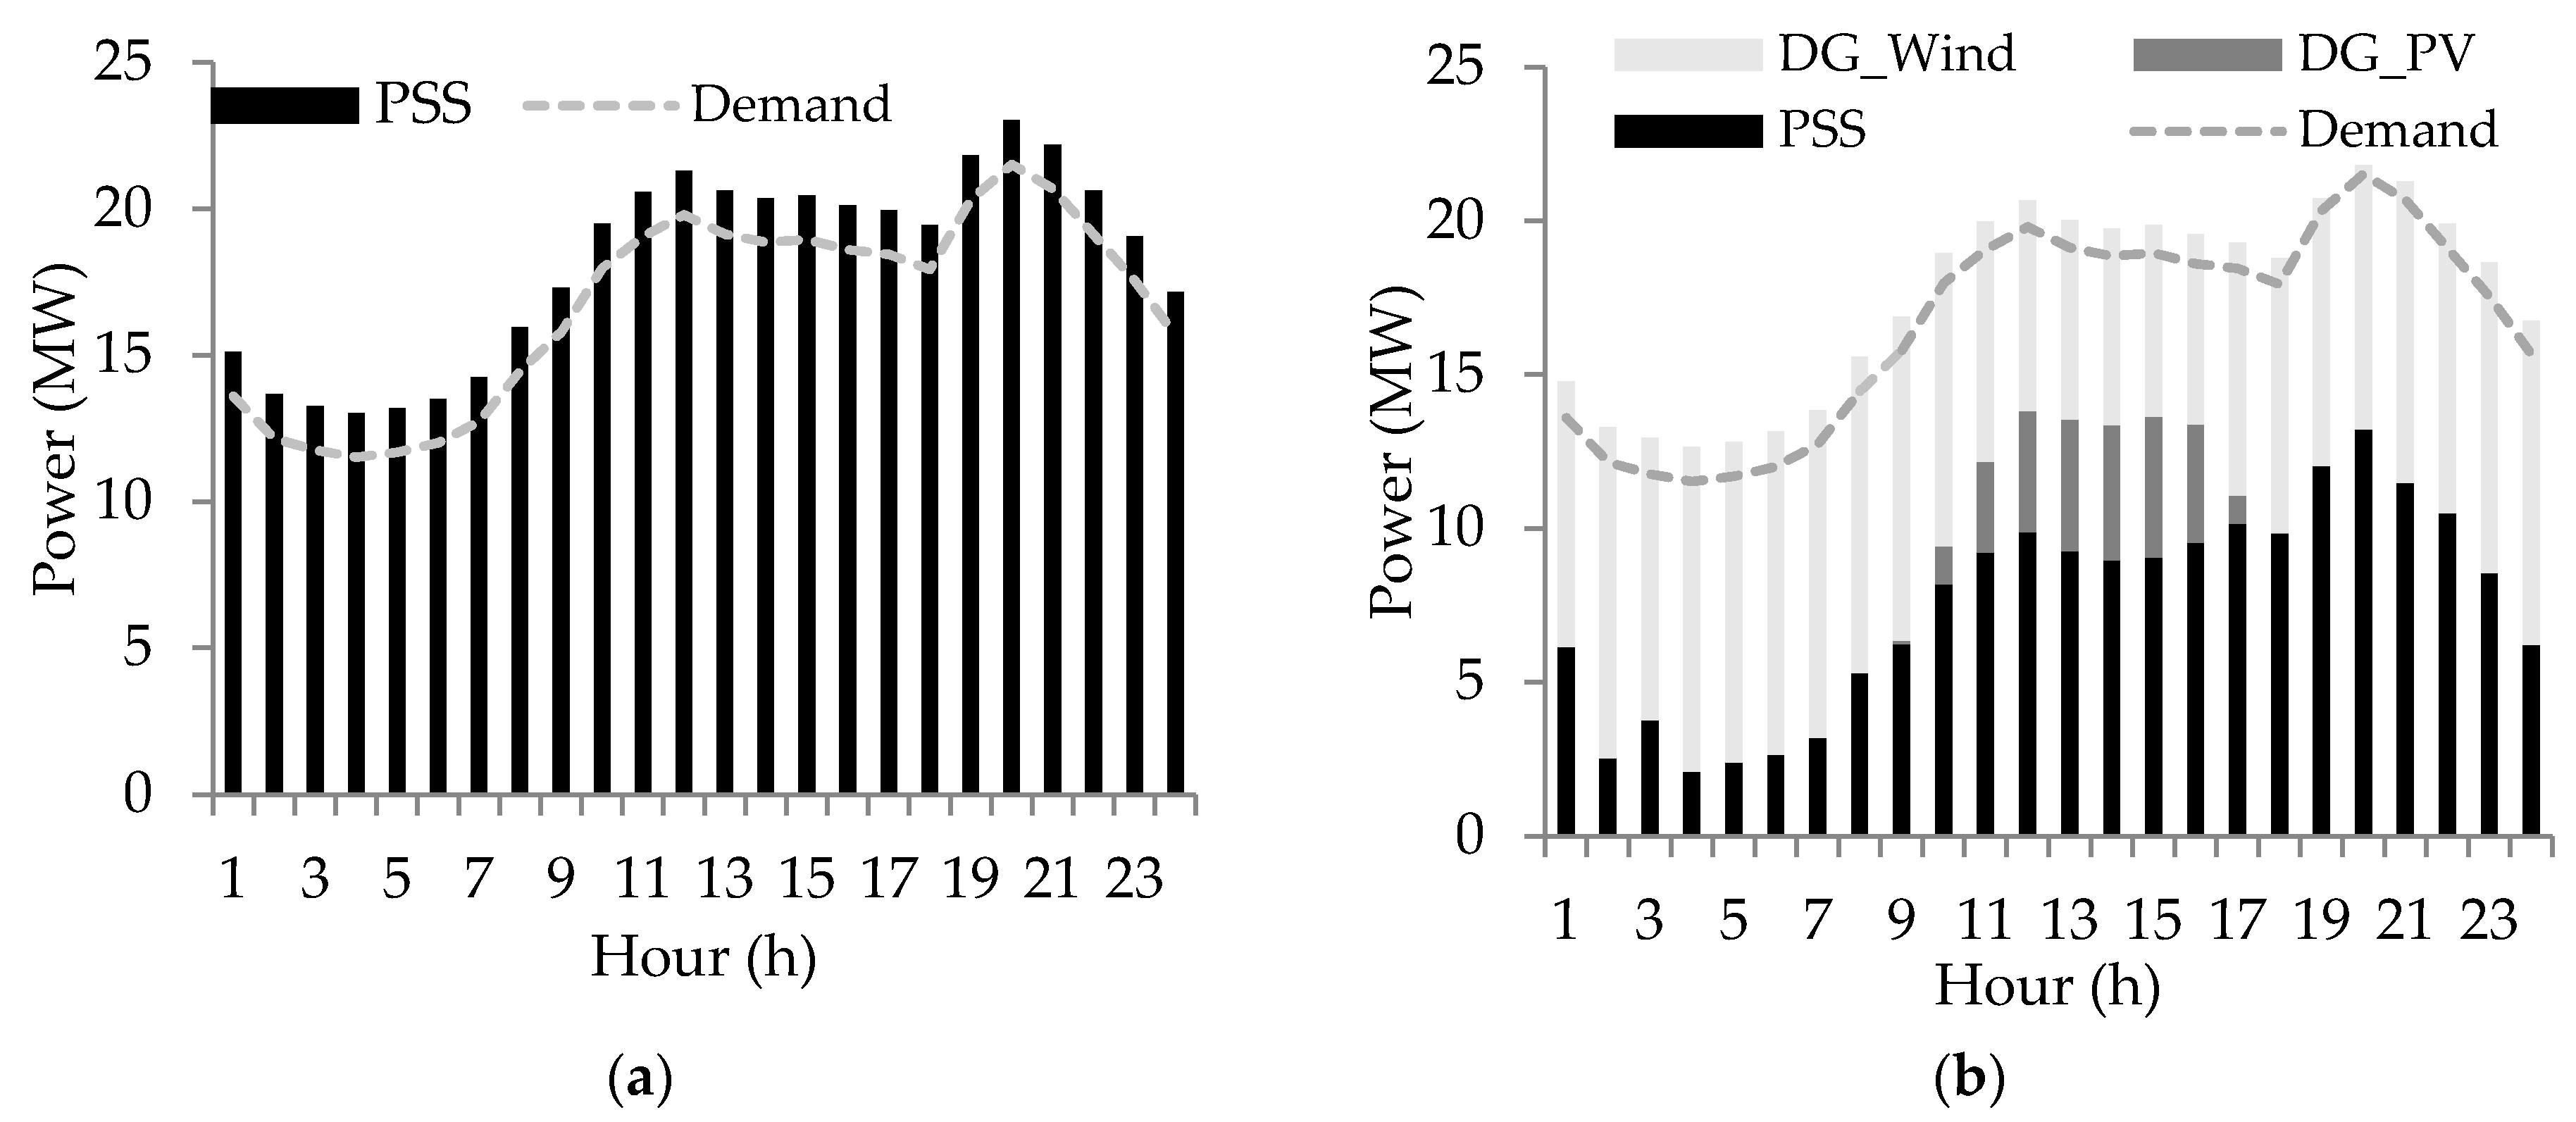
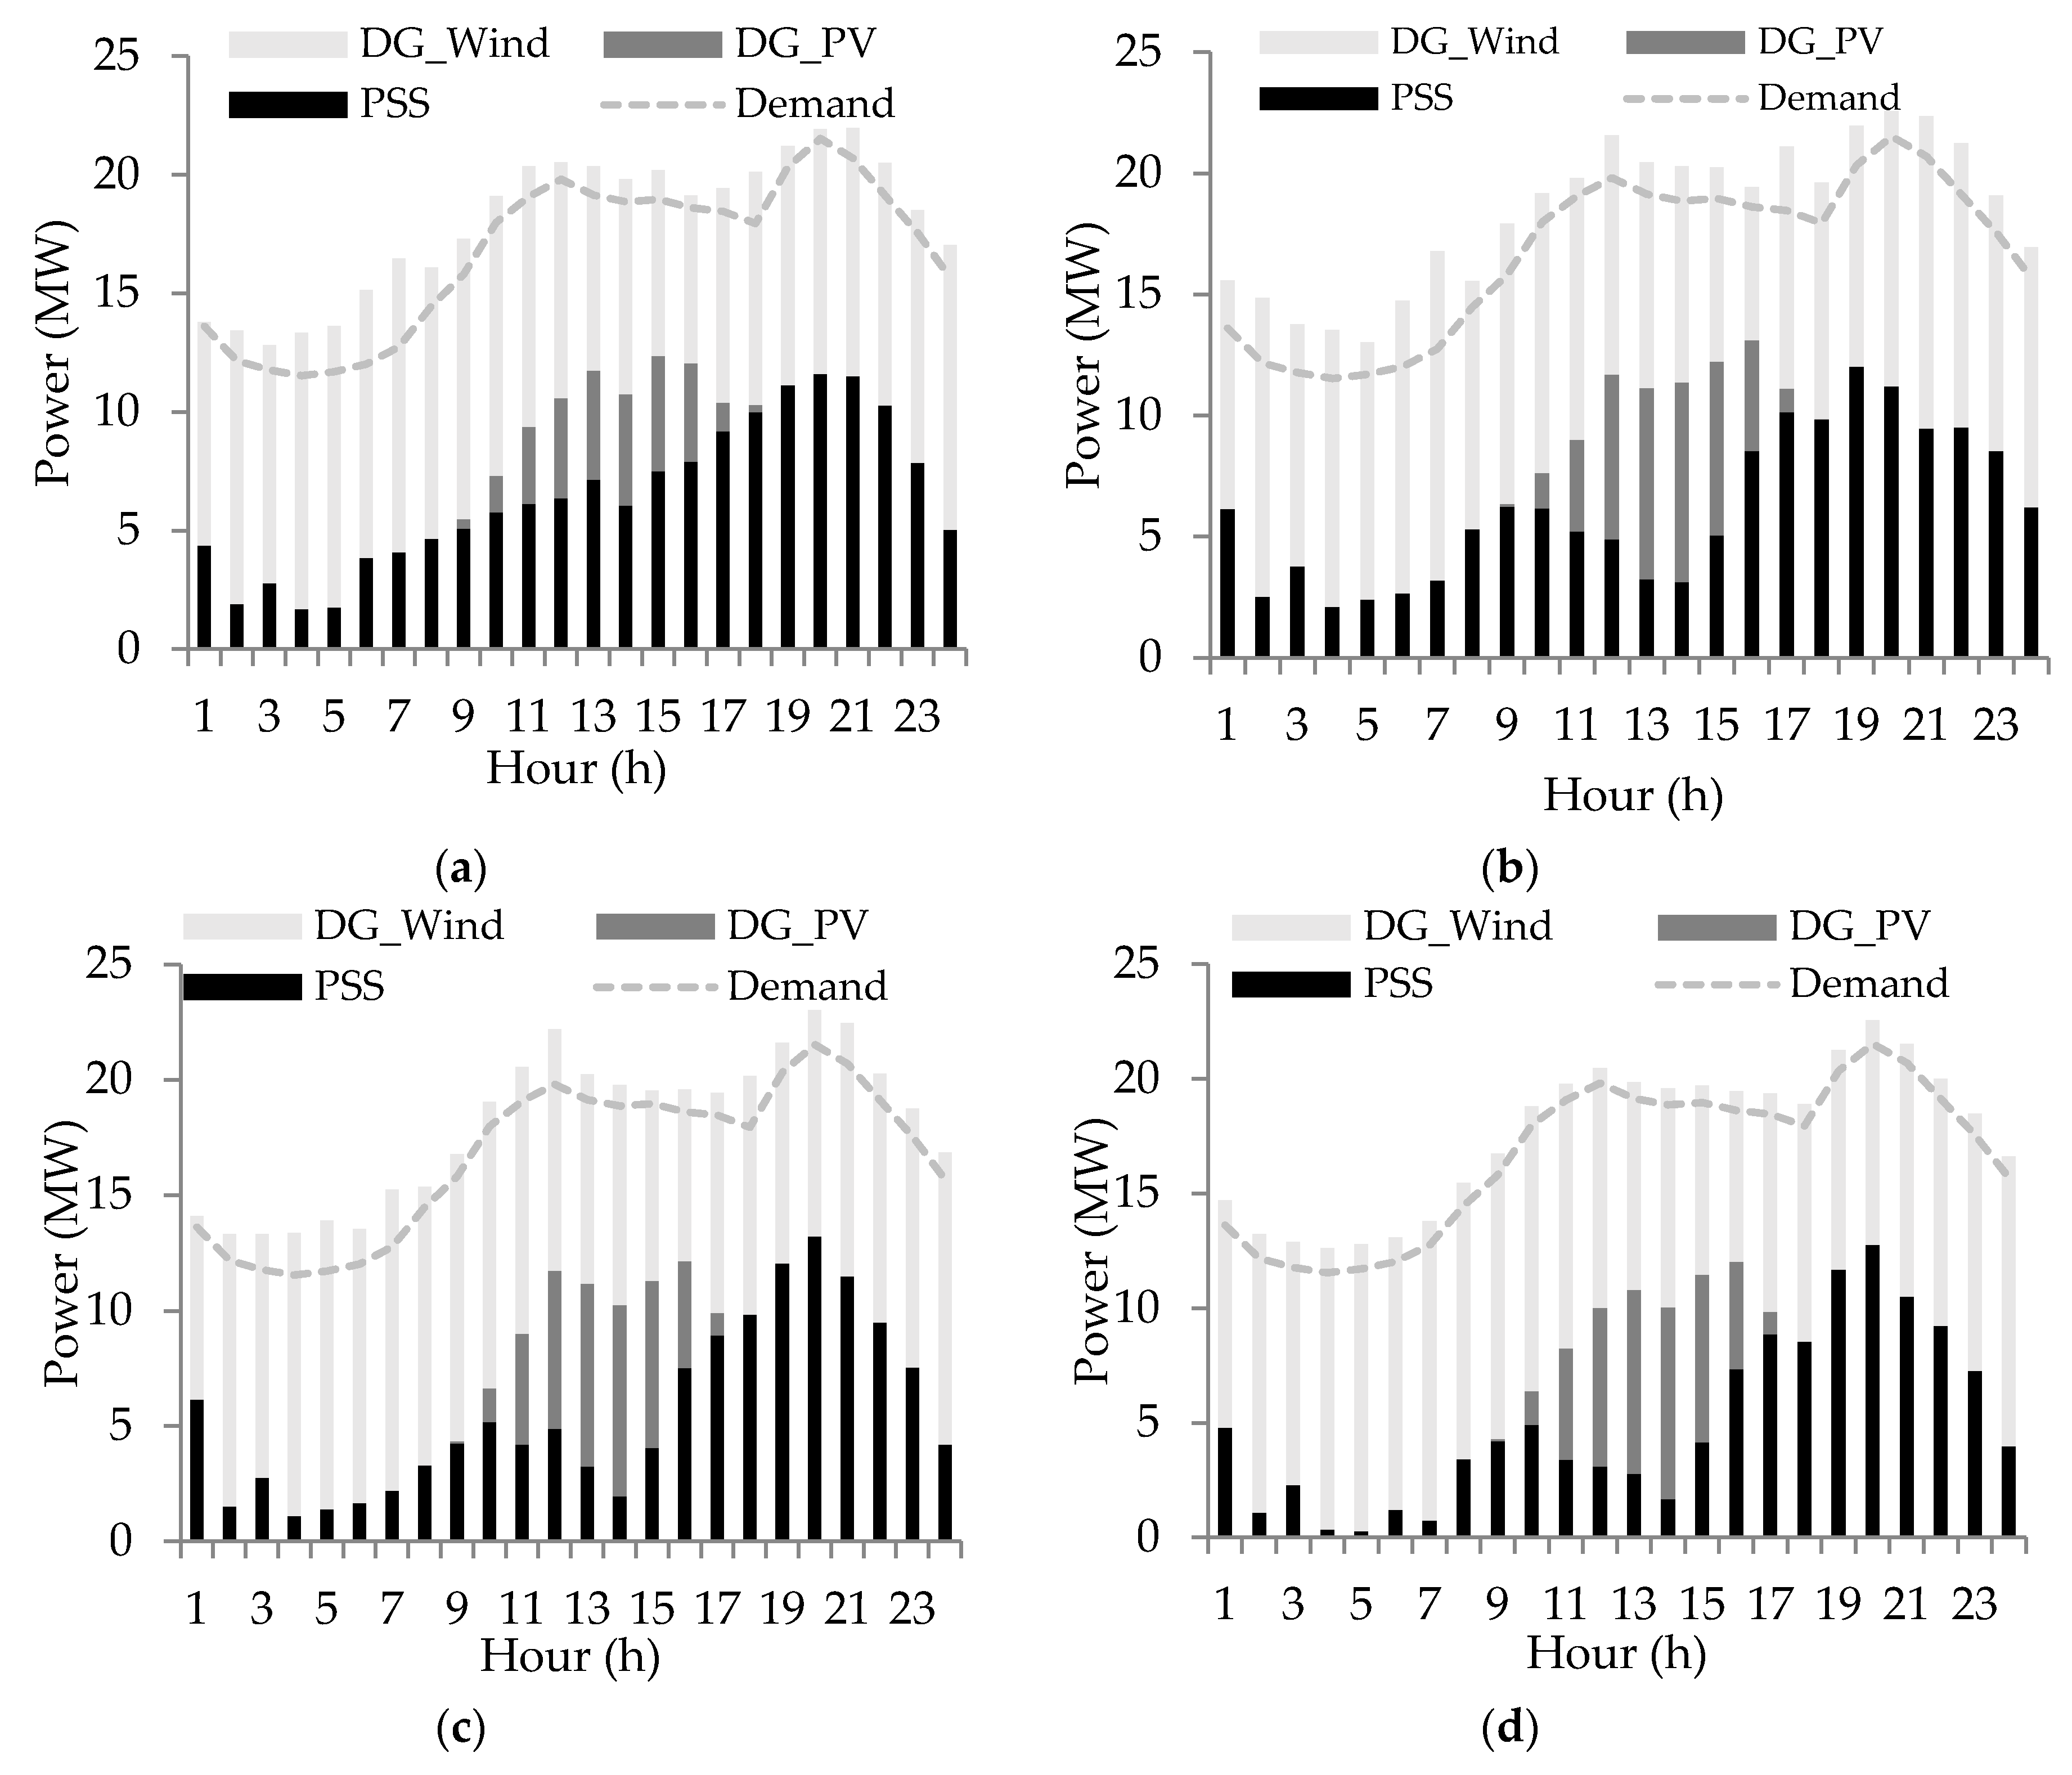
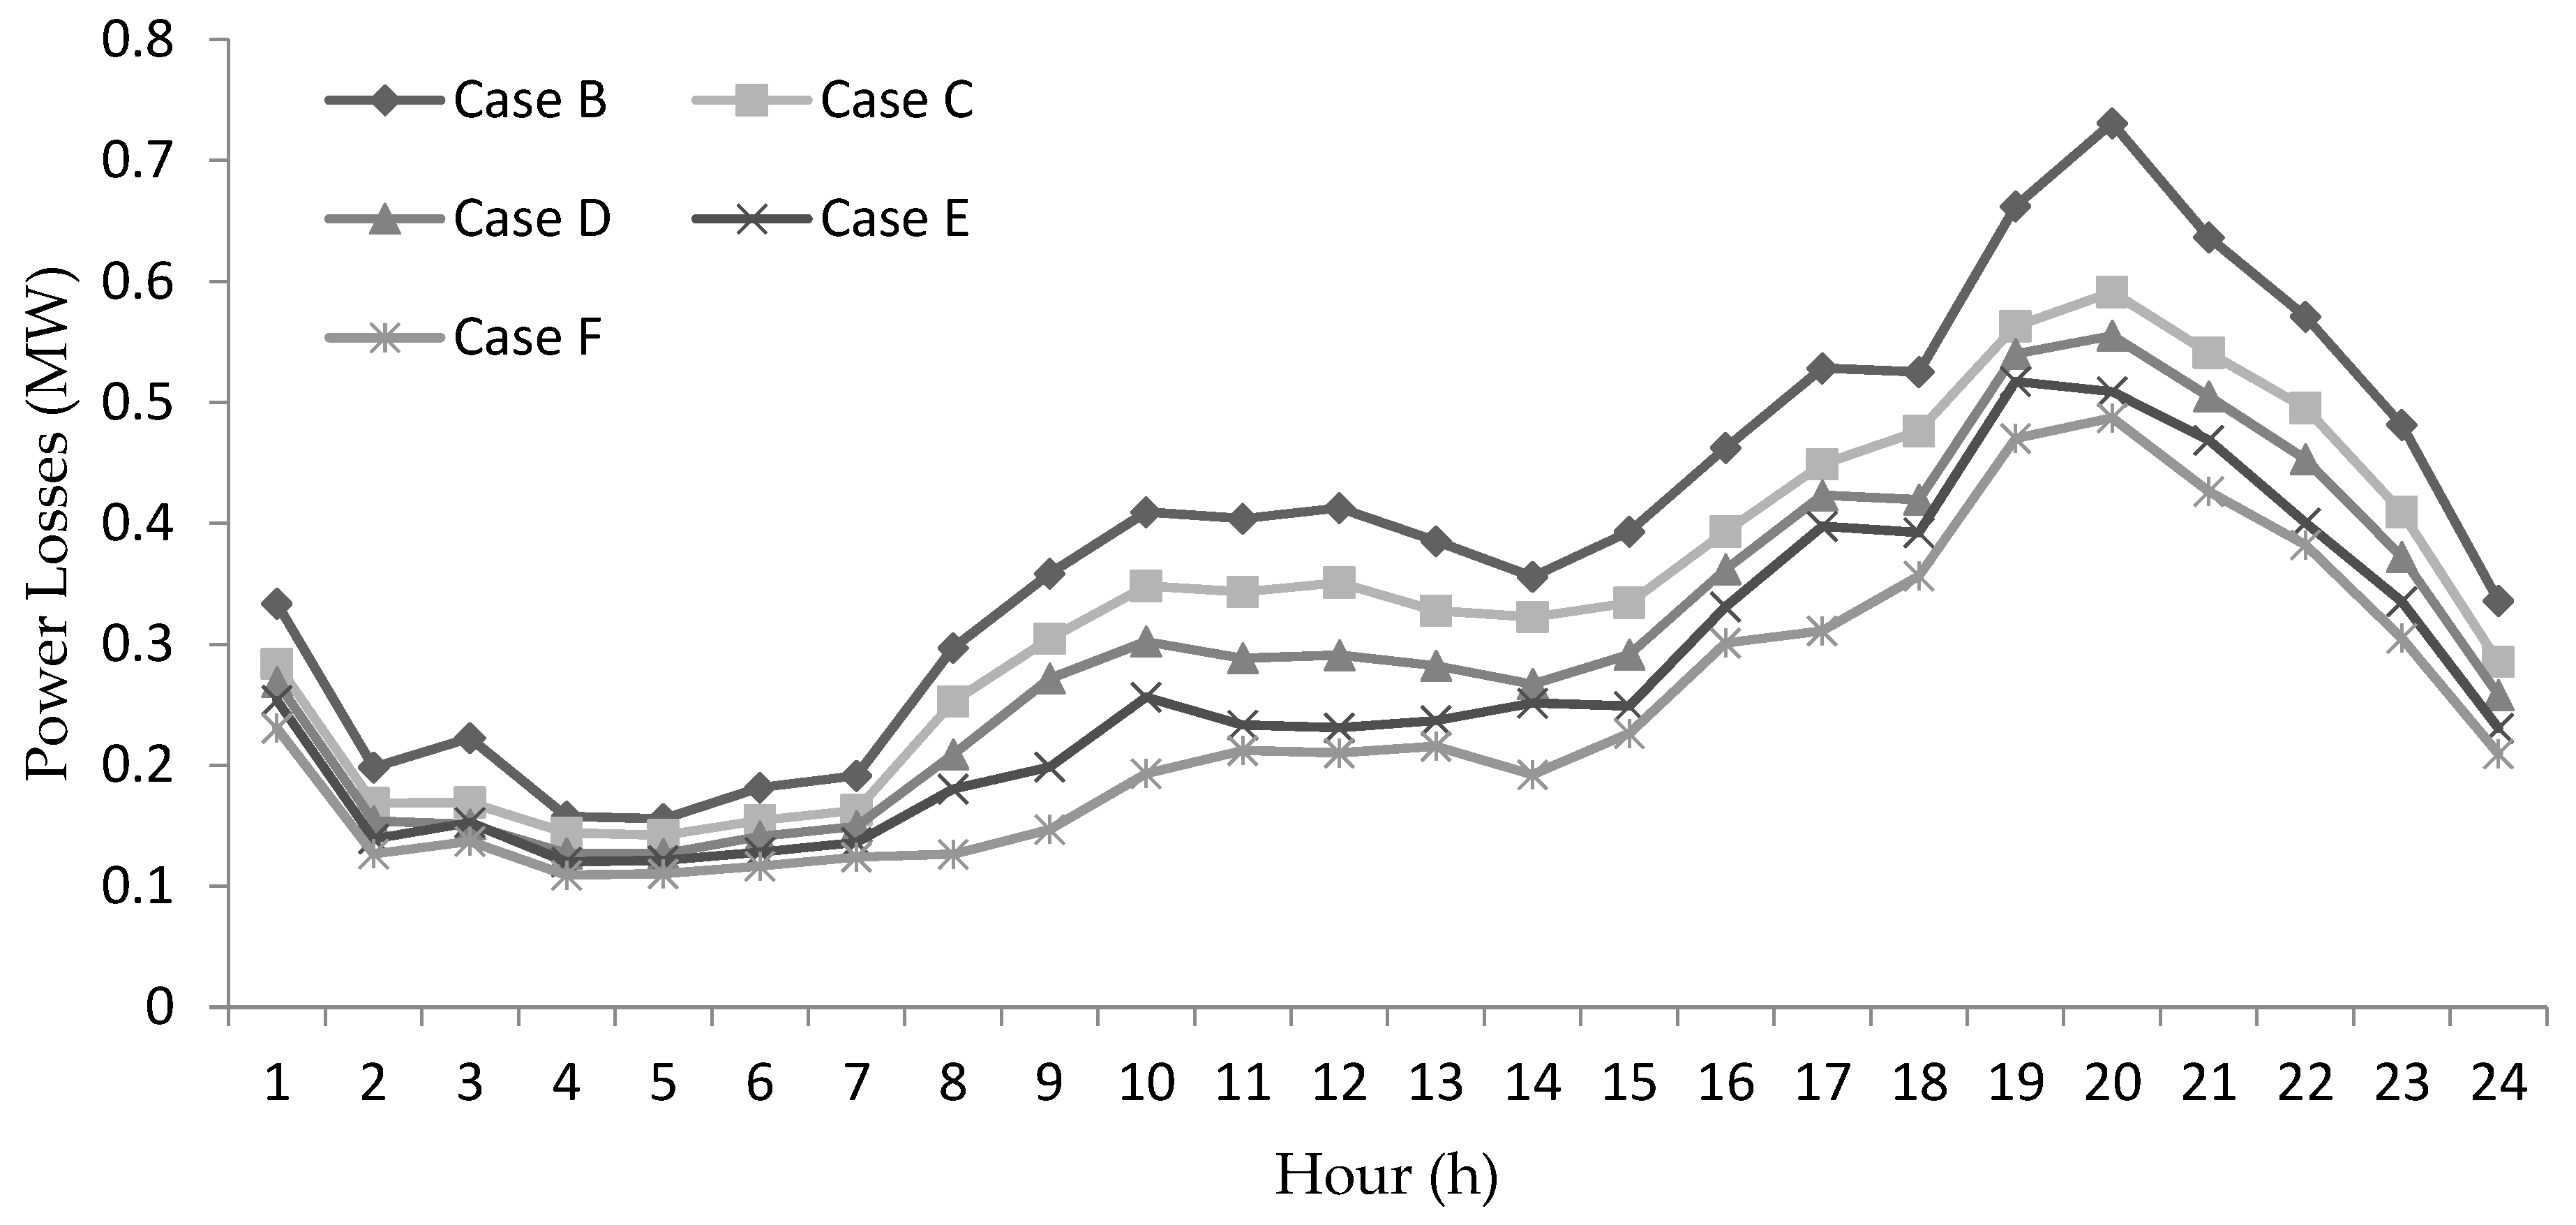
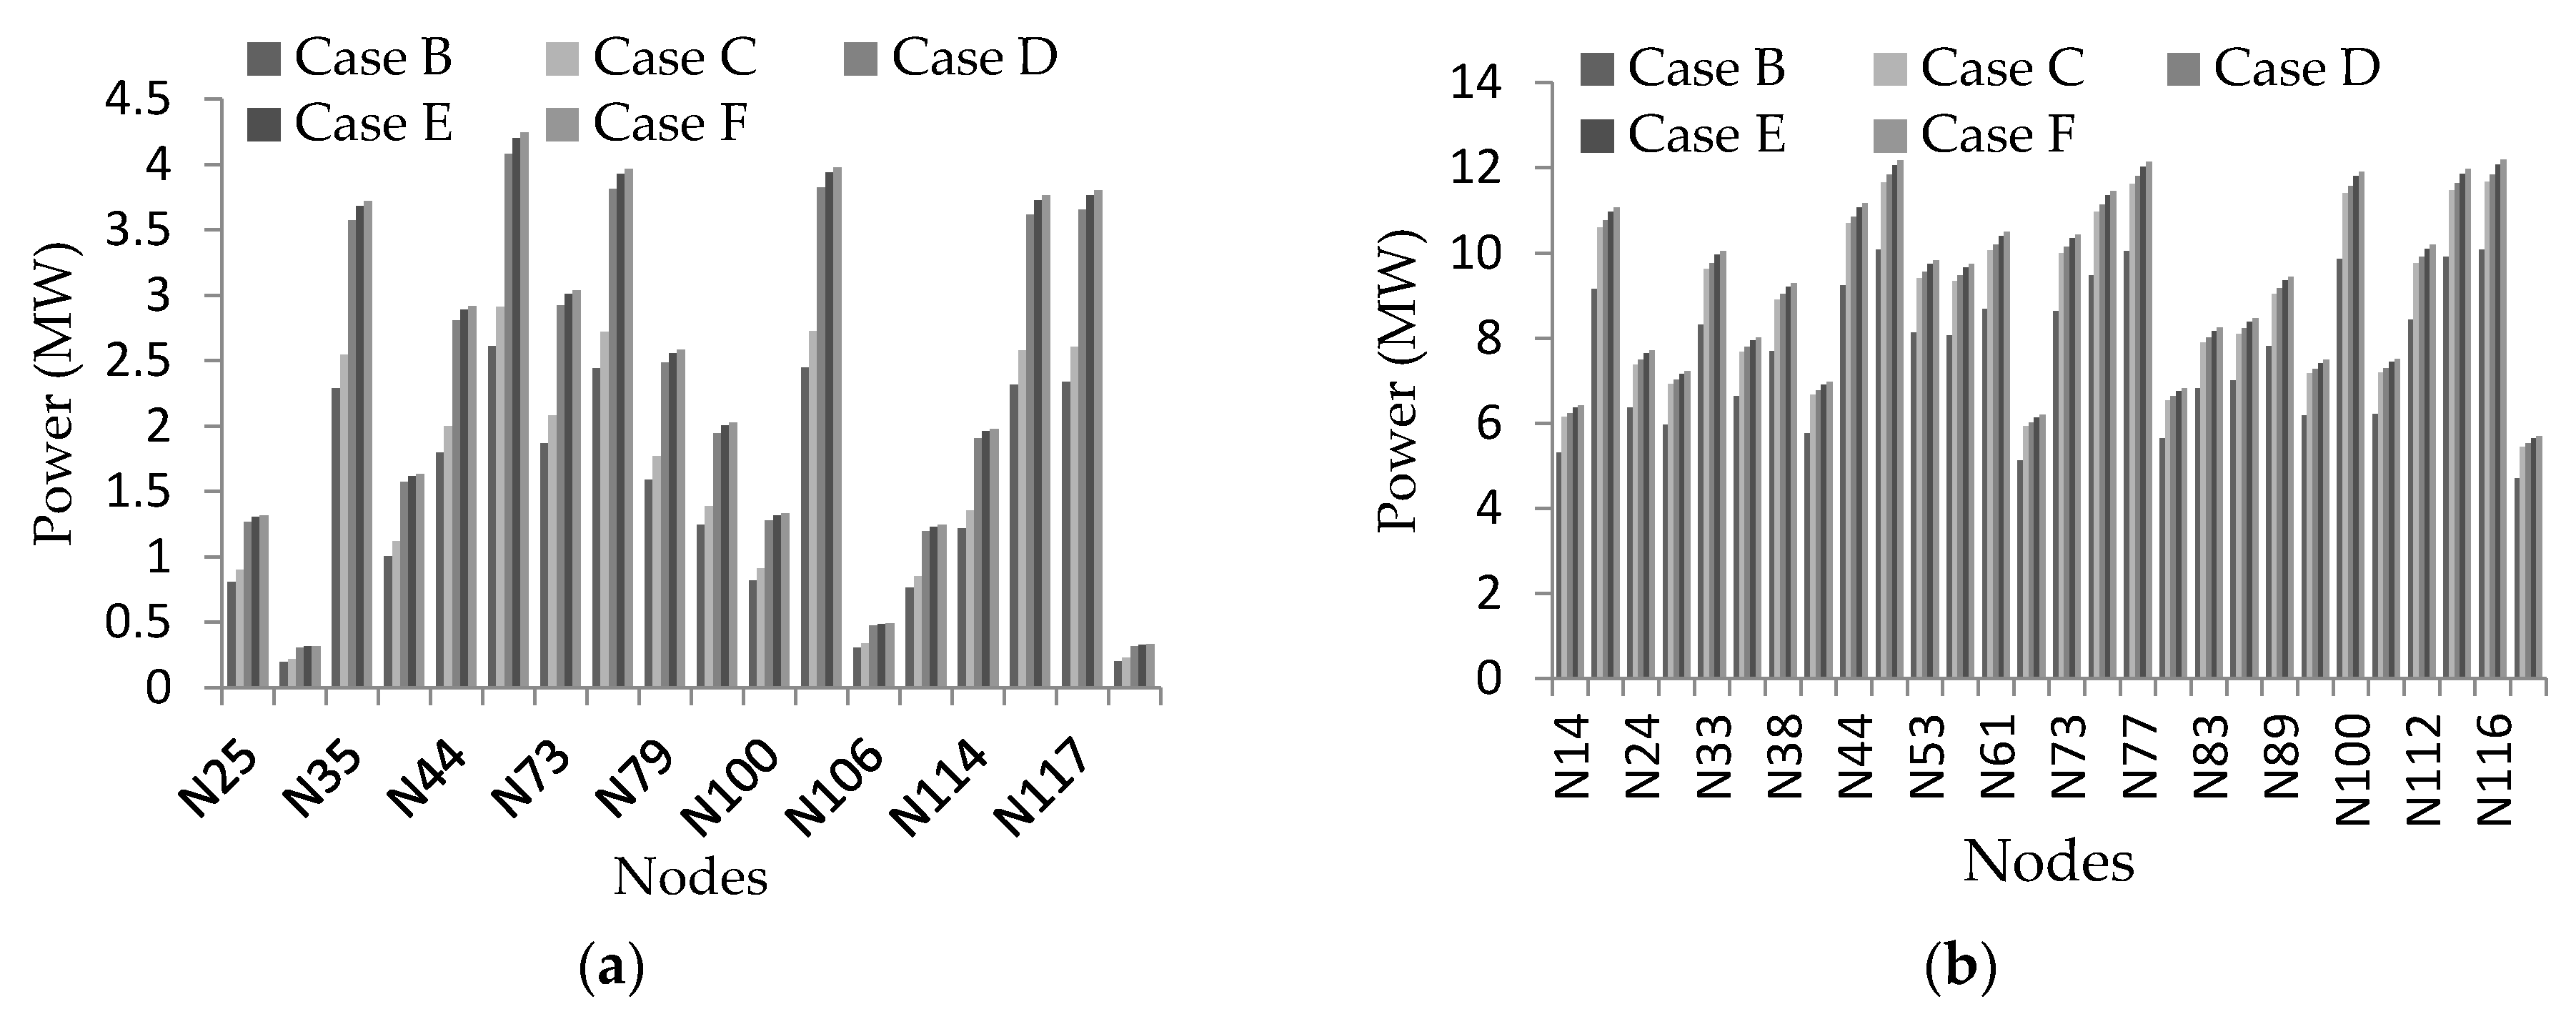
3.2. Numerical Results
4. Conclusions
Author Contributions
Funding
Conflicts of Interest
Appendix A

| Sets/Indices | Definitions | Sets/Indices | Definitions |
| Index/set of buses | Index/set of hourly snapshots | ||
| Index/set of generators/vRES | Index/set of scenarios | ||
| Index/set of branches | Index/set of substations | ||
| Parameters | Definitions | Parameters | Definitions |
| Emission rates of vRES and energy purchased, respectively (tCO2e/MWh) | Number of buses and substations, respectively | ||
| Conductance, susceptance, and flow limit of branch k ( | Nominal voltage (kV) | ||
| Big-M parameters associated with active and reactive power flows through branch k | Impedances of branch i-j ( | ||
| Operation cost of unit energy production by vRES (€/MWh) | Price of emissions (€/tons of CO2 equivalent) | ||
| Big-M parameters associated with active and reactive power flows through branch k | Price of electricity purchased upstream (€/MWh) | ||
| Operation cost of unit energy production by vRES (€/MWh) | Probability of hourly scenario s and weight (in hours) of hourly snapshot group h | ||
| Penalty for active and reactive unserved power, respectively (€/MW, €/MVAr) | Power factor of substation and DGs, respectively | ||
| Total number of linear segments | Slopes of linear segments | ||
| Variables | Definitions | Variables | Definitions |
| Active and reactive power demand at node i (MW, MVAr) | Unserved power at node i (MW) | ||
| Active and reactive power produced by vRESs (MW) | Unserved power at node i (MW) | ||
| Active and reactive power imported from the grid (MW) | Voltage magnitudes at nodes i and j (kV) | ||
| Active and reactive power flows, and voltage angle difference of link k (MW, MVAr, radians) | Utilization variables of existing lines | ||
| Active and reactive power losses (MW, MVAr) | Voltage angles at node i and j (radians) | ||
| Active and reactive power losses at substation (MW, MVAr) | Real-time price of electricity (€/MWh) | ||
| , | Step variables used in the linearization of quadratic flows (MW, MVAr) | ||
| Functions | Definitions | Functions | Definitions |
| Expected cost of energy imported through the substation level | Expected cost of energy produced by vRES | ||
| Expected emission cost due to vRES power production (€) | Expected emission cost of energy imported through the substations (€) | ||
| Total expected costs of supplied energy (€) | Total expected costs of energy not supplied (€) | ||
| Total expected costs of emissions (€) |
Appendix B
References
- Papaefthymiou, G.; Dragoon, K. Towards 100% renewable energy systems: Uncapping power system flexibility. Energy Policy 2016, 92, 69–82. [Google Scholar] [CrossRef]
- International Energy Agency (IEA). Empowering Variable Renewables—Options for Flexible Electricity Systems; OECD: Paris, France, 2008. [Google Scholar]
- Santos, S.F.; Fitiwi, D.Z.; Cruz, M.R.M.; Cabrita, C.M.P.; Catalão, J.P.S. Impacts of optimal energy storage deployment and network reconfiguration on renewable integration level in distribution systems. Appl. Energy 2017, 185, 44–55. [Google Scholar] [CrossRef]
- Brouwer, A.S.; van den Broek, M.; Seebregts, A.; Faaij, A. Impacts of large-scale Intermittent Renewable Energy Sources on electricity systems, and how these can be modeled. Renew. Sustain. Energy Rev. 2014, 33, 443–466. [Google Scholar] [CrossRef]
- Ceaki, O.; Vatu, R.; Mancasi, M.; Porumb, R.; Seritan, G. Analysis of Electromagnetic Disturbances for Grid-Connected PV Plants. In Proceedings of the 2015 MEPS—International Conference Modern Electric Power Systems, Wroclaw, Poland, 6–9 July 2015. [Google Scholar]
- Ceaki, O.; Vatu, R.; Golovanov, N.; Porumb, R.; Seritan, G. Analysis of the grid-connected PV plants behavior with FACTS influence. In Proceedings of the 49th International Universities Power Engineering Conference (UPEC), Cluj-Napoca, Romania, 2–5 September 2014. [Google Scholar]
- Panagiotis, K.; Lambros, E. Electricity Distribution; Springer: New York, NY, USA, 2016. [Google Scholar]
- Hossain, M.S.; Madlool, N.A.; Rahim, N.A.; Selvaraj, J.; Pandey, A.K.; Khan, A.F. Role of smart grid in renewable energy: An overview. Renew. Sustain. Energy Rev. 2016, 60, 1168–1184. [Google Scholar] [CrossRef]
- Schachter, J.A.; Mancarella, P. A critical review of Real Options thinking for valuing investment flexibility in Smart Grids and low carbon energy systems. Renew. Sustain. Energy Rev. 2016, 56, 261–271. [Google Scholar] [CrossRef]
- Yenginer, H.; Cetiz, C.; Dursun, E. A review of energy management systems for smart grids. In Proceedings of the 2015 3rd International Istanbul, Smart Grid Congress and Fair (ICSG), Istanbul, Turkey, 29–30 April 2015; pp. 1–4. [Google Scholar]
- Kulkarni, S.N.; Shingare, P. A review on Smart Grid Architecture and Implementation Challenges. In Proceedings of the 2016 International Conference on Electrical, Electronics, and Optimization Techniques (ICEEOT), Chennai, India, 3–5 March 2016. [Google Scholar]
- Zhou, X.; Cui, H.; Ma, Y.; Gao, Z. Research review on smart distribution grid. In Proceedings of the 2016 IEEE International Conference on Mechatronics and Automation (ICMA), Harbin, China, 7–10 August 2016; pp. 575–580. [Google Scholar]
- Udgave, A.D.; Jadhav, H.T. A review on Distribution Network protection with penetration of Distributed Generation. In Proceedings of the 2015 IEEE 9th International Conference on Intelligent Systems and Control (ISCO), Coimbatore, India, 9–10 January 2015; pp. 1–4. [Google Scholar]
- Bhimarasetti, R.T.; Kumar, A. A New Contribution to Distribution Load Flow Analysis for Radial and Mesh Distribution Systems. In Proceedings of the 2014 International Conference on Computational Intelligence and Communication Networks, Bhopal, India, 14–16 November 2014; pp. 1229–1236. [Google Scholar]
- Arritt, R.F.; Dugan, R.C. Review of the Impacts of Distributed Generation on Distribution Protection. In Proceedings of the 2015 IEEE Rural Electric Power Conference, Asheville, NC, USA, 19–21 April 2015; pp. 69–74. [Google Scholar]
- Tiwari, A.K.; Mohanty, S.R.; Singh, R.K. Review on protection issues with penetration of distributed generation in distribution system. In Proceedings of the 2014 International Electrical Engineering Congress (iEECON), Chonburi, Thailand, 19–21 March 2014; pp. 1–4. [Google Scholar]
- Celli, G.; Pilo, F.; Pisano, G.; Cicoria, R.; Iaria, A. Meshed vs. radial MV distribution network in presence of large amount of DG. In Proceedings of the IEEE PES Power Systems Conference and Exposition, New York, NY, USA, 10–13 October 2004; pp. 1357–1362. [Google Scholar]
- Yu, P.; Venkatesh, B.; Yazdani, A.; Singh, B.N. Optimal Location and Sizing of Fault Current Limiters in Mesh Networks Using Iterative Mixed Integer Nonlinear Programming. IEEE Trans. Power Syst. 2016, 31, 4776–4783. [Google Scholar] [CrossRef]
- Zubo, R.H.A.; Mokryani, G.; Rajamani, H.-S.; Aghaei, J.; Niknam, T.; Pillai, P. Operation and planning of distribution networks with integration of renewable distributed generators considering uncertainties: A review. Renew. Sustain. Energy Rev. 2017, 72, 1177–1198. [Google Scholar] [CrossRef]
- Alvarez-Herault, M.-C.; N’Doye, N.; Gandioli, C.; Hadjsaid, N.; Tixador, P. Meshed distribution network vs reinforcement to increase the distributed generation connection. Sustain. Energy Grids Netw. 2015, 1, 20–27. [Google Scholar] [CrossRef]
- Davoudi, M.; Cecchi, V.; Agüero, J.R. Increasing penetration of distributed generation with meshed operation of distribution systems. In Proceedings of the North American Power Symposium (NAPS), Pullman, WA, USA, 7–9 September 2014; pp. 1–6. [Google Scholar]
- Chalapathi, B.; Agrawal, D.; Murty, V.; Kumar, A. Optimal placement of Distribution Generation in weakly meshed Distribution Network for energy efficient operation. In Proceedings of the 2015 Conference on Power, Control, Communication and Computational Technologies for Sustainable Growth (PCCCTSG), Kurnool, India, 11–12 December 2015; pp. 150–155. [Google Scholar]
- Ivic, D.; Macanovic, D.; Sosic, D.; Stefanov, P. Weakly meshed distribution networks with distributed generation—Power flow analysis using improved impedance matrix based algorithm. In Proceedings of the International Symposium on Industrial Electronics (INDEL), Banja Luka, Bosnia Herzegovina, 3–5 November 2016; pp. 1–6. [Google Scholar]
- Yang, H.; Bae, T.; Kim, J.; Kim, Y.H. Load model technique for mesh-structured power distribution network. In Proceedings of the 2012 4th Asia Symposium on Quality Electronic Design (ASQED), Penang, Malaysia, 10–11 July 2012; pp. 219–222. [Google Scholar]
- Yu, L.; Czarkowski, D.; de León, F.; Bury, W. A time sequence load-flow method for steady-state analysis in heavily meshed distribution network with DG. In Proceedings of the 2013 8th International Conference on Compatibility and Power Electronics (CPE), Ljubljana, Slovenia, 5–7 June 2013; pp. 25–30. [Google Scholar]
- Fitiwi, D.Z.; Olmos, L.; Rivier, M.; de Cuadra, F.; Pérez-Arriaga, I.J. Finding a representative network losses model for large-scale transmission expansion planning with renewable energy sources. Energy 2016, 101, 343–358. [Google Scholar] [CrossRef]
- Zhang, H.; Heydt, G.T.; Vittal, V.; Quintero, J. An Improved Network Model for Transmission Expansion Planning Considering Reactive Power and Network Losses. IEEE Trans. Power Syst. 2013, 28, 3471–3479. [Google Scholar] [CrossRef]


| Parameter Description | Parameter Setting |
|---|---|
| Nominal voltage | 11 kV |
| Active power demand | 22,709.720 kW |
| Reactive power demand | 17,041.068 kVAr |
| Base case system losses | 1298.090 kW |
| Minimum voltage of the base case system (which occurs at bus 116) | 0.8783 p.u. |
| Bus | Wind (MW) | PV (MW) |
|---|---|---|
| 14 | 1 | 0 |
| 21 | 1 | 0 |
| 24 | 1 | 0 |
| 25 | 0 | 1 |
| 29 | 0 | 1 |
| 32 | 1 | 0 |
| 33 | 1 | 0 |
| 35 | 0 | 1 |
| 37 | 1 | 0 |
| 38 | 1 | 0 |
| 42 | 1 | 0 |
| 43 | 0 | 1 |
| 44 | 1 | 1 |
| 52 | 1 | 1 |
| 53 | 1 | 0 |
| 56 | 1 | 0 |
| 61 | 1 | 0 |
| 69 | 1 | 0 |
| 73 | 1 | 1 |
| 74 | 1 | 0 |
| 77 | 1 | 1 |
| 79 | 0 | 1 |
| 82 | 1 | 0 |
| 83 | 1 | 0 |
| 84 | 0 | 1 |
| 85 | 1 | 0 |
| 89 | 1 | 0 |
| 96 | 1 | 0 |
| 100 | 1 | 1 |
| 101 | 0 | 1 |
| 106 | 0 | 1 |
| 108 | 1 | 0 |
| 112 | 1 | 1 |
| 114 | 1 | 1 |
| 116 | 1 | 1 |
| 117 | 0 | 1 |
| 119 | 0 | 1 |
| 121 | 1 | 0 |
| Parameter | Setting |
|---|---|
| 0.8 | |
| 0.95 | |
| 0.4 | |
| 15 | |
| 3000 | |
| 3000 MVAr | |
| , | 20 |
| DG Type | Emission Rates of DGs | |
|---|---|---|
| Solar | 40 | 0.0584 |
| Wind | 20 | 0.0276 |
| Feeders | Maximum Transfer Capacity (A) |
|---|---|
| {(1, 2); (2, 4); (1, 66); (66, 67)} | 1200 |
| {(4, 5); (5, 6); (6, 7); (4, 29); (29, 30); (30, 31); (67, 68); (67, 81); (81, 82); (1, 105); (105, 106); (106, 107)} | 800 |
| Remaining feeders | 400 |
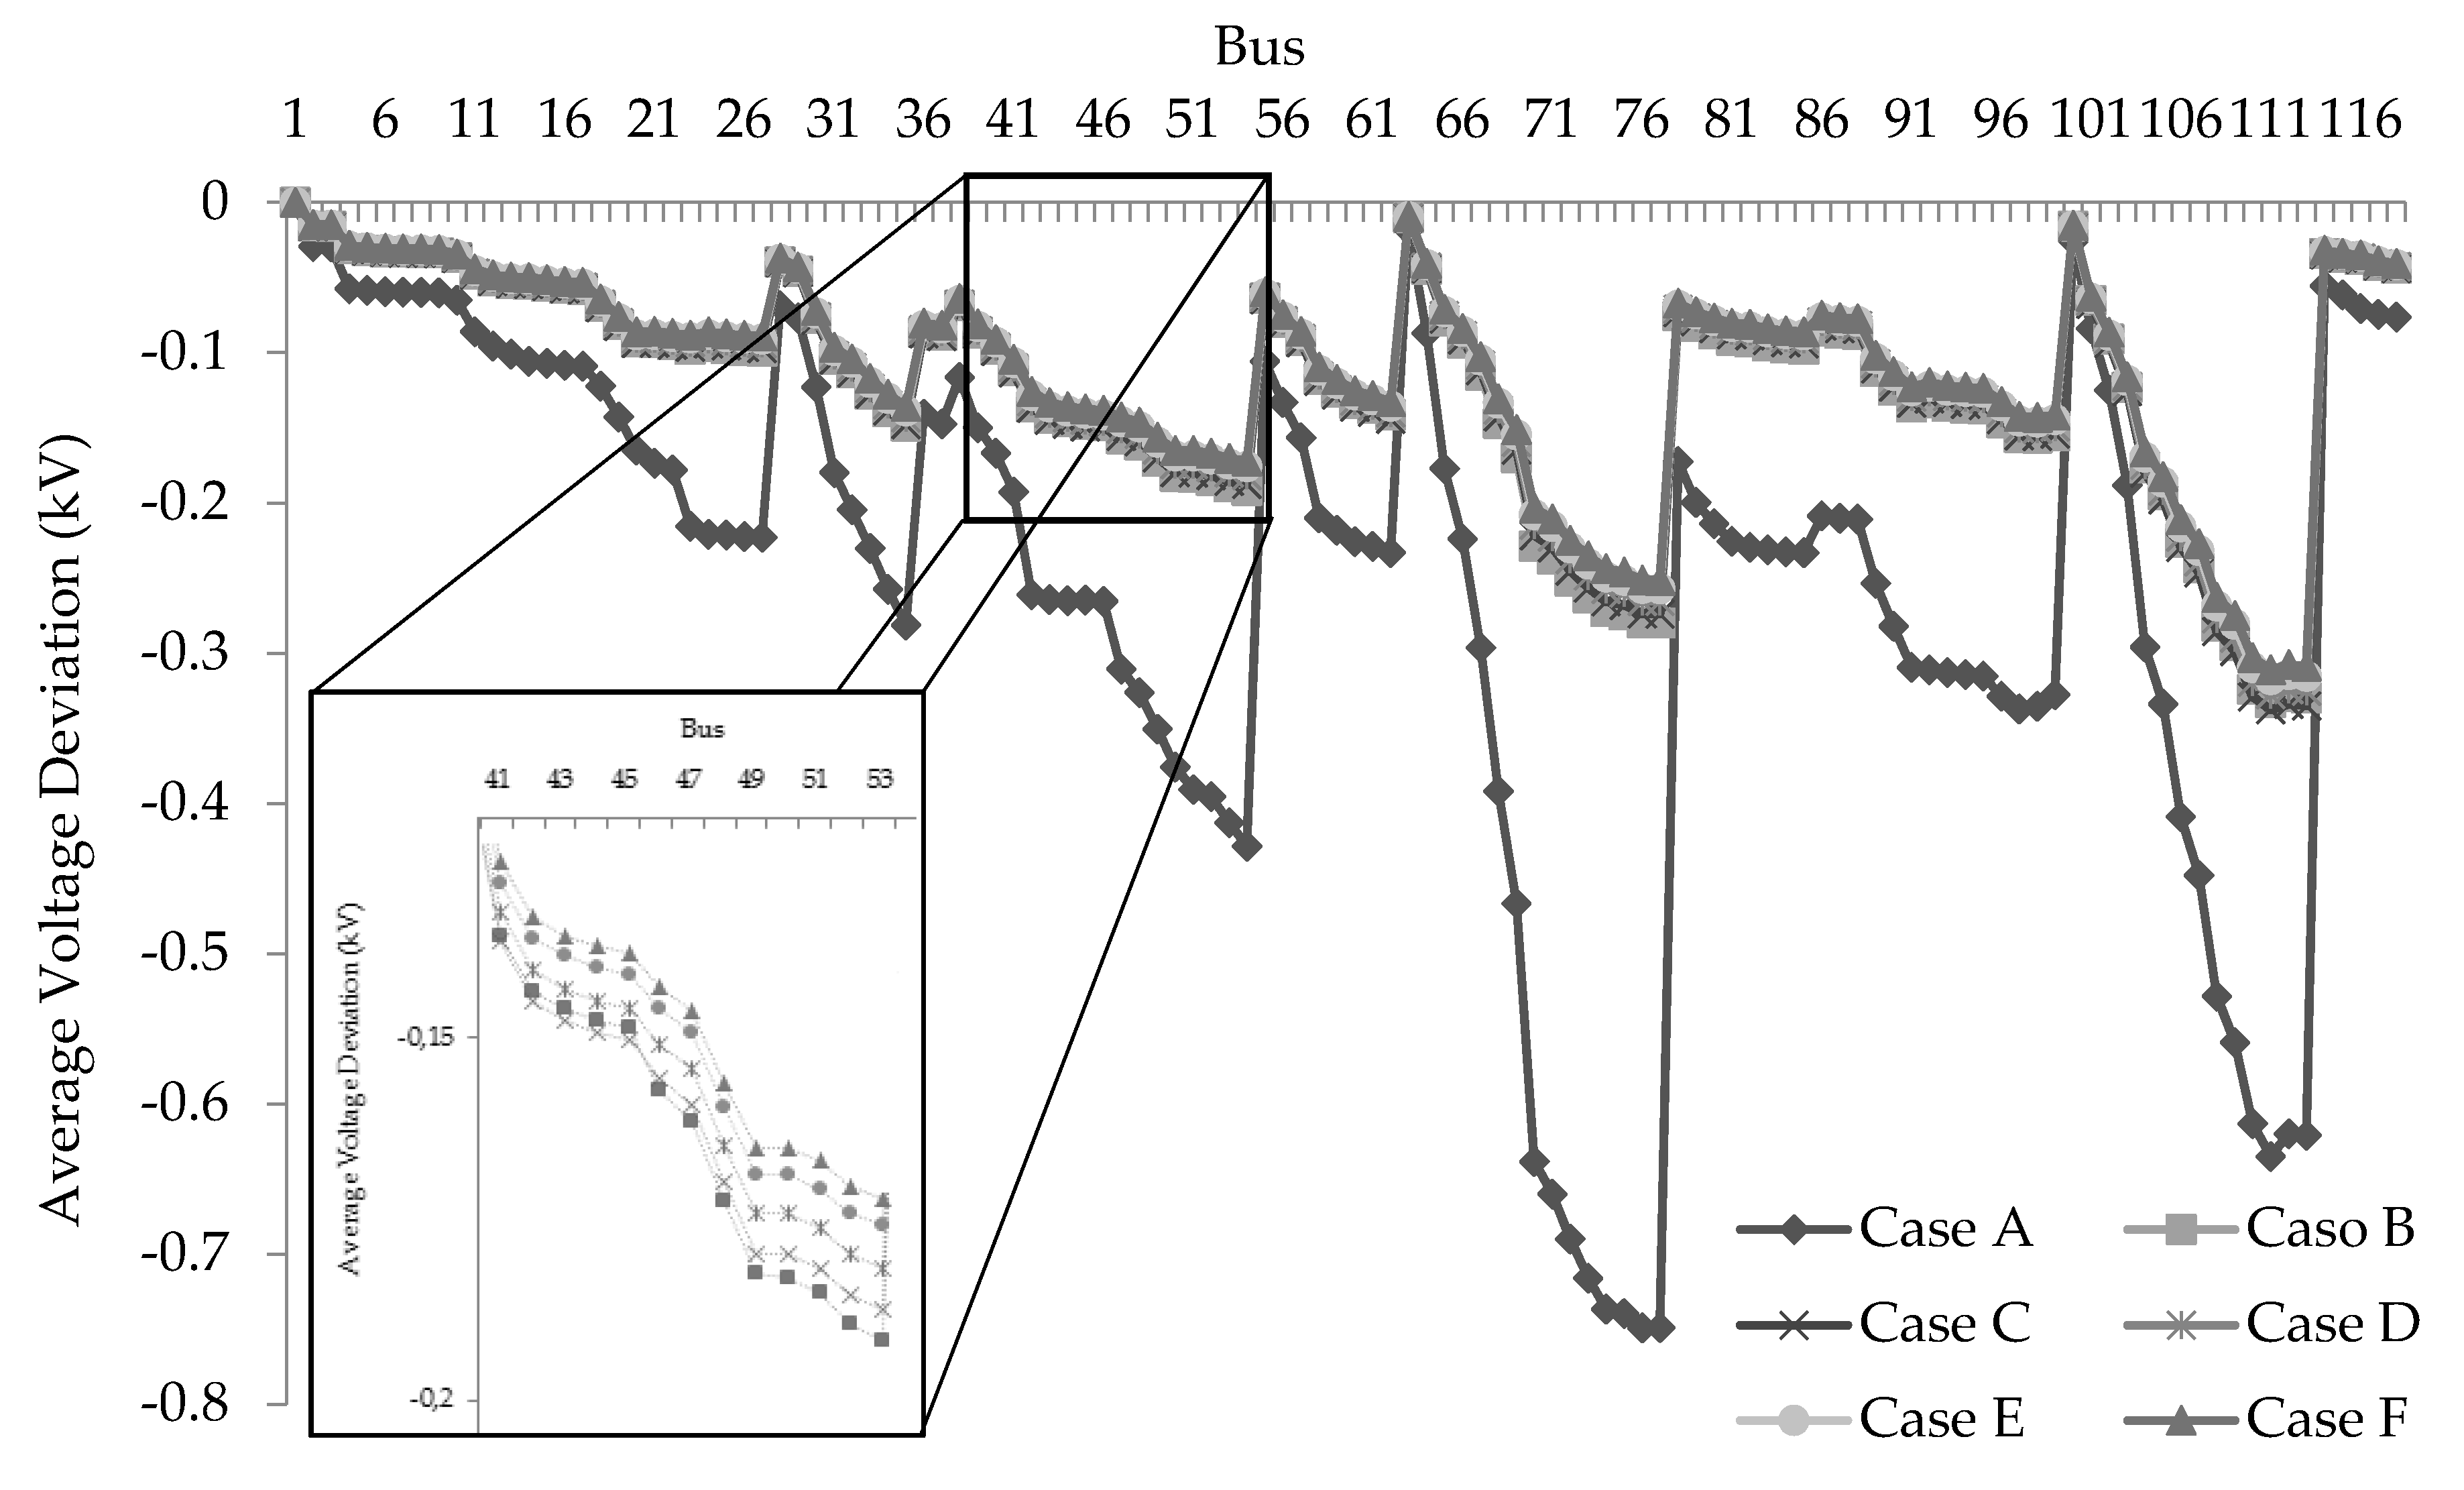
| Case A | Case B | Case C | Case D | Case E | Case F | |
|---|---|---|---|---|---|---|
| Total Cost (€) | 32,217.38 | 27,215.55 | 24,634.12 | 18,458.99 | 16,937.63 | 15,664.99 |
| Energy Cost (€) | 30,349.82 | 26,629.07 | 24,103.04 | 17,979.25 | 16,501.48 | 15,265.23 |
| Emission Cost (€) | 1219.56 | 557.47 | 513.63 | 472.96 | 436.15 | 399.76 |
| PNS Cost (€) | 647.99 | 29.01 | 17.45 | 6.78 | 0.00 | 0.00 |
| Power Loss (MW) | 20.25 | 9.39 | 8.01 | 7.21 | 6.47 | 5.73 |
| Power Loss (MVar) | 14.11 | 6.13 | 4.67 | 3.97 | 3.24 | 2.49 |
© 2018 by the authors. Licensee MDPI, Basel, Switzerland. This article is an open access article distributed under the terms and conditions of the Creative Commons Attribution (CC BY) license (http://creativecommons.org/licenses/by/4.0/).
Share and Cite
Cruz, M.R.M.; Fitiwi, D.Z.; Santos, S.F.; Mariano, S.J.P.S.; Catalão, J.P.S. Prospects of a Meshed Electrical Distribution System Featuring Large-Scale Variable Renewable Power. Energies 2018, 11, 3399. https://doi.org/10.3390/en11123399
Cruz MRM, Fitiwi DZ, Santos SF, Mariano SJPS, Catalão JPS. Prospects of a Meshed Electrical Distribution System Featuring Large-Scale Variable Renewable Power. Energies. 2018; 11(12):3399. https://doi.org/10.3390/en11123399
Chicago/Turabian StyleCruz, Marco R. M., Desta Z. Fitiwi, Sérgio F. Santos, Sílvio J. P. S. Mariano, and João P. S. Catalão. 2018. "Prospects of a Meshed Electrical Distribution System Featuring Large-Scale Variable Renewable Power" Energies 11, no. 12: 3399. https://doi.org/10.3390/en11123399
APA StyleCruz, M. R. M., Fitiwi, D. Z., Santos, S. F., Mariano, S. J. P. S., & Catalão, J. P. S. (2018). Prospects of a Meshed Electrical Distribution System Featuring Large-Scale Variable Renewable Power. Energies, 11(12), 3399. https://doi.org/10.3390/en11123399