Article

Performance Analysis of a RED-MED Salinity Gradient Heat Engine

by
Patricia Palenzuela
1,
Marina Micari
2,3,
Bartolomé Ortega-Delgado
2,
Francesco Giacalone
2,
Guillermo Zaragoza
1,
Diego-César Alarcón-Padilla
1,
Andrea Cipollina
2,*,
Alessandro Tamburini
2 and
Giorgio Micale
2
1
CIEMAT-Plataforma Solar de Almería, Ctra. de Senés s/n, 04200 Tabernas, Almería, Spain
2
DIID—Dipartimento dell’Innovazione Industriale e Digitale—Ingegneria Chimica, Gestionale, Informatica, Meccanica, Università degli Studi di Palermo (UNIPA), viale delle Scienze, Ed. 6, 90128 Palermo, Italy
3
German Aerospace Center (DLR), Institute of Engineering Thermodynamics, Pfaffenwaldring 38-40, 70569 Stuttgart, Germany
*
Author to whom correspondence should be addressed.
Energies 2018, 11(12), 3385; https://doi.org/10.3390/en11123385
Submission received: 5 October 2018 / Revised: 9 November 2018 / Accepted: 20 November 2018 / Published: 3 December 2018
(This article belongs to the Section A: Sustainable Energy)

Abstract

:
A performance analysis of a salinity gradient heat engine (SGP-HE) is presented for the conversion of low temperature heat into power via a closed-loop Reverse Electrodialysis (RED) coupled with Multi-Effect Distillation (MED). Mathematical models for the RED and MED systems have been purposely developed in order to investigate the performance of both processes and have been then coupled to analyze the efficiency of the overall integrated system. The influence of the main operating conditions (i.e., solutions concentration and velocity) has been quantified, looking at the power density and conversion efficiency of the RED unit, MED Specific Thermal Consumption (STC) and at the overall system exergy efficiency. Results show how the membrane properties (i.e., electrical resistance, permselectivity, water and salt permeability) dramatically affect the performance of the RED process. In particular, the power density achievable using membranes with optimized features (ideal membranes) can be more than three times higher than that obtained with current reference ion exchange membranes. On the other hand, MED STC is strongly influenced by the available waste heat temperature, feed salinity and recovery ratio to be achieved. Lowest values of STC below 25 kWh/m3 can be reached at 100 °C and 27 effects. Increasing the feed salinity also increases the STC, while an increase in the recovery ratio is beneficial for the thermal efficiency of the system. For the integrated system, a more complex influence of operating parameters has been found, leading to the identification of some favorable operating conditions in which exergy efficiency close to 7% (1.4% thermal) can be achieved for the case of current membranes, and up to almost 31% (6.6% thermal) assuming ideal membrane properties.

1. Introduction

Most of the industrial plants continuously discharge large amounts of waste heat, which entails an environmental problem and contributes to an increase in energy costs. Several studies have estimated that about 20–70% of industrial energy consumption is discharged as waste heat, and in some cases the energy efficiency can be improved by 10% to as much as 50% by recovering the waste heat [1,2,3,4]. Waste heat is normally defined as the heat dissipated directly into the environment, generally regardless the temperature level and possible use and re-use. Sources of waste heat include hot combustion gases discharged to the atmosphere, heated products existing in industrial processes, and heat transfer from hot equipment surfaces [5].
Two types of heat recovery technologies have been proposed so far: passive and active technologies. Passive technologies are those in which the heat is used directly at the same or lower temperature level (heat exchangers and thermal energy storages). Active technologies transform heat into different form of energy or enhance the temperature grade of the heat and can be categorized in three types: (i) “waste heat to heat” (e.g., mechanical vapor compressors and heat pumps [6]); (ii) “waste heat to cold” (e.g., sorption chiller); (iii) “waste heat to power” which converts heat into electricity (e.g., low-temperature Steam Rankine Cycle (SRC), Organic Rankine Cycle (ORC) and Kalina Cycle (KC) [1,2,7,8,9,10,11,12]). There are also more innovative technologies proposed and tested for the use of low temperature heat [13,14]: thermoelectric generator (TEG), Piezoelectric Generator (PG), Stirling Engine (SE), and Carbon Carrier (CC) cycle.
Among the waste heat to power technologies, Salinity Gradient Power (SGP) is receiving increasing attention. In this case, the recovery of energy is based on the controlled mixing of two solutions at different salinities [15]. Examples are the Reverse Electrodialysis (RED) process and Pressure Retarded Osmosis [16,17,18,19,20]. A promising possibility is represented by the so called “Salinity Gradient Heat Engine (SG-HE)”, which is an implementation of SGP technologies operated in closed-loop for the conversion of low-temperature ( T < 100 °C) heat into energy [21]. In any SG-HE, the two solutions exiting the SGP unit are restored to their initial conditions through a regeneration process, where low-temperature heat is supplied. The SG-HE shows several advantages with respect to other heat engines. A significant advantage consists in the fact that the SG-HEs do not have any environmental risk, since they do not generally make use of hazardous materials or operate at very high temperatures or release pollutants. Moreover, the use of a closed-loop ensures the possibility to use artificial solutions in limited amount, so that the performances can be maximized selecting the most suitable salt (or the combination of salts) and the solvent. In addition, the use of artificial solutions minimizes the fouling phenomena in the membranes. On the other hand, some theoretical calculations have shown that the exergy efficiency of the SG-HE (defined as the ratio between the energetic efficiency and the theoretical Carnot efficiency) can reach high values, depending on the temperature level of the heat source and on the adopted regeneration strategy [21]. The SG-HEs work at the lowest range of temperatures, between 50 °C and 100 °C, characterised by low Carnot efficiencies. Hence, this technology can potentially reach higher exergy efficiencies, as shown in Figure 1.
As mentioned before, salinity gradient heat engines can be based on pressure-retarded osmosis or reverse electrodialysis processes. In the case of pressure retarded osmosis, membranes are ideally permeable only to water, so that the expected transport phenomenon is the water passage through the membrane from the dilute to the concentrate solution [22,23]. Conversely, the RED membranes are ideally permeable only to salt in the form of ions, so that the expected transport phenomenon is the ions passage through the membranes from the concentrate to the dilute solution [24,25]. Besides that, pressure-retarded osmosis generates mechanical energy, while reverse electrodialysis directly generates electricity. The development of a SG-HE based on the RED process is the main focus of the EU-funded project RED-Heat-to-Power [26]. In that project two general regeneration schemes of a closed-loop system have been proposed and discussed: the solvent-extraction and the salt-extraction scheme [21,27,28,29]. The solvent extraction scheme is reported in Figure 2. It combines the RED unit with a solvent extraction process, which restores the two solutions through the partial evaporation of the solvent of the concentrate solution, in order to increase its concentration. In this case a conventional thermally-driven process such as the Multi-Effect Distillation (MED) [30,31] or a thermally-driven membrane processes, such as membrane distillation [32,33,34] can be adopted.
Only a few works in the literature are focused on the case of “solvent extraction scheme”. In particular, Long et al. [35] performed a parametric study on a hybrid membrane distillation RED system powered by NaCl solutions, reaching a maximum thermal efficiency of 1.15%. Tamburini et al. [29] analyzed the performance of a RED-MED heat engine adopting a simplified model approach, obtaining a maximum energetic efficiency of 5% (27.9% exergy efficiency) with current state of the art values for the RED and MED performances, and around 15.4% (86% exergy efficiency) with prospective values. Recently, J. Hu et al. [36] presented a thermodynamic analysis of a RED-MED system based on First Law. They investigated the effect on the performance of relevant operating parameters, and obtained a maximum thermal efficiency of 1.01%. However, the energy conversion potential was not assessed in their work, limiting the scope of the analysis. Notwithstanding the RED-MED coupling appears very promising thanks to lower thermal consumption compared to other evaporative technologies [37], the need for a more rigorous approach identifying the real potential of this technology arises. With this regard, the exergy efficiency is used to measure the maximum thermodynamic capability of the process to convert heat into power, i.e., how far is the investigated RED-MED HE from the ideal reversible process.
The present work aims to provide a rigorous tool for the evaluation of the energy and exergy performance of a RED-MED HE. With this tool, the effect of the main operating variables (solutions concentration and velocity) on the system performance has been investigated. Two different scenarios have been analyzed: the first one considers conventional Ionic Exchange Membranes (IEMs) properties based on commercially available membranes, while the second one assumes ideal IEMs properties (perfect permselectivity, null value of the diffusive salt flux and water permeability across the membranes and reduced membrane resistance). To this end, two separated mathematical models for the description of the RED and MED units have been used. A parametric study has been performed for the separated RED and MED units and for the whole RED-MED HE, with sodium chloride aqueous solution as working fluid. The performance parameters analyzed are the power density (W/m2 of cell pair) and the energy yield (kWh/m3 of feed solution) for the RED unit, the Specific Thermal Consumption (STC, in kWh/m3 of extracted solvent) for the MED unit, and the Thermal Power Consumption (TPC, in W) and exergy efficiency for the overall integrated system. This detailed analysis is helpful to provide guidance and insight on the design and operation of a RED-MED HE.

2. Description and Modeling of the Systems

2.1. Reverse Electrodialysis Process

The reverse electrodialysis process has been modeled following a hierarchical approach, reflecting the structure of a real unit [38,39,40,41]. The RED stack consists of cell pairs each one constituted by a Cation Exchange Membrane (CEM) and an Anion Exchange Membrane (AEM) [42,43], and two adjacent channels, alternatively fed by a concentrate and a dilute solution. The concentration gradient across the membrane constitutes the driving force for the transport of ions, from the concentrate to the dilute solution (see Figure 3). The presence of ionic exchange membranes ensures the selective passage of anions moving towards the anode and cations towards the cathode, thus generating an ionic current through the stack, which leads to the generation of the electro motive force of the pile. The ionic flux is converted into an electric current by means of redox reactions, which take place in the electrode compartments, fed by a water solution of a suitable redox couple [44].
The low-hierarchy model is restricted to one cell pair and contains all the equations (reported in the Supplementary Information, Table S1.1) to calculate the thermodynamic and physical properties, the ions and water fluxes through the membranes and all the electrical variables such as electromotive force, cell-pair resistance and current. In addition, the model computes the variation of solute concentration and flow-rate along the channel length by means of a distributed domain approach, as depicted in Figure 3. The channel length is subdivided in a certain number of computational elements ( N k = 50 ) which allows for an accurate numerical solution of model equations.
Activity and osmotic coefficients of NaCl in water solution are estimated through the Pitzer’s model for single salt-water solutions [46,47,48], while the salt-solution conductivity is estimated via the Jone and Dole’s equation [49]. For the sake of brevity, all relevant details are reported in the Section S2 of the Supplementary Information file. The RED model, already validated against experimental data [45], is extensively described in [38,41].
The high-hierarchy model describes the whole RED stack. The main equations of the model are reported in the Supplementary Information, Table S1.2, and allow for the computation of the main electrical outputs, i.e., stack voltage, electric current, stack resistance and power density. The stack equivalent electrical scheme (Figure 4) includes the stack internal resistance, active elements generating the electromotive force (e.m.f.), and external load where the power generated is consumed. It is assumed an ideal flow distribution in all cell pairs and the pile resistance and e.m.f. in the cell pairs are considered as N · R c e l l and N · E c e l l , respectively.
An important performance parameter for the RED process is the yield ( Y ). It represents the fraction of power recovered ( P n e t ) with respect to the maximum available power ( Δ G ˙ m i x ) evaluable considering the Gibbs free energy of mixing:
Y = P n e t Δ G ˙ m i x
where:
Δ G ˙ m i x = | G ˙ m i x G ˙ d i l G ˙ c o n c |
in which G ˙ m i x , G ˙ d i l and G ˙ c o n c are the Gibbs free energy rate of final solution, dilute and concentrate, respectively. It is evaluated according to:
G i ˙ = n i ˙ μ i = n ˙ s a l t , i μ s a l t , i + n ˙ w a t e r , i μ w a t e r , i
where n ˙ is the molar flow rate, and μ is the chemical potential of the solution species.
The RED model has been implemented in gPROMS®, using a hierarchical structure, as mentioned previously. This process modeling platform is useful to solve non-linear equation systems and it does not need to develop algorithms as all the equations are solved simultaneously. Simulations have been performed for a stack of 50 cell pairs fed by NaCl aqueous solutions, with two different geometrical configurations, i.e., 0.1 × 0.1 m2 and 0.1 × 0.88 m2, which represent typical lab-scale and real-scale lengths of a RED stack, and in counter-current flow arrangement. These simulations have been carried out considering a wide range of variation of the main operating parameters, i.e., feeds inlet concentration and velocity. In particular, the performance of the RED unit, in terms of power density and process yield, has been analyzed varying the inlet concentration in the concentrate channel ( C H , i n ) from 2 M to 5 M and in the dilute channel ( C L , i n ) from 0.01 M to 0.2 M, with fixed velocities, and varying the velocity in both channels from 0.5 cm/s to 2 cm/s, with fixed concentrations. Notice that the maximum power is obtained approximately for a value of the external resistance equal to the stack resistance [50]. Therefore, all simulations have been performed assuming the external load that maximizes the power density ( P d , m a x ), which has been obtained previously through an optimization tool of gPROMS.

2.2. MED Process

The MED thermal separation process (Figure 5) is based on multi-stage evaporation/condensation processes at decreasing temperatures (and their corresponding saturation pressures). In each stage, part of the feed solution is evaporated (boiling vapor) and the rest is concentrated in salts (brine). Only one external energy source (heating steam) is needed for the MED process, which enters the first effect tube bundle (falling-film evaporator) at the highest temperature. This energy source can be waste heat from any industrial process. In the remaining effects, the boiling vapor is used as the energy source thus significantly enhancing the energy efficiency of the process. It passes through a demister to retain the water droplets, and is driven to the preheater, where part of it condenses. The rest enters the following evaporator, being the energy source for a new evaporation process. All the condensates, from the preheaters and evaporators, are collected in the flash boxes, where a small part of vapor is produced and introduced in the correspondent effect. The condensation of vapor produced in the last effect takes place in an external tube bundle called end condenser, using cooling water from a cold source.
The configuration of the MED plant shown in Figure 5 is forward-feed, in which both feed solution and vapor flow in the same direction. This configuration reduces the Boiling Point Elevation (BPE) as the maximum feed concentration is reached in the last stage, which operates at lower temperature (Figure S2.1 in Supplementary Information).
The potential for improving the energy efficiency of MED plants is limited mainly by the top brine temperature (i.e., the maximum temperature achieved, taking place in the first effect), which is typically 70 °C when operating with seawater, in order to avoid scaling and reduce corrosion problems. If salt solutions different from seawater (e.g., sodium chloride aqueous solution) are used in the MED process, as it is the present case, the top brine temperature can be increased above 70 °C and the potential for improving the energy efficiency becomes larger. Also, the increase of the Recovery Ratio (RR, defined as the ratio of the distillate flow rate to the feed flow rate) above 30–40% is possible with the use of artificial salt solutions, which leads to a potential reduction in the specific thermal consumption of the separation process.
There are plenty of MED models presented in the scientific literature, most of them consider parallel feed or parallel-cross configuration for the MED plant and are adapted to the bound conditions referred to seawater as the working fluid [31,51,52,53,54]. Thus, they use correlations for the calculation of the physical-chemical properties of the adopted saline solution related to seawater. The model here presented is a steady-state model for a forward feed MED plant thoroughly described and validated in [55], including purposely developed correlations for the physical-chemical properties of the NaCl aqueous solution (BPE, latent heat of vaporization, enthalpy, density, specific heat, etc.). Also, the working range for several parameters has been enlarged, e.g., the heating steam temperature can range between 60 °C and 100 °C and the recovery ratio between 10 and 70%.
The model is based on the mass and energy balances applied to the different elements of the plant, along with the heat transfer equations for heat exchangers. It has been implemented in Engineering Equation Solver (EES) software environment [56], which uses the Newton-Raphson method to solve simultaneously all the equations, therefore, proper initialization and bounding of the variables is needed to reach convergence. For the cooling flow required in the condenser, river water has been considered. A brief resume of the most significant equations of the cited model is presented in the Supplementary Information file.
For the simulations related to of the MED unit performance (Section 3.2), the following considerations are established:
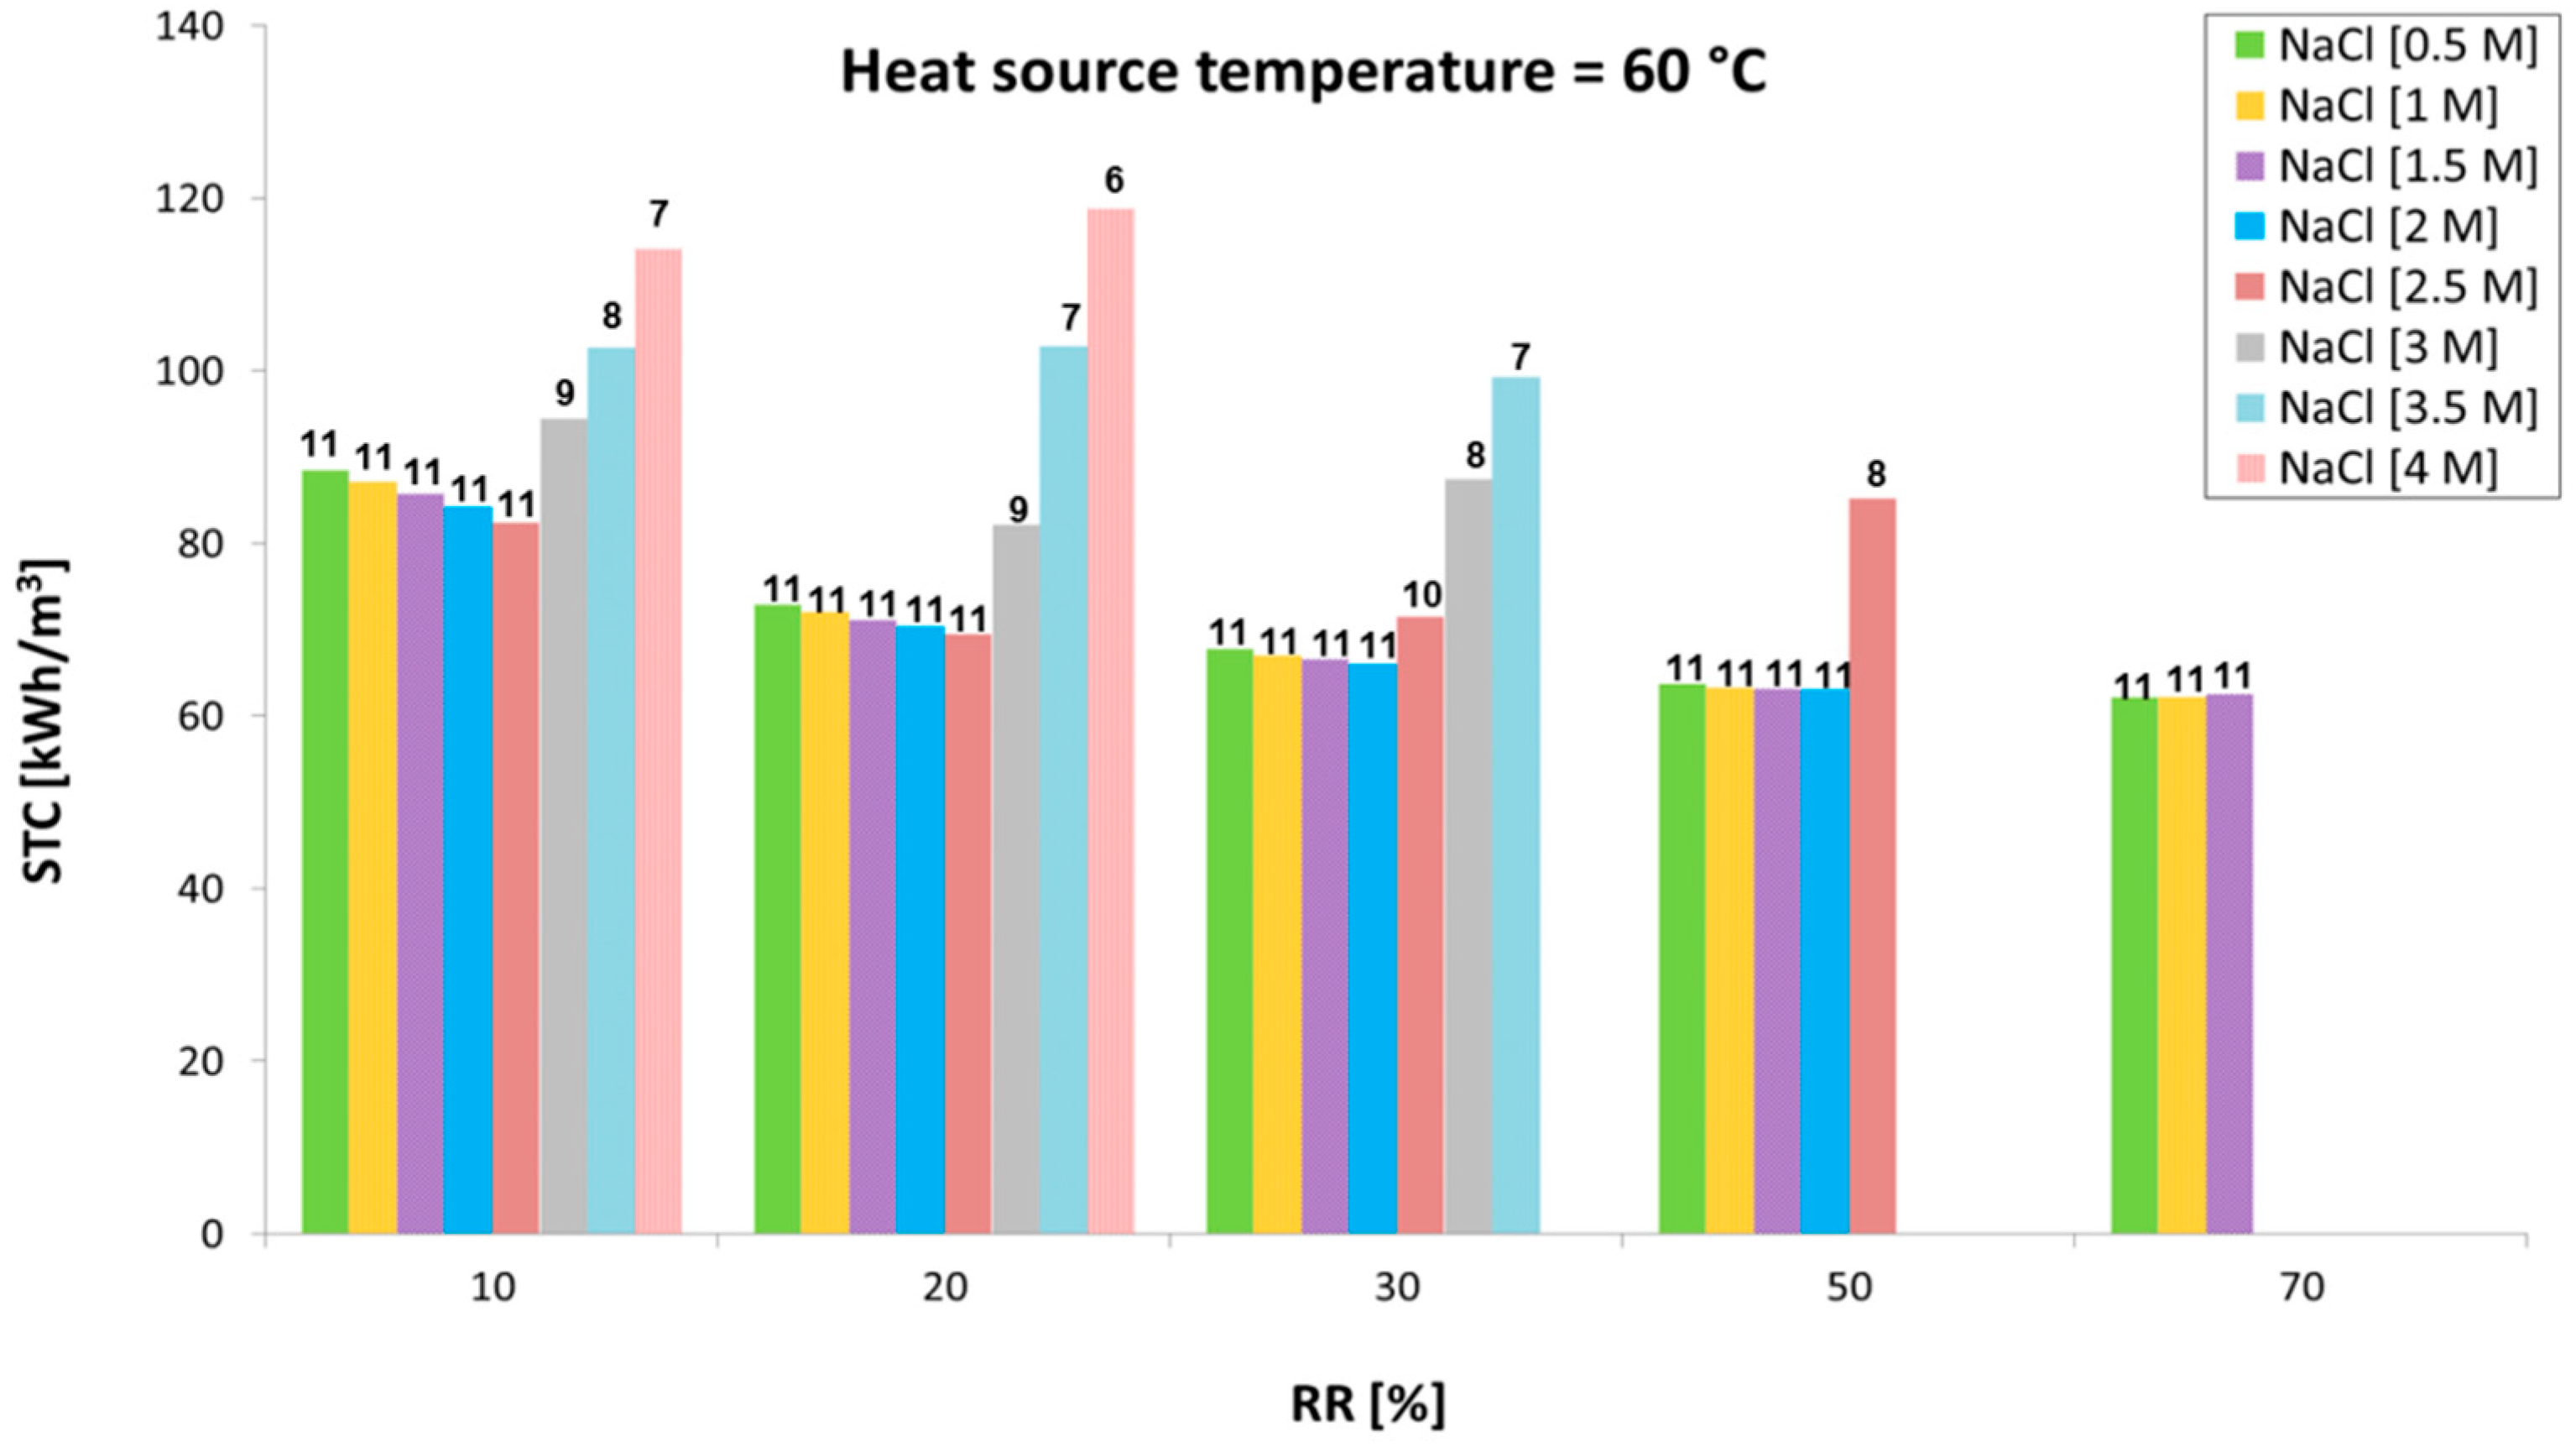
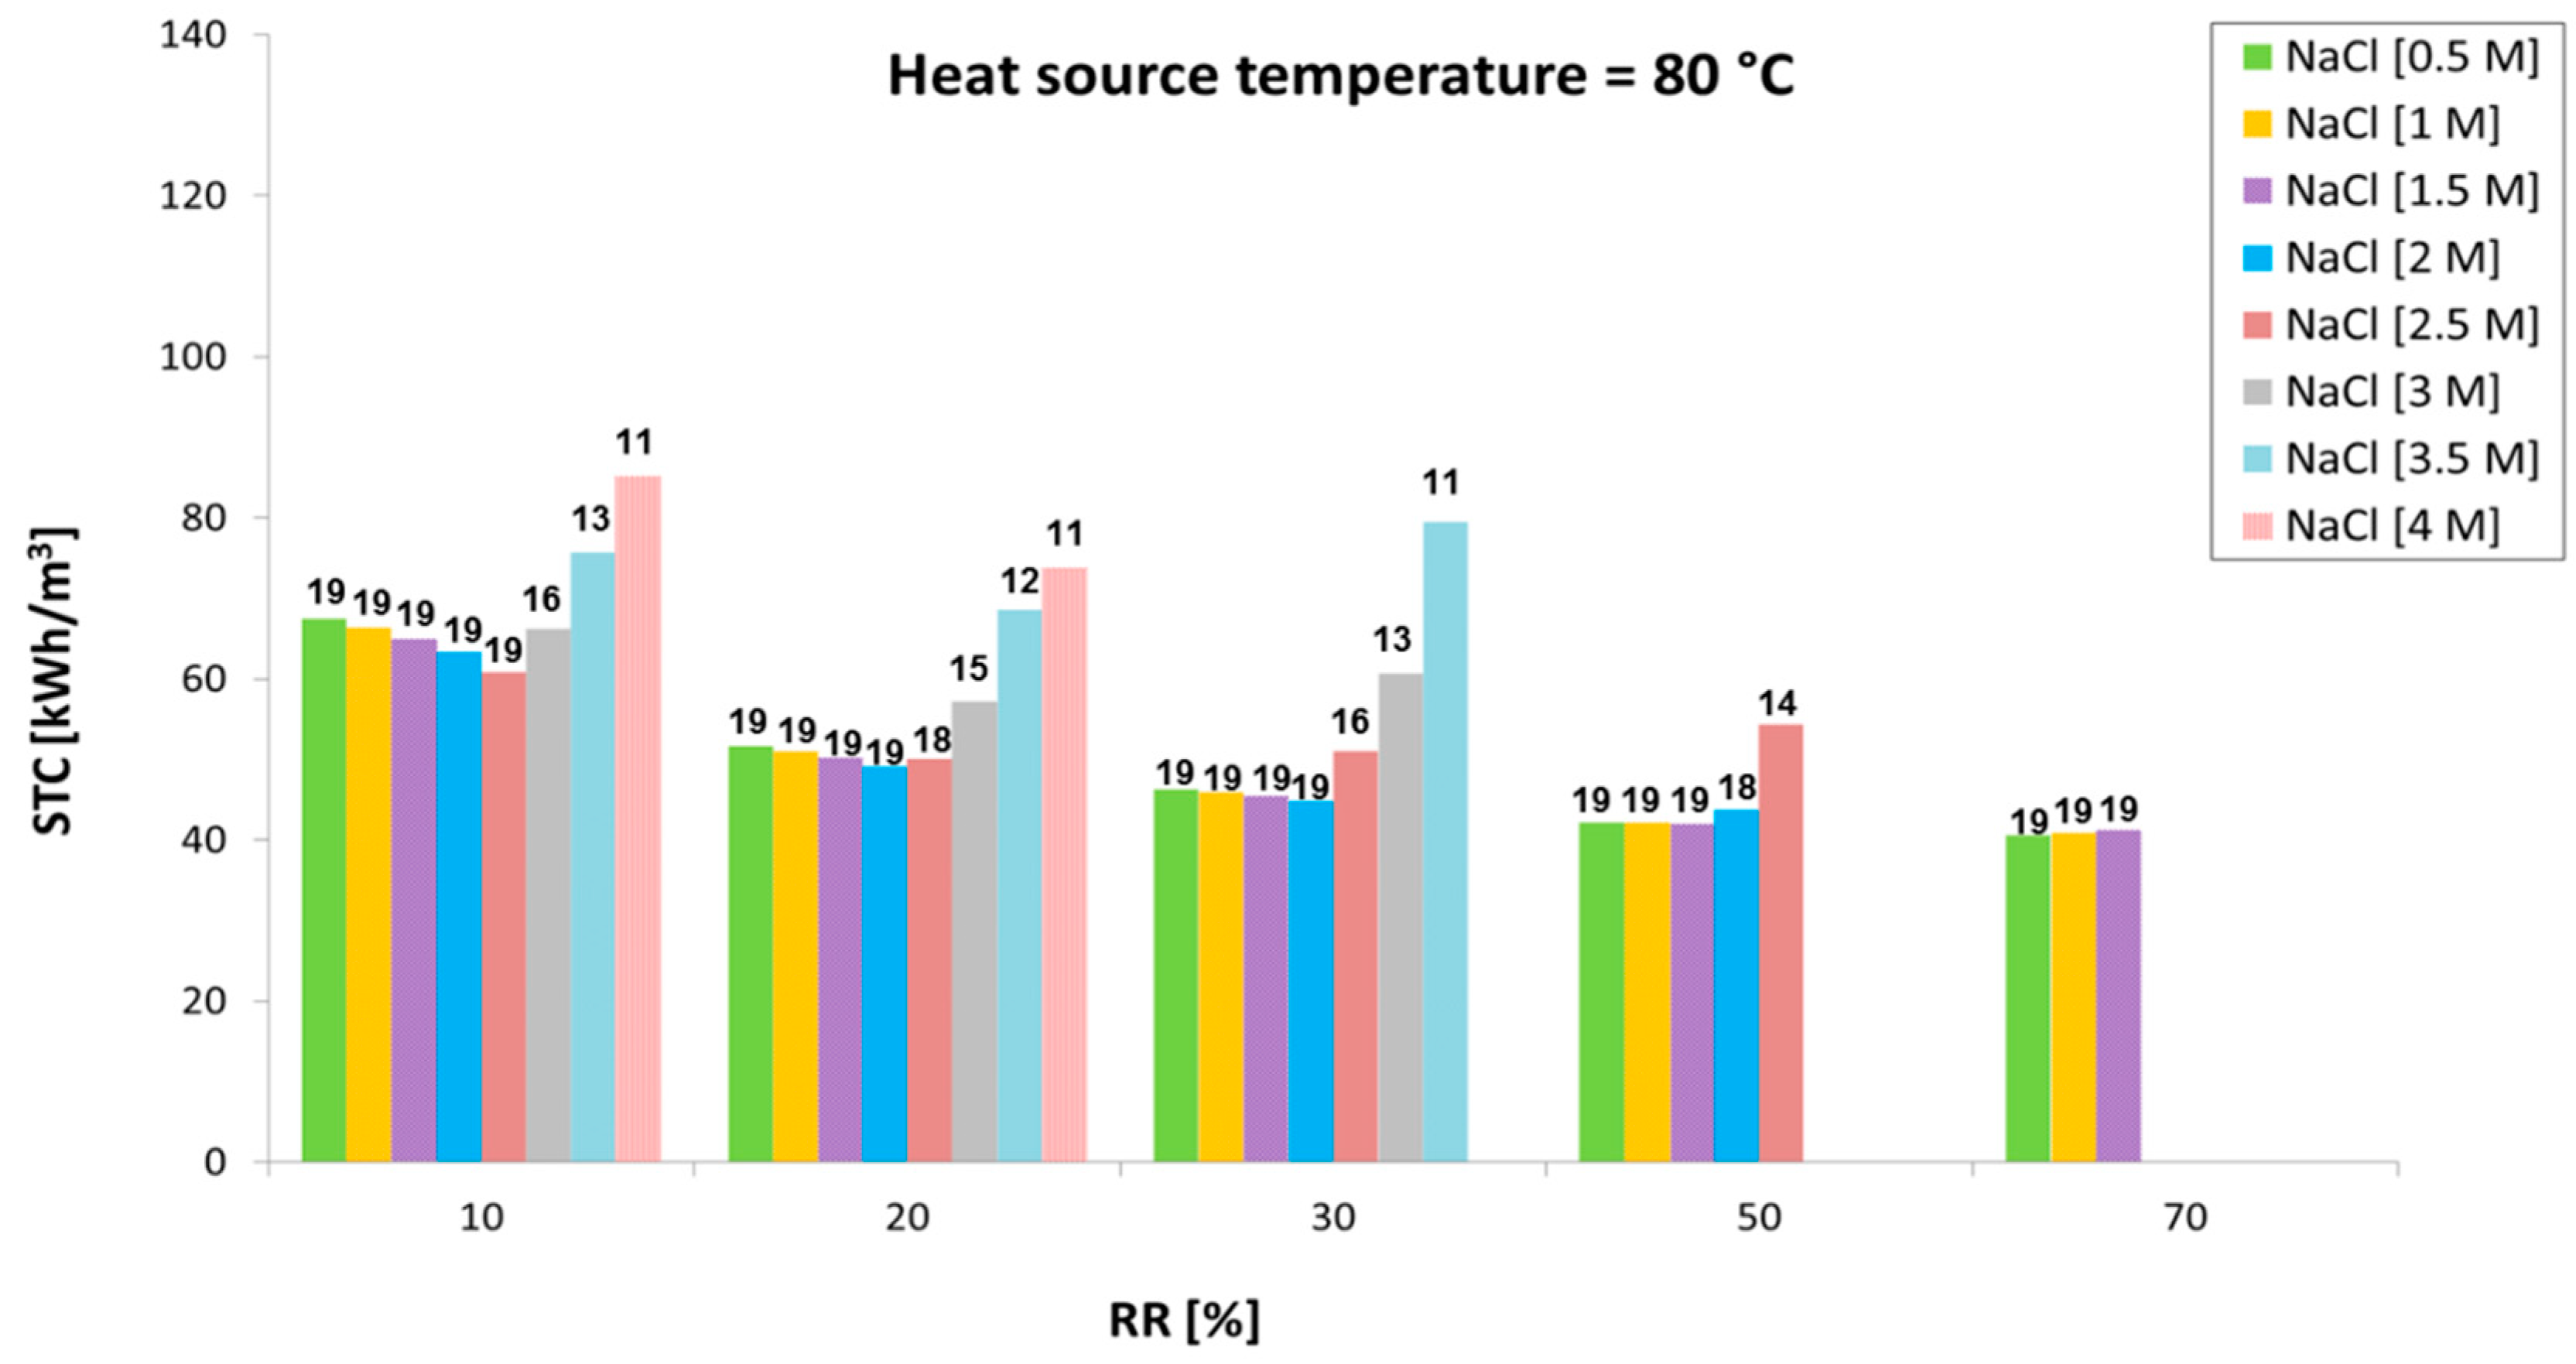
  • The theoretical number of effects has been established in order to maximise the thermal efficiency of the system, yet guaranteeing a minimum effective driving force in each effect of at least 1 °C. The total number of effects is significantly limited in the cases with high RR and, consequently, high values of concentration and BPE are reached in the last effects.
  • In all cases, the temperature of the cooling water at the inlet of the condenser has been fixed at 20 °C, which is assumed as the temperature of the cooling source.
  • The temperature of the feed salt solution at the inlet of the MED plant has been established as 25 °C (this is the operating temperature assumed for the RED process).
  • In all cases, the temperature of the concentrated solution in the last effect was assumed equal to 35 °C and the total distillate production equal to 100 m3/day, respectively. The capacity does not have influence on the performance of the process.
The operating conditions for the simulations are shown in Table 1, considering a matrix of tests in which the inlet concentration of the salt solution ( M M E D , i n ) and the RR are varied. All these cases have been investigated for different temperatures of the external heating steam (from 60 °C to 100 °C). The recovery ratio has been fixed in order to cover a wide range of MED outlet concentrations, up to a maximum of 5 M. For each value of M M E D , i n , the higher the RR the sooner the limit value of 5 M is achieved. Therefore, at high values of M M E D , i n a finer discretization of RR values is adopted. For each inlet condition ( M M E D , i n , RR and temperature of the heating steam), the number of effects that minimize the STC has been determined. The results of these simulations have been used to obtain two correlations (STC and Neffects) to be used in the integrated system model (see Section 2.3).

2.3. RED-MED Coupled System

A scheme of the coupled RED-MED system is given in Figure 6. Here the RED stack converts an initial artificial salinity gradient into power, while the MED unit acts as a regeneration process, re-establishing the initial conditions of the two solutions exiting from the RED unit. The distillate produced in the MED unit is theoretically free of salts, then two mixers are used to restore in the two loops the mass of salt exchanged in the RED stack.
In particular, a fraction of the outlet dilute solution from the RED unit is mixed with the outlet concentrate (Mixer 1), restoring the salt content of the feed solution in the concentrate loop. Thus, the flow rate of the bypass solution ( Q b y p a s s ) is calculated by the following equation:
C H , o u t Q H , o u t + C L , o u t Q b y p a s s = C H , i n Q H , i n
where C H , i n , C H , o u t , Q H , i n , and Q H , o u t are the inlet and outlet concentrations and flow rates of the concentrate solution in the RED unit, while C L , o u t is the outlet concentration of the dilute solution from the RED unit.
The flow rate and the concentration of the solution fed to the MED plant ( Q M E D , i n and C M E D , i n , respectively) are determined according to the following equations:
Q H , o u t + Q b y p a s s = Q M E D , i n
C M E D , i n Q M E D , i n = C H , i n Q H , i n
The feed salt solution ( Q M E D , i n ) enters in the MED unit in order to produce both a concentrated solution and a distillate solution, using low-grade heat (between 60 °C and 100 °C) as thermal energy source (see Figure 5) in the first effect. The concentrated solution results from the sequential evaporation process in the effects, while the distillate is the sum of all the solute-free streams produced from the condensation process in each evaporator and preheater. The distillate output from the MED is then mixed with the rest of the dilute streams exiting from the RED unit (Mixer 2).
The distillate flow rate ( Q D ), which is needed to restore the flow rate and concentration of the RED inlet dilute solution ( Q L , i n ), is determined through the following mass balance in the second mixer (Mixer 2):
Q L , o u t + Q D = Q L , i n
For a fast computing and flexible simulation strategy, the coupling of the two models was done through simple correlations relating the specific thermal consumption and the optimised number of effects ( N e f f e c t ) to the inlet MED concentration ( C M E D , i n ) and the inlet-outlet concentration difference ( Δ C M E D ):
S T C = A + B C M E D , i n + C Δ C M E D + D C M E D , i n 2 + E Δ C M E D 2
N e f f e c t s = A + B C M E D , i n + C Δ C M E D
where A , B , C , D   and   E are constants derived from fitting the model predictions (reported in Table S3.1 within the Supplementary Information file).
The product of the specific thermal consumption and the distillate flow rate gives the total Thermal Power Consumption ( T P C ) of the MED plant, in W:
T P C = S T C · Q D
Therefore, the energy efficiency ( η ) of the RED-MED integrated system is defined as:
η = R E D   n e t   p o w e r M E D   p u m p i n g   p o w e r T P C
The pumping power consumption of the MED unit is evaluated according to the equations reported in the Supplementary Information, Section S3. Finally, the exergy efficiency, η e x , is given by the ratio between the energy efficiency ( η ) and the Carnot efficiency ( η C ) [29]:
η e x = η η C
η C = 1 T c o l d   [ K ] T h o t   [ K ]
The RED-MED model was used to perform a sensitivity analysis in order to identify the exergy efficiency of the global system varying the inlet concentrations and velocities of the two solutions entering to the RED unit. In particular, the concentration of the high concentrated solution, C H , i n , was varied from 2 M to 5 M and the concentration of the dilute solution, C L , i n , from 0.01 M to 0.2 M, while the velocities in both channels were varied from 0.5 cm/s to 2 cm/s. These simulations have been performed for a stack of 50 cell pairs with membrane areas of 0.1 × 0.88 m2 and spacer thickness of 155 µm, in counter-current flow arrangement. In order to assess the effect of improving IEMs properties for a perspective analysis of potential, all simulations were first performed assuming typical properties of current state of the art membrane and then assuming future perspective IEM with ideal permselectivity, α , and reduced electrical resistance, R C E M and R A E M (see Table 2). The other two membrane properties, i.e., the water permeability, L p , and the salt diffusivity, D s , were taken equal to zero for the ideal case, since in this way the diffusive flux of the salt from the concentrate to the dilute compartment and the osmotic flux resulted equal to zero. These last two terms are detrimental for the RED performances as they cause uncontrolled mixing, which leads to a reduction of the driving force and the destruction of part of the exergy contained in the inlet streams [45].
For each set of conditions, concentration and flow rate of the solution entering the MED unit were computed from the mass balance Equations (5) and (6) taking into account the outlet conditions (flow-rates and concentrations) from the RED unit. Finally, correlations (Equations (8) and (9)) were used to calculate the optimized number of effects and STC of MED unit.

3. Results

3.1. RED Model Results

The first analysis is focused on the influence of the feed inlet concentration and velocity on the produced power density under the condition of an external load maximising the power output of the RED unit ( P d , m a x ) (Figure 7). As shown in Figure 7a the P d , m a x achievable in the shorter stack is much higher than that achievable in the longer stack (Figure 7b), as expected, because of the noticeable decrease of the average driving force with the increase of length. In the case of stack length equal to 0.1 m, P d , m a x was found equal to 5.4 W/m2, with C H , i n = 3.75 M and C L , i n = 0.02 M. Conversely, in the case of stack length equal to 0.88 m, assuming the same inlet conditions, P d , m a x was found equal to 2.8 W/m2 that does not correspond to the maximum value. A maximum value equal to 2.9 W/m2 was found at C H , i n = 4.5 M and C L , i n = 0.01 M. Such values are considerably lower than the case of short stack due to the large change in concentration of the two streams (i.e., short stack: C H , o u t = 3.5 M, C L , o u t = 0.08 M; long stack: C H , o u t = 3 M, C L , o u t = 0.6 M).
Interestingly, the maximum values of P d , m a x are not found in correspondence with the maximum inlet concentration difference, i.e., C H , i n = 5 M and C L , i n = 0.01 M. This is due to the variation of IEMs and stack properties with concentration. In fact, the higher the C L , i n the lower the driving force but, at the same time, the lower the electrical resistance of dilute channels. These opposite effects have been experimentally observed using real NaCl solutions [57]. On the other side, the higher the C H , i n the lower the IEMs permselectivity as the average concentration in the channels depends more intensely on the inlet conditions.
The effect of fluid velocity on P d , m a x is shown in Figure 7c for the case of the longer stack at the inlet concentration conditions C H , i n = 4.5 M and C L , i n = 0.01 M previously found to lead to a maximum value of the power density. The effects of the variation of v L and v H on P d , m a x are quite different. When v L increases, for every v H , P d , m a x increases since the higher the velocity of the dilute stream, the higher the driving force along the entire channel. Conversely, a change of v H , for every v L , does not result in a significant variation of P d , m a x . Therefore, the maximum power density, about 4 W/m2, is found for v H = v L = 2 cm/s.
Notwithstanding the higher values of power density obtained with the shorter stack, yields resulted in very low values compared to the longer stack, since it has a beneficial effect when increasing stack length (Figure 8a,b). For this reason, in the next sections just a stack length of 0.88 m has been considered. In Figure 8c the effect of variation of v L and v H on yield is shown for the case of C H , i n = 4.5 M and C L , i n = 0.01 M, which was found to maximize the P d , m a x (Figure 7b). It was found that the yield largely depends on the value of v H , which determines the residence time in the concentrate channel. Conversely, the effect of v L , i n is significant in the range 0.5–1 cm/s while for values higher than 1 cm/s the effect is negligible.

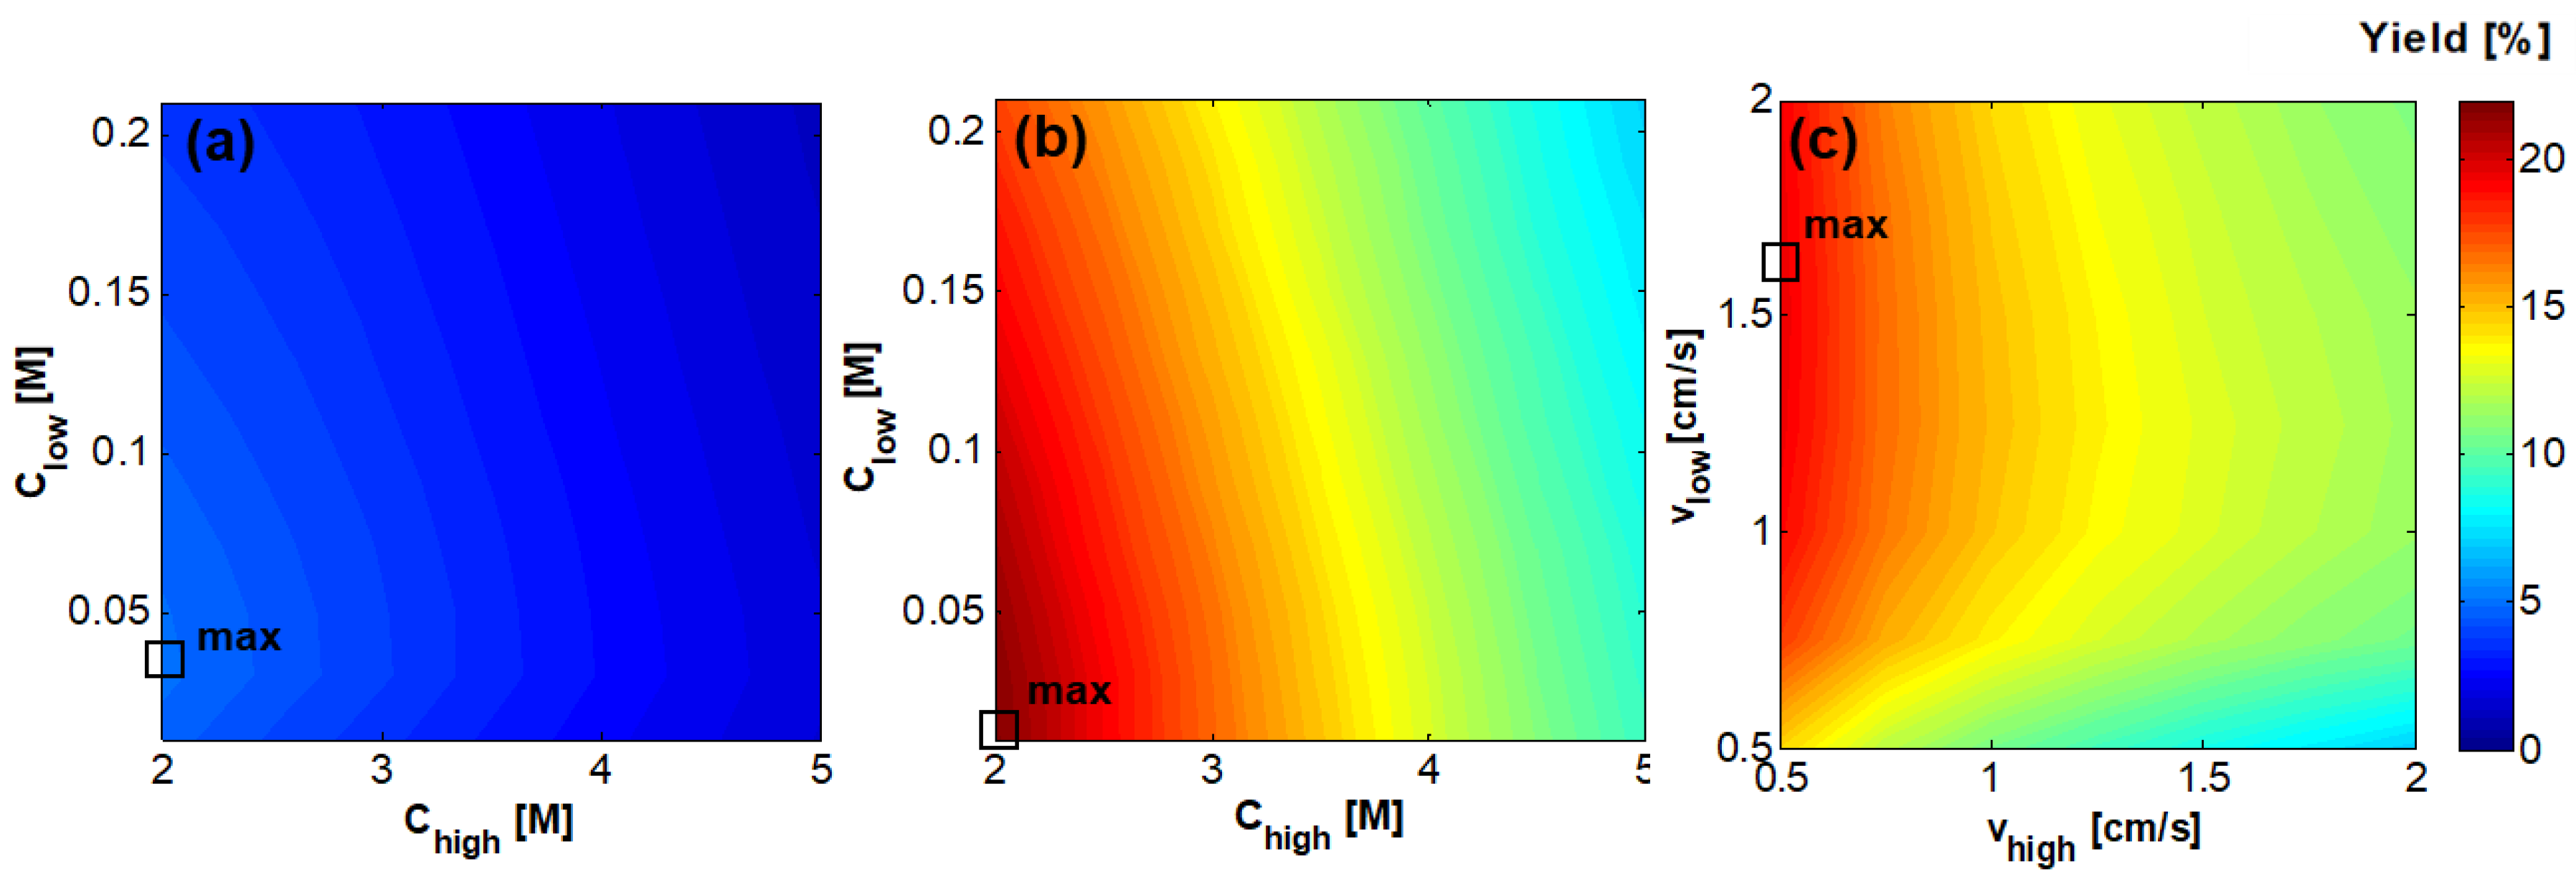
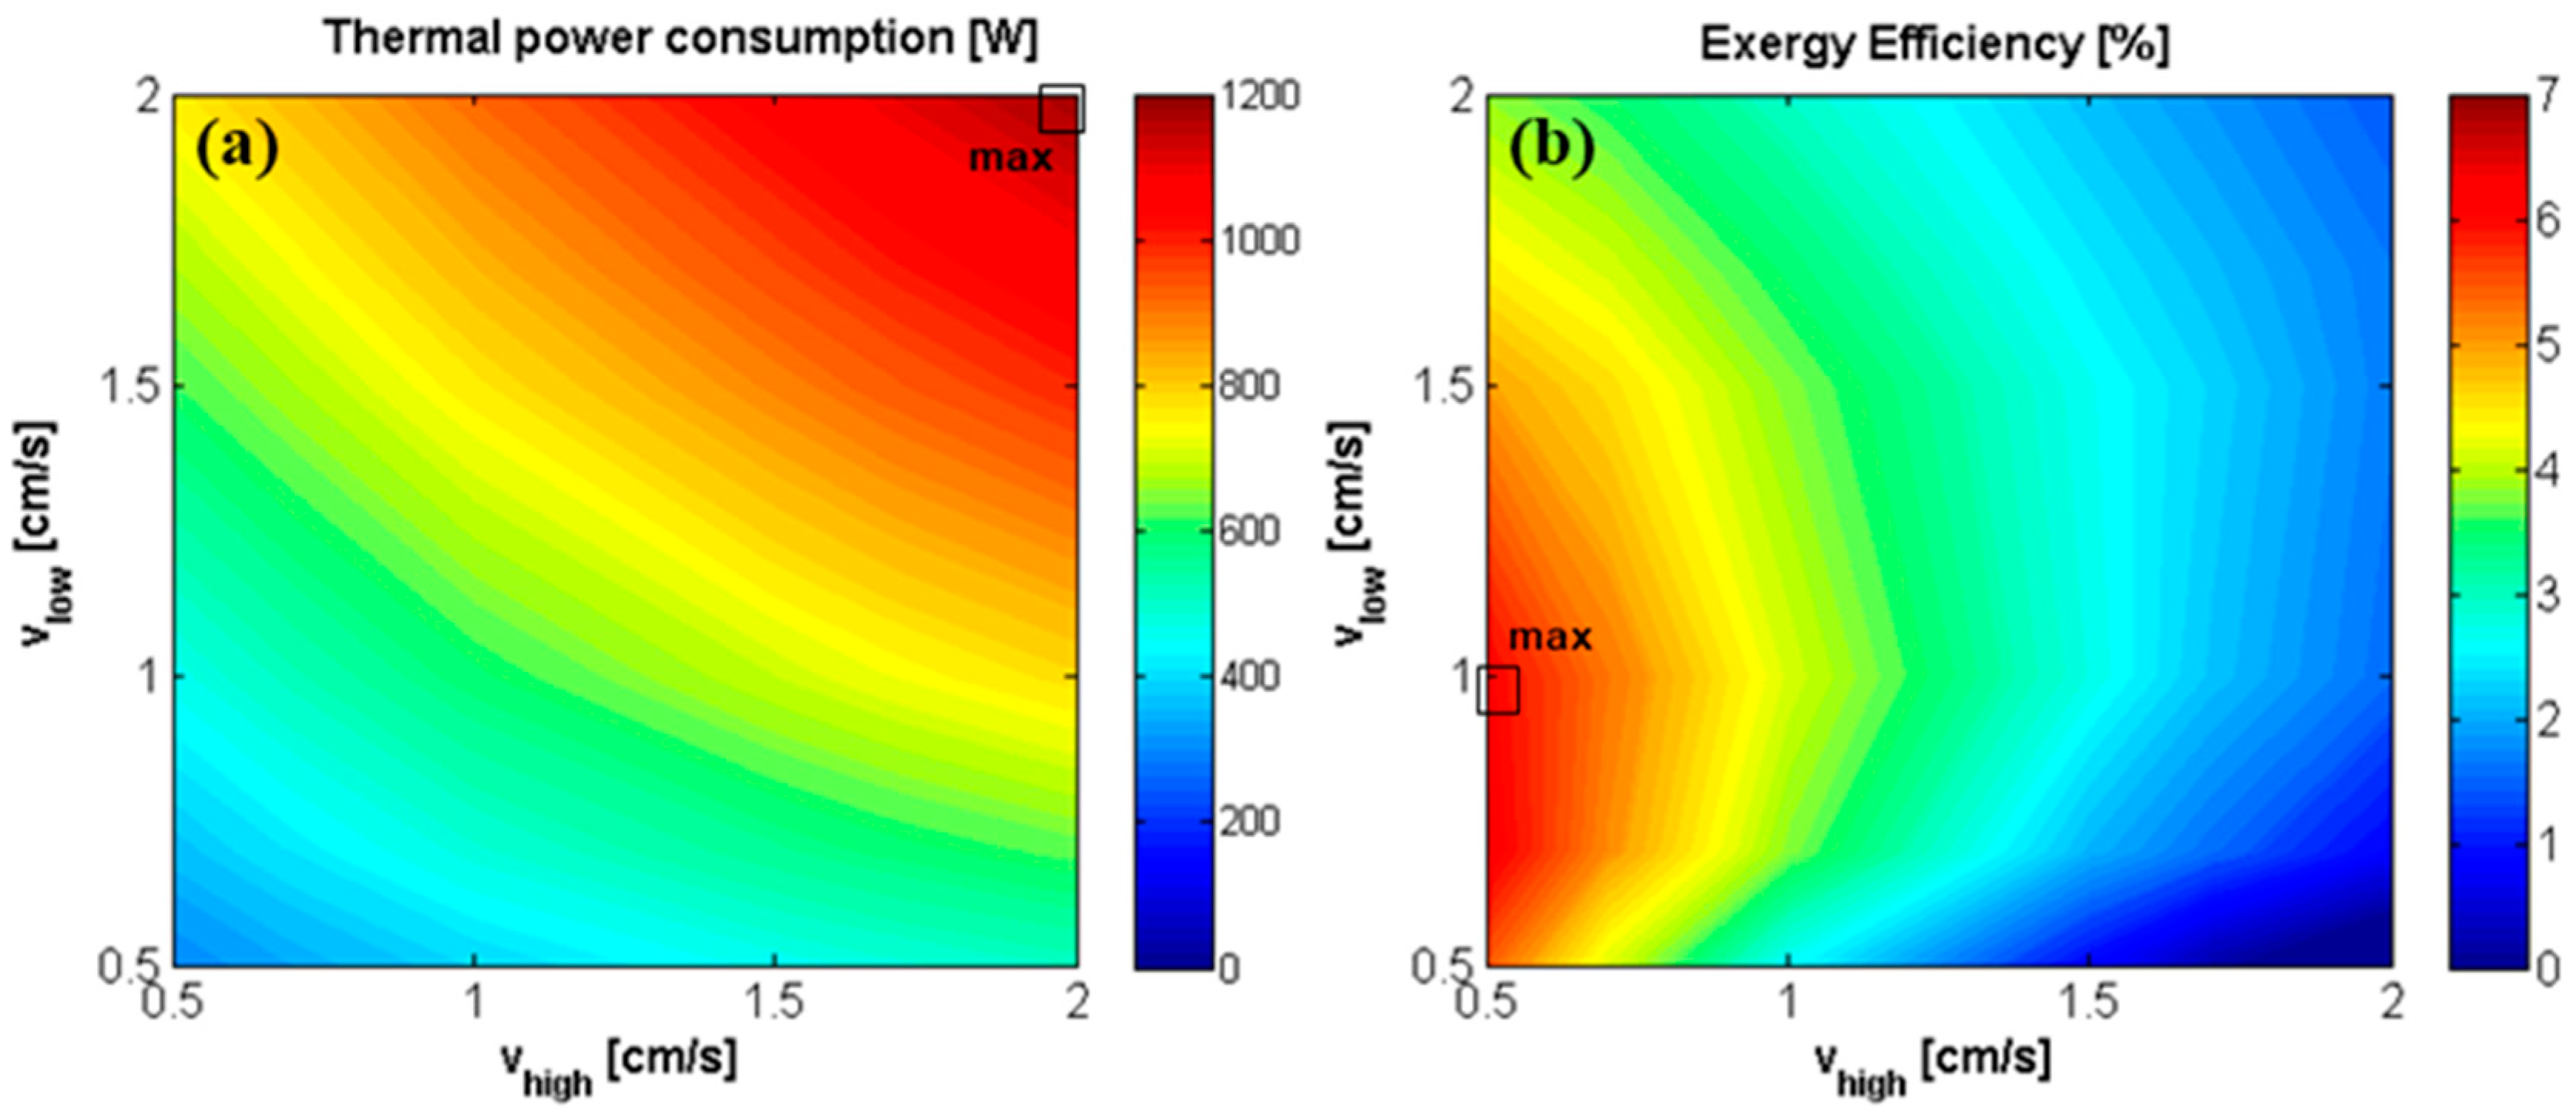
RED Performance with Ideal IEMs

The RED performance is dramatically affected by the properties of the membranes as the “non-ideal” behavior of IEMs determines several exergy losses [45], e.g., due to the diffusive flux of the neutral salt and water through the membranes. Thus, it is interesting to investigate the behavior of a RED stack equipped with ideal IEMs as mentioned in Section 2.3.
As shown in Figure 9a, the maximum power density is produced at the highest concentration in the concentrate compartment and at the lowest concentration in the dilute compartment, since the prominent term, in this case, is the driving force, while the effect of concentration on IEMs permselectivity and resistance is neglected for ideal IEMs. Therefore, since the electrical resistance of the membranes is much lower than in the real case, the overall stack resistance decreases significantly at any concentration. Regarding the permselectivity, it is set to 100% in all the concentration range, thus the available potential difference is higher than in the real case and this is evident especially in the cases of high concentrations in the concentrate compartment and low concentration in the dilute compartment, in which the real permselectivity was significantly reduced. The combination of increased potential difference and decreased stack resistance leads to an enhanced power density at any set of concentrations. A maximum power density of about 10% W/m2 is reached in this case, which is more than three times higher than the maximum power density achieved with current membranes (2.9 W/m2).
Similar to the simulations carried out for the current membranes, a set of concentrations has been selected and fixed (i.e., 5 M and 0.01 M for the concentrate and the dilute solution respectively, since these concentrations maximize the power density) in order to investigate the influence of the fluid velocity on the power produced in the RED stack. Also, in this case, P d , m a x increases as the two fluid velocities increase, reaching its maximum value (about 14%) at the highest velocity in both channels (2 cm/s) (Figure 9b).

3.2. MED Model Results

The performance of the stand-alone MED unit under the identified operating conditions (Table 1) was characterized as well. Figure 10, Figure 11 and Figure 12 show variation of the specific thermal consumption as a function of the recovery ratio, for different inlet concentrations (0.5 M to 4 M) and various temperatures of the waste heat source (60 °C, 80 °C and 100 °C). The corresponding number of effects is reported above each bar.
Results indicate the trend of the minimum achievable STC values (obtained increasing the number of effects up to the maximum allowed value) in the different scenarios analyzed. It is worth noting how the initial concentration significantly limits the number of effects allowed (especially for values above 1.5–2 M, where the effect on BPE raise becomes important) and has a direct influence on the specific thermal consumption achieved. When the number of effects can be kept constant (e.g., with inlet salt concentration from 0.5 to 1.5 or 2 M), the STC only slightly decreases with the RR. In fact, the temperature difference between vapor generation and subsequent condensation is increased by the higher values of BPE. This leads to a reduced latent heat of evaporation (at higher temperature due to the BPE) compared to the latent heat of condensation of the vapor in the subsequent tube bundle, thus improving the thermal integration of the multi-stage system. However, this is visible only at very high RR, where an increase in STC is observed when increasing the inlet concentration.
The major influence of inlet concentration, however, is due to the lower number of effects, which dramatically reduce the thermal efficiency of the multi-effect distillation process. On the other hand, the higher the RR the lower the flow rate of feed solution through the preheaters. This reduces the amount of vapor consumed and enhances the overall efficiency of the system. STC also significantly decreases with the operating temperature, as the number of effects can be increased by increasing the temperature of the energy source provided to the MED plant. A minimum value of 23 kWh/m3 at 100 °C and inlet concentration of 1.5 M is achieved.
On the basis of these findings, in all cases discussed in the following, concerning the simulations of the RED-MED integrated system, T h o t , i.e., the temperature of the waste heat provided to the MED unit, is set to 100 °C and T c o l d , i.e., the temperature of the cold sink where the residual heat is discharged, is set to 20 °C.

3.3. RED-MED Integrated System

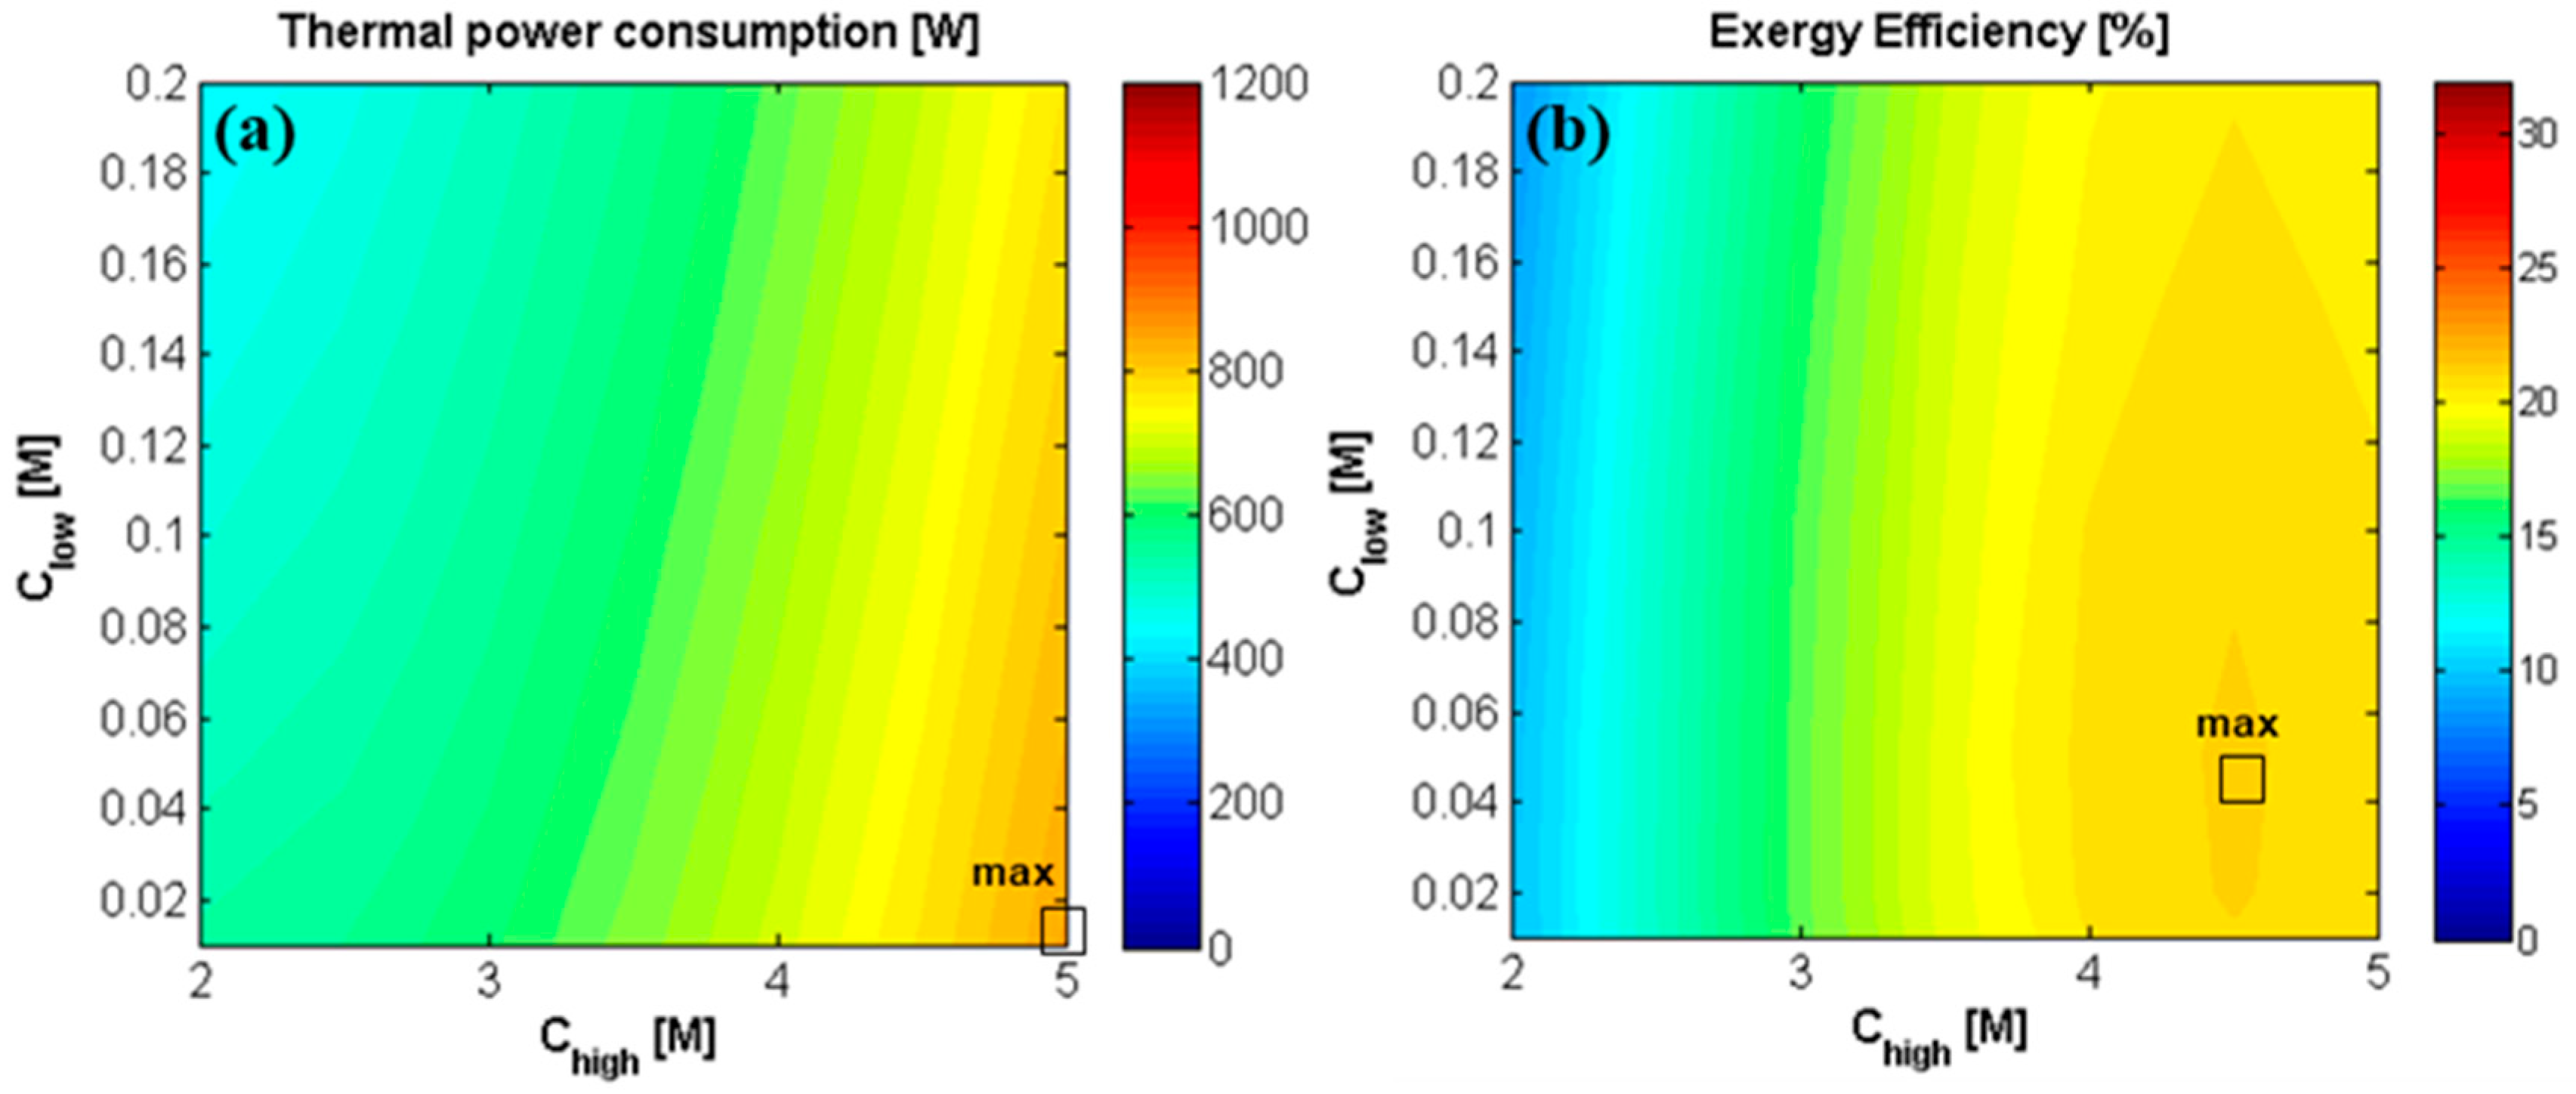
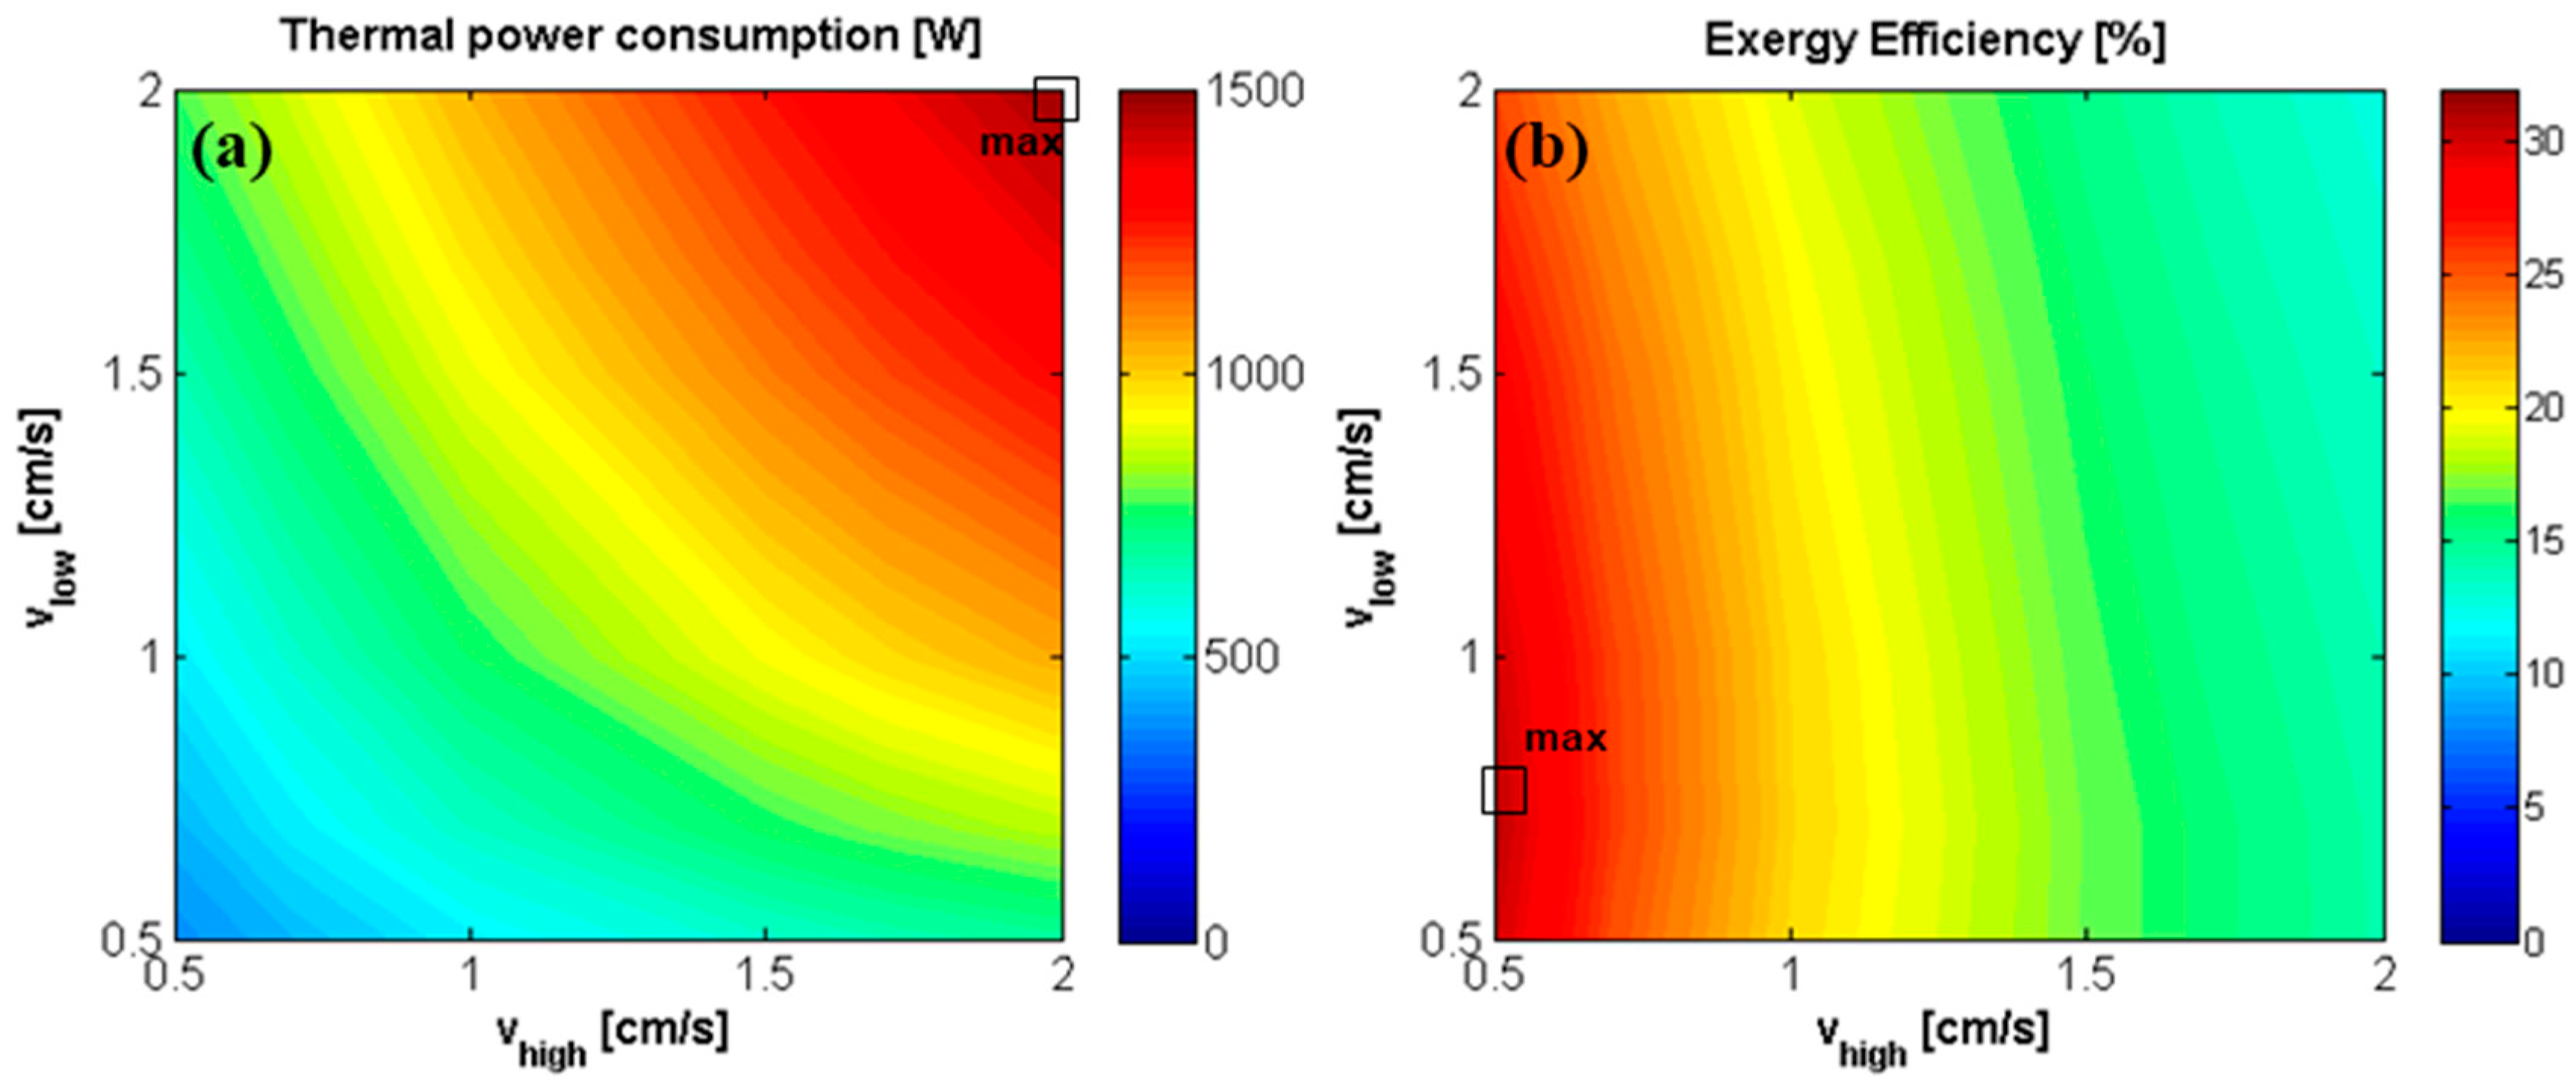
3.3.1. Analysis of the Integrated RED-MED System Performance with Current IEMs

The analysis of the integrated RED-MED system has been performed varying the RED inlet solutions concentration and velocity as these determine the concentration of the solution sent to the MED unit, as well as the required distillate flow rate. These two parameters have a prominent role in the definition of the specific thermal consumption of the MED process, since it depends on the inlet MED concentration, C M E D , i n , and the relevant Δ C M E D , while the total energy consumption is given by the product of the STC by the volumetric flow rate of distillate, Q D (Equation (10)). In particular, C M E D , i n increases as C H , i n and C L , i n increase (Equations (4)–(6)). As a consequence, the higher the two concentrations, the higher the specific thermal consumption. On the other side, Q D largely depends on the value of C L , i n , while the effect of C H , i n is negligible. An increase of C L , i n reduces the Q D . As global results, the product of the two terms, i.e., STC and Q D , gives rise to the map of the thermal power consumption, reported in Figure 13a. The influence of C H , i n and C L , i n on the thermal power consumption is reported in Figure 13a. Concerning the effect of C H , i n , since the STC increases as C H , i n increases, the thermal power consumption is expected to increase with C H , i n . An increase of C L , i n has a double effect: a higher specific energy consumption but also a lower Q D . This last effect prevails determining a decrease of the thermal power consumption when an increase of C L , i n is considered.
The ratio between the net power generated in the RED unit and the thermal power consumption by the MED defines the energetic efficiency of the closed-loop (Equation (11)), while the ratio between the energetic and Carnot efficiency gives the exergy efficiency (Equation (12)), which is a more useful parameter to compare different heat engines [21]. Figure 13b shows how the exergy efficiency reaches its maximum value (4.5%, correspondent to a thermal efficiency of 0.97%) at the lowest concentration for the dilute solution, which maximizes in all cases the driving force, and at C H , i n equal to 3.5 M, as higher values negatively affects both permselectivity, membrane properties and the energy consumption in the MED plant.
The effect of velocity in the two channels has been also analyzed in terms of thermal power consumption and exergy efficiency (Figure 14). Concerning the effect of the inlet solution velocities on the thermal power consumption, the different influence on the specific thermal consumption and volumetric flow rate of distillate is analyzed also in this case. STC is a growing function of C M E D , i n , which increases as v H , i n increases and v L , i n decreases (due to the decrease of Q b y p a s s (Equation (6)). Q D is almost independent on v H , i n and, conversely, dramatically increases with v L , i n . On overall, the thermal power consumption increases both with v L , i n and v H , i n , as shown in Figure 14a.
Finally, the exergy efficiency is reported as a function of the two velocities (Figure 14b). The maximum exergy efficiency (6.7%) is reached when v L , i n is equal to 1 cm/s and v H , i n to 0.5 cm/s, and with 28 MED effects, which corresponds to a thermal efficiency value of 1.4%. As observed in Figure 7c, this is due to the fact that the higher the velocity of the dilute solution with respect to the concentrate one, the higher driving force is maintained along the entire channel. This effect is particularly evident when long RED stack are used, which are much more affected by the drop of driving force along the channel length.

3.3.2. Analysis of the Integrated RED-MED System Performance with Ideal IEMs

As already observed in Figure 7 and Figure 9, the power density generated with ideal membranes is more than three times higher than the one obtained with the current ones (14% vs 4%, approximately), due to the fact that the exchange of counter-ions is maximized and the non-ideal dissipative phenomenon is neglected. This has two direct consequences on the system operation: (1) higher electrical currents, leading to larger power generation and closer outlet concentrations of the two streams exiting the RED unit; (2) null diffusive salt and water flux, which significantly reduce the concentration drops (or rise) along the channel, thus preserving the salinity gradient at the RED unit outlet. The two phenomena affect the overall performance of the system in different ways, depending on the operating conditions. In particular, as shown in Figure 15a, the thermal power requirements increase with the concentrate solution salinity and decrease with the dilute solution salinity.
Concerning the exergy efficiency (Figure 15b), a maximum of about 22% is observed for C H , i n equal to 4.5 M and C L , i n equal to 0.05 M. With regards to the effect of C H , i n , the maximum is identified at a higher concentration than the case of current RED stack (3.5 M). In fact, here, the net power increases as C H , i n increases in the whole range of concentration. Thus, the increase in thermal power consumption prevails only at higher concentrations, determining a decrease of the overall efficiency above 4.5 M. Regarding the influence of C L , i n , while the system with a current RED stack reached the maximum efficiency at the lowest C L , i n investigated (0.01 M), in this case the efficiency slightly decreases at concentrations below 0.05 M, indicating that the increase of thermal energy consumption (due to the higher Q D ) prevails on the increase of generated power, which determine a decrease in the overall efficiency.
In the case of ideal membranes, the effect of the fluid velocity on the performances of the coupled system has been also investigated (see Figure 16), adopting the concentrations that correspond to the maximum exergy efficiency, i.e., 4.5 M and 0.05 M for the concentrate and the dilute solution, respectively. The trends of STC, Q D and thermal power consumption are analogous to the ones already described for the coupled system with the current RED stack: the specific energy consumption increases with the increase of v H , i n and the decrease of v L , i n while the thermal power consumption rises with both v H , i n and v L , i n .
Finally, the exergy efficiency is reported as a function of the two velocities (Figure 16b), for the case of optimal concentrations found previously C H , i n = 4.5 M and C L , i n = 0.05 M (Figure 15b). The maximum exergy and thermal efficiencies (31% and 6.6%, respectively) are reached when v L , i n is equal to 0.7 cm/s and v H , i n to 0.5 cm/s, with 22 MED effects, combining high net power output in the RED unit and low thermal energy consumption in the MED unit.
The results obtained can be compared with other RED-HE works published in the literature. In particular, Long et al. [35], using NaCl-water and a membrane distillation unit as regeneration stage, reached a maximum thermal efficiency of 1.2%. Bevacqua et al. [28], with a stripping column and ammonium bicarbonate as working fluid, achieved also 1.2% (2.3% with enhanced membrane properties). Finally, Hu et al. [36] obtained a maximum thermal efficiency of 1.01% with a RED-MED HE, working NaCl-water with a 3.75 mol·kg-1 (high concentrated inlet solution), 10 MED effects and using hot water at 95 °C as external heat source. Compared to those results, in this work, the analysis performed with current membrane properties predicts a thermal efficiency of 1.4%, using waste heat at 100 °C, inlet concentrations and velocities of 3.5–0.01 M and 0.5–1 cm/s, and 28 MED effects. The perspective analysis using high-performing membranes, 4.5–0.05 M, 0.5–0.7 cm/s and 22 MED effects reports a value of the thermal efficiency of 6.6% (exergy efficiency of 31%), thus proving the higher potential of waste heat to electricity conversion of the RED-MED system with respect to other thermal regeneration options.

3.4. Overview of the Effects of Ideal Membranes on the System Performance

To summarise the qualitative effects of changing the membrane properties on the performance of RED, MED and integrated RED-MED HE, reader can refer to Table 3. In particular, the RED unit performance is largely enhanced by decreasing the membrane resistance and increasing permselectivity, while a smaller improvement is observed by the reduction of the water flux and salt diffusivity. A reduction of these latter terms affects the outlet solution concentrations by lowering the salinity gradient consumption in the RED unit. Thus, in this case, also the MED consumption is marginally reduced. At the contrary, the reduction of resistance and the increase of permselectivity increase the electrical current and salt flux in the RED unit, thus leading to a small increase of the MED consumption. However, on overall, the increase of permselectivity and the reduction of the resistance significantly enhance the global efficiency, while water permeation and salt diffusion have a smaller detrimental effect on the process. It is worth noting that the membrane properties weakly affect the MED performance due to the presence of mixer 1, which practically equalizes the MED inlet concentration.

4. Conclusions and Future Perspectives

This paper presents a parametric analysis on a close-loop salinity gradient heat engine powered by waste heat, adopting a reverse electrodialysis unit for power generation and a multi effect distillation unit for the regeneration of solutions. The electric power generated and the thermal energy consumption were evaluated as function of several operational parameters, such as the concentration and velocity of the solutions entering the RED unit. The regeneration process performance was analyzed with regards to the specific thermal consumption, for a variable number of effects, different values of the recovery ratio, concentration, and waste heat temperatures. To this end, mathematical models for the RED stack and MED unit were developed and coupled. Following the sensitivity analysis, we found that the total energy required for the complete closed-loop SGP-HE process increases with the concentration decrease in the RED dilute feed and with the concentration increase in the high salinity feed, while the same conditions tend to increase the RED power generation. On the other side, the maximum value of exergy and thermal efficiencies (6.7% and 1.4%, respectively) was observed for the lowest investigated concentration of the dilute solution (0.01 M), an intermediate concentration of the high salinity solution (3.5 M), velocities of the dilute and concentrated solutions of 1 and 0.5 cm/s (the lowest investigated), respectively, and 28 MED effects.
Membrane properties and geometrical arrangement of the RED unit play a key role in determining the performance of the system. In particular, assuming novel and optimised membrane properties (as a perspective analysis looking at technological improvements in IEMs), the maximum power density reached can be up to three times higher (~14 W/m2) than in the current case (~4 W/m2). With such improvements in the RED performance, the exergy and thermal efficiencies can reach values up to 31% and 6.6%, respectively, (4.5–0.05 M, 0.5–0.7 cm/s, and 22 MED effects), which is a considerable achievement, given the rigorous approach adopted to determine it (no extreme assumptions were done, contrarily to what often reported in the literature for similar analysis).
Further research will be carried out focusing on the minimisation of the identified exergy losses of the process considering novel and better performing hybrid schemes, but also new alternatives for the working fluid, which has to combine thermo-physical properties [58] and ion-transport properties [59,60], making it more suitable for effective RED power generation and easy separation/regeneration of feed solutions.

Supplementary Materials

The following are available online at https://www.mdpi.com/1996-1073/11/12/3385/s1, Table S1.1 Relevant equations for the low-hierarchy RED model; Table S1.2 Relevant equations for the high-hierarchy RED model; Table S1.3 Brief resume of MED-FF model; Figure S2.1 Variation of the boiling point elevation of NaCl with salt concentration for different equilibrium vapor temperatures, Table S3.1 Parameters of the fitting equations for the specific thermal consumption and number of effects of the MED unit, Figure S2.2 Comparison between the MED model predictions and correlation for STC and Neffect for the case of waste heat available at 100 °C.

Author Contributions

Conceptualization, A.C. and G.Z.; methodology, P.P., M.M., B.O.-D., F.G., A.C., A.T. and G.M.; software, P.P., M.M., B.O.-D. and F.G.; validation, P.P, M.M., B.O.-D. and F.G.; formal analysis, P.P., M.M., B.O.-D., F.G.; investigation, P.P., M.M., B.O.-D. and F.G.; resources, G.Z., D.-C.A.-P., A.C. and G.M.; writing—original draft preparation, P.P., M.M., B.O.-D. and F.G.; writing—review and editing, P.P., M.M., B.O.-D., F.G., G.Z., D.-C.A.-P., A.C., A.T. and G.M.; visualization, P.P., M.M., B.O.-D. and F.G.; supervision, G.Z., D.-C.A.-P., A.C., A.T. and G.M.; project administration, A.C. and G.M.; funding acquisition, P.P., G.Z., D.-C.A.-P., A.C., G.M.

Funding

This research was funded by Horizon 2020 Framework Programme, grant number 640667 (RED-Heat-to-Power project).

Acknowledgments

The authors would like to acknowledge also FUJIFILM Manufacturing Europe B.V. for providing information on the properties of current and perspective ion exchange membranes for RED.

Conflicts of Interest

The authors declare no conflict of interest. The funders had no role in the design of the study; in the collection, analyses, or interpretation of data; in the writing of the manuscript, or in the decision to publish the results.

Nomenclature

A area, m2
b membrane width, m
C molar concentration, mol/m3
D s diffusion coefficient, m2/s
c ¯ p average specific heat at constant pressure, J/(kg·°C)
E voltage, V
E ˙ exergy rate, kW
F Faraday constant, C/mol
G ˙ Gibbs free energy rate, kW
H height, m
h specific enthalpy, kJ/kg
I electric current, A
J trans-membrane flux, m3/(m2·s)
j ionic current density, A/m2
L P water permeability coefficient, m/(Pa⋅s)
m ˙ mass flow rate, kg/s
m molality, mol/kg
M molarity, mol/L or molar mass, g/mol
N number of effects of the MED unit or number of cell pairs
n ˙ molar flow rate, mol/s
n h total hydration number
p pressure, bar
P power, W
Q volumetric flow rate, m3/s
R electrical resistance, Ω⋅cm2
R u universal gas constant, J/(mol·K)
s f spacer shadow factor
T   o r   t temperature, °C or K
U overall heat transfer coefficient, W/(m2·K)
v velocity, cm/s
W specific work, kJ/kg
W ˙ e electric power, MW
X salinity, ppm
Y yield
Subscripts
a m b ambient
a n anode
a v average
B brine
C Carnot or condensation
c a t cathode
c o n c concentrate
c o n d condensation
c o u l coulombic
c w cooling water
d density
D distillate
d i f f diffusive
d i l dilute
e evaporator
e o s electro-osmotic
e x exergy
e x t external
F feed
F B flash box
F E flash in the effect
H high
i n inlet
L low
o s m osmotic
p r e h preheater
Q heat
s heating steam
s a t saturation
s o l solution
T total
V vapor
w h waste heat
Superscripts
ccondenser
vapor/condensate conditions after the demister
vapor/condensate conditions in the flash box
Greek
α permselectivity or fraction of vapor condensed in a preheater
γ activity coefficient
δ thickness of the spacer, m
η efficiency
θ polarization coefficient
λ specific enthalpy of evaporation/condensation, kJ/kg
Λ equivalent conductance, S·cm2/mol
μ chemical potential, kJ/mol
ν Van’t Hoff factor
Π osmotic pressure, bar
ρ density, kg/m3
φ osmotic coefficient
Acronyms and abbreviations
AEMAnion Exchange Membrane
BPEBoiling Point Elevation
CCCarbon carrier Cycle
CEMCation Exchange Membrane
EESEngineering Equation Solver
FFForward Feed
IEMIon Exchange Membrane
KCKalina Cycle
LMTDLog Mean Temperature Difference
MEDMulti-Effect Distillation
ORCOrganic Rankine Cycle
PGPiezoelectric Generator
REDReverse ElectroDialysis
RRRecovery Ratio
SEStirling Engine
SG-HESalinity Gradient Heat Engine
SGPSalinity Gradient Power
SRCSteam Rankine Cycle
STCSpecific Thermal Consumption
TEGThermo Electric Generation
TPCThermal Power Consumption

References

  1. Nguyen, T.Q.; Slawnwhite, J.D.; Boulama, K.G. Power generation from residual industrial heat. Energy Convers. Manag. 2010, 51, 2220–2229. [Google Scholar] [CrossRef]
  2. Khatita, M.A.; Ahmed, T.S.; Ashour, F.H.; Ismail, I.M. Power generation using waste heat recovery by organic Rankine cycle in oil and gas sector in Egypt: A case study. Energy 2014, 64, 462–472. [Google Scholar] [CrossRef]
  3. Johnson, I.; Choate, W.T.; Davidson, A. Waste Heat Recovery. Technology and Opportunities in U.S. Industry; U.S. Department of Energy, Office of Energy Efficiency and Renewable Energy: Washington, DC, USA, 2008.
  4. Kermani, M.; Wallerand, A.S.; Kantor, I.D.; Maréchal, F. Generic superstructure synthesis of organic Rankine cycles for waste heat recovery in industrial processes. Appl. Energy 2018, 212, 1203–1225. [Google Scholar] [CrossRef]
  5. Bendig, M.; Maréchal, F.; Favrat, D. Defining “Waste Heat” for industrial processes. Appl. Therm. Eng. 2013, 61, 134–142. [Google Scholar] [CrossRef]
  6. Wallerand, A.S.; Kermani, M.; Kantor, I.; Maréchal, F. Optimal heat pump integration in industrial processes. Appl. Energy 2018, 219, 68–92. [Google Scholar] [CrossRef] [Green Version]
  7. Karellas, S.; Leontaritis, A.-D.; Panousis, G.; Bellos, E.; Kakaras, E. Energetic and exergetic analysis of waste heat recovery systems in the cement industry. Energy 2013, 58, 147–156. [Google Scholar] [CrossRef]
  8. Wang, J.; Yan, Z.; Wang, M.; Ma, S.; Dai, Y. Thermodynamic analysis and optimization of an (organic Rankine cycle) ORC using low grade heat source. Energy 2013, 49, 356–365. [Google Scholar] [CrossRef]
  9. Wang, Y.; Tang, Q.; Wang, M.; Feng, X. Thermodynamic performance comparison between ORC and Kalina cycles for multi-stream waste heat recovery. Energy Convers. Manag. 2017, 143, 482–492. [Google Scholar] [CrossRef]
  10. Jung, H.C.; Krumdieck, S.; Vranjes, T. Feasibility assessment of refinery waste heat-to-power conversion using an organic Rankine cycle. Energy Convers. Manag. 2014, 77, 396–407. [Google Scholar] [CrossRef]
  11. Kaşka, Ö. Energy and exergy analysis of an organic Rankine for power generation from waste heat recovery in steel industry. Energy Convers. Manag. 2014, 77, 108–117. [Google Scholar] [CrossRef]
  12. Uusitalo, A.; Honkatukia, J.; Turunen-Saaresti, T. Evaluation of a small-scale waste heat recovery organic Rankine cycle. Appl. Energy 2017, 192, 146–158. [Google Scholar] [CrossRef]
  13. He, W.; Wang, S.; Yue, L. High net power output analysis with changes in exhaust temperature in a thermoelectric generator system. Appl. Energy 2017, 196, 259–267. [Google Scholar] [CrossRef]
  14. Tavakolpour-Saleh, A.R.; Zare, S.; Bahreman, H. A novel active free piston Stirling engine: Modeling, development, and experiment. Appl. Energy 2017, 199, 400–415. [Google Scholar] [CrossRef]
  15. Yip, N.Y.; Brogioli, D.; Hamelers, H.V.M.; Nijmeijer, K. Salinity Gradients for Sustainable Energy: Primer, Progress, and Prospects. Environ. Sci. Technol. 2016, 50, 12072–12094. [Google Scholar] [CrossRef] [PubMed]
  16. Post, J.W.; Veerman, J.; Hamelers, H.V.M.; Euverink, G.J.W.; Metz, S.J.; Nymeijer, K.; Buisman, C.J.N. Salinity-gradient power: Evaluation of pressure-retarded osmosis and reverse electrodialysis. J. Memb. Sci. 2007, 288, 218–230. [Google Scholar] [CrossRef] [Green Version]
  17. Logan, B.E.; Elimelech, M.; States, U. Membrane-based processes for sustainable power generation using water. Nature 2012, 488, 313–319. [Google Scholar] [CrossRef]
  18. Yip, N.Y.; Elimelech, M. Comparison of Energy Efficiency and Power Density in Pressure Retarded Osmosis and Reverse Electrodialysis. Environ. Sci. Technol. 2014, 48, 11002–11012. [Google Scholar] [CrossRef] [PubMed]
  19. Hong, J.G.; Zhang, W.; Luo, J.; Chen, Y. Modeling of power generation from the mixing of simulated saline and freshwater with a reverse electrodialysis system: The effect of monovalent and multivalent ions. Appl. Energy 2013, 110, 244–251. [Google Scholar] [CrossRef]
  20. Farrell, E.; Hassan, M.I.; Tufa, R.A.; Tuomiranta, A.; Avci, A.H.; Politano, A.; Curcio, E.; Arafat, H.A. Reverse electrodialysis powered greenhouse concept for water- and energy-self-sufficient agriculture. Appl. Energy 2017, 187, 390–409. [Google Scholar] [CrossRef]
  21. Tamburini, A.; Cipollina, A.; Papapetrou, M.; Piacentino, A.; Micale, G. Salinity gradient engines. In Sustainable Energy from Salinity Gradient; Cipollina, A., Micale, G., Eds.; Woodhead Publishing: Cambridge, UK, 2016; pp. 219–256. [Google Scholar]
  22. Achilli, A.; Cath, T.Y.; Childress, A.E. Power generation with pressure retarded osmosis: An experimental and theoretical investigation. J. Memb. Sci. 2009, 343, 42–52. [Google Scholar] [CrossRef]
  23. Altaee, A.; Palenzuela, P.; Zaragoza, G.; AlAnezi, A.A. Single and dual stage closed-loop pressure retarded osmosis for power generation: Feasibility and performance. Appl. Energy 2017, 191, 328–345. [Google Scholar] [CrossRef]
  24. Długołecki, P.; Gambier, A.; Nijmeijr, K.; Wessling, M. Practical Potential of Reverse Electrodialysis as Process for Sustainable Energy Generation. Environ. Sci. Technol. 2009, 43, 6888–6894. [Google Scholar] [CrossRef] [PubMed]
  25. Vermaas, D.A.; Guler, E.; Saakes, M.; Nijmeijer, K. Theoretical power density from salinity gradients using reverse electrodialysis. Energy Procedia 2012, 20, 170–184. [Google Scholar] [CrossRef]
  26. Conversion of Low Grade Heat to Power through closed loop Reverse ElectroDialysis—Horizon 2020 programme, Project Number: 640667. Available online: www.red-heat-to-power.eu (accessed on 4 September 2018).
  27. McGinnis, R.L.; McCutcheon, J.R.; Elimelech, M. A novel ammonia-carbon dioxide osmotic heat engine for power generation. J. Memb. Sci. 2007, 305, 13–19. [Google Scholar] [CrossRef]
  28. Bevacqua, M.; Tamburini, A.; Papapetrou, M.; Cipollina, A.; Micale, G.; Piacentino, A. Reverse electrodialysis with NH4HCO3-water systems for heat-to-power conversion. Energy 2017, 137, 1293–1307. [Google Scholar] [CrossRef]
  29. Tamburini, A.; Tedesco, M.; Cipollina, A.; Micale, G.; Ciofalo, M.; Papapetrou, M.; Van Baak, W.; Piacentino, A. Reverse electrodialysis heat engine for sustainable power production. Appl. Energy 2017, 206, 1334–1353. [Google Scholar] [CrossRef]
  30. Cipollina, A.; Micale, G.; Rizzuti, L. Seawater Desalination: Conventional and Renewable Energy Processes; Springer: Berlin, Germany, 2009. [Google Scholar]
  31. Ortega-Delgado, B.; Palenzuela, P.; Alarcón-Padilla, D.-C. Parametric study of a multi-effect distillation plant with thermal vapor compression for its integration into a Rankine cycle power block. Desalination 2016, 394, 18–29. [Google Scholar] [CrossRef]
  32. Alkhudhiri, A.; Darwish, N.; Hilal, N. Membrane distillation: A comprehensive review. Desalination 2012, 287, 2–18. [Google Scholar] [CrossRef]
  33. Cipollina, A.; Di Sparti, M.G.; Tamburini, A.; Micale, G. Development of a Membrane Distillation module for solar energy seawater desalination. Chem. Eng. Res. Des. 2012, 90, 2101–2121. [Google Scholar] [CrossRef]
  34. Ali, A.; Tufa, R.A.; Macedonio, F.; Curcio, E.; Drioli, E. Membrane technology in renewable-energy-driven desalination. Renew. Sustain. Energy Rev. 2018, 81, 1–21. [Google Scholar] [CrossRef]
  35. Long, R.; Li, B.; Liu, Z.; Liu, W. Hybrid membrane distillation-reverse electrodialysis electricity generation system to harvest low-grade thermal energy. J. Memb. Sci. 2017, 525, 107–115. [Google Scholar] [CrossRef]
  36. Hu, J.; Xu, S.; Wu, X.; Wu, D.; Jin, D.; Wang, P.; Leng, Q. Theoretical simulation and evaluation for the performance of the hybrid multi-effect distillation—reverse electrodialysis power generation system. Desalination 2018, 443, 172–183. [Google Scholar] [CrossRef]
  37. Palenzuela, P.; Zaragoza, G.; Alarcón-Padilla, D.C. Characterisation of the coupling of multi-effect distillation plants toconcentrating solar power plants. Energy 2015, 82, 986–995. [Google Scholar] [CrossRef]
  38. Tedesco, M.; Cipollina, A.; Tamburini, A.; van Baak, W.; Micale, G. Modelling the Reverse ElectroDialysis process with seawater and concentrated brines. Desalin. Water Treat. 2012, 49, 404–424. [Google Scholar] [CrossRef] [Green Version]
  39. Veerman, J.; Saakes, M.; Metz, S.J.; Harmsen, G.J. Reverse electrodialysis: A validated process model for design and optimization. Chem. Eng. J. 2011, 166, 256–268. [Google Scholar] [CrossRef]
  40. Post, J.W.; Goeting, C.H.; Valk, J.; Goinga, S.; Veerman, J.; Hamelers, H.V.M.; Hack, P.J.F.M. Towards implementation of reverse electrodialysis for power generation from salinity gradients. Desalin. Water Treat. 2010, 16, 182–193. [Google Scholar] [CrossRef] [Green Version]
  41. Tedesco, M.; Cipollina, A.; Tamburini, A.; Bogle, I.D.L.; Micale, G. A simulation tool for analysis and design of reverse electrodialysis using concentrated brines. Chem. Eng. Res. Des. 2015, 93, 441–456. [Google Scholar] [CrossRef] [Green Version]
  42. Hong, J.G.; Zhang, B.; Glabman, S.; Uzal, N.; Dou, X.; Zhang, H.; Wei, X.; Chen, Y. Potential ion exchange membranes and system performance in reverse electrodialysis for power generation: A review. J. Memb. Sci. 2015, 486, 71–88. [Google Scholar] [CrossRef]
  43. Yaroslavtsev, A.B.; Nikonenko, V.V. Ion-exchange membrane materials: Properties, modification, and practical application. Nanotechnologies Russ. 2009, 4, 137–159. [Google Scholar] [CrossRef]
  44. Scialdone, O.; Guarisco, C.; Grispo, S.; Angelo, A.D.; Galia, A. Investigation of electrode material—Redox couple systems for reverse electrodialysis processes. Part I: Iron redox couples. J. Electroanal. Chem. 2012, 681, 66–75. [Google Scholar] [CrossRef]
  45. Giacalone, F.; Catrini, P.; Tamburini, A.; Cipollina, A.; Piacentino, A.; Micale, G. Exergy analysis of reverse electrodialysis. Energy Convers. Manag. 2018, 164, 588–602. [Google Scholar] [CrossRef]
  46. Pitzer, K.S. Thermodynamics of Electrolytes. I. Theoretical Basis and General Equations. J. Phys. Chem. 1973, 77, 268–277. [Google Scholar] [CrossRef]
  47. Van Der Stegen, J.H.G.; Weerdenburg, H.; Van Der Veen, A.J.; Hogendoorn, J.A.; Versteeg, G.F. Application of the Pitzer model for the estimation of activity coefficients of electrolytes in ion selective membranes. Fluid Phase Equilib. 1999, 157, 181–196. [Google Scholar] [CrossRef] [Green Version]
  48. Pitzer, K.S. Electrolyte Theory-Improvements since Debye and Huckel. Acc. Chem. Res. 1977, 10, 371–377. [Google Scholar] [CrossRef]
  49. Jones, G.; Bickford, C.F. The Conductance of Aqueous Solutions as a Function of the Concentration. I. Potassium Bromide and Lanthanum Chloride. J. Am. Chem. Soc. 1934, 56, 602–611. [Google Scholar] [CrossRef]
  50. Veerman, J.; Post, J.W.; Saakes, M.; Metz, S.J.; Harmsen, G.J. Reducing power losses caused by ionic shortcut currents in reverse electrodialysis stacks by a validated model. J. Memb. Sci. 2008, 310, 418–430. [Google Scholar] [CrossRef] [Green Version]
  51. Palenzuela, P.; Hassan, A.S.; Zaragoza, G.; Alarcón-Padilla, D.-C. Steady state model for multi-effect distillation case study: Plataforma Solar de Almería MED pilot plant. Desalination 2014, 337, 31–42. [Google Scholar] [CrossRef]
  52. El-Dessouky, H.T.; Ettouney, H.M. Fundamentals of Salt Water Desalination; Elsevier: Amsterdam, The Netherlands, 2002. [Google Scholar]
  53. Alasfour, F.N.; Darwish, M.A.; Bin Amer, A.O. Thermal analysis of ME—TVC+MEE desalination systems. Desalination 2005, 174, 39–61. [Google Scholar] [CrossRef]
  54. Al-Mutaz, I.S.; Wazeer, I. Development of a steady-state mathematical model for MEE-TVC desalination plants. Desalination 2014, 351, 9–18. [Google Scholar] [CrossRef]
  55. Ortega-Delgado, B.; García-Rodríguez, L.; Alarcón-Padilla, D.-C. Opportunities of improvement of the MED seawater desalination process by pretreatments allowing high-temperature operation. Desalin. Water Treat. 2017, 97. [Google Scholar] [CrossRef]
  56. Klein, S.A. Engineering Equation Solver Software (EES); F-Chart Software: Madison, WI, USA, 2013. [Google Scholar]
  57. Kingsbury, R.S.; Liu, F.; Zhu, S.; Boggs, C.; Armstrong, M.D.; Call, D.F.; Coronell, O. Impact of natural organic matter and inorganic solutes on energy recovery from five real salinity gradients using reverse electrodialysis. J. Memb. Sci. 2017, 541, 621–632. [Google Scholar] [CrossRef]
  58. Giacalone, F.; Olkis, C.; Santori, G.; Cipollina, A.; Brandani, S.; Micale, G. Novel solutions for closed-loop reverse electrodialysis: Thermodynamic characterisation and perspective analysis. Energy 2019, 166, 674–689. [Google Scholar] [CrossRef]
  59. Micari, M.; Bevacqua, M.; Cipollina, A.; Tamburini, A.; Van Baak, W.; Putts, T.; Micale, G. Effect of different aqueous solutions of pure salts and salt mixtures in reverse electrodialysis systems for closed-loop applications. J. Memb. Sci. 2018, 551, 315–325. [Google Scholar] [CrossRef] [Green Version]
  60. Zhu, S.; Kingsbury, R.S.; Call, D.F.; Coronell, O. Impact of solution composition on the resistance of ion exchange membranes. J. Memb. Sci. 2018, 554, 39–47. [Google Scholar] [CrossRef]
Figure 1. Exergy efficiency range for various thermodynamic cycles as function of the heat source temperature. On the secondary x -axis the Carnot efficiency corresponding to the Thot is shown (considering a constant Tcold = 25 °C). The grey circles correspond to technologies still under development [21]. (KC: Kalina Cycle, ORC: Organic Rankine Cycle, TEG: Thermoelectric Generator cycle, PEPG: piezoelectric power generation with waste heat-powered expansion/compression cycle, SRC-hot gases: Steam Rankine Cycle integrated with gas turbine/other topping cycles, CC: Carbon Carrier cycle, SRC-fuel: Steam Rankine Cycle directly fueled by oil, coal or other fuels).
Energies 11 03385 g001
Figure 2. Reverse Electrodialysis (RED)-heat engine scheme: RED coupled with a solvent extraction technology.
Energies 11 03385 g002
Figure 3. Schematic representation of the cell pair in the RED stack adapted from [45].
Energies 11 03385 g003
Figure 4. Equivalent electric circuit of the RED unit.
Energies 11 03385 g004
Figure 5. Scheme of the Forward-Feed Multi-Effect Distillation (MED) regeneration plant.
Energies 11 03385 g005
Figure 6. Process flow diagram of the RED-MED coupled system.
Energies 11 03385 g006
Figure 7. Effect of the feeds inlet concentration on the power density P d , m a x [W/m2] for the case of RED stack with 50 cell pairs, v L = v H = 1 cm/s, counter-current arrangement, and membrane area of (a) 0.1 × 0.1 m2 and (b) 0.1 × 0.88 m2; (c) Effect of the feeds inlet velocity for the case of RED stack with 50 cell pairs, C L = 4.5 M and C H = 0.01 M, counter-current arrangement, and membrane area of 0.1 × 0.88 m2.
Energies 11 03385 g007
Figure 8. Effect of the feeds inlet concentration on Yield [%] for the case of RED stack with 50 cell pairs, v H = v L = 1 cm/s, counter-current arrangement, and membrane area of (a) 0.1 × 0.1 m2 and (b) 0.1 × 0.88 m2; (c) Effect of feeds inlet velocity for the case of RED stack with 50 cell pairs, C H = 4.5 M and C L = 0.01 M, counter-current arrangement, and membrane area of 0.1 × 0.88 m2.
Energies 11 03385 g008
Figure 9. Dependence of power density on (a) feeds inlet concentration with fixed inlet solutions velocity ( v L = v H = 1 cm/s); (b) feeds inlet velocity with fixed inlet solutions concentration ( C L = 0.05 M and C H = 4.5 M). RED stack of 50 cp, with a membrane area of 0.1 × 0.88 m2, counter-current arrangement, ideal membranes.
Energies 11 03385 g009
Figure 10. Variation of the specific thermal consumption with the recovery ratio at different inlet concentrations with a heat source at 60 °C.
Energies 11 03385 g010
Figure 11. Variation of the specific thermal consumption with the recovery ratio at different inlet concentrations with a heat source at 80 °C.
Energies 11 03385 g011
Figure 12. Variation of the specific thermal consumption with the recovery ratio at different inlet concentrations with a heat source at 100 °C.
Energies 11 03385 g012
Figure 13. Effect of inlet solutions concentration on (a) the thermal power consumption [W] of the MED unit, and on (b) exergy efficiency of RED-MED Closed loop. RED stack: 50 cell pairs, membrane area of 0.1 × 0.88 m2, counter-current arrangement, v H , i n = v L , i n = 1 cm/s. MED: T h o t = 100 °C, T c o l d = 20 °C, optimized number and area of the effects.
Energies 11 03385 g013
Figure 14. Effect of inlet solutions velocity on (a) the total thermal power consumption [W] of the MED unit, and on (b) exergy efficiency of the RED-MED system. RED stack: 50 cell pairs, membrane area of 0.1 × 0.88 m2, counter-current arrangement, C H , i n = 3.5 M and C L , i n = 0.01 M. MED: T h o t = 100 °C, T c o l d = 20 °C, optimized number and area of the effects.
Energies 11 03385 g014
Figure 15. Effect of inlet solutions concentration on (a) the thermal power consumption [W] of the MED unit, and on (b) exergy efficiency of the RED-MED system. RED stack: 50 cell pairs, ideal membranes, membrane area of 0.1 × 0.88 m2, counter-current arrangement, v H , i n = v L , i n = 1 cm/s. MED: T h o t = 100 °C, T c o l d = 20 °C, optimized number and area of the effects.
Energies 11 03385 g015
Figure 16. Effect of inlet solutions velocity on (a) thermal power consumption [W] of the MED unit, and on (b) exergy efficiency of the RED-MED system. RED stack: 50 cell pairs, ideal membranes, membrane area of 0.1 × 0.88 m2, counter-current arrangement, C H , i n = 4.5 M and C L , i n = 0.05 M. MED: T h o t = 100 °C, T c o l d = 20 °C, optimized number and area of the effects.
Energies 11 03385 g016
Table 1. Matrix of simulations performed to investigate MED process potential as regeneration stage.
M MED , in [mol/L]Recovery Ratio [%]
0.510152025304050607080
110152025304050607080
1.5101520253040506070
21015202530405060
2.510152025304050
3101520253040
3.51015202530
4101520
Table 2. Membrane properties adopted in the two scenarios current and ideal membranes [45].
ScenarioRCEM = RAEM [Ω⋅cm2]Lp [m⋅Pa−1⋅s−1]Ds [m2⋅s−1]α [%]
Current membrane1.5(c)2.22∙10−14(a,d)10−12(d)95–98(b)
Ideal membrane¼⋅RIEM,current(d)0(d)0(d)100(d)
(a) Experimental values measured @ ref. conditions: T = 25 °C, CH,in = 3 M CL,in = 0.05 M. (b) Experimental values measured @ ref. conditions: T = 25 °C, CH,in = 0.5 M CL,in = 0.05 M. (c) Experimental values measured @ ref. conditions: T = 25 °C, Csol = 2 M. (d) Assumed constant in the whole range of concentration.
Table 3. Qualitative effect of membrane properties on the performance of RED, MED and RED-MED-HE.
IEM PropertiesRED PowerCRED,H,outCRED,L,outMED STCGlobal Efficiency
Resistance (RCEM = RAEM)↑↑↑↑↑↑↑↑↑↑
Permselectivity (α)↑↑↑↑↑↑
Water permeability ( L p )↑↑↑↑↑↑↑
Salt diffusivity ( D s )

