Article

Estimating the Economic Impacts of Net Metering Schemes for Residential PV Systems with Profiling of Power Demand, Generation, and Market Prices

Institute of Power Engineering, Riga Technical University (RTU), LV-1658 Riga, Latvia
*
Authors to whom correspondence should be addressed.
Energies 2018, 11(11), 3222; https://doi.org/10.3390/en11113222
Submission received: 29 October 2018 / Revised: 12 November 2018 / Accepted: 16 November 2018 / Published: 20 November 2018
(This article belongs to the Special Issue Solar and Wind Energy Forecasting)

Abstract

:
This article analyses the influence of supporting scheme variants on the profitability of a projected investment of residential photovoltaic systems. The focus of the paper lies in evaluating the feasibility for the power system of solar power generation technologies to achieve a balance between energy generation and support costs in a more efficient way. The case study is based on a year-long time series of examples with an hourly resolution of electricity prices from the Nord Pool power market, in addition to the power demand and solar generation of Latvian prosumers. Electric energy generation and the consumption of big data from more than 100 clients were collected. Based on these data, we predict the processes for the next 25 years, and we estimate economic indicators using a detailed description of the net metering billing system and the Monte-Carlo method. A recommendation to change the current net system to a superior one, taking into account the market cost of energy, concludes the paper.

1. Introduction

The problems of climate change have motivated the development of renewable energy applications in power supply. In recent years, there has been a rapid increase in the use of renewable energy. In the foreseeable future, utilisation of renewable sources will be able to produce most of the world’s electricity, significantly reducing greenhouse gas emissions [1,2,3]. In the process of the accelerated introduction of renewable energy sources, an important role belongs to solar power generation [4,5], particularly, to distributed, small-scale generators based on photovoltaic (PV) technology [6,7]. Distributed renewable energy sources can result in a number of benefits for both customers and the whole energy system. Particularly, the grid peak demand for electricity and the system losses can be reduced [8]. Small-scale power sources can make a significant contribution towards financing the development of power systems. The rapid increase in the capacity of renewable sources is facilitated by advances in technology development and the political decisions taken by many countries including Latvia to fund renewable energy [9]. In particular, the development of technologies and governmental support are facilitating the dissemination of distributed small-scale power sources that are connected to low- or medium-voltage distribution networks [10]. Customers of electricity that have installed energy sources at their households are transformed into prosumers [11].
The increase in the number of prosumers can only be ensured under the condition that the investment in generation pays off within some acceptable period. The payback period depends on a number of factors and the specific conditions of use [12]. In the case of using solar energy, the most important influencing factors include the level of solar irradiation, the volume of investment required, the rules for selling and buying energy, the availability, and the volume of support for green energy [6]. The support scheme and rules of energy trading are chosen by government agencies and are based on the economic capabilities of each country [10]. The rules of energy trading have a solid impact on the financial performance of PV systems. Retail tariffs should be considered by policymakers in evaluating the strategy of PV deployment [12].
Different countries use diverse schemes of support for prosumers. The most frequently used schemes are the feed-in tariff (FiT), investment supports (IS), and the net metering system (NS) [13]. A FiT scheme provides a premium price to the prosumer and obliges the grid operators to purchase the generated electricity output [10]. The application of the FiT and IS schemes has aided the distribution of a large number of renewable energy sources (RES). An overview of the FiT supporting schemes is provided in [13,14,15,16,17,18]. The FiT and the IS can ensure a rapid spread of renewable energy but ultimately lead to an increase in the cost of the bills for end users [19]. The NS is an electricity policy which allows energy prosumers to balance their electricity usage with electricity produced by themselves. The variability and inconsistency of the energy generation and consumption schedules lead to a need for energy exchange between the consumer and the electric grid [20,21,22]. The NS system establishes rules for the exchange of energy between the electric grid and the consumer and the formation of payments for using it. Diverse methods of paying for the energy given or taken are used in the formation of bills [1]. A common feature for different systems is that they each ensure the possibility of supplying energy from the consumer to the grid at times when generation exceeds consumption and returning it in the opposite case. The methods used by the NS are distinguished based on the way of paying for the energy given or taken in the formation of bills. In European countries, two main groups of NS variants are used [1].
The first group is based on taking into account the energy exchange between the electric grid and the prosumer (net accounting system (NAS)). The NAS does not respect the production/consumption time and market value of the energy produced or consumed. The NAS [16], which is currently in place in many countries, disregards the prices of the submitted and received energy [23]. The energy surplus is measured in units of energy (kWh), and when electricity production exceeds consumption, it is submitted to the network; otherwise, it can be returned from the network.
The second group takes into account not only the amount of energy but also its cost [19] (a net billing system (NBS)). In this case, a new, more sophisticated payment scheme should be used. This is based on the treatment of the variable cost of energy depending on the actual wholesale market price of electricity. The cost of energy forms the basis for mutual settlements between the electric grid and the prosumer [1]. In the NBS case of grid debt, the market price of the submitted and received energy is considered [1,16]. The grid’s debt is expressed in monetary terms. The prosumer is motivated to submit energy at time periods when the prices are high and to consume it when the prices are as low as possible, receiving an energy amount that is larger than the submitted amount [14]. Such an NBS system has significant advantages; however, it not only requires more complex measurements but also is more complex from the point of view of its effectiveness analysis, since it is strongly influenced by three random processes: the generation of energy, energy consumption, and energy market price.
In Latvia, renewable electricity generation is stimulated through a complex support system based on a FiT, which also includes elements of a quota system and tenders. The existing FiT is on hold until 1 January 2020 due to concerns about corruption and a lack of transparency in the way it has been implemented since 2007. The existing state support mechanisms for energy production from renewable energy sources (RES) are being assessed and revised. Stringent supervision of subsidized electricity producers, stricter controls, and a limited timeframe for the implementation of RES projects have been introduced. At the same time, a new tax for subsidized electricity producers was introduced in January 2014. The tax should be paid by companies receiving financial support for power generation from renewable energy sources or from combined heat and power plants. Since 1 January 2014 RES-E (Electricity from Renewable Energy Sources) is promoted also through net-metering. According to Energy Development Guidelines for 2016 to 2020, a new national support mechanism for electricity production from RES should be developed until 2018. Heating and cooling from renewable energy sources is promoted through different tax benefits. Access of renewable energy plants to the grid is subject to the general legislation on energy. Electricity from renewable sources is not given priority. Also, devices for heat production from renewable energy sources are not given priority connection, and there is no special legislation promoting the connection of RES heating devices to the heat transmission network at the national level [24,25]. In Latvia net metering applies to clients who are at the same time producers of electricity and are connected to the electricity grid through a connection with a throughput value smaller than or equal to 3*16A. Clients must apply for an offer from the responsible grid operator for injecting electricity to the grid. For small-scale clients, energy costs only apply to the net electricity consumption, defined as the difference between electricity obtained from and fed into the grid. Furthermore, clients are required to pay a grid use charge [26].
The main purpose of this study is to compare the cost-effectiveness of different options and to search for ways to accelerate the application of solar generators, to improve the methodology for evaluating the efficiency of technology utilisation, and to develop proposals for improving support schemes. To achieve these goals, we perform the following actions:
  • Make a brief overview of the support schemes in use.
  • Formulate the problem of maximising the profit of the prosumers and substantiate the algorithm for its resolution.
  • Solve the problem of estimating the influence of a large number of generators on the operation of the power system as a whole.
  • Based on the collected experimental data and the selected scenarios, demonstrate the possibility of increasing the profitability and number of prosumers.
The results of solving the above tasks can be useful both for decision-makers at the legislative level and for potential investors in the development of green energy. This article uses smart metering data collected in Latvia; however, we hope that the results and conclusions can also be utilised in other, primarily, Northern European, countries with low solar irradiation (the Netherlands, Belgium, Denmark, Lithuania, Latvia, Ireland, UK, Estonia, Sweden, Finland, and Iceland [1]). Solar resource and PV power potential maps and GIS data are available in [24,27]. These countries are close in terms of solar radiation but have significantly different power systems and capabilities for supporting renewable energy sources. The Latvian power system encompasses five large power plants [28] with a total installed capacity of 2569 MW. The remaining producers can be divided into the following groups [29]: small natural-gas-based combined heat and power plants—172 MW, wind power plants—71 MW, biogas power plants—66 MW, biomass power plants—58 MW, small hydropower plants—29 MW, and solar power plants—1.5 MW. In 2017, an annual balance between the generated and consumed electricity was roughly achieved in Latvia. At the same time, an active energy exchange is taking place with other participants of the Nord Pool market. The power system has a feature that is very important for further analysis: the combined heat and power plants and the plants using RES, except large hydropower plants and microgenerators, are supported by applying the FiT. Support of this kind is applied to almost half of all the energy generated and is included in the bills of all the consumers. The high level of the FiT in Latvia (approximately 35% of the bill for the end users [23]), is causing discontent among the public, which means that it is impossible to further increase the FiT. The NAS is applied to microgenerators [16]. As was previously mentioned, the FiT is not currently applied for supporting microgenerators.
Solar power plants represent the most widespread type of microgeneration. The total capacity of solar panels installed in Latvia is only 1500 kW (approximately 270 prosumers); the capacity installed at one household varies from 2.5 kW to 11 kW; the average capacity of the applications of the technology is 5.5 kW. The total annual amount of energy submitted to the grid is 1.38 GWh and the total annual amount received from the grid is 2.08 GWh. These data provide the conclusion that the influence of solar panels on the power system is very low since the installed capacities in question only amount to 0.05% of the total capacity of the power system; solar power can be used 1700–1900 hours a year [1]. With a 1 kW solar panel, an annual average of 900–1000 kWh of electricity can be generated [8]. It can be concluded that using solar power for electricity generation will only pay off with highly efficient technologies and capital investments as low as possible [29,30].
The problems of PV technology deployment in these countries are reflected in the scientific literature (a comprehensive review of this literature is given in the articles [13,30,31,32,33,34,35,36]. However, as far as we know, no assessment of the joint effect of load, solar activity, market price profiles, and the rules for the formation of consumers’ accounts on their financial efficiency has been conducted. This problem becomes particularly acute in the case of using smart metering data [23], making it necessary in this case to take into account not only the volume of generation and consumption but also the cost. To solve this problem, we use an algorithm based on the adoption of the hypothesis of stationarity of input processes, big data collected in Latvia, the long-term prediction of the realisation of processes, and a detailed billing model for the energy used. The structure of this algorithm, the results of its verification and application form the main contribution of this article.
The rest of the article is organised as follows: Section 2 describes the purposes of the research task and contains a brief description of the current legislation establishing the rules for energy trade. Also, it is devoted to the description of the methodology, models, and input information used. Section 3 reflects the results of the calculation of profitability, gas consumption and emission reduction rates. The last section is devoted to conclusions and a recommendation to change the current net system to a superior one, taking into account the market cost of energy.

2. Methodology and Models

2.1. The Methodology of Feasibility Studies

Usually, power system planning issues are formulated in the form of profit maximisation problems. For this purpose, designers use a number of economic criteria, such as the net present value of cash flow (NPV), internal rate of return, payback time, and levelised cost of energy (LCOE) [1,8,30]. In this paper, we limit ourselves to using only the NPV and the LCOE, while the generality of the feasibility studies task statement is not lost since the algorithm outlined below can be easily extended to compute other economic criteria as well. The NPV is given in [28] as:
  N P V ( i d ,   T p t ) = t = 1 T p t R t ( 1 + i d ) t ,  
where t—time of the cash flow, usually one year, Tpt—planning time of the PV technology in years (for example, Tpt = 25) [3], iddiscount rate (the rate of return that could be earned on an investment in financial markets with a similar risk; Rt—net cash flow, i.e., cash inflow and cash outflow at time, t, in . The cash flow within one year will not be discounted for NPV calculation purposes. Investments during the time interval from the initial design to power plant start-up are summed up with a negative cash flow [8,30]. The LCOE is calculated as follows:
   L C O E ( i p t , T p t ) = ( C i n v e s t + C c r e d ) + t = 1 T p t . C m o d , t ( 1 + i d ) t t = 1 T p t A t ( 1 + i d ) t ,  
where t—equipment planning year (1, 2,... Tpt), A,t—annual total amount of electricity generated (kWh/year), Ccred—the interest to be paid to the bank for the loan received, over the whole planning period (€); Cmod,t—annual costs (€/year), Cinvest—the prosumer’s investments in the purchase and installation of equipment (€).
In order to be able to apply Equation (1) and (2), it is necessary to evaluate the energy costs, which depend on the support scheme used. As has been mentioned, the schemes to be used are selected by government decisions. We also estimate the benefit of prosumers (annual bill savings, C s a v i n g s t (€)), which is defined as the difference between the cost of energy in the case when no PV technology is installed (( C b i l l _ n o P V t ) (€)) and the cost of energy using PV technology ( C b i l l _ P V t ) (€)). Thus, the benefit for the whole year is as follows:
  C s a v i n g s t = C b i l l _ n o P V t C b i l l _   P V t .  
Due to the fact that prosumers cannot make total conclusions on the basis of the NPV or the LCOE, we consider the payback period (PP) as well, which characterizes the year in which the cumulative savings exceed the investment costs of PV technology.

2.2. Evaluation of the Economic Benefit from Support Schemes

Consumers’ bills contain components paid to finance the operating costs of the power system:
  • The fixed volume (FV) component is based on the connection capacity (kVA);
  • The variable progressive (VP) component: in this component, the tariff per kWh increases along with an increasing measured consumption level;
  • The market component (MC) is equal to the day-ahead hourly price of the electricity market (for example, Nord Pool) [23,28].
This tariff is only possible with smart meters [23]. If the prosumer generates a smaller amount of electricity than it consumes (over a month), then, according to the NS, the prosumer’s bill contains the FV and the VP, which includes only payment for the difference between the amount of energy received from the grid and the amount of energy submitted to the grid. In the opposite case, when the prosumer consumes less than it has generated and has submitted more energy to the grid than it has received, then the resulting difference is regarded as the debt of the power system, which is included into the bills of the following months. The structural diagram of the algorithm for evaluating the annual expenses, Exp, is provided in Figure 1.
The algorithm uses the hourly (i) measurements of energy submitted to the grid, WG+, and received from the grid, WG, the hourly electricity price, C, and the hourly electricity consumption, WC (Block 1). For every prosumer, the grid forms an individual bill, which accounts the amounts of electricity submitted to the grid or received from the grid, Expstore, (Block 2) and the hourly MC payments are accumulated. If during a given hour, the generation amount exceeds consumption and the prosumer submits more electricity to the grid than it receives, it needs to additionally pay for only the FV component, EFV (Block 3). The annual expenses, Exp, increase by this amount. Otherwise, Expstore is checked. If Expstore exceeds the Expstore of the current month (in our case, the Expstore of the preceding hours), then, in some countries, the prosumer does not have to pay the VP component EVP at this hour; however, the prosumer always has to pay for the FV component and the MC for the electricity received, Cc+ (Block 4). Otherwise, the prosumer pays in the same way as in Block 4 or only pays for the total difference, EVP, of the VP component for the current hour, Expstore (Block 5). In the calculation, we assume that the prosumer pays the VP component, EVP. If Expstore is negative or equal to zero, the prosumer pays in full for the electricity received from the grid (as an ordinary consumer) (Block 6). Once a year, the process is started all over again [1].
To analyse the feasibility of a system which is described by Figure 1, Equation (1) and (2), the prediction and simulation of the random correlated processes of generation, electricity production, consumption, and market electricity pricing are required; however, such simulation creates considerable problems [37,38].

2.3. The Basic Tasks of the Study

The present article sets two basic tasks:
  • To evaluate the benefits received by the individual prosumer and the factors that influence them, as a result of equipping the household in question with PV.
  • To evaluate the influence of a sharp increase in the number of prosumers and their capacity on the power system and the other energy consumers.
As has been mentioned, the results of solving both of these tasks depend on a number of factors. In particular, it can be said that the benefits received by the individual prosumer depend on its energy utilisation schedule, which means that solving the first task requires an individual approach. This peculiarity makes the solution of the second task more complicated, since, even in the case of a small power system, several tens of thousands of prosumers need to be taken into account, all of them with individual generation and consumption schedules.
The goal of using RES is a set number of sub-goals. The sub-goals are decarbonisation, the augmentation of energy independence, and the diminishment of the gas import amount. The energy produced by prosumers equipped with PV technologies replaces other types of energy. Evaluating the conditions that characterise power supply in Latvia, it can be said that the prosumers will replace the energy that has been produced with natural gas by burning imported natural gas. Thus, an increase in the number of prosumers can ensure the following benefits:
  • A diminished dependence on gas imports;
  • A diminished amount of atmospheric emissions of CO2.
Depending on the prospective number of prosumers, let us evaluate the performance indicators of these prospective situations. Given the number of prosumers (Npros) and taking into account the direct consumption of the prosumers, we find the amount of electricity produced by the prosumers (Epros) (GWh/year):
  E p r o s = N p r o s · E p o s , a v g ,  
where E p r o s , a v g stands for the average amount of electricity produced by one prosumer, GWh/year (we assume a value of 5500 kWh). Given the amount of electricity produced by the prosumers and assuming that it replaces the electricity produced with natural gas, we find the amount of unburned gas ( G a p j ) (thousands of m3/year):
  G a p j = E p r o s k 1 · k 2 · Q g ,   
where k 1 stands for the efficiency of an electricity-generating unit (a value of 0.9 is assumed) and k 2 is the electricity generation coefficient. The calculations assume the value of 0.6, characteristic of the high-efficiency gas/steam technologies; Q g —the calorific value of natural gas (a value of 0.0105 MWh/m3 is assumed).
After determining the amount of unburned natural gas, using the assumed natural gas emission factor (Ef = 0.203) (t/MWh), we find the reduction of the emissions of CO2 into the atmosphere ( m s e g ) (t/year):
  m s e g = G a p j · Q g · E f .  
From Equations (4), (5), and (6), it can be determined what the contribution of PV to achieving the RES goals in Latvia would be to reach the average value of the PV utilisation level in the Nordic countries [1]. Reaching the average level of the Nordic countries regarding the utilisation of PV technologies is an ambitious, yet achievable, goal.

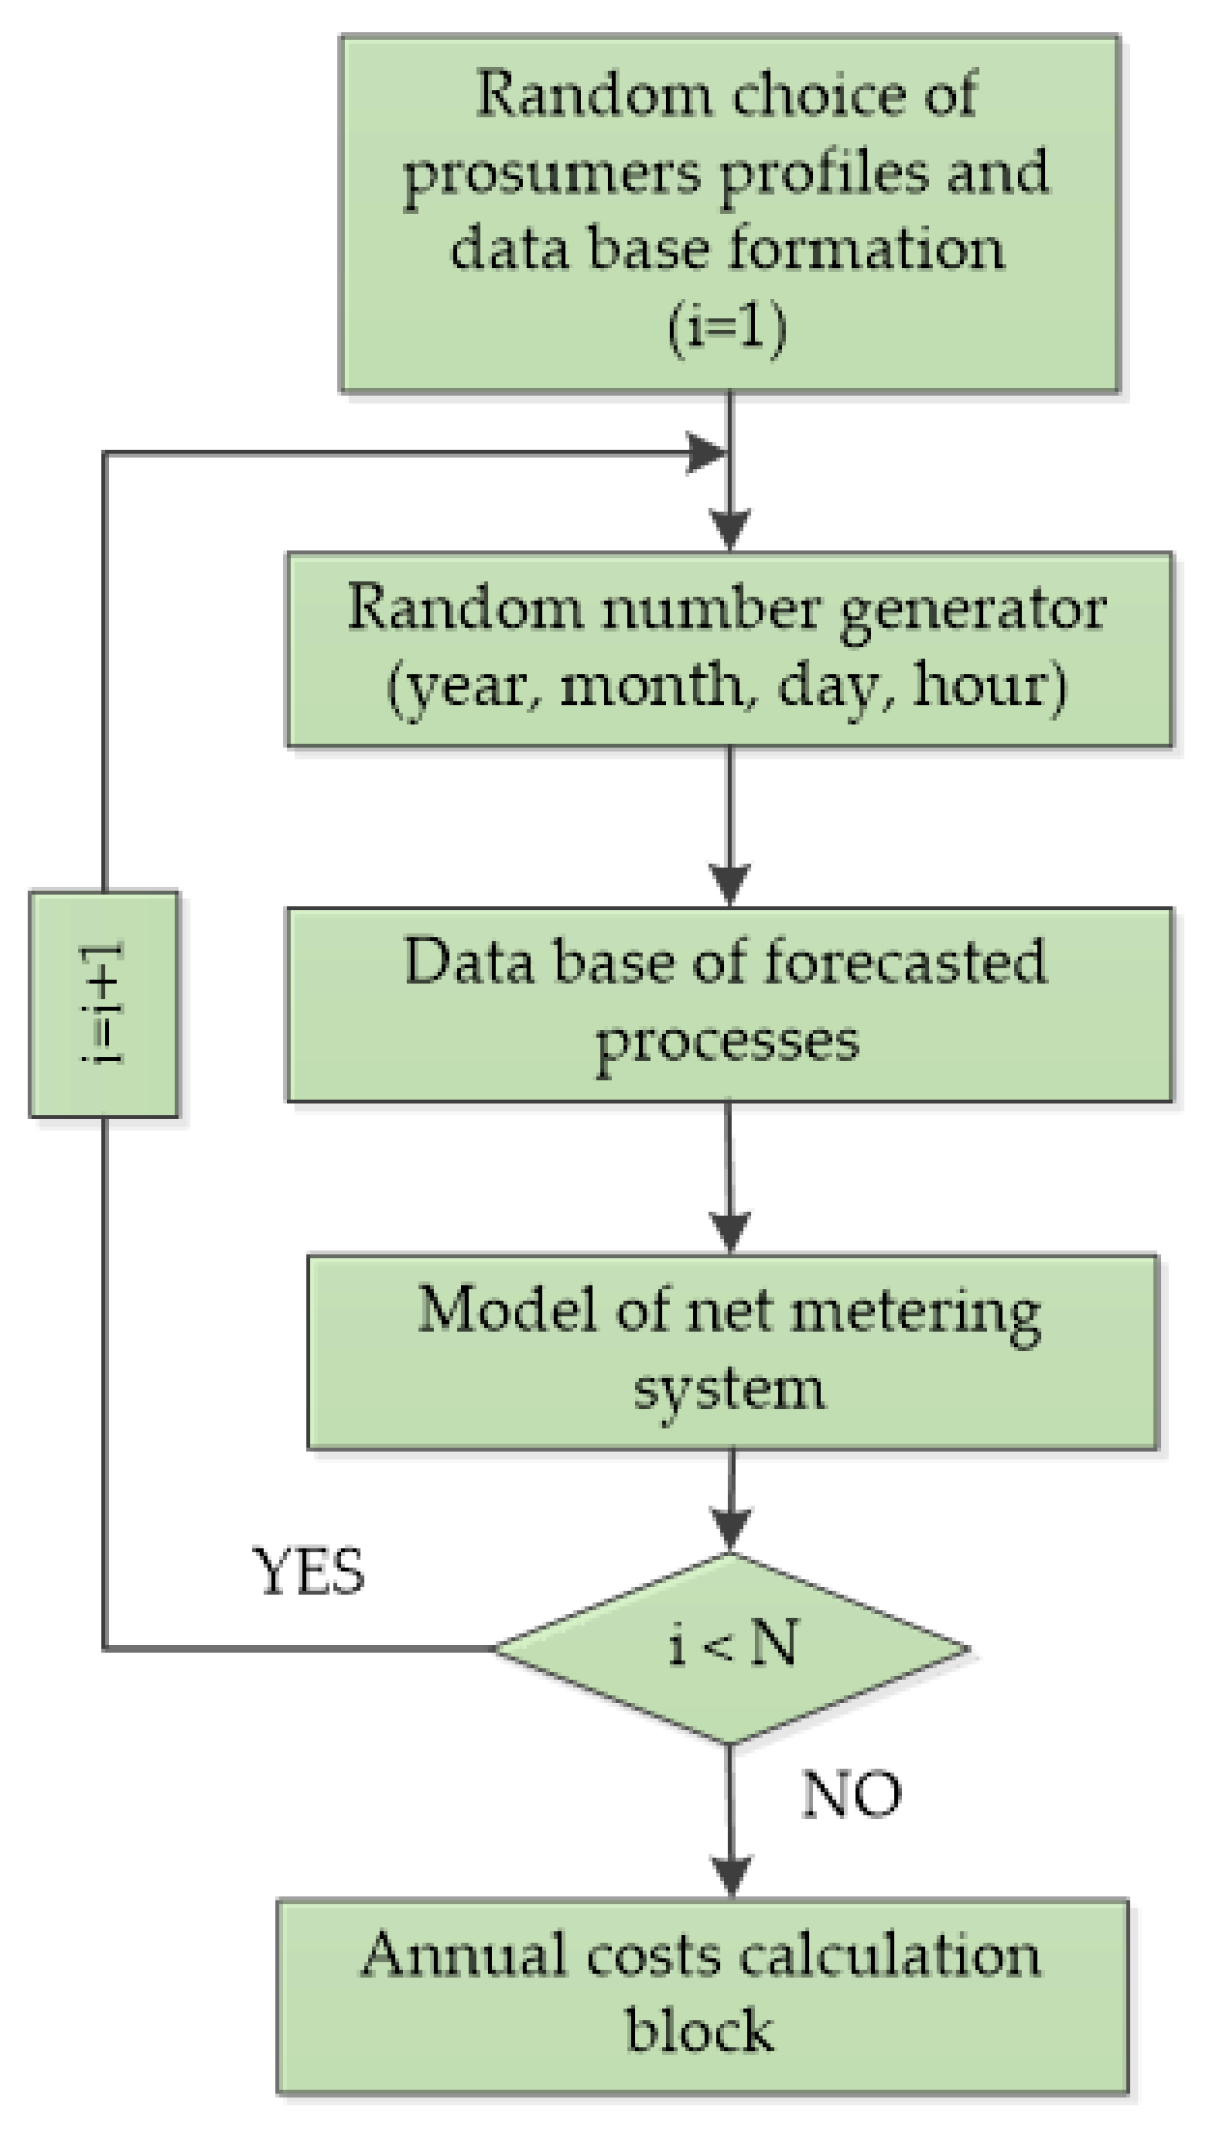
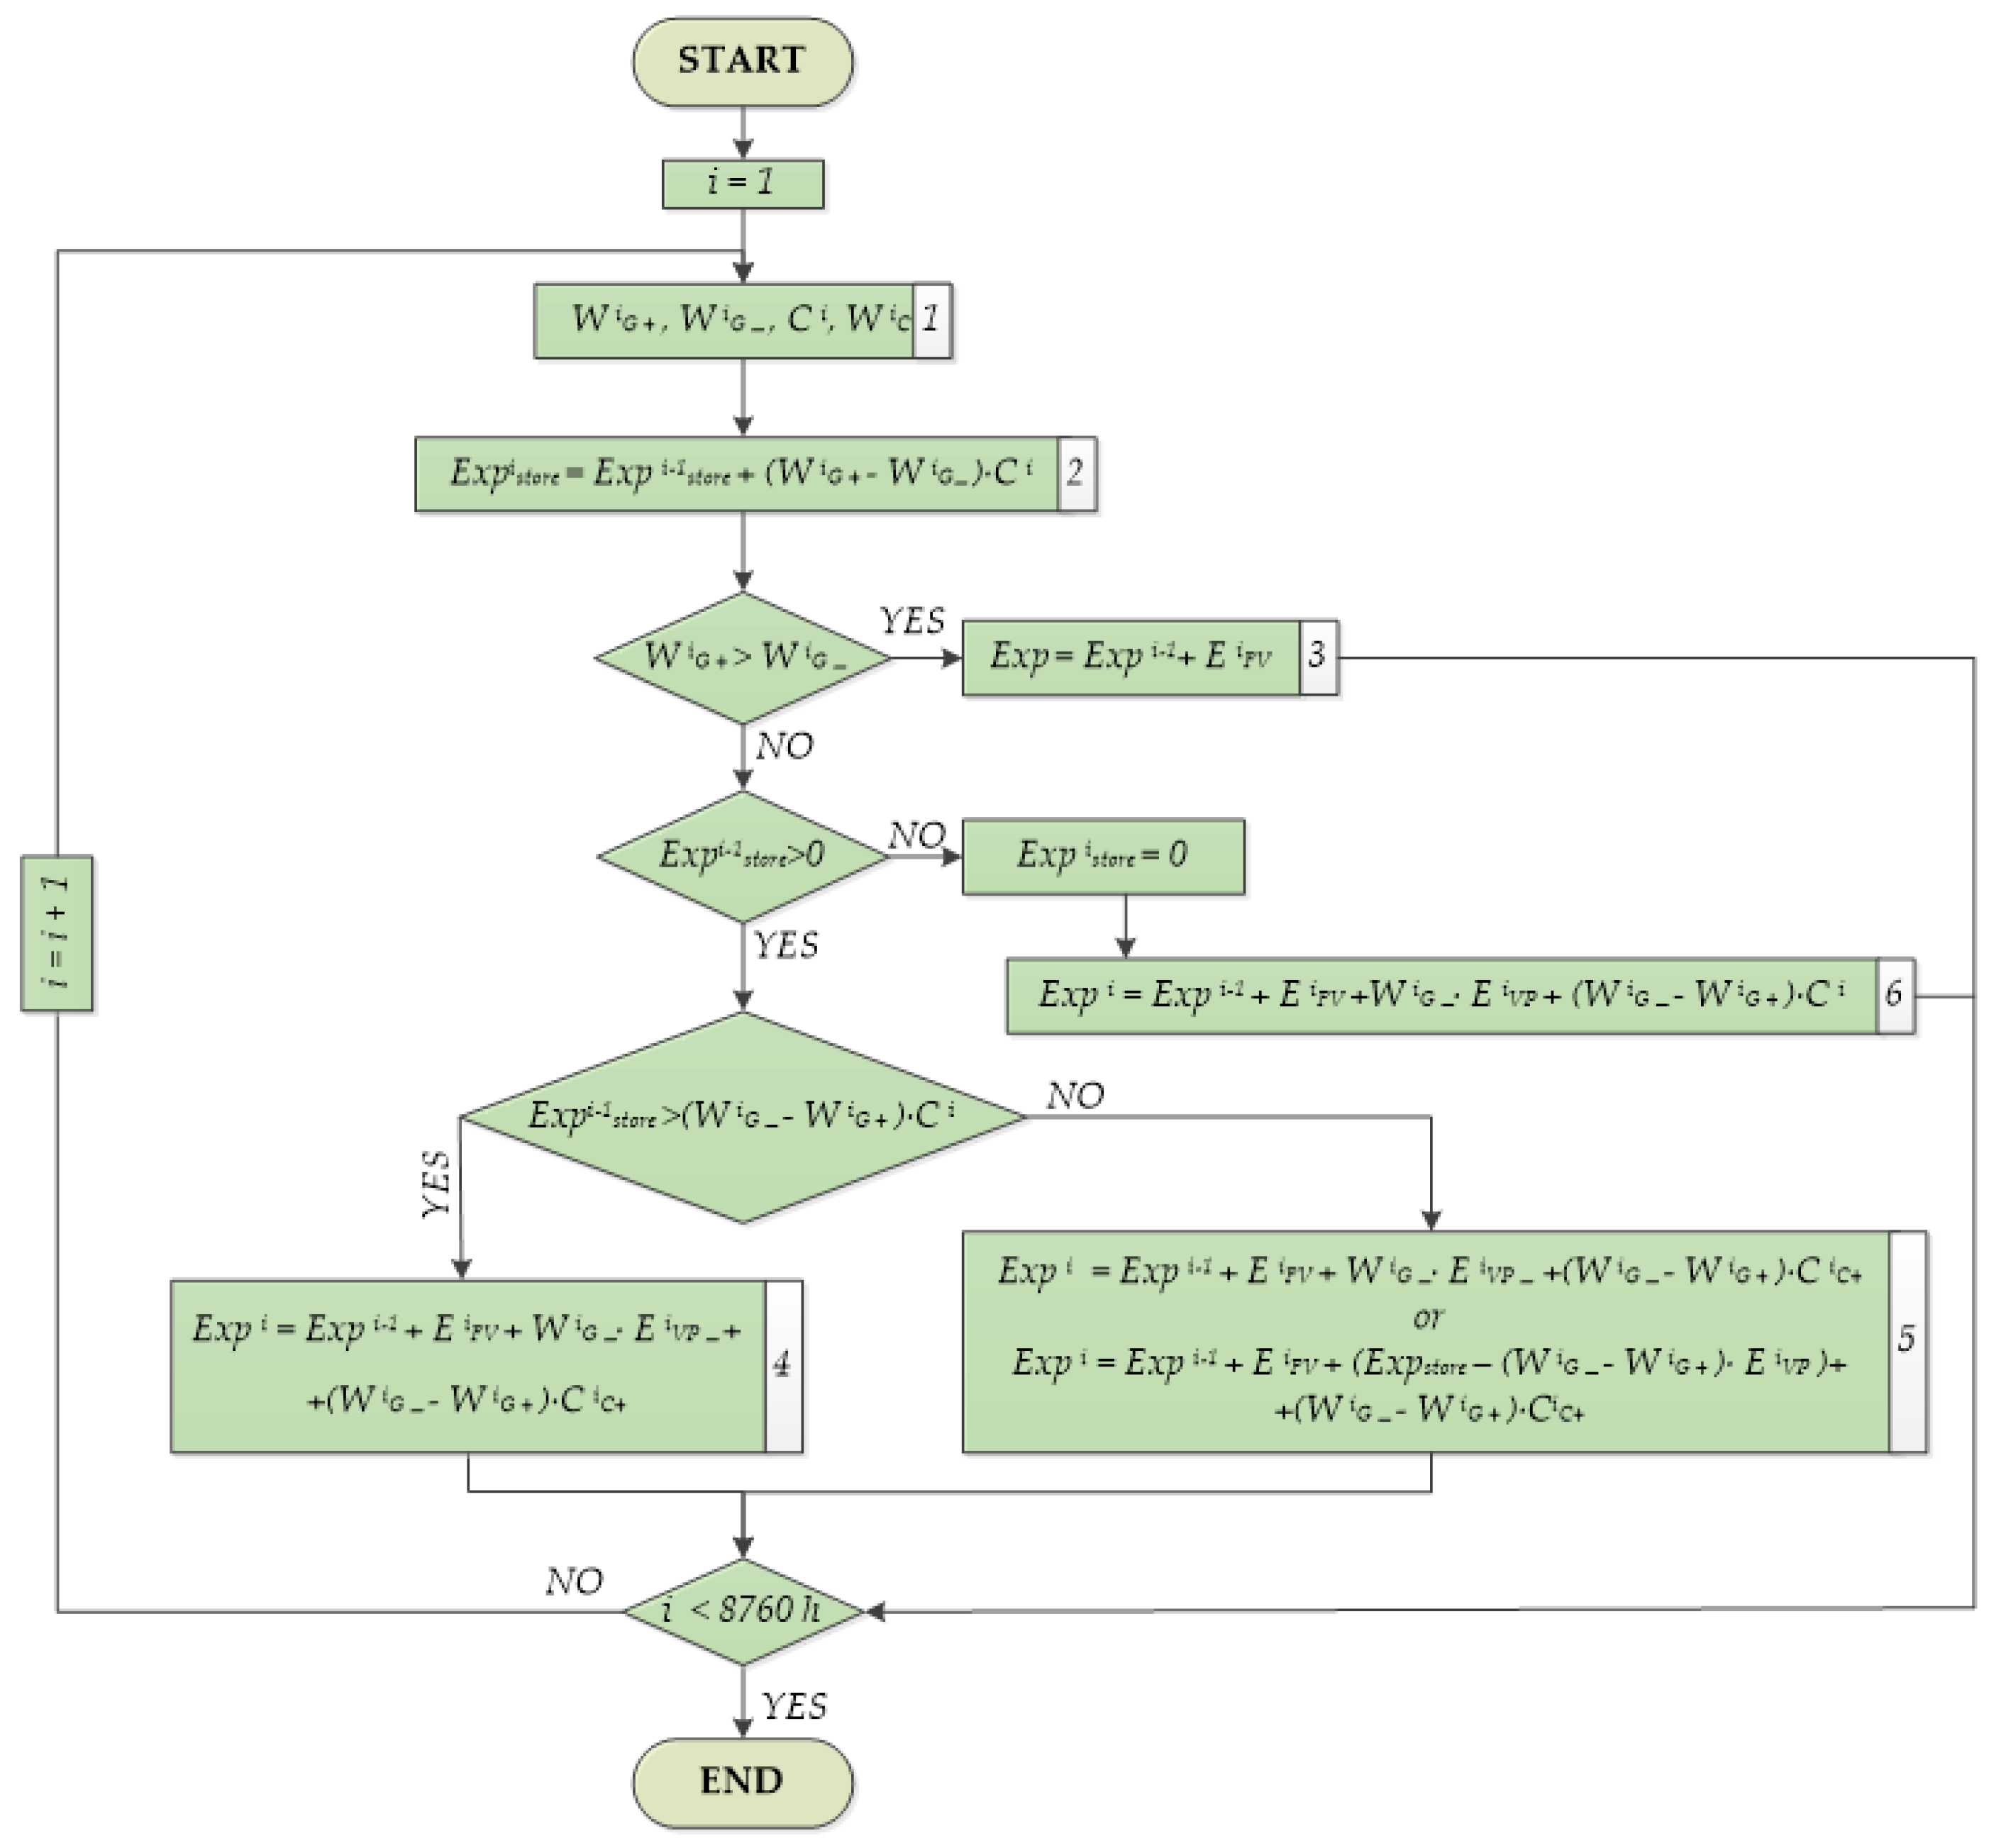
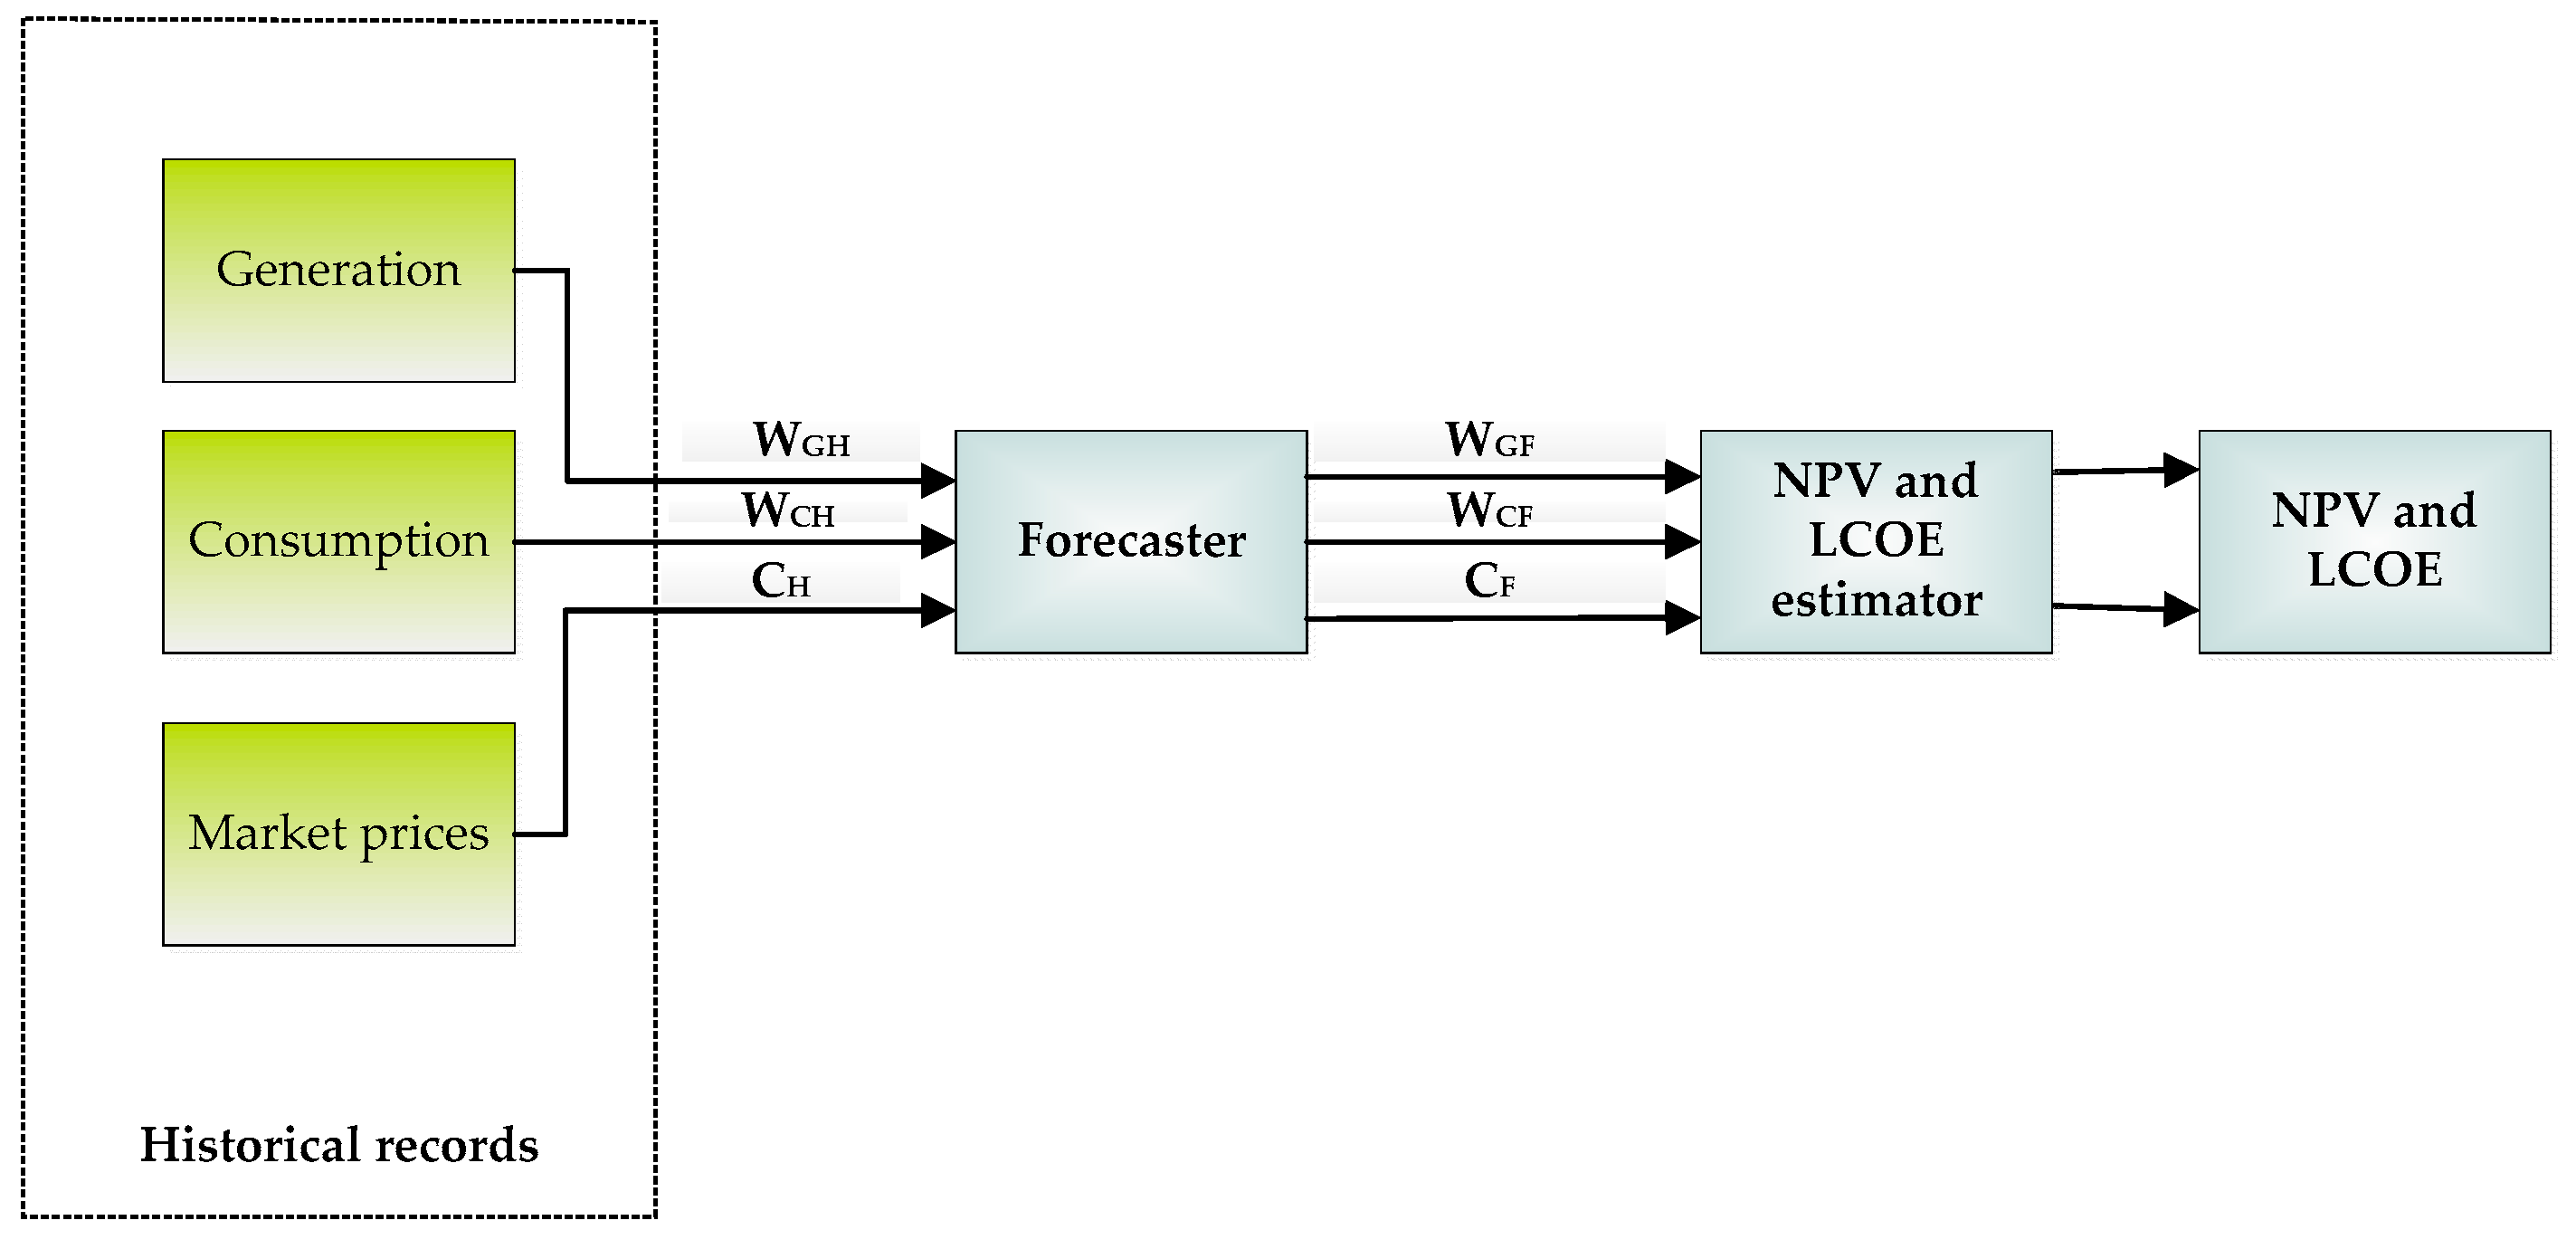
2.3.1. Implementation of the First Task

Let us assume that a certain household wishes to start using solar power. The natural way to start is to evaluate the profitability of the prospective project. Notwithstanding the low planned generation capacity, it becomes necessary to solve the benefit maximisation problem. By using the NPV or the LCOE (Equation (1) and (2)) and setting the expected PV technology’s planning time, optimisation tasks can be formulated in the following form:
  N P V ( T p t ) m a x ,  
  L C O E ( T p t ) m i n .  
Cash flow and generated electricity can be described in a different mode. We select an avoided-cost approach [1,19]. In this case, the cash flow should be calculated as:
  R t = R b R t p r ,  
where Rb is the cash flow calculated for the consumer before the installation of the PV technologies (the base case). Rtpr—the cash flow reduced after the installation of the PV technology. The amount of produced energy, Rt, comprises all the energy generated by the PV technologies—auxiliary consumption and supply to the grid.
In NPV or LCOE criteria value assessment, the greatest difficulties arise in computing the net cash flow Rt because of the amounts of generated and consumed electricity and because the energy prices change over time and can be described in terms of stochastic functions [39].
Prosumer efficiency, Epr (NPV or LCOE), is a function that can be described as follows:
  E p r = F ( W g ( t ) ,   W c ( t ) ,   C ( t ) ) ,  
where Wg(t), Wc(t), and C(t) stand for the amounts of generated and consumed electricity and the changes in the energy prices over time. The NPV calculation of the function in question (Equation (6)) depends on the support scheme used or the type of NS [30]. In order to calculate the efficiency criteria, it is necessary to describe changes in processes for many years ahead. This task leads to uncertainty and necessitates the use of methods regarding the theory of stochastic processes. Let us assume that Wg(t), Wc(t), and C(t) are stochastic processes, see Figure 2. In this case, it can be said that the efficiency indicators (the NPV or the LCOE) are random values [22]. When formulating the optimisation task, it is necessary to use the mathematical expectation of the following values: E ( N P V ( T p t ) ) ,   E   ( L C O E ( T p t ) ) .   The optimisation tasks take on a stochastic form [39], see Equations (11) and (12):
  E ( N P V ( T l t ) ) m a x ,  
  E ( L C O E ( T l t ) ) m i n .  
Solving the stochastic task necessitates the use of the statistic characteristic of the input processes Wg(t), Wc(t), and C(t) (distribution function; correlation) [30,40]. An illustration of the changeability of the processes is provided in Figure 2.
The task becomes simplified if a hypothesis regarding the stationary nature of the stochastic processes is assumed [28,40]. In this case, it becomes possible to use the historical data on the calculation or measurement results of the input processes: generation WGH, consumption WCH, and price CH. Forecasts of processes are used, which have been formed on the basis of measurements of the processes in question and by applying the so-called naïve forecasting approach to generation WGF, consumption WCF, and price CF [28], which is based on the assumption that past processes will repeat in the future. Additionally, we take into account the change in the average annual price [28]. Note, that the problem of forecasting processes is relevant in solving many problems related to optimizing power systems. The extensive scientific literature is devoted to this problem [41,42,43,44,45,46,47,48]. The approach we use is only one of the possible approaches. The proof of its acceptable accuracy and a more detailed description is given in our previous work [28]. A structural diagram of the algorithm is provided in Figure 3.
Values of mathematical expectation, E ( N P V ( T p t ) ) and E ( L C O E ( T p t ) ) can be determined on the basis of Rt:
  E ( R t ) = t = 1 t = T p t R t .  
In the case under discussion, when the possible profitability of the potential prosumer is evaluated, historical measurement records are available only for two processes, namely, market price and consumption. In order to forecast generation, the measurement records of other solar power plants can be used for reference. It is this possibility that will be used in our study.

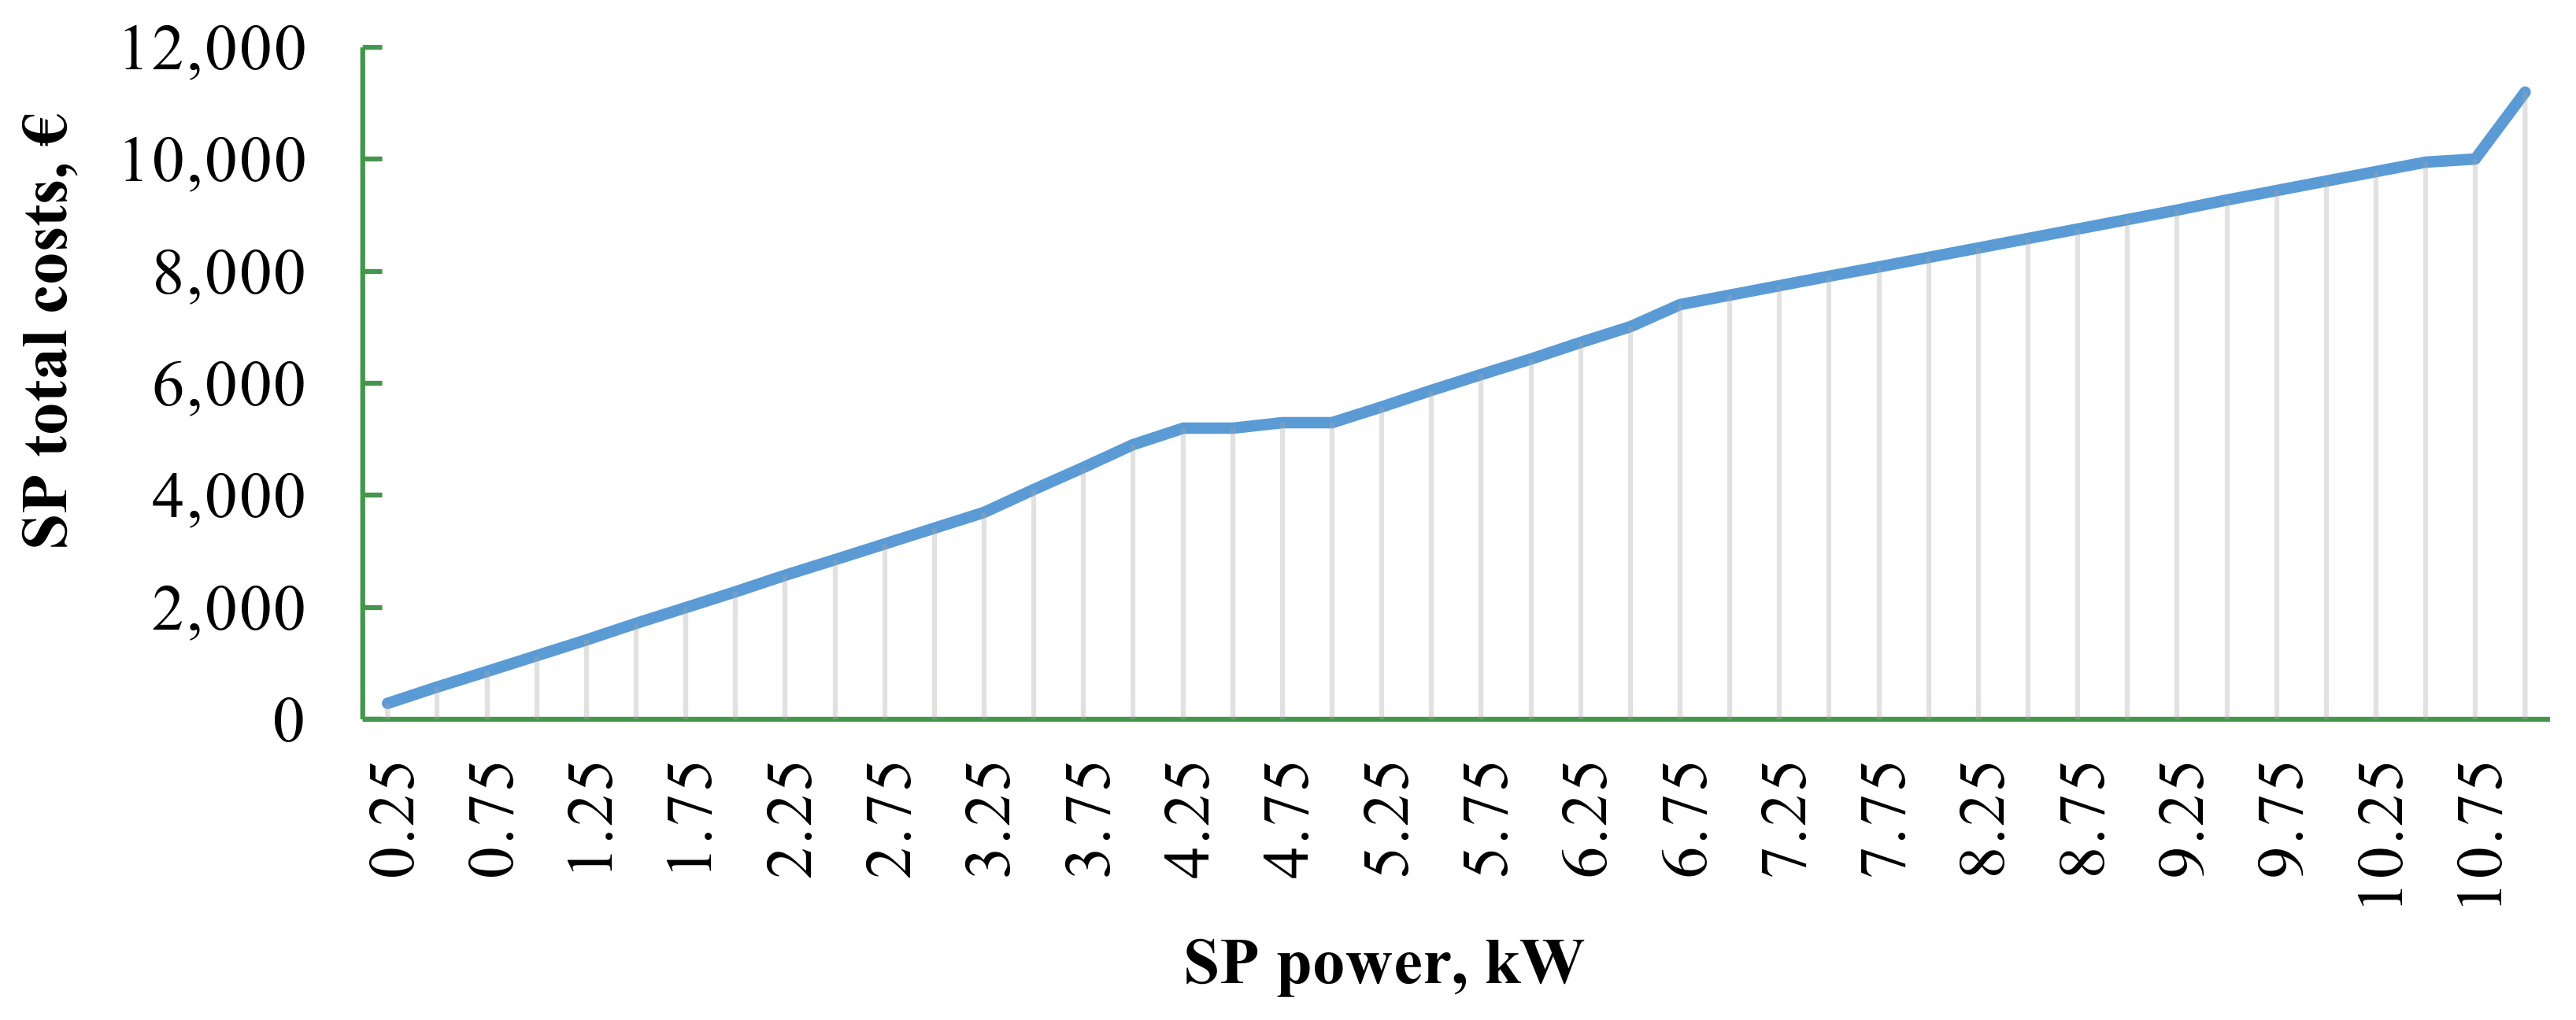
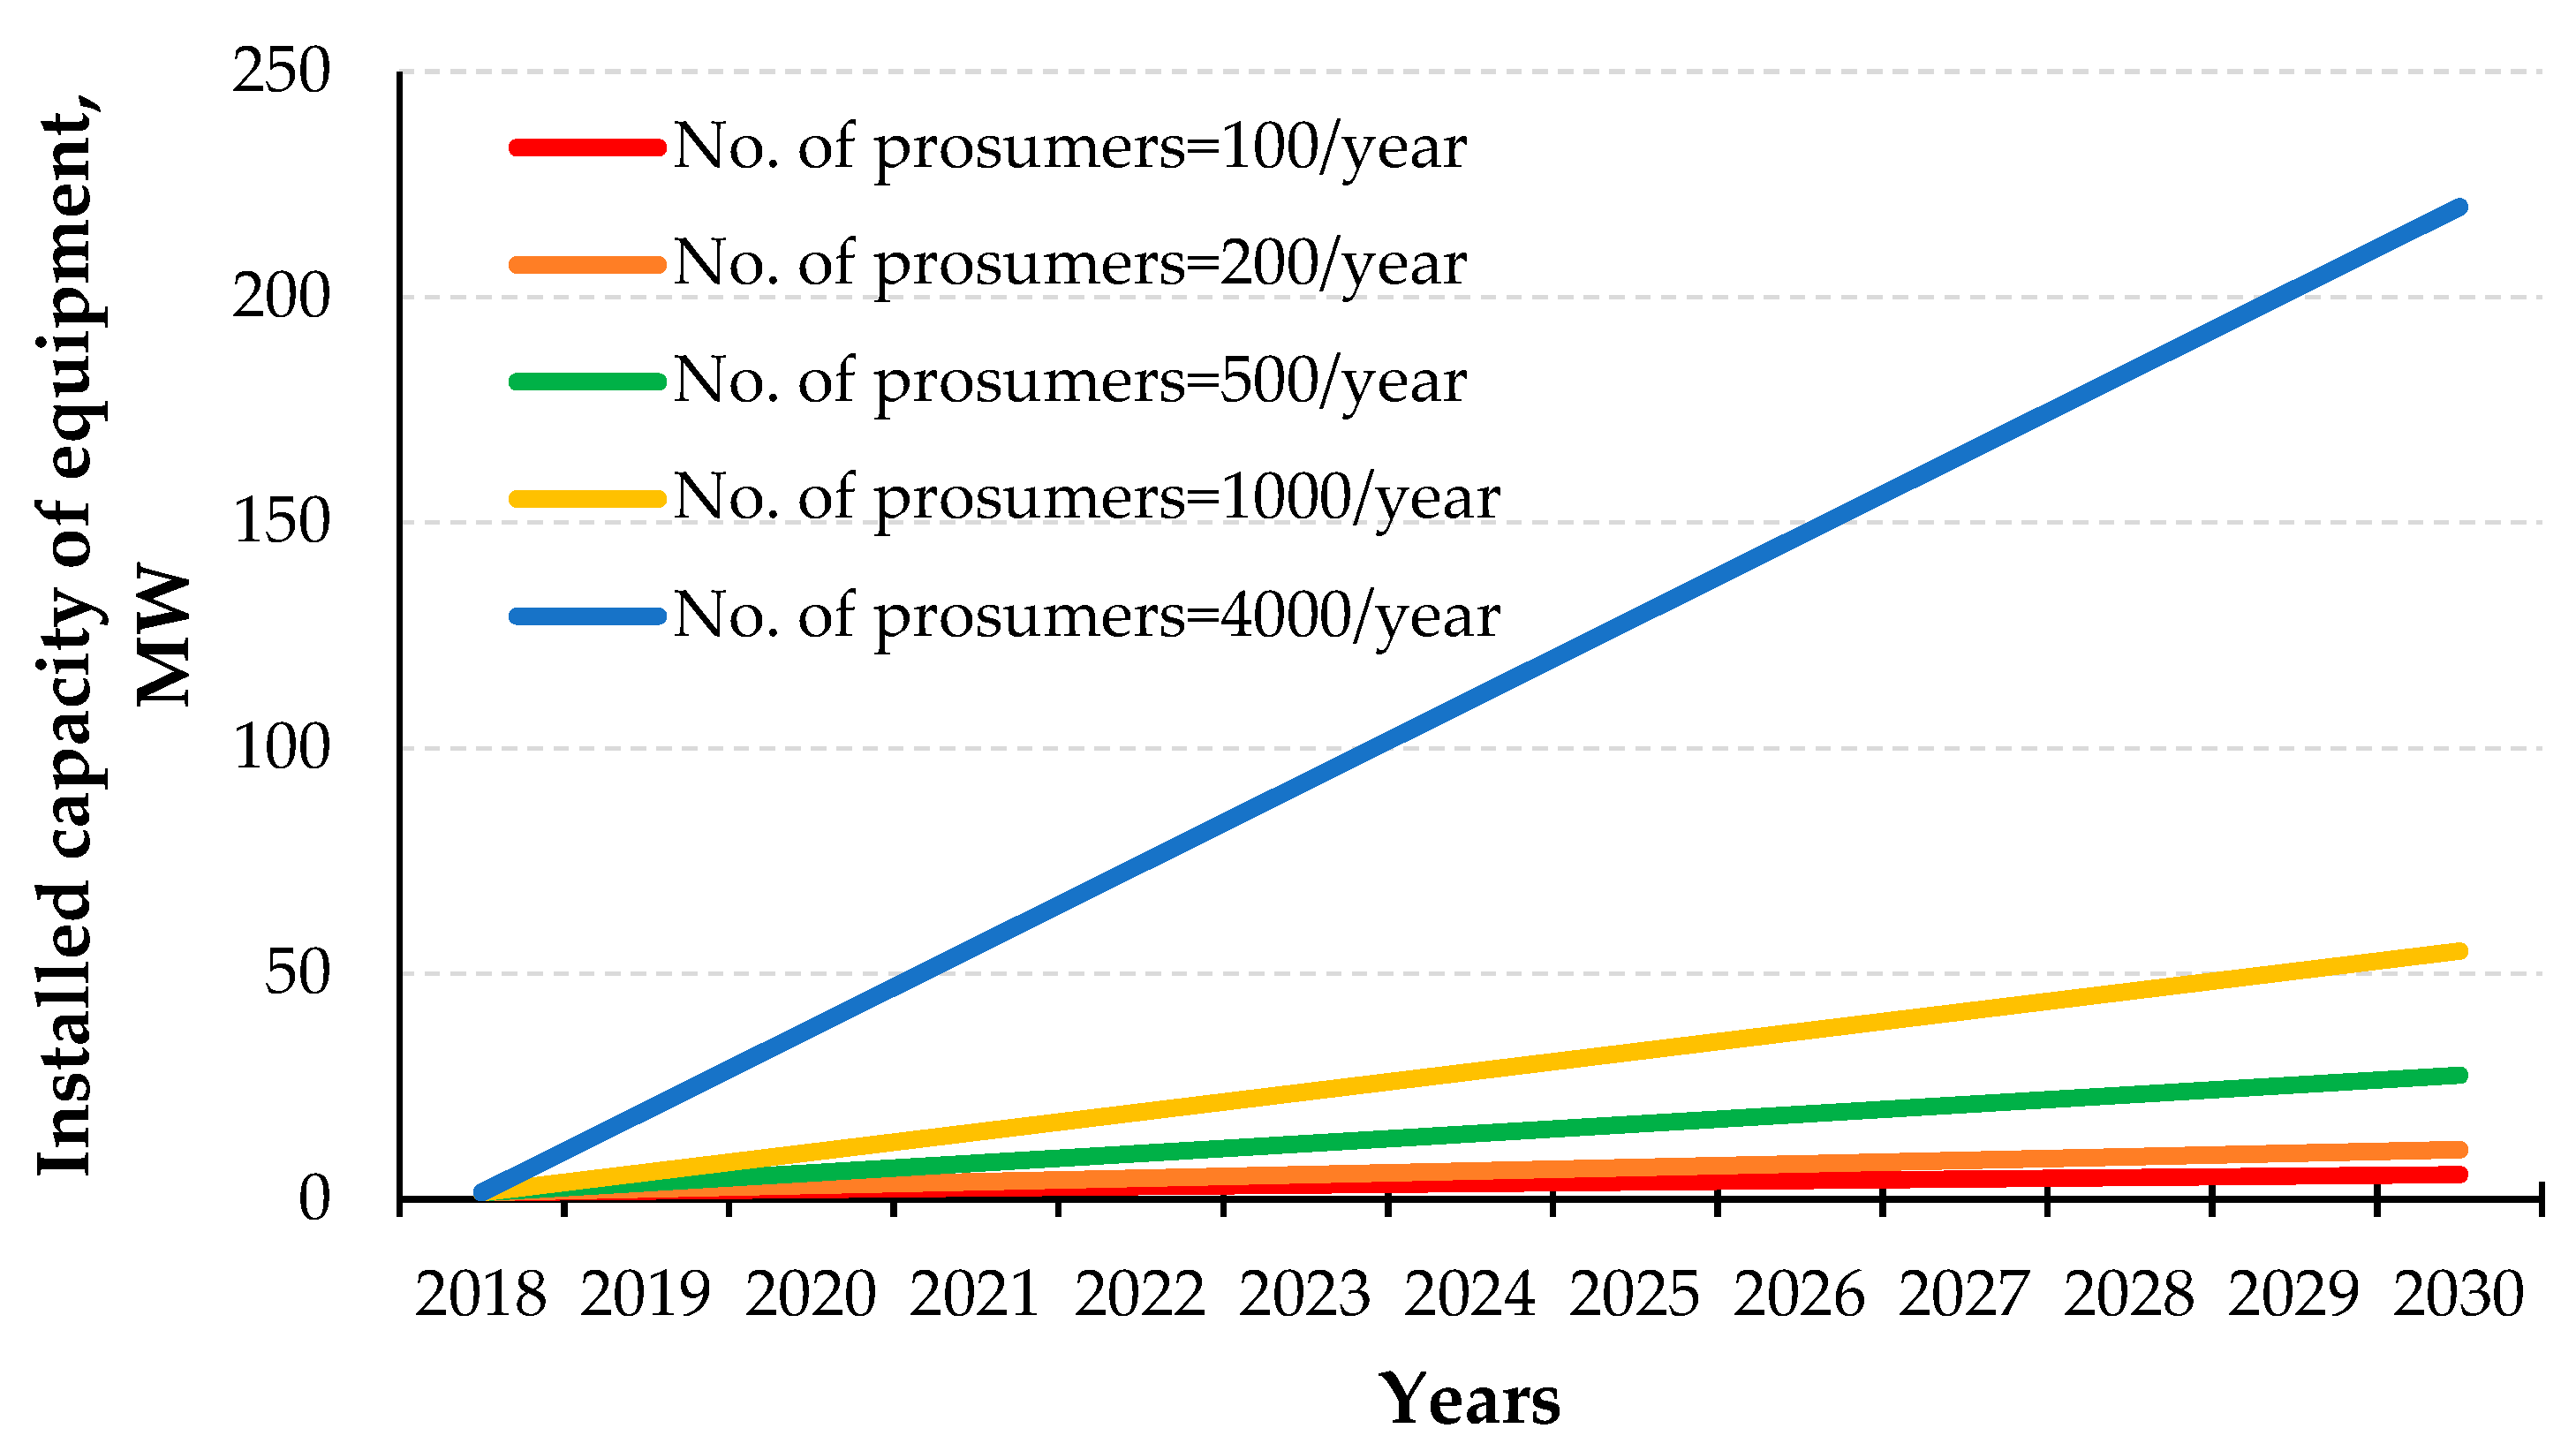
2.3.2. Implementation of the Second Task

In the case of multiple prosumers, evaluating their impact on the power system as a whole, the task becomes even more complicated, since calculation of the total energy generation amount, Wsum, for tens of thousands of prosumers, simulating the operation of each prosumer, is too expensive in terms of money as well as labour because the number of prosumers, N, may reach tens of thousands or more. This problem can be solved by means of the Monte-Carlo method [49] (Equation (14)). The essence of the method is as follows: The process is modelled using a random variable generator. This is repeated many times, and then, based on the obtained random data, the probabilistic characteristics of the problem being solved are calculated.
  W s u m = i = 1 i = T p t W i N · i = 0 i = T p t W i n ,  
where N>>n and n stands for the number of prosumers randomly selected for analysis; Wi is the energy generation amount of i-th prosumer, (kWh).
As was previously mentioned, to estimate the total energy generation quantity and annual total costs of the huge number of prosumers is a labour-intensive process. Figure 4 below shows a structural diagram of the algorithm for solving the efficiency evaluation task which is based on the Monte-Carlo method. Such a method is very convenient and appropriate for calculating the average costs and the profitability of prosumers.
The algorithm, shown in Figure 4, enables the implementation of the second task. The presented approach can be implemented by means of software, and it enables a quick and easy solution of the set task. In our case, the MATLAB (R2013a, MathWorks, Natick, MA) environment is used.

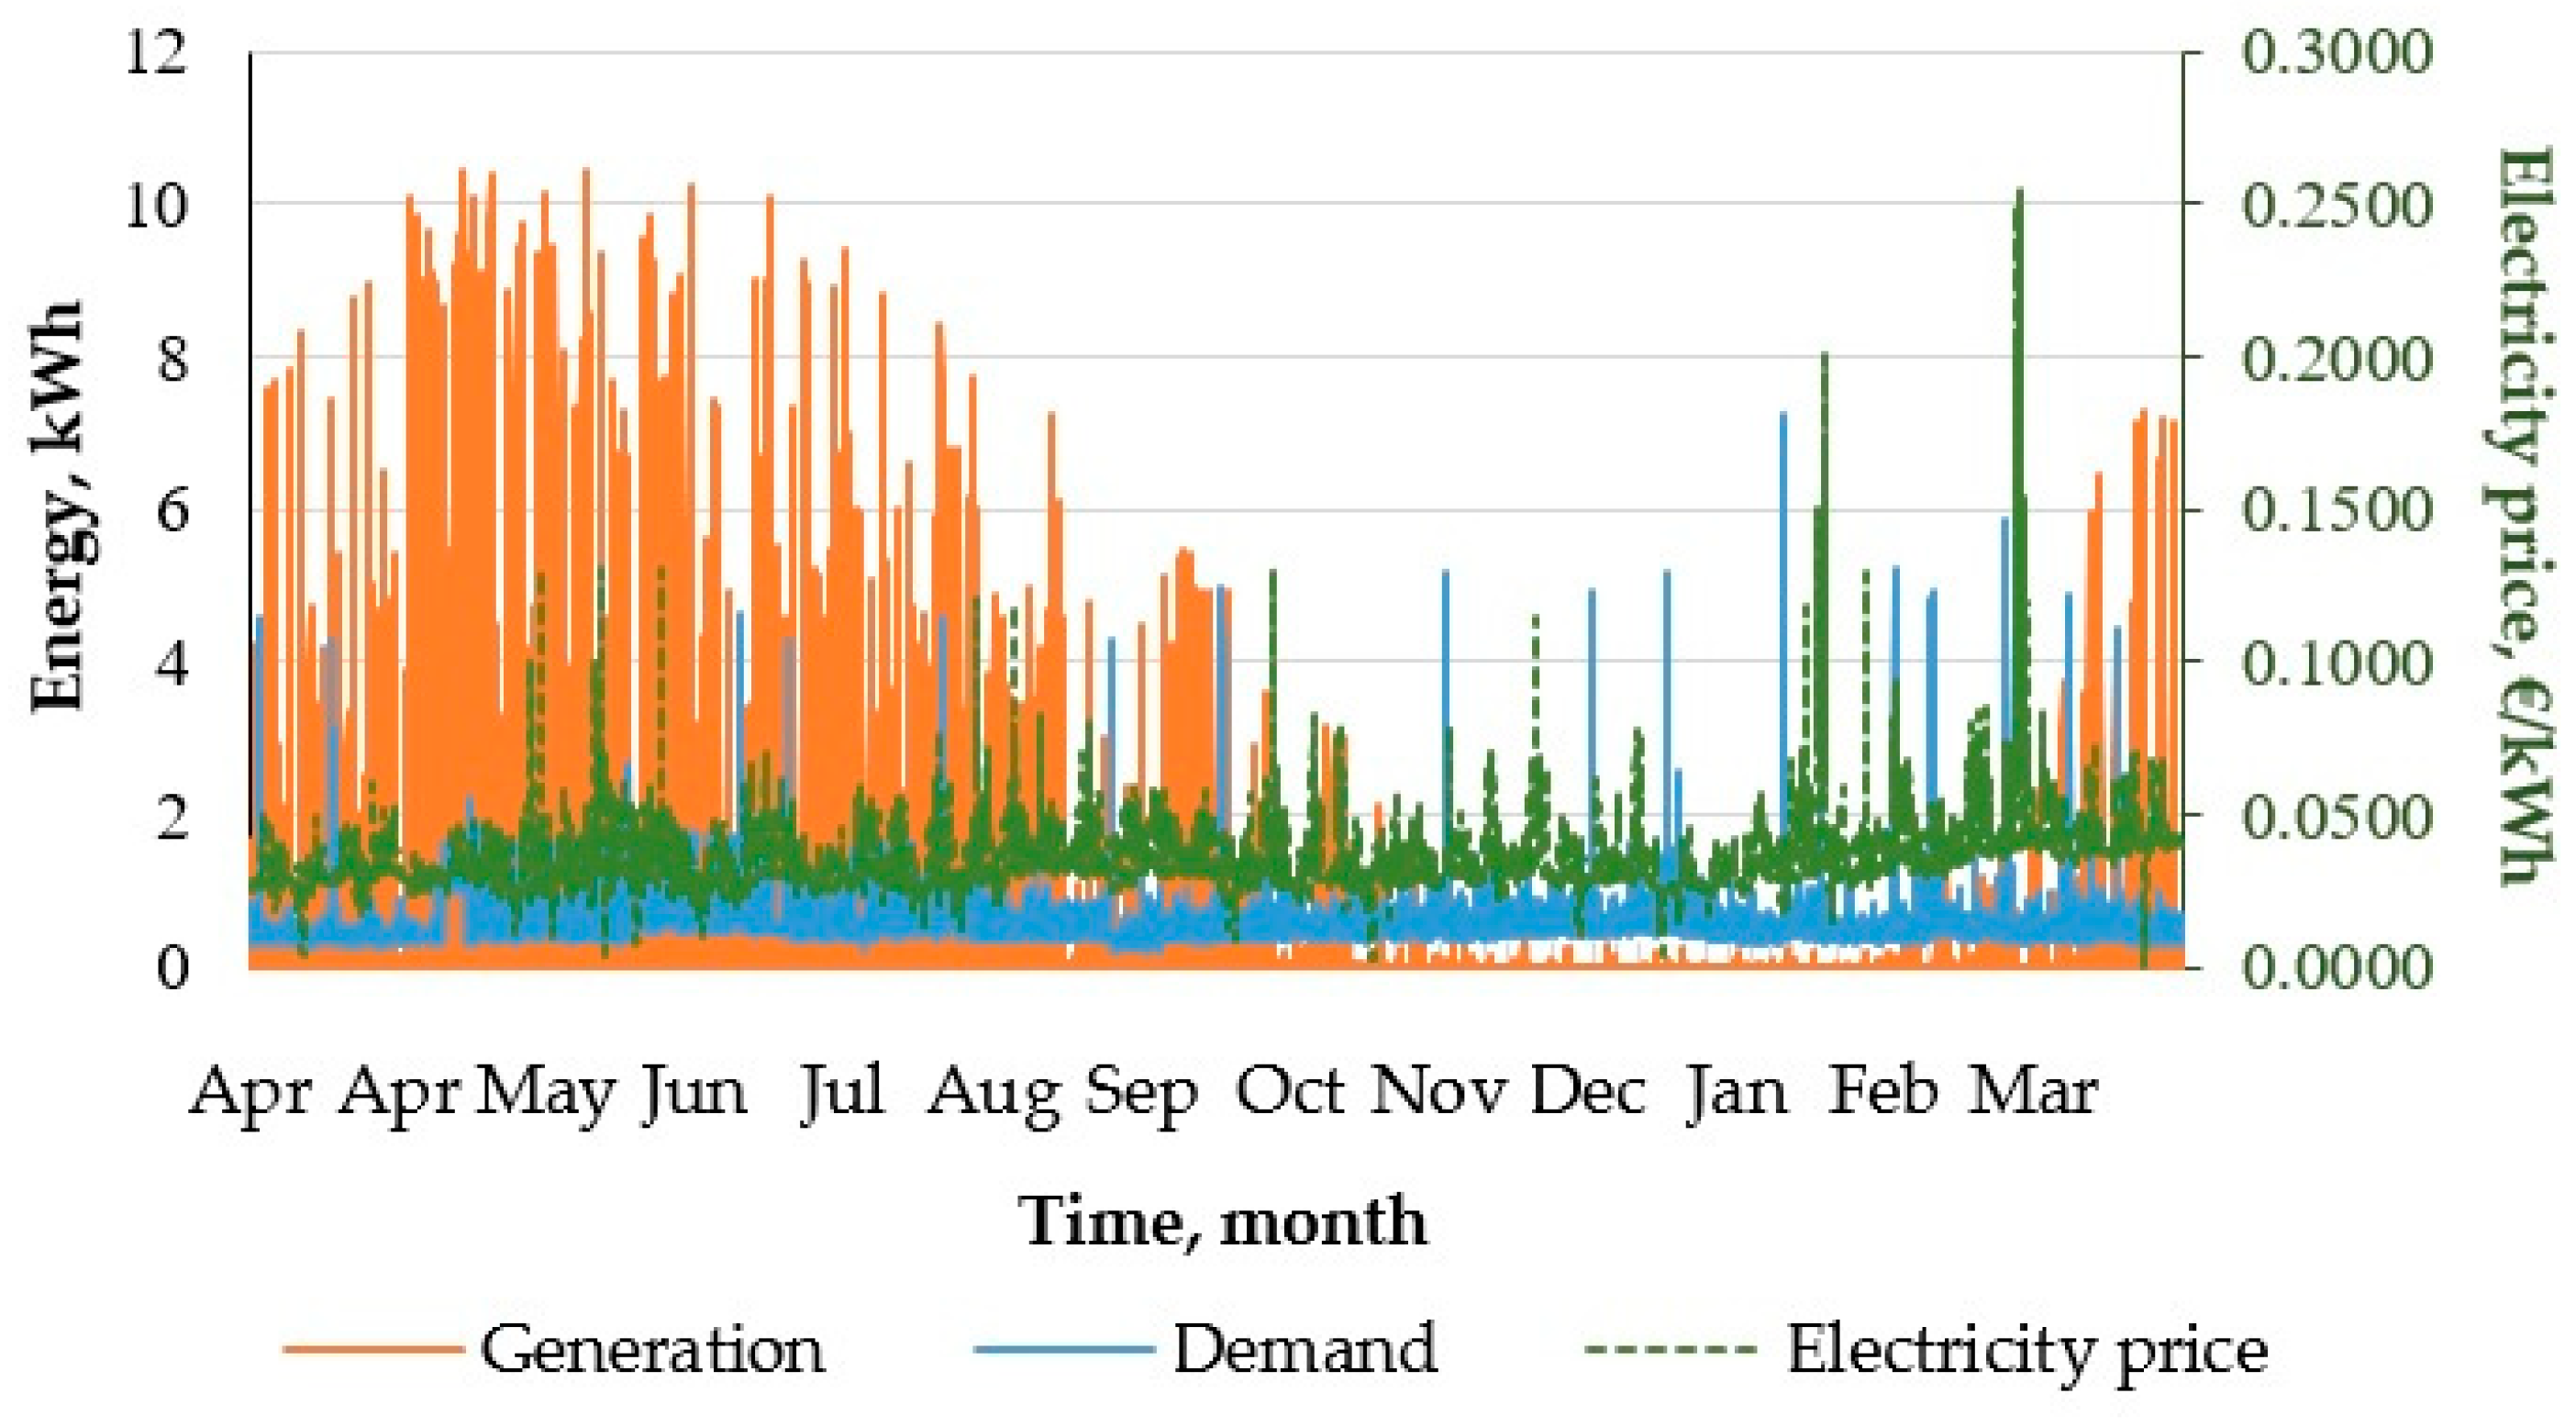
2.4. Input Information and Assumptions

For the case study, we identify two cases:
  • The base case, when the householder does not have an NS.
  • The case, when the householder has an NBS.
As has been said before, solving the tasks under consideration requires simulation of the changes of three input processes over time with a step of 1 h:
  • Power demand: information is required regarding the energy demand profiles of a large number of prosumers. We use the records of the smart meters of one hundred different randomly selected consumers over a period of one year [23];
  • Power generation: the generation of the potential 100 prosumers is simulated by using the records of a newly installed generator for the year 2017. These records are modified by changing the equipment capacity for each of the 100 prosumers in such a way as to achieve a balance between the annual energy generation and consumption figures;
  • Electricity market prices: the Nord Pool market prices are used. By using the Fourier transform [39], we single out the constant component, which we set as a variable depending on the number of the planning year. The average price changes are set by using the published results and the selected scenarios [39].
On the Latvian market, PV equipment is offered by a number of manufacturers. Based on their data, Figure 5 shows the total installation costs of PV technology (not including Value-Added Tax (VAT)).
The trader’s prices, shown in Figure 5, are used in the further simulation calculation. When performing the simulation, the following limiting conditions were taken into account:
  • The NS billing period is maintained according to the valid legislation, i.e., from April 1 till March 31. This period is suitable for the prosumers of Nordic countries [1] since in the winter period the prosumer has the possibility to use the electricity submitted to the grid to the maximum extent. This period increases the economic profitability for the prosumers.
  • Retail prices are assumed to rise by 7.5% each year [50] (from 2018 to 2030), then by 2% (from 2030 till 2040) and fall by 1% (from 2040 till 2043) according to the EU Outlook 2050 energy price scenario, released by Energy Brainpool (June 2017).
  • A fixed payment for ensuring the connection is maintained, in keeping with the valid legislation [51,52]. The payments for the FV and VP components are observed according to the valid legislation.
  • For the hourly load of end users, the time series collected by the smart meters were used, covering a whole year.
  • We assume that, for the consumers connected to the grid, the consumption remains the same for future years as well. The loan interest rate was assumed in accordance with the interest rates laid down by the Bank of Latvia, i.e., 2.6% per annum [53]. The discount rate was assumed to be 2.0% per annum. The credit period is assumed to be equal to the equipment service life—25 years.
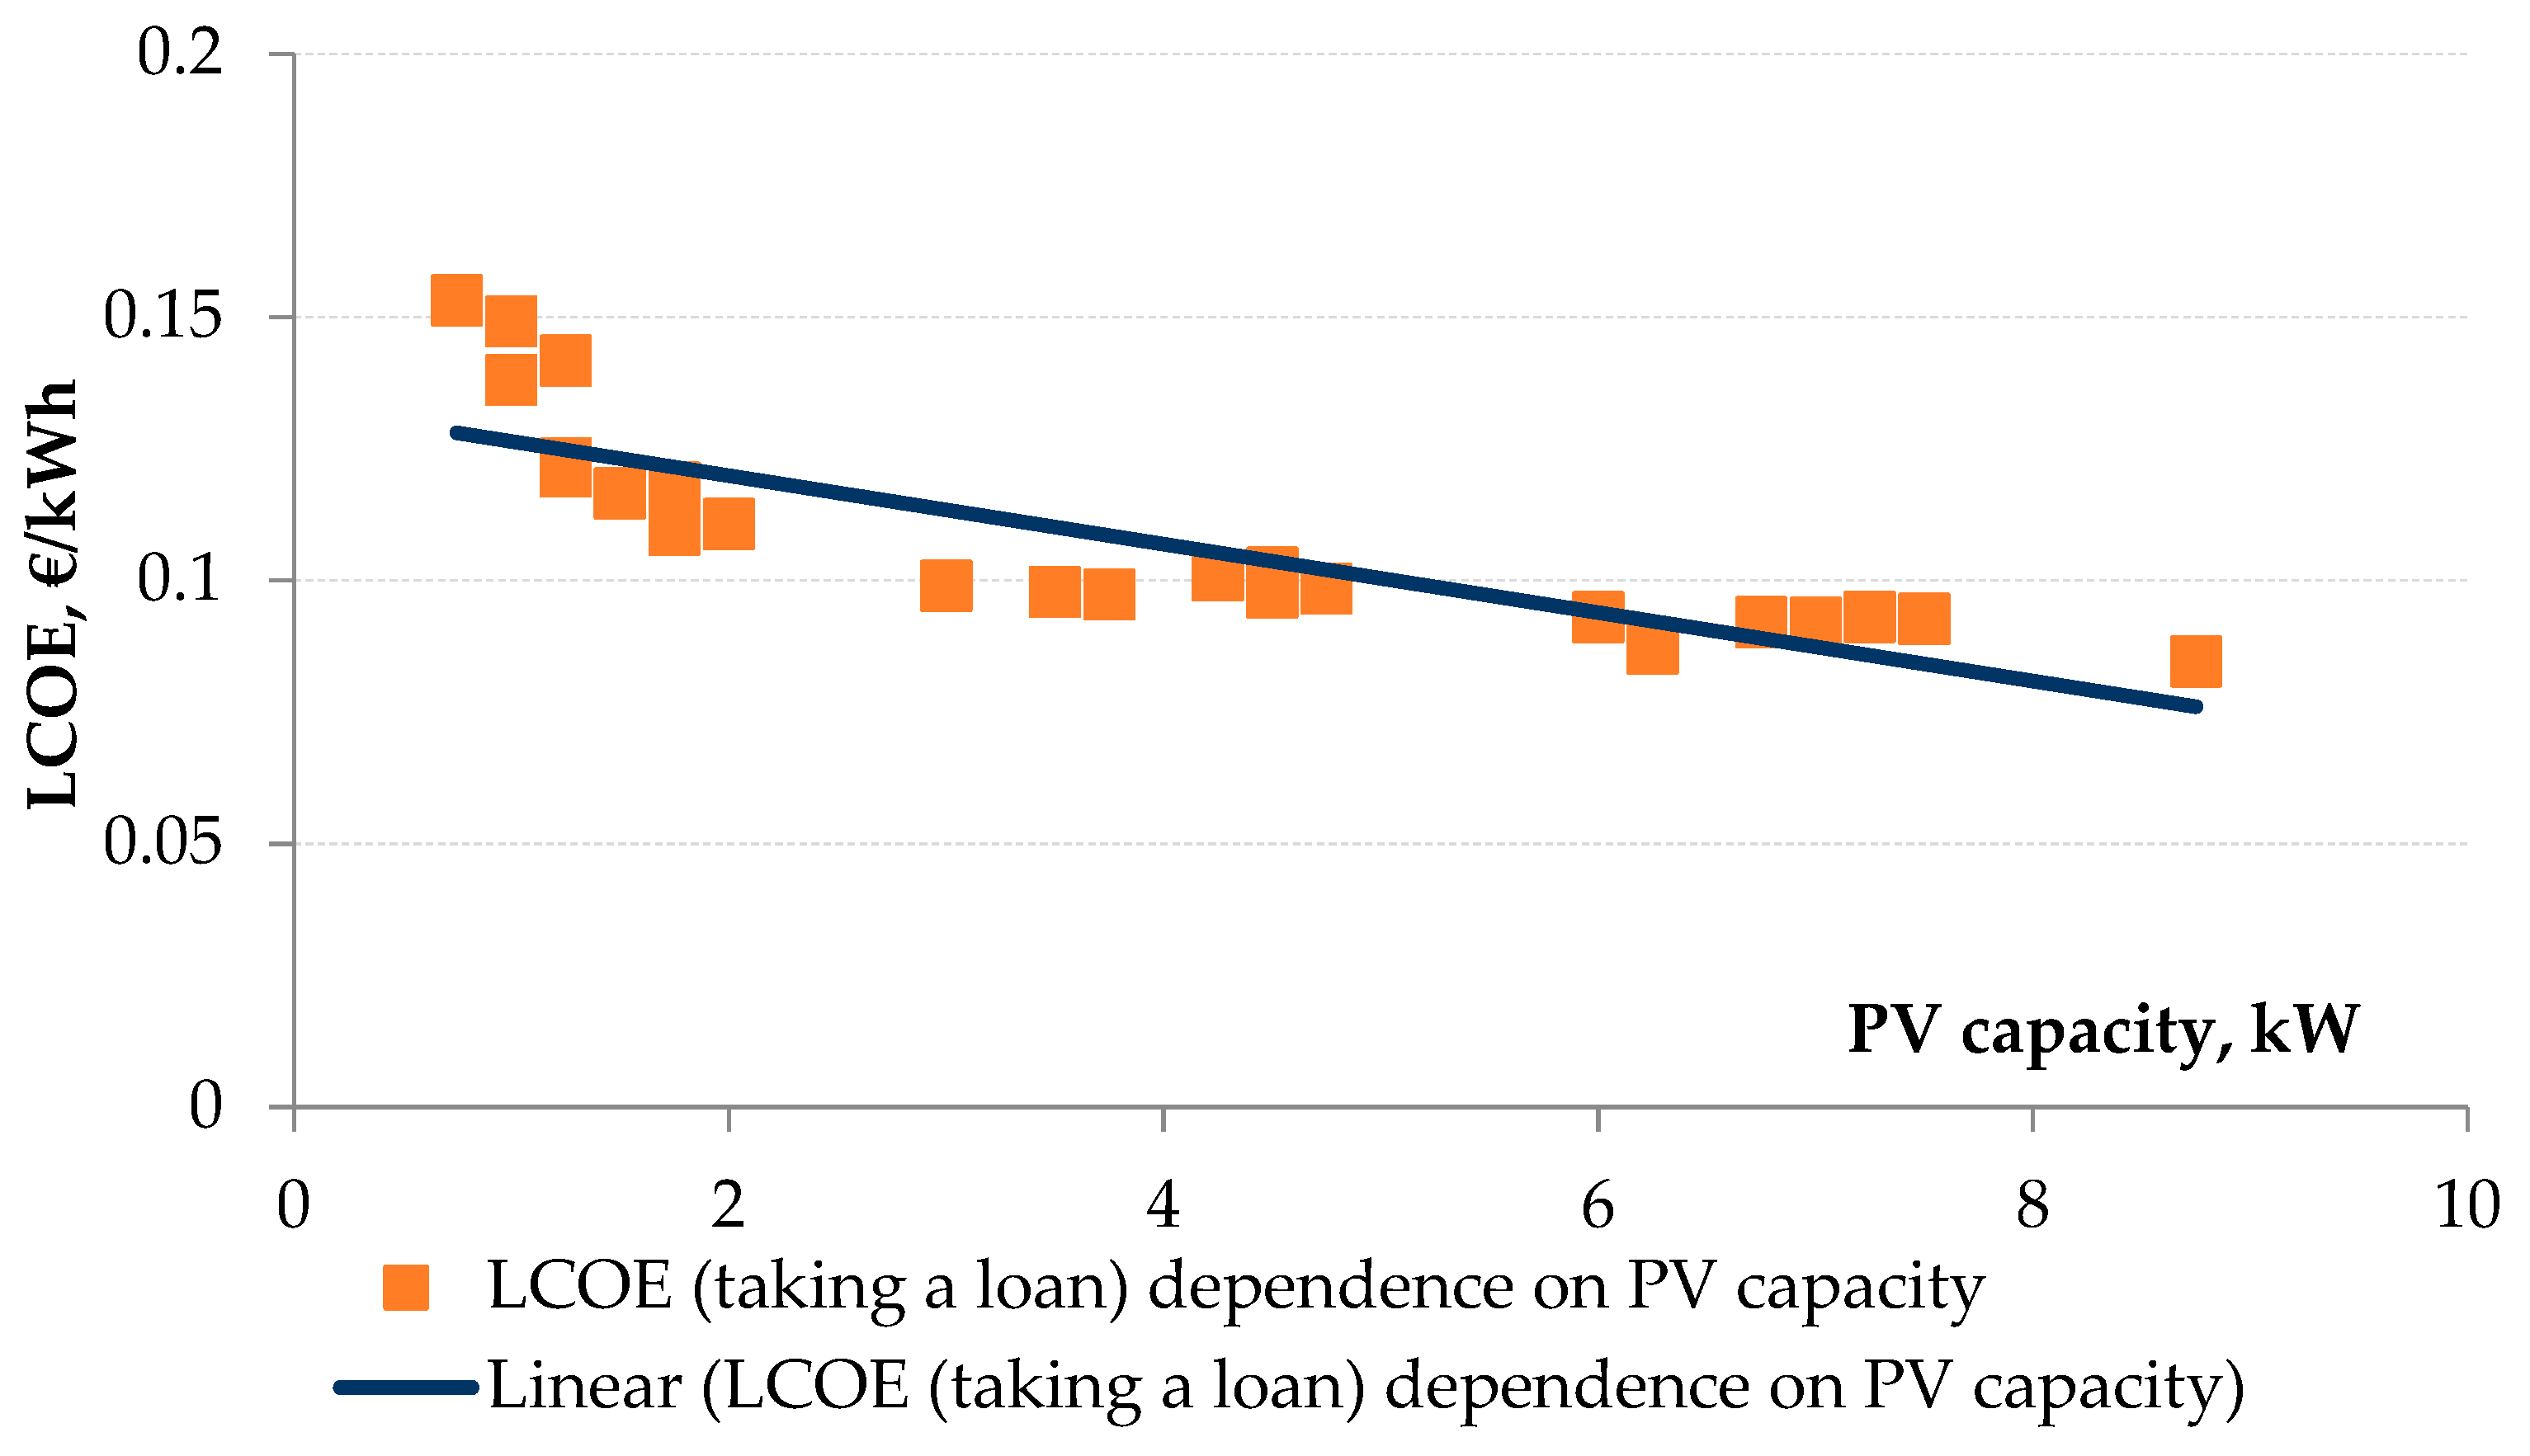
  • The capacity of the PV technology and the corresponding amount of investment was determined on the basis of solar radiation in Latvia, to enable the prosumer with its individual consumption to use the energy produced by the PV technology for end consumption to a maximum extent.
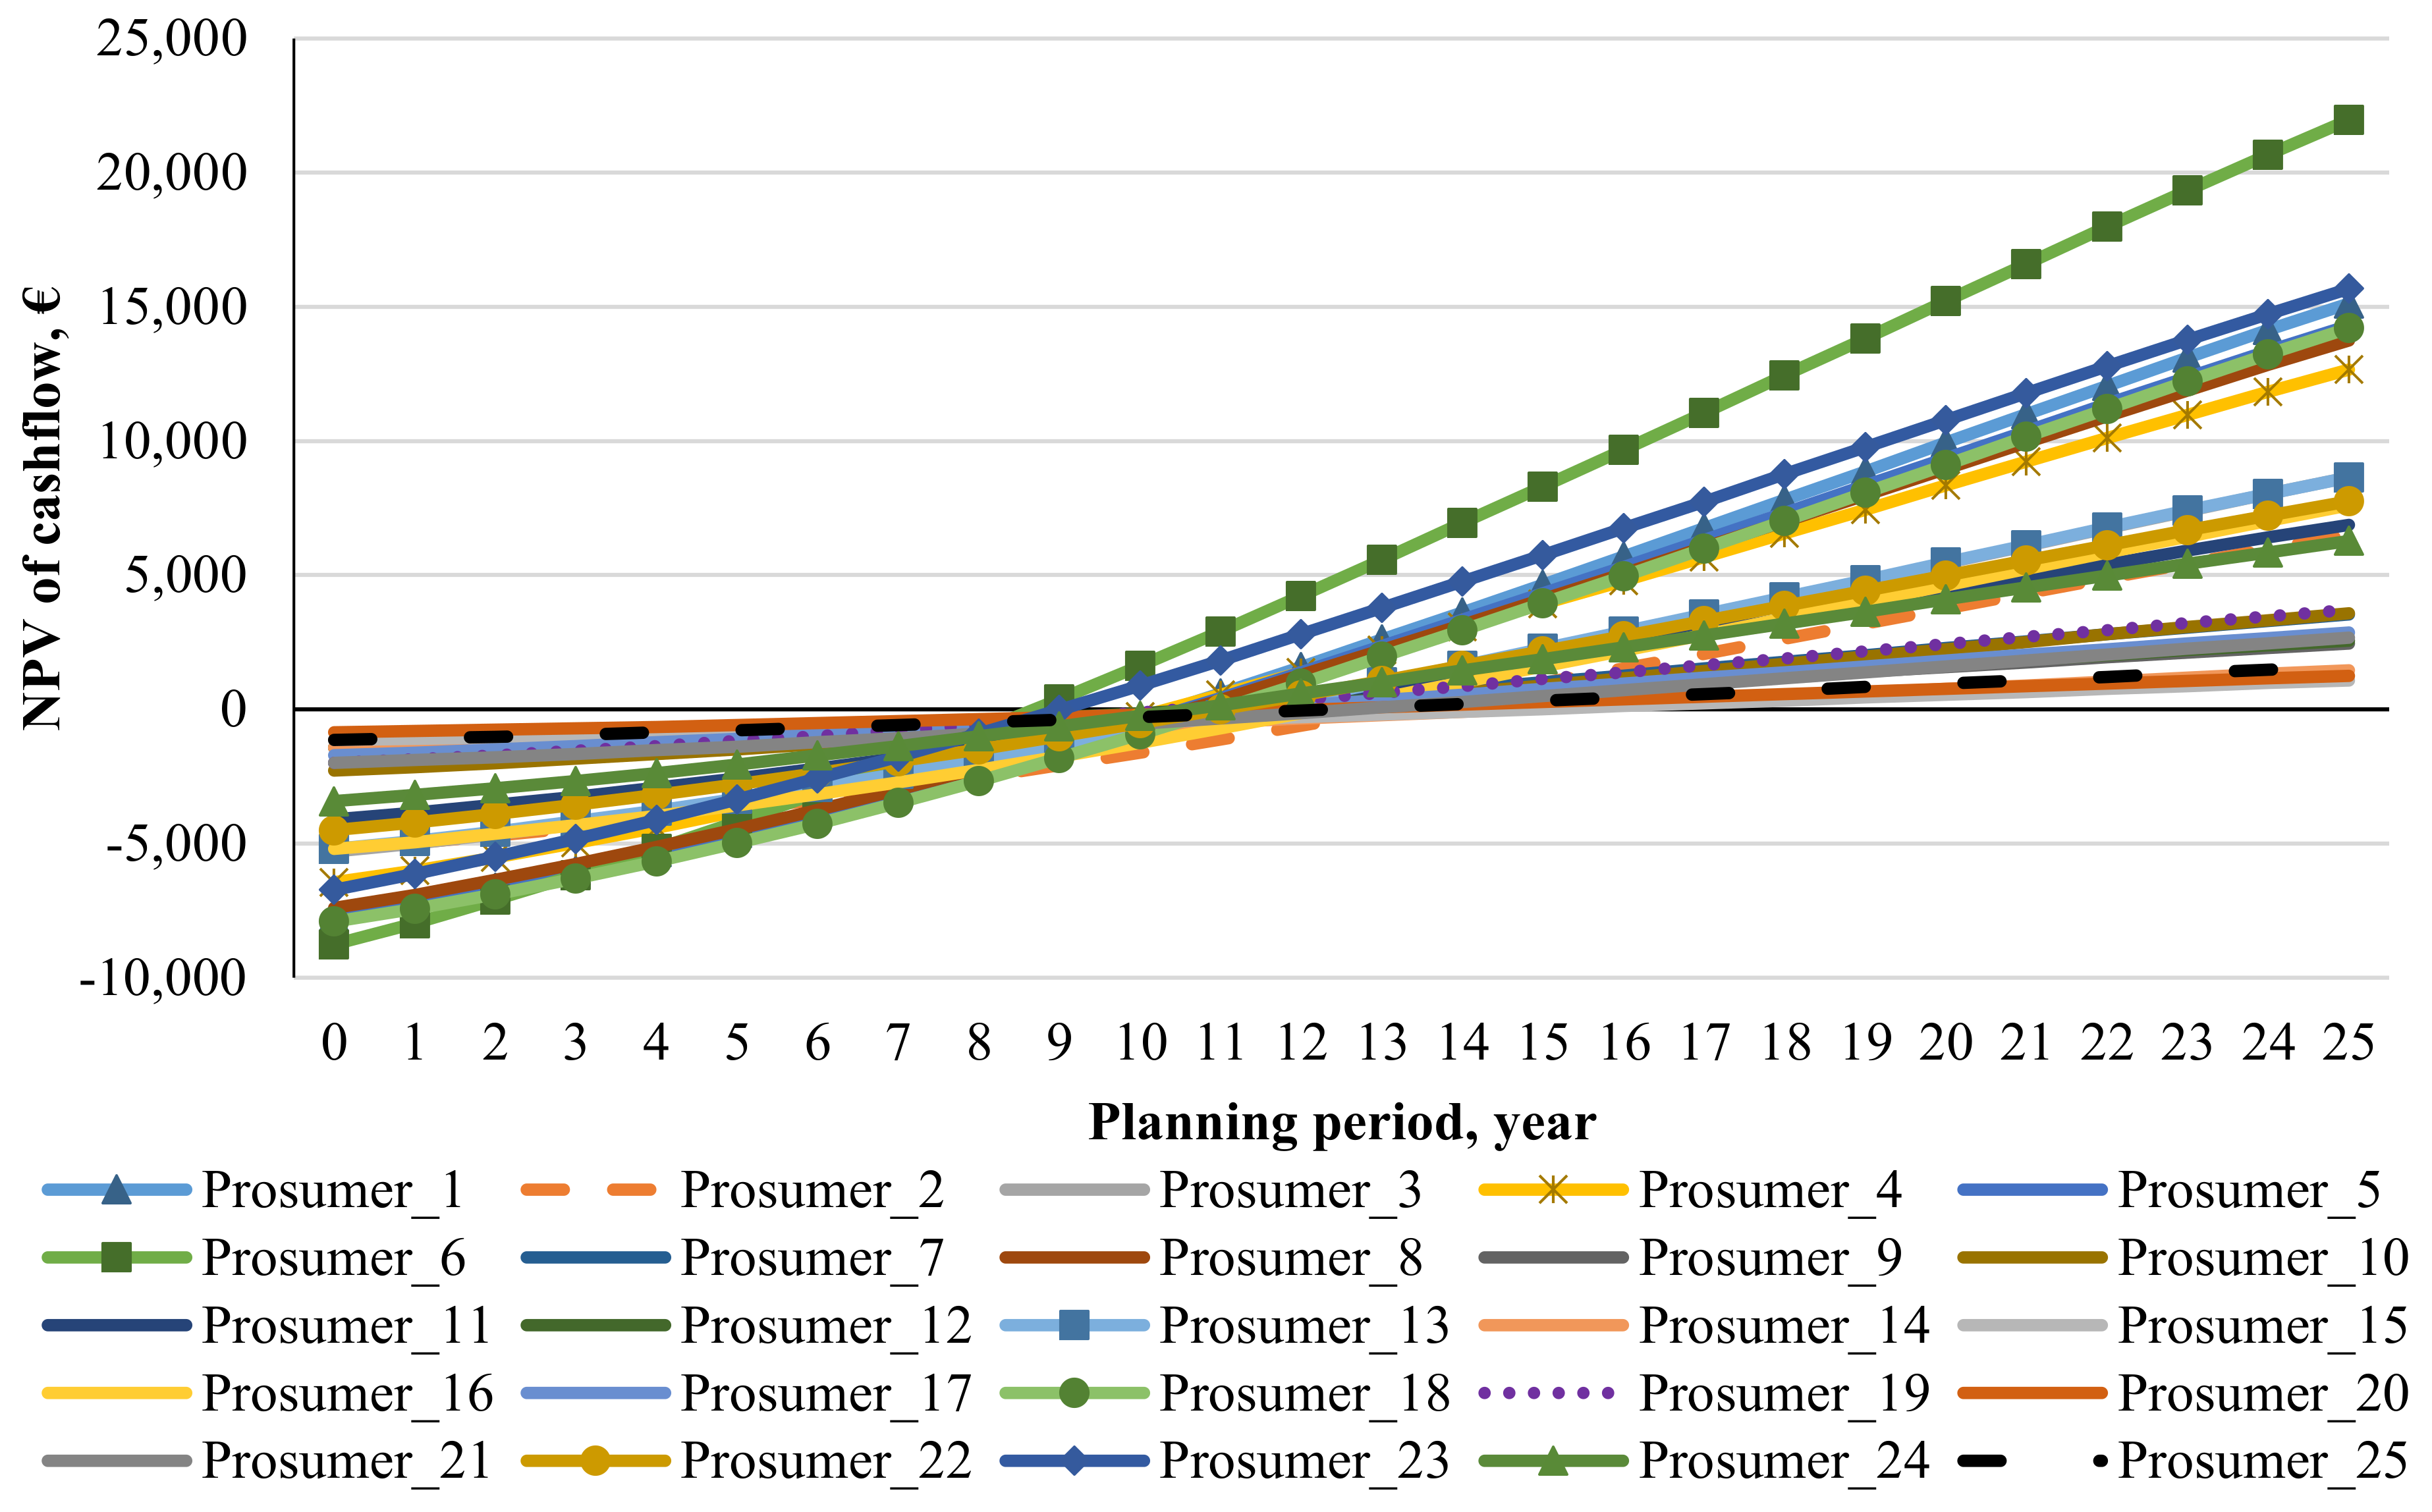
  • The NPV is calculated for two alternatives: Alternative 1 presumes taking a loan; Alternative 2 entails no loan; using the prosumer’s savings, Expstore.
  • The NPV is calculated by taking into account the prosumer’s income, Expstore, which is obtained from the energy produced by the PV technology.
  • No subsidy is applied. There are currently no grants or financing incentives available for PV generation in Latvia.
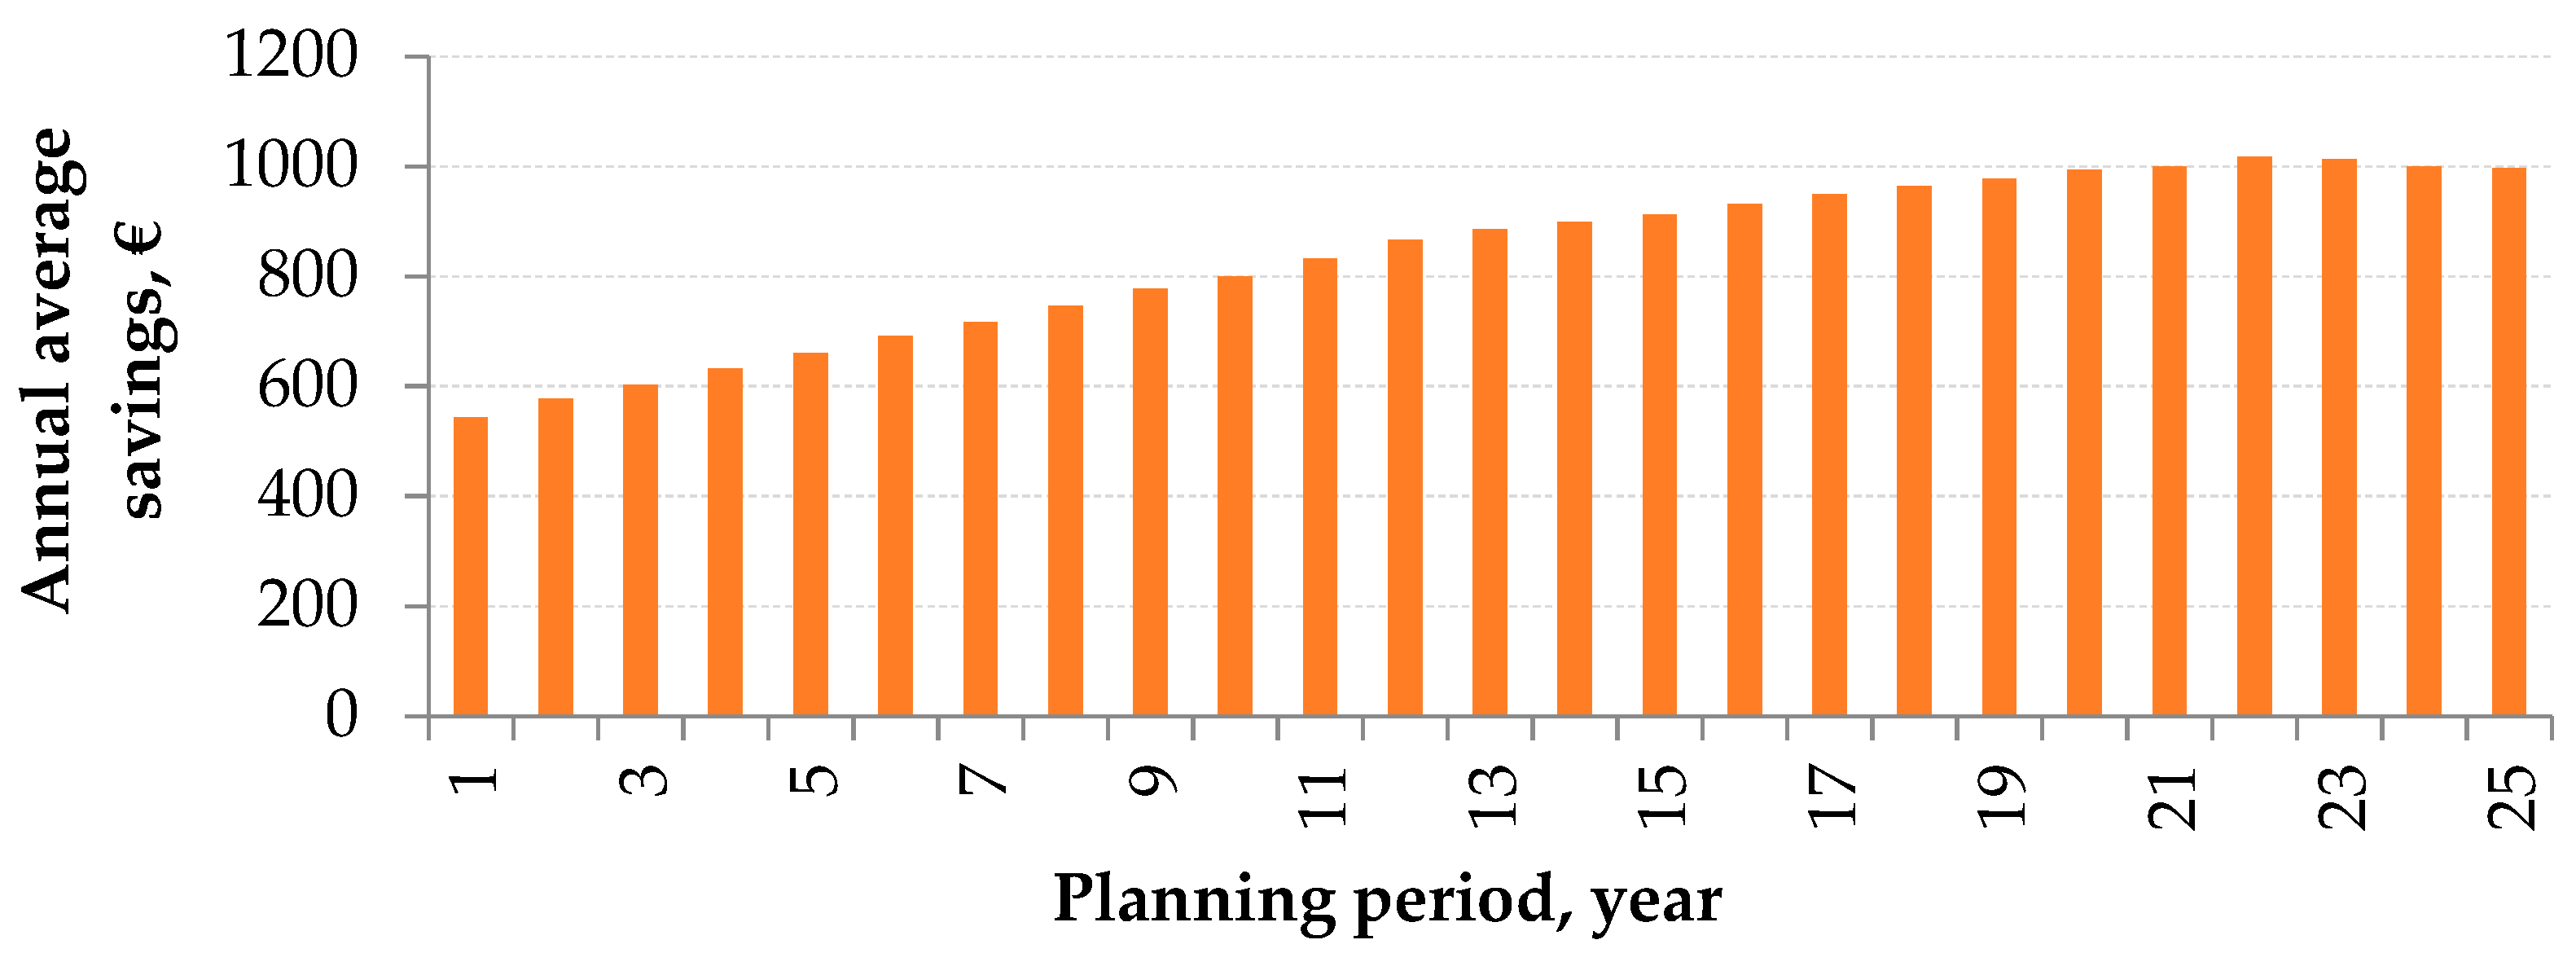
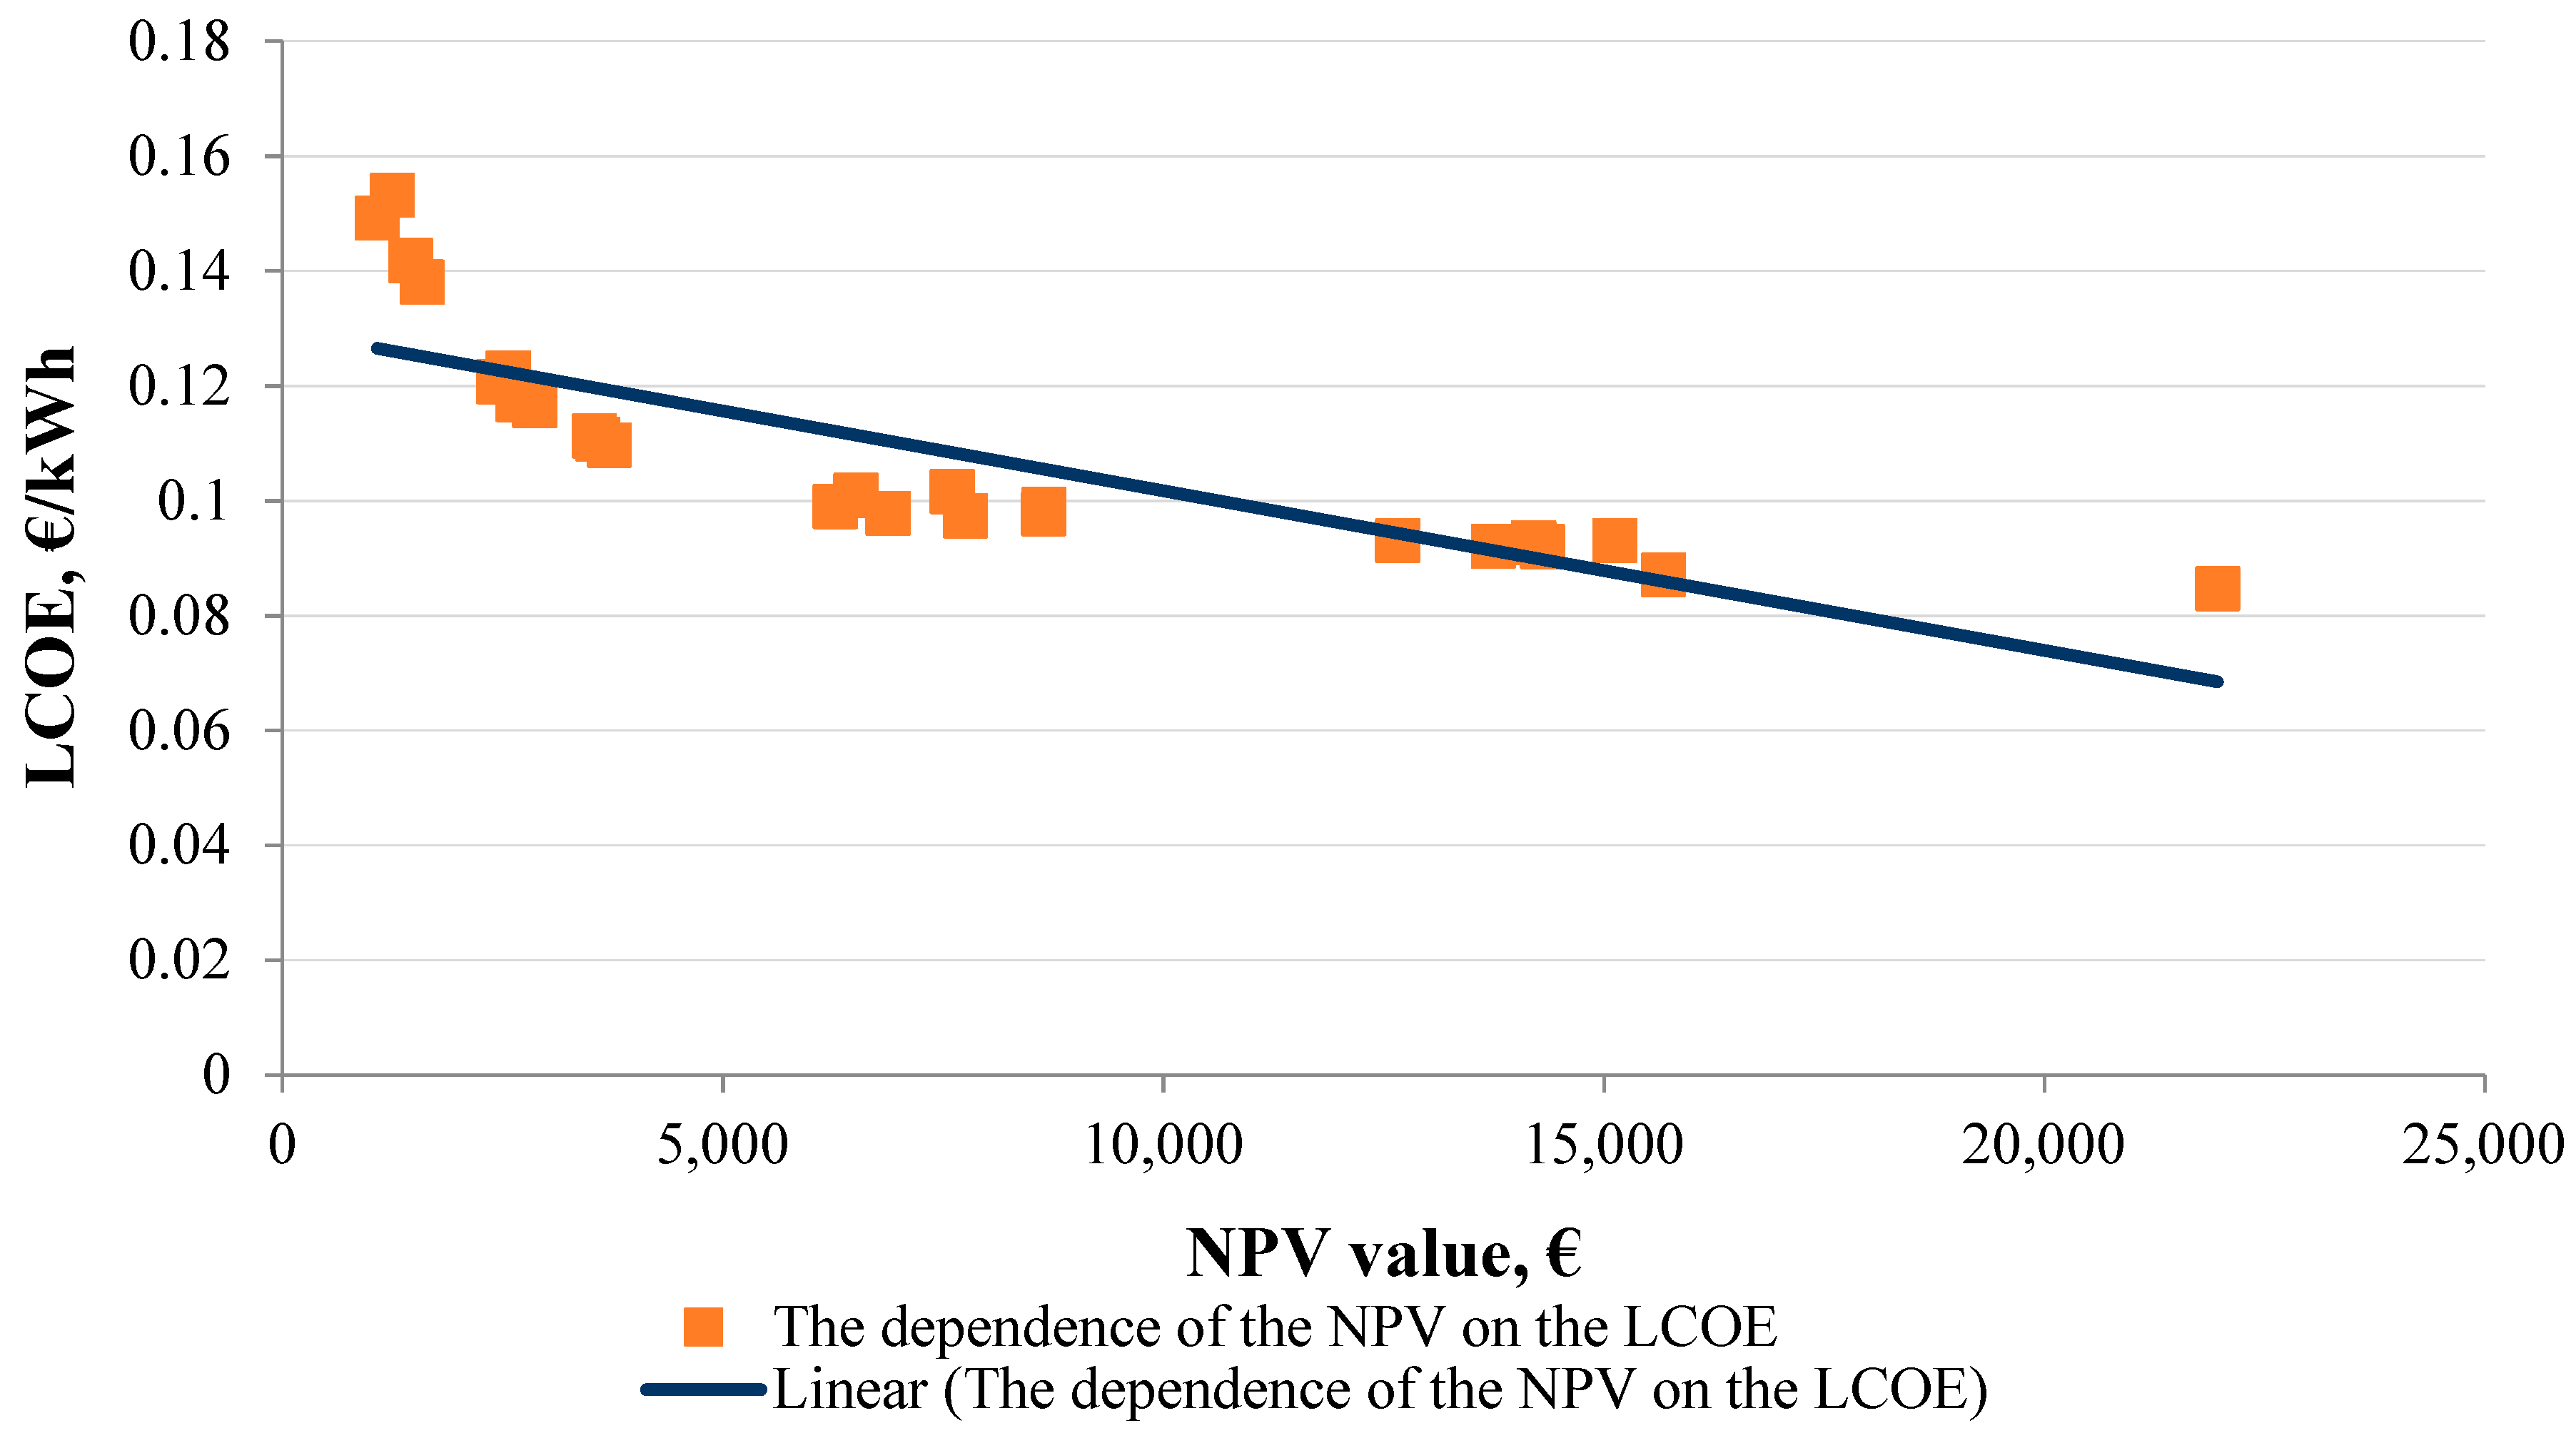
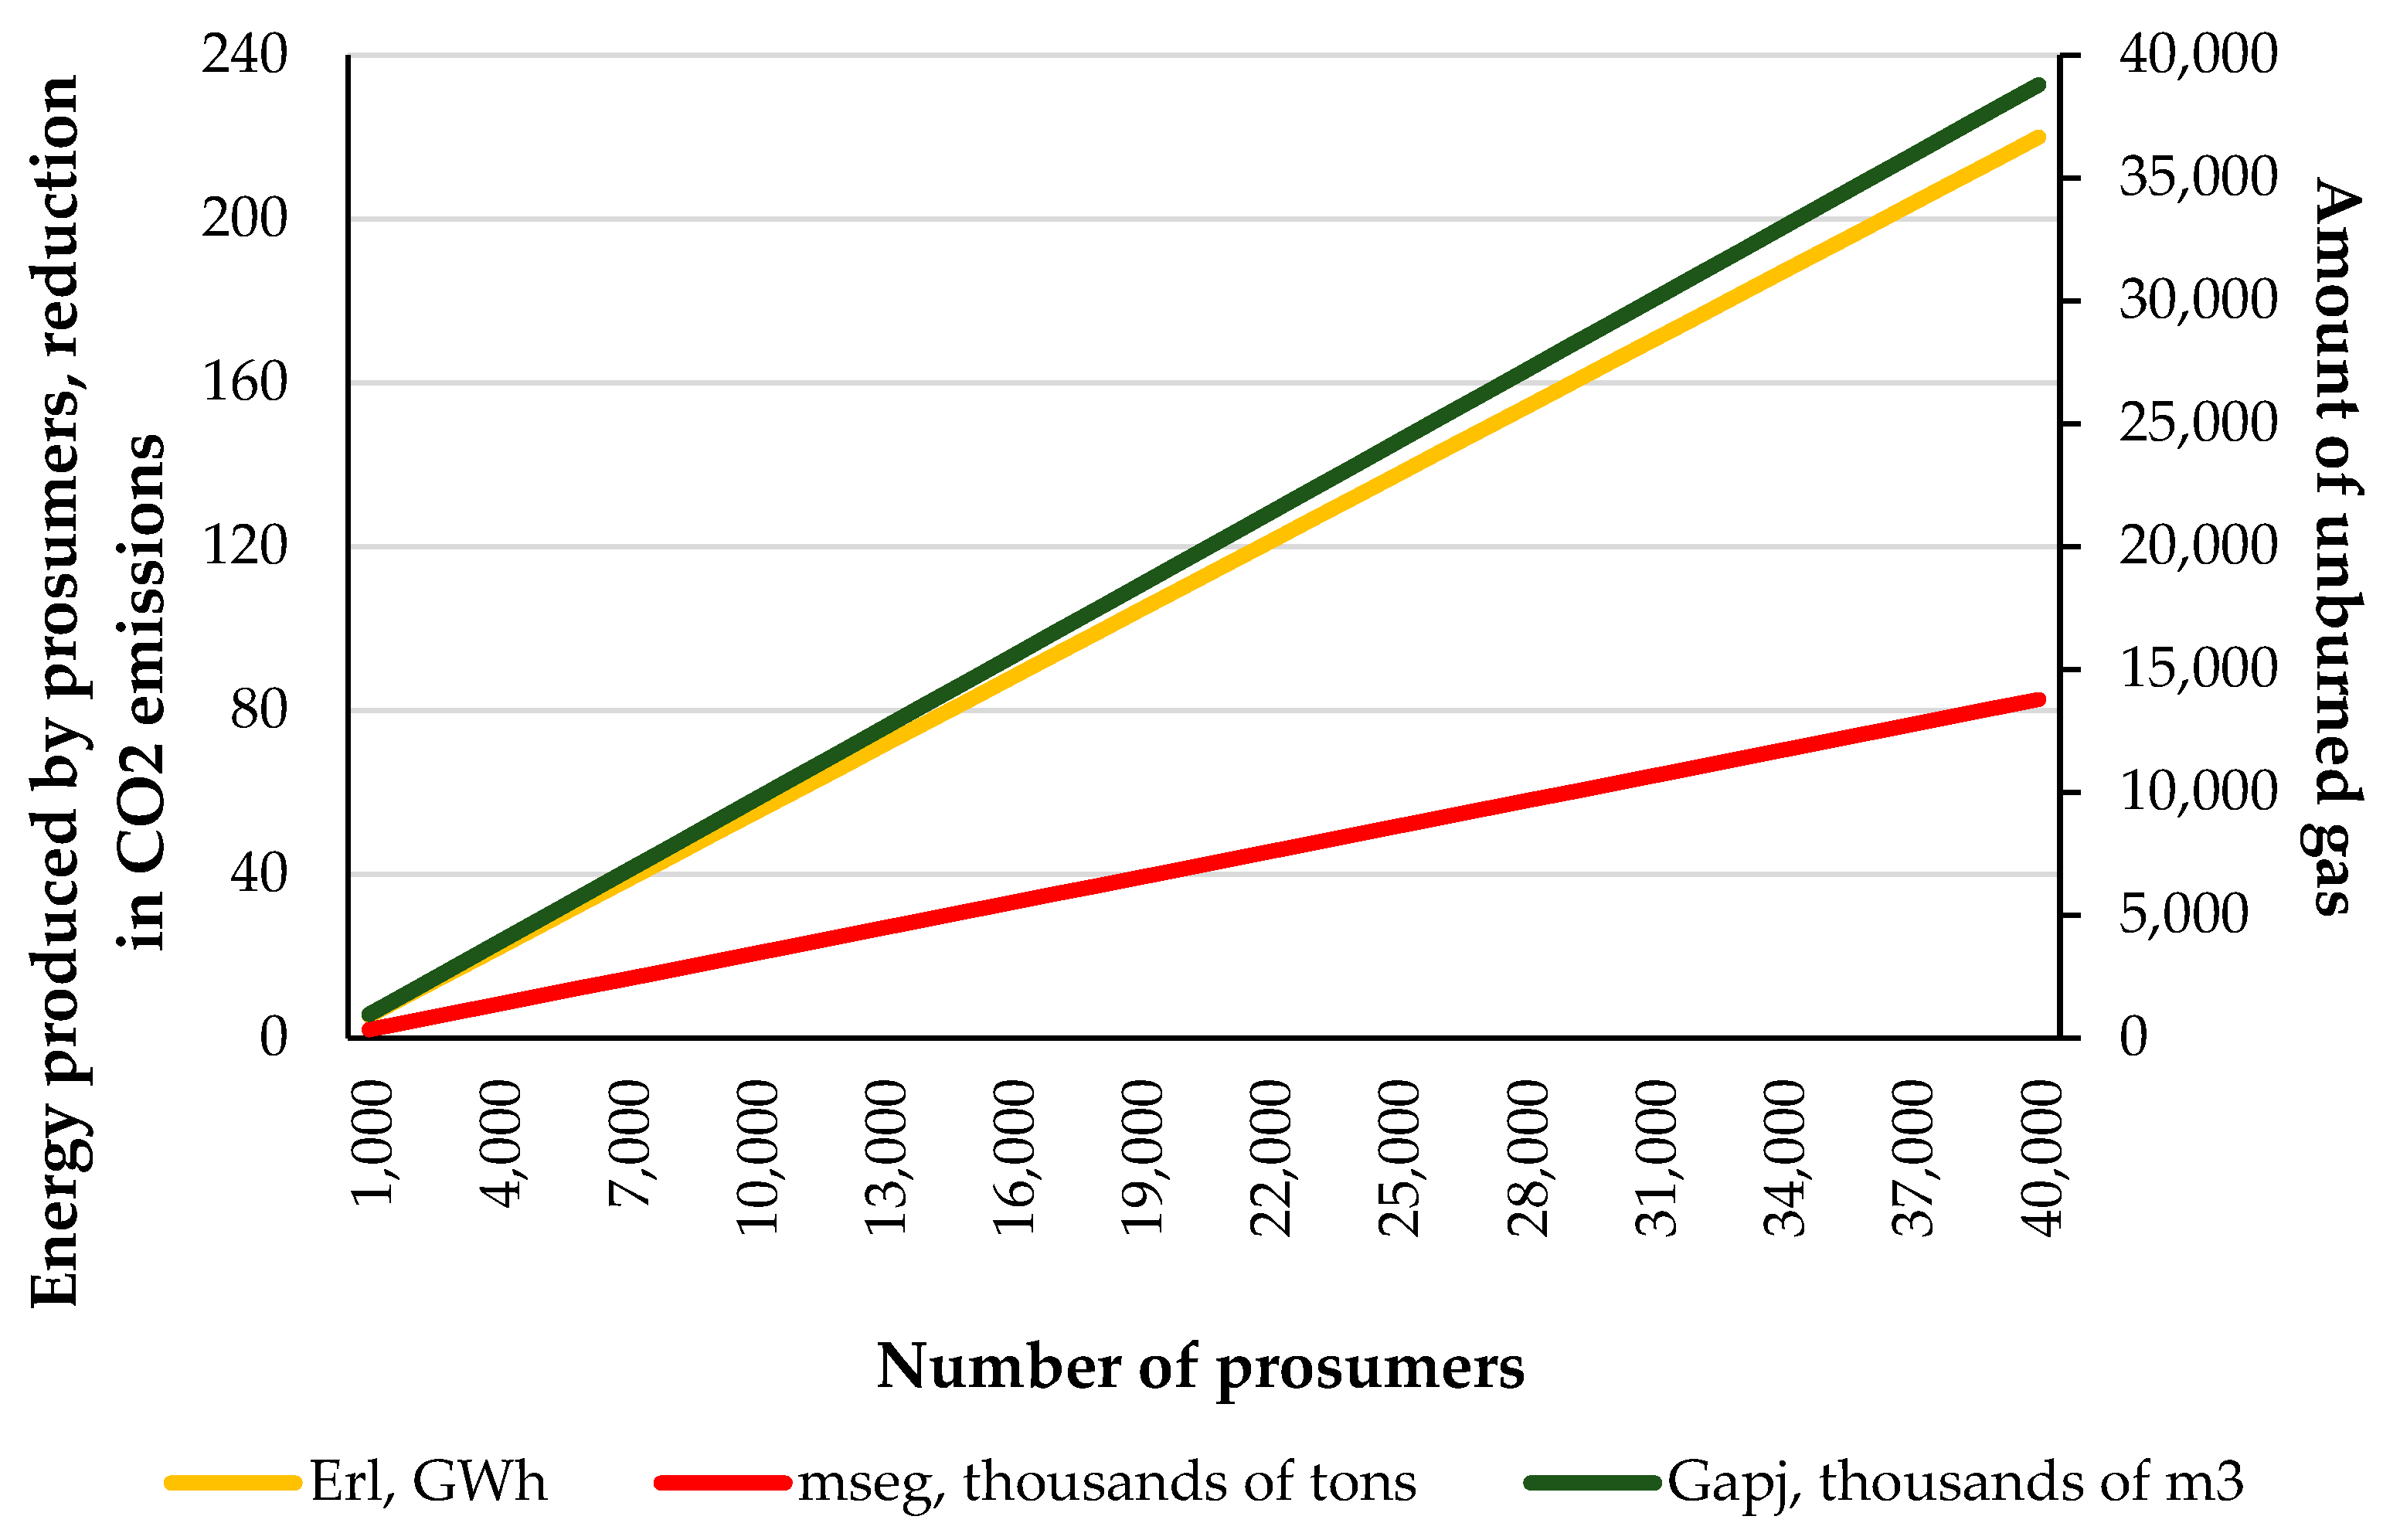
The main technical and economic assumptions are summarised in Table 1.
The data and assumptions of Table 1 are used in the calculations and taken into account in Section 3.

3. Results

Firstly, let us compare NBS and NAS. Figure 6 presents the results of the payment changes by month.
The total average payment of the end-user in the case of NBS is 732.84 € and, in the case of NAS, 829.58 €. Therefore, the difference is 11%. Consequently, NBS is beneficial for both the consumer and the power system. Moreover, the NBS encourages consumers to adapt to volatile market prices. Therefore, in Section 3 we consider only the NBS.
Table 2 and Figure 7, Figure 8, Figure 9, Figure 10, Figure 11 and Figure 12 present the results, which show the NPV, the LCOE, and the PP for each case of NBS. It must be taken into account that, if a loan is taken, the equipment payback period is longer (11 years). As a result, the action of taking a loan has a considerable impact on, first of all, the prosumer’s benefits and the PV technology payback period. However, if prices are to become higher or lower than those predicted in [50], the PP will change according to the price increase/decrease factor. As we can see, in the base case the total average electricity bill for the consumer is 37,420.72 € for a period of 25 years. In the second case, when the NBS is applied, it is 2.3 times this amount. This is also evidenced by the calculated LCOE value, which shows how much 1 kWh of electricity will cost over the whole service life of the installed equipment: 0.16 €/kWh for the base case, 0.10 €/kWh in the case of NBS with no loan, or 0.11 €/kWh with a loan. When calculating the LCOE, no consideration is given to the potential future changes in the electricity tariffs, which may impact the total value of the LCOE. For each scenario, the NPV is calculated, which takes account both the interest rates if a loan is taken and the discount rate.
From Table 2, it can be seen that the value of the NPV is positive, which means that the project succeeds in paying off within 25 years. Upon evaluating the results, we see that the highest NPV is observed in the scenario when no loan is taken, and it is equal to 11,852.97 €.
Figure 7 shows the dependence of the LCOE on the installed capacity of the PV technology.
Figure 7 shows that, as the PV capacity increases, the LCOE gradually diminishes. Based on the assumptions and the modelling methodology, the PP of the PV investment is different for all the prosumers, as shown in Figure 8.
We note that all 25 variants show a positive NPV over 25 years. It is obvious that the profitability of PV technology utilisation fluctuates greatly and this is due to several reasons. For instance, the more generated energy the prosumer uses for auxiliary consumption, the cheaper their electricity bill, and the more savings they make. As a result, the PV technology will pay off faster and the total NPV of the project will have a higher value. As can be seen from Figure 8, the 6th variant corresponds to the most profitable prosumer. Its PP is nine years and the total NPV is equal to 21,965.57 €. The worst results can be found for the 15th prosumer: the PP is 15 years and the NPV is only 1,076.22 €.
However, for the sake of simplicity, we present the average NPV of the 25 householders. The resulting NPV is shown in Table 2.
In addition, the annual savings were calculated and are shown in Figure 9.
We can see that in the first twelve years, the annual savings increase rapidly, whereas from the 12th year till the 22nd year they grow moderately. However, in the last three years of the planning period, the annual savings decrease slightly. This is because, from 2040 onwards, electricity prices will most probably drop despite growing prices for primary energy carriers and CO2.
The cause for this lies in the high feed-in tariff of wind and solar power plants, which increases the periods of low and even negative electricity prices [50]. Figure 10 shows the dependence of the LCOE on the NPV.
As the NPV increases, the value of the LCOE diminishes and using the NS becomes more profitable for the prosumers. The overall results show that the installation of PV technologies and the use of the NBS can provide benefits both for the end user and the grid operator under certain conditions. For instance, the electricity bills of the prosumers are significantly reduced. Moreover, after the 11th year (when the prosumer takes a loan), the remaining 14 years show only a profit from using the PV technology.
Higher retail prices make the installation of PV technologies more profitable, as the auxiliary consumption savings are worth more. The NBS system clearly performs better than the base scenario.
The assumed average capacity of a PV technology is 5.5 kW. To prevent the total amount of electricity produced by the prosumers exceeding 3% of the total electricity consumption in Latvia and in order to achieve the average level of the Nordic countries, the number of prosumers needs to be about 40,000.
In this way, a prosumer number of 40,000 can be interpreted as acceptable, both from the point of view of the other consumers and in terms of the decrease in the impact on the power system. In order to reach the above number of prosumers by 2030, it would be necessary to equip approximately 4000 households every year with PV technologies. In our opinion, such an increase is achievable, albeit with difficulty.
Let us point out that by 2017, there were only about 40 new prosumers in Latvia every year; therefore, by analysing Figure 11, it can be concluded that the depicted capacity can only be achieved by considerably changing the conditions for setting up prosumers.
It can be expected that the increase in the number of prosumers will be lower than 40,000 as depicted above. The cases with a lower forecast of the increase in installed capacities and a lower number of prosumers achieved by 2030 are shown in Figure 11.
From the above, it can be concluded that if the present trend of an increasing number of prosumers and installed capacities, the number of prosumers in 2030 would not even reach 1000. In order to reach the optimistic value of 40,000, 4000 new prosumers would have to emerge per year. If the number of new prosumers is 1000 per year, then the achievable installed capacity for 2030 is 55 MW; with the total number of new prosumers being 40,000, the installed capacity reaches 220 MW.
The calculated amounts of electricity produced by the prosumers, unburned natural gas, and the decrease in the CO2 emissions depending on the number of prosumers are shown in Figure 12. If Latvia reaches the level of the Nordic countries in the utilisation of PV technology, it will be possible to additionally produce approximately 220 GWh of electricity, avoid burning approximately 40 million m3 of natural gas per year, and diminish the CO2 emissions by approximately 82,000 tonnes per year.
Figure 12 shows that as the utilisation of PV technologies increases, the amount of fossil gas burned diminishes, as does the amount of CO2 emissions, which in turn has an indirect impact on the country’s GDP. Hence, it can be said that a further economic analysis of PV technology utilisation is needed in order to evaluate the country’s benefits from not purchasing and burning fossil fuel.

4. Discussion

Within the present net system, the prosumer can save an average of approximately 56% compared to the annual electricity costs of household consumers. When using a net billing system (NBS), the average payback period of the RES equipment installed by the prosumer is 11 years (if a loan is taken) or 8 years (if no loan is taken). However, the payback period (PP) is strongly dependent on the predicted prices. The PP will obviously change according to the price increase/decrease factor. Considering that accounting of electricity takes place on the basis of the amount of electricity submitted to the grid and received from the grid, it can be said that the net accounting system (NAS) is separated from the operation of the electricity market and does not stimulate prosumers to adapt to fluctuating market prices, which would diminish the amount of electricity demanded from the grid at high-price hours. The NAS is not adapted to the use of smart technologies, i.e., prosumers are not encouraged to install energy generation/consumption controls and energy accumulators and to use advantages that could benefit both the prosumer and the power grid as a whole. Therefore, it is useful to apply the NBS, which will stimulate consumers to purchase RES equipment.
With Latvia reaching the level of the Nordic countries regarding the utilisation of PV technologies, a considerable amount of fossil fuel would be saved and the amount of CO2 emissions would be diminished, resulting in additional financial savings. In order to achieve such ambitious goals, the following important principles need to be observed: application of taxes for fossil fuel to stimulate the use of renewable energy sources; instead of subsidising, market mechanisms have to be used to prevent market distortion; the best projects emerge when there is competition, so they have to be selected by way of tenders, giving preference to those projects which require the least amount of subsidies; solutions have to be stimulated that do not burden the consumers and the infrastructure, bringing the producers closer to the consumers; the legal environment needs to be improved and obstacles to the development of large-scale RES removed. From the point of view of sustainability, it is important to support the development of renewable energy sources and thus achieve the goals set by the Latvian government. To sum up, the issue of the future of energy policies is of decisive importance to Latvia, since it can be expected to have an impact on the national economy as a whole and on all of its sectors.

5. Conclusions

The net accounting system used in Latvia needs to be changed due to the following: prosumers are not being stimulated to adapt to changing market prices and the needs of the distribution and transmission grids. The existing system is not adapted to the use of smart technologies, i.e., prosumers are not encouraged to install energy generation/consumption controls and energy accumulators and to use advantages that could benefit both the prosumer and the power grid as a whole. The application of the net billing system ensures a reduction in the payback (11%) and stimulates the use of PV technology. The average Latvian prosumer’s annual benefits (without a loan) exceed 10% of the capital investment, which is more than the bank deposit interest rate. Such benefits can be attractive to users who are able to invest their money. In the case of a loan, a large part of the benefits go to the repayment of the loan. The use of PV technologies, even in small Nordic countries, can reduce the volume of imported gas and emissions into the atmosphere.
The data collected in this work and the developed algorithm can be used as a basis for the development of PV technology evaluation software (future work). For acceleration of the use of PV, the provision of free access to this software is intended for all potential prosumers.

Author Contributions

The contributions of the authors to this paper are as follows: The main idea was proposed by all authors. A.S. contributed the methodology. L.Z. contributed to the design of long-term plan calculations, analysed the results, and wrote the paper. L.P. wrote the model software and performed the calculations for the study. A.J. and I.M. contributed resources and data curation.

Funding

This work was founded by Latvian Council of Science, project: Management and Operation of an Intelligent Power System (I-POWER) (No. lzp-2018/1-0066).

Conflicts of Interest

The authors declare no conflict of interest.

References

  1. European Commission Directive 2009/28/EC of the European Parliament and of the Council of 23 April 2009 on the Promotion of the Use of Energy from Renewable Sources and Amending and Subsequently Repealing Directives 2001/77/EC and 2003/30/EC (2009). Available online: https://eur-lex.europa.eu/LexUriServ/LexUriServ.do?uri=OJ:L:2009:140:0016:0062:en:PDF (accessed on 15 August 2018).
  2. Renewable Energy Policy Network for the 21st Century Renewables 2017 Global Status Report—REN21. Available online: http://www.ren21.net/wp-content/uploads/2017/06/17-8399_GSR_2017_Full_Report_0621_Opt.pdf (accessed on 5 November 2018).
  3. European Commission. Energy Efficiency Directive—European Commission. Available online: https://ec.europa.eu/energy/en/topics/energy-efficiency/energy-efficiency-directive (accessed on 5 November 2018).
  4. Technology Roadmap-Smart Grids. (International Energy Agency, Paris). Available online: https://www.iea.org/publications/freepublications/publication/TechnologyRoadmapHow2GuideforSmartGridsinDistributionNetworks.pdf (accessed on 3 November 2018).
  5. Hosenuzzaman, M.; Rahim, N.A.; Selvaraj, J.; Hasanuzzaman, M.; Malek, A.B.M.A.; Nahar, A. Global prospects, progress, policies, and environmental impact of solar photovoltaic power generation. Renew. Sustain. Energy Rev. 2015, 41, 284–297. [Google Scholar] [CrossRef]
  6. Popovic, I.; Radovanovic, I. Methodology for detection of photovoltaic systems underperformance operation based on the correlation of irradiance estimates of neighboring systems. J. Renew. Sustain. Energy 2018, 10. [Google Scholar] [CrossRef]
  7. Fraunhofer Institute for Solar Energy Systems—ISE Photovoltaics Report. Available online: https://www.ise.fraunhofer.de/content/dam/ise/de/documents/publications/studies/Photovoltaics-Report.pdf (accessed on 7 November 2018).
  8. Jäger-Waldau, A. PV Status Report 2017, EUR 28817 EN; Publications Office of the European Union: Luxembourg, 2017; ISBN 978-92-79-74071-8. [Google Scholar] [CrossRef]
  9. Dijkgraaf, E.; Van Dorp, T.P.; Maasland, E. On the effectiveness of feed-in tariffs in the development of solar photovoltaics. Energy J. 2018, 39, 81–99. [Google Scholar] [CrossRef]
  10. Dusonchet, L.; Telaretti, E. Comparative economic analysis of support policies for solar PV in the most representative EU countries. Renew. Sustain. Energy Rev. 2015, 42, 986–998. [Google Scholar] [CrossRef]
  11. García-Álvarez, M.; Cabeza-García, L.; Soares, M. Assessment of energy policies to promote photovoltaic generation in the European Union. Energy 2018, 151, 864–874. [Google Scholar] [CrossRef]
  12. Electricity Price Statistics. Available online: https://ec.europa.eu/eurostat/statistics-explained/index.php/Electricity_price_statistics#Electricity_prices_for_household_consumers (accessed on 5 October 2018).
  13. La Monaca, S.; Ryan, L. Solar PV where the sun doesn’t shine: Estimating the economic impacts of support schemes for residential PV with detailed net demand profiling. Energy Policy 2017, 108, 731–741. [Google Scholar] [CrossRef] [Green Version]
  14. EK “Solar Energy Policy in the EU and the Member States, from the Perspective of the Petitions Received“. Available online: http://www.europarl.europa.eu/RegData/etudes/STUD/2016/556968/IPOL_STU (2016)556968_EN.pdf (accessed on 5 October 2018).
  15. Zemite, L.; Kutjuns, A.; Bode, I.; Kunickis, M.; Zeltins, N. Consistency Analysis and Data Consultation of Gas System of Gas-Electricity Network of Latvia. Latv. J. Phys. Tech. Sci. 2018, 55, 22–34. [Google Scholar] [CrossRef]
  16. Dufo-López, R.; Bernal-Agustín, J.L. A comparative assessment of net metering and net billing policies. Study cases for Spain. Energy 2015, 84, 684–694. [Google Scholar] [CrossRef]
  17. Pyrgou, A.; Kylili, A.; Fokaides, P.A. The future of the feed-in tariff (FiT) scheme in europe: The case of photovoltaics. Energy Policy 2016, 95, 94–102. [Google Scholar] [CrossRef]
  18. Solarplaza, M.M. Overview of European PV Capacity Running out of Feed-In Tariffs & Alternative Revenue Streams. Available online: https://www.solarplaza.com/channels/asset-management/11738/overview-european-pv-capacity-running-out-feed-tariffs-alternative-revenue-streams/ (accessed on 6 November 2018).
  19. Yamamoto, Y. Pricing electricity from residential photovoltaic systems: a comparison of feed-in tariffs, net metering, and net purchase and sale. Sol. Energy 2012, 86, 2678–2685. [Google Scholar] [CrossRef]
  20. Jacobs, D.; Sovacool, B.K. Feed-In Tariffs and Other Support Mechanisms for Solar PV Promotion. Compr. Renew. Energy 2012, 1, 73–109. [Google Scholar] [CrossRef]
  21. Campoccia, A.; Dusonchet, L.; Telaretti, E.; Zizzo, G. Comparative analysis of different supporting measures for the production of electrical energy by solar pv and wind systems: four representative european cases. Sol. Energy 2009, 83, 287–297. [Google Scholar] [CrossRef]
  22. Poullikkas, A.; Kourtis, G.; Hadjipaschalis, J. A review of net metering mechanism for electricity renewable energy sources. Int. J. Energy Environ. 2013, 4, 975–1001. [Google Scholar]
  23. Jasevics, A.; Zemite, L. Kunickis Demand load control with smart meters. In Proceedings of the 58th Annual International Scientific Conference on Power and Electrical Engineering of Riga Technical University (RTUCON), Riga, Latvia, 12–13 October 2017. [Google Scholar]
  24. Photovoltaic Geographical Information System. Available online: http://re.jrc.ec.europa.eu/pvg_tools/en/tools.html#PVP (accessed on 12 August 2018).
  25. Legal sources on renewable energy. Latvia: Overall Summary. Available online: http://www.res-legal.eu/search-by-country/latvia/ (accessed on 5 November 2018).
  26. Electricity Market Law, §30 par.1,2,3,4. Available online: https://www.google.ru/url?sa=t&rct=j&q=&esrc=s&source=web&cd=1&ved=2ahUKEwiEobzn0dneAhVEBiwKHQVlAxAQFjAAegQICBAC&url=http%3A%2F%2Fwww.vvc.gov.lv%2Fexport%2Fsites%2Fdefault%2Fdocs%2FLRTA%2FCiti%2FElectricity_Market_Law.doc&usg=AOvVaw3UGSfxk4NRZmm5VG_xTrlT (accessed on 7 November 2018).
  27. Solar Resource Maps and GIS Data for 200+ Countries. Available online: https://solargis.com/maps-and-gis-data/overview/ (accessed on 7 November 2018).
  28. Petrichenko, L.; Broka, Z.; Sauhats, A.; Bezrukovs, D. Cost-Benefit Analysis of Li-Ion Batteries in a Distribution Network. In Proceedings of the 2018 15th International Conference on the European Energy Market (EEM), Łódź, Poland, 27–29 June 2018; pp. 1–5. [Google Scholar]
  29. Zemite, L.; Gerhard, J.; Gorobetz, M.; Levchenkov, A. Optimization of distribution system reliability. In Proceedings of the 16th International Conference on Environment and Electrical Engineering (EEEIC), Florence, Italy, 6–8 June 2016. [Google Scholar]
  30. Huld, T.; Jäger-Waldau, A.; Ossenbrink, H.; Szábo, S.; Dunlop, E.; Taylor, N. Cost Maps for Unsubsidised Photovoltaic Electricity. Available online: https://setis.ec.europa.eu/sites/default/files/reports/Cost-Maps-for-Unsubsidised-Photovoltaic-Electricity.pdf (accessed on 31 July 2018).
  31. Dusonchet, L.; Telaretti, E. Economic analysis of different supporting policies for the production of electrical energy by solar photovoltaics in western European Union countries. Energy Policy 2010, 38, 3297–3308. [Google Scholar] [CrossRef]
  32. Amillo, A.; Huld, T.; Müller, R. A new database of global and direct solar radiation using the eastern meteosat satellite, models and validation. Remote Sensing 2014, 6, 8165–8189. [Google Scholar] [CrossRef] [Green Version]
  33. Hempel, S.; Schweinsberg, C.; Schmidt, J.; Tröster, E.; Ackermann, T. Smart Network Control with Coordinated PV Infeed. Available online: http://regridintegrationindia.org/wp-content/uploads/sites/3/2017/09/7A_5_GIZ17_xxx_paper_Eckehard_Troester.pdf (accessed on 29 July 2018).
  34. Darghouth, N.R.; Barbose, G.; Wiser, R.H. Customer-economics of residential photovoltaic systems (Part 1): The impact of high renewable energy penetrations on electricity bill savings with net metering. Energy Policy 2014, 67, 290–300. [Google Scholar] [CrossRef]
  35. Holdermann, C.; Kissel, J.; Beigel, J. Distributed photovoltaic generation in Brazil: An economic viability analysis of small-scale photovoltaic systems in the residential and commercial sectors. Energy Policy 2014, 67, 612–617. [Google Scholar] [CrossRef]
  36. Kroics, K.; Zemite, L.; Gaigals, G. Analysis of advanced inverter topology for renewable energy generation and energy storage integration into AC grid. In Proceedings of the 16th International Scientific Conference Engineering for Rural Development, Jelgava, Latvia, 24–26 May 2017. [Google Scholar]
  37. Gajowniczek, K.; Nafkha, R.; Ząbkowski, T. Electricity peak demand classification with artificial neural networks. In Proceedings of the 2017 Federated Conference on Computer Science and Information Systems (FedCSIS), Prague, Czech Republic, 3–6 September 2017. [Google Scholar]
  38. Ząbkowski, T.; Gajowniczek, K.; Szupiluk, R. Grade analysis for energy usage patterns segmentation based on smart meter data. In Proceedings of the 2015 IEEE 2nd International Conference on Cybernetics (CYBCONF), Gdynia, Poland, 24–26 June 2015. [Google Scholar]
  39. Sauhats, A.; Petričenko, Ļ; Berjozkina, S. Stochastic Planning of Distribution Lines. In Proceedings of the 2016 13th International Conference on the European Energy Market (EEM 2016), Porto, Portugal, 6–9 June 2016. [Google Scholar]
  40. Moshkin, I.; Sauhats, A. Solving district heating problems by using cooperative game theory methods. In Proceedings of the 16th International Conference on Environment and Electrical Engineering (EEEIC 2016), Florence, Italy, 6–8 June 2016. [Google Scholar]
  41. Singh, S.; Yassine, A. Big Data Mining of Energy Time Series for Behavioral Analytics and Energy Consumption Forecasting. Energies 2018, 11, 452. [Google Scholar] [CrossRef] [Green Version]
  42. Aggarwal, S.K.; Saini, L.M.; Kumar, A. Electricity price forecasting in deregulated markets: A review and evaluation. Int. J. Electr. Power Energy Syst. 2009, 31, 13–22. [Google Scholar] [CrossRef]
  43. Singh, N.; Mohanty, S.R. A Review of Price Forecasting Problem and Techniques in Deregulate ElectricityMarkets. J. Power Energy Eng. 2015, 3, 1–19. [Google Scholar] [CrossRef]
  44. Pandey, N.; Upadhyay, K.G. Different price forecasting techniques and their application in deregulated electricity market: A comprehensive study. In Proceedings of the 2016 International Conference on Emerging Trends in Electrical Electronics & Sustainable Energy Systems (ICETEESES), Sultanpur, India, 11–12 March 2016. [Google Scholar]
  45. Petrichenko, R.; Baltputnis, K.; Sauhats, A.; Sobolevsky, D. District Heating Demand Short-Term Forecasting. In Proceedings of the 17th International Conference on Enviroment and Electrical Engineering (IEEE EEEIC 2017), Italy, Milan, 6–9 June 2017. [Google Scholar]
  46. Yao, M.; Zhao, M.; Xiao, H.; Wang, D. Research on mid-long term load forecasting based on combination forecasting mode. In Proceedings of the 2015 IEEE/ACIS 16th International Conference on Software Engineering, Artificial Intelligence, Networking and Parallel/Distributed Computing (SNPD), Takamatsu, Japan, 1–3 June 2015. [Google Scholar]
  47. Agarwal, A.; Ojha, A.; Tewari, S.C.; Tripathi, M.M. Hourly load and price forecasting using ANN and fourier analysis. In Proceedings of the 2014 6th IEEE Power India International Conference (PIICON), Delhi, India, 5–7 December 2014. [Google Scholar]
  48. Ariyo, A.A.; Adewumi, A.O.; Ayo, C.K. Stock Price Prediction Using the ARIMA Model. In Proceedings of the 2014 UKSim-AMSS 16th International Conference on Computer Modelling and Simulation, Cambridge, UK, 26–28 March 2014. [Google Scholar]
  49. Sauhats, A.; Čuvičins, V.; Bočkarjova, G.; Žalostība, D.; Antonovs, D.; Petričenko, R. Detection and Management of Large Scale Disturbances in Power System. In Critical Information Infrastructures Security. Lecture Notes in Computer Science: Vol.8985; Springer International Publishing: Limassol, Cyprus, 2016; pp. 147–152. [Google Scholar]
  50. Energy Prices Forecast. Available online: https://blog.energybrainpool.com/en/trends-in-the-development-of-electricity-prices-eu-energy-outlook-2050/ (accessed on 5 October 2018).
  51. AS “Sadales Tīkls” Electricity Distribution Differential Tariffs. Available online: https://www.sadalestikls.lv/uploads/2018/01/ST_tarifi_ENG.pdf (accessed on 5 October 2018).
  52. Electricity Price Components. Available online: http://www.eptirgotajs.lv/no-2018-gada-sagaidama-oik-samazinasanas/#/ [on Latvian] (accessed on 5 October 2018).
  53. Bank Interest Rates. Available online: https://www.bank.lv/statistika/dati-statistika/procentu-likmju-statistikas-raditaji/galvenas-procentu-likmes [in Latvian] (accessed on 5 October 2018).
Figure 1. The structure of the algorithm for evaluating the annual expenses.
Energies 11 03222 g001
Figure 2. The changeability of the process.
Energies 11 03222 g002
Figure 3. A structural diagram of process prediction.
Energies 11 03222 g003
Figure 4. The structure of the algorithm structure.
Energies 11 03222 g004
Figure 5. The dependence of photovoltaic (PV) technology costs on PV capacity.
Energies 11 03222 g005
Figure 6. Average payment of the end-user in the case of net billing system (NBS) and net accounting system (NAS).
Energies 11 03222 g006
Figure 7. The dependence of the LCOE on PV capacity.
Energies 11 03222 g007
Figure 8. NPV for PV investment for 25 prosumers (taking a loan).
Energies 11 03222 g008
Figure 9. Annual savings of a prosumer during a planning period.
Energies 11 03222 g009
Figure 10. The dependence of the LCOE on the NPV.
Energies 11 03222 g010
Figure 11. The forecast increase in the capacities of installed equipment by 2030.
Energies 11 03222 g011
Figure 12. The impact of renewable energy sources (RES) technology utilisation.
Energies 11 03222 g012
Table 1. The key assumptions.
Name of the Parameter; Measuring UnitValue
Number of phases3
Payment for the trading service, €/kWh0.00564
FV component, €/year115.11
VP component, €/kWh0.07104
Planning time, years25
Loan interest rate, %2.6
Discount rate, % 2.0
Table 2. The initial financial performance results.
ScenarioAccording to MCLoanSum of Annual Mean Costs, €NPV, €PP, YearsLCOE, €/kWhLCOE Changes in Respect to the Base Case, %
Base case Accounting-37420.72--0.160.00%
NBSBillingpresent16446.077468.60110.11−33.40%
Billingabsent11852.9780.10−38.13%

