On the Disruptive Innovation Strategy of Renewable Energy Technology Diffusion: An Agent-Based Model


1
School of Management and Economics, Beijing Institute of Technology, Haidian, Beijing 100081, China
2
Energy Systems Division, Argonne National Laboratory, Lemont, IL 60439, USA
3
School of Electrical Engineering, Northeast Electric Power University, Jilin 132012, China
*
Authors to whom correspondence should be addressed.
Energies 2018, 11(11), 3217; https://doi.org/10.3390/en11113217
Submission received: 22 October 2018
/
Revised: 13 November 2018
/
Accepted: 13 November 2018
/
Published: 20 November 2018
(This article belongs to the Section C: Energy Economics and Policy)
Abstract
:Renewable energy technologies (RETs) are crucial for solving the world’s energy dilemma. However, the diffusion rate of RETs is still dissatisfactory. One critical reason is that conventional energy technologies (CETs) are dominating energy markets. Emergent technologies that have inferior initial performance but eventually become new dominators of markets are frequently observed in various industries, which can be explained with the disruptive innovation theory (DIT). DIT suggests that instead of competing with incumbent technologies in the dominated dimension, redefining the competition on a two-dimensional basis is wise. Aiming at applying DIT to RET diffusion, this research builds an agent-based model (ABM) considering the order of entering the market, price, preference changing and RET improvement rate to simulate the competition dynamics between RETs and CETs. The findings include that the order of entering the market is crucial for a technology’s success; disruptive innovation is an effective approach to cope with the disadvantage of RETs as latecomers; generally, lower price, higher consistency with consumers’ preferences and higher improvement rate in the conventional dimension are beneficial to RET diffusion; counter-intuitively, increasing RET’s improvement rate in the conventional dimension is beneficial to RET diffusion when the network is sparse; while it is harmful when the network is densified.
1. Introduction
Renewable energy technologies (RETs) are crucial for solving the world’s energy dilemma [1]. Developing and utilizing RETs are in accordance with the Kyoto Protocol and the Paris Agreement, which stand for an admitted environmental goal pursued by the whole world. Furthermore, RETs play an important role in moving the globe toward a cleaner and more sustainable energy system [2,3]. However, the diffusion rate of RETs is still dissatisfactory [4,5,6]. One important reason responsible for the slow diffusion is that RETs are not yet as competitive as conventional energy technologies (CETs), which have been developing (at least) since the first industrial revolution and outperform renewable energies in multiple aspects, e.g., efficiency, initial cost, stability, ease of use and accessibility [4,6].
The initial cost of RETs is usually much higher than CETs, which significantly hampers RETs’ diffusion. A typical example is photovoltaic (PV) systems. According to the recent data [7], a 4.7 kW dc rooftop PV system in Illinois costs $13,758 and saves $574 annually. Given a 25-year lifespan of a PV system, a house owner can obtain $14,350 in total, but only $592 net income. This calculation has not counted inflation yet. If time preference (meaning that people value immediate incomes more than future gains) is considered, the total income of $14,530 has an equivalent incentive effect to merely $5962 immediate income [8,9]. Filling the huge gap to generate effective economic incentive is never easy. Nevertheless, one unique dimension renewable energies possess is that they are renewable. This dimension endows RETs with incomparable advantages and importance and suggests an opportunity to challenge CETs.
Generally, the value of a new technology or product can be broken down into an old dimension and a new dimension. As for RETs, the old dimension is the value of providing energy, which is consistent with the expertise of CETs. In many cases, RETs are not competitive in the old dimension, compared with CETs [10]. Nevertheless, RETs can effectively reduce environmental pollution [11,12], which significantly differentiates RETs from CETs. This dichotomy is inspired by the disruptive innovation theory (DIT), well known from the insights into the success of many technologies with inferior performance in the old dimension while having superior performance in the new dimension [13,14,15].
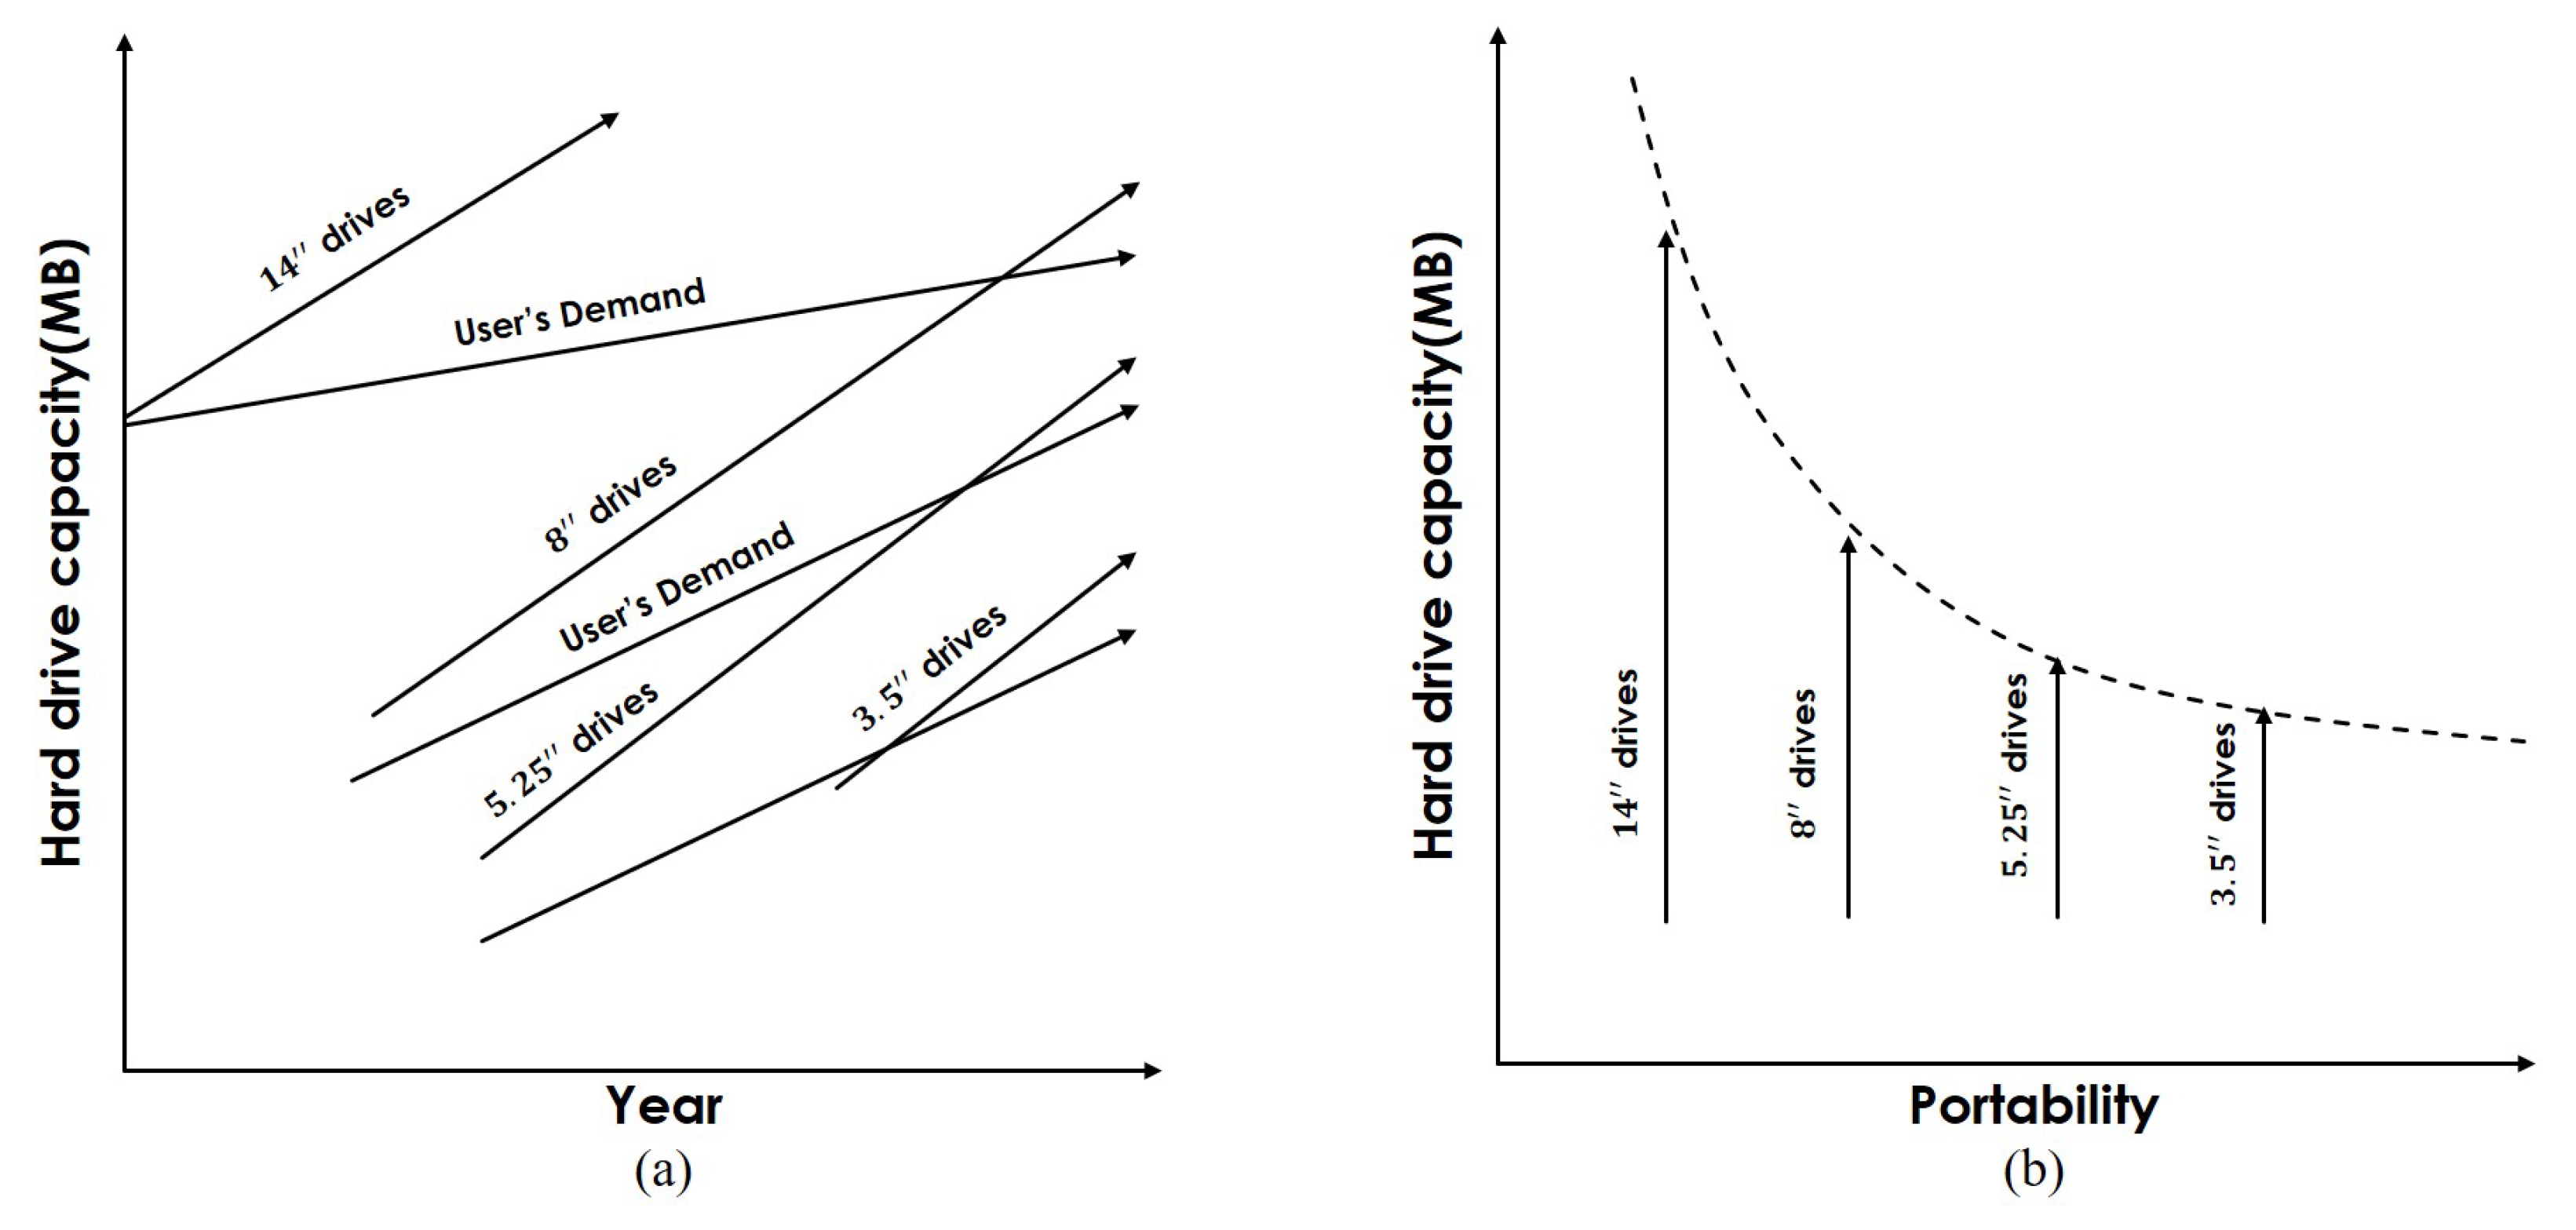
DIT was originally aimed to explain an intriguing phenomenon observed in the hard drive industry of America. As shown in (a) of Figure 1, there exists a pattern that the sales of hard drives with large capacities and sizes are all exceeded by the latecomers with smaller capacities and sizes. One critical reason is that the hard drives in small sizes possess more portability than the incumbents do. (b) in Figure 1 provides an explanatory illustration. The dashed curve is an indifference curve, which is comprised of the points representing different combinations of capacity and portability, but providing the same utility. As witnessed, the hard drives of smaller sizes with lower capacity can provide equivalent utilities to what the high-capacity hard drives provide, which suggests opportunities to challenge the incumbent technologies even with inferior performance in one dimension. Similar phenomena in a wide range of industries have been witnessed and explained with DIT [15]. Renewable energy researchers and practitioners began to realize that actively launching disruptive innovation strategies under the pressure of incumbent technologies was “worth a shot” [15,16,17].
Some emergent RET enterprises indeed engage in the disruptive innovation strategy (DIS). Tesla Motors is a star electric car company, which has popularized the concept and demonstrated the feasibility of powering vehicles with electricity. Although, electric cars are not as convenient as conventional cars by far, markets show an unexpected strong demand for Tesla Motors’ products. Instead of barely focusing on improving the maximum mileage its electric cars can cover, Tesla Motors has successfully introduced a brand new dimension: smartness, which differentiates its products from the “clumsy” conventional cars. SolarCity is a subsidiary of Tesla Motors and a leading residential solar system installation company. Different from other solar energy companies, SolarCity does not only advertise the system efficiency of its solar panels, but also places a great emphasis on the decorative function and super durability of the solar tiles [18]. It provides customers with integrated energy service, as well. Another example is Offset Solar. It advertises solar products to invoke people’s awareness of environmental protection. Furthermore, it offers customers a mobile application to track the performance of each solar panel, which brings users an innovative experience. Generally, those newly-proposed dimensions of RETs are added value. A relevant phenomenon was found in a highly competitive Nordic electricity market: even when retail electricity was high priced, users were willing to pay if innovative services were provided [19]. Nevertheless, the currently low popularity of the DIS among renewable energy companies does not match its fame in other industries. A crucial reason is that the factors that could significantly affect the effectiveness of DIT are unclear because of the complexity residing in the competition among different technologies.
This paper conducts exploratory research on the competition dynamics between CETs and RETs from the perspective of disruptive innovation. Considering the dynamic nature of technological competition and various scenarios that cannot be captured by traditional methods, agent-based modeling is used. Multiple variables are considered, and four critical factors—the order of entering a market, price, preference changing, technology improvement rate—are investigated. Academically, this research contributes to supplementing the existing RET diffusion literature, which mainly uses qualitative methods or statically unveils the barriers and drivers of RET adoption [20]. Practically, this research can offer practitioners a new approach to develop RET products and design more effective R&D strategies; also, this paper could provide policymakers with an innovative perspective to make policies that foster RET diffusion.
The rest of this paper is structured as follows. In the next section, the conceptual frameworks for building the model are introduced, and the model dynamics is detailed. The numerical experiments and results are elaborated in the Results section. The Discussion section extracts the implications from the experiments. Conclusions are summarized in the final section.
2. Materials and Methods
2.1. Framework of the Model
There is rich literature that studies technology diffusion using mathematical modeling (e.g., [21,22,23,24]). These studies are top-down methods that treat the world as homogeneous, which have the merits of mathematical clarity. In contrast, agent-based modeling is a bottom-up approach working as an effective tool for exploring complex adaptive systems (CASs) that consist of numerous heterogeneous adaptive and interactive components. The agent-based model (ABM) allows researchers to build models from a microscopic base while observing emergent phenomena at the system level [25]. It bridges the micro and macro perspectives and helps researchers capture patterns that can hardly be discovered with top-down methods. Many researchers have used agent-based modeling to explore the impact of various factors on innovation diffusion [26,27,28,29,30,31,32,33] because innovation diffusion is a dynamic process having a stylized pattern emerging from the interactions between adaptive agents with different attributes and behaviors. Hence, this paper adopts agent-based modeling to explore the dynamic process of competition between RETs and CETs. Netlogo [34] is used as a platform to implement this agent-based model.
Three frameworks are incorporated to build the ABM: the disruptive innovation theory [15], the innovation decision process [35] and the Bass model [36]. These frameworks function as a skeleton and are organized in Figure 2. The innovation decision process is the backbone of the whole model. Three stages of the process are considered, i.e., knowledge, persuasion and decision. In the knowledge stage, potential adopters are informed about an innovation from mass media and other related adopters. Then, the decision process moves to the persuasion stage in which potential adopters evaluate the benefit of adopting the innovation from various aspects. The decision stage outputs the result of whether to purchase the innovation.
Concretely, in the knowledge stage, potential adopters are informed via mass media or by other adopters. In this model, we follow the assumption of Rogers and Bass, which indicates that there exists a small group of potential adopters adopting innovations independently, while the majority of adopters are related to the interactions between non-adopters and adopters. Herein, a random network is used to mimic how consumers are connected. According to the documentation of Netlogo’s “network extension”, the random network involved in this model is generated using the G(n, p) variant of the Erdős–Rényi model [37].
Disruptive innovation theory is used to flesh out the persuasion stage. According to this theory, the value of a technology can be divided into two dimensions. It is noteworthy that, when disruptive innovation enters a market for the first time, it brings a conceptually and qualitatively new dimension to the market. For example, originally, hard drives were produced for mainframe computers, and few people thought computers could be made portable and adopted by individuals until microelectronic technology brought smaller processors and hard drives. Since then, portability became an adopted concept and pursued by computer manufacturers. In the same vein, an RET can be decomposed into two dimensions: one that satisfies the demand for conveniently using energy and one that differs from the former dimension, which could be enriched with a qualitatively different value such as being environmentally friendly, having a green image, having a high-tech appearance, having independence from the grid, having an integrated smart energy service, etc. The former dimension is consistent with the functionality of conventional energy technologies, while the other dimension is unique and new to consumers. For clarity, we simply name the former dimension as the conventional dimension versus the non-conventional dimension for the latter.
In the decision stage, a potential adopter decides whether to purchase the innovation or not. We introduce the concept of reservation price from micro economics. Reservation price refers to the highest price one is willing to pay for a specific product. A purchase can be accomplished only when one’s reservation price exceeds the actual price. In this model, we assume that the more one’s reservation price exceeds the actual price, the more likely one would purchase, which gives agents some inertia when the surplus is positive but not significant. Therefore, factors such as switching cost and transaction cost, which work as friction that hampers purchases in the real world, are considered implicitly in this model.
The interactions between the agents at the bottom level should generate an S-shaped diffusion curve at the system level as described by the Bass model, which fits realistic data quite well and has been frequently used to predict innovation diffusion. Mathematically, the Bass model is expressed by Equation (1) as:
where denotes the new adopters in year t; p and q are constants that are normally interpreted as the external (e.g., mass media) and internal influence (e.g., imitation and word-of-mouth) on the diffusion [38,39]; N is a constant meaning the total number of potential adopters; is the number of accumulative adopters. Figure 3 illustrates how different values of p and q affect the pattern of diffusion. As witnessed, a greater p advances the take-off of a diffusion; and a greater q shortens the time to peak. The Bass model is used to calibrate the ABM, as well as an approach of cross-model validation [40], which provides an admitted stylized pattern of technology diffusion. More on model building is detailed in the following subsection.
2.2. Model Dynamics
The flowchart of the model is presented in Figure 4. Since the most critical part in this model is the competition between CETs and RETs, for clarity, only the process after RETs appear is given. Before the appearance of RETs, CETs have already developed for a long time and become fully mature, which is simulated in a similar way as the flowchart shows, but without the persuasion stage. Corresponding to the Bass model, the flowchart shows that there are two approaches that a potential RET adopter can use to become an RET adopter. One approach is independent adoption: a potential adopter becomes an adopter without being influenced by other agents. The other approach is dependent adoption: a potential RET adopter becomes a real RET adopter because of the influence from other adopters.
The agents start as potential adopters. According to Rogers [35], a small group (about 2.5%) of pioneering adopters appears in the early stage of innovation diffusion. These pioneering adopters are independent of the opinions of others. Their appearance demonstrates the adoption for potential adopters who would adopt by observing and imitating others. Following the Bass model, we use and to denote the probability that a non-adopter independently adopts CETs and RETs, respectively. Independent adopters function as seeds of the whole technology diffusion process. It should be noted that in this model, independent RET adopters can be transformed from any type of agents and keep adopting RETs constantly. This assumption is made according to the fact that independent RET adopters are usually motivated by non-economic factors, e.g., pursuing environmentally-friendly technologies [41] and educating others [42]. Hence, they are not as changeable as dependent adopters within the time span of interest.
If an agent does not become an independent RET adopter, as mentioned above, he/she can use the dependent approach to adopt. The first stage is the knowledge stage of the innovation decision process, during which potential adopters are informed by others. The probabilities and representing agent i becoming aware of CETs and RETs are determined respectively by the following Equations (2) and (3):
where () denotes the probability that a neighboring adopter of CETs (RETs) successfully influences agent i; () is the number of the neighboring adopters of CETs (RETs).
Once agent i becomes aware of a technology, he/she enters the persuasion stage. Two steps are included in this stage, i.e., preference varying and choice making. The preference of consumer i is defined in Equation (4) and calculated with Equations (5) and (6).
Equation (4) means that the preference of agent i is defined by a vector that consists of two dimensions, i.e., and , which denote the weights that agent i assigns to a technology’s conventional dimension and non-conventional dimension. The weight agent i assigns to the non-conventional dimension of a technology is determined as Equation (5), where denotes the initial weight agent i assigns to RETs’ non-conventional dimension. Agent i’s preference changes according to the influence from its neighboring RET adopters multiplying a coefficient that adjusts the degree of the influence on preference changing. also contributes to determining the upper limit of .
Vector denotes the performance of CETs that are defined by two dimensions, i.e., the conventional dimension and the non-conventional dimension, which are denoted as and (see Equation (7)). A ceiling is imperatively imposed on when implementing the model, which reflects the limitation of technological paradigms. herein is assumed as zero, which means CETs have no merit in the non-conventional dimension. This is consistent with the feature of disruptive innovation mentioned above: disruptive innovations introduce qualitatively new dimensions to markets. It is plausible to give a small non-zero value to . Whereas, this does not quantitatively change the results, it may increase the risk of blurring the clearly-defined context of disruptive innovation if is aggrandized. is updated according to Equation (8).
In Equation (8), denotes the initial performance of CETs when they enter the market at first; constant adjusts the speed of technology progress; denotes the maximal cumulative adopters of CETs at year t; M denotes the total number of potential adopters in a market, which is set at 1000. Similarly, the performances of RETs are represented by vector in Equation (9), which has two dimensions denoted as and , respectively representing the conventional and non-conventional dimension of RETs.
In the following simulations, is set as one, which means this dimension is quantitatively equal to a fully-mature conventional dimension of CETs. The absolute value of is of little interest, but in what direction drives the model and how it exerts a joint influence with other changing variables are major concerns of this paper. However, numerical experiments are conducted and introduced in the “3.2.2 Impact of Preference Changing” section to confirm that a moderate change in does not qualitatively affect the results of interest. Similar to CETs, the performance of the non-conventional dimension of RETs is updated using Equation (10). The constants and denote the initial performance and the speed of technological progress of RETs. denotes the maximum cumulative adopters of RETs within t years.
After the update of consumers’ preferences, the consumers make decisions according to the comparison between the utilities offered by different technologies. Consumer i chooses the technology that provides a larger utility after she/he becomes aware of CETs and RETs simultaneously. The utilities brought by CETs and RETs are calculated using Equations (11) and (12):
As the process moves to the decision stage, consumer i decides to purchase a CET or RET by a probability of and , which are calculated with Equations (13) and (14):
where the and denote the reservation prices of consumers willing to pay for CETs and RETs, while and denote the actual prices of CETs and RETs. Equations (13) and (14) mean that consumers are more likely to purchase a technology that offers a higher surplus (reservation price minus cost). and are determined using Equations (15) and (16).
where coefficient d is introduced to reflect the deviation between the utility a consumer perceives and the reservation price the same consumer is willing to pay. This deviation is caused by various factors (e.g., annual income). d ranges from [−1, 1] and is assumed to follow a triangular distribution. and are determined by Equations (17) and (18):
where and respectively represent the unit prices of and .
3. Results
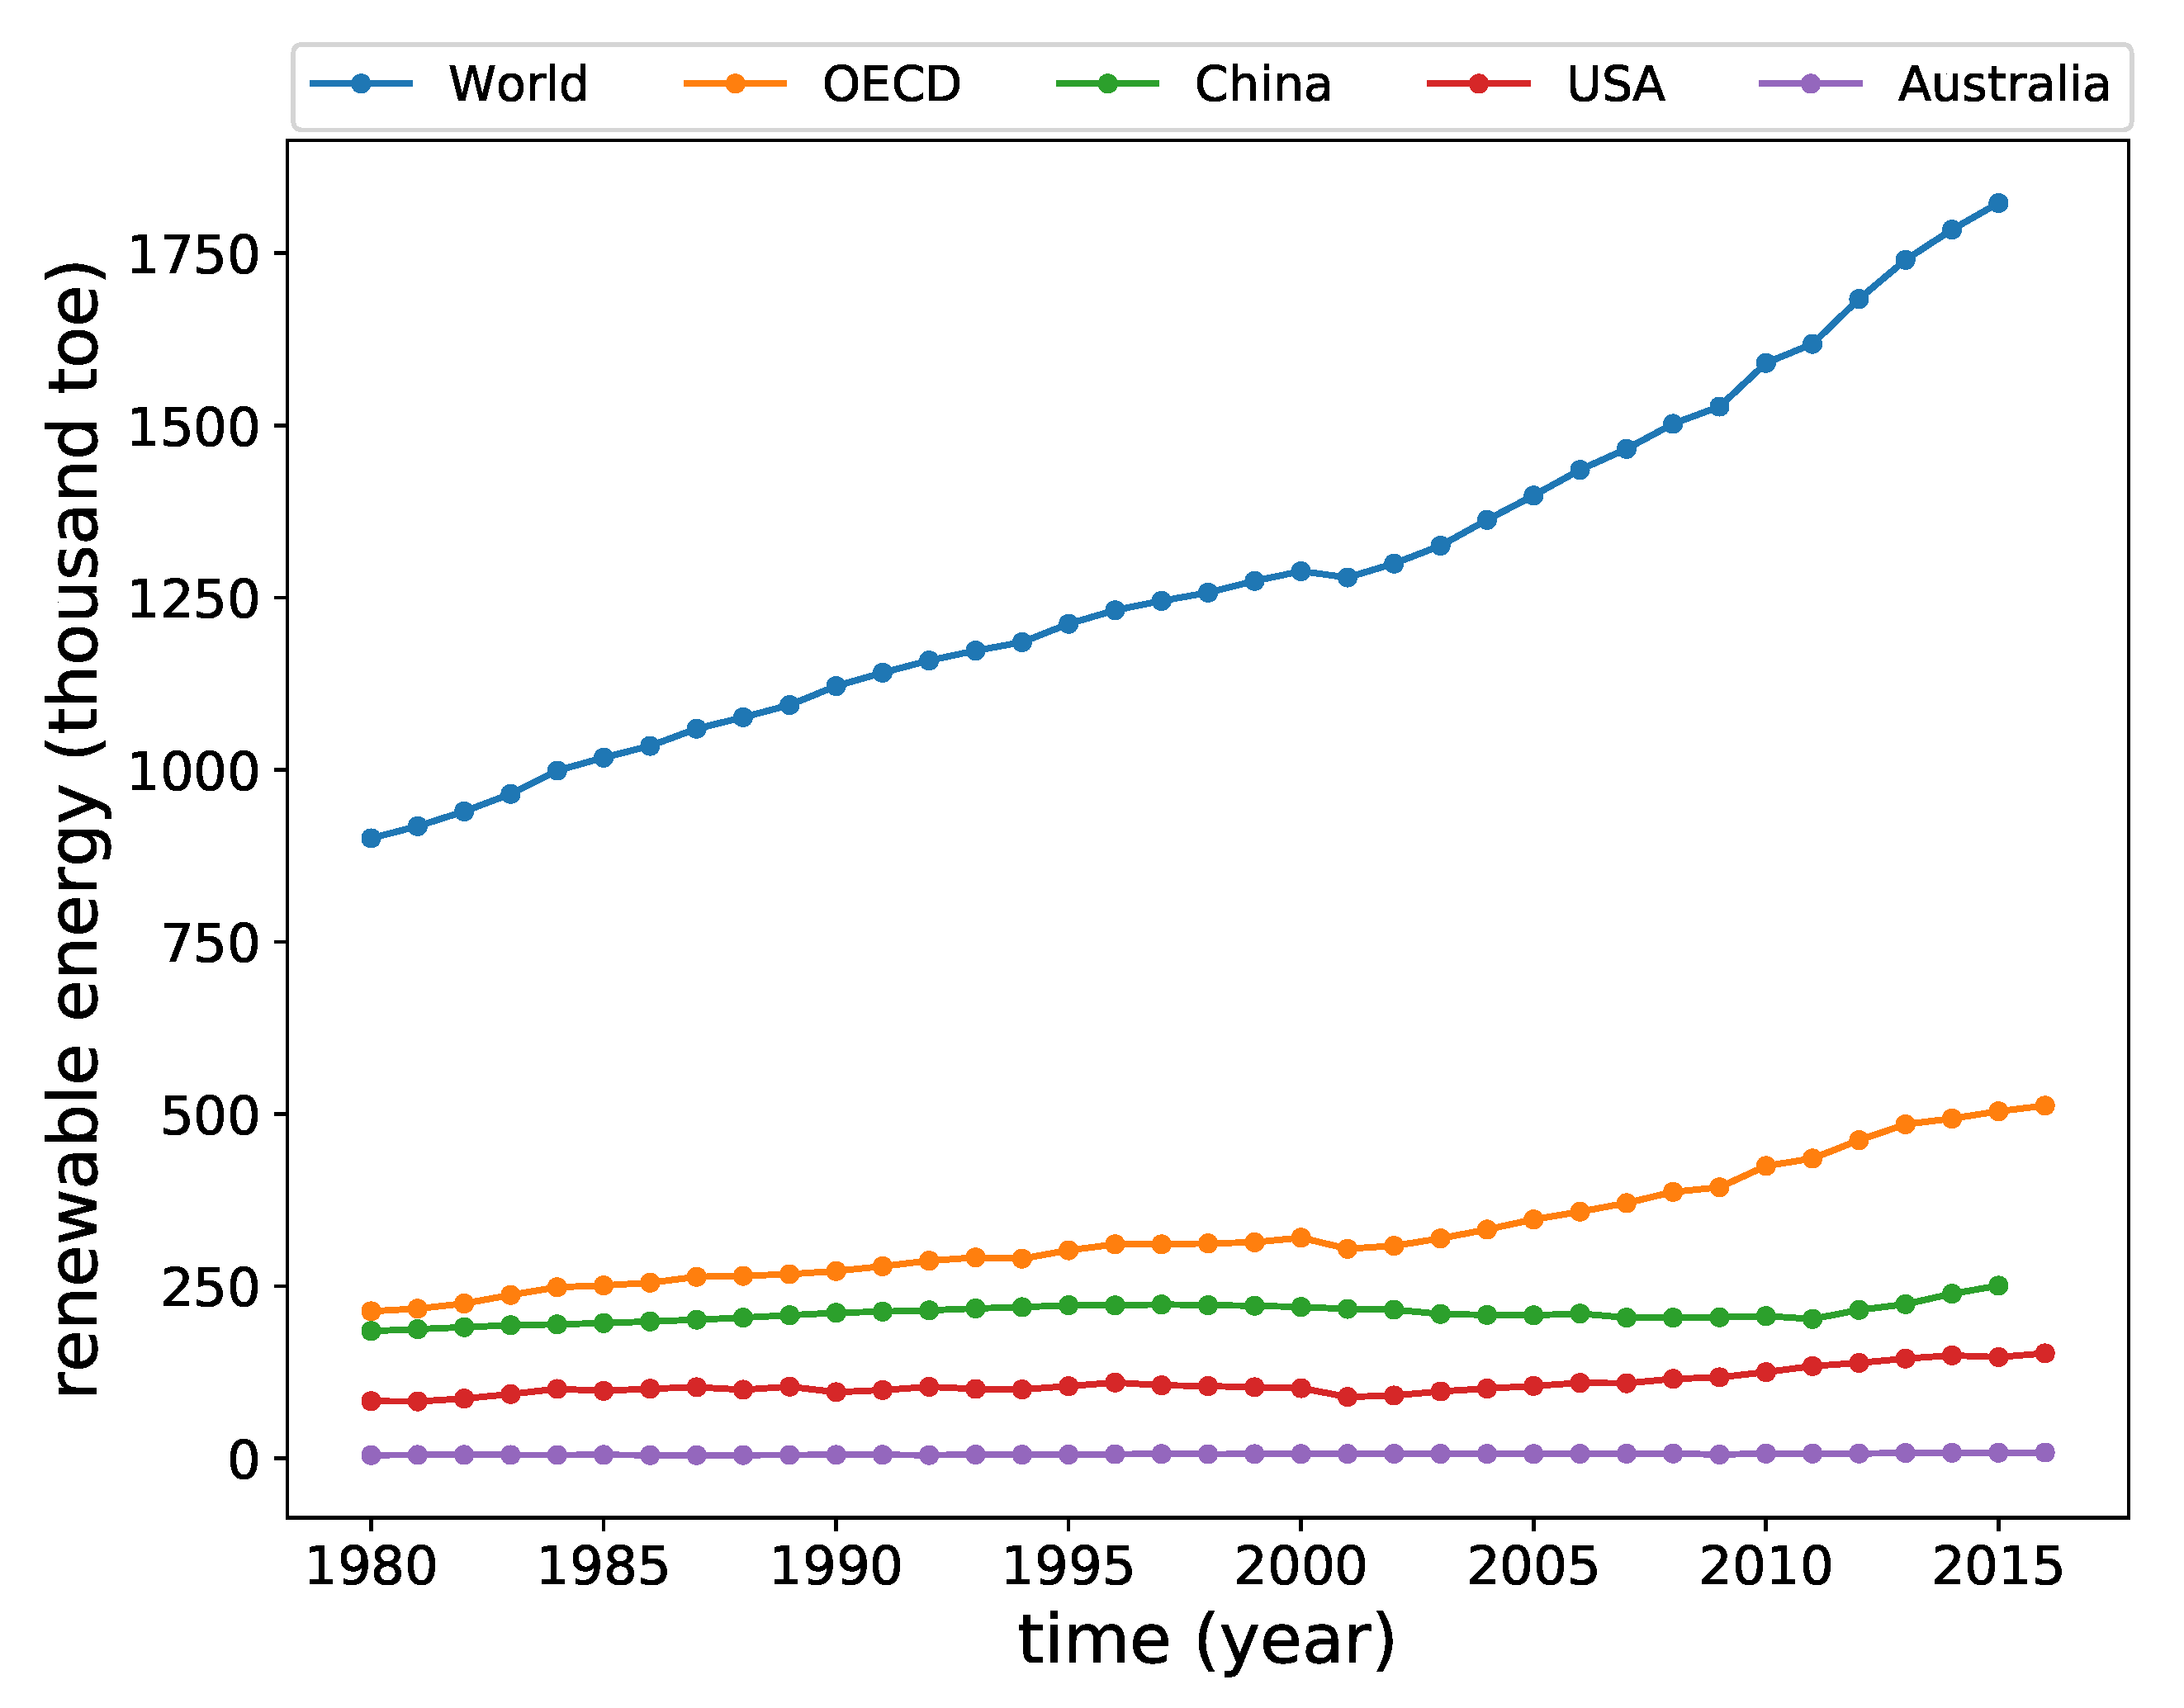
A series of numerical experiments were conducted to observe how CETs and RETs compete in the context of disruptive innovation. CETs are the incumbent technologies that are mature and widely adopted; while RETs are commonly latecomers with inferior performance in the conventional dimension, but with an irreplaceable new dimension. Therefore, it is reasonable to assume that CETs are in the late stage of an S-shaped curve, i.e., CETs are highly mature, but have a very limited growth rate. RETs are still in the infant stage, growing extremely slowly. It is commonplace to calibrate the model with real data of both types of technologies. Nevertheless, the starting point of CETs is quite ambiguous. Coal is a representative conventional energy, which has been used to provide heat for thousands of years. It is meaningless to compare RETs with such CETs. On the other hand, ideally, the two turning points of an S-shaped curve generated by the Bass model should be known to make stable estimations [38,43,44]. The historical data of renewable energy supply (see Figure 5) are far from sufficient to generate a meaningful diffusion curve.
In order to obtain a typical S-shaped curve in a definitive time span and focus on the competition dynamics between two technologies, we use the data generated from the Bass model, whose and , to calibrate the ABM. These q and p values are average values derived from 213 technologies and 10 energy-related technologies [46]. The genetic algorithm is used for searching for a combination of parameters that minimizes the difference between the results of the model and the target data. Having been calibrated, the model shows a high fitness to the target data (see Figure 6), which means the model is qualitatively validated and can replicate the stylized fact of technology diffusion. Based on this curve, the following numerical experiments are conducted.
3.1. One-Dimensional Competition
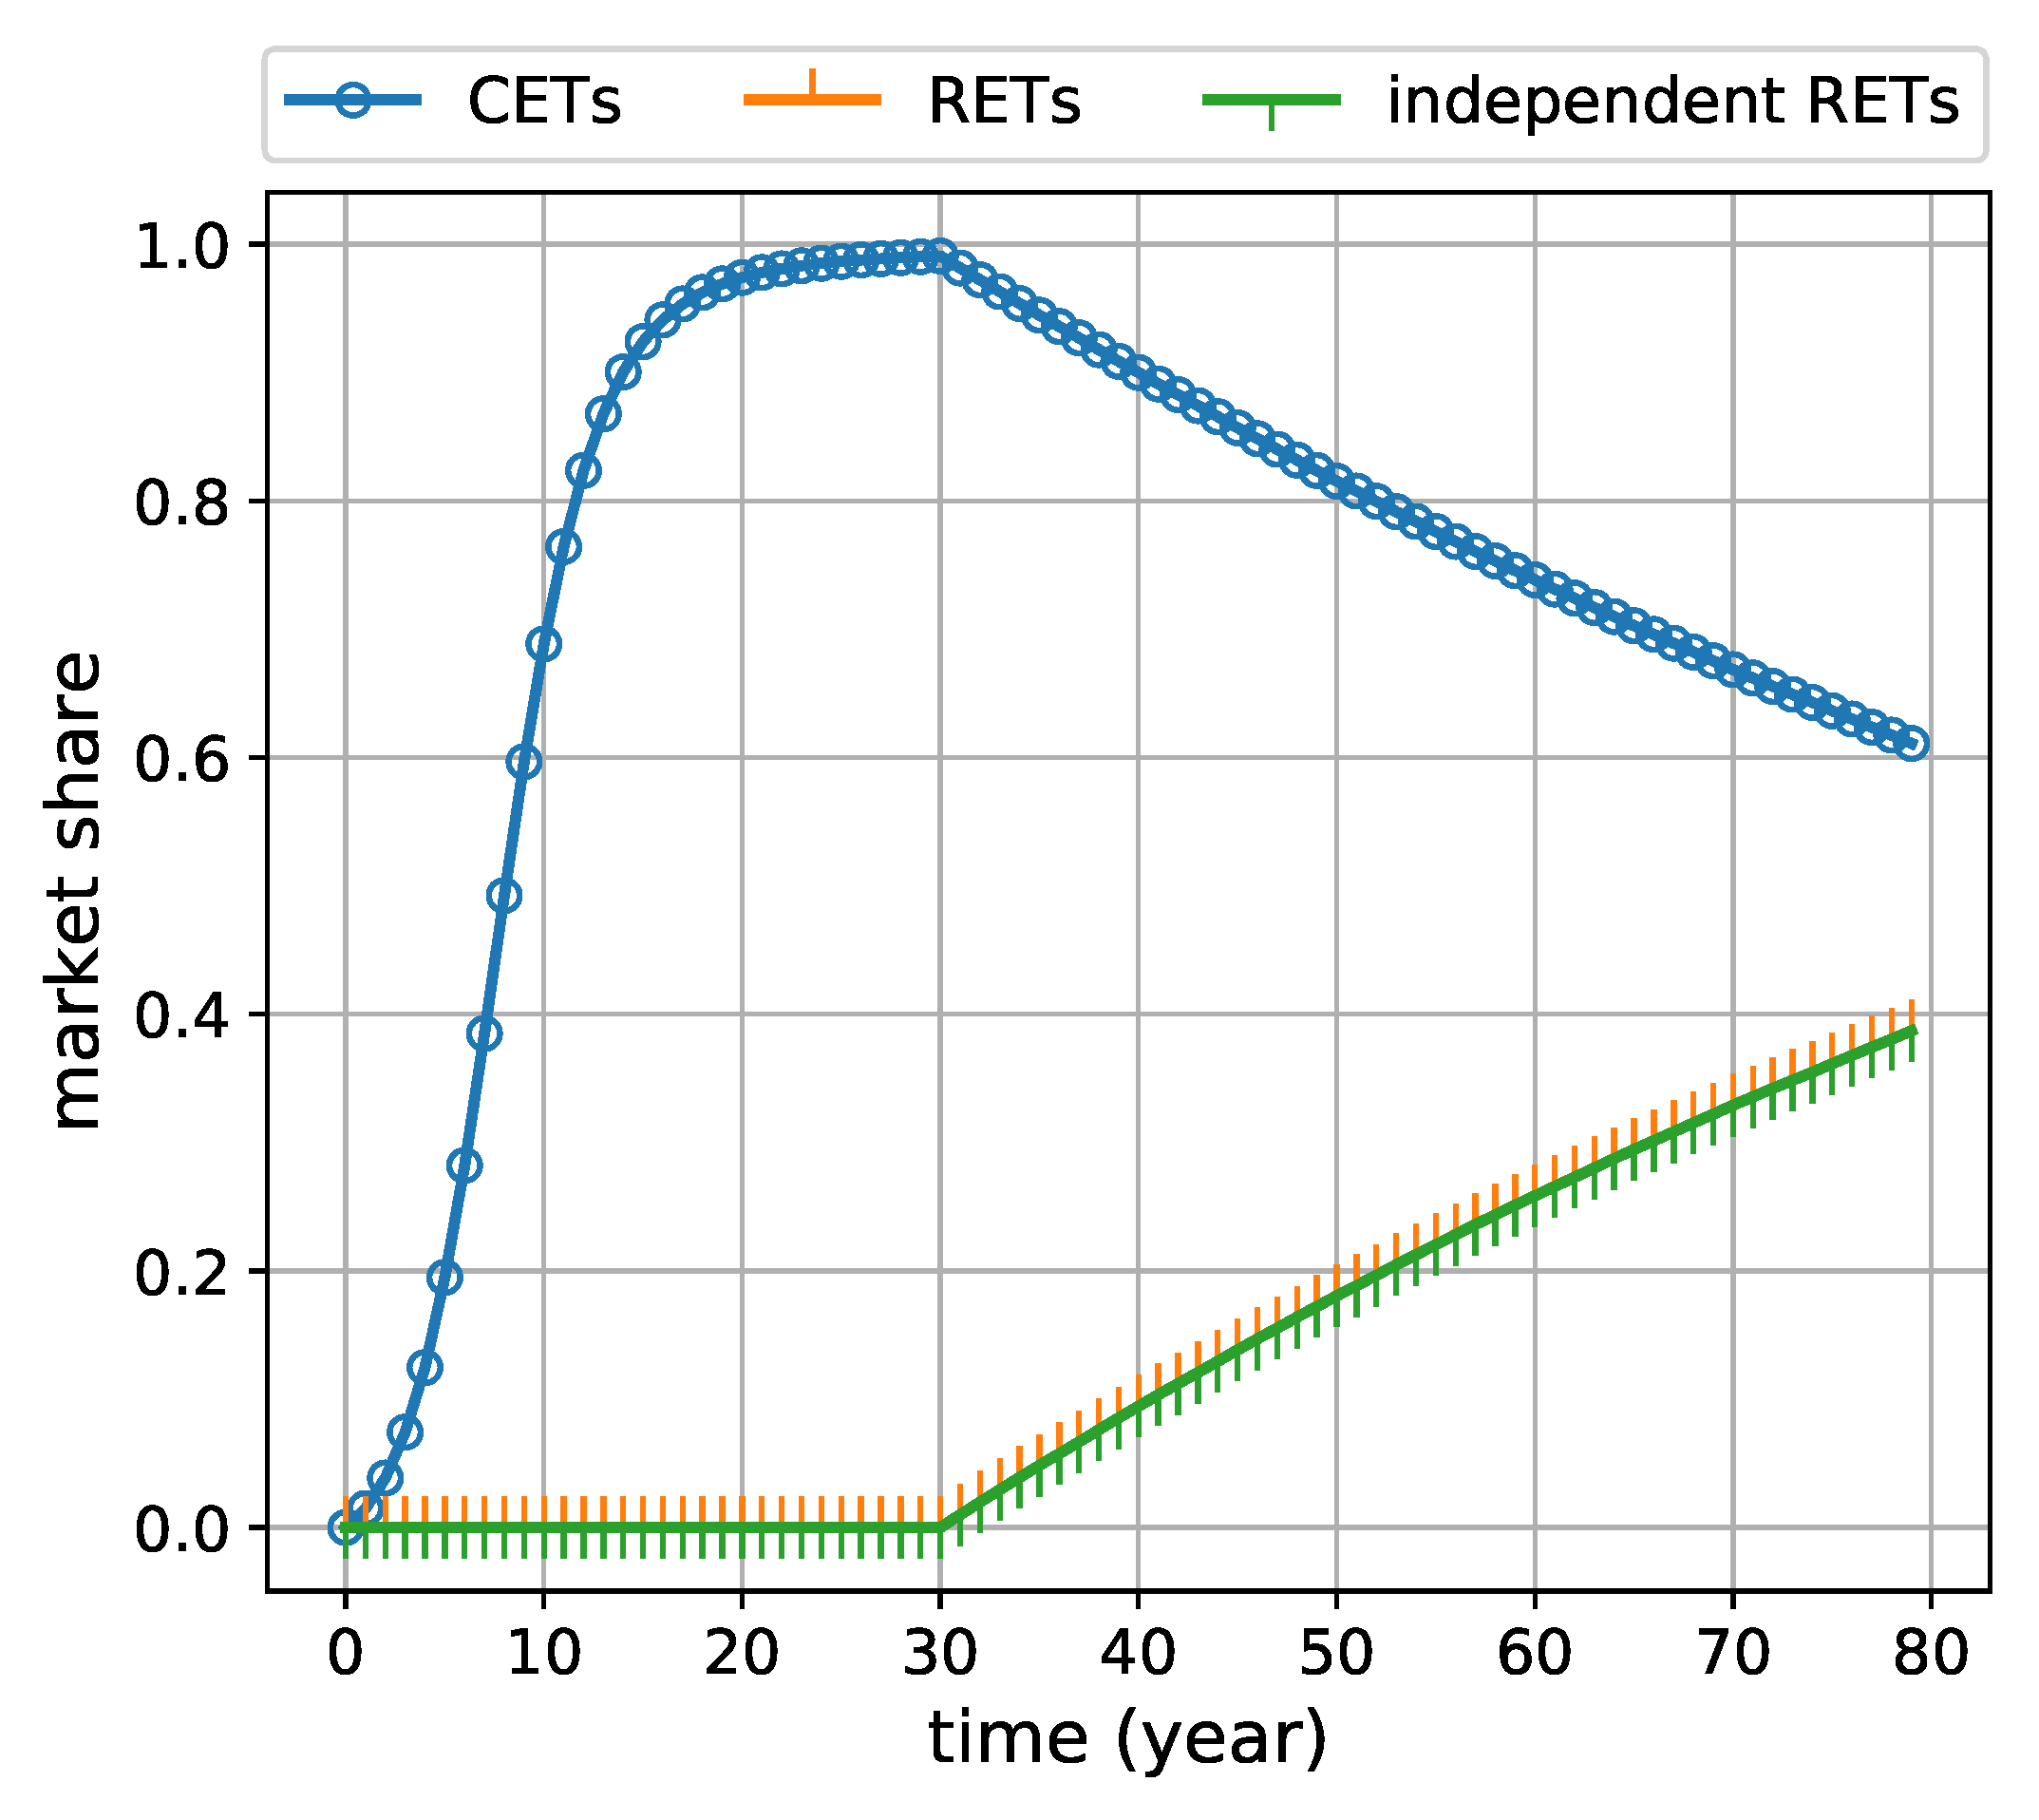
In the first scenario, we simulate the competition between different technologies in solely one dimension. This type of competition is completely homogeneous, which works as a reference point for the ensuing heterogeneous scenarios. It is common sense that RETs as latecomers with inferior performance are not able to defeat CETs so far. Therefore, the scenario that a technology emerges as a latecomer with exactly the same performance as the incumbent technology may be of more interest, which can provide the observation of the pure impact of the timing. Thus, in this scenario, we examined the competition between two technologies with exactly the same parameters, but appearing at different times: let the first technology growing for 30 years to be fully mature and dominate the market; then, the second technology emerges as a potential disruptor. The parameter settings are displayed in Table 1. The model was run 300 times, and Figure 7 is obtained.
As can be seen, CETs follow a typical S-shaped curve until RETs appear in the 30th year. Then, CETs begin to be substituted by the growing RETs. It seems that RETs tend to replace CETs completely. However, it takes RETs 50 years to merely occupy 40% of the market. It is noteworthy that the RETs’ growth in Figure 7 is driven purely by independent adopters, which means the dependent diffusion process is ineffective. This is not consistent with the fact that independent adopters refer to the innovators and early adopters during an innovation diffusion process [35]. These innovators and early adopters should be a small, but critical group of adopters who trigger fast innovation diffusion later on. Therefore, the results presented in Figure 7 should not be interpreted literally, but suggests that RETs are not able to capture a considerable market share from CETs only because RETs are latecomers. This can be explained by the fact that adopters may incur a switching cost when changing technologies, although the alternative performs the same as the original technology.
Even with the equivalent performance, RETs are not able to compete with incumbent CETs, only because the former lose first-mover advantage, let alone the RETs have inferior performance. Nevertheless, this scenario only considers one dimension. The competition in two dimensions is different, which is investigated in the next subsection.
3.2. Two-Dimensional Competition
In this scenario, we vary some parameters of RETs in the first scenario to gain variations. First, should become less, considering that the probability of independent adopters is not very high, and our focus should not be distracted by a large . Empirically, a wide range of values from 0.0001–0.01 could be assigned to , though [49], we use . Second, the initial preference for the non-conventional dimension () is set as 0.2 in contrast with 0.8 () of the conventional dimension, which means potential adopters have a much greater initial preference for the conventional dimension than their preference for the non-conventional dimension. is temporarily set at 0.4, which indicates that the influence on a potential adopter from her/his neighboring RET adopters is converted to her/his preference of RETs by a proportion of 40%, leaving a 60% proportion unchanged.
3.2.1. The Impact of Price Variation
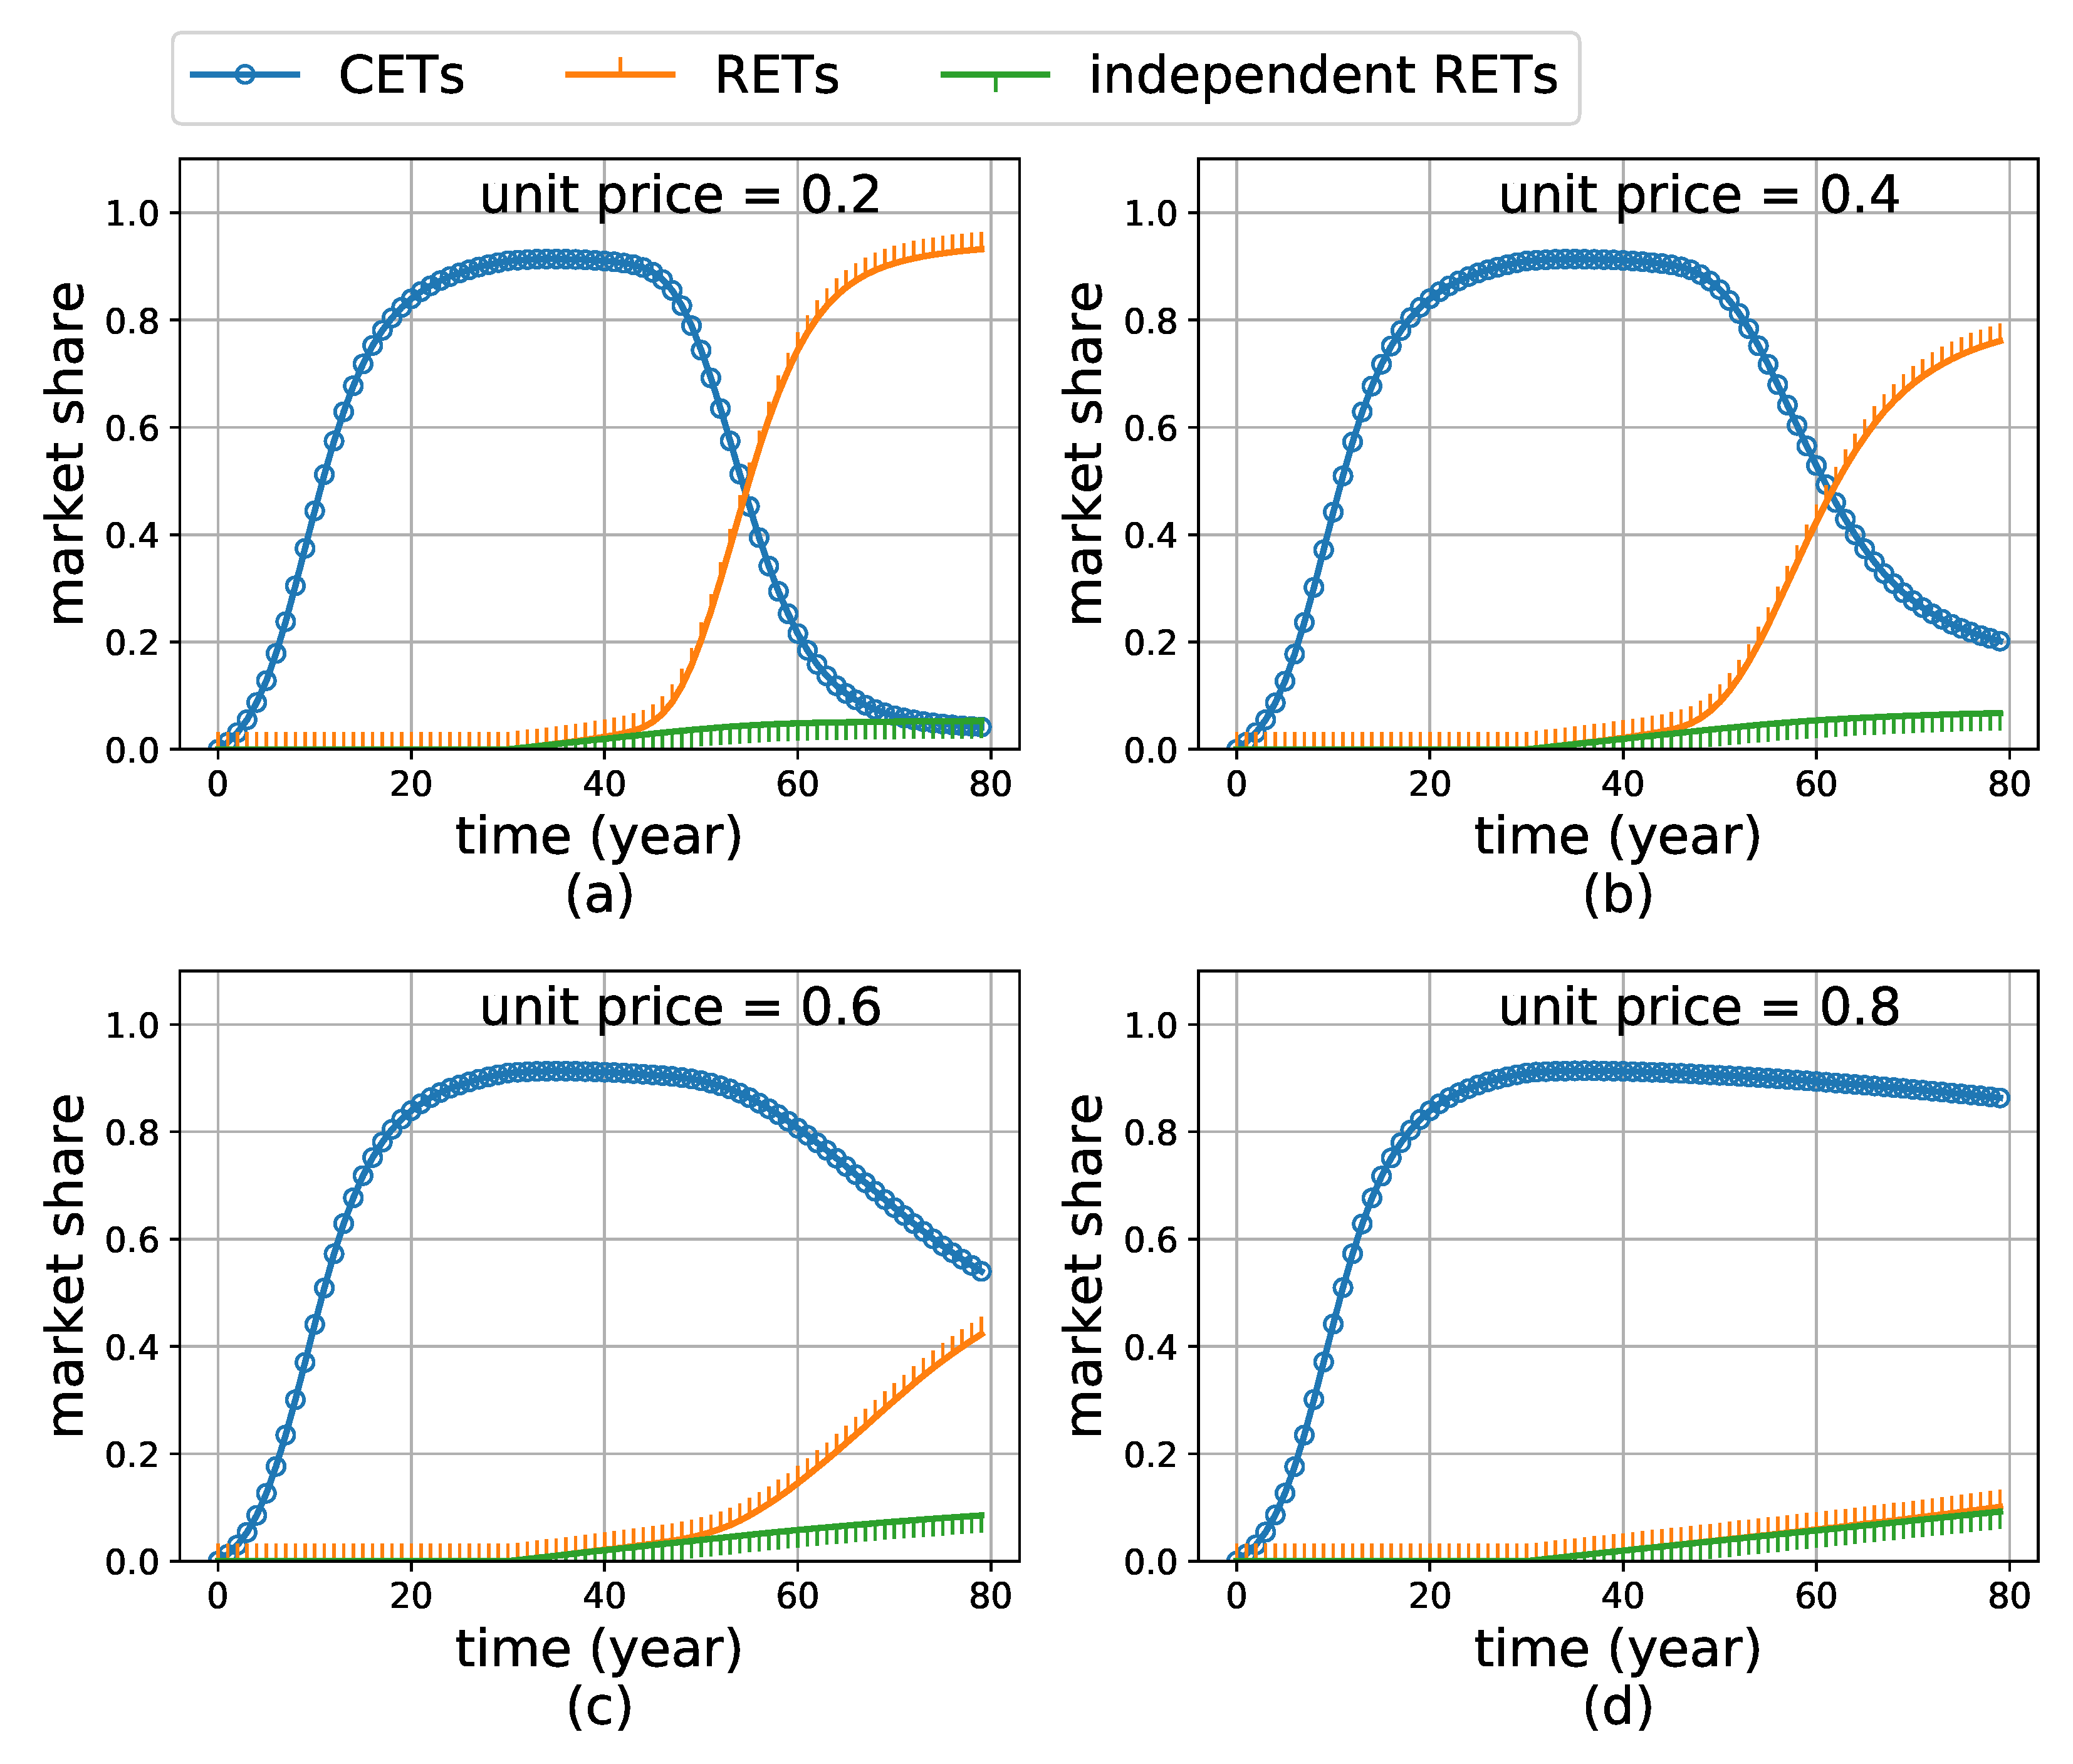
The impact of the price of the new dimension might be of great interest. As a benchmark, the unit price of the conventional dimension was set as one. Different values of the new dimension’s unit price ranging from 0.2–0.8 with intervals of 0.2 were used in simulations. After 300 runs for each value of the new dimension’s unit price, Figure 8 illustrates the results.
From (a)–(d) of Figure 8, the unit price of the non-conventional dimension increases from 0.2–0.8, which manifests a notable impact on the diffusion patterns. The market share of RETs in Year 80 decreases as the prices increase. Furthermore, the point where CETs and RETs intersect is delayed, while RETs become more expensive.
3.2.2. Impact of Preference Changing
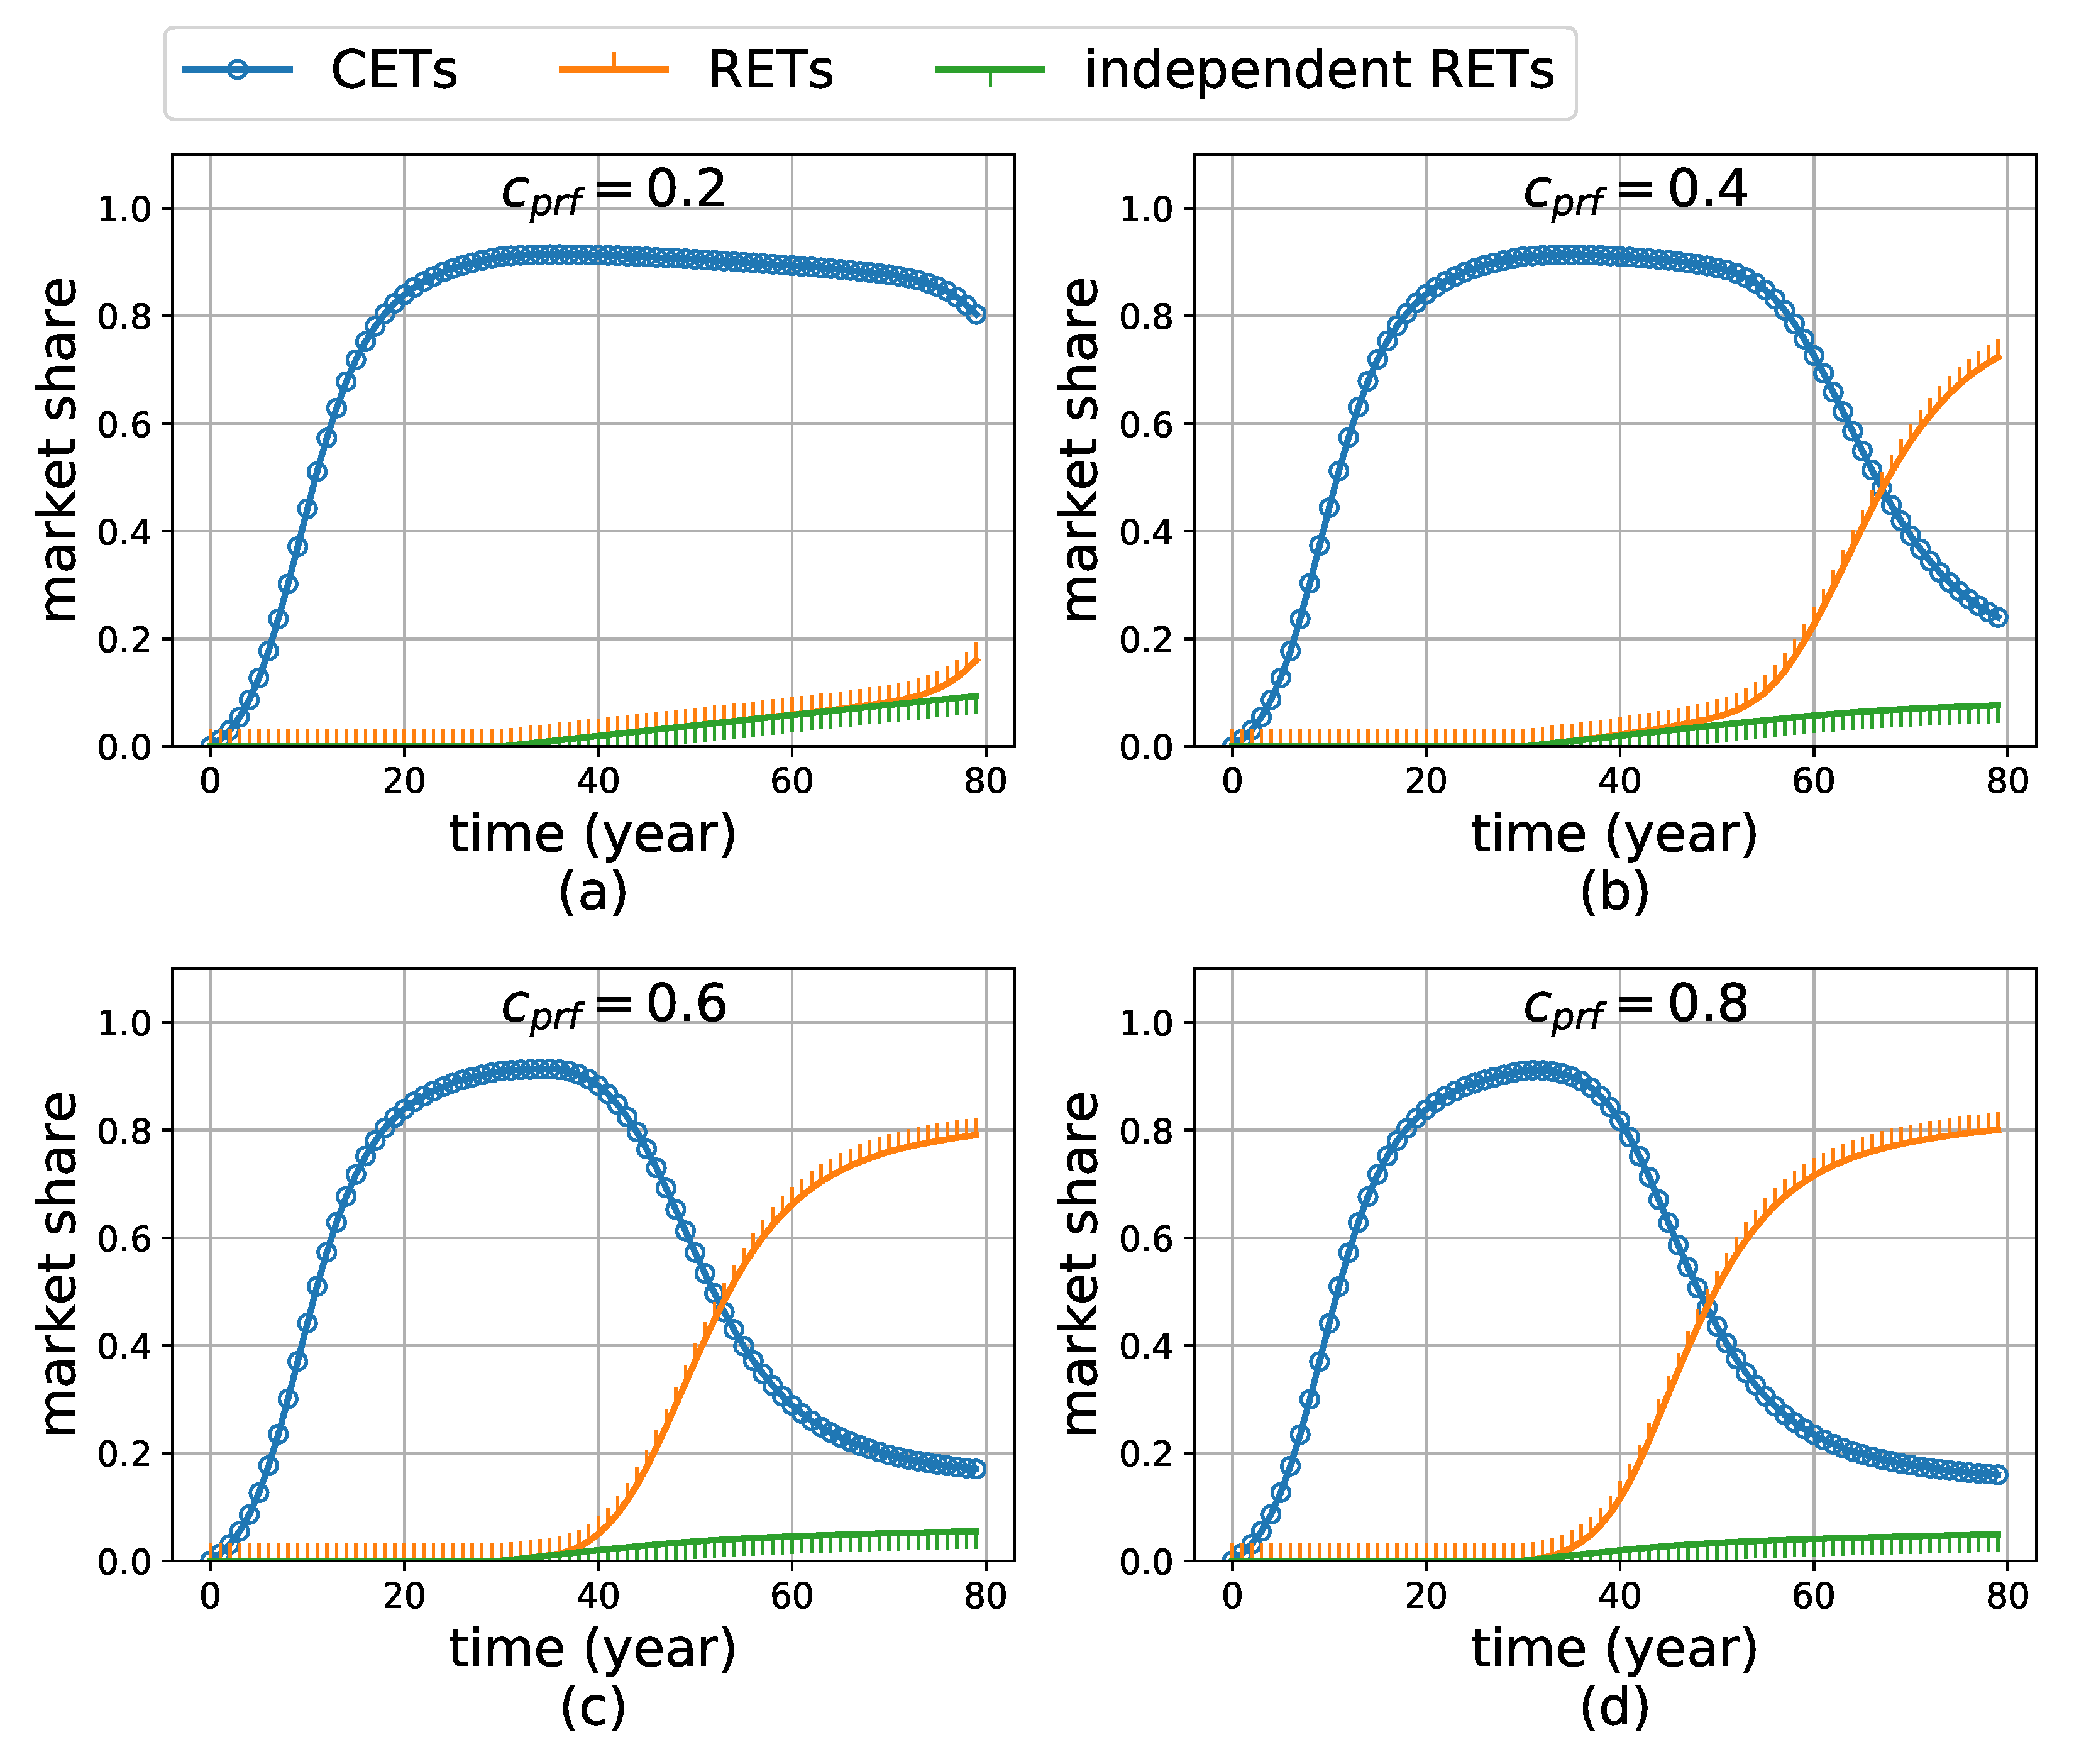
As mentioned above, is a coefficient adjusting the rate of preference changing and the upper limit of agent i’s preference for the non-conventional dimension (). In the process of RET diffusion, it is critical that potential adopters gradually develop their preference for the value of being environmentally friendly. Therefore, the model has been run 300 times for each value of ranging from 0.2–0.8 with intervals of 0.2. Since we know the higher the unit prices of RETs are, the more slowly RETs diffuse, which gives a direction for improving RETs, it is meaningful to know if RETs have already been improved to an acceptable unit price, e.g., 0.4, while other factors might impair or foster RET diffusion. Hence, the current unit price of the non-conventional dimension is set at 0.4, which gives rise to a comparatively complete S-shaped curve. This diffusion pattern provides an ideal goal to pursue, which is not as difficult as reducing the price to 0.2. Under these parameter settings, the impact of preference changing is examined.
The results are in Figure 9. At first glance, the graphs in Figure 9 are similar to those in Figure 8. With the increase of , RETs performs better, which is consistent with intuition. Nevertheless, it should be noted that the maximum market share that RETs can reach by changing tends to 0.8. From 0.2–0.4, exhibits a significant impact on the diffusion, but from 0.4–0.8, the impact diminishes. As can be seen, there is no obvious difference between and 0.8. Similarly, the diminishing impact of increasing on the timing when RETs exceed CETs can also be observed in the results.
The diminishing impact of preference changing is consistent with the impact of the q in the Bass model. Figure 3 illustrates how the diffusion pattern is changed when varying the q value. Setting as the benchmark, as the q increase evenly from 0.2–0.8 with intervals equal to 0.2, the year when the diffusion reaches 0.8 market share decreases, but the gap between each neighboring pair of curves becomes narrower. Essentially, increasing means to gain the influence of neighboring RET adopters, which is similar to increasing the q in the Bass model.
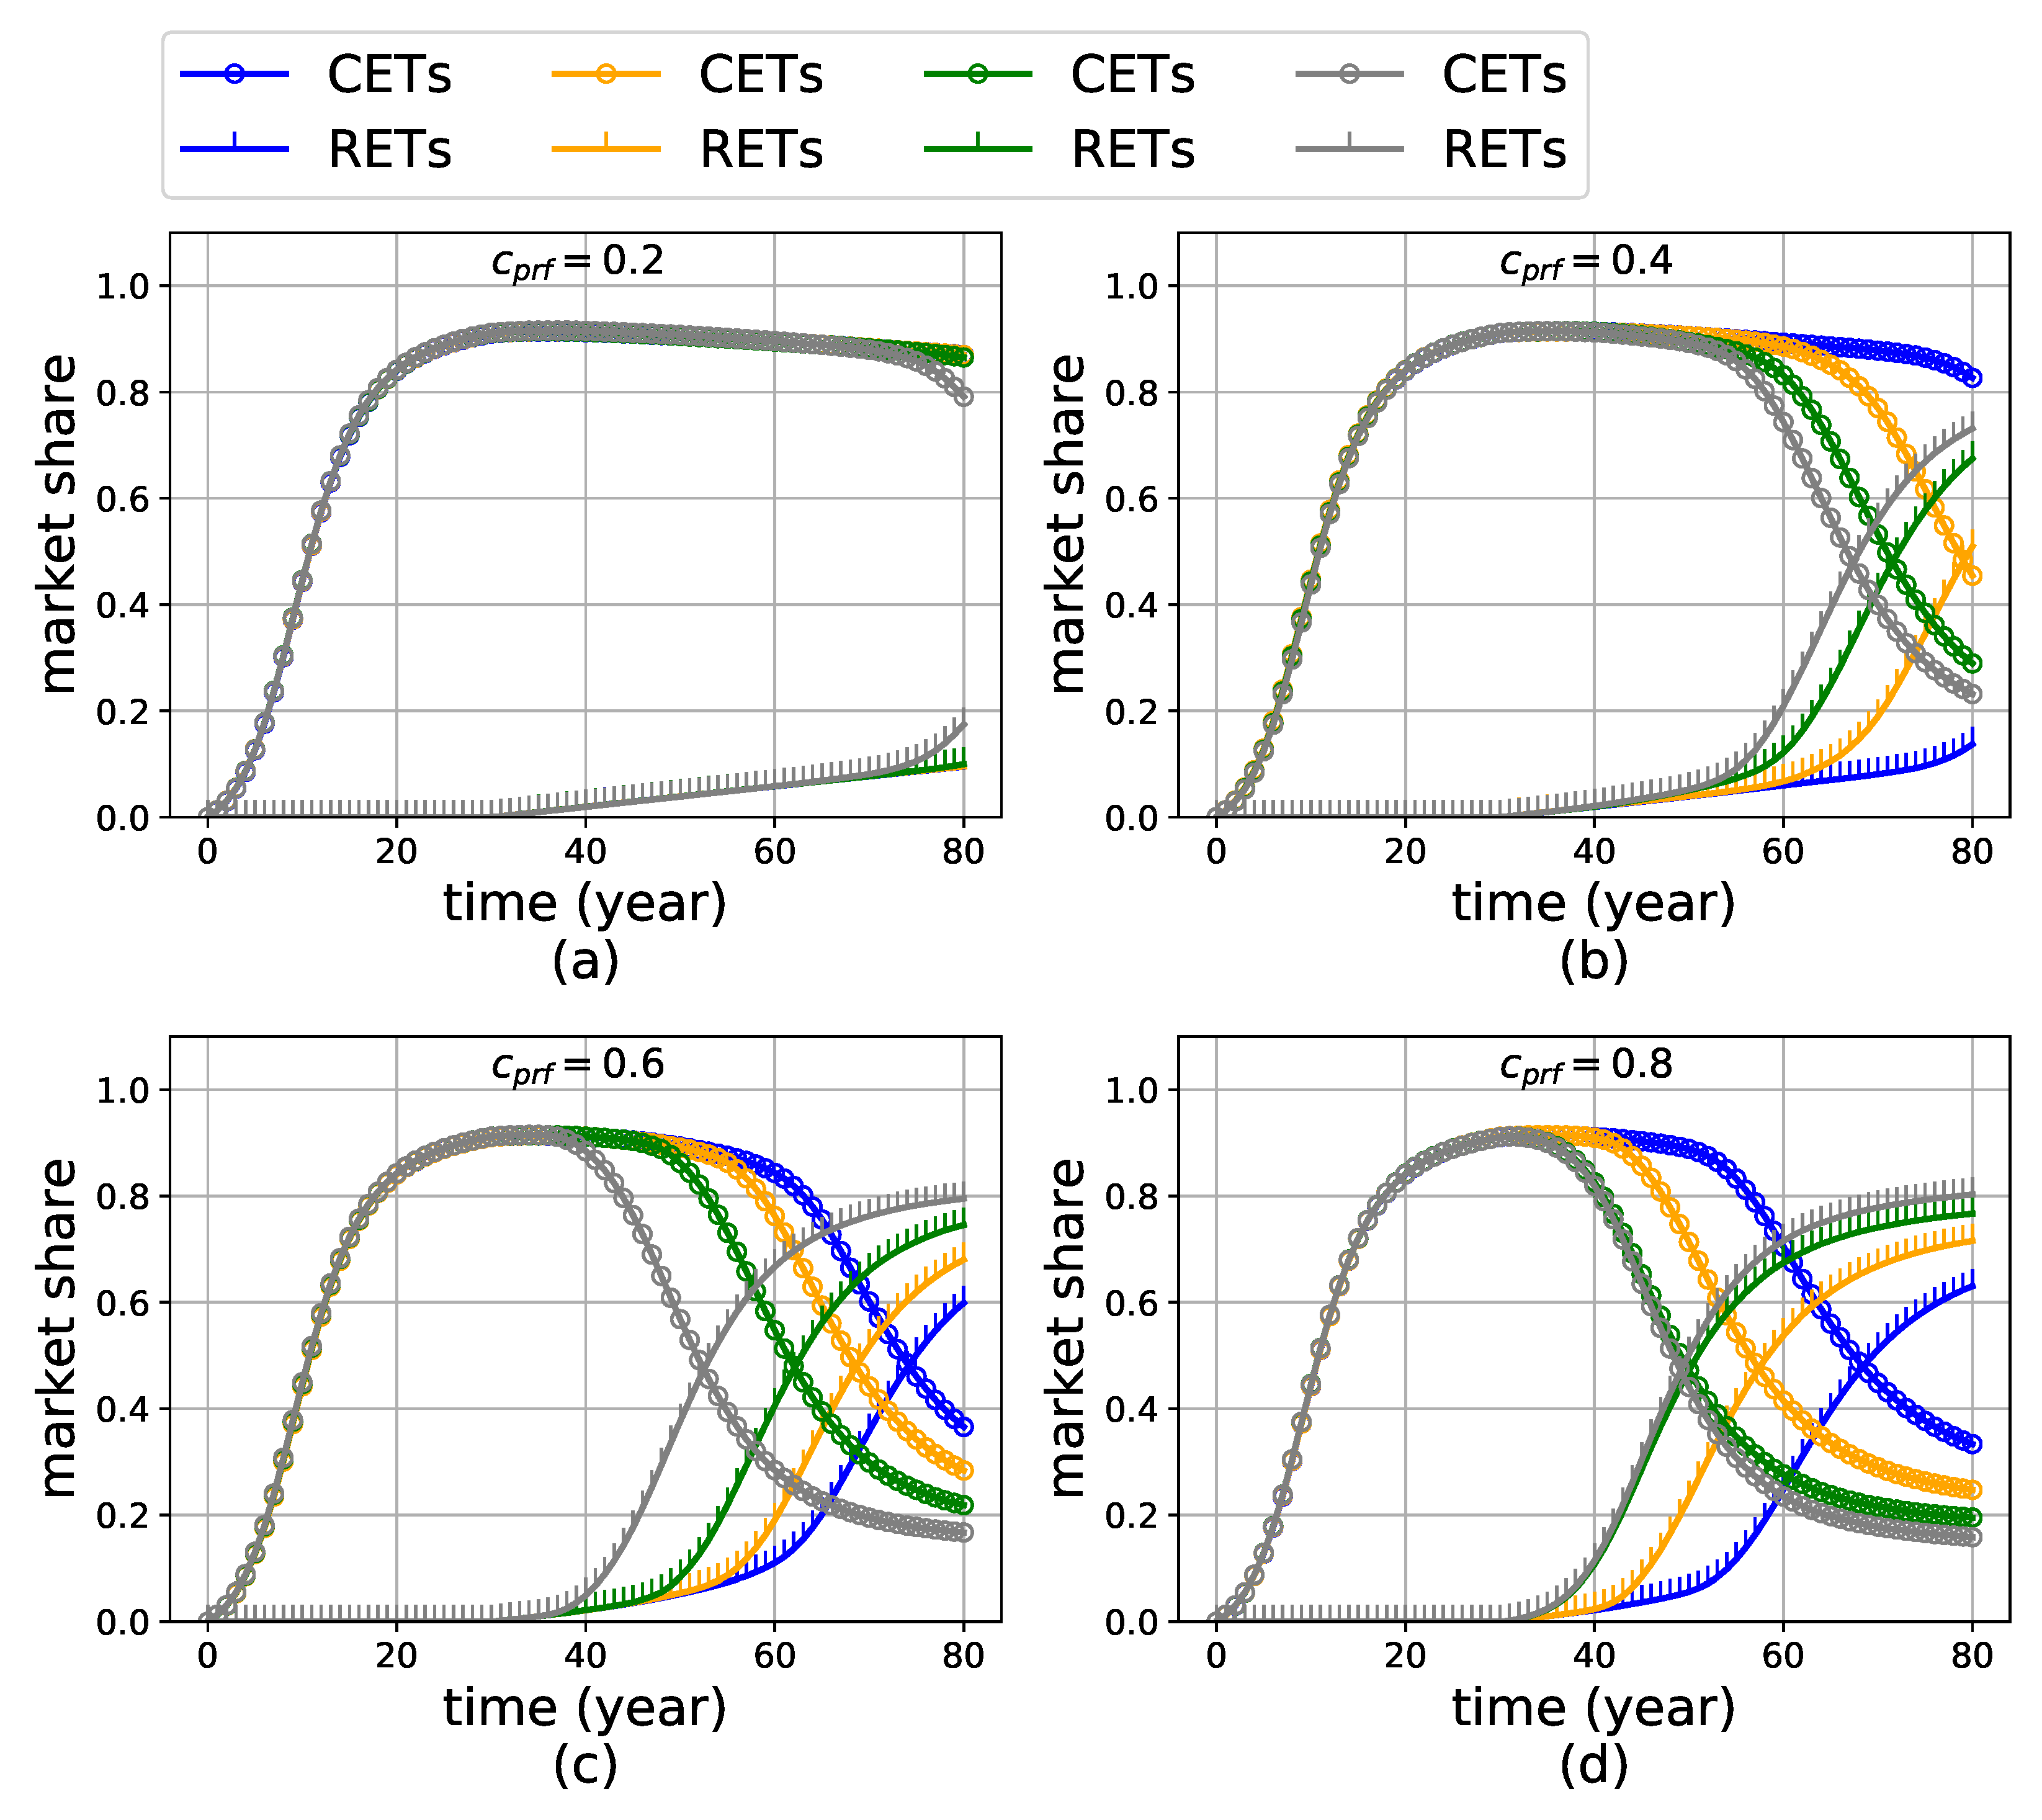
The results shown in Figure 9 are obtained based on , which means the new dimension of RETs is assumed to have an equivalent scalar value to a completely developed conventional dimension (i.e., the conventional dimension reaches the upper limit of one). However, actual values of depend on what specific RETs are discussed. In order to see whether the values assigned to qualitatively affect the results, 0.7, 0.8 and 0.9 are respectively tested. The results are shown in Figure 10. As can be seen, these pairs of CET and RET diffusion curves share the same qualitative features: the greater or is, the earlier the CET and RET diffusion curves will intersect, and the larger market share of RETs will reach in the 80th year. Therefore, both greater and are beneficial to speeding up RET diffusion. In other words, a small could be compensated with a large to maintain a certain RET diffusion rate, and vice versa (certainly and intuitively, this statement is valid only when and are not too small, otherwise the results would stay the same as (a) in Figure 10). In this paper, the changing preferences of consumers are of greater interest; thus, is fixed at one to manifest the impact of .
3.2.3. The Impact of RET Improvement Rate
In the context of disruptive innovation, technologies as latecomers have an advantage over incumbent technologies in one dimension, while having inferior performance on the other dimension and still need to improve their conventional dimension. Typically, disruptive innovations do not develop faster than incumbent technologies do or outperform the latter in the conventional dimension; whereas, it is necessary for latecomers to improve the conventional dimension to some extent to meet the the corresponding demand of consumers. We run the model for another 300 times for each value of the rate of RETs’ improvement, ranging from 0.2–2.0 with intervals of 0.6. The results are in Figure 11. It is not surprising that the higher the improvement rate is, the faster RETs improve. Furthermore, because the technology development has an upper limit, increasing the improvement rate does not constantly accelerate the diffusion of RETs by a considerable amount, but diminishes as well.
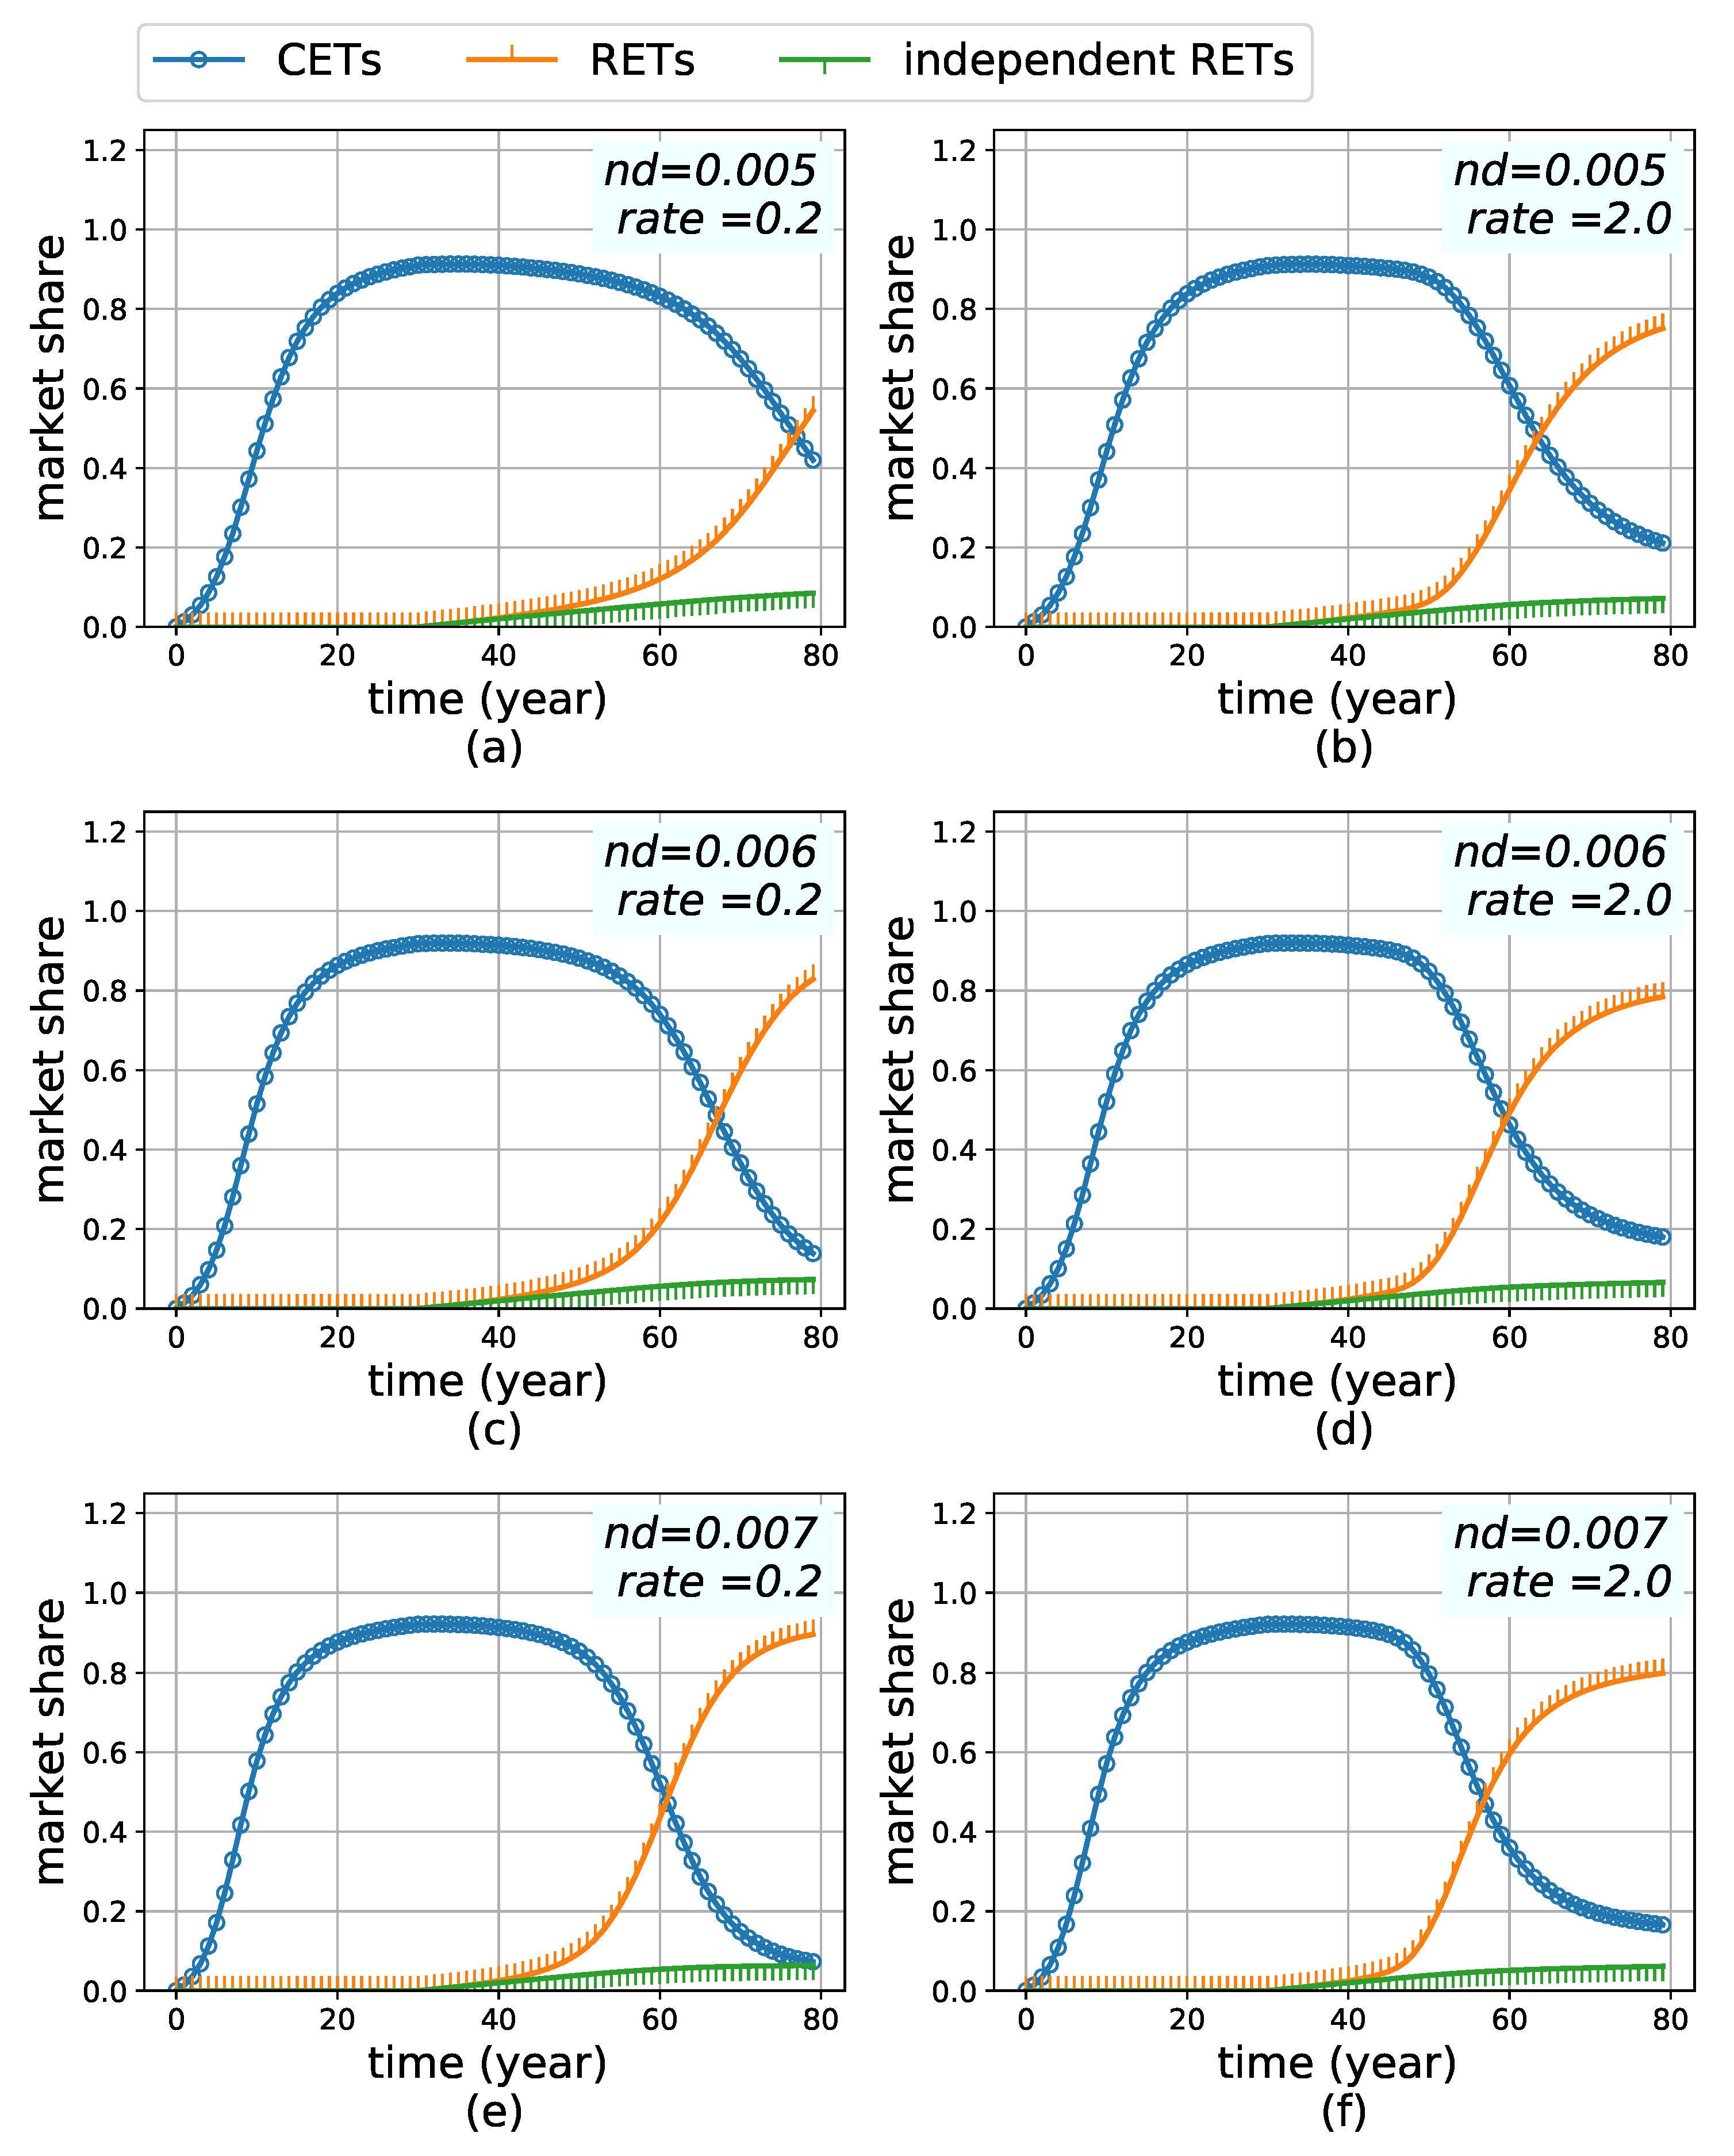
Nevertheless, as the network density varies, some interesting phenomena emerge. Figure 12 shows two columns of figures. The left column is the results of the RET rate () of 0.2. In contrast, the right column displays the results of the RET rate of 2.0, which is 10-times greater than the former. The three rows in Figure 12 have different network densities () of 0.005, 0.006 and 0.007, respectively. When , increasing the RET rate has a significant positive impact on the diffusion rate of RETs. When , the low RET rate (0.2) seems to lead the diffusion to a higher market share than the high RET rate does in the 80th year. This effect is more observable when is increased to 0.007 (see (e) and (f) of Figure 12): the final market share is lager when the development rate of RET is lower.
Another subtlety worth emphasis is that the RETs with a lower development rate hit a high score, and the timing when they exceed CETs (intersection of the two diffusion curves) is delayed compared to the situations when the RET rate is higher. This phenomenon implies that the RETs focusing more on the development of the conventional dimension can be adopted faster, but not more broadly. In other words, the faster RETs improve their conventional dimension the more pressure is placed on their diffusion potential. This counter-intuitive behavior of the system can be attributed to the preference changing, as well. According to Equation (5), the denser the network is, the more neighbors an agent will have, which leads to a higher probability and faster pace of the preference changing. Thus, a high improvement rate can boost RETs to meet the demand of consumers on the conventional dimension, but may also result in excess, which would give rise to the deviation from consumers’ changing preference. This deviation then suppresses the adoption of RETs.
4. Discussion
Considering the slow diffusion of RETs, we build an agent-based model to explore how DIS propels the diffusion process. This model is built based on the admitted frameworks of innovation diffusion, which give the model a conceptually validated foundation. Furthermore, this model is calibrated with statistically representative data [46] and generates a typical S-shaped diffusion curve, which qualitatively validates this model [35,36,38]. Three qualitative facts of the competition between RETs and CETs are captured: (1) compared with CETs, RETs are entirely new and emerge after CETs become highly developed; (2) consumers’ preferences for RETs evolve from a very low point; (3) RETs have a brand new dimension that CETs do not have. With this model, a sequence of controlled numerical experiments is conducted to explore the crucial factors that impact the effectiveness of applying the DIS to RET diffusion.
The first experiment gains insights into how the order of entering a market impacts technology diffusion. This experiment shows that even with the same parameter setting, the technologies having first-mover advantage win. This is because the model mimics the inertia (caused by switching cost, transaction cost, etc.) of consumers and allows agents to switch their choice only when the alternative technologies can provide utility strictly greater than the incumbent technologies do. This experiment implies the difficulty of attacking as an emergent technology. Nevertheless, this experiment only considers one dimension. If the competition is moved to two dimensions, latecomers may have more of a chance to win.
The result of the second experiment demonstrates the impact of the price changing of RETs’ unconventional dimension. The results are quite intuitive: RETs are not only faster, but also more widely adopted within the investigated time span, when the price is reduced. These results indicate that lowering the price of technologies’ new dimension is critical for successful diffusion. RETs suppliers should place great emphasis on pricing. Furthermore, this experiment supports that monetary compensation (e.g., subsidies) is an effective policy instrument to promote RET diffusion.
RETs are relatively new to CETs. It takes time for consumers to learn to appreciate the value of RETs’ new dimension. Hence, the preference changing of consumers is considered in the model. Having examined different values ranging from 0.2–0.8, it is discovered that increasing preference changing can significantly propel the diffusion of RETs, but the effectiveness diminishes as increases. This result implies that educating consumers and cultivating their demand for the new dimension are crucial for disruptive innovation. Particularly in the early stage, striving to develop consumers’ inclination towards the new dimension is rather helpful for RET diffusion, although the effectiveness tends to diminish.
The most noteworthy experiment might be the impact of RET improvement rate. RETs are benefited by a high improvement rate in the conventional dimension toward more diffusion when the network density is low. However, a high improvement rate may also lead RETs to lower performances in diffusion when the network is densified. Usually, information can transmit faster in a dense network, which enhances the influence of RET adopters on their neighbors’ preference. Thus, in the context of fast preference-changing, RETs’ high improvement rate in the conventional dimension is helpful at first, but harmful ultimately. These results imply that RET suppliers should track the preference changing of the market, rather than excessively investing in the conventional dimension. This result could be generalized to explain the recurrent failures of mainstream technologies that once emerged as disruptors. This phenomenon is known as the innovator’s dilemma [13,14,15]. Although, this scenario probably has not yet been found in the renewable energy market, it should be noted that more and more RET suppliers begin to realize the significance of RETs’ integration with the fast-evolving “smart technologies” (e.g., automation and artificial intelligence [50,51]). It should be still vividly remembered how dramatically consumers shifted their preferences for Nokia phones’ durability to iPhone and Android phones’ smartness [52].
5. Conclusions
In order to explore the critical factors influencing RETs’ diffusion from the perspective of disruptive innovation, an agent-based model is built, and multiple factors are considered. A series of numerical experiments is conducted. The results of these experiments show that the order of entering the market is crucial for a technology’s success. In many cases, RETs are not as competitive in the conventional dimension as CETs. To challenge the giant incumbent, redefining the competition on a two-dimensional basis is an effective approach in accordance with the disruptive innovation strategy. However, price, consumer preference and the improvement of the conventional dimension are still important factors that need to be considered by RET suppliers. Generally, lower price, higher consistency with consumer preference and a higher improvement rate of the conventional dimension are helpful for RETs’ diffusion. However, it should be noted that if consumers’ preferences change fast, investing heavily in the conventional dimension is not wise. A dense network can propel information transmission, which could further accelerate consumers’ preference changing and suppress the diffusion of RETs that focus on improving the conventional dimension.
Author Contributions
Y.Z. and P.D. proposed the idea; Y.Z. conceptualized and implemented the agent-based model, analyzed the data and wrote the first draft; Y.S. and Y.L. verified and validated the model, revised the writing and edited the manuscript; the research was conducted under the supervision of P.D.
Funding
This work is supported by the International Graduate Exchange Program of Beijing Institute of Technology and the National Natural Science Foundation of China (Project Number 71873015).
Acknowledgments
We would like to convey special thanks to Prakash Reddy Thimmapuram, Ralph Muehleisen, and Lingling Wang for their very useful and constructive suggestions for our work.
Conflicts of Interest
The authors declare no conflict of interest.
Abbreviations
| Variable | Meaning |
| the probability that a potential adopter independently adopts CETs. | |
| the probability that a potential adopter independently adopts RETs. | |
| the probability that a potential adopter becomes aware of CETs. | |
| the probability that a potential adopter becomes aware of RETs. | |
| the probability that a neighboring adopter of CETs successfully influences the potential adopter of CETs. | |
| the probability that a neighboring adopter of RETs successfully influences the potential adopter of RETs. | |
| the number of neighboring adopters of CETs. | |
| the number of neighboring adopters of RETs. | |
| the preference of agent i. | |
| the weight that agent i assigns to a technology’s conventional dimension. | |
| the weight that agent i assigns to a technology’s non-conventional dimension. | |
| the initial weight agent i assign to RETs’ non-conventional dimension. | |
| a coefficient adjusting the degree of the influence on preference changing | |
| the performance of CETs. | |
| the performance of CETs in terms of the conventional dimension. | |
| the performance of CETs in terms of the non-conventional dimension. | |
| the initial performance of CETs when they enter the market at first. | |
| the constant that adjusts the speed of technology progress. | |
| the maximal cumulative adopters of CETs at year t. | |
| M | the total number of potential adopters in a market. |
| the performance of RETs. | |
| the performance of RETs in terms of the conventional dimension. | |
| the performance of RETs in terms of the non-conventional dimension. | |
| the initial performance of RETs. | |
| the speed of the technological progress of RETs. | |
| the maximum cumulative adopters of RETs within t years. | |
| the probability that consumer i decides to purchase a CET. | |
| the probability that consumer i decides to purchase a RET. | |
| the reservation price of consumers willing to pay for CETs. | |
| the reservation price of consumers willing to pay for RETs. | |
| the actual price of CETs. | |
| the actual price of RETs. | |
| the utility of CETs that a consumer perceives. | |
| the utility of RETs that a consumer perceives. | |
| d | the deviation between the utility a consumer perceives and the reservation price the consumer is willing to pay. |
| the unit price of . | |
| the unit price of . |
References
- Wu, J.; Fan, Y.; Xia, Y. How can China achieve its nationally determined contribution targets combining emissions trading scheme and renewable energy policies? Energies 2017, 10, 1166. [Google Scholar] [CrossRef]
- Li, Y.; Yang, Z.; Li, G.; Zhao, D.; Tian, W. Optimal scheduling of an isolated microgrid with battery storage considering load and renewable generation uncertainties. IEEE Trans. Ind. Electron. 2019, 66, 1565–1575. [Google Scholar] [CrossRef]
- Li, Y.; Yang, Z.; Li, G.; Mu, Y.; Zhao, D.; Chen, C.; Shen, B. Optimal scheduling of isolated microgrid with an electric vehicle battery swapping station in multi-stakeholder scenarios: A bi-level programming approach via real-time pricing. Appl. Energy 2018, 232, 54–68. [Google Scholar] [CrossRef]
- Verdolini, E.; Vona, F.; Popp, D. Bridging the gap: Do fast-reacting fossil technologies facilitate renewable energy diffusion? Energy Policy 2018, 116, 242–256. [Google Scholar] [CrossRef] [Green Version]
- Bergek, A.; Mignon, I. Motives to adopt renewable energy technologies: Evidence from Sweden. Energy Policy 2017, 106, 547–559. [Google Scholar] [CrossRef]
- Negro, S.O.; Alkemade, F.; Hekkert, M.P. Why does renewable energy diffuse so slowly? A review of innovation system problems. Renew. Sustain. Energy Rev. 2012, 16, 3836–3846. [Google Scholar] [CrossRef]
- System Advisor Model (SAM). Available online: https://sam.nrel.gov/ (accessed on 20 October 2018).
- Angeletos, G.M.; Laibson, D.; Repetto, A.; Tobacman, J.; Weinberg, S. The hyperbolic consumption model: Calibration, simulation, and empirical evaluation. J. Econ. Perspect. 2001, 15, 47–68. [Google Scholar] [CrossRef]
- Rubinstein, A. “Economics and Psychology”? The Case of Hyperbolic Discounting. Int. Econ. Rev. 2003, 44, 1207–1216. [Google Scholar] [CrossRef]
- Cannistraro, M.; Mainardi, E.; Bottarelli, M. Testing a Dual-Source Heat Pump. Math. Model. Eng. Prob. 2018, 5, 205–210. [Google Scholar] [CrossRef]
- Piccolo, A.; Siclari, R.; Rando, F.; Cannistraro, M. Comparative performance of thermoacoustic heat exchangers with different pore geometries in oscillatory flow. implementation of experimental techniques. Appl. Sci. 2017, 7, 784. [Google Scholar] [CrossRef]
- Cannistraro, M.; Castelluccio, M.E.; Germanò, D. New sol-gel deposition technique in the Smart-Windows– Computation of possible applications of Smart-Windows in buildings. J. Build. Eng. 2018, 19, 295–301. [Google Scholar] [CrossRef]
- Bower, J.L.; Christensen, C.M. Disruptive technologies: Catching the wave. Harv. Bus. Rev. 1995, 73, 43–53. [Google Scholar]
- Adner, R. When are technologies disruptive? A demand-based view of the emergence of competition. Strateg. Manag. J. 2002, 23, 667–688. [Google Scholar] [CrossRef]
- Christensen, C. The Innovator’s Dilemma: When New Technologies Cause Great Firms to Fail; Harvard Business Review Press: Cambridge, MA, USA, 2013. [Google Scholar]
- Hardman, S.; Steinberger-Wilckens, R.; van der Horst, D. Disruptive innovations: The case for hydrogen fuel cells and battery electric vehicles. Int. J. Hydrogen Energy 2013, 38, 15438–15451. [Google Scholar] [CrossRef]
- Dijk, M.; Wells, P.; Kemp, R. Will the momentum of the electric car last? Testing an hypothesis on disruptive innovation. Technol. Forecast. Soc. Chang. 2016, 105, 77–88. [Google Scholar] [CrossRef]
- SolarCity. Available online: https://www.tesla.com/solarroof (accessed on 20 October 2018).
- Ilieva, I.; Gabriel, S. Electricity retailers’ behavior in a highly competitive Nordic electricity market. J. Energy Mark. 2014, 7, 4. [Google Scholar] [CrossRef]
- Lilliestam, J.; Patt, A. Barriers, risks and policies for renewables in the Gulf States. Energies 2015, 8, 8263–8285. [Google Scholar] [CrossRef]
- Lee, D.H.; Park, S.Y.; Kim, J.W.; Lee, S.K. Analysis on the feedback effect for the diffusion of innovative technologies focusing on the green car. Technol. Forecast. Soc. Chang. 2013, 80, 498–509. [Google Scholar] [CrossRef]
- Marinakis, Y.D. Forecasting technology diffusion with the Richards model. Technol. Forecast. Soc. Chang. 2012, 79, 172–179. [Google Scholar] [CrossRef]
- Gunduc, S. A Case Study of Diffusion of Innovation under Competition. Acta Phys. Pol. A 2018, 133, 1465–1469. [Google Scholar] [CrossRef]
- Jin, W.; Zhang, Z. On the mechanism of international technology diffusion for energy technological progress. Resour. Energy Econ. 2016, 46, 39–61. [Google Scholar] [CrossRef] [Green Version]
- Olivella-Rosell, P.; Villafafila-Robles, R.; Sumper, A.; Bergas-Jané, J. Probabilistic agent-based model of electric vehicle charging demand to analyse the impact on distribution networks. Energies 2015, 8, 4160–4187. [Google Scholar] [CrossRef] [Green Version]
- Shafiei, E.; Thorkelsson, H.; Ásgeirsson, E.I.; Davidsdottir, B.; Raberto, M.; Stefansson, H. An agent-based modeling approach to predict the evolution of market share of electric vehicles: A case study from Iceland. Technol. Forecast. Soc. Chang. 2012, 79, 1638–1653. [Google Scholar] [CrossRef]
- Stummer, C.; Kiesling, E.; Günther, M.; Vetschera, R. Innovation diffusion of repeat purchase products in a competitive market: An agent-based simulation approach. Eur. J. Oper. Res. 2015, 245, 157–167. [Google Scholar] [CrossRef]
- Palmer, J.; Sorda, G.; Madlener, R. Modeling the diffusion of residential photovoltaic systems in italy: An agent-based simulation. Technol. Forecast. Soc. Chang. 2015, 99, 106–131. [Google Scholar] [CrossRef]
- Robinson, S.A.; Rai, V. Determinants of spatio-temporal patterns of energy technology adoption: An agent-based modeling approach. Appl. Energy 2015, 151, 273–284. [Google Scholar] [CrossRef] [Green Version]
- Kangur, A.; Jager, W.; Verbrugge, R.; Bockarjova, M. An agent-based model for diffusion of electric vehicles. J. Environ. Psychol. 2017, 52, 166–182. [Google Scholar] [CrossRef]
- Desmarchelier, B.; Fang, E.S. National culture and innovation diffusion. Exploratory insights from agent-based modeling. Technol. Forecast. Soc. Chang. 2016, 105, 121–128. [Google Scholar] [CrossRef]
- Goldenberg, J.; Libai, B.; Muller, E. Using complex systems analysis to advance marketing theory development: Modeling heterogeneity effects on new product growth through stochastic cellular automata. Acad. Mark. Sci. Rev. 2001, 2001, 9. [Google Scholar]
- Kononovicius, A.; Daniunas, V. Agent-based and macroscopic modeling of the complex socio-economic systems. Soc. Technol. 2013, 3. [Google Scholar] [CrossRef]
- Wilensky, U. NetLogo. Center for Connected Learning and Computer-Based Modeling. 1999. Available online: http://ccl.northwestern.edu/netlogo/ (accessed on 7 June 2018).
- Rogers, E.M. Diffusion of Innovations; Simon and Schuster: New York City, NY, USA, 2010. [Google Scholar]
- Bass, F.M. A new product growth for model consumer durables. Manag. Sci. 1969, 15, 215–227. [Google Scholar] [CrossRef]
- NetLogo Nw Extension. Available online: https://ccl.northwestern.edu/netlogo/docs/nw.html (accessed on 1 November 2018).
- Kiesling, E.; Günther, M.; Stummer, C.; Wakolbinger, L.M. Agent-based simulation of innovation diffusion: A review. Cent. Eur. J. Oper. Res. 2012, 20, 183–230. [Google Scholar] [CrossRef]
- Van den Bulte, C.; Stremersch, S. Social contagion and income heterogeneity in new product diffusion: A meta-analytic test. Mark. Sci. 2004, 23, 530–544. [Google Scholar] [CrossRef]
- North, M.J.; Macal, C.M. Managing Business Complexity: Discovering Strategic Solutions with Agent-Based Modeling and Simulation; Oxford University Press: Oxford, UK, 2007. [Google Scholar]
- Jager, W. Stimulating the diffusion of photovoltaic systems: A behavioural perspective. Energy Policy 2006, 34, 1935–1943. [Google Scholar] [CrossRef]
- Rai, V.; Reeves, D.C.; Margolis, R. Overcoming barriers and uncertainties in the adoption of residential solar PV. Renew. Energy 2016, 89, 498–505. [Google Scholar] [CrossRef]
- Srinivasan, V.; Mason, C.H. Nonlinear least squares estimation of new product diffusion models. Mark. Sci. 1986, 5, 169–178. [Google Scholar] [CrossRef]
- Chandrasekaran, D.; Tellis, G.J. A critical review of marketing research on diffusion of new products. In Review of Marketing Research; Emerald Group Publishing Limited: Bingley, UK, 2007; pp. 39–80. [Google Scholar]
- Oecd Renewable Energy Data. Available online: https://data.oecd.org/energy/renewable-energy.htm (accessed on 20 October 2018).
- Sultan, F.; Farley, J.U.; Lehmann, D.R. A meta-analysis of applications of diffusion models. J. Mark. Res. 1990, 27, 70–77. [Google Scholar] [CrossRef]
- Barabási, A.L. Network Science; Cambridge University Press: Cambridge, UK, 2016. [Google Scholar]
- Rand, W.; Rust, R.T. Agent-based modeling in marketing: Guidelines for rigor. Int. J. Res. Mark. 2011, 28, 181–193. [Google Scholar] [CrossRef]
- Antonopoulos, C. Diffusion of Energy Efficient Technology in Commercial Buildings: An Analysis of the Commercial Building Partnerships Program. Ph.D. Thesis, Portland State University, Portland, OR, USA, 2013. [Google Scholar]
- Building a Better World with Smart Homes + Solar Energy & Battery Storage. Available online: https://www.sunrun.com/go-solar-center/solar-articles/building-a-better-world-with-smart-homes-solar-energy-battery-storage (accessed on 20 October 2018).
- 5 Trends for the Smart Energy Home of the Future. Available online: https://www.greentechmedia.com/articles/read/5-trends-for-the-smart-energy-home-of-the-future#gs.5An9N=o (accessed on 20 October 2018).
- Where Nokia Went Wrong. Available online: https://www.newyorker.com/business/currency/where-nokia-went-wrong (accessed on 20 October 2018).
Figure 1.
Disruptive innovation: the hard drive case. (a) one-dimension perspective: capacity only; (b) two-dimension perspective: capacity and portability.
Figure 1.
Disruptive innovation: the hard drive case. (a) one-dimension perspective: capacity only; (b) two-dimension perspective: capacity and portability.

Figure 2.
The framework of the agent-based model (ABM).
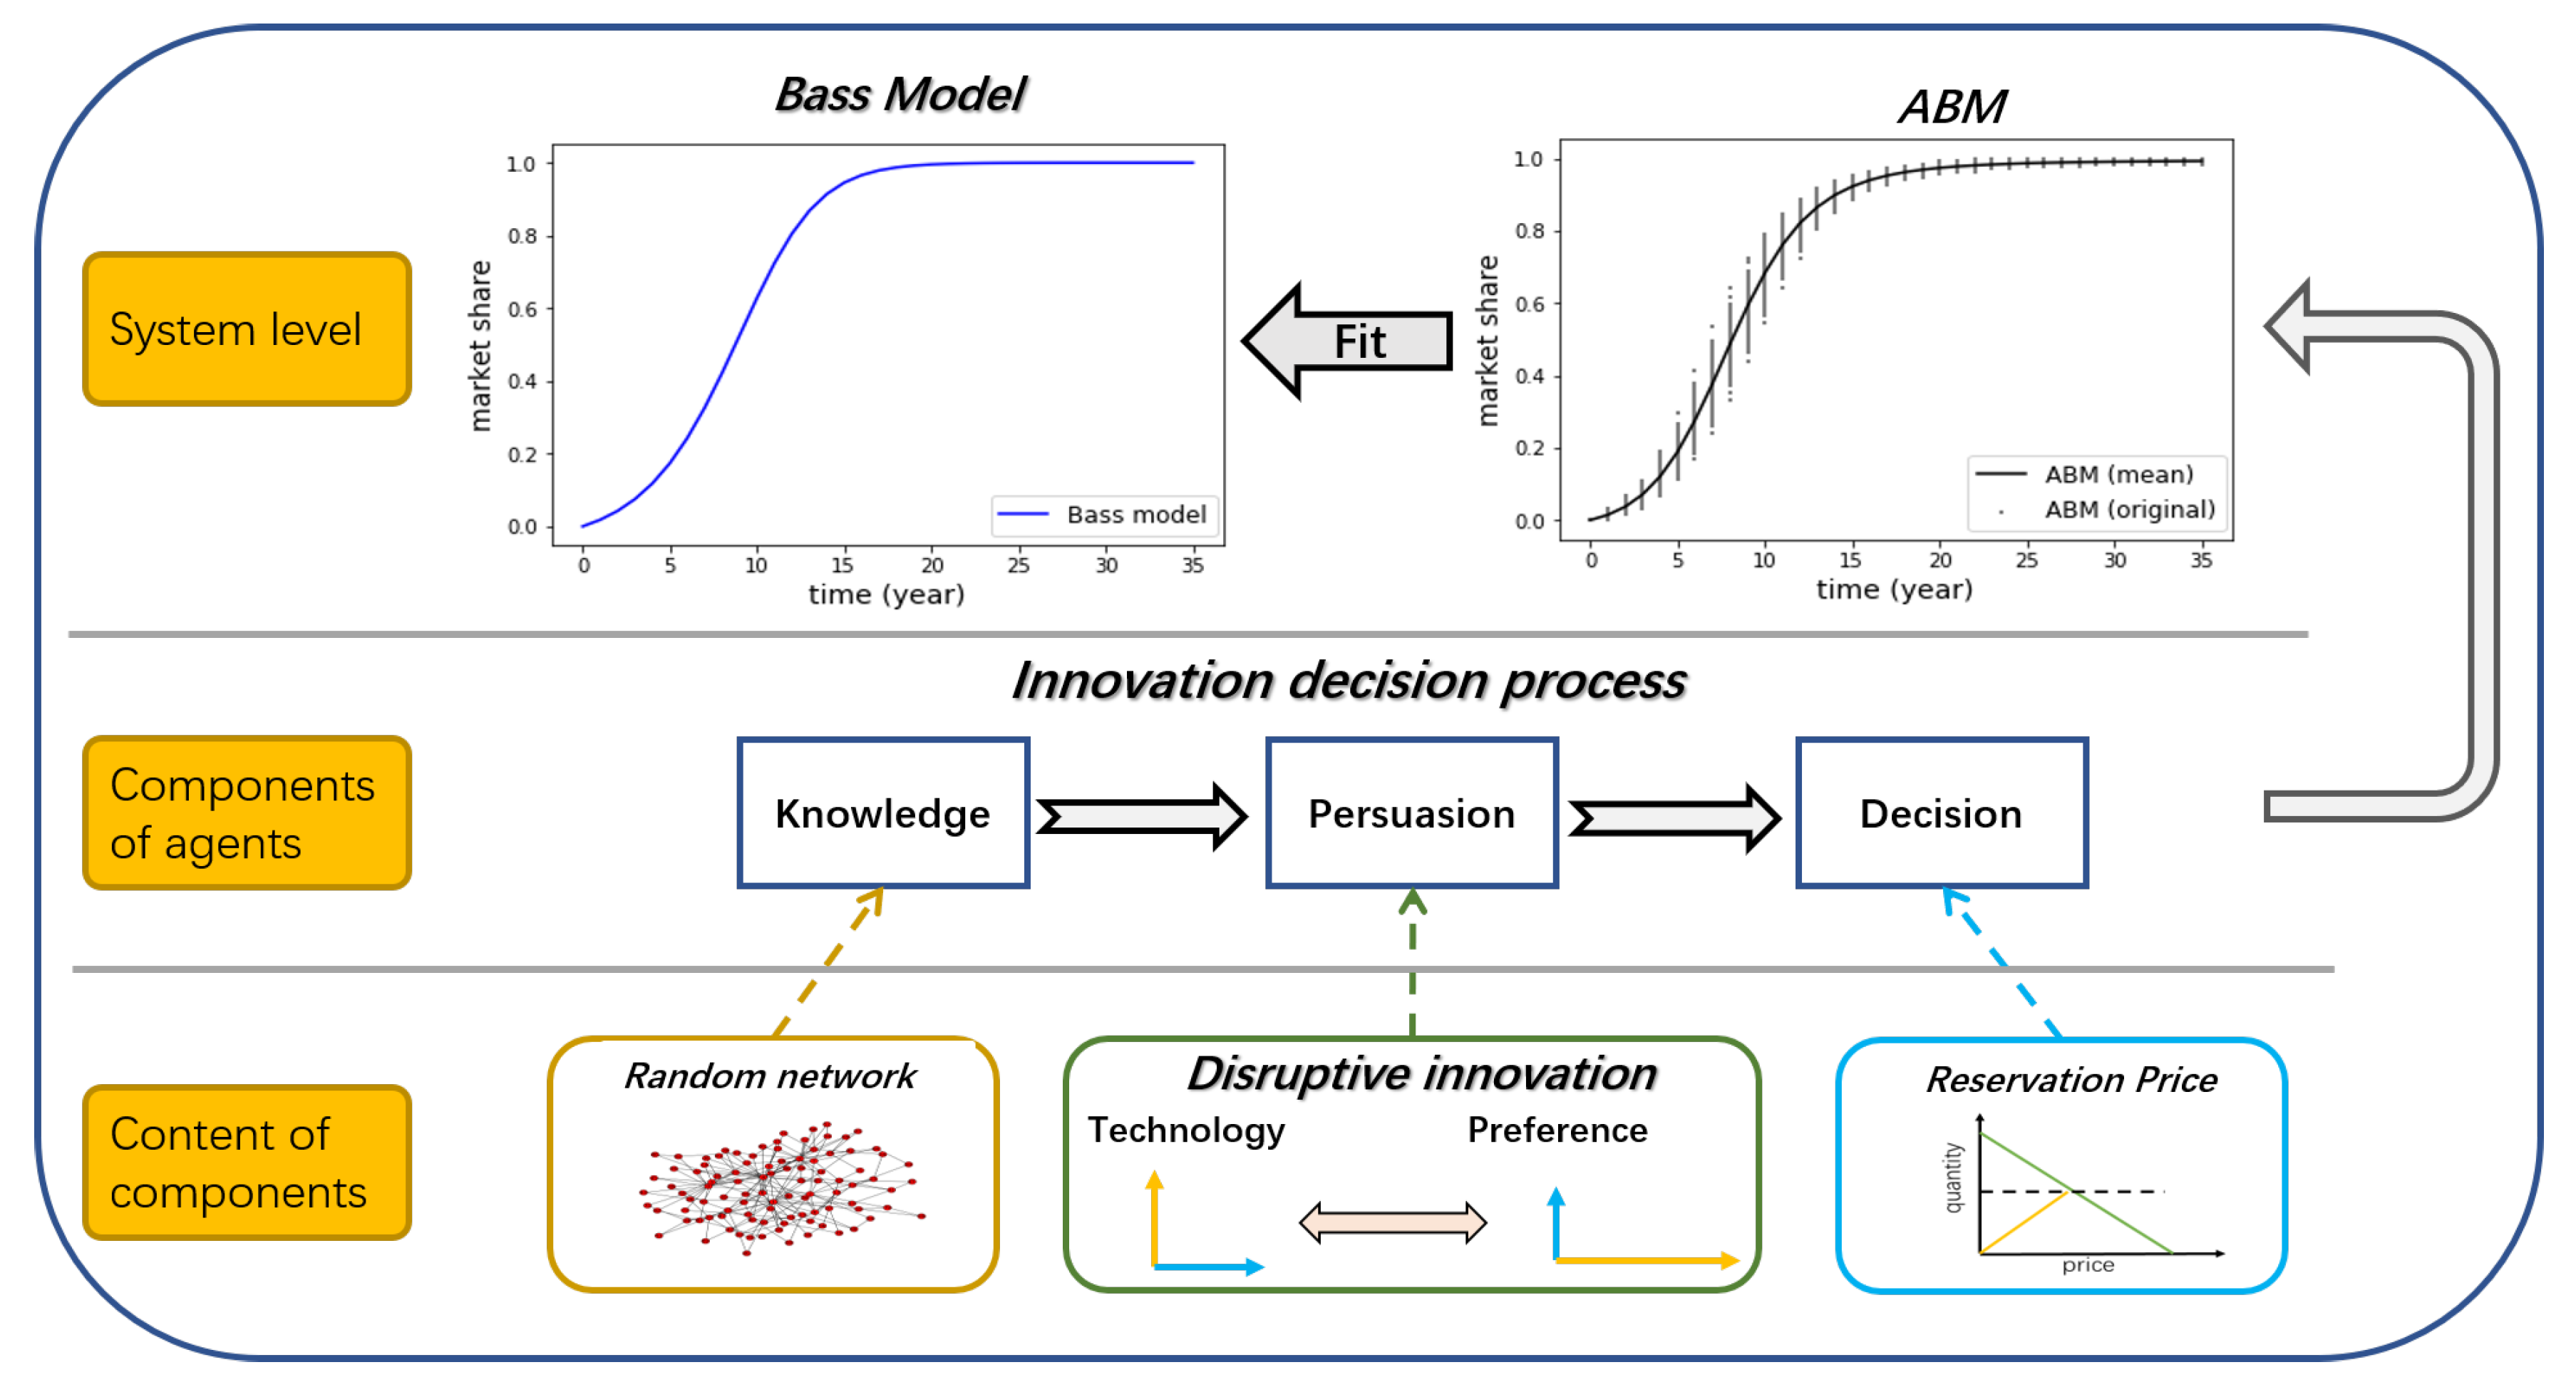
Figure 3.
The impact of p and q on the S-shaped diffusion pattern; the horizontal axes indicate time (years); vertical axes indicate market share.
Figure 3.
The impact of p and q on the S-shaped diffusion pattern; the horizontal axes indicate time (years); vertical axes indicate market share.
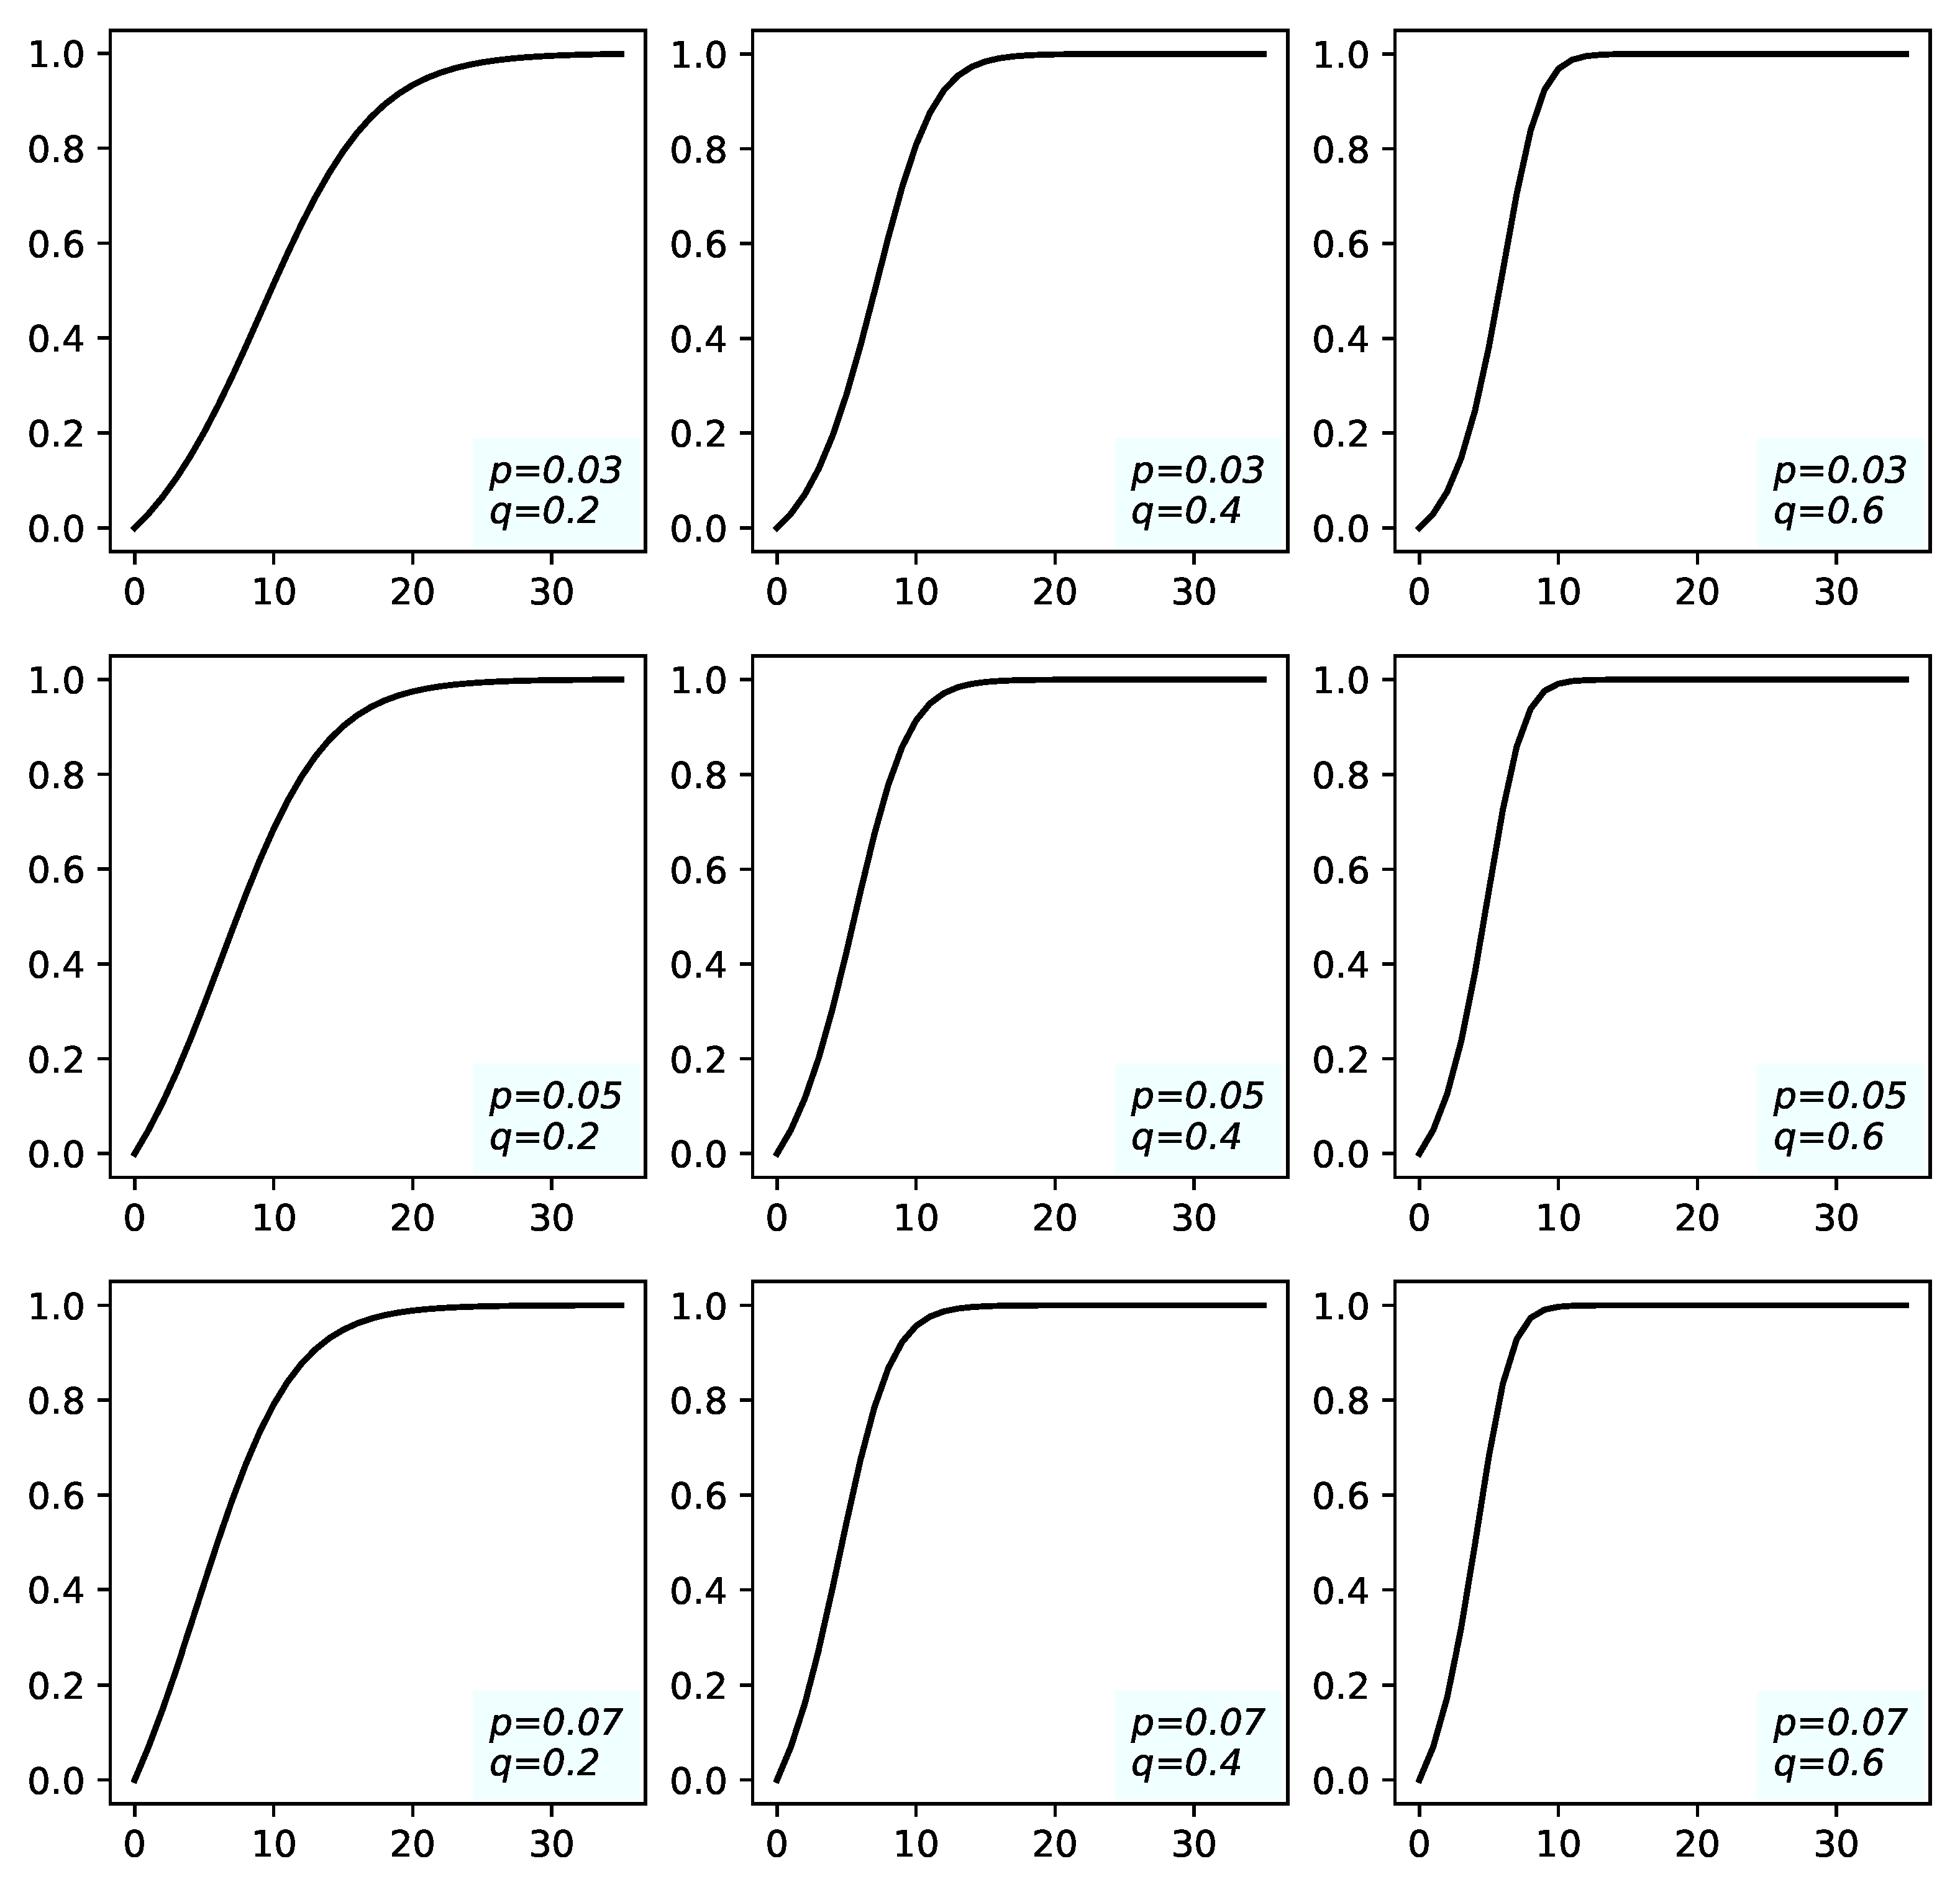
Figure 4.
Flowchart of the model. RETs, renewable energy technologies.
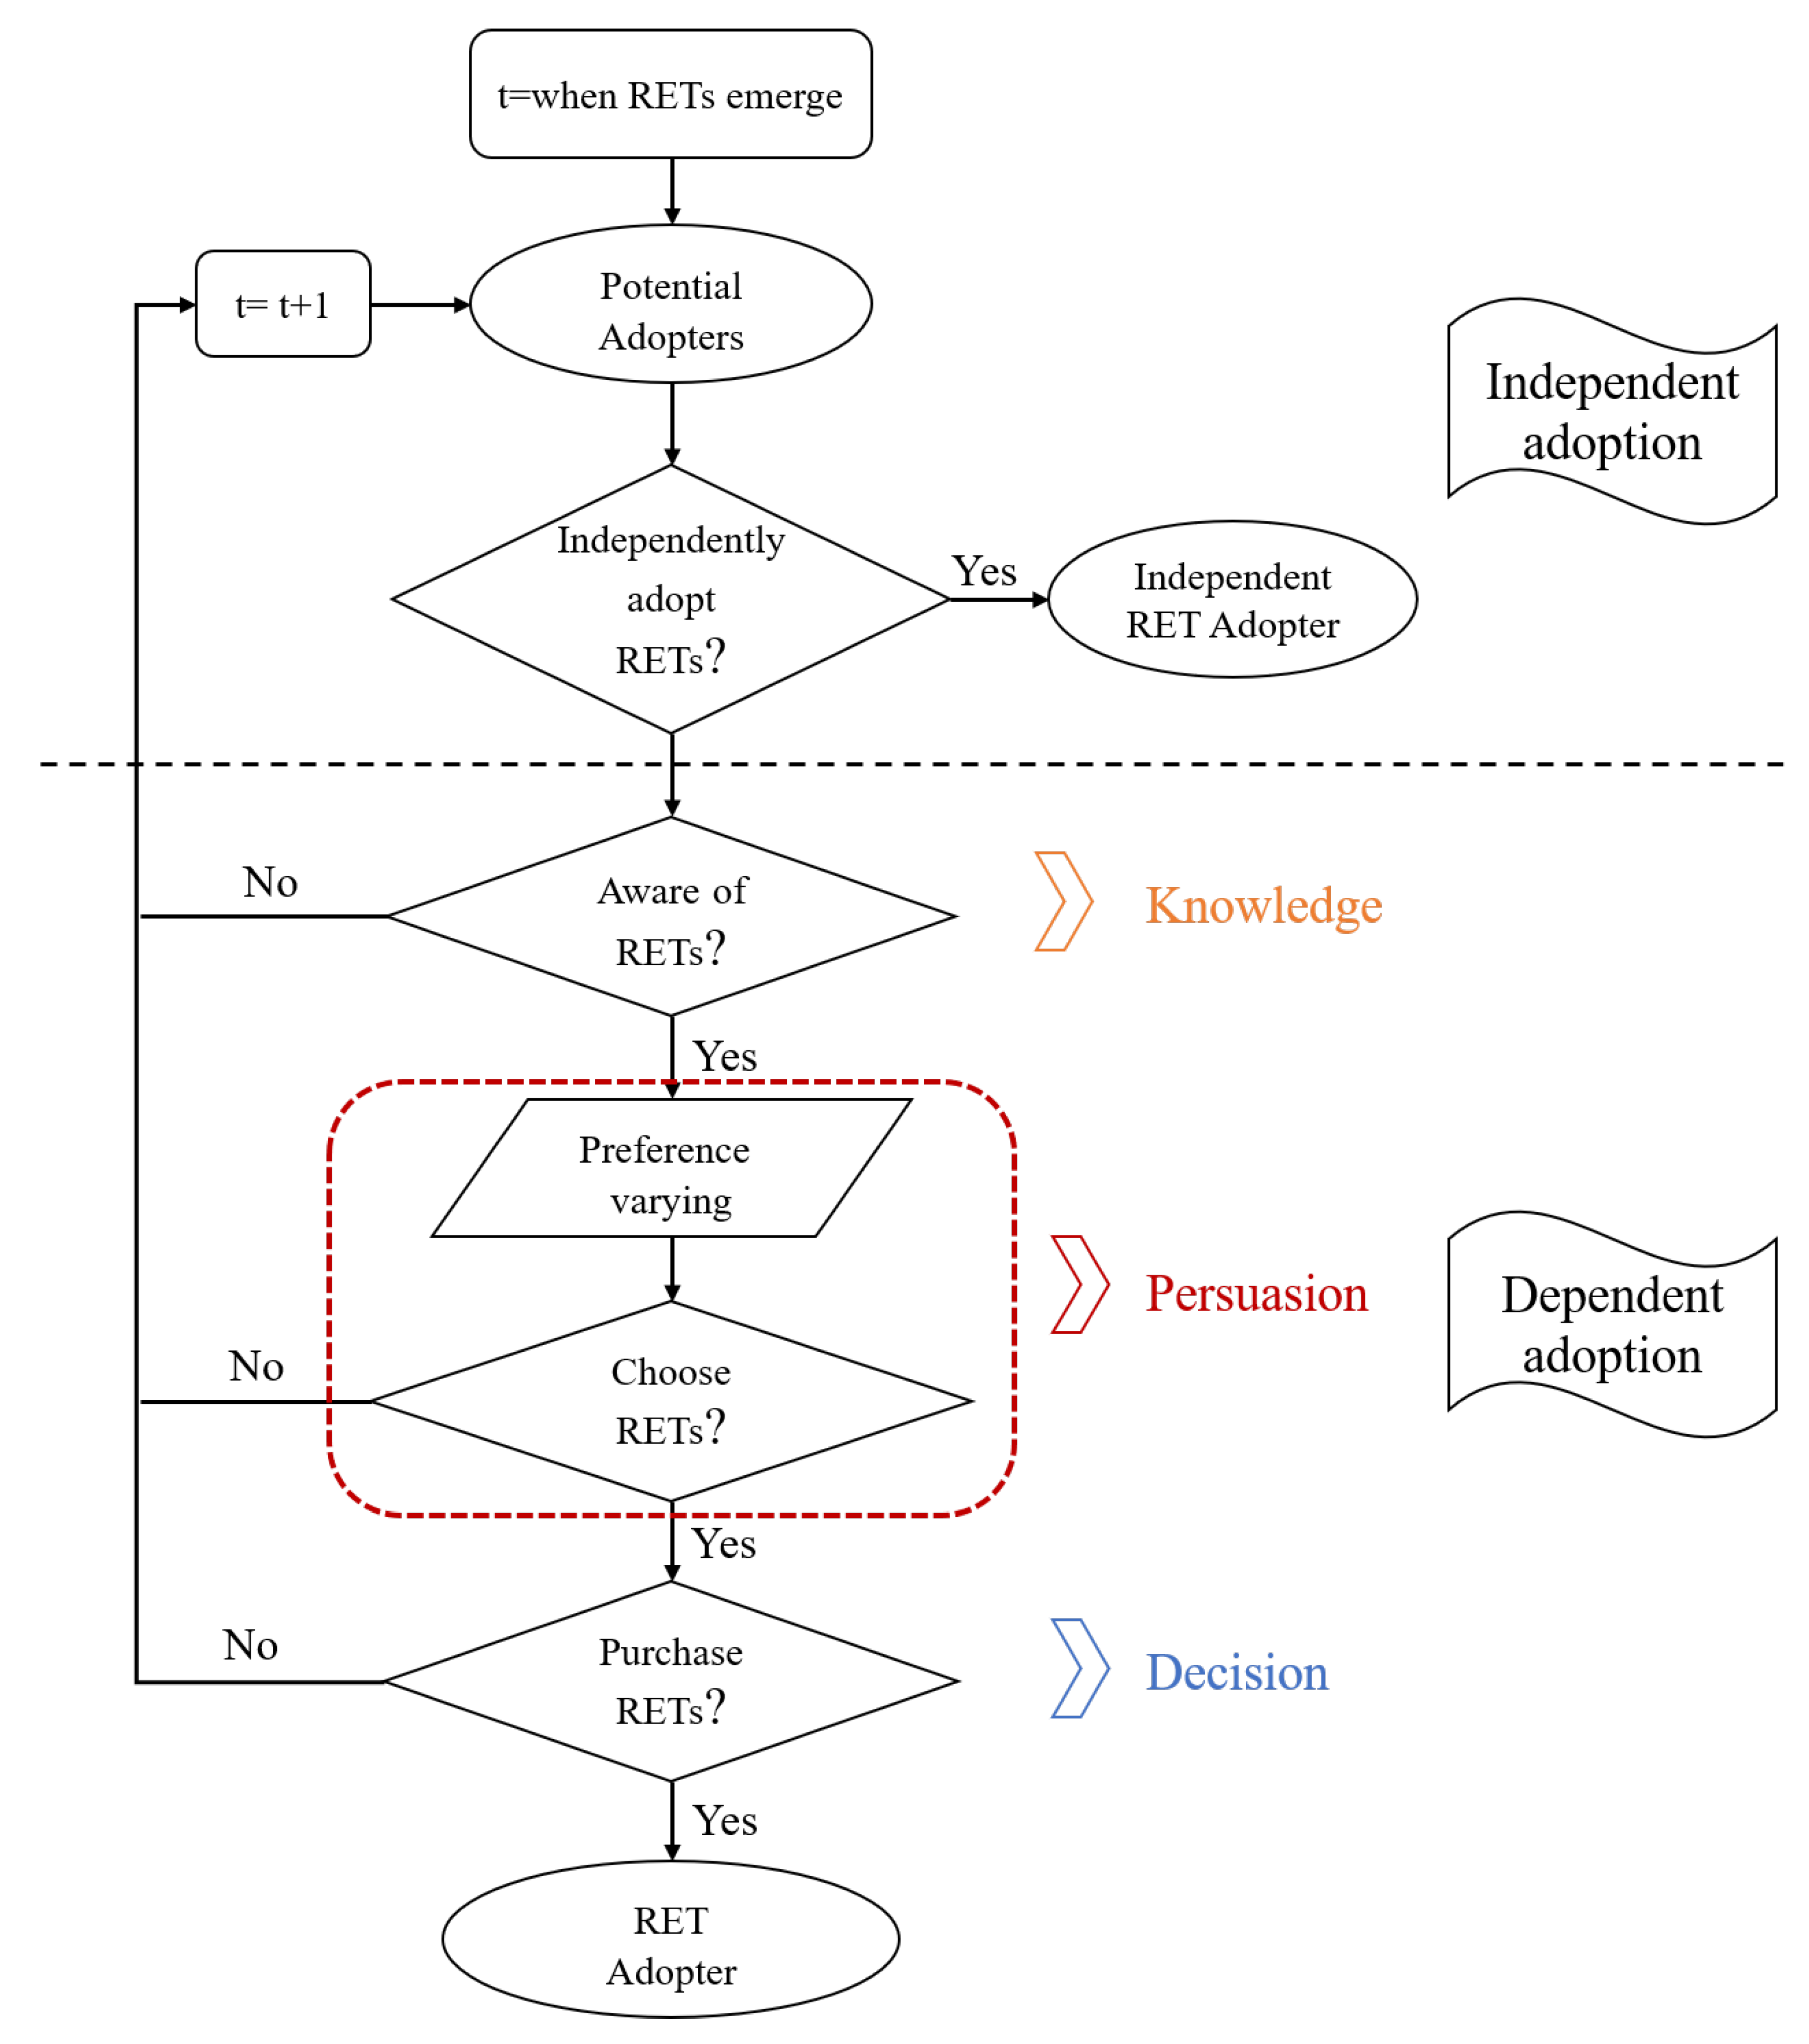
Figure 5.
Renewable energy annual supply [45].
Figure 5.
Renewable energy annual supply [45].

Figure 6.
Model calibration ().
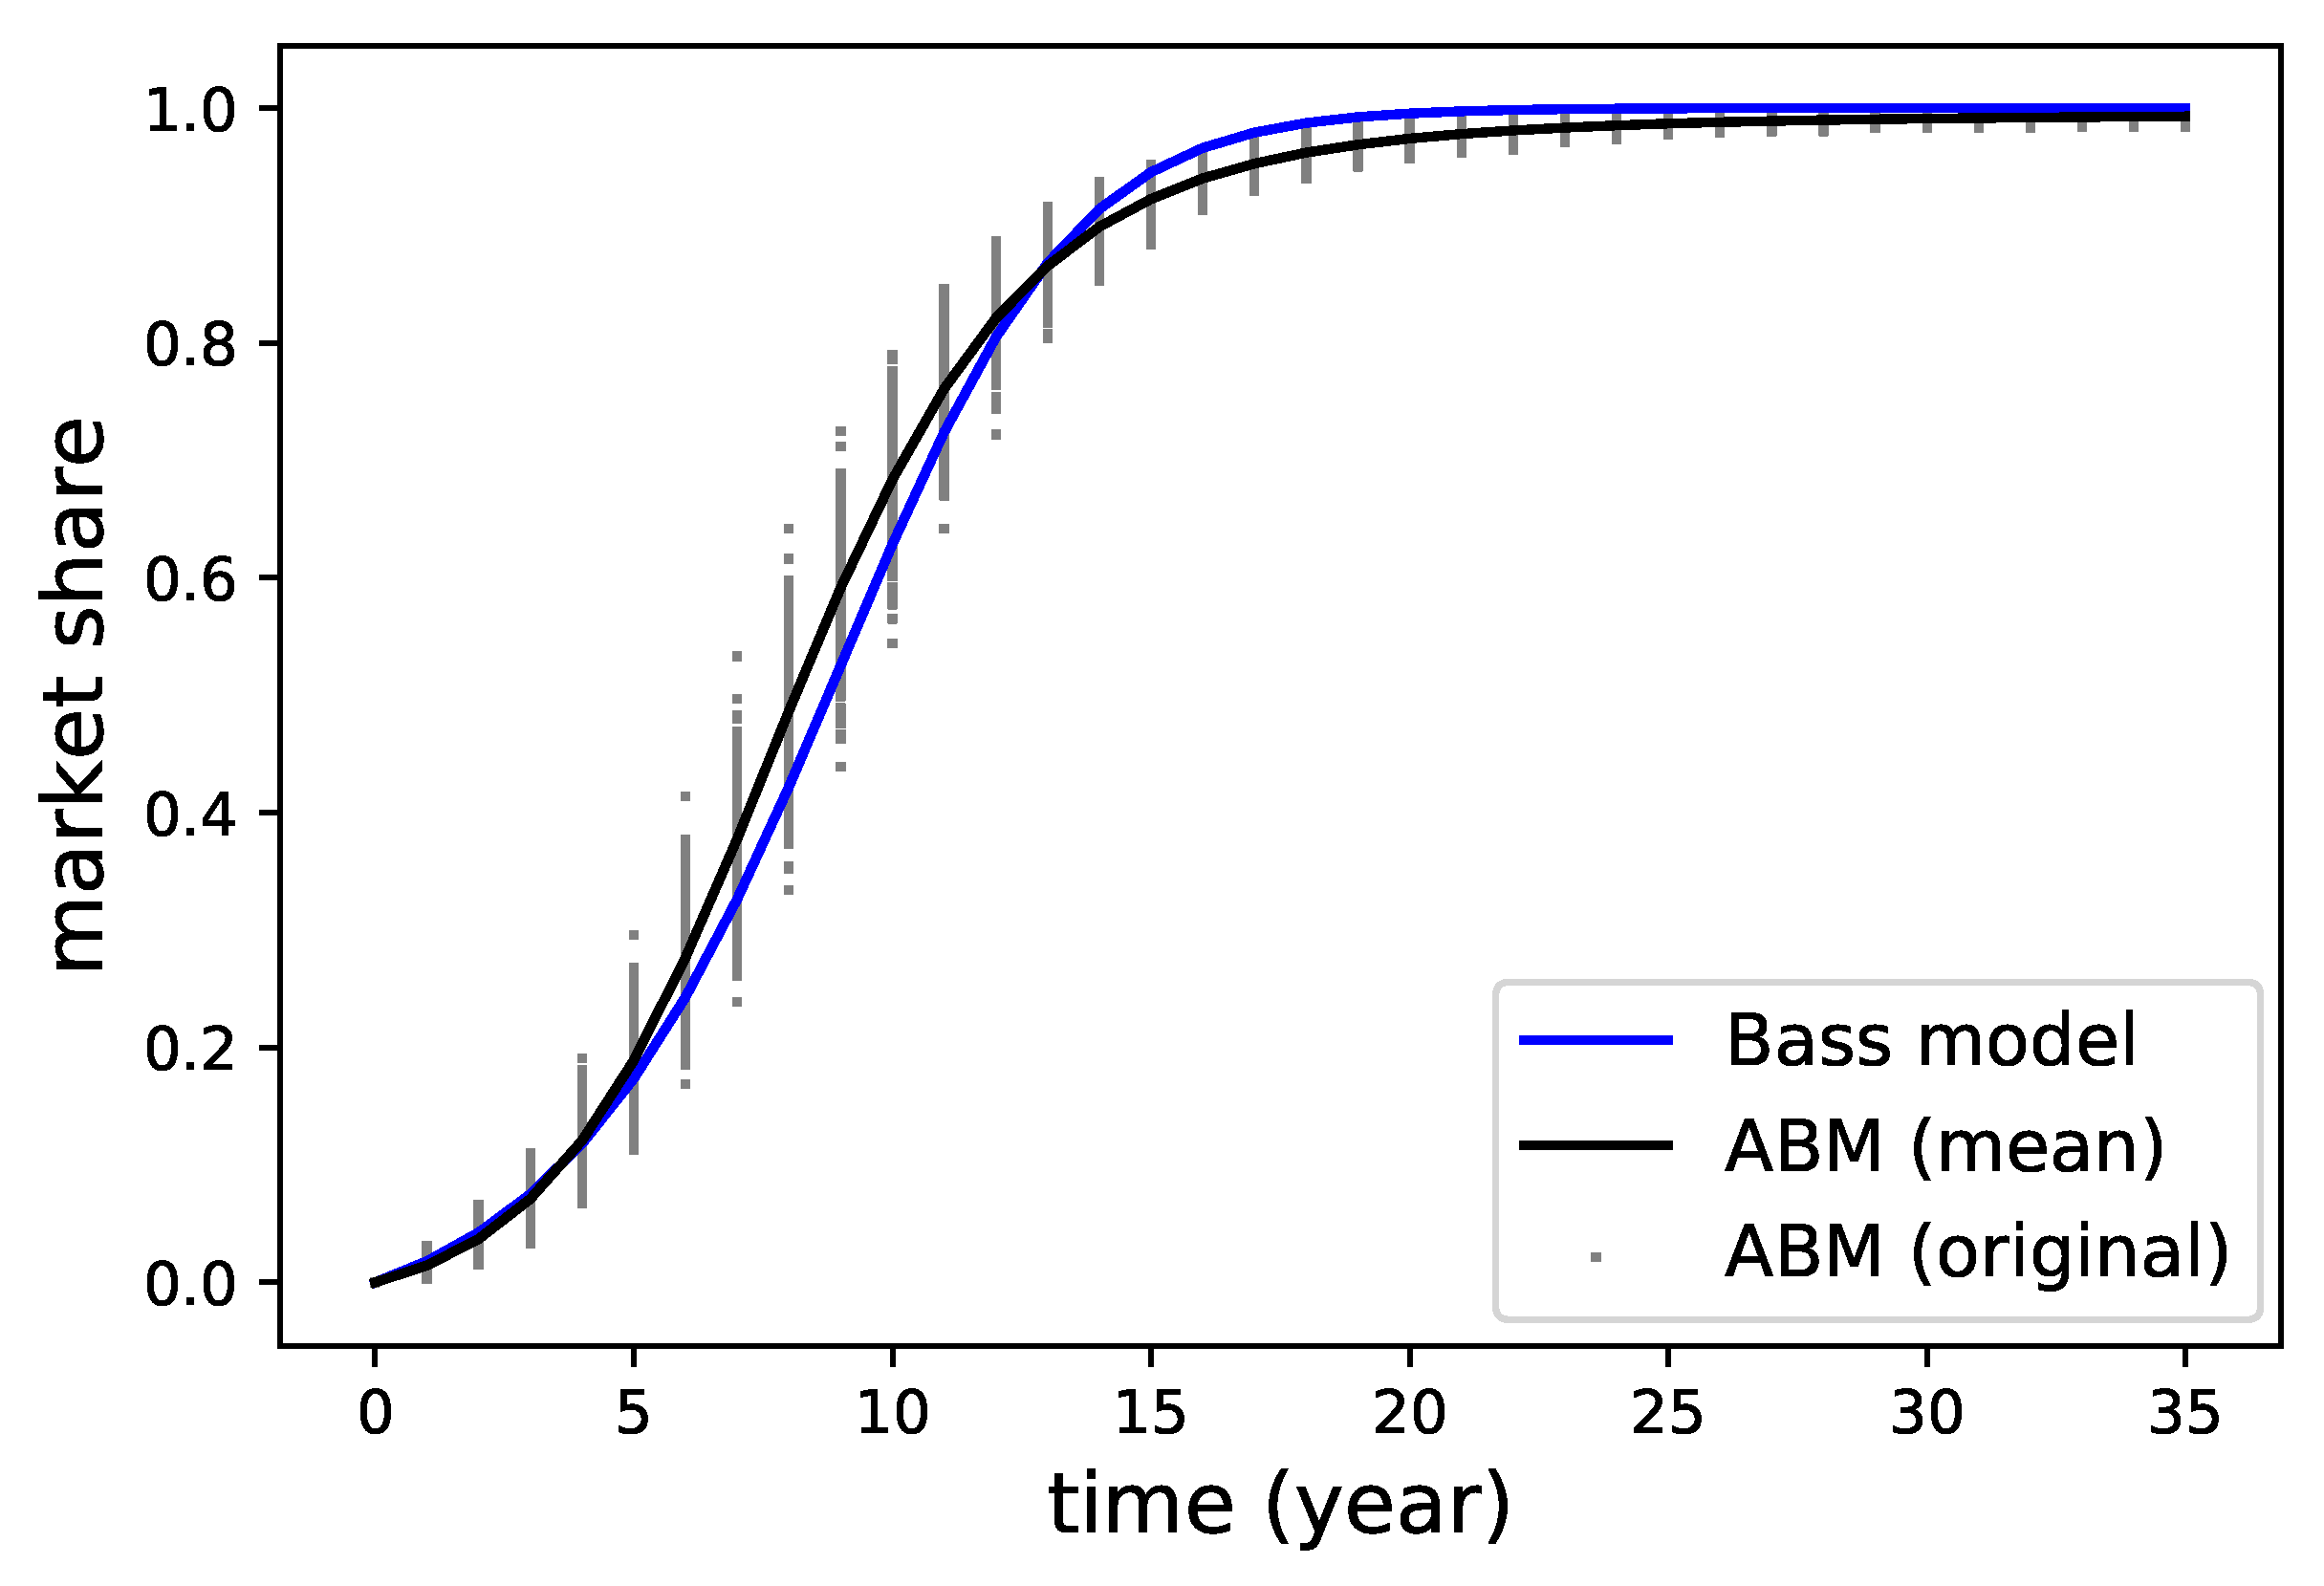
Figure 7.
The competition between two technologies entering the market with different timings. CETs, conventional energy technologies.
Figure 7.
The competition between two technologies entering the market with different timings. CETs, conventional energy technologies.

Figure 8.
The impact of RETs’ price changing.

Figure 9.
The impact of preference changing.

Figure 10.
The impact of preference changing under different values of . Gray, green, orange and blue curves respectively correspond to .
Figure 10.
The impact of preference changing under different values of . Gray, green, orange and blue curves respectively correspond to .

Figure 11.
The impact of the RET improvement rate.
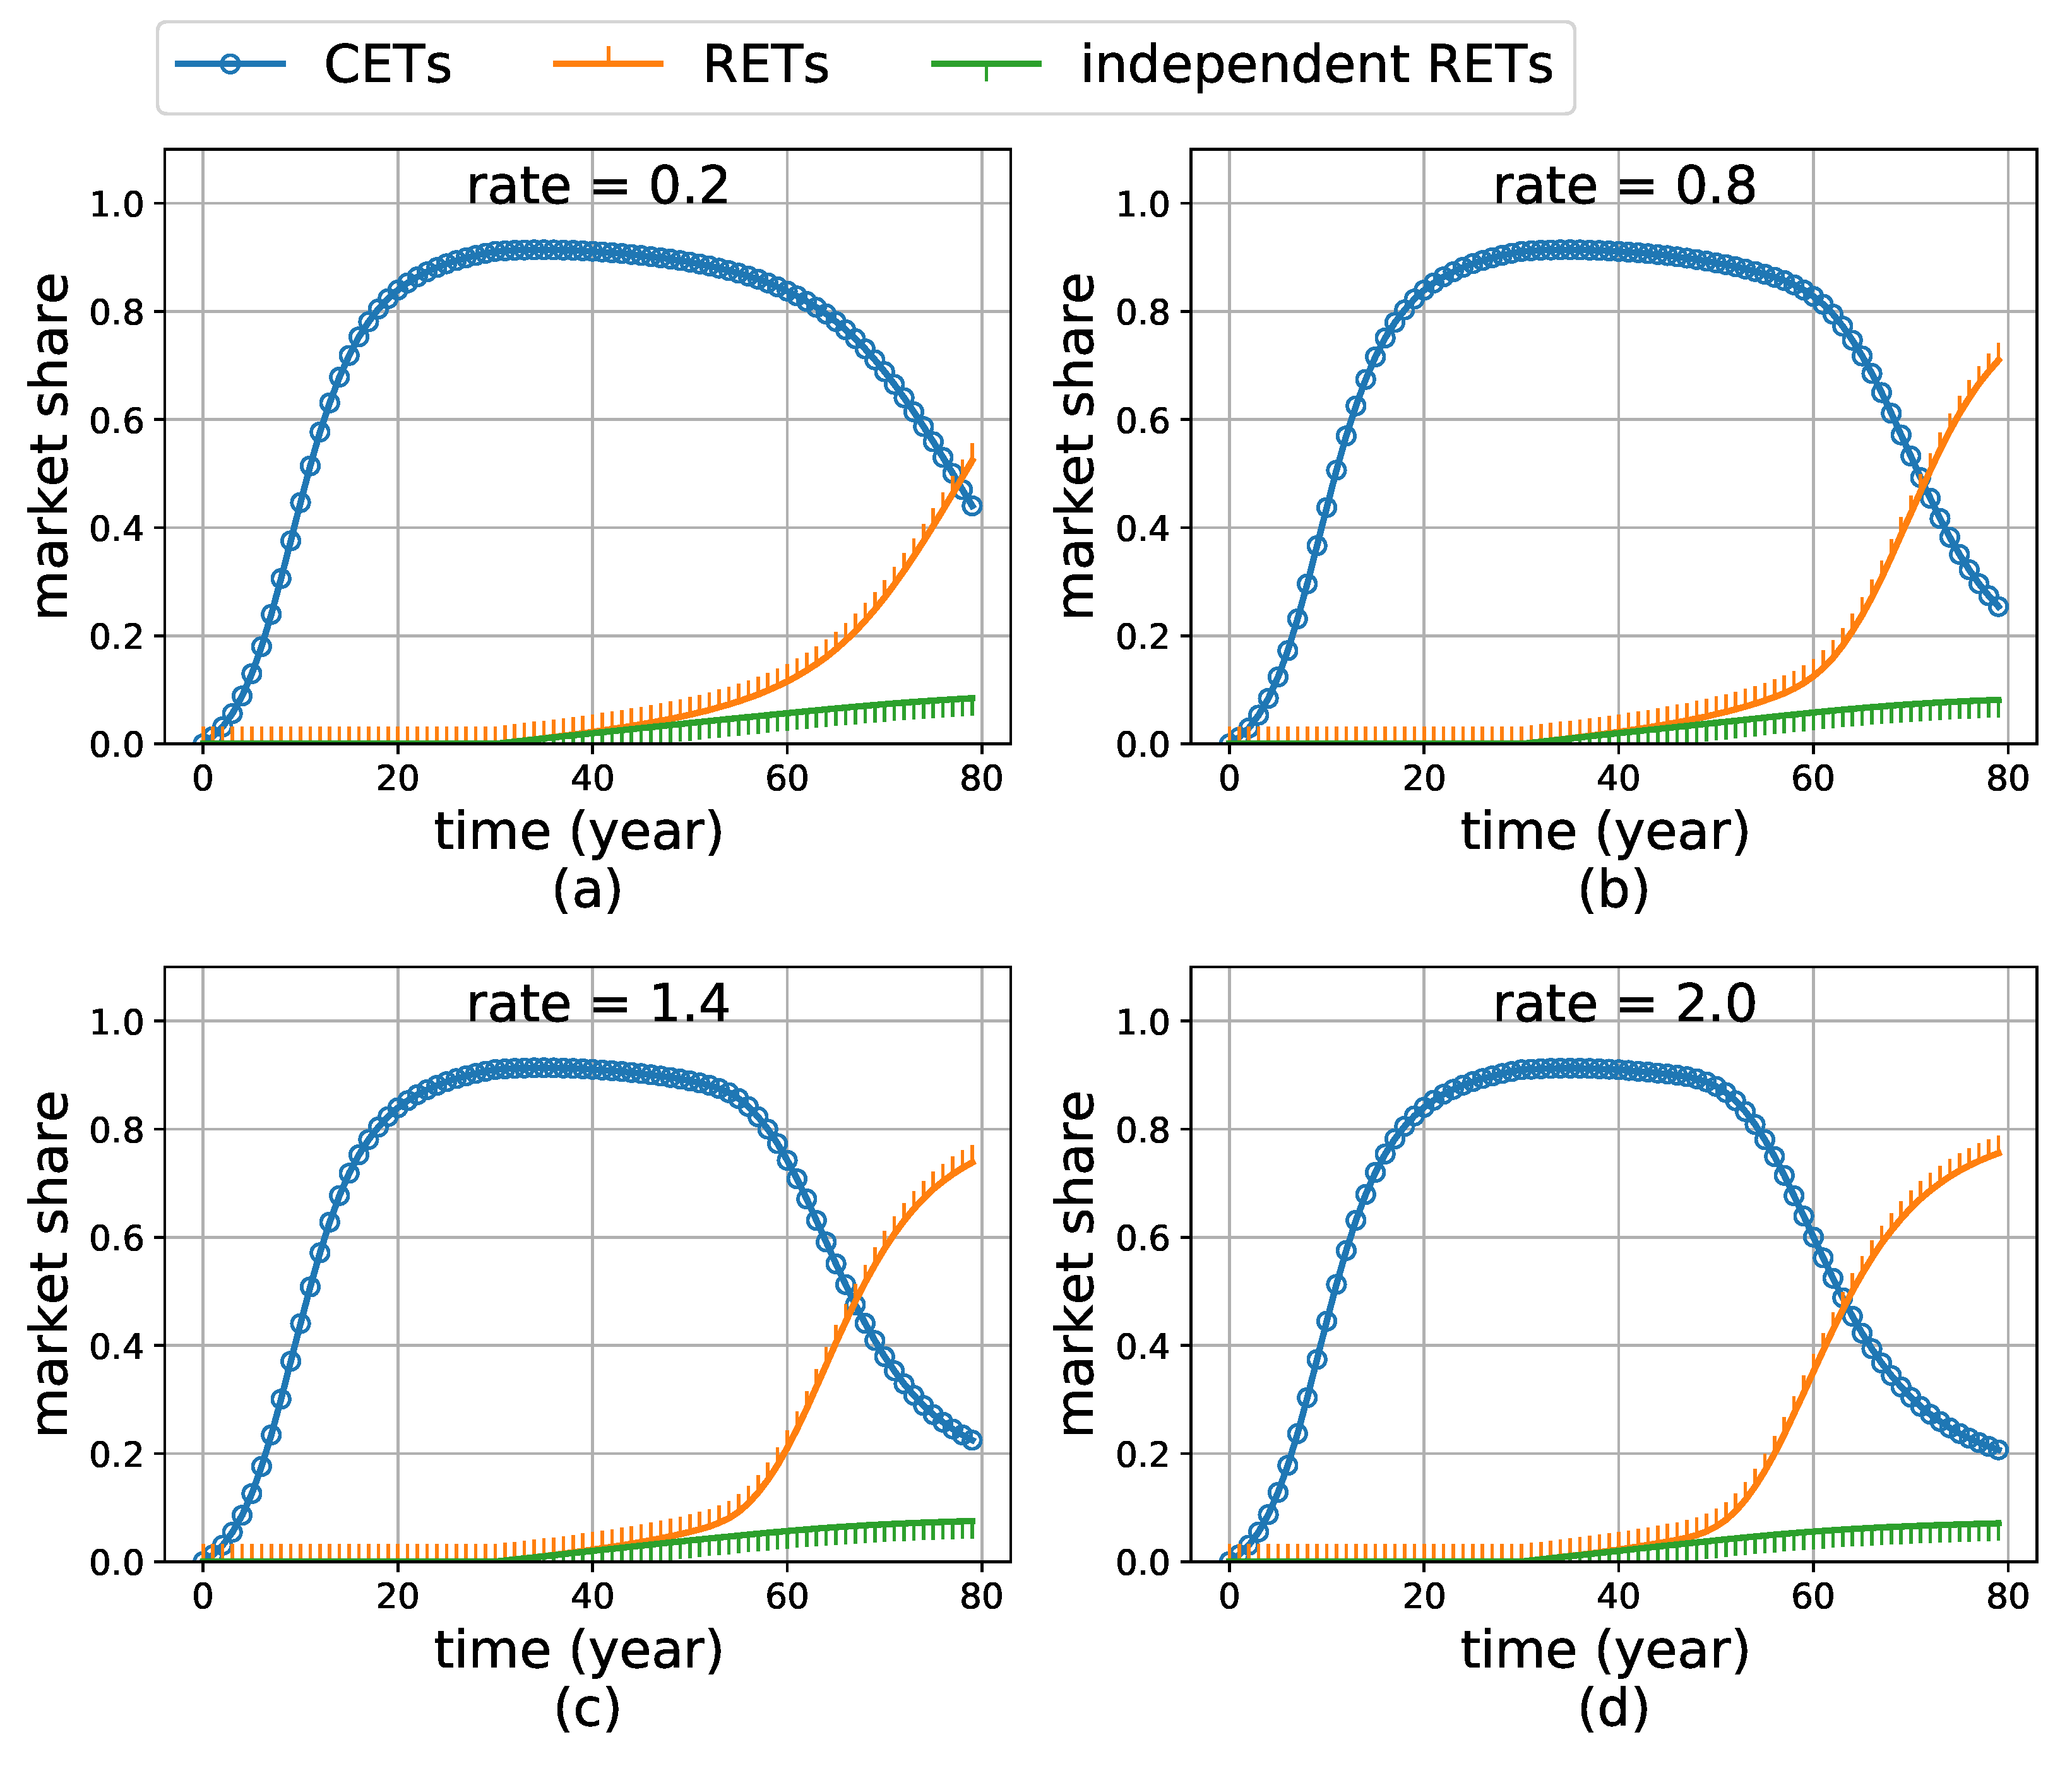
Figure 12.
The joint impact of network density and RET improvement rate.

Table 1.
Parameter settings of the one-dimensional competition scenario.
| Parameter Name | Value | Remark |
|---|---|---|
| M | 1000 | The absolute number of agents is not important when potential adopters are treated as 1. |
| 0.005 | Network density () is set according to the calibration. This is consistent with [47], which found that the networks in the real world are normally sparse. | |
| 0.01 | Set according to the calibration. The value is located in the range of previous literature [36,48]. | |
| 0.01 | Controlled for the current experiment. | |
| 0.26 | Set according to the calibration. The value is located in the range of previous literature [36,48]. | |
| 0.26 | Controlled for the current experiment. | |
| 0.01 | Assume that CETs start with a very low performance, which intends to mimic a complete maturation process of CETs. | |
| 2.6 | Set according to the calibration. This value indicates that this technology becomes fully mature after 38.9% of the consumers have adopted, according to Equation (8). | |
| Controlled for the current experiment. Indicating that the emergent technology appears with the same performance as the incumbent technology. | ||
| 2.6 | Controlled for the current experiment. | |
| 1 | The unit price of a technology’s conventional dimension. The number “1” is a convenient benchmark. |
© 2018 by the authors. Licensee MDPI, Basel, Switzerland. This article is an open access article distributed under the terms and conditions of the Creative Commons Attribution (CC BY) license (http://creativecommons.org/licenses/by/4.0/).
Share and Cite
MDPI and ACS Style
Zeng, Y.; Dong, P.; Shi, Y.; Li, Y. On the Disruptive Innovation Strategy of Renewable Energy Technology Diffusion: An Agent-Based Model. Energies 2018, 11, 3217. https://doi.org/10.3390/en11113217
AMA Style
Zeng Y, Dong P, Shi Y, Li Y. On the Disruptive Innovation Strategy of Renewable Energy Technology Diffusion: An Agent-Based Model. Energies. 2018; 11(11):3217. https://doi.org/10.3390/en11113217
Chicago/Turabian StyleZeng, Yongchao, Peiwu Dong, Yingying Shi, and Yang Li. 2018. "On the Disruptive Innovation Strategy of Renewable Energy Technology Diffusion: An Agent-Based Model" Energies 11, no. 11: 3217. https://doi.org/10.3390/en11113217
Note that from the first issue of 2016, this journal uses article numbers instead of page numbers. See further details here.