Article

Co-Digestion of Napier Grass with Food Waste and Napier Silage with Food Waste for Methane Production

by
Suriyan Boonpiyo
1,
Sureewan Sittijunda
2 and
Alissara Reungsang
1,3,*
1
Department of Biotechnology, Faculty of Technology, Khon Kaen University, Khon Kaen 40002, Thailand
2
Faculty of Environment and Resource Studies, Mahidol University, Nakhon Pathom 73170, Thailand
3
Research Group for Development of Microbial Hydrogen Production Process from Biomass, Khon Kaen University, Khon Kaen 40002, Thailand
*
Author to whom correspondence should be addressed.
Energies 2018, 11(11), 3200; https://doi.org/10.3390/en11113200
Submission received: 28 October 2018 / Revised: 7 November 2018 / Accepted: 15 November 2018 / Published: 18 November 2018
(This article belongs to the Collection Bioenergy and Biofuel)

Abstract

:
Enhancement of methane production by co-digestion of Napier grass and Napier silage with food waste was investigated in batch and repeated batch modes. First, the ratios of Napier grass to food waste and Napier silage to food waste were varied at different g-volatile solids (VS) to g-VS at an initial substrate concentration of 5 g-VS/L. The optimum ratios of Napier grass to food waste and Napier silage to food waste were 1:4 and 3:2 (g-VS/g-VS), respectively. This gave maximum methane yields (MY) of 411 and 362 mL-CH4/g-VSadded, respectively. Subsequently, the suitable ratios were used to produce methane at various substrate concentrations. A maximal MY of 403 and 353 mL CH4/g-VS were attained when concentrations of Napier grass co-digested with food waste and Napier silage co-digested with food waste were 15 g-VS/L and 20 g-VS/L, respectively. Under the optimum substrate concentration, the maximum MY from co-digestion of Napier grass with food waste was 1.14 times higher than that of Napier silage with food waste. Thus, co-digestion of Napier grass with food waste was further investigated at various organic loading rates (OLRs) in a 10.25 L horizontal reactor with a working volume of 5 L at an optimal ratio of 1:4 (g-VS/g-VS) and substrate concentration of 15 g VS/L. An OLR of 1.5 g-VS/L∙d gave a maximum methane production rate and MY of 0.5 L CH4/L∙d and 0.33 L-CH4/g-VSadded, respectively. Under the optimum OLR, the predominant methane producers were Methanoregula sp., Methanotorris sp., Methanobacterium sp., Methanogenium sp. and Methanosarcina sp. An energy production of 11.9 kJ/g-VSadded was attained.

1. Introduction

Methane is an alternative energy resource that has received considerable attention due to its high heating value of 55.5 MJ/kg [1], which is equivalent to 15.4 kWh of electricity and 1.2 times higher than an equal mass of liquefied petroleum gas (LPG) [2]. In Thailand, various kinds of agricultural feedstock have been used to produce methane, e.g., biomass residues from palm oil milling [3,4], cassava pulp [5], Napier grass and Napier silage [6], and rice straw [7]. Napier grass (Pennisetum purpureum) contains high content of cellulose, hemicellulose [6,8] and other nutrients which made it suitable to use as the substrate for energy and animal feed. Napier grass is rapidly regenerated after cutting with a high yield per unit area, and fast growth. Thus, the utilization of Napier grass to energy does not compete with the utilization as animal feed. In Thailand, Napier grass is promoted as the energy crop by Thai Government [9]. The Department of Alternative Energy Development and Efficiency (2018) [9] reported that one tonne of fresh Napier grass can produce 90 m3 of biogas. Napier silage, produced from a self-fermentation of Napier grass under anaerobic conditions, can also be used as a feedstock to produce methane. During the ensiling process, cellulose and hemicellulose in fresh Napier grass are partially digested into sugars and volatile fatty acids (VFAs). Then, the VFAs are converted to methane. As a consequence, methane production can be improved [10,11].
In order to enhance the methane production, various kinds of methods have been conducted e.g., in situ injection of hydrogen inside the anaerobic reactor and ex situ injection of hydrogen in a separate reactor [12]. Among the existing methods, the classical approach is to optimize the key environmental factors affecting methane production process. In this study, the carbon to nitrogen ratio (C/N) was optimized. Carbon is an energy source while nitrogen is used for cell synthesis. If the C/N ratio is high, methanogens will rapidly consume the nitrogen to meet their protein requirements and will no longer consume the remaining carbon content of the material. As a result, gas production will be low. Alternatively, if the C/N ratio is very low, nitrogen will be liberated and accumulated in the form of ammonium (NH4+), which is toxic to methanogens [13]. Therefore, to achieve maximal methane production from Napier grass and Napier silage, the C/N ratio should be properly adjusted. Since the main component of Napier grass and Napier silage is carbon, an organic substance containing a high nitrogen content should be co-digested with Napier grass and Napier silage to balance the C/N ratio.
Food waste is the largest organic waste over the world [14]. Over 8.6 million tonnes of it is produced per year in Thailand [15]. Food wastes are rich in degradable carbohydrates, proteins, and lipids in the ranges of 41–62%, 15–25% and 13–30%, respectively [16]. Food waste has a high nitrogen content with the C/N ratio in the range of 11.27 to 16.50% which make it suitable substrate to co-digest with Napier grass and Napier silage to balance the C/N ratio for methane production.
In this study, co-digestion of Napier grass with food waste and Napier silage with food waste in batch and repeated batch mode was conducted to produce methane. The ratio of Napier grass to food waste and Napier silage to food waste for methane production was first optimized. The concentration of Napier grass and food waste, Napier silage and food waste for methane production was further investigated. Then, the organic loading rate (OLR) for methane production from a co-digestion of Napier grass with food waste and Napier silage with food waste under an optimum ratio and substrate concentration was determined in a horizontal reactor. Pre-dominant microorganisms at the optimum OLR in a repeated batch mode were identified by polymerase chain reaction—denaturing gradient gel electrophoresis (PCR-DGGE).

2. Results and Discussion

2.1. Optimization of the Mixture Ratios and Substrate Concentration for Methane Production

The variation of mixing ratios of Napier grass to food waste and Napier silage to food waste resulted in a variation of methane production potential (MP), methane production rate (MPR), and methane yield (MY) (Table 1). A slight increase in the pH at the end of the fermentation could have been caused by the degradation of protein in food waste and subsequent release of ammonia into the fermentation broth. This has been previously reported in experiments using protein-rich feedstocks such as food waste, meat extract and kitchen waste as substrates in an anaerobic digestion (AD) [17,18]. However, the final pH of the fermentation broth was not markedly different (in the range of 7.41–7.49) (Table 1). This is probably due to the buffering capacity of NaHCO3 in the Basic Anaerobic medium (BA medium) [19]. The compositions of BA medium is shown in Section 3.3.
MP and MY obtained from co-digestion of Napier grass with food waste increased with an increase in the proportion of food waste in the substrate (Table 1). Simple organic components such as sugars, protein and fat were the primary degradable substrates in food waste, while cellulose and hemicellulose, accounting for 64.58% of VS content, were the degradable substrates in Napier grass. An increase in the proportion of food waste in the substrate increased the overall substrate digestion resulting in an increase in the MP and MY. The MY obtained from the fermentation of food waste alone (410 mL-CH4/g-VSadded) was 1.7 times greater than that of Napier grass alone (240 mL-CH4/g-VSadded) (Table 1), indicating that food waste was more susceptible to AD than Napier grass. Deublein and Steinhauser [20] reported that the composition of the substrate used to produce methane affected the rate of hydrolysis step in AD process.
The maximum MY, 411 mL-CH4/g-VSadded, at the optimum Napier grass to food waste ratio of 1:4 (g-VS/g-VS) with a C/N ratio of approximately 18.35 was 1.71 times greater than that obtained from Napier grass alone (C/N ratio of 58.15). This result indicated an enhancement of MY by co-digestion of Napier grass with food waste. Thus, the optimal Napier grass to food waste ratio of 1:4 (g-VS/g-VS) was selected for used in subsequent experiments.
The fermentation of Napier silage alone yielded MP and MY values of 964.9 mL-CH4/L and 193 mL-CH4/g-VSadded, respectively, which were less than that obtained from the fermentation of Napier grass alone (Table 1). This may due to the fact that Napier grass has a higher organic carbon (45.36 %) than the silage (43.18%). The enhancement of methane production by co digestion of Napier silage with food waste was clearly observed. Greater MP and MY values were via co-digestion compared to the fermentation of Napier silage alone (Table 1). MP and MY obtained from co-digestion increased with the proportion of food waste in the substrate (Table 1).
Lower MP and MY values were observed at Napier silage to food waste ratios of 2.5:2.5 and 2:3 (g-VS/g-VS) than at a ratio of 3:2 (g-VS/g-VS). The maximum MP and MY values were achieved at a Napier silage to food waste ratio of 1:4 (g-VS/g-VS). However, the MY obtained at Napier silage to food waste ratios of 1:4 (371 mL-CH4/g-VSadded) and 3:2 (g-VS/g-VS) (362 mL-CH4/g-VSadded) were not statistically different. Since the main purpose of this study is to use Napier grass and Napier silage as a feedstock for methane production, the ratio containing more Napier silage, 3:2 (g-VS/g-VS), was selected and used in further experiments.
Substrate concentrations were further optimized at the optimal Napier grass and Napier silage to food waste ratios. Cumulative methane production and lag time for Napier grass co-digested with food waste was found to increase with the substrate concentration. Further increases in the substrate concentration to levels greater than 35 g-VS/L, resulted in an increase in the cumulative methane production and a longer lag time (Table 2). These results suggested that the microorganisms required time to adapt to higher substrate concentrations. Similar trends were observed for co-digestion of Napier silage with food waste. A maximum MY of 416 mL CH4/g-VSadded was achieved at 10 g-VS/L, which was not significantly different than that of 15 g-VS/L. However, the MPR at a substrate concentration of 15 g-VS/L was 1.25 times higher than at 10 g-VS/L. Thus, the substrate concentration of 15 g-VS/L was selected for use as the initial substrate concentration for co-digestion of Napier grass with food waste in the subsequent experiment.
Co-digestion of Napier silage with food waste at the substrate concentration of 10 and 15 g-VS/L showed no lag time in the fermentation. This occurred since the cellulose and hemicellulose in silage was partially digested by lactic acid bacteria, forming sugars and organic acids [10,11] before being further converted to methane. However, at substrate concentrations greater than 15 g-VS/L, a longer lag time was observed (Table 2).
At a ratio of Napier silage with food waste of 3:2 (g-VS/g-VS), variation of substrate concentration resulted in changes in the MPR and MY. Total substrate concentrations of 20 g-VS/L and 30 g-VS/L gave the same MY of 353 mL-CH4/g-VSadded and MPR values of 256.7 and 339.9 mL-CH4/L∙d, respectively. However, the lag time at a substrate concentration of 20 g-VS/L was shorter than the lag time at 30 g-VS/L. Therefore, the suitable substrate concentration for co-digestion of Napier silage with food waste was 20 g-VS/L. This resulted in a maximum MY of 353 mL-CH4/g-VSadded.
The pH of the fermentation broth of all treatments was quite stable. At the end of the fermentation, it was in the range of 7.42–7.65 and 7.21–7.38 for co-digestion of Napier grass with food waste and Napier silage with food waste, respectively (Table 2). These results implied that microbes rapidly converted accumulated VFAs to methane. Moreover, the buffer in the BA medium might have helped maintain the pH of fermentation broth during AD. Thus, the final pH was not drastically changed.
The maximum MY obtained from co-digestion of Napier grass with food waste (403 mL-CH4/g-VSadded) was 1.14 times higher than the MY from the co-digestion of Napier silage with food waste (353 mL-CH4/g-VSadded). Therefore, co-digestion of Napier grass with food waste at a ratio of 1:4 (g-VS/g-VS) and substrate concentration of 15 g-VS/L was further used to optimize the OLRs in the horizontal reactor in a repeated batch mode.

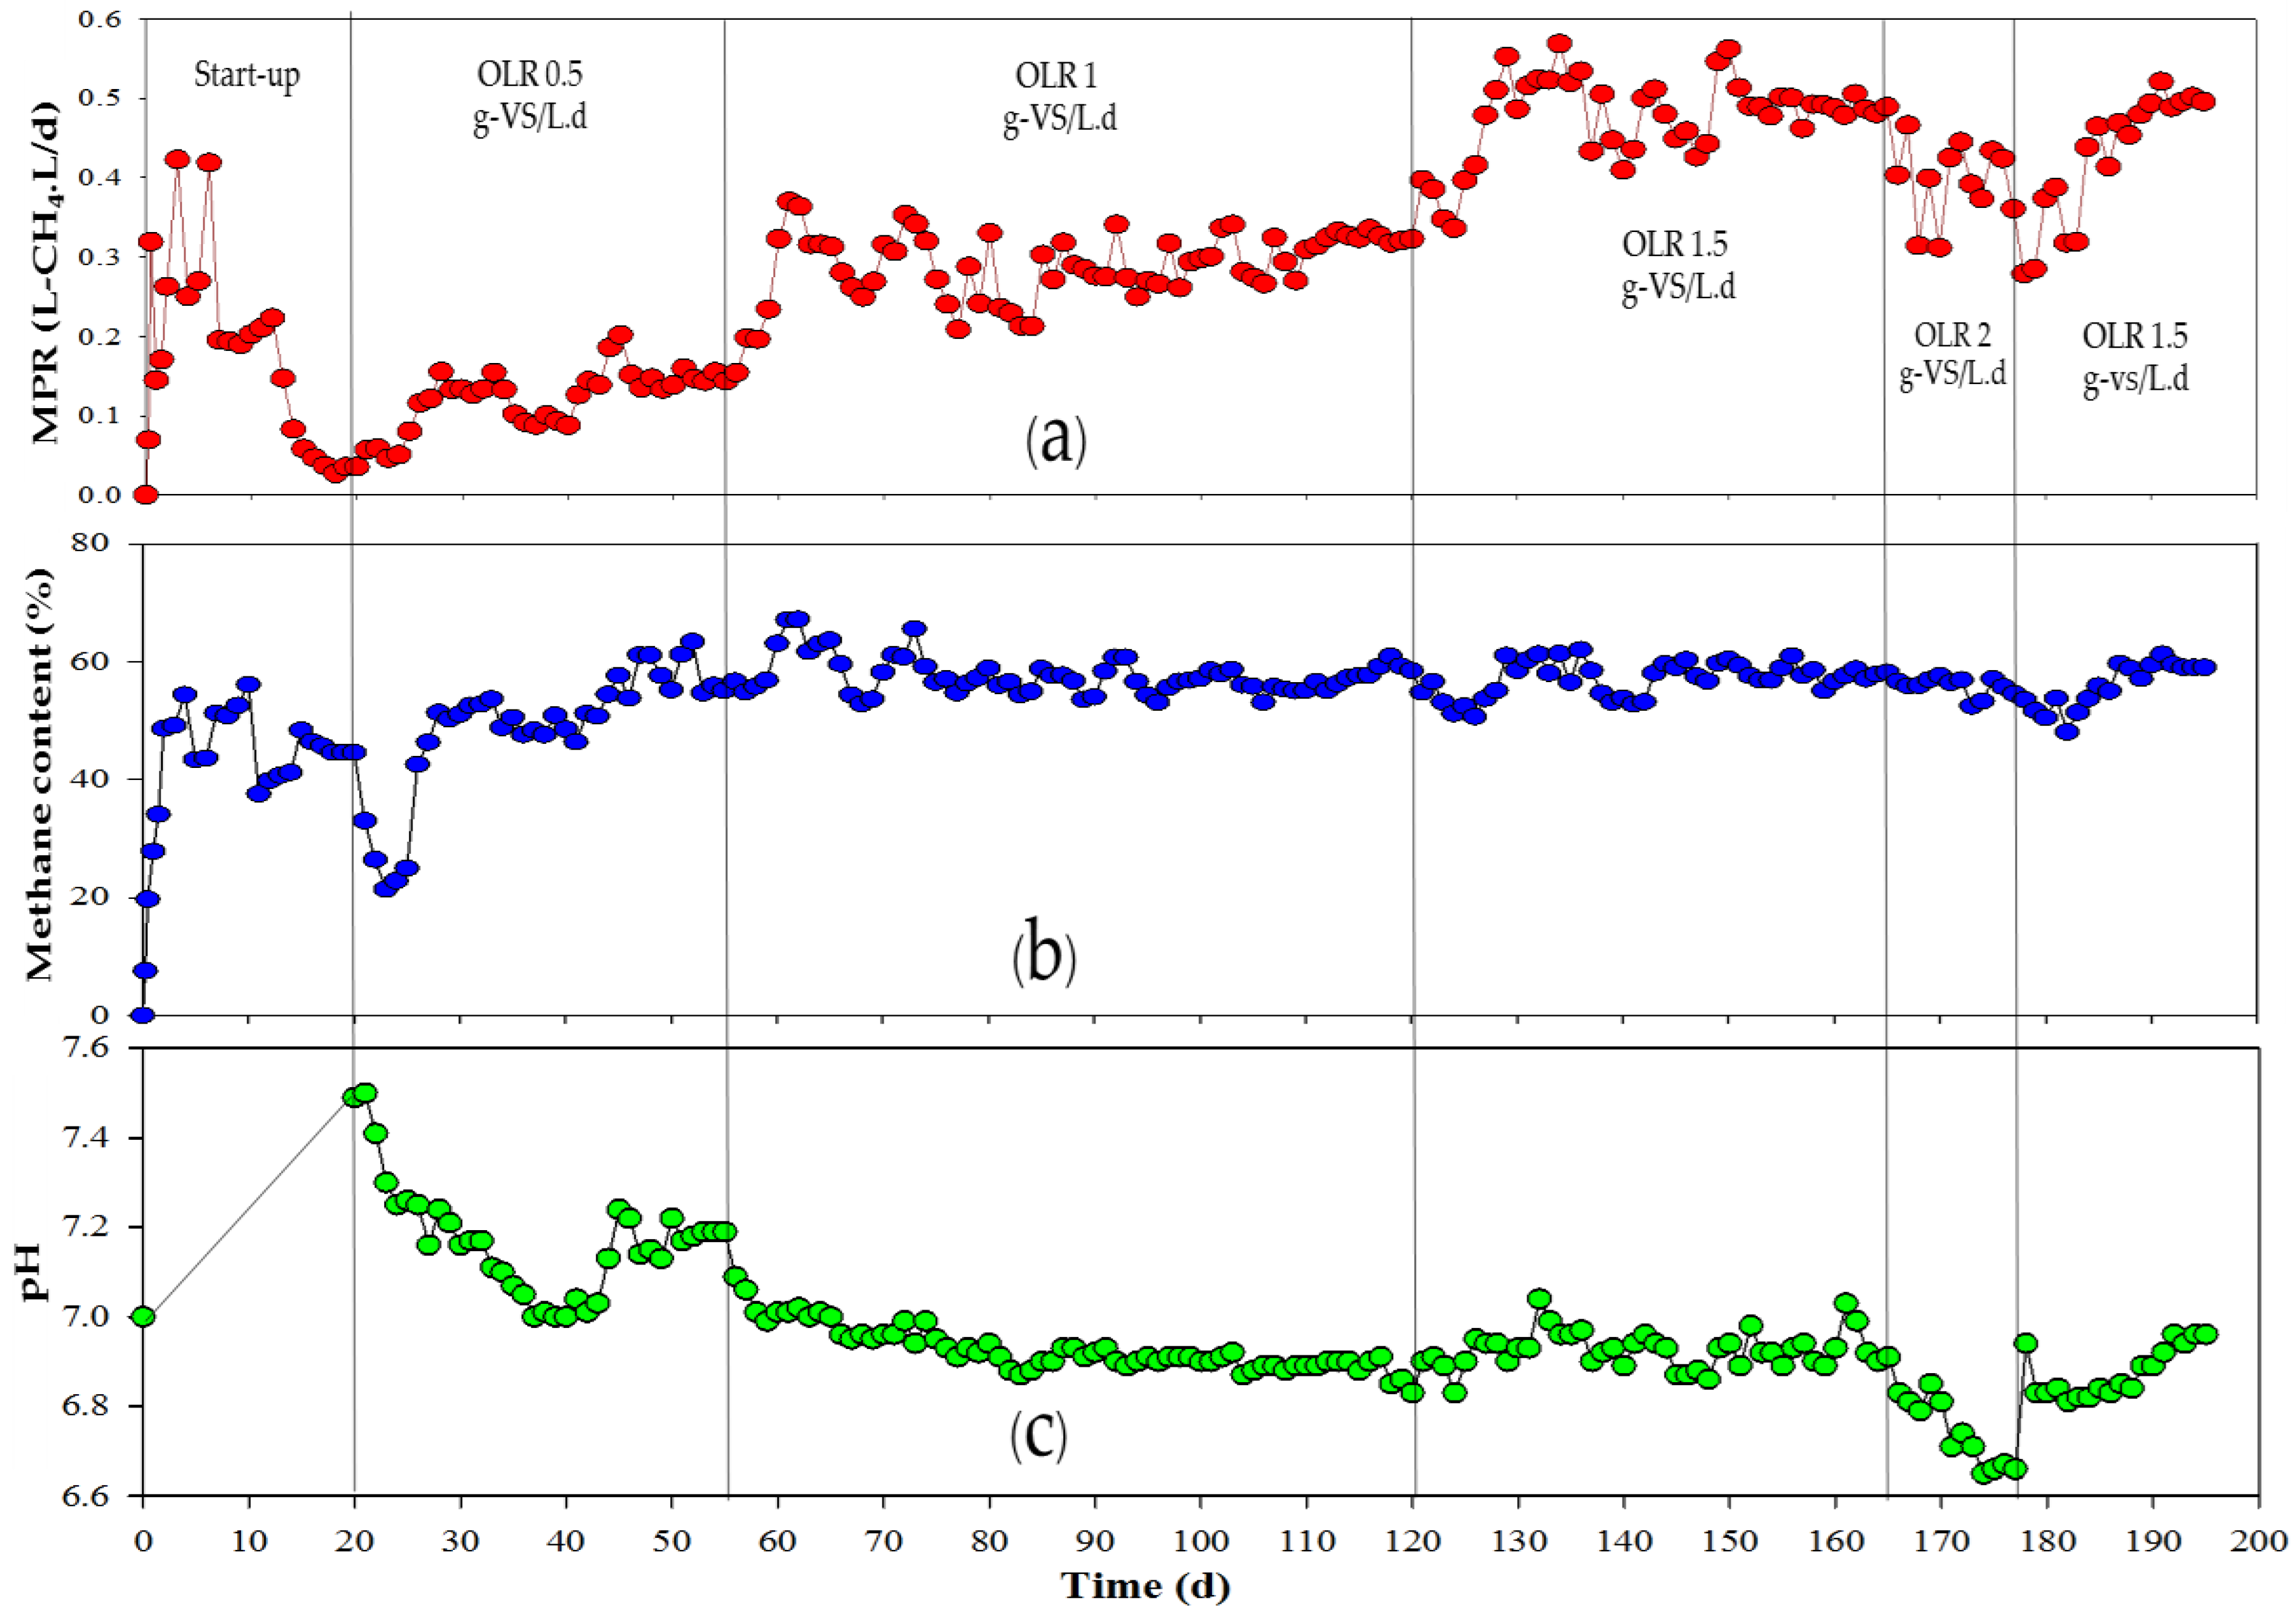
2.2. Repeated Batch Fermentation of Napier Grass Co-Digested with Food Waste

Napier grass was co-digested with food waste at a ratio of 1:4 (g-VS/g-VS) and a total substrate concentration of 15 g-VS/L in a repeated batch mode. At the start-up period, the methane content increased from 0 to 56.1% and was stable (45.7%) at day 20 (Figure 1). Then the reactor was switched to a repeated batch mode at various OLRs of 0.5, 1, 1.5 and 2 g VS/L∙d. The results showed that the variation in the OLR led to a changes in the MPR and PH. The biogas consisted of methane and carbon dioxide.
The methane content of the biogas at each OLR was between 55 and 59%. The MPR and MY gradually increased with increasing OLR from 0.5 to 1.5 g-VS/L∙d (Table 3). However, when OLR was greater than 1.5 g-VS/L∙d, the MPR and MY showed a decreasing trend. The methane content was stable in the range of 57.6 to 58.1% at OLR values of 0.5 1.5 g VS/L∙d. An increase in OLR to 2.0 g-VS/L∙d resulted in the slight decrease in methane content to 54.6%. The increased OLR brought more substrate into the horizontal anaerobic reactor system and increased the substrate concentration. Consequently, methane production was enhanced.
At each OLR, VFAs/alkalinity ratios of 0.045 to 0.353 were observed (Table 3), indicating the stability of this reactor. Callaghan et al. (2002) [21] reported that the VFAs/alkalinity ratio should be kept below 0.4 to avoid the process instabilities. At OLR 0.5–1.5 g-VS/L∙d, the pH could remain above 6.8, indicating a well buffered fermentation. However, the pH decreased to 6.66 at an OLR 2.0 g-VS/L∙d, which is correlated with a decrease in the MPR and MY. The optimum pH for methanogens ranges from 6.8–7.2 [13]. At pH values lower than 6.6, inhibition of methanogens has been observed [13].

2.3. Energy Production and a Comparison with the Literature Values

The maximum energy yields of 14.5 and 12.7 kJ/g-VSadded were obtained from batch fermentation of a co-digestion of Napier grass with food waste and Napier silage with food waste, respectively. These values are comparable to those of the studies of Prapinagsorn et al. [22], González et al. [23] and Silva et al. [24]. In contrast, they are lower than that reported by Schievano et al. [25]. The difference in energy yield could be due to the ratio of substrate to inoculum, type of substrate as well as the type of inoculum and fermentation conditions.
The maximum energy yield (11.9 kJ/g-VSadded) obtained at the optimum OLR of 1.5 g-VS/L·d was lower than that reported in the studies of Prapinagsorn et al. [22], González et al. [23] and Silva et al. [24]. However, it was higher than reported by Arreola-Vargas et al. [26], Nualsri et al. [27] and Prapinagsorn et al. [6] (Table 4). The discrepancies might also have been due to variations in substrate types, concentrations, inoculum types and fermentation modes.

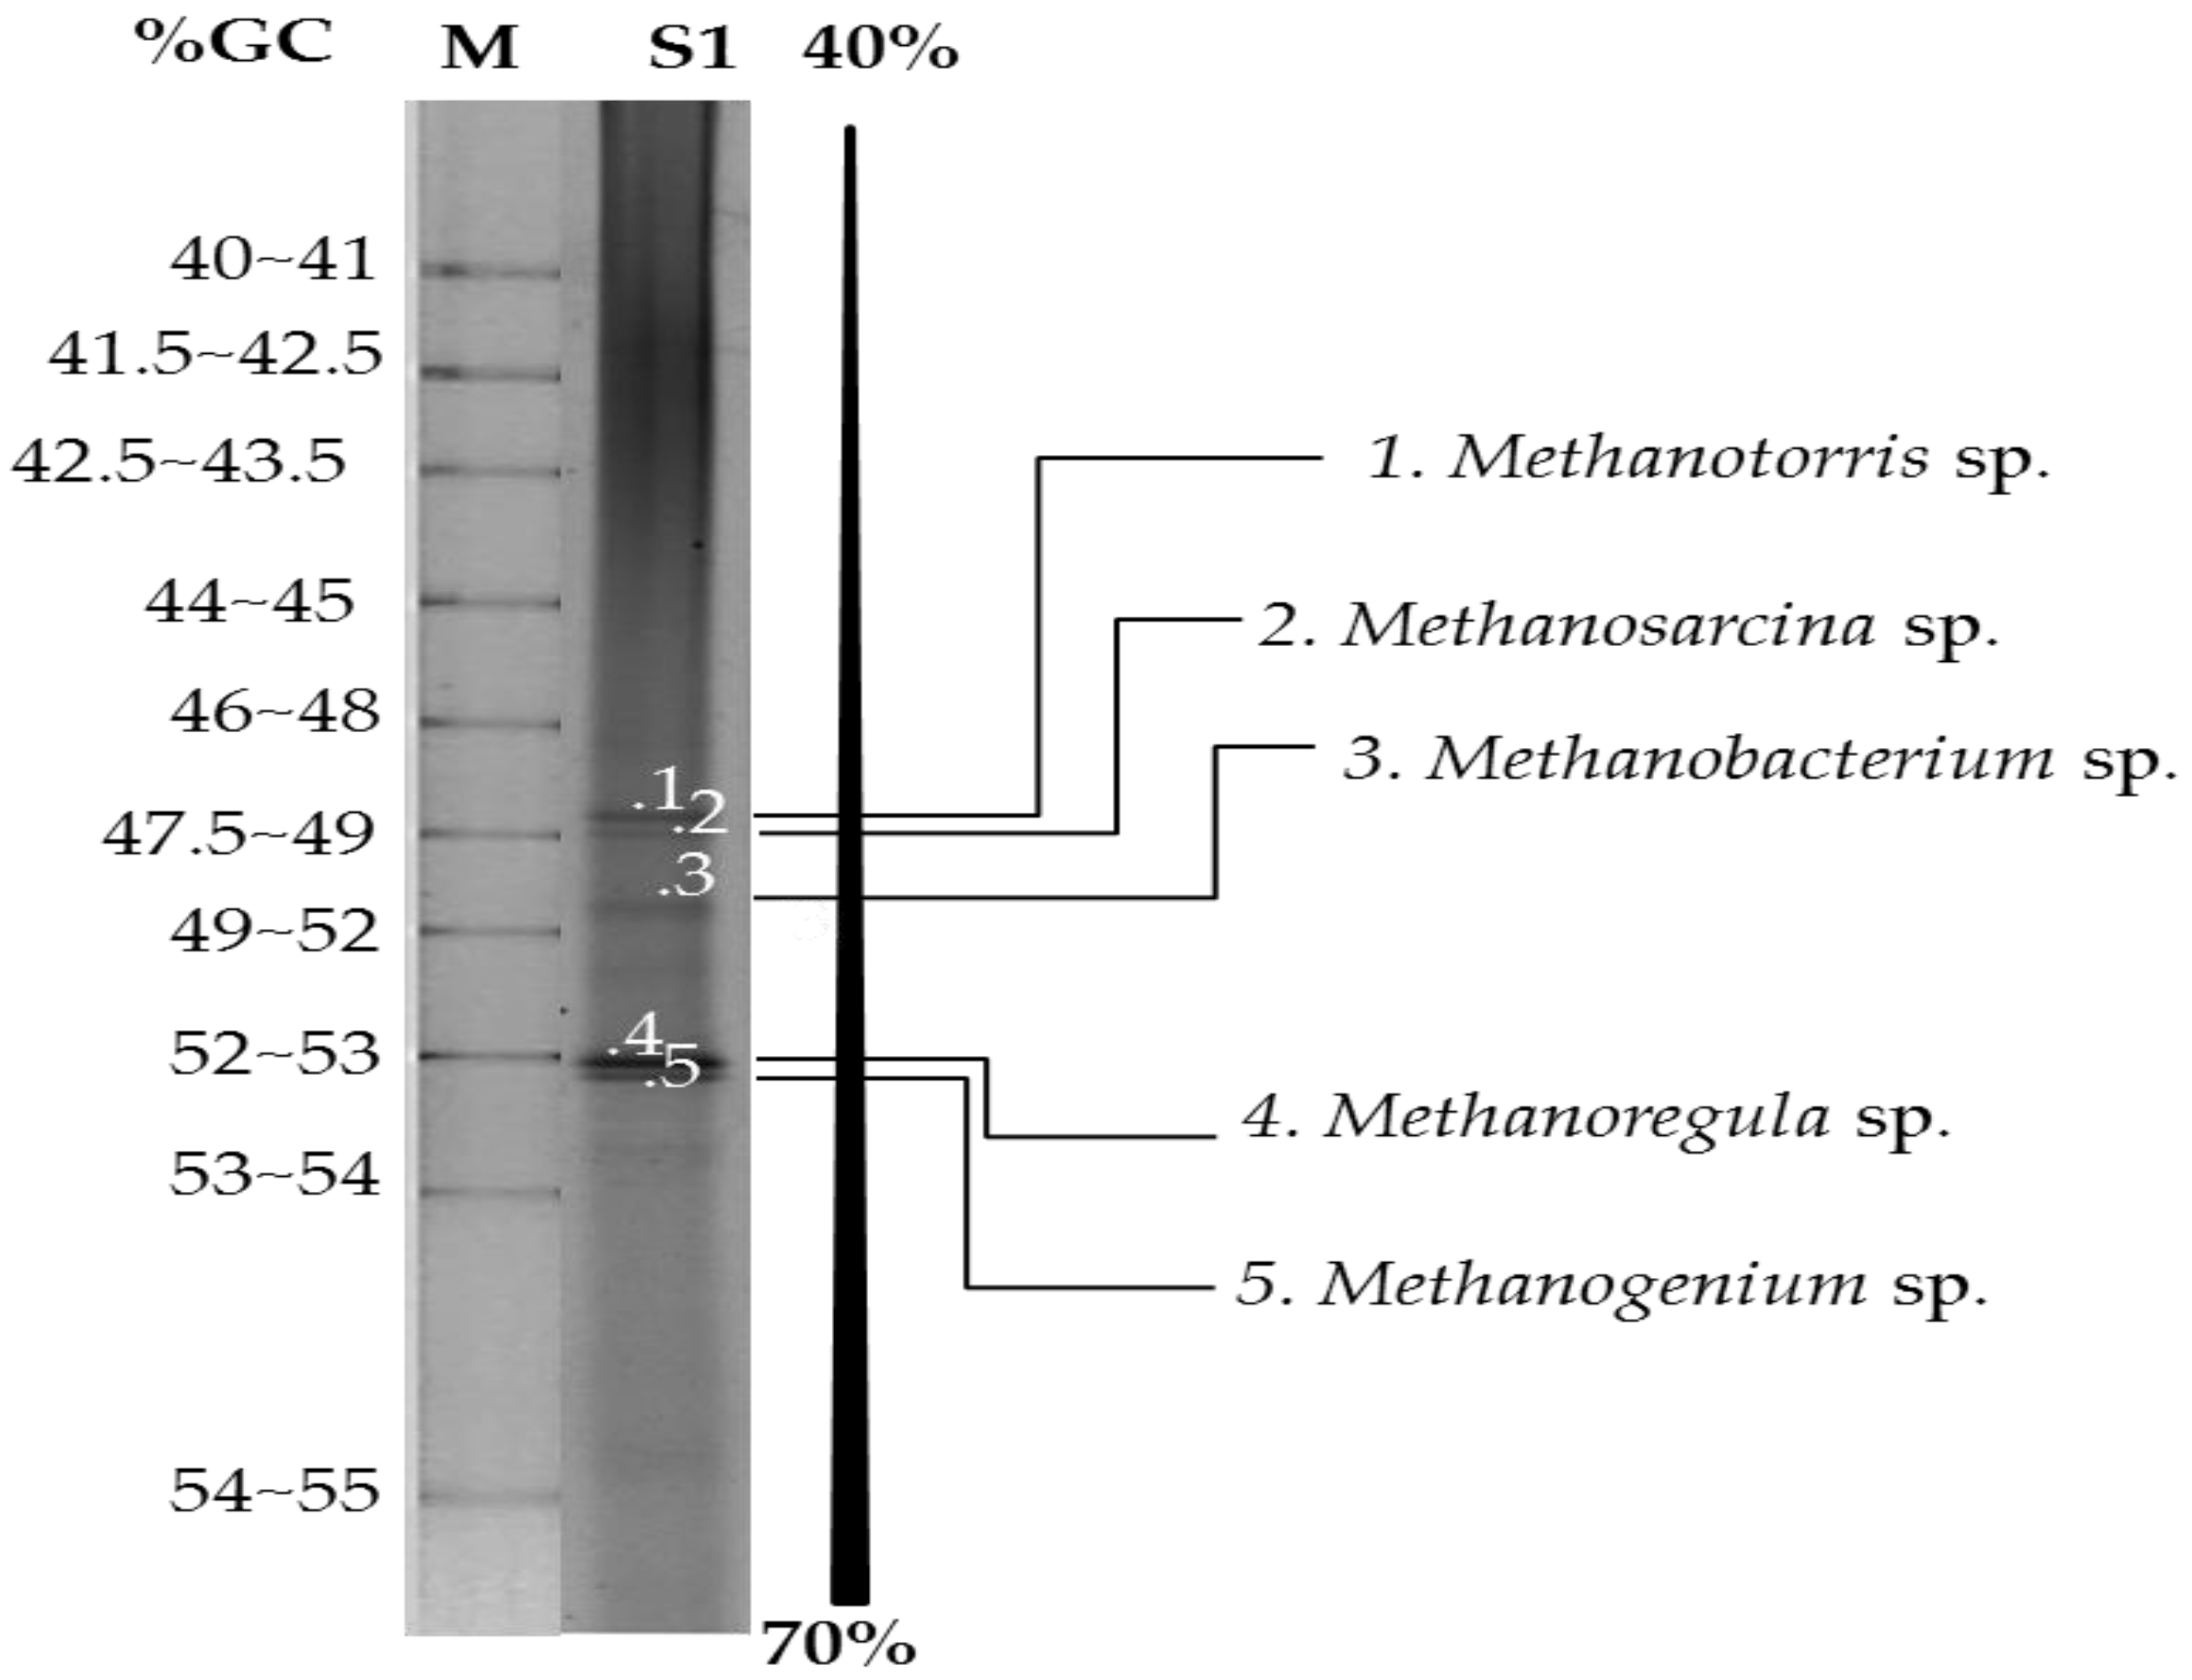
2.4. Microbial Community

The predominant microorganisms at an OLR level of 1.5 g-VS/L∙d were Methanoregula sp. (band 4) Methanotorris sp. (band 1) Methanobacterium sp. (band 3), Methanogenium sp. (band 5) and Methanosarcina sp. (band 2, Figure 2). These microorganisms are methanogens that play an important role in the AD process. Methanoregula sp. is the primary mesophilic archaea (30–35 °C) found in granular sludge [6,27]. Methanoregula sp., Methanotorris sp. and Methanogenium sp. are methanogens that use hydrogen, carbon dioxide and formate as the substrates to produce methane (equations (1) and (2)) [32].
Strictly hydrogenotrophic methanogenic bacteria, Methanobacterium sp., utilize hydrogen and carbon dioxide to form methane (Equation (2)) [33,34,35] while acetoclastic methanogenic bacterium, Methanosacina sp., is capable of converting acetic acid to methane (Equation (1)) [6,35]:
CH3COO + H2O Energies 11 03200 i001 CH4 + HCO3  ΔG = −31.0 kJ/mol
Acetoclastic methanogens
4H2 + CO2 Energies 11 03200 i001 CH4 + 2H2O  ΔG = −139 kJ/mol
Hydrogenotrophic methanogens

3. Material and Methods

3.1. Substrate

The Pak Chong 1 strain of Napier grass from Sriviroj Farm Co., Ltd., Khon Kaen, Thailand, was used as the substrate. It was harvested after 60 days of growth by cutting it at level 5 10 cm above the ground. All parts of Napier grass plant, including stems and leaves were used as a substrate. Napier silage was prepared by fermenting fresh Napier grass in tightly closed containers under anaerobic conditions and room temperature (30 ± 3 °C) for two weeks (self-fermentation). Both substrates were ground in a blender and then passed through a 2 mm sieve (10 mesh). They were stored at −20 °C and hawed at room temperature before use.
Food waste was collected from a canteen on the Khon Kaen University Campus, Khon Kaen, Thailand. Bones and plastic materials were removed from food waste before being ground in a food blender. The processed food waste was stored at −20 °C before use as a substrate for methane production. The initial compositions of Napier grass, Napier silage and food waste are shown in Table 5.

3.2. Inoculum

Anaerobic granular sludge was collected from an up-flow anaerobic sludge blanket reactor (UASB) used to produce methane from a hydrogenic effluent obtained from a reactor producing hydrogen from sugarcane syrup by Clostridium butyricum TISTR1032. Prior to use, UASB granules were degassed in a 600 mL serum bottle, capped with butyl rubber stoppers and aluminum caps. The bottle contents were purged with nitrogen gas for 10 minutes to create anaerobic conditions. The inoculum bottles were degassed for 7 days at room temperature (30 ± 3 °C) to allow the inoculum to utilize the residual biodegradable sugars and VFAs.

3.3. Optimization of the Mixture Ratios of Napier Grass and Napier Silage to Food Waste and Substrate Concentration for Methane Production

Co-digestion of Napier grass with food waste and Napier silage with food waste were conducted at various initial g-VS/g-VS ratios of 4.75:0.25, 4.5:0.5, 4.25:0.75, 4:1, 3:2, 2.5:2.5, 2:3 and 1:4, with a total substrate concentration of 5 g-VS/L. Batch experiments were carried out in 120 mL serum bottles with a working volume of 70 mL. Each serum bottle contained 20% (v/v) of inoculum, BA medium (Table 6—Modified from Angelidaki and Sanders [19]) and 5 g-VS/L of substrate. The pH was adjusted to 7 by addition of either 5 M HCl or 5 M NaOH. The bottles were capped with butyl rubber stoppers and aluminum caps and then purged with nitrogen for 5 min to create anaerobic conditions. Then, they were incubated at room temperature (30 ± 3 °C) and shaken at 150 rpm. During the fermentation, the volume of biogas was measured using a wetted glass syringe method [36]. Gas samples were taken to analyze the percentage of methane in the biogas using gas chromatography (GC). The fermentation was continued until biogas was no longer produced. The ratios of Napier grass and Napier silage to food waste that gave the highest methane production were further used as the optimal ratios in subsequent experiments.
The substrate concentration of Napier grass and Napier silage and food waste were determined using the optimal ratios of Napier grass to food waste and Napier silage to food waste from the previous experiment. The experiments were conducted by varying concentration of VS at 10, 15, 20, 25, 30, 35, 40, 45 and 50 g-VS/L. The experimental set up, pH adjustment, methane fermentation and gas measurement were conducted as described above.

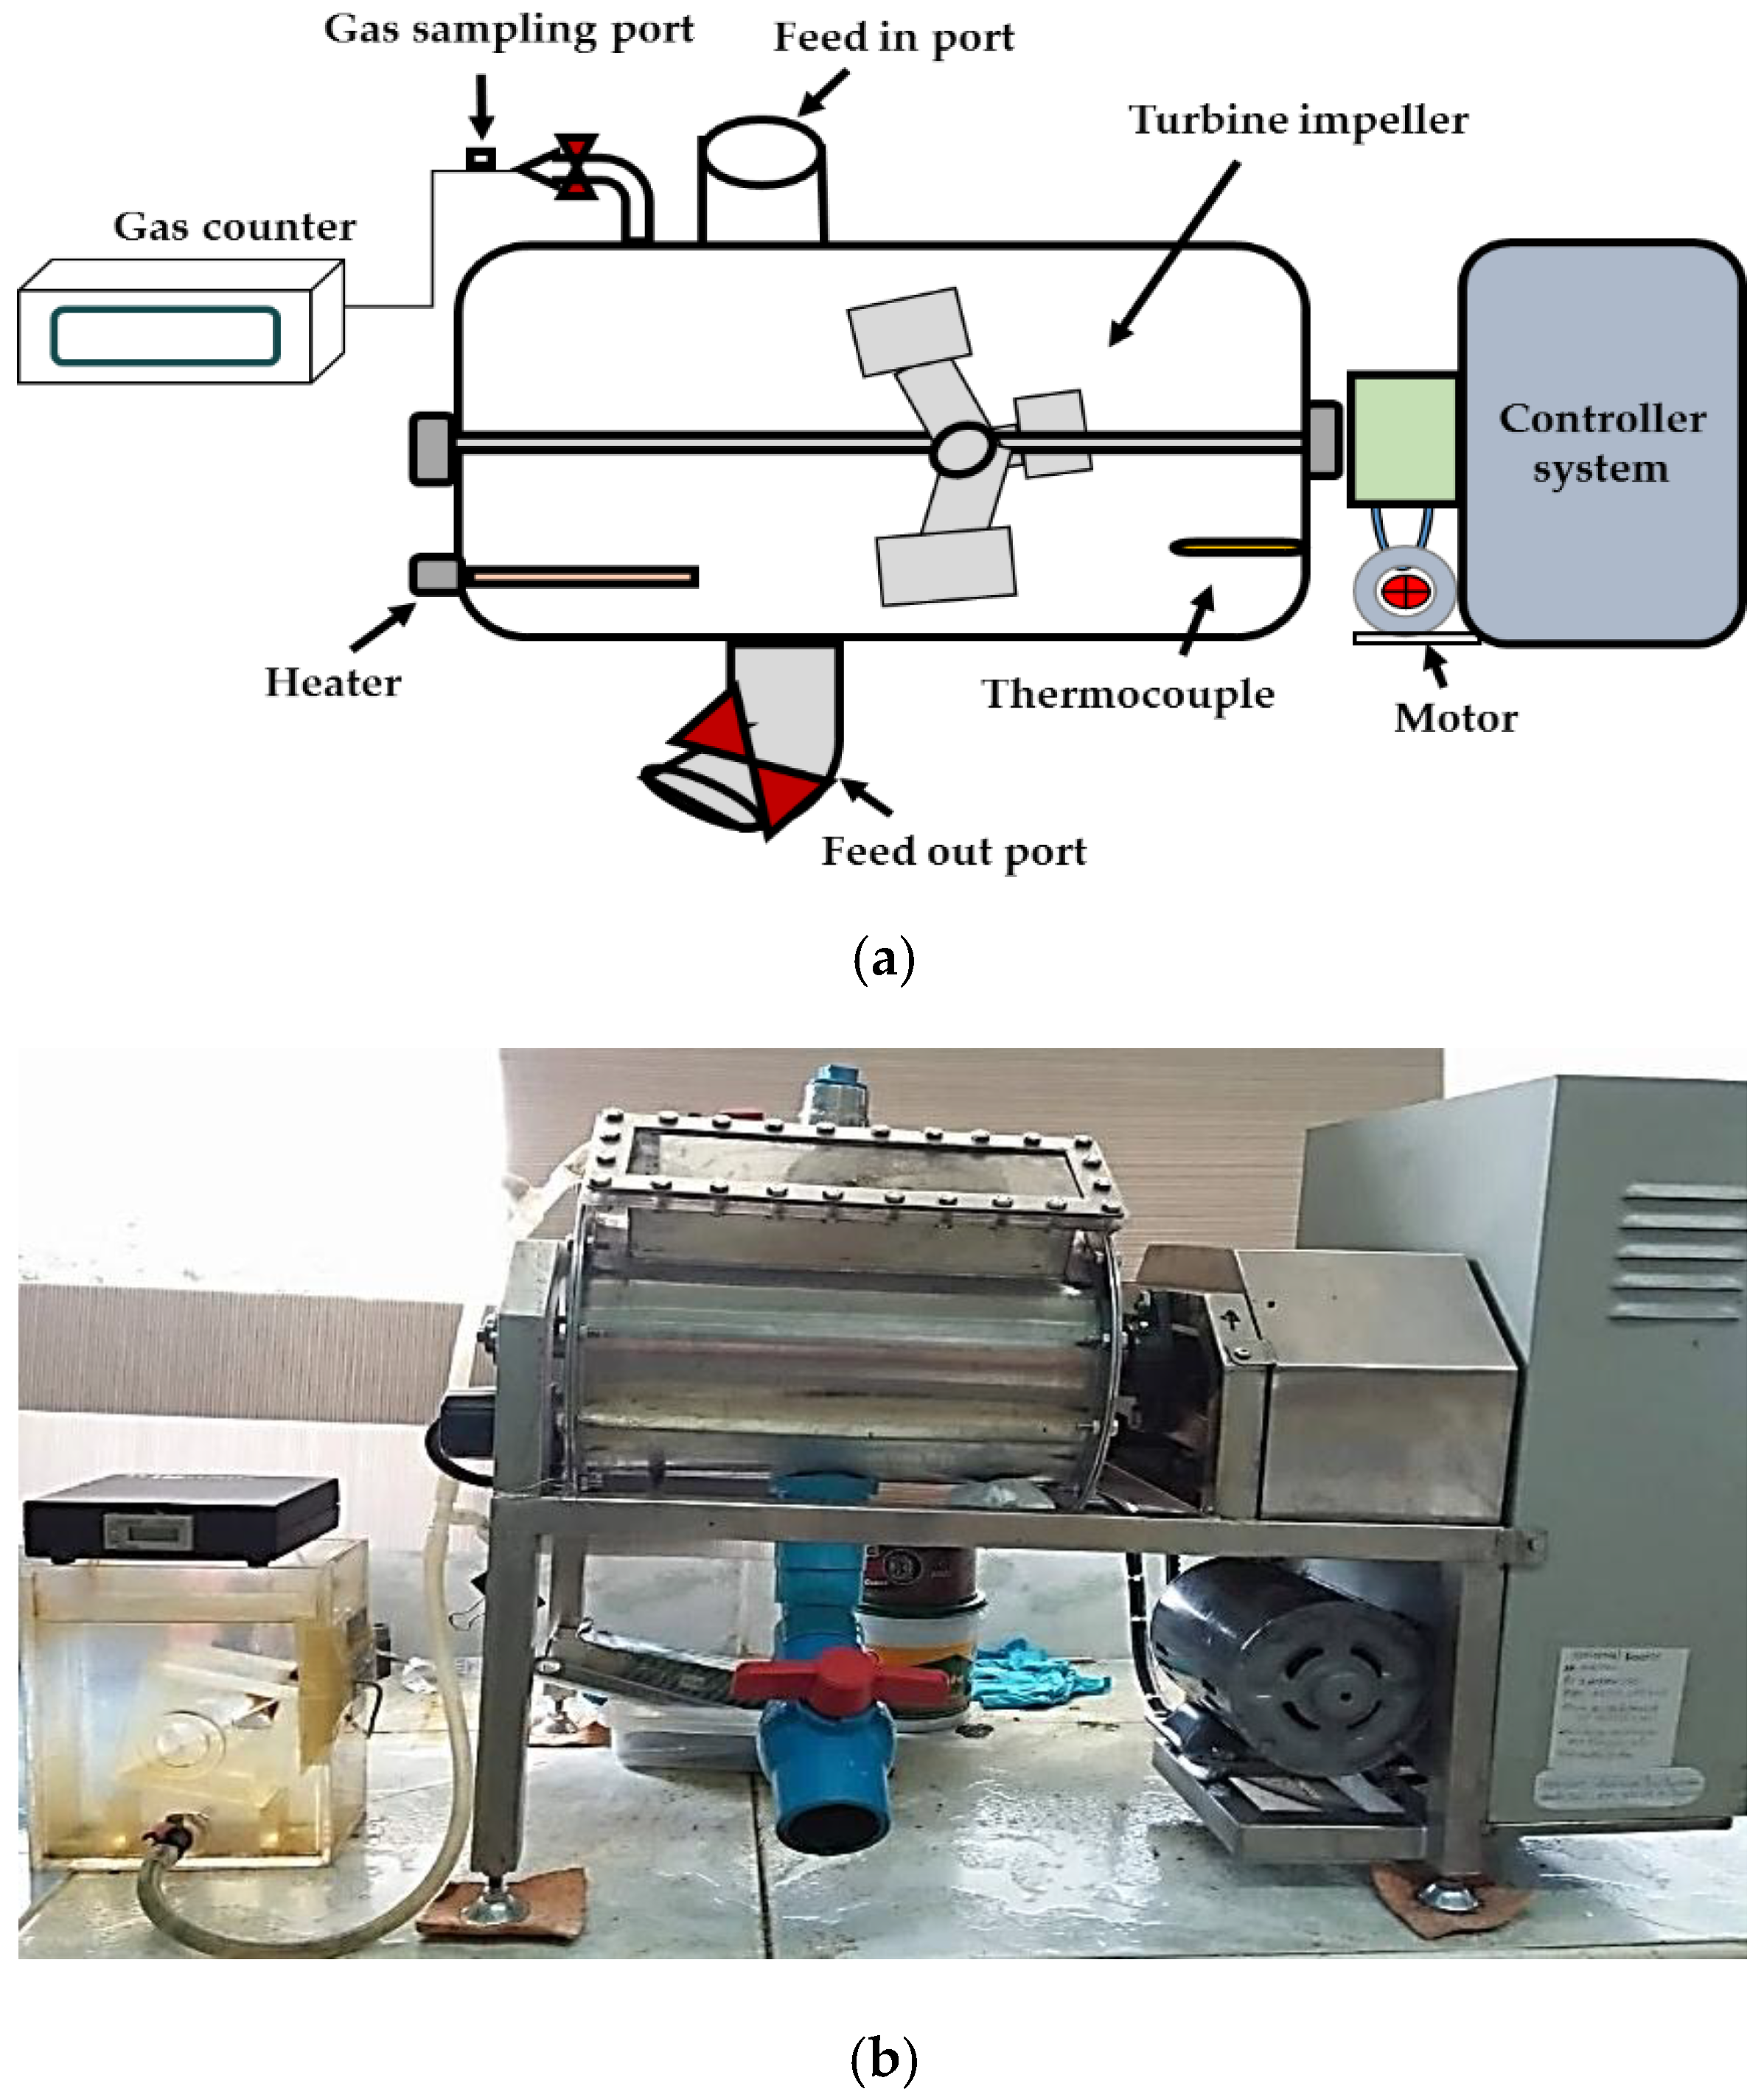
3.4. Repeated Batch Methane Production in the Horizontal Reactor

Repeated batch methane production was carried out in a horizontal reactor with a total volume of 10.25 L and a working volume of 5 L. The horizontal reactor was 20 cm in diameter and 30 cm in length. A schematic and image of the horizontal reactor is shown in Figure 3. The agitation speed of the impeller was set at 82 rpm while the agitation cycle was continuous stirring for 5 min followed by an idle period of 30 min. The optimum ratio of Napier grass or Napier silage to food waste and optimum substrate concentration obtained from the batch experiments were used in the reactor of this experiment. First, the reactor was started by feeding it with 4 L of feedstock at the optimum ratio of feedstock and 20% (v/v) of inoculum. It was then purged with nitrogen gas for 15 min to create anaerobic conditions. Then, the reactor was incubated in a batch mode for 20 days at a temperature of 37 ± 1 °C using a controlled heater. After that, the reactor was switched to a repeated batch mode at an OLR of 0.5 g-VS/L∙d. The effluent was replaced by fresh feedstock every 24 h until methane production reached a steady state condition, i.e., there was less than 10% variation in the methane production rate (MPR) over 10 days. Then the OLR of reactor was stepwise increased to 1, 1.5 and 2 g-VS/L∙d. During repeated batch operation, the volume of biogas was measured using a gas counter. The biogas was analyzed using GC to determine its composition. The effluent was collected to analyze for alkalinity, VFA concentration and the microbial community.

4. Analytical Methods

Total solids (TS), VS, moisture content, ash, carbon, nitrogen and COD were determined following standard methods [37]. Lignin, cellulose and hemicellulose were determined based on the method of Sluiter et al. [38]. pH was measured using a pH meter (pH-500, Clean Instrument Co Ltd., New Taipei City, Taiwan). The total sugar concentration was analyzed using a phenol sulfuric acid method with glucose as a standard [39]. Protein concentration was determined by Lowry’s method [40]. The total lipid concentration was determined following the method of Mishra et al. [41]. The biogas composition was analyzed using a GC (GC-2014, Shimadzu Co Ltd., Japan) equipped with a thermal conductivity detector (TCD) and a 2-m stainless steel column packed with Shin carbon (50/80 mesh). The operating conditions were set according to Laocharoen et al. [42].
The DNA extraction and microbial community analysis were conducted by PCR-DGGE following the methods of Kongjan et al. [43]. Briefly, genomic DNA was used as a template for PCR reactions with the specific primer pair Arch21f and Arc958r [42] to detect the archaea population in the co-digestion process. Most of the bands were excised from the gel and re-amplified. After re-amplification, PCR products were purified and sequenced by Macrogen Inc. (Seoul, Korea). Closest matches for partial 16S rRNA gene sequences were identified by database searches in GenBank using BLAST [44].
The energy production from methane (kJ/g-VS) was determined by multiplying the methane yield (MY) (L-CH4/g-VS) by the relative density of methane (0.72 g-CH4/L-CH4) and its heating value (50.0 kJ/g-CH4) [45].

5. Conclusions

Co-digestion of Napier grass and Napier silage with food waste improved methane production. The optimum conditions for the co-digestion of Napier grass with food waste were a ratio of 1:4 (g-VS/g-VS) at a substrate concentration of 15 g-VS/L. This gave a MY of 403 mL CH4/g VSadded. The optimum ratio of 3:2 (g-VS/g-VS) at a total substrate concentration of 20 g-VS/L were suitable for co-digestion of Napier silage with food waste resulting with a MY of 353 mL-CH4/g-VSadded. Co-digestion of Napier silage with food waste had a shorter lag time than that of co-digestion of Napier grass with food waste. However, a lower maximum methane production rate was observed. Co digestion of Napier grass with food waste in a repeated batch horizontal reactor at an OLR level of 1.5 g-VS/L∙d gave a maximum MY of 0.33 L-CH4/g-VSadded and a maximum energy yield of 11.9 kJ/g-VSadded. At this OLR, the predominant species were Methanoregula sp., Methanotorris sp. and Methanogenium sp.

Author Contributions

A.R. conceived of the ideas, designed the experiments, provided revisions to scientific content of manuscript and proof the manuscript. S.B. performed the experiments, analyzed the data and wrote the manuscript. S.S. co-design the experiment, analyzed the data and wrote the manuscript. All authors read, corrected, and approved the manuscript.

Funding

The author acknowledges scholarship from Center for Alternative Energy Research and Development, Khon Kaen University. The research funds were kindly provided by the Energy Policy and Planning Office, Ministry of Energy (Thailand) and TRF Senior Research Scholar (Grant No. RTA5980004).

Acknowledgments

Authors appreciate the facilities support from Research Group for Development of Microbial Hydrogen Production Process from Biomass-Khon Kaen University, Khon Kaen, Thailand.

Conflicts of Interest

The authors have declared no conflicts of interest.

Nomenclature

ADanaerobic digestion
BAbasic anaerobic
C/N ratiocarbon to nitrogen ratio
CODchemical oxygen demand
DGGEdenaturing gradient gel electrophoresis
Eqequation
FWfood waste
Ggrass
GCgas chromatography
G:FWco-digestion of grass with food waste
HPLChigh performance liquid chromatography
MPmethane production (mL-CH4/L)
MPRmaxmaximum methane production rate (mL-CH4/L∙h)
MYmethane yield (mL-CH4/g-VSadded)
OLRorganic loading rate
PCRpolymerase chain reaction
rpmrevolutions per minute
Ssilage
S:FWco-digestion of silage with food waste
TCD thermal conductivity detector
TStotal solid
VFAsvolatile fatty acids
VSvolatile solid

References

  1. Ashik, U.P.M.; Daud, W.M.A.W.; Hayashi, J. A review on methane transformation to hydrogen and nanocarbon: Relevance of catalyst characteristics and experimental parameters on yield. Renew. Sustain. Energy Rev. 2017, 76, 743–767. [Google Scholar] [CrossRef]
  2. Kamaruddin, M.H.; Osman, S.A.; Fawzi, M.; Mustaffa, N.; Tukiman, M.M. Predicting the performances of a CAMPRO engine retrofitted with liquefied petroleum gas (LPG) system using 1-dimensional software. MATEC Web Conf. 2017, 90. [Google Scholar] [CrossRef]
  3. Suksong, W.; Promnuan, K.; Seengenyoung, J.; Sompong, S. Anaerobic Co-Digestion of Palm Oil Mill Waste Residues with Sewage Sludge for Biogas Production. Energy Procedia 2017, 138, 789–794. [Google Scholar] [CrossRef]
  4. Saelor, S.; Kongjan, P.; O-Thong, S. Biogas Production from Anaerobic Co-digestion of Palm Oil Mill Effluent and Empty Fruit Bunches. Energy Procedia 2017, 138, 717–722. [Google Scholar] [CrossRef]
  5. Glanpracha, N.; Annachhatre, A.P. Anaerobic co-digestion of cyanide containing cassava pulp with pig manure. Bioresour. Technol. 2016, 214, 112–121. [Google Scholar] [CrossRef] [PubMed]
  6. Prapinagsorn, W.; Sittijunda, S.; Reungsang, A. Co-digestion of napier grass and its silage with cow dung for methane production. Energies 2017, 10, 1654. [Google Scholar] [CrossRef]
  7. Amnuaycheewa, P.; Hengaroonprasan, R.; Rattanaporn, K.; Kirdponpattara, S.; Cheenkachorn, K.; Sriariyanun, M. Enhancing enzymatic hydrolysis and biogas production from rice straw by pretreatment with organic acids. Ind. Crops Prod. 2016, 87, 247–254. [Google Scholar] [CrossRef]
  8. Pu, Y.; Zhang, D.; Singh, P.M.; Ragauskas, A.J. The new forestry biofuels sector. Biofuels Bioprod. Biorefining 2008, 2, 58–73. [Google Scholar] [CrossRef]
  9. Department of Alternative Energy Development and Efficiency Napier Grass. Available online: http://weben.dede.go.th/webmax/content/napier-grass (accessed on 27 September 2018).
  10. Ambye-Jensen, M.; Johansen, K.S.; Didion, T.; Kádár, Z.; Schmidt, J.E.; Meyer, A.S. Ensiling as biological pretreatment of grass (Festulolium Hykor): The effect of composition, dry matter, and inocula on cellulose convertibility. Biomass Bioenergy 2013, 58, 303–312. [Google Scholar] [CrossRef] [Green Version]
  11. Li, Y.C.; Nissilä, M.E.; Wu, S.Y.; Lin, C.Y.; Puhakka, J.A. Silage as source of bacteria and electrons for dark fermentative hydrogen production. Int. J. Hydrog. Energy 2012, 37, 15518–15524. [Google Scholar] [CrossRef]
  12. Aryal, N.; Kvist, T.; Ammam, F.; Pant, D.; Ottosen, L.D.M. An overview of microbial biogas enrichment. Bioresour. Technol. 2018, 264, 359–369. [Google Scholar] [CrossRef] [PubMed]
  13. Chandra, R.; Takeuchi, H.; Hasegawa, T. Methane production from lignocellulosic agricultural crop wastes: A review in context to second generation of biofuel production. Renew. Sustain. Energy Rev. 2012, 16, 1462–1476. [Google Scholar] [CrossRef]
  14. Paritosh, K.; Kushwaha, S.K.; Yadav, M.; Pareek, N.; Chawade, A.; Vivekanand, V. Food Waste to Energy: An Overview of Sustainable Approaches for Food Waste Management and Nutrient Recycling. Biomed Res. Int. 2017, 2017. [Google Scholar] [CrossRef] [PubMed]
  15. Kiran, E.U.; Trzcinski, A.P.; Ng, W.J.; Liu, Y. Bioconversion of food waste to energy: A review. Fuel 2014, 134, 389–399. [Google Scholar] [CrossRef]
  16. Zhao, J.; Liu, Y.; Wang, D.; Chen, F.; Li, X.; Zeng, G.; Yang, Q. Potential impact of salinity on methane production from food waste anaerobic digestion. Waste Manag. 2017, 67, 308–314. [Google Scholar] [CrossRef] [PubMed]
  17. Chen, G.; Liu, G.; Yan, B.; Shan, R.; Wang, J.; Li, T.; Xu, W. Experimental study of co-digestion of food waste and tall fescue for bio-gas production. Renew. Energy 2016, 88, 273–279. [Google Scholar] [CrossRef]
  18. Kovács, E.; Wirth, R.; Maróti, G.; Bagi, Z.; Nagy, K.; Minárovits, J.; Rákhely, G.; Kovács, K.L. Augmented biogas production from protein-rich substrates and associated metagenomic changes. Bioresour. Technol. 2015, 178, 254–261. [Google Scholar] [CrossRef] [PubMed]
  19. Angelidaki, I.; Sanders, W. Assessment of the anaerobic biodegradability of macropollutants. Rev. Environ. Sci. Biotechnol. 2004, 3, 117–129. [Google Scholar] [CrossRef] [Green Version]
  20. Deublein, D.; Steinhauser, A. Biogas from Waste and Renewable Resources: An Introduction; Deublein, D., Steinhauser, A., Eds.; Wiley-VCH Verlag GmbH & Co. KGaA: Weinheim, Germany, 2008; ISBN 9783527621705. [Google Scholar]
  21. Callaghan, F.J.; Wase, D.A.J.; Thayanithy, K.; Forster, C.F. Continuous co-digestion of cattle slurry with fruit and vegetable wastes and chicken manure. Biomass Bioenergy 2002, 22, 71–77. [Google Scholar] [CrossRef]
  22. Prapinagsorn, W.; Sittijunda, S.; Reungsang, A. Co-digestion of napier grass and its silage with cow dung for bio-hydrogen and methane production by two-stage anaerobic digestion process. Energies 2018, 11. [Google Scholar] [CrossRef]
  23. González, L.M.L.; Reyes, I.P.; Romero, O.R. Anaerobic co-digestion of sugarcane press mud with vinasse on methane yield. Waste Manag. 2017, 68, 139–145. [Google Scholar] [CrossRef] [PubMed]
  24. Silva, F.M.S.; Mahler, C.F.; Oliveira, L.B.; Bassin, J.P. Hydrogen and methane production in a two-stage anaerobic digestion system by co-digestion of food waste, sewage sludge and glycerol. Waste Manag. 2018, 76, 339–349. [Google Scholar] [CrossRef] [PubMed]
  25. Schievano, A.; Tenca, A.; Lonati, S.; Manzini, E.; Adani, F. Can two-stage instead of one-stage anaerobic digestion really increase energy recovery from biomass? Appl. Energy 2014, 124, 335–342. [Google Scholar] [CrossRef]
  26. Arreola-Vargas, J.; Flores-Larios, A.; González-Álvarez, V.; Corona-González, R.I.; Méndez-Acosta, H.O. Single and two-stage anaerobic digestion for hydrogen and methane production from acid and enzymatic hydrolysates of Agave tequilana bagasse. Int. J. Hydrog. Energy 2016, 41, 897–904. [Google Scholar] [CrossRef]
  27. Nualsri, C.; Kongjan, P.; Reungsang, A. Direct integration of CSTR-UASB reactors for two-stage hydrogen and methane production from sugarcane syrup. Int. J. Hydrog. Energy 2016, 41, 17884–17895. [Google Scholar] [CrossRef]
  28. Yong, Z.; Dong, Y.; Zhang, X.; Tan, T. Anaerobic co-digestion of food waste and straw for biogas production. Renew. Energy 2015, 78, 527–530. [Google Scholar] [CrossRef]
  29. Dareioti, M.A.; Kornaros, M. Anaerobic mesophilic co-digestion of ensiled sorghum, cheese whey and liquid cow manure in a two-stage CSTR system: Effect of hydraulic retention time. Bioresour. Technol. 2015, 175, 553–562. [Google Scholar] [CrossRef] [PubMed]
  30. Mamimin, C.; Singkhala, A.; Kongjan, P.; Suraraksa, B.; Prasertsan, P.; Imai, T.; O-Thong, S. Two-stage thermophilic fermentation and mesophilic methanogen process for biohythane production from palm oil mill effluent. Int. J. Hydrog. Energy 2015, 40, 6319–6328. [Google Scholar] [CrossRef]
  31. Monlau, F.; Kaparaju, P.; Trably, E.; Steyer, J.P.; Carrere, H. Alkaline pretreatment to enhance one-stage CH4 and two-stage H2/CH4 production from sunflower stalks: Mass, energy and economical balances. Chem. Eng. J. 2015, 260, 377–385. [Google Scholar] [CrossRef]
  32. Maspolim, Y.; Zhou, Y.; Guo, C.; Xiao, K.; Ng, W.J. Comparison of single-stage and two-phase anaerobic sludge digestion systems—Performance and microbial community dynamics. Chemosphere 2015, 140, 54–62. [Google Scholar] [CrossRef] [PubMed]
  33. dos Reis, C.M.; Carosia, M.F.; Sakamoto, I.K.; Amâncio Varesche, M.B.; Silva, E.L. Evaluation of hydrogen and methane production from sugarcane vinasse in an anaerobic fluidized bed reactor. Int. J. Hydrog. Energy 2015, 40, 8498–8509. [Google Scholar] [CrossRef]
  34. Venkiteshwaran, K.; Bocher, B.; Maki, J.; Zitomer, D. Relating Anaerobic Digestion Microbial Community and Process Function. Microbiol. Insights 2016, 8, 37. [Google Scholar] [CrossRef] [PubMed]
  35. Demirel, B.; Scherer, P. The roles of acetotrophic and hydrogenotrophic methanogens during anaerobic conversion of biomass to methane: A review. Rev. Environ. Sci. Biotechnol. 2008, 7, 173–190. [Google Scholar] [CrossRef]
  36. Owen, W.F.; Stuckey, D.C.; Healy, J.B.; Young, L.Y.; McCarty, P.L. Bioassay for monitoring biochemical methane potential and anaerobic toxicity. Water Res. 1979, 13, 485–492. [Google Scholar] [CrossRef]
  37. American Public Health Association Standard Methods for the Examination of Water and Wastewater, 19th ed.; American Public Health Association: Washington, WA, USA, 1995; ISBN 0875532292 (Supplement) 0875532233.
  38. Sluiter, A.; Hames, B.; Ruiz, R.; Scarlata, C.; Sluiter, J.; Templeton, D.; Crocker, D. Determination of Structural Carbohydrates and Lignin in Biomass: Laboratory Analytical Procedure (LAP). Available online: http://www.academia.edu/download/34289991/Determination-Structural-Carbohydrates-L....pdf (accessed on 20 August 2018).
  39. Dubois, M.; Gilles, K.A.; Hamilton, J.K.; Rerbers, P.A.; Smith, F. Colorimetric method for determination of sugars and related substances. Anal. Chem. 1956, 28, 350–356. [Google Scholar] [CrossRef]
  40. Lowry, O.H.; Rosebrough, N.J.; Farr, A.L.; Randall, R.J. Protein measurement with the folin phenol reagent. J. Biol. Chem. 1951, 193, 265–275. [Google Scholar] [CrossRef] [PubMed]
  41. Mishra, S.K.; Suh, W.I.; Farooq, W.; Moon, M.; Shrivastav, A.; Park, M.S.; Yang, J.W. Rapid quantification of microalgal lipids in aqueous medium by a simple colorimetric method. Bioresour. Technol. 2014, 155, 330–333. [Google Scholar] [CrossRef] [PubMed]
  42. Laocharoen, S.; Reungsang, A.; Plangklang, P. Bioaugmentation of Lactobacillus delbrueckii ssp. bulgaricus TISTR 895 to enhance bio-hydrogen production of Rhodobacter sphaeroides KKU-PS5. Biotechnol. Biofuels 2015, 8, 1–16. [Google Scholar] [CrossRef] [PubMed]
  43. Kongjan, P.; O-Thong, S.; Kotay, M.; Min, B.; Angelidaki, I. Biohydrogen production from wheat straw hydrolysate by dark fermentation using extreme thermophilic mixed culture. Biotechnol. Bioeng. 2010, 105, 899–908. [Google Scholar] [CrossRef] [PubMed]
  44. Altschul, S.F.; Madden, T.L.; Schäffer, A.A.; Zhang, J.; Zhang, Z.; Miller, W.; Lipman, D.J. Gapped BLAST and PSI-BLAST: A new generation of protein database search programs. Nucleic. Acids Res. 1997, 25, 3389–3402. [Google Scholar] [CrossRef] [PubMed]
  45. Rutz, D.; Janssen, R. Biofuel Technology Handbook; WIP Renewable Energies: München, Germany, 2007; ISBN 978-1-57444-703-3. [Google Scholar]
Figure 1. Effect of organic loading rate (OLR) on the performance of a horizontal reactor. (a) methane production rate (MPR), (b) methane content and (c) pH.
Energies 11 03200 g001
Figure 2. PCR-DGGE profiles of archaea at the end of methane production from co-digestion of Napier grass with food waste at an optimum ratio of 1:4 (g-VS/g-VS) and optimum substrate concentration of 15 g-VS/L. Lane M is a DGGE marker, Lane S1 represents the archaea community at the OLR level of 1.5 g-VS/L∙d.
Energies 11 03200 g002
Figure 3. Schematic (a) and image (b) horizontal reactor.
Energies 11 03200 g003
Table 1. C/N ratios, MPR, MP, MY, and final pH from a co-digestion of Napier grass and Napier silage with food waste at various ratios.
Ratio (g-VS/g-VS/)C/N ratioMPRmax (mL-CH4/L∙h)MP (mL-CH4/L) MY* (mL-CH4/g-VS)Final pH
G:FW
4.75:0.2551.923.0 ± 0.11229.6 ± 13.8246e ± 2.87.47 ± 0.01
4.5:0.546.833.2 ± 0.51291.8 ± 52.4258e ± 10.57.47 ± 0.01
4.25:0.7542.582.7 ± 0.21478.5 ± 116.2296d ± 23.27.46 ± 0.01
4:138.992.8 ± 0.21596.2 ± 129.7319cd ± 25.97.45 ± 0.01
3:228.875.9 ± 0.71666.1 ± 127.7333bc ± 25.57.44 ± 0.02
2.5:2.525.403.5 ± 0.71664.8 ± 15.6333bc ± 15.67.45 ± 0.01
2:322.607.3 ± 0.21802.6 ± 57.2361b ± 11.47.45 ± 0.01
1:418.358.3 ± 0.32053.7 ± 8.8411a ± 1.87.46 ± 0.01
S:FW
4.75:0.2542.912.3 ± 0.61000.6 ± 2.5200f ± 0.57.41 ± 0.01
4.5:0.539.502.3 ± 0.11294.7 ± 3.1259e ± 0.67.44 ± 0.01
4.25:0.7536.561.7 ± 0.11570.4 ± 11.8314d ± 2.47.43 ± 0.01
4:134.002.5 ± 0.41610.6 ± 89.5322cd ± 17.97.43 ± 0.02
3:226.413.2 ± 0.11808.2 ± 17.5362b ± 3.57.41 ± 0.03
2.5:2.523.683.1 ± 0.31701.7 ± 3.6340c ± 0.77.43 ± 0.01
2:321.424.1 ± 0.21660.3 ± 93.8332cd ± 18.87.43 ± 0.01
1:417.895.9 ± 0.51856.0 ± 66.0371b ± 13.27.45 ± 0.02
G58.151.9 ± 0.21200.2 ± 84.0240e ± 16.87.46 ± 0.01
S46.932.1 ± 0.5964.9 ± 9.6193f ± 5.97.44 ± 0.03
FW15.267.3 ± 0.32052.0 ± 8.3410a ± 5.77.49 ± 0.02
G: Grass; S: Silage; FW: Food waste; MPRmax: maximum methane production rate; MP: methane production; MY: methane yield; VS: volatile solids; C/N ratio: carbon to nitrogen ratio. *Comparison between treatments are significantly different (Duncan, p < 0.05) if marked with different letters.
Table 2. Substrate concentration, MPR, MY, lag time, and final pH for co-digestion of Napier grass with food waste and Napier silage with food waste at optimal ratios of 1:4 and 3:2 (g VS/g-VS).
Substrate Concentrations (g-VS/L)Lag Time (d)MPRmax (mL-CH4/L∙d)MY* (mL-CH4/g-VS)Final pH
Napier grass to food waste ratio of 1:4 (g-VS/g-VS)
100.1 ± 0.0244.3 ± 12.5416a ± 19.17.42 ± 0.01
151.6 ± 0.6305.6 ± 11.3403ba ± 11.57.47 ± 0.04
207.3 ± 1.0430.5 ± 7.4400ba ± 15.07.53 ± 0.01
2514.3 ± 0.2411.0 ± 22.1398ba ± 2.07.54 ± 0.08
3020.3 ± 0.2445.8 ± 42.0379c ± 7.17.65 ± 0.04
3526.5 ± 1.2419.7 ± 3.7377c ± 1.47.46 ± 0.02
4032.5 ± 1.7396.1 ± 19.3385cb ± 4.07.46 ± 0.03
4545.9 ± 5.1350.7 ± 32.6352d ± 5.07.44 ± 0.02
5056.6 ± 4.9454.2 ± 23.9374c ± 6.97.43 ± 0.03
Napier silage to food waste ratio of 3:2 (g-VS/g-VS)
100203.7 ± 18.6314d ± 4.07.30 ± 0.02
150227.1 ± 23.9324dc ± 12.97.28 ± 0.01
200.4 ± 0.3256.7 ± 14.7353a ± 5.87.30 ± 0.02
253.3 ± 0.4313.8 ± 15.1349a ± 2.57.33 ± 0.02
306.9 ± 0.8339.9 ± 22.6353a ± 8.27.38 ± 0.01
3512.1 ± 0.4346.8 ± 41.5339ba ± 8.27.21 ± 0.02
4015.5 ± 1.1380.8 ± 48.1348a ± 6.17.27 ± 0.02
4520.1 ± 2.7378.5 ± 34.1342ba ± 2.87.27 ± 0.03
5025.4 ± 0.7406.8 ± 9.1331cb ± 7.17.27 ± 0.03
MPRmax: maximum methane production rate; MY: methane yield; VS: volatile solids. *Comparison between treatments are significantly different (Duncan, p < 0.05) if marked with different letters.
Table 3. Summarization of methane production rate, MY, methane content, alkalinity. VFAs/alkalinity ratio and the final pH at steady-state for each OLR.
ParametersOLR (g-VS/L·d)
0.511.52
MPR (L-CH4/L·d)0.15 ± 0.010.32 ± 0.010.50 ± 0.020.40 ± 0.04
MY (L-CH4/g-VS)0.29 ± 0.020.32 ± 0.010.33± 0.010.20 ± 0.02
Methane content (%)57.8 ± 3.3057.6 ± 1.8058.1 ± 0.0354.6 ± 1.84
Alkalinity (mg-CaCO3/L)2537 ± 212020 ± 482063 ± 381777 ± 28
VFAs/alkalinity ratio0.045 ± 0.0060.058 ± 0.0020.063 ± 0.0010.353 ± 0.026
Final pH7.17 ± 0.046.88 ± 0.036.93 ± 0.046.66 ± 0.01
OLR: organic loading rate; MPR: methane production rate; MY: methane yield; VFAS: volatile fatty acids; VS: volatile solids.
Table 4. Comparison of energy yields from one-stage methane production by an anaerobic mixed culture with published reports.
SubstrateInoculumTemperature (°C)Energy yield (kJ/g-VS)Reference
Batch mode:
Food waste, sewage sludge and raw glycerolAnaerobic sludge3512.3[24]
Pre-treated solid residue of grass with cow dungAnaerobic sludge30 ± 213.3[22]
Pre-treated solid residue of Silage with cow dungAnaerobic sludge30 ± 213.4
Grass with cow dungAnaerobic sludge30 ± 26.5[6]
Silage with cow dungAnaerobic sludge30 ± 27.5
Agave tequilana bagasse hydrolysateAnaerobic granular sludge375.84a[26]
Food waste with strawGranular sludge7.0414.1[28]
Maize silage with swine manureThermophilic anaerobic sludge5515.2[25]
Napier grass with food wasteAnaerobic granular sludge30 ± 314.5The current study
Napier silage with food wasteAnaerobic granular sludge30 ± 312.7The current study
Continuous, semi-continuous and repeated batch mode:
Sugarcane press mud with vinasseAnaerobic sludge3513.1[23]
Sugarcane syrupAnaerobic sludge30 ± 29.76a[27]
Ensiled sorghum, cheese whey and liquid cow manureAnaerobic sludge378.0b[29]
Palm oil mill effluentAnaerobic sludge28–348.2a[30]
Sun flower stalkGranular sludge356.9c[31]
Napier grass with food waste at the optimum OLRAnaerobic granular sludge30 ± 311.9The current study
a: Expressed in mL or kJ per g-COD. b: Calculated from the original data and expressed in mL/g-COD and kJ/g-COD units. c: Converted from the original data and expressed in kg/g-VS unit. TS: Total solid; VS: Volatile solid; COD: Chemical oxygen demand; kJ: kilojoules.
Table 5. Characteristics of Napier grass, Napier silage and food waste.
SubstrateNapier GrassNapier SilageFood Waste
Total solids (g/kg)311.02 ± 1.4405.40 ± 1.7194.74 ± 0.6
Volatile solids (g/kg)288.75 ± 1.2379.74 ± 1.8179.43 ± 0.7
Total COD (g/kg)nana171.77 ± 2.9
Total sugars (g/kg)30.9 ± 3.40na77.06 ± 6.6
Proteins (g/kg)27 ± 2.97na64.74 ± 0.8
Lipids (g/kg)14.8 ± 1.63na28.71 ± 1.81
Lignin (%)31.74 ± 1.035.18 ± 0.7na
Moisture (%)68.89 ± 0.159.46 ± 0.280.53 ± 0.1
Ash (g/kg)22.27 ± 0.225.66 ± 0.315.32 ± 0.1
Organic carbon (%)45.3643.1838.16
Total kjeldahl nitrogen (%)0.780.922.50
na: not analyzed.
Table 6. Composition of basic anaerobic medium stock.
StockComposition and Quantity (g/L)Used (mL/L)
ANH4Cl, 100; NaCl, 10; MgCl2.6H2O, 10; CaCl2.2H2O, 510
BK2HPO4.3H2O, 2002
CNaHCO3, 5250
DFeCl2.4H2O, 2; H3BO3, 0.05; ZnCl2, 0.05; CuCl2.2H2O, 0.038; MnCl2.4H2O, 0.05; (NH4)6Mo7O24.4H2O, 0.05; AlCl3.6H2O, 0.05; CoCl2.6H2O, 0.05; NiCl2.6H2O, 0.092; EDTA, 0.5; concentrated HCl, 1 mL; Na2SeO3.5H2O, 0.11
EYeast extract, 1001

