Article

Electric Vehicle Charging Strategy for Isolated Systems with High Penetration of Renewable Generation

by
Jean-Michel Clairand
1,*,
Javier Rodríguez-García
2 and
Carlos Álvarez-Bel
2
1
Facultad de Ingeniería y Ciencias Agropecuarias, Universidad de las Américas-Ecuador, Quito 170122, Ecuador
2
Institute for Energy Engineering, Universitat Politècnica de València, 46022 Valencia, Spain
*
Author to whom correspondence should be addressed.
Energies 2018, 11(11), 3188; https://doi.org/10.3390/en11113188
Submission received: 23 October 2018 / Revised: 9 November 2018 / Accepted: 12 November 2018 / Published: 16 November 2018
(This article belongs to the Section A: Sustainable Energy)

Abstract

:
Inhabited islands depend primarily on fossil fuels for electricity generation and they also present frequently a vehicle fleet, which result in a significant environmental problem. To address this, several governments are investing in the integration of Renewable Energy Sources (RESs) and Electric Vehicles (EVs), but the combined integration of them creates challenges to the operation of these isolated grid systems. Thus, the aim of this paper is to propose an Electric Vehicle charging strategy considering high penetration of RES. The methodology proposes taxing CO 2 emissions based on high pricing when the electricity is mostly generated by fossil fuels, and low pricing when there is a RES power excess. The Smart charging methodology for EV optimizes the total costs. Nine scenarios with different installed capacity of solar and wind power generation are evaluated and compared to cases of uncoordinated charging. The methodology was simulated in the Galapagos Islands, which is an archipelago of Ecuador, and recognized by the United Nations Educational, Scientific and Cultural Organization (UNESCO) as both a World Heritage site and a biosphere reserve. Simulations results demonstrate that the EV aggregator could reduce costs: 7.9% for a case of 5 MW installed capacity (wind and PV each), and 7% for a case of 10 MW installed (wind and PV each). Moreover, the use of excess of RES power for EV charging will considerably reduce CO 2 emissions.

Graphical Abstract

1. Introduction

Climate change has pushed governments to create new energy policies. In particular, the energy activities that emit the highest amounts of greenhouse gases, such as CO 2 , are electricity generation and transportation [1].
Hence, Renewable Energy Sources (RESs) emerge as new solutions to address this issue. They are naturally replenished sources that do not pollute locally and have a very low carbon footprint. The primary energy of these sources is transformed into secondary energy, such as electricity. However, some of the more critical problems of the use of RES in this area are the generation uncertainties and their high installation cost [2,3].
Various measures have been taken in several countries [4] to achieve the target of CO 2 decrease. One of these measures consists of taxing CO 2 emissions to increase renewable energy production.
On the other side, Electric vehicles (EVs) seem to be a proper solution to reduce emissions in transportation. This generates zero emissions while driving, and electricity production causes its only footprint. However, a massive introduction to the grid could create negative impacts [5,6,7,8], and create new challenges for the power systems [9,10]. In particular, a massive introduction of EVs in distribution networks that have a high penetration of renewable electricity generation is even more complicated because of some issues, such as impacts on the performance of parking lot operators [11], power systems security [12], and planning of RES Sources [13]. Thus, in recent years, some researchers have studied solutions for mitigating the adverse effects of EVs and also for creating new opportunities for the grid.
The objectives of the works of EV integration in RES systems include: charging parking lots management [14,15,16], unit commitment models for EV integration [12], microgrids’ energy management [17,18], EV charging facilities as energy micro hubs [19], and the allocation of RES and EV charging stations [20]. Fewer works have considered the operation of isolated grid systems considering EV loads. In particular, isolated microgrids ought to keep the system voltage and frequency within satisfactory ranges, but they can suffer significant variations from nominal operating conditions because of the variations in the power output of solar and wind sources [21,22].
In some places in the world, it is essential to change network conditions because of environmental situations, and the introduction of green sources are compulsory, such as the Galapagos Islands. They are an archipelago of volcanic islands. Therefore, Galapagos is a protected area: the previous Ecuadorean government has implemented some policies to protect them, especially because of the growth of population and tourism. Moreover, electricity generation is mainly based on diesel fuel, which results in significant environmental problems, and the transportation of fuels to the islands creates another concern due to the risk of possible spills. Therefore, the government of Ecuador decided to create the Program “Cero Combustibles Fósiles”, which consists of reducing gradually the fuel consumption in the islands [23]. In that way, the government of Ecuador installed RES generation in the islands, such as solar and wind, as part of the policies for changing the matrix of electricity [24]. The government also has the initiative of introducing EVs to replace internal combustion because of the environmental conditions mentioned above [25], but this replacement does not include only traditional cars to electric ones, but also motorcycles and buses. As far as the present authors know, no work has been that studies the impact of different types of EVs in the grid operation. Hence, a methodology has to be implemented to avoid grid problems from this new load.
The aim of this paper is to propose an EV charging strategy in isolated distribution systems, such as Off-grid Microgrids, based on the optimization of the charging process and subject to the grid constraints. Furthermore, the methodology gives rise to increasing the use of available RES and resulting in a future increase of renewable energy production and reduction of CO 2 emissions. A case study of the Galapagos Islands is presented. This paper is an extension of an previous conference [26], which has been significantly polished. The original contributions of the proposed methodology are highlighted as follows:
  • A strategy for EV charging in isolated electricity networks is proposed, considering a high presence of both wind and solar generation.
  • The EV aggregator optimizes the EV charging profile, through charging power rate modulation, while respecting actual grid conditions, using renewable power excess that is not consumed by other loads, and mitigating the RES power variations.
  • The methodology has to consider the participation of a different kind of EVs such as electric cars, motorcycles, and buses. Thus, the different energy requirements will be taken into account.
This paper is structured as follows: in Section 2, the related works are presented. The methodology is described in Section 3. The case study is discussed in Section 4. The results are presented in Section 5. Finally, Section 6 highlights the conclusions.

2. Related Work

Related work of this paper is presented in two subsections. Firstly, an overview of the principal works considering the EV integration in RES systems is presented. Then, some of the works that have considered the impact of different types of EVs.

2.1. EV Integration in RES Systems

In [27], the coordinated integration of EVs and RES in power systems was studied based on a stochastic security-constrained unit-commitment model. The objective was to minimize the expected grid operation cost. The authors of [28] proposed an operational planning of EVs in a microgrid in order to balance wind power and load fluctuations. The authors of [29] proposed an algorithm that exploits the flexibility of EVs’ load to absorb the unforeseen fluctuations from the wind. However, these works considered only wind generators. In [30], the operational planning of EVs and photovoltaic (PV) units was presented. However, a similar shortcoming is present because only PV units are studied. To address this, in [31], a smart charging algorithm is proposed that improves the power system stability and robustness, using PV and wind. The authors of [32] proposed a probabilistic approach for managing unavoidable uncertainties in loads, plug-in EVs and renewable generation, including PV and Wind, based on the sizing of storage devices.
These works and others have studied the EV integration in RES systems that are connected to a main grid. Just a few works have addressed the operation of EVs in isolated (or off-grid) systems. For example, in [33], the optimal scheduling of distributed energy resources and smart management of controllable loads, including EVs, in isolated microgrids is studied. The authors of [34] presented the load frequency control of an isolated microgrid, based on a time-varying controller, and considering EVs. In [35], a tool for the optimal dispatch of isolated microgrids is proposed, including charging of EVs.
Although these works propose efficient solutions, they have mainly studied theoretical rather than real case studies, using limited data.

2.2. Impact of Multiple EV Classes on the Grid

For the electric buses, in [36], the short-term forecasting for electric bus charging stations was developed. The authors of [37] investigated the implementation of electric buses in a full transit network, based on a real-time simulation. The authors of [38] proposed a power consumption model of electric buses, based on fuzzy evaluation and wavelet neural network, and an optimization of the bus company cost. In [39], a real-time optimal energy management system was performed, based on a particle swarm optimization and dynamic programming. In [40], a transit system was studied to work according to the electric grid capacity, achieving the required frequency and voltage. The authors of [41] studied the optimal charging schedule of an electric bus charging station, minimizing the charging costs. For the electric motorcycles, fewer significant works in the literature exist. In [42], an energy consumption model of electric motorcycle was developed, using artificial neuro-fuzzy inference systems; however, the impact on the grid was not developed. The authors of [43] presented an implementation of a prototype of electric motorcycle to run in Cuenca, Ecuador; however, the travel simulations of the city are very simple, and no impact in the grid was done.
As far as the present authors know, no work has studied the impact of both electric cars, electric buses and electric motorcycles in power systems with RESs.

3. Methodology

Several policies have been created for protected areas to reduce CO 2 emissions related to the increase of both installed capacity of RES and EV penetration. However, System Operator (SO) may suffer from operating problems if there is not both a proper management system of RES and an EV smart charging plan.
To address this issue, a smart charging strategy is presented. Thus, when EV users plug their EV into the grid, they will allow EV aggregator modulating the power demanded during the EV charging process, through intelligent chargers and smart meters, which are assumed to be installed. Furthermore, it is assumed that a robust communication exists between the EVs and the EV aggregator, such as the one presented in [44], and secure data communication, as per [45]. The EV aggregator will manage all the EVs of the islands and it will communicate with the SO to develop a smart charging process that will respect grid constraints and reduce users’ costs. The EV aggregator will be only in charge of managing the EVs charge while the SO will be in charge of the operation of renewable generation. It could be also considered that the EV aggregator will be in interaction with residential customers’ aggregators, which will manage energy hubs as buildings [46]. The EV aggregator will have to define a daily EV electricity cost curve when a new day starts, based on the forecasts. Then, it will have to optimize the charging of the EV fleet, based on this electricity curve and considering the needs of the EV users. The EV electricity cost, the problem formulation, and the EV charging methodology are detailed next. Observe that various known conditions are assumed to be known by the EV aggregator as input data. They could be predicted by estimation techniques such as presented in some papers discussed previously, but designing these forecasts are not the main focus of the paper.

3.1. EV Electricity Cost

EVs represent a new load, which has to be taken into account in the daily operation. If the RES penetration is higher than 30%, where inertia issues occur [21], it could be advantageous to charge the EV when there is a high RES power available, which could result in excess of generation if the residential demand (excluding EVs) is too low. Moreover, if there is not enough RES power available and the residential load is high, it is crucial not to charge the EVs. Some work have already considered consuming this excess of RES energy such as [47]. For this purpose, it might be beneficial to encourage this load consumption through the charging of the EV batteries by the EV aggregator, based on electricity pricing mechanisms. Hence, an electricity cost for EV users is proposed. The formulation considers proposing lower costs when RES power is in excess of maximizing its utilization and proposing higher costs when RES power is not available for minimizing electricity consumption from diesel. Note that this charging mechanism is only proposed for EV charging purposes, while the residential load (excluding EVs) has to respect its own tariff.
According to the characteristics of the pricing conditions of the case study, the daily specific electricity prices have to be between a minimum and maximum values and considering a mean value [48]. For this purpose, a daily EV specific electricity cost for charging EVs is proposed to be between the minimum and maximum values, y m i n and y m a x , which have to be fixed by the EV aggregator. It is also assumed that the EV specific electricity cost has a daily mean y m equal to the mean proposed by the Ecuadorean regulator for the residential load. These conditions could be changed depending on the local regulations.
For the calculation of the EV electricity cost, the difference of the residential load and RES generation P k d i f , including PV power P k P V and Wind Power P k W , is considered, for each time interval k in a day:
P k d i f = P k L P k P V P k W k τ .
In a day, the negative values of P k d i f represent a RES power excess. If the value is 0, it means that RES power satisfies precisely the load. A positive value implies that there is not enough RES power to satisfy load demand and it is necessary to generate the remaining power by diesel generation. Therefore, it is considered that the charging mechanism for EV is built considering the trend of P d i f during a day. As per [49], pricing approaches have to be considered for the consumers, so the lower costs will be when there is an RES power excess (negative values) and the most expensive ones when the electricity has to be generated by diesel (positive values). For the case study, electricity prices have to be positive. In order to consider the trend of P d i f , but with only positive values, a system of equations has to be solved.
A system of three equations with three unknown variables {a,b,c} has to be solved by the system in order that the specific electricity cost curve follows the trend of P d i f curve:
a × m i n ( P k d i f ) 2 + b × m i n ( P k d i f ) + c = y m i n k τ ,
a × m a x ( P k d i f ) 2 + b × m a x ( P k d i f ) + c = y m a x k τ ,
a × k = 1 D ( P k d i f ) 2 + b × k = 1 D P k d i f + k = 1 D c = k = 1 D y m k τ .
This system has to be solved by the EV aggregator with the forecast values before the beginning of the new day. It is assumed that the forecast predictions are very reliable.
After obtaining the variables, the specific cost π k is obtained:
π k = a × ( P k d i f ) 2 + b × P k d i f + c k τ .
Let’s suppose that P k C , P k M and P k B are the vectors of decision variables for the charging power of cars, motorcycles, and buses, which are defined based on the number of owners they have:
P k C = P k , 1 C P k , 2 C . . . P k , N C C ,
P k M = P k , 1 M P k , 2 M . . . P k , N M M ,
P k B = P k , 1 B P k , 2 B . . . P k , N B B .
The total load demanded from EV charging at interval k is defined as the sum of the demand of the cars, motorcycles, and buses:
P k E V = P k C + P k M + P k B .
The total energy needed for charging all the EVs in a day (kWh) is defined:
E E V , t o t = k = 1 D P k E V × Δ T k τ .
EV Daily costs correspond to the sum of all the costs of the charge process of all the EV types, for all the time intervals k in a day:
C = k = 1 D π k × ( P k C + P k M + P k B ) = k = 1 D π k × P k E V .
The specific cost is obtained by changing the scale of the curve of P d i f and adapting to a new interval, as represented in Figure 1.

3.2. Problem Formulation

The model maximizes the RES energy excess consumed by EVs and minimizes the electricity production from diesel, based on the charging of EVs:
m i n P d i f = m i n ( k = 1 D P k L P k P V P k W ) .
Moreover, the problem is equivalent of minimizing the daily cost of the EV charging:
m i n C = m i n ( k = 1 D π k × ( P k C + P k M + P k B ) ) .
The problem is subject to the following constraints:
  • Supply-demand balance in the microgrid
    The EV load has not to overpass the maximum grid capacity. It means that the sum of all the demand, including EV and residential loads, and the losses might be lower than the power balance of all the generation production, including solar, wind and diesel, for each time interval k, expressed as:
    P k P V + P k W + P k D P k L + P k E V + P k l o s s k T .
  • Maximum EV Charging Power Rate
    The EV aggregator has to modulate the EV charging power rate between zero and the upper bound, which corresponds to the maximum charging power that the charger from each kind of EV e allows:
    0 < P k , i , e < P i , e E V ¯ k τ .
  • Daily EV user energy required
    At the beginning of the charging, each EV user i specifies the energy needed the EV aggregator has to respect:
    E i , e r e q = k = 1 k = D P i , e , k × Δ T k δ i .
In this methodology, minimum and maximum power constraints of generators are not taken into account because only a small part of this power is considered to be demanded by EV charging so that the other electric loads will demand the rest of power. Transmission network constraints were not considered either because the grid is mainly composed of only a generation and distribution system.
The problem can be solved by a linear optimization for each EV.

3.3. EV Charging Mechanism

  • At the end of Day 1, the system operator processes the data of RES Generation and Load Demand from all the day.
  • After processing the data, and including the EV charging that was not completed the day before, the system operator has to create the specific electricity cost curve.
  • Real-time information of the new cars plugged is sent to the EV aggregator each time interval, which could be performed by smart meters installed in the customer facility. If new cars are connected to the grid, the smart meter linked to them will have to send the information about the charging, such as the energy required by the EV user.
    Then, the cost optimization has to be performed, which will be carried out through the charging power rate modulation between zero and the maximum EV charging power rate P i , e E V ¯ . The time in which the EV charging ends will also be known. The optimization process will determine the new charging rate according to both the network constraints and the committed charging previously.
  • EV aggregator will inform each time interval of the EV load to the SO to produce the required diesel generation.
The flowchart of the methodology is illustrated in Figure 2.

4. Case Study: Santa Cruz, the Galapagos Islands

To evaluate the proposed methodology, a case study was done of the Galapagos Islands in Ecuador, which form an archipelago and whose islands are isolated from the main grid. The island of Santa Cruz was selected for this study.
In this section, the distribution model that is going to be used in the methodology validation will be described. For the first scenario, the actual conditions mentioned in [50] are presented. The distribution system in Santa Cruz is formed by wind turbines, PV installations, and fuel generators, which are described next.

4.1. Generation Capacity

The Ecuadorean government has recognized the Galapagos Islands as a national concern for conservation and environmental management, establishing the Galapagos Zero Fossil Fuels program, which consists of various measures and activities to mitigate degradation of habitat and ecological impact [24,25]. Hence, the Ecuadorean government invested and installed wind turbines and photovoltaic (PV) plants in Galapagos [51]. It is also expected that more RES generation is going to be installed in the islands, but the exact capacity is uncertain. The characteristics are detailed next.

4.1.1. Wind

There are three wind generators located in the Baltra Island, which are connected to the electric grid of Santa Cruz Island through a 34.5 kV power line of 50 km long. The installed power of this wind farm is 2.25 MW.

4.1.2. PV

There is a Photovoltaic plant located near Puerto Ayora, which is the main city on the Santa Cruz Island. It has a total amount of 6006 PV panels, which is connected to Puerto Ayora substation through a 13.8 kV power line, and has an installed power of 15 MWpeak (MWp).

4.1.3. Diesel

There are seven Caterpillar diesel generators with a total installed capacity of 5.26 MW [52]. Four Hyundai diesel generators have been installed recently with an installed capacity of 1.7 MW each [52]. The total installed capacity is 12.06 MW.

4.2. Types of EVs

In the previous work presented in [53], some analyses of EV penetration were performed where some assumptions of future trends in EVs were made. The novelty of the study lies in the study of both regular electric cars, electric motorcycles and buses. In this paper, the term electric car will refer to regular small size EV.

4.2.1. Electric Motorcycle

It is an EV with two or three wheels powered by electricity, through rechargeable batteries, such as traditional EV. Typically, the battery is fabricated by lithium ion. Electric motorcycles can be charged in ordinary wall outlets, and some models allow charging by electric vehicle supply equipment. The electric motorcycles usually have lower energy capacity battery. Additionally, electric motorcycles have comparable performances than gasoline-powered motorcycles, but they are less pollutant and less noisy.

4.2.2. Electric Bus

It is an EV with four wheels powered by electricity. There are two principal kinds of electric buses: non-autonomous and onboard stored electricity.
An external source of electricity powers non-autonomous electric buses, which could be by two overhead electric wires, from a power line embedded in the ground, or by electric cable buried under the pavement.
On-board stored electric buses are powered by a battery pack, with significant energy capacity. The driving performances of electric buses are demonstrated to be similar than fuel buses. Furthermore, since the battery has significant capacity, it could be beneficial to adopt vehicle-to-grid technology. For this methodology, electric buses with battery packs are considered.

4.3. EV Input Variables

4.3.1. Values for the Daily EV Specific Costs

The minimum and maximum values, y m i n and y m a x , are selected based on the values given by the Ecuadorean regulator Arconel, which are 0.05 $/kWh and 0.1 $/kWh, respectively. It is also proposed to have a daily mean y m equal to the mean proposed by Arconel that is 0.078 $/kWh.

4.3.2. Number of Vehicles from Each Type and Model Selected

In [25], there are 1326 total vehicles in Santa Cruz. Only the types of vehicles that could be replaced by the ones mentioned above are considered in this study. The other types are smaller groups or more difficult to replace by a current equivalent electric model. The quantity and main features of each type are summarized in Table 1.
The motorcycles in Galapagos require a speed up to 70 km/h to drive in the roads of the island safely. Thus, the model S-4100 (S4100, Zelectricvehicle, Morgantown, WV, USA) is considered as the most suitable equivalent model to replace the existing ones. Its relevant features are presented in [54]. According to this, the maximum charging power rate is 1 kW. The charging time reaches up to four hours.
Among buses, the BYD K9 model is the equivalent electric design that is considered in this study. This model has a maximum charging power rate of 60 kW [55]. In Galapagos, road conditions are not exceptional, so taxi owners commonly buy spacious cars. Therefore, the Kia Soul EV is considered as the equivalent electric car in this case. This model has a maximum charging power rate of 6.6 kW [56].

4.3.3. Starting Time of Charge

On the Santa Cruz Island, motorcycle users are usually people that work in government or tourism offices during the traditional Ecuadorian workday, which finishes between 4:00 p.m. and 8:00 p.m. Considering the trips home, it is estimated that motorcycle users will plug in their EVs between 4:30 p.m. and 8:30 p.m.
According to the local bus timetable of routes on the island, bus drivers work only at the beginning and end of labor hours. For this reason, it is considered that half of the buses start their charging between 8:00 a.m. and 10:00 a.m., and the other half between 4:00 p.m. and 8:00 p.m. [25].
On the Santa Cruz Island, most of the car users are taxis drivers [25]. In this case, they usually work all day transporting workers and tourists. The starting time of charging is considered later than the others because they have to supply the needs of people that won’t take the buses. For this reason, electric cars are considered to start their charging between 10:00 p.m. and 2:00 a.m.. It is also considered a starting charging time between 5:00 a.m. and 12:00 p.m. because of the transportation of tourists to the airport.

4.3.4. Energy Required

The distances that are covered by the different vehicles were considered to have an estimation of the energy required for each type of EV per day. Regarding the electric motorcycles, which are equipped with a battery of 2.86 kWh, and, taking into account the existing road conditions, it is assumed that they have an autonomy of 50 km. Furthermore, it is considered that motorcycle users drive 30 km per day; as a result, the energy required per user is 1.7 kWh per day.
In the case of electric buses, the battery capacity of BYD K9 bus (K9, BYD, Shenzhen, China) is 324 kWh that corresponds with an autonomy of 250 km. The buses currently cover around 200 km per day and the value of their autonomy could be a bit lower because their routes usually go through the main roads on the island. Therefore, the energy required of each electric bus is estimated at 280 kWh per day.
In the case of the electric cars, the Kia Soul EV (Soul EV, Kia, Seoul, South Korea) has an autonomy of 180 km. The taxi drivers cover an average distance of 150 km per day and, taking into account the road conditions, the energy required by each EV is around 24 kWh per day. This value is close to 27 kWh, but, as mentioned above, it is considered that there are two periods of charging every day.

4.3.5. Plug Duration

In this study, it is assumed that the Plug Duration for each EV i, T τ , i , is twice as long as the duration of charging at the maximum charging power rate T P , m a x , i , which is expressed in the following equation. This assumption was made based on the behaviors of EV users [53]:
T τ , i = 2 × T P , m a x , i = 2 × E i , e r e q P i , e E V ¯ .

4.4. Residential Load

A daily load curve of a typical day for residential customers in the Santa Cruz island was selected from the data provided by Elecgalápagos (local distributor). The residential load is presented in Figure 3. The present RES generation of that day is also represented. In addition, it has been assumed 10% of electricity grid losses taking into account the information provided by Elecgalapagos.

4.5. Implementation

In a day, it is considered D = 72 that is the number of time intervals per day, so the time intervals last 20 min:
τ = { 1 , 2 , D } .
The plug duration γ i is defined as the time between the plug of the EV i to the charging station and the time of departure. In this case:
γ i τ .
The charging time δ i is defined as the duration in which their EVs are plugged to perform the smart charging. If a user disconnects its EV before the charging time is finished, there will be no guarantee that at least some energy has been transferred to the batteries. If everything goes well, users will be able to unplug their EVs after the charging time when the interface shows the associated message. In this sense:
δ i γ i

5. Results and Discussion

5.1. Scenarios Definition

As previously mentioned, the newly installed capacity of the RES generation in Santa Cruz is uncertain. Thus, to assess the influence of the methodology for different capacities of both wind and PV, nine scenarios are studied, which combine different installed capacities of PV (5, 7.5 and 10 MW) and Wind (5, 7.5 and 10 MW). All the scenarios are resumed in Table 2, depending on the assumed installed capacity of wind and solar. The present conditions are not taken into account because of the actual low RES penetration.
Firstly , to evaluate the daily operation, the simulations of the smart charging methodology are compared to a case of uncoordinated charging, which consists of EV users starting their charging at a maximum charging power rate immediately after they are plugged to the grid. For this evaluation, two scenarios are selected with very different installed capacity, which correspond to the first scenario (5 MW of PV and 5MW of Wind), and the ninth scenario (10 MW of PV and 10 MW of Wind). The analysis of daily operations is performed.
Then, all the costs of the nine scenarios are studied to show the importance of proper management of EV charging when there is a high presence of renewable electricity generation in the grid. These scenarios are studied for several months from the data available from [13,26].

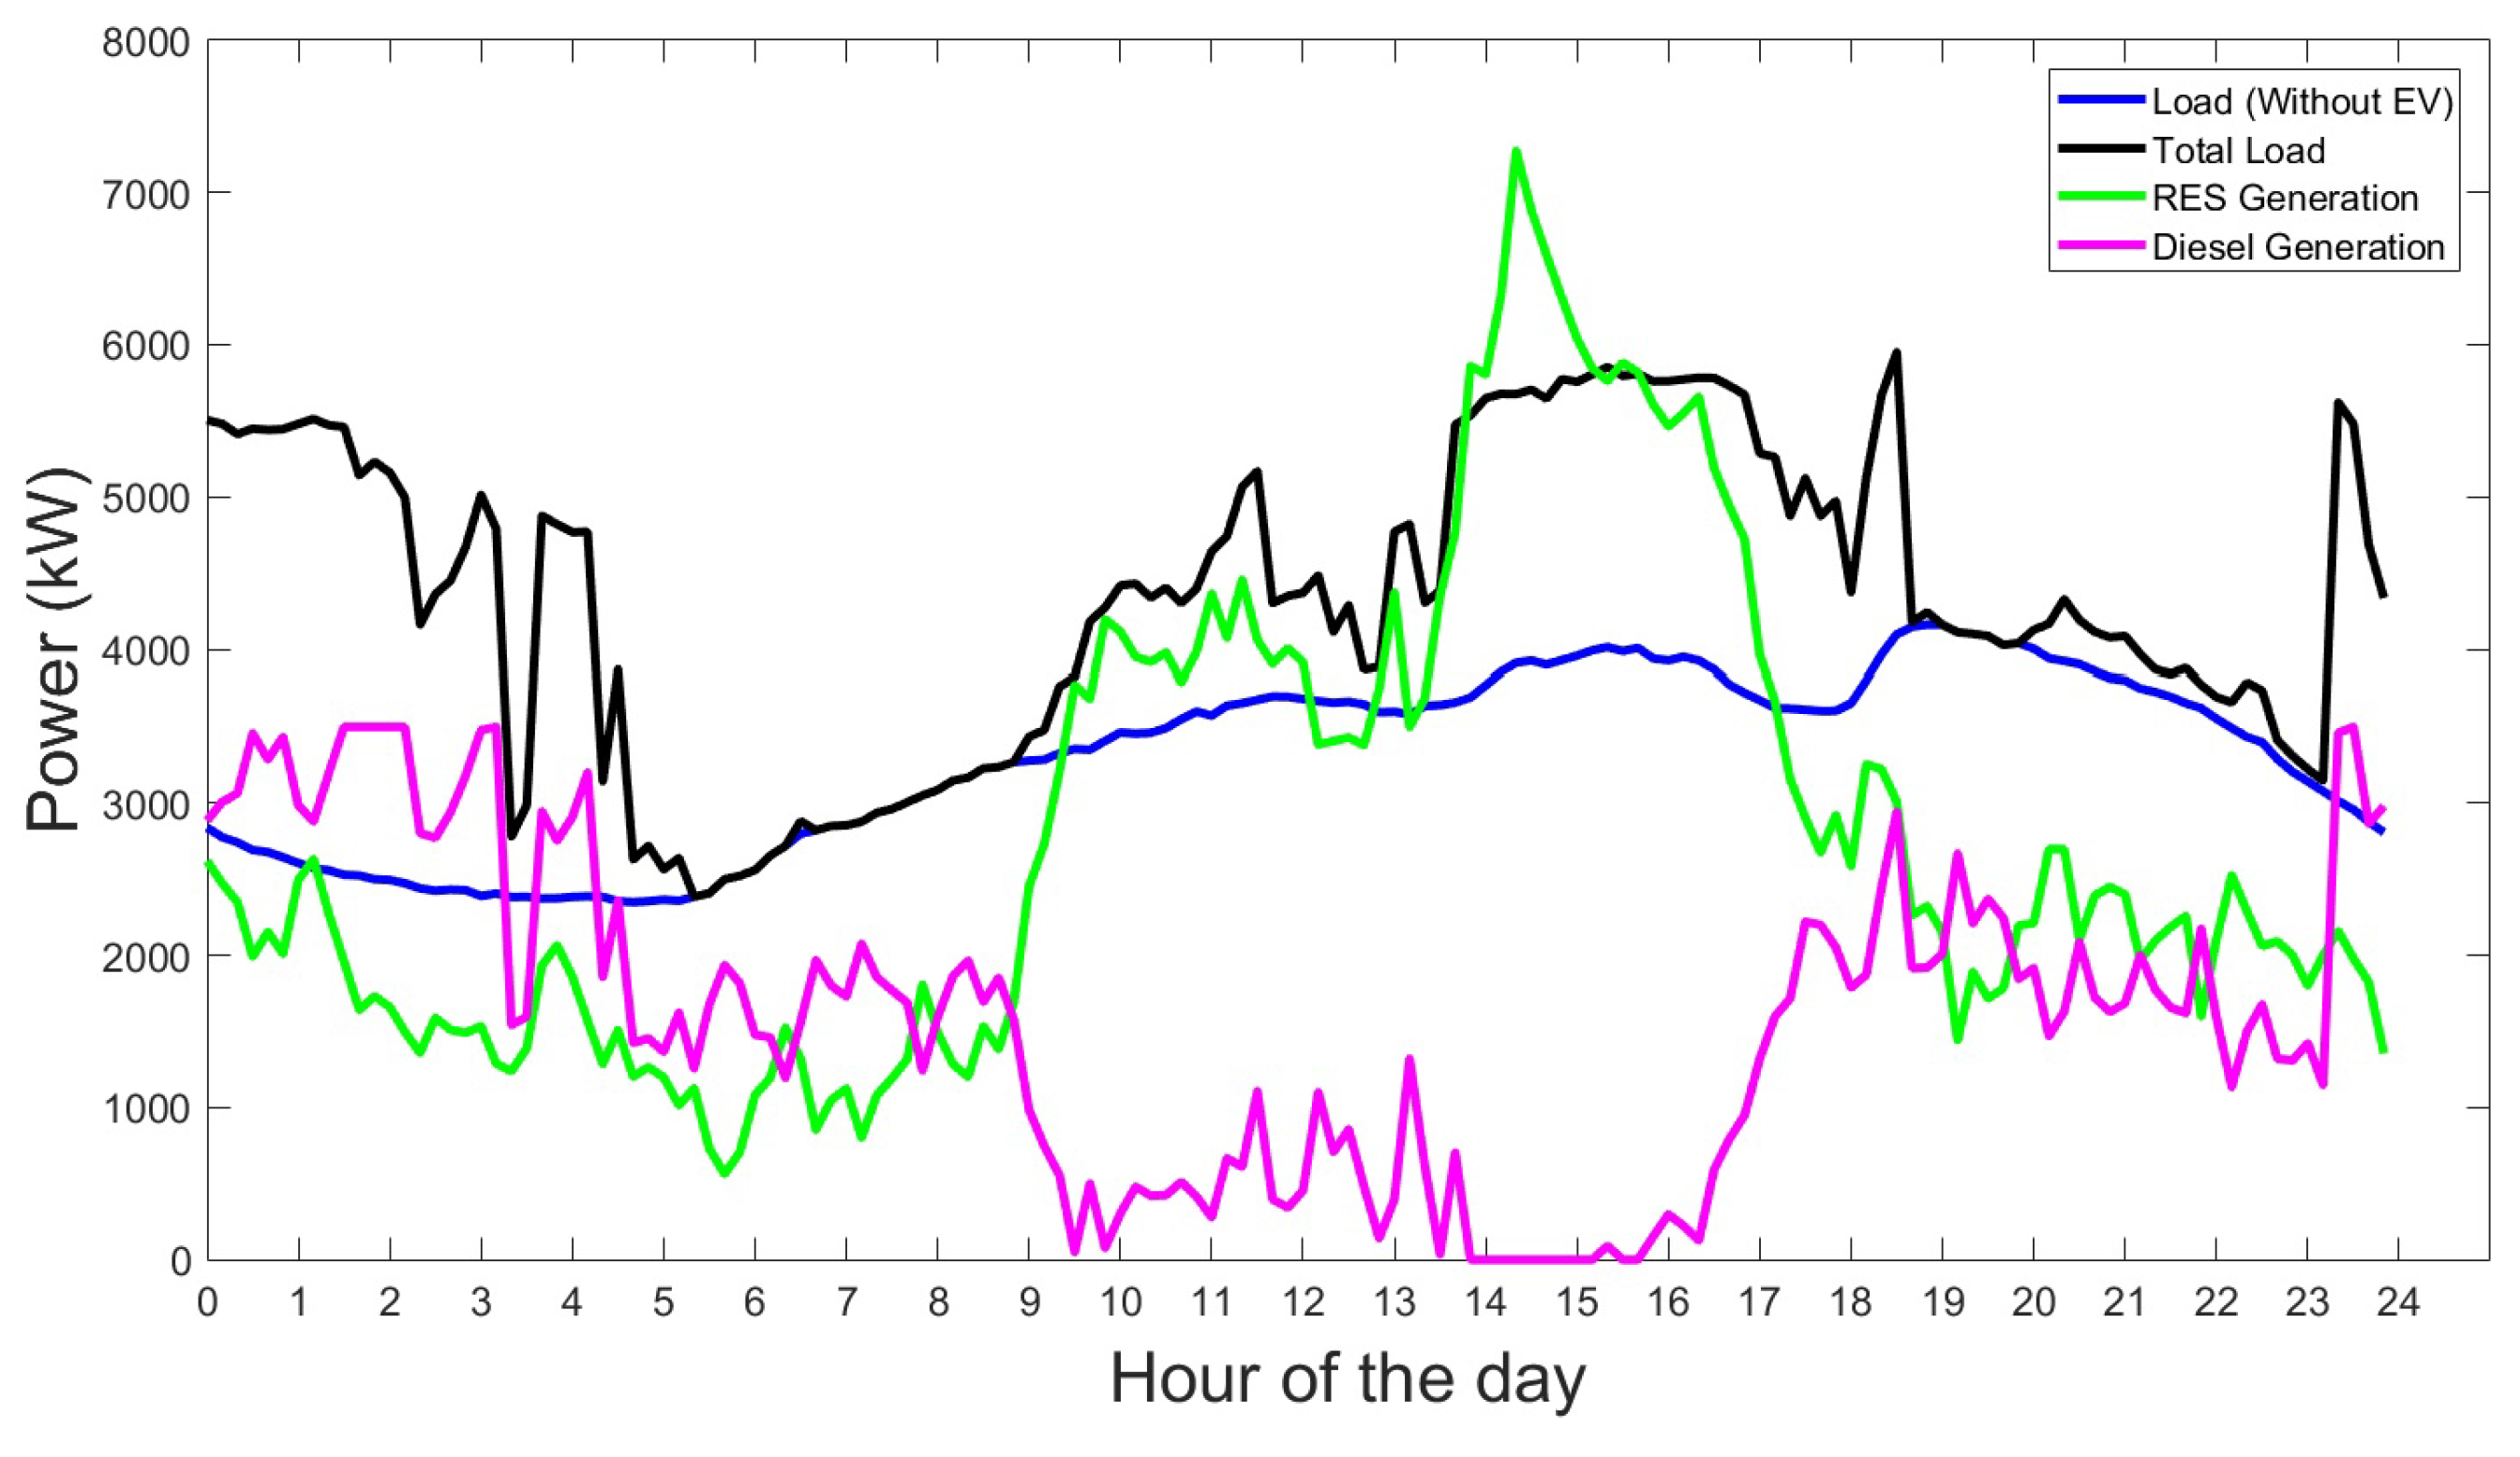
5.2. Daily Operation: Scenario 1

Scenario 1 corresponds to an installed capacity of 5 MW of Wind and 5 MW of PV. From the simulations of the proposed methodology, the charging patterns of the smart charging for all the EVS are represented in Figure 4, and the load patterns of the different types of EVs are compared.
The energy required for charging electric motorcycles is very small compared with the energy for the other kind of EVs. Buses are the EVs that consume the most energy, especially during the night, when the RES power is not significantly available.
Figure 5 represents the different loads and the generation output. The EV Load is able to absorb a large part of the RES energy, particularly during the day. Moreover, from 10:00 a.m. until 4:00 p.m., diesel generation is minimal.
In Figure 6, the patterns for both Smart and Uncoordinated Charging are shown. Significant peaks and valley periods occur in the Smart Charging pattern corresponding to the absence or surplus of energy from RES.
The excess power from RES is expressed:
P k e x c , R E S = P k W + P k P V P k D , if P k W + P k P V > P k D , 0 , otherwise .
The daily excess energy from RES is expressed:
E k e x c , R E S = k = 1 D P k e x c , R E S × Δ T .
The excess power from RES consumed by EV is expressed:
P k e x c , E V = P k E V , if 0 < P k E V < P k e x c , R E S , P k e x c , R E S , if 0 < P k e x c , R E S < P E V , 0 , otherwise .
The excess energy from RES consumed by EVs is expressed:
E k e x c , E V = k = 1 D P k e x c , E V × Δ T .
Figure 7 presents the electricity that has to be produced by Diesel generators and the RES energy excess consumed by EVs.
It was observed that, with the smart charging, the EVs consume more RES energy and less diesel energy. Note also that the RES energy excess is not very significant.
Table 3 summarizes the energy consumed, total costs and specific costs both for uncoordinated and smart charging for each type of EV. Smart Charging results in lower costs than Uncoordinated Charging for all types of EVs. The most critical difference is for electric cars for which the Specific Cost has a difference of 9.9% between uncoordinated and smart charging. The difference for all the EV charging between uncoordinated and smart is 7.9%.
The ratio of RES energy excess consumed and EV η e x c , E V is expressed as:
η e x c , E V = E e x c , E V E E V , t o t .
This relation demonstrates the RES excess energy that is consumed by EVs overall energy that was supplied for EV charging.
Table 4 shows the total amount of Electricity generated by Diesel and the RES energy excess that is consumed in charging EVs.
As can be seen, the Smart Charging of EVs involves 4.6% less electricity produced by Diesel and 23.9% more consumption of RES energy excess compared to uncoordinated charging. Furthermore, the ratio of RES energy excess used for charging EV is 31.8% more significant for Smart Charging than for Uncoordinated Charging. Note that the values of the ratios for the two kinds of charging are relatively significant.

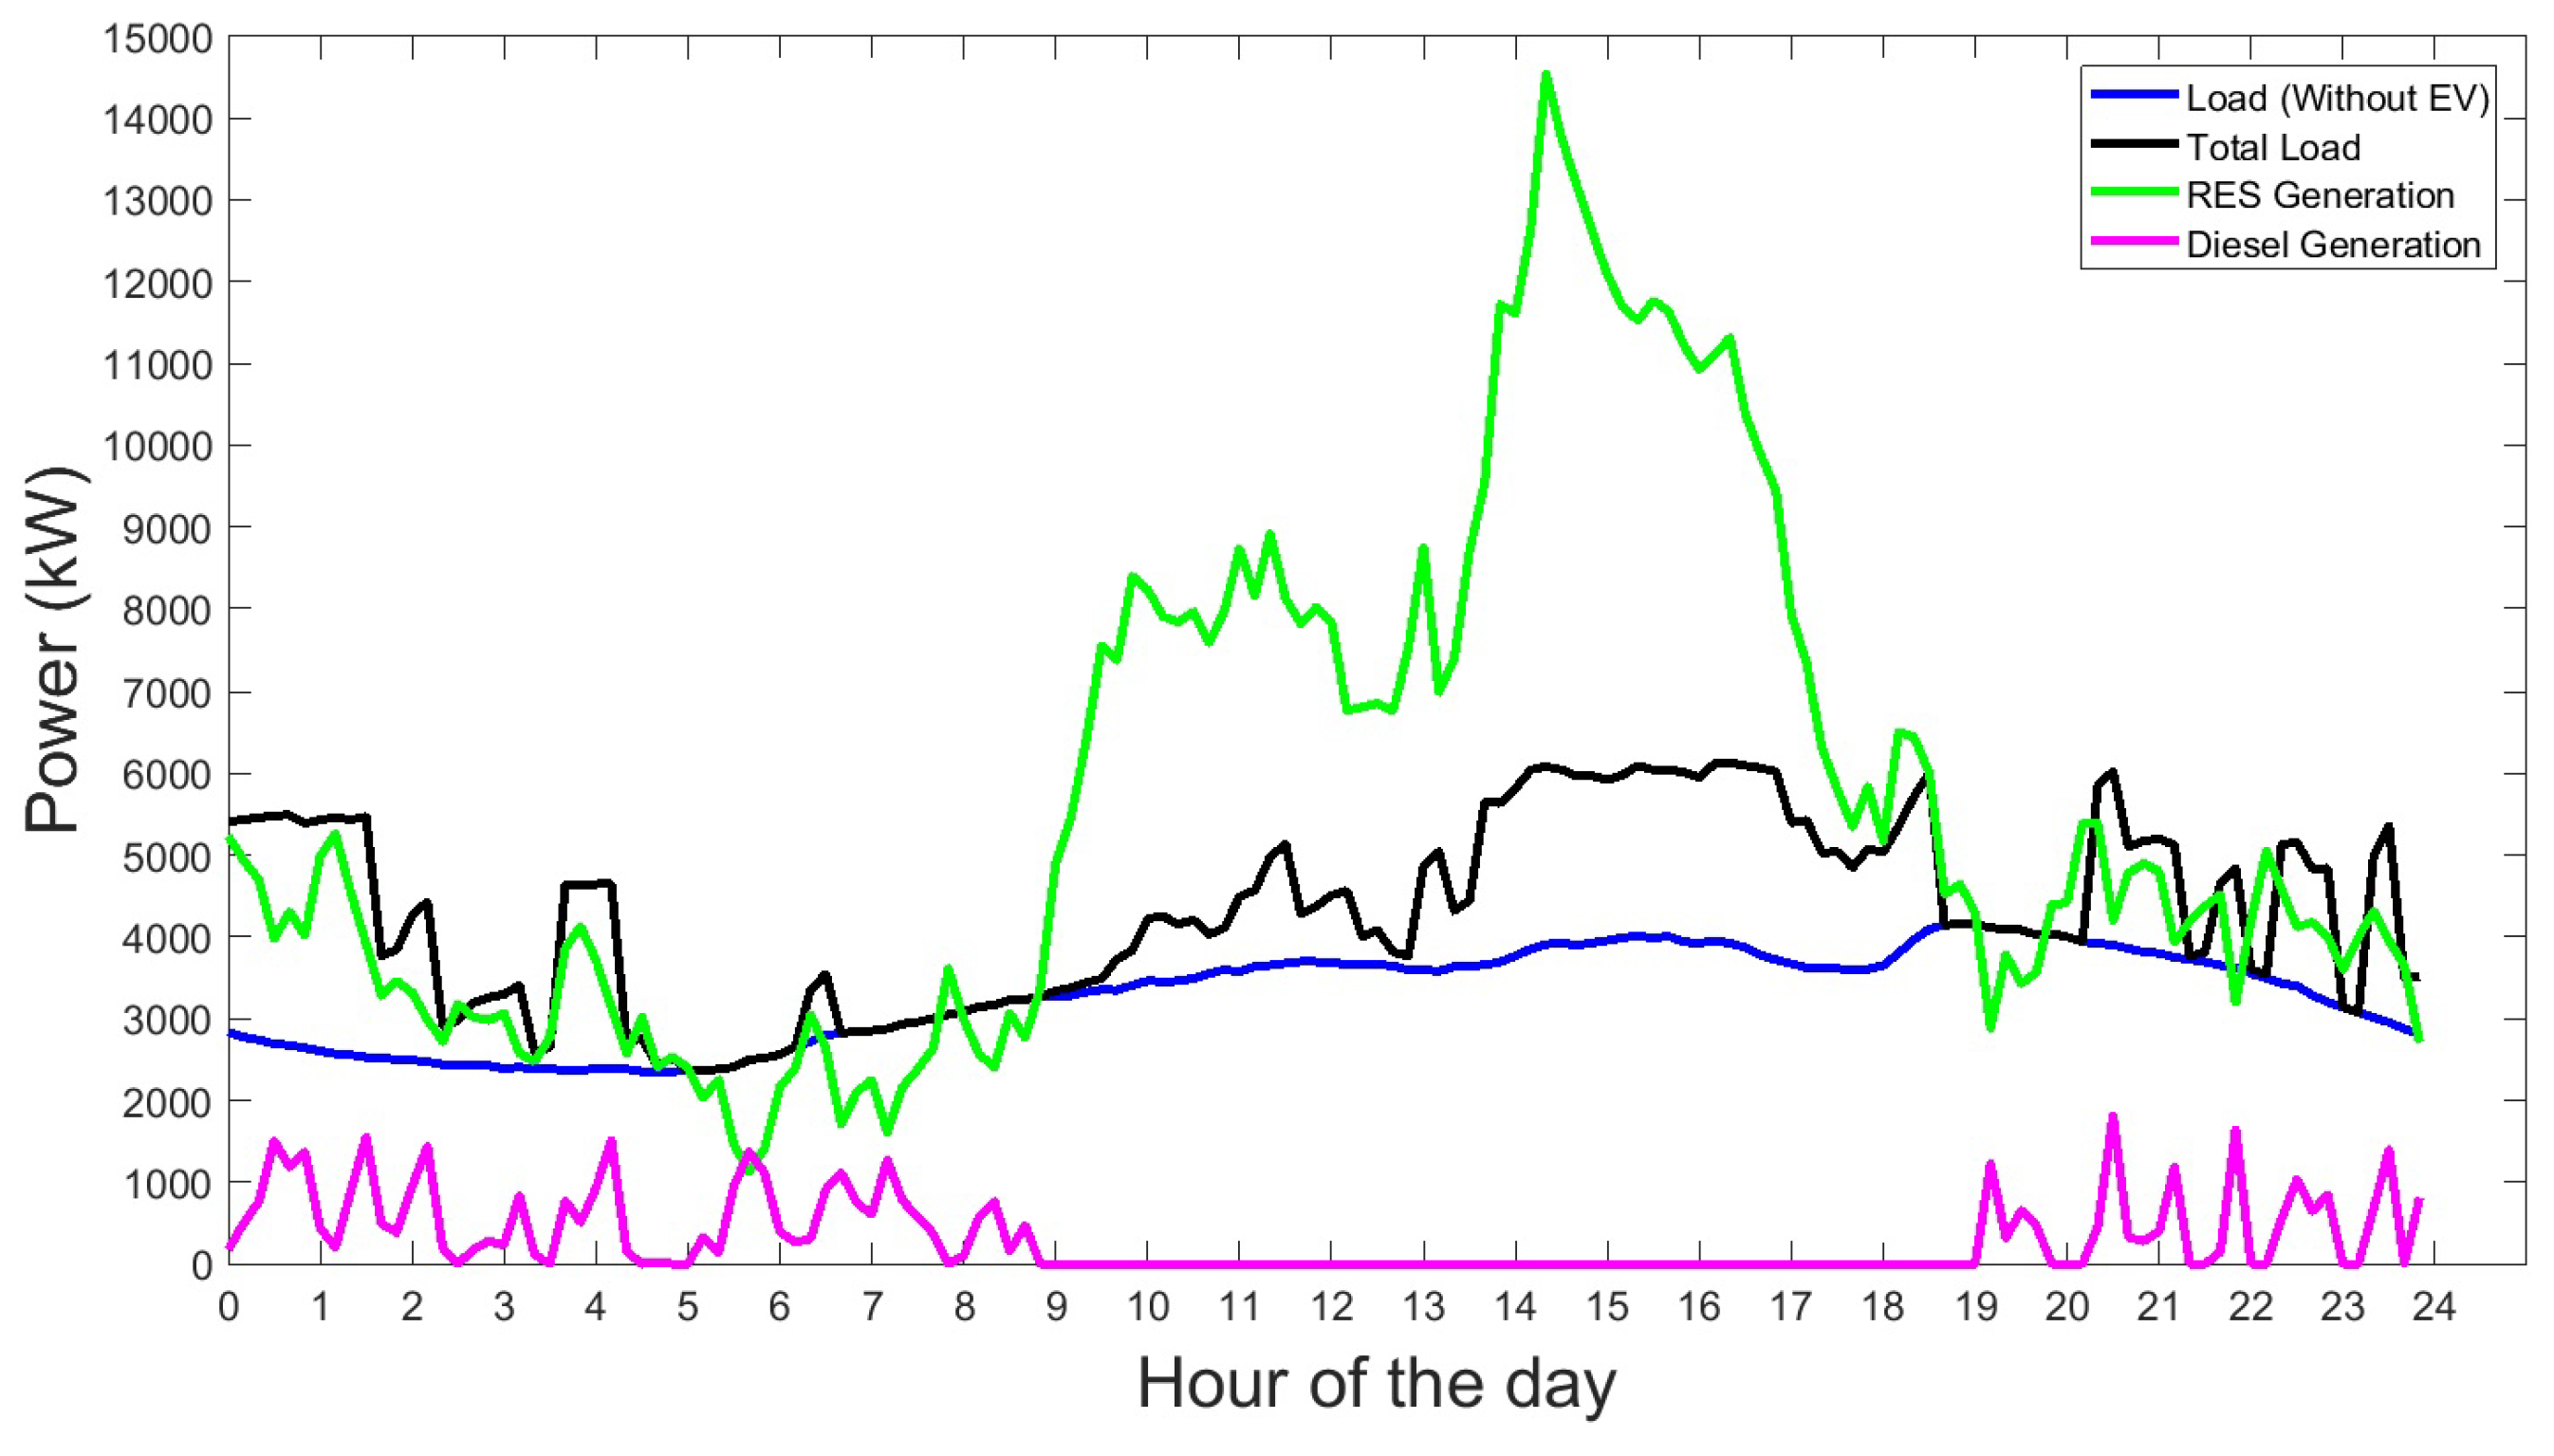
5.3. Scenario 9: Daily Operation

This scenario increased the same proportions of PV and Wind Generation, with an installed power capacity of 10 MW capacity for both PV and Wind. The different patterns from generation and loads are represented in Figure 8. The EV charging load is quite similar to that of Scenario 1, but as the RES capacity is higher, RES energy excess that was not seen in reference scenario is available at specific periods of the night. It can be seen that EV charging absorbs RES power peaks. However, since the RES installed capacity is very high, there is a significant amount of RES energy that cannot be consumed.
In Figure 9, the Diesel generation and RES energy excess consumed by EVs are represented both for smart and uncoordinated charging. As the RES power capacity increases, so do total Diesel generation and RES energy excess consumed by EV.
Table 5 shows the total amount of Electricity generated by Diesel and the RES energy excess consumed for charging EVs in Scenario 9. As in scenario 1, the costs and specific costs are lower with smart charging than with uncoordinated charging, but the total difference drops (7% for the specific cost) and the total costs and specific costs are more significant for smart charging between the reference scenario and scenario 2. This finding is because the cheaper periods of electricity cannot be used for charging EVs because there is no significant demand for charging at these periods.
Table 6 shows the total amount of electricity generated by Diesel and the RES excess energy that is consumed for charging EVs. The Smart Charging of EVs has 23.3% less electricity produced by Diesel and 8.6% more consumption of the RES energy excess compared to uncoordinated charging.

5.4. Medium-Term Operation

RES generation presents fluctuations from one day to other, so different scenarios are evaluated from the data available from July to November 2015, to evaluate the methodology in a longer period.
The results of the different parameters studied are represented in Table 7. It is observed that the costs C are very similar in all cases, but they are relatively lower with a high presence of wind generation. In particular, EV load corresponds more to periods when wind generation is high. Note also that the excess of energy consumed by EVs presents fair values for the Scenario 6, which corresponds to an installed capacity of 7.5 MW of both Wind and PV. The first scenarios result in low values of E e x c , E V and the last scenarios in relatively high values of E e x c , E V , but considering high RES installed capacity.

5.5. Discussion

It was demonstrated that the excess of RES power, which results from the unbalance between the load and generation could be adequately managed by charging the EVs. However, the installed capacity of RES has to be appropriately planned because the EV load can not only consume a very high amount of excess of RES power. Furthermore, for implementing the methodology, it has to be considered the additional installation of local microgrid controllers, in order to avoid stability issues due to the variability of the RES power.
However, this methodology presents several advantages and can be appropriately integrated into similar microgrid systems.

6. Conclusions

An EV charging strategy was studied in this work to encourage RES integration in isolated distribution systems, such as Off-grid Microgrids. The smart charging methodology for EV considered the RES power availability, through cost optimization, which is based on EV charging power modulation. This charging mechanism was simulated in Santa Cruz, which is a protected island of Galapagos and works in off-grid mode. Different kinds of EVs that could be introduced in the Galapagos Islands were considered in the methodology in the charging process.
The EV charging strategy was compared to cases of Uncoordinated Charging. It was observed that the EV aggregator could reduce costs: 7.9% for a case of 5 MW installed capacity (wind and PV each), 7% for a case of 10 MW installed (wind and PV each). In addition, it is observed an increase in the use of RES excess energy by EV load, as well as a decrease of the Diesel generation, while respecting grid conditions. Moreover, this will lead to a significant decrease of CO 2 emissions, which could reach up to 12,780 kg/day avoided in Scenario 9 [13], and thus mitigate contamination in the island.
Nine scenarios from different installed capacities of wind and PV were studied, where two scenarios were illustrated for daily charging. The costs of the nine scenarios were evaluated in the medium term. The increase of the RES installed capacity holds the EV aggregator specific costs almost equal but leads to a decrease of the Diesel use and in an increase of the RES excess energy consumed by EV.
The main limitation of this work lies in the significant amount of RES excess energy that cannot be absorbed by EV with high RES capacity installation. In fact, EVs play a key role in the new power systems, but they are not the only factor; for a better RES integration, it is necessary to complement with residential load management strategies such as demand response and integration of energy storage.

Author Contributions

Conceptualization, J.-M.C. and J.R.-G.; Data Curation, J.-M.C.; Formal Analysis, J.-M.C.; Investigation, J.-M.C.; Methodology, J.-M.C. and J.R.-G.; Software, J.-M.C.; Supervision, J.R.-G. and C.Á.-B.; Validation, J.R.-G. and C.Á.-B.; Writing—Original Draft and Editing, J.-M.C.; Writing—Review, J.R.-G. and C.Á.-B.

Funding

This research received no external funding. The APC was funded by Universidad de las Américas—Ecuador.

Acknowledgments

The authors wish to thank the Ministry of Electricity and Renewable Energy of Ecuador (MEER) and Elecgalapagos for providing important information for this work.

Conflicts of Interest

The authors declare no conflict of interest.

Abbreviations

The following abbreviations are used in this manuscript:
EVElectric Vehicle
RESRenewable Energy Source
PVPhotovoltaic
SOSystem Operator

Nomenclature

Indices
eEV type: B for bus, C for car, M for motorcycle
iEV index
kTime interval
Parameters
Δ T Time between each time interval (h)
P i , e E V ¯ Maximum EV charging power rate for an EV i and type e (kW)
π k Specific Electricity cost at time interval k ($/kWh)
B a t e Battery capacity of EV type e (kWh)
DNumber of time intervals in a day
E i , e r e q Daily Energy required by EV i and type e (kWh)
I C P V Installed Capacity of PV (MW)
I C W Installed Capacity of Wind (MW)
N B Number of electric buses
N C Number of electric cars
N M Number of electric motorcycles
N E V Number of EVs
P k D Power of diesel generator at interval k (kW)
P k L Residential load excluding EV at interval k (kW)
P k W Wind generation power at interval k(kW)
P k l o s s Power losses at interval k (kW)
P k P V PV generation power at interval k (kW)
s t i , e Hour of plug of EV i and type e
Sets
δ i Set of time intervals of charging duration of an EV i
γ i Set of time intervals of plug duration of an EV i
τ Set of time intervals in a day
Variables
η e x c , R E S Ratio of excess energy from RES cosnumed by EV (%)
CTotal daily cost ($)
C c o o Total daily cost for coordinated charging ($)
C u n Total daily cost for uncoordinated charging ($)
C e q c o o Specific cost for coordinated charging ($)
C e q u n Specific cost for uncoordinated charging ($)
E D Total energy generated by Diesel (kWh)
E E V , t o t Total energy needed for charging all the EVs in a day (kWh)
E e x c , E V Excess of energy from RES in a day that was used for charging EV (kWh)
E e x c , R E S Excess of energy from RES in a day (kWh)
P k E V Total load demanded from EV charging at time interval k (kW)
P k e x c , E V Excess of power from RES at interval k that was consumed for charging EV (kW)
P k e x c , R E S Excess of power from RES at interval k (kW)
P k , i , e Power consumed by EV i by type e at time interval k (kW)

References

  1. Labatt, S.; White, R.R. Carbon Finance; John Wiley & Sons, Inc.: Hoboken, NJ, USA, 2007. [Google Scholar]
  2. Geng, Z.; Conejo, A.J.; Chen, Q.; Xia, Q.; Kang, C. Electricity production scheduling under uncertainty: Max social welfare vs. min emission vs. max renewable production. Appl. Energy 2017, 193, 540–549. [Google Scholar] [CrossRef]
  3. Verbruggen, A.; Fischedick, M.; Moomaw, W.; Weir, T.; Nadaï, A.; Nilsson, L.J.; Nyboer, J.; Sathaye, J. Renewable energy costs, potentials, barriers: Conceptual issues. Energy Policy 2010, 38, 850–861. [Google Scholar] [CrossRef]
  4. Robalino-López, A.; Mena-Nieto, A.; García-Ramos, J.E. System dynamics modeling for renewable energy and CO2 emissions: A case study of Ecuador. Energy Sustain. Dev. 2014, 20, 11–20. [Google Scholar] [CrossRef] [Green Version]
  5. Clement-Nyns, K.; Haesen, E.; Driesen, J. The impact of Charging plug-in hybrid electric vehicles on a residential distribution grid. IEEE Trans. Power Syst. 2010, 25, 371–380. [Google Scholar] [CrossRef] [Green Version]
  6. Ahmadi, L.; Croiset, E.; Elkamel, A.; Douglas, P.L.; Unbangluang, W.; Entchev, E. Impact of PHEVs penetration on Ontario’s electricity grid and environmental considerations. Energies 2012, 5, 5019–5037. [Google Scholar] [CrossRef]
  7. Humayd, A.S.; Bhattacharya, K. Design of Optimal Incentives for Smart Charging Considering Utility-Customer Interactions and Distribution Systems Impact. IEEE Trans. Smart Grid 2017, 3053, 1–11. [Google Scholar] [CrossRef]
  8. De Oliveira-De Jesus, P.; Rios, M.; Ramos, G. Energy Loss Allocation in Smart Distribution Systems with Electric Vehicle Integration. Energies 2018, 11, 1962. [Google Scholar] [CrossRef]
  9. Guo, C.; Yang, J.; Yang, L. Planning of electric vehicle charging infrastructure for urban areas with tight land supply. Energies 2018, 11, 2314. [Google Scholar] [CrossRef]
  10. Kordkheili, R.A.; Pourmousavi, S.A.; Savaghebi, M.; Guerrero, J.M.; Nehrir, M.H. Assessing the potential of plug-in electric vehicles in active distribution networks. Energies 2016, 9, 34. [Google Scholar] [CrossRef]
  11. Shafie-Khah, M.; Siano, P.; Fitiwi, D.; Mahmoudi, N.; Catalão, J. An innovative two-level model for electric vehicle parking lots in distribution systems with renewable energy. IEEE Trans. Smart Grid 2018, 9, 1506–1520. [Google Scholar] [CrossRef]
  12. An, K.; Song, K.B.; Hur, K. Incorporating charging/discharging strategy of electric vehicles into security-constrained optimal power flow to support high renewable penetration. Energies 2017, 10, 729. [Google Scholar] [CrossRef]
  13. Clairand, J.-M.; Arriaga, M.; Cañizares, C.A.; Álvarez-Bel, C. Power Generation Planning of Galapagos Microgrid Considering Electric Vehicles and Induction Stoves. IEEE Trans. Sustain. Energy 2018. [Google Scholar] [CrossRef]
  14. Amini, M.H.; Moghaddam, M.P.; Karabasoglu, O. Simultaneous allocation of electric vehicles’ parking lots and distributed renewable resources in smart power distribution networks. Sustain. Cities Soc. 2017, 28, 332–342. [Google Scholar] [CrossRef]
  15. Guo, Y.; Xiong, J.; Xu, S.; Su, W. Two-Stage Economic Operation of Microgrid-Like Electric Vehicle Parking Deck. IEEE Trans. Smart Grid 2016, 7, 1703–1712. [Google Scholar] [CrossRef]
  16. Miceli, R.; Viola, F. Designing a sustainable university recharge area for electric vehicles: Technical and economic analysis. Energies 2017, 10, 1604. [Google Scholar] [CrossRef]
  17. Lu, X.; Zhou, K.; Yang, S. Multi-objective optimal dispatch of microgrid containing electric vehicles. J. Clean. Prod. 2017, 165, 1572–1581. [Google Scholar] [CrossRef]
  18. Ji, Z.; Huang, X.; Xu, C.; Sun, H. Accelerated model predictive control for electric vehicle integrated microgrid energy management: A hybrid robust and stochastic approach. Energies 2016, 9, 973. [Google Scholar] [CrossRef]
  19. Alharbi, W.; Member, S.; Bhattacharya, K.; Member, S. Electric Vehicle charging facility as a smart energy microhub.pdf. IEEE Trans. Sustain. Energy 2017, 8, 616–628. [Google Scholar] [CrossRef]
  20. Mozafar, M.R.; Moradi, M.H.; Amini, M.H. A simultaneous approach for optimal allocation of renewable energy sources and electric vehicle charging stations in smart grids based on improved GA-PSO algorithm. Sustain. Cities Soc. 2017, 32, 627–637. [Google Scholar] [CrossRef]
  21. Delille, G.; François, B.; Malarange, G. Dynamic frequency control support by energy storage to reduce the impact of wind and solar generation on isolated power system’s inertia. IEEE Trans. Sustain. Energy 2012, 3, 931–939. [Google Scholar] [CrossRef]
  22. Han, H.; Li, L.; Wang, L.; Su, M.; Zhao, Y.; Guerrero, J.M. A novel decentralized economic operation in islanded AC microgrids. Energies 2017, 10, 804. [Google Scholar] [CrossRef]
  23. Vélez-Vega, V.; Cedeño-Gómez, M.; Almeida-Chinga, O. Energía Verde Para Galápagos. PROGRa.m.A LAS Nac. UNIDAS PARA EL Desarro. 2016, p. 10. Available online: http://www.ec.undp.org/content/dam/ecuador/docs/documentosproyectosambiente/pnud_ecREVISTAENERGIAVERDEPARAGALAPAGOS-ilovepdf-compressed.pdf (accessed on 28 November 2017).
  24. Ponce-Jara, M.; Castro, M.; Pelaez-Samaniego, M.; Espinoza-Abad, J.; Ruiz, E. Electricity sector in Ecuador: An overview of the 2007–2017 decade. Energy Policy 2018, 113, 513–522. [Google Scholar] [CrossRef]
  25. Consejo de Gobierno del Regimen Especial de Galapagos, Plan Galapagos. Technical Report. Available online: http://extwprlegs1.fao.org/docs/pdf/ecu166016.pdf (accessed on 15 November 2017).
  26. Clairand, J.M.; Rodríguez-García, J.; Álvarez-Bel, C.; Pesantez-Sarmiento, P. A tariff system for electric vehicle smart charging to increase renewable energy sources use. In Proceedings of the 2017 IEEE PES Innovative Smart Grid Technologies Conference - Latin America (ISGT Latin America), Quito, Ecuador, 20–22 September 2017. [Google Scholar]
  27. Khodayar, M.E.; Wu, L.; Shahidehpour, M. Hourly coordination of electric vehicle operation and volatile wind power generation in SCUC. IEEE Trans. Smart Grid 2012, 3, 1271–1279. [Google Scholar] [CrossRef]
  28. Yang, H.; Pan, H.; Luo, F.; Qiu, J.; Deng, Y.; Lai, M.; Dong, Z.Y. Operational Planning of Electric Vehicles for Balancing Wind Power and Load Fluctuations in a Microgrid. IEEE Trans. Sustain. Energy 2017, 8, 592–604. [Google Scholar] [CrossRef]
  29. Bilh, A.; Naik, K.; El-shatshat, R. A Novel Online Charging Algorithm for Electric Vehicles Under Stochastic Net-Load. IEEE Trans. Smart Grid 2018, 9, 1787–1799. [Google Scholar] [CrossRef]
  30. Sabillon, C.; Franco, J.F.; Rider, M.J.; Romero, R. Electrical Power and Energy Systems Joint optimal operation of photovoltaic units and electric vehicles in residential networks with storage systems: A dynamic scheduling method. Int. J. Electr. Power Energy Syst. 2018, 103, 136–145. [Google Scholar] [CrossRef]
  31. Ma, T.; Mohammed, O.A. Economic analysis of real-time large-scale pevs network power flow control algorithm with the consideration of V2G services. IEEE Trans. Ind. Appl. 2014, 50, 4272–4280. [Google Scholar] [CrossRef]
  32. Chiodo, E.; Fantauzzi, M.; Lauria, D.; Mottola, F. A Probabilistic Approach for the Optimal Sizing of Storage Devices to Increase the Penetration of Plug-in Electric Vehicles in Direct Current Networks. Energies 2018, 11. [Google Scholar] [CrossRef]
  33. Alharbi, T.; Bhattacharya, K. Optimal Scheduling of Energy Resources and Management of Loads in Isolated/Islanded Microgrids. Can. J. Electr. Comput. Eng. 2017, 40, 284–294. [Google Scholar]
  34. Khooban, M.H.; Niknam, T.; Shasadeghi, M. Load Frequency Control in Microgrids Based on a Stochastic Noninteger Controller. IEEE Trans. Sustain. Energy 2018, 9, 853–861. [Google Scholar] [CrossRef]
  35. Guzzi, F.; Neves, D.; Silva, C.A. Integration of smart grid mechanisms on microgrids energy modelling. Energy 2017, 129, 321–330. [Google Scholar] [CrossRef]
  36. Zhang, X. Short-term load forecasting for electric bus charging stations based on fuzzy clustering and least squares support vector machine optimized by Wolf pack algorithm. Energies 2018, 11, 1449. [Google Scholar] [CrossRef]
  37. Mohamed, M.; Farag, H.; El-Taweel, N.; Ferguson, M. Simulation of electric buses on a full transit network: Operational feasibility and grid impact analysis. Electr. Power Syst. Res. 2017, 142, 163–175. [Google Scholar] [CrossRef]
  38. Gao, Y.; Guo, S.; Ren, J.; Zao, Z.; Ehsan, A.; Zheng, Y. An Electric Bus Power Consumption Model and Optimization of Charging Scheduling Concerning Multi-External Factors. Energies 2018, 11. [Google Scholar] [CrossRef]
  39. Yang, Y.; Zhang, Y.; Tian, J.; Zhang, S. Research on a plug-in hybrid electric bus energy management strategy considering drivability. Energies 2018, 11, 2177. [Google Scholar] [CrossRef]
  40. Agrawal, A.; Kumar, M.; Prajapati, D.K.; Singh, M.; Kumar, P. Smart public transit system using an energy storage system and its coordination with a distribution grid. IEEE Trans. Intell. Transp. Syst. 2014, 15, 1622–1632. [Google Scholar] [CrossRef]
  41. Leou, R.C.; Hung, J.J. Optimal charging schedule planning and economic analysis for electric bus charging stations. Energies 2017, 10, 483. [Google Scholar] [CrossRef]
  42. Sriwilai, A.; Pattaraprakorn, W. The Study on the Effect of Electric Car to Energy. In Proceedings of the 2016 13th International Conference on Electrical Engineering/Electronics, Computer, Telecommunications and Information Technology (ECTI-CON), Chiang Mai, Thailand, 28 June–1 July 2016; pp. 0–3. [Google Scholar]
  43. Fernandez, P.E.; Coello, M. Implementation of electric motorcycle case of study: Cuenca-Ecuador. In Proceedings of the 2017 Congreso Internacional de Innovacion y Tendencias en Ingenieria (CONIITI), Bogota, Colombia, 4–6 October 2017; pp. 1–5. [Google Scholar]
  44. Zhang, L.; Ma, H.; Shi, D.; Wang, P.; Cai, G.; Liu, X. Reliability Oriented Modeling and Analysis of Vehicular Power Line Communication for Vehicle to Grid (V2G) Information Exchange System. IEEE Access 2017, 5, 12449–12457. [Google Scholar] [CrossRef]
  45. Hoang, D.T.; Wang, P.; Niyato, D.; Hossain, E. Charging and discharging of plug-in electric vehicles (PEVs) in vehicle-to-grid (V2G) systems: A cyber insurance-based model. IEEE Access 2017, 5, 732–754. [Google Scholar] [CrossRef]
  46. Roldán-Blay, C.; Escrivá-Escrivá, G.; Roldán-Porta, C.; Álvarez-Bel, C. An optimisation algorithm for distributed energy resources management in micro-scale energy hubs. Energy 2017, 132, 126–135. [Google Scholar] [CrossRef]
  47. Ekman, C.K. On the synergy between large electric vehicle fleet and high wind penetration—An analysis of the Danish case. Renew. Energy 2011, 36, 546–553. [Google Scholar] [CrossRef]
  48. ARCONEL. Pliego Tarifario Para Las Empresas Eléctricas. Technical Report. 2016. Available online: http://www.regulacionelectrica.gob.ec/wp-content/uploads/downloads/2018/01/2018-01-11-Pliego-y-Cargos-Tarifarios-del-SPEE-20182.pdf (accessed on 12 April 2017).
  49. Picciariello, A.; Reneses, J.; Frias, P.; Söder, L. Distributed generation and distribution pricing: Why do we need new tariff design methodologies? Electr. Power Syst. Res. 2015, 119, 370–376. [Google Scholar] [CrossRef]
  50. Elecgalapagos. Parque Eólico Baltra. Technical Report. 2016. Available online: http://www.elecgalapagos.com.ec/pdf2015/centrales.pdf (accessed on 15 March 2017).
  51. Elecgalapagos. Proyectos. Available online: http://www.elecgalapagos.com.ec/proyectos (accessed on 15 February 2018).
  52. Paz, C.; Anazco, D. Iluminando al Patrimonio Natural de la Humanidad. Technical Report. 2015. Available online: http://www.elecgalapagos.com.ec/pdf2015/M09/Revistainstitucional.pdf (accessed on 28 November 2017).
  53. Álvarez-Bel, C.; Pesantez-Sarmiento, P.; Rodriguez García, J.; Alcázar-Ortega, M.; Carbonell Carretero, J.; Erazo-Almeida, P.; Morales Jadan, D.X.; Escrivá-Escrivá, G.; Carrillo-Díaz, A.; Piette, M.A.; et al. Análisis para la implementación de redes inteligentes en Ecuador—Metodología de Previsión de la demanda basada en redes inteligentes; Editorial Institucional UPV: Valencia, Spain, 2016; p. 287. [Google Scholar]
  54. Zelectricvehicle. Z Electric Vehicle: The Performance and Value Leader in Electric Vehicles. 2018. Available online: https://www.zelectricvehicle.com/ (accessed on 20 May 2018).
  55. BYD. K9 Electric Transit Bus. 2018. Available online: http://en.byd.com/usa/bus/k9-electric-transit-bus/ (accessed on 20 May 2018).
  56. Kia. Kia Soul EV. 2018. Available online: http://www.kia.com/es/modelos/soul-ev/descubrelo/ (accessed on 20 May 2018).
Figure 1. Difference of residential load and RES power, and EV charging specific cost.
Energies 11 03188 g001
Figure 2. Flowchart of the optimal EV charging for each interval in a day.
Energies 11 03188 g002
Figure 3. Present daily Santa Cruz load and daily Renewable generation.
Energies 11 03188 g003
Figure 4. Charging pattern from each type of EV, with smart charging, for Scenario 1.
Energies 11 03188 g004
Figure 5. Loads and Generation Profiles, with smart charging, for Scenario 1.
Energies 11 03188 g005
Figure 6. Smart Charging and Uncoordinated Charging Patterns, for Scenario 1.
Energies 11 03188 g006
Figure 7. Diesel generation and RES power excess consumed by EVs for Scenario 1.
Energies 11 03188 g007
Figure 8. Loads and Generation Profiles for Scenario 9, with smart charging.
Energies 11 03188 g008
Figure 9. Diesel generation and RES power excess consumed by EVs for Scenario 9.
Energies 11 03188 g009
Table 1. EV characteristics.
EV TypeMotorcycleBusCar
N61146467
P i , e E V ¯ 1 kW60 kW6.6 kW
B a t e 4 kWh324 kWh27 kWh
E i , e r e q 1.7 kWh280 kWh24 kWh
s t i , e 16 h 30–20 h 3012 h 00–22 h 0005 h 00–12 h 00 & 22 h 00–02 h 00
Table 2. Installed capacity of PV and Wind for each scenario.
Scenario IC PV (MW) IC W (MW)
155
257.5
3510
47.55
57.57.5
67.510
7105
8107.5
91010
Table 3. Energy and Costs for each type of EV for Scenario 1.
EV TypeMotorcycleBusCarTotal
E E V , t o t (kWh)103912,88011,20825,127
C u n c ($)919838621936
C c o o ($)879187771782
C e q u n c ($/MWh)87.676.376.977
C e q c o o ($/MWh)83.771.369.370.9
Table 4. Diesel Generation and RES power excess used for charging EV for Scenario 1.
Type of ChargingUncoordinatedSmart
Diesel Energy (kWh)39,50537,766
Excess RES Used (kWh)55327271
Ratio excess RES (%)2229
Table 5. Energy and Costs for each type of EV for Scenario 9.
EV TypeMotorcycleBusCarTotal
E E V , t o t (kWh)103912,88011,20825,127
C u n c (kWh)869378881911
C c o o ($)839097971790
C e q u n c ($/MWh)90.272.779.276.1
C e q c o o ($/MWh)79.970.671.171.2
Table 6. Diesel Generation and RES pwer excess used for charging EV for Scenario 9.
Type of ChargingUncoordinatedSmart
Diesel Energy (kWh)90197317
Excess RES Used (kWh)18,67920,382
Ratio excess RES (%)7481
Table 7. Energy and Costs comparison between each scenario.
Scenario IC PV (MW) IC W (MW) E exc , EV (MWh) E D (MWh)C (k$)
1552929700281
257.56627680280
351012605980278
47.556168850284
57.57.59457050282
67.51014605520281
71058678310285
8107.511306680284
9101015705270283

