1. Introduction
Buildings comprise about 34% of the global energy consumption and are responsible for 6% of global greenhouse gas emissions [
1]. It is estimated that 39% of the energy attributed to buildings is consumed by air conditioning applications in commercial buildings in the United States which necessitates building materials to have thermal insulation properties [
2]. Moreover, embodied energy involved in the production of traditional building insulation materials such as glass wool is very high. Both factors are responsible for significant environmental damage [
3]. Thus, the production and processing of thermal insulation materials should not be energy intensive. The material selection is also dependent on the global and regional availability of the materials to reduce transportation costs. The materials should be widely available with lesser environmental impacts throughout its life cycle and meet defined thermal characteristics [
4]. Application of insulation materials into buildings improves acoustic characteristics and reduces transmittance of urban noise to the indoor spaces [
5].
Several sustainable green materials have been investigated for thermal insulation in building applications including reeds; bagasse; cattail; corn cob; cotton stalk fibers; rice husk; date palm; and a blend of jute, flax, and hemp [
6,
7]. Other than agriculture-based materials, recycled plastics [
6] and recycled textile fiber [
6] are also investigated for building thermal insulations. The focus of all these studies was on the development of insulation materials and on investigating the material properties such as thermal conductivity. For example, Haba et al. investigated thermo-physical properties of date palm-based building insulation material. The study reported a range of thermal conductivity values (K-value) for the bio composite materials from 0.185 W m
−1 K
−1 to 0.243 W m
−1 K
−1 which is due to a range of testing conditions including moisture content and temperature [
8]. Masri et al. blended date palm with polystyrene to develop sustainable building material. Through scanning electron microscopy (SEM) investigations, bonding and adhesion of the materials were investigated and K-value of the composites was also measured [
9]. The research produced composite materials with the minimum K-value of 0.112 W m
−1 K
−1 and the materials have the potential to be recycled after its life cycle [
9].
Approximately 10 million tons of rubber tires are wasted each year globally [
10]. The materials have different chemical compositions and strong cross-linked structure which prohibits its biodegradation and photochemical decomposition. This significant amount of non-degradable waste addition to the eco-system is considered a real threat to the environment [
10]. Until now, major consumption of this waste in Europe is energy recovery [
11], pyrolysis [
12], and earthquake prevention in buildings [
13]. Paraffin waxes are another by-product of the petrochemical industry which are usually called phase change materials (PCM). PCM has potential to absorb and release a huge amount of heat over a narrow temperature range by changing its phase (from solid to liquid and liquid to solid) [
14,
15]. The low K-value and high latent heat of fusion of PCM makes them a good insulator for building applications. Furthermore, paraffins are widely available around the globe [
14,
15]. From life cycle assessment of the traditional materials, there is a dire need to develop and investigate environment friendly materials for massive construction. A recent review article stated that green materials and by-products are not investigated in-depth for thermal insulation. Specific heat capacity of most materials is still unknown, and research is needed prior to the penetration of such material into market [
6]. None of the previous studies found in literature have examined the application of waste materials for indoor heating/cooling load reduction.
The goal of this work is to investigate the thermal performance of waste materials and industrial by-products for building insulations in extreme cold and hot climatic conditions. The effect of identical thick layers of different insulation materials on temperature damping at the back surface is examined, and consequent energy savings are calculated.
2. Materials and Methods
In this study, agricultural waste material (date palm), industrial waste (rubber tire of vehicles), and industrial by-products of petrochemical industry (paraffins, polyurethane foam) are tested as thermal insulation for buildings. The thermal performance of these materials is compared with the well-understood materials (air and expanded polystyrene foam).
2.1. Materials
Used rubber tire of vehicles and dead date palm are waste materials while polyurethane, paraffin based PCM-30, and paraffin based PCM-42 are by-products of the petrochemical industry. Furthermore, vertical air cavity and expanded polystyrene foam were investigated as a benchmark of thermal performance. Thermo-physical properties of the materials are summarized in
Table 1.
2.2. Methods
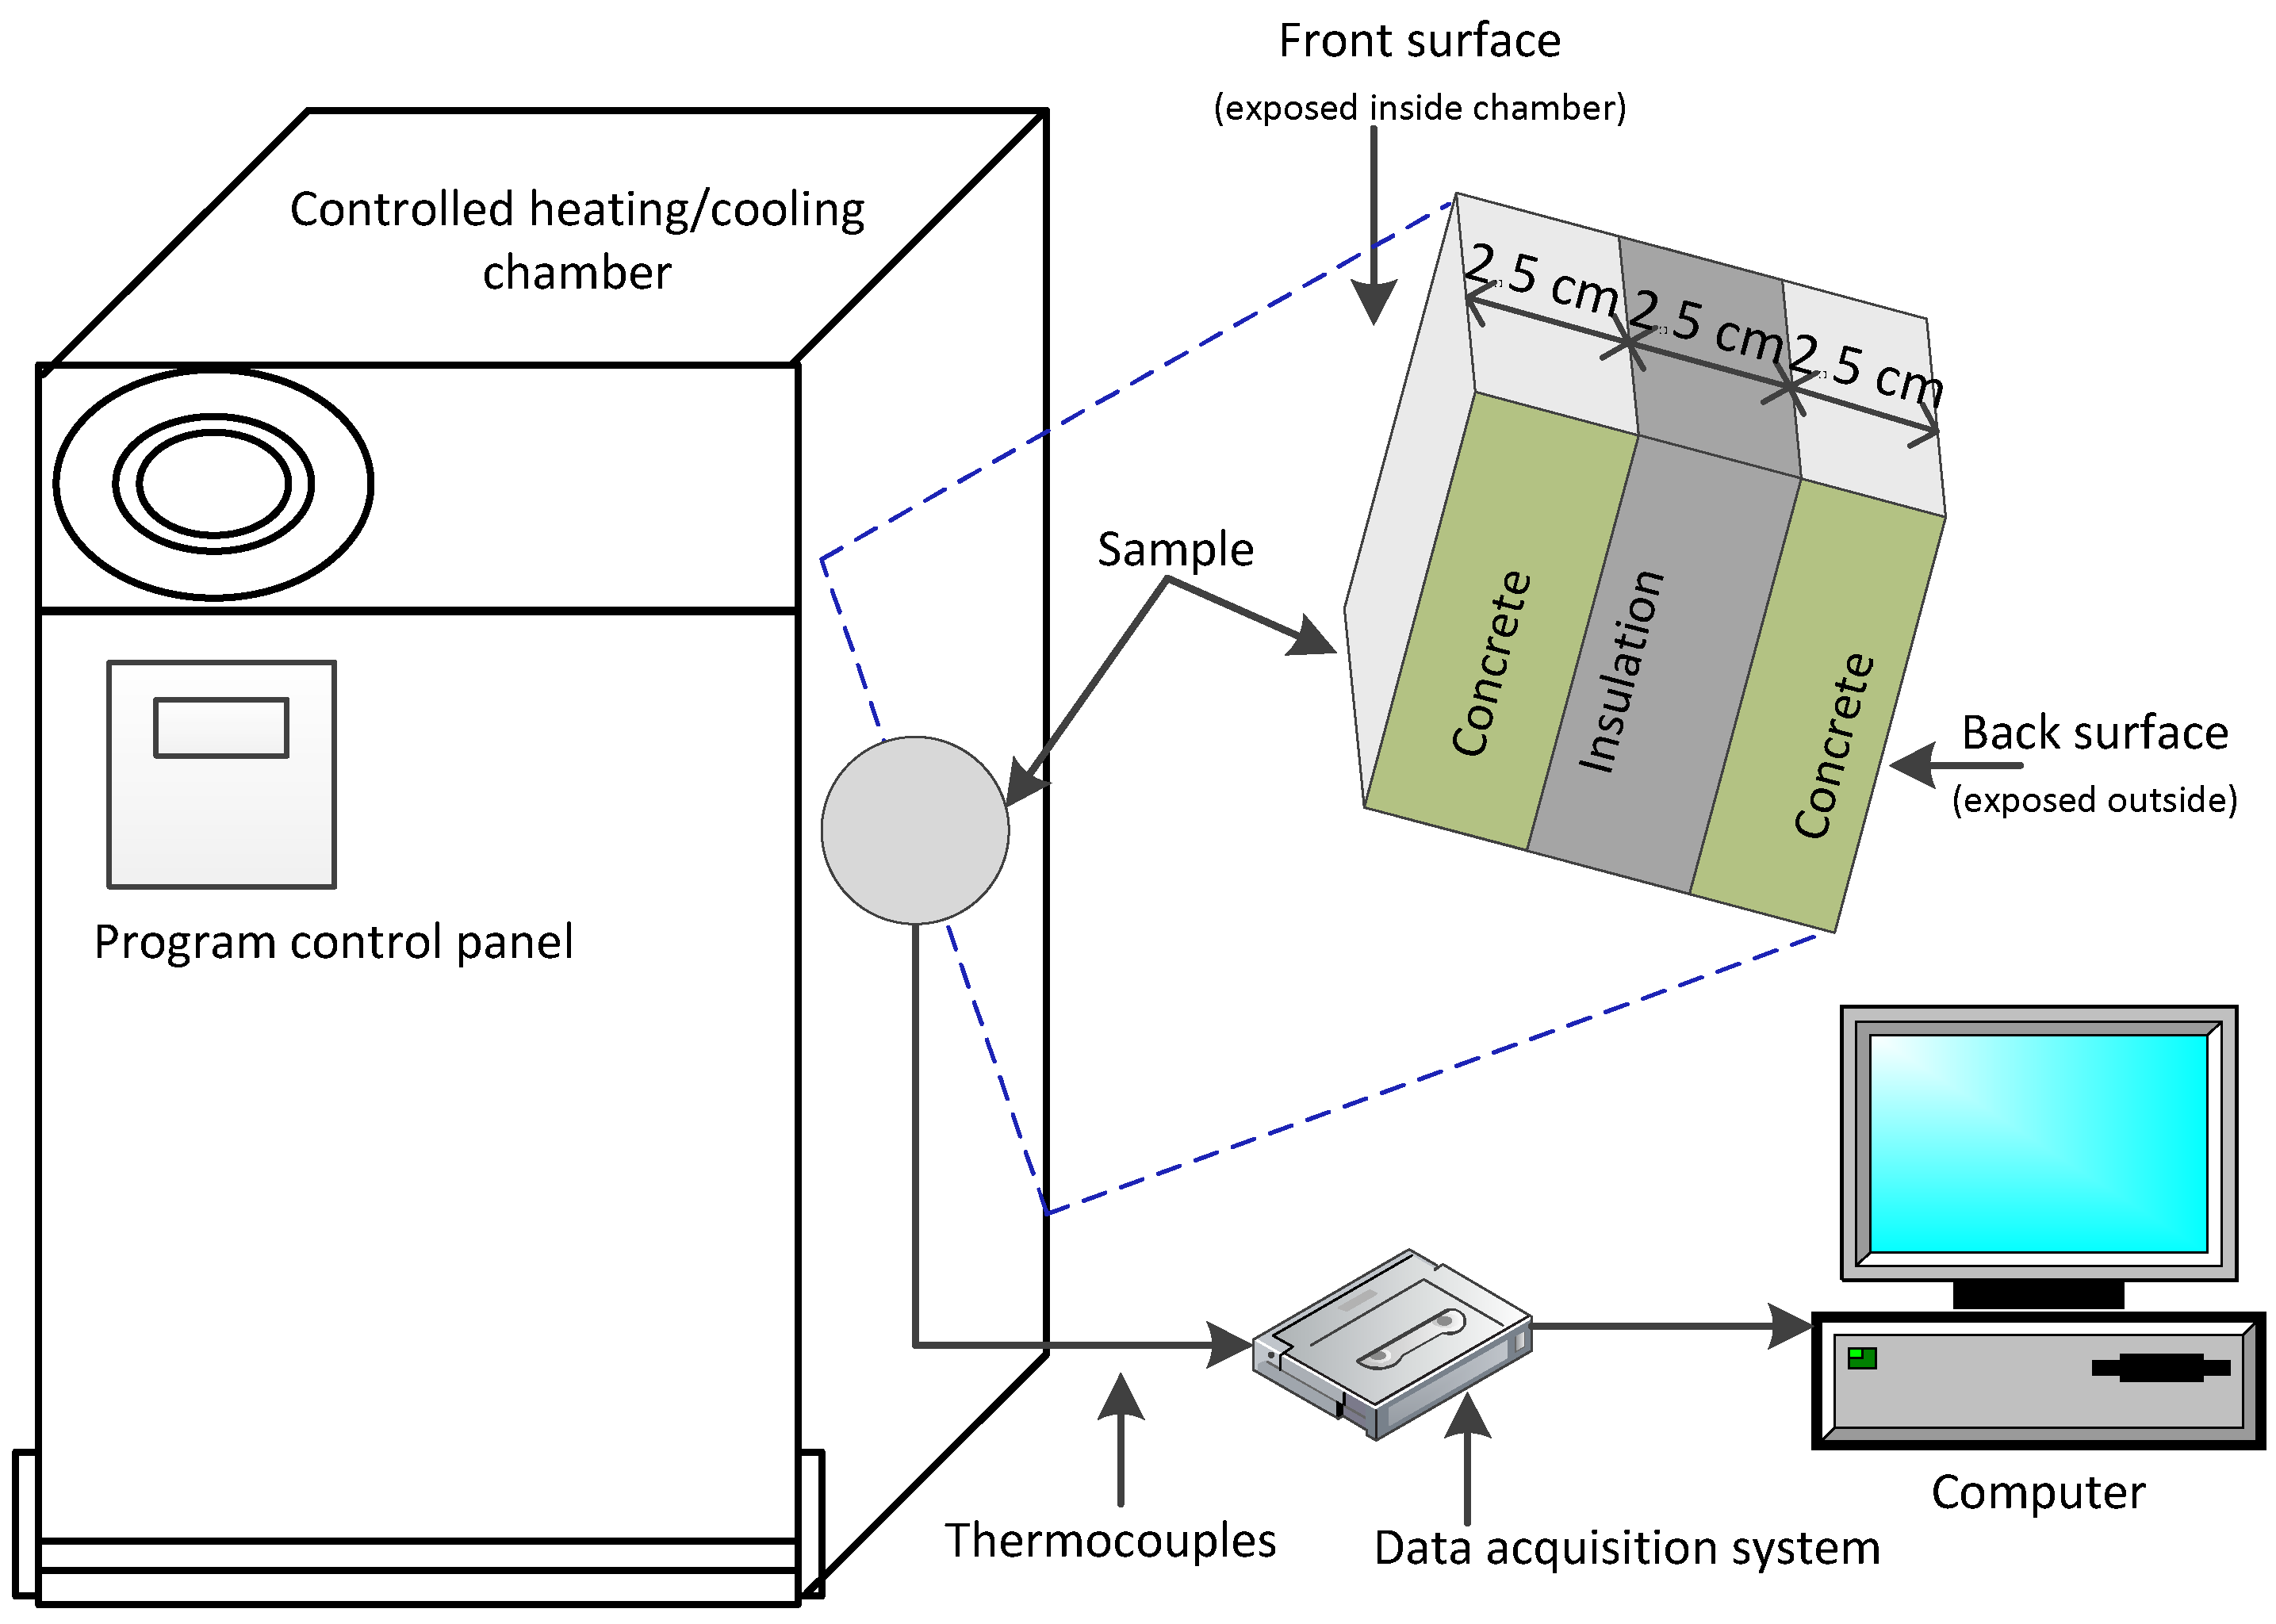
In the reference case, multiple K-type thermocouples were attached on the two opposite faces of a geopolymer concrete block. The thickness of the block was 7.5 cm with the cross-sectional rea of 5 × 5 cm. The remaining four faces of the block were tightly wrapped into thermal insulation made of glass wool. The K-value of the single layer of 2.5 cm thick glass wool is 0.039 W m
−1 K
−1 [
21], and the block was wrapped in several layers of the wool to ensure perfect insulation with the aim of the study to investigate 1-D heat conduction through the block. Later the sample was inserted into the specimen holder of the controlled heating/cooling oven. The oven can be programmed in the temperature range of −40 °C to 110 °C with high accuracy. Inside conditions of the thermal chamber were programmed and controlled while outer surface of the concrete cube was exposed to indoor ambient at fix temperature of 23 °C. Thermocouples related to a data logger of National Instruments. One sample was tested at a time and then all the results were plotted against same time axis. Schematic diagram of the experimental set up is shown in
Figure 1.
For configuration other than reference, two pieces of the geopolymer concrete with the width of 2.5 cm each were taken. Prior to the conduction of experiments, it was ensured that surfaces of the materials are smooth so that the surfaces can rest well onto each other while making sandwich geometry. Further, thermal pads of very small thickness were used between concrete section and insulation on both sides to reduce irregularities of the surfaces and to reduce thermal contact resistance. In the case of PCM, materials were sealed in a very thin polyethylene sheet to avoid PCM leakage in the liquidous form.
2.2.1. Hot Climatic Conditions
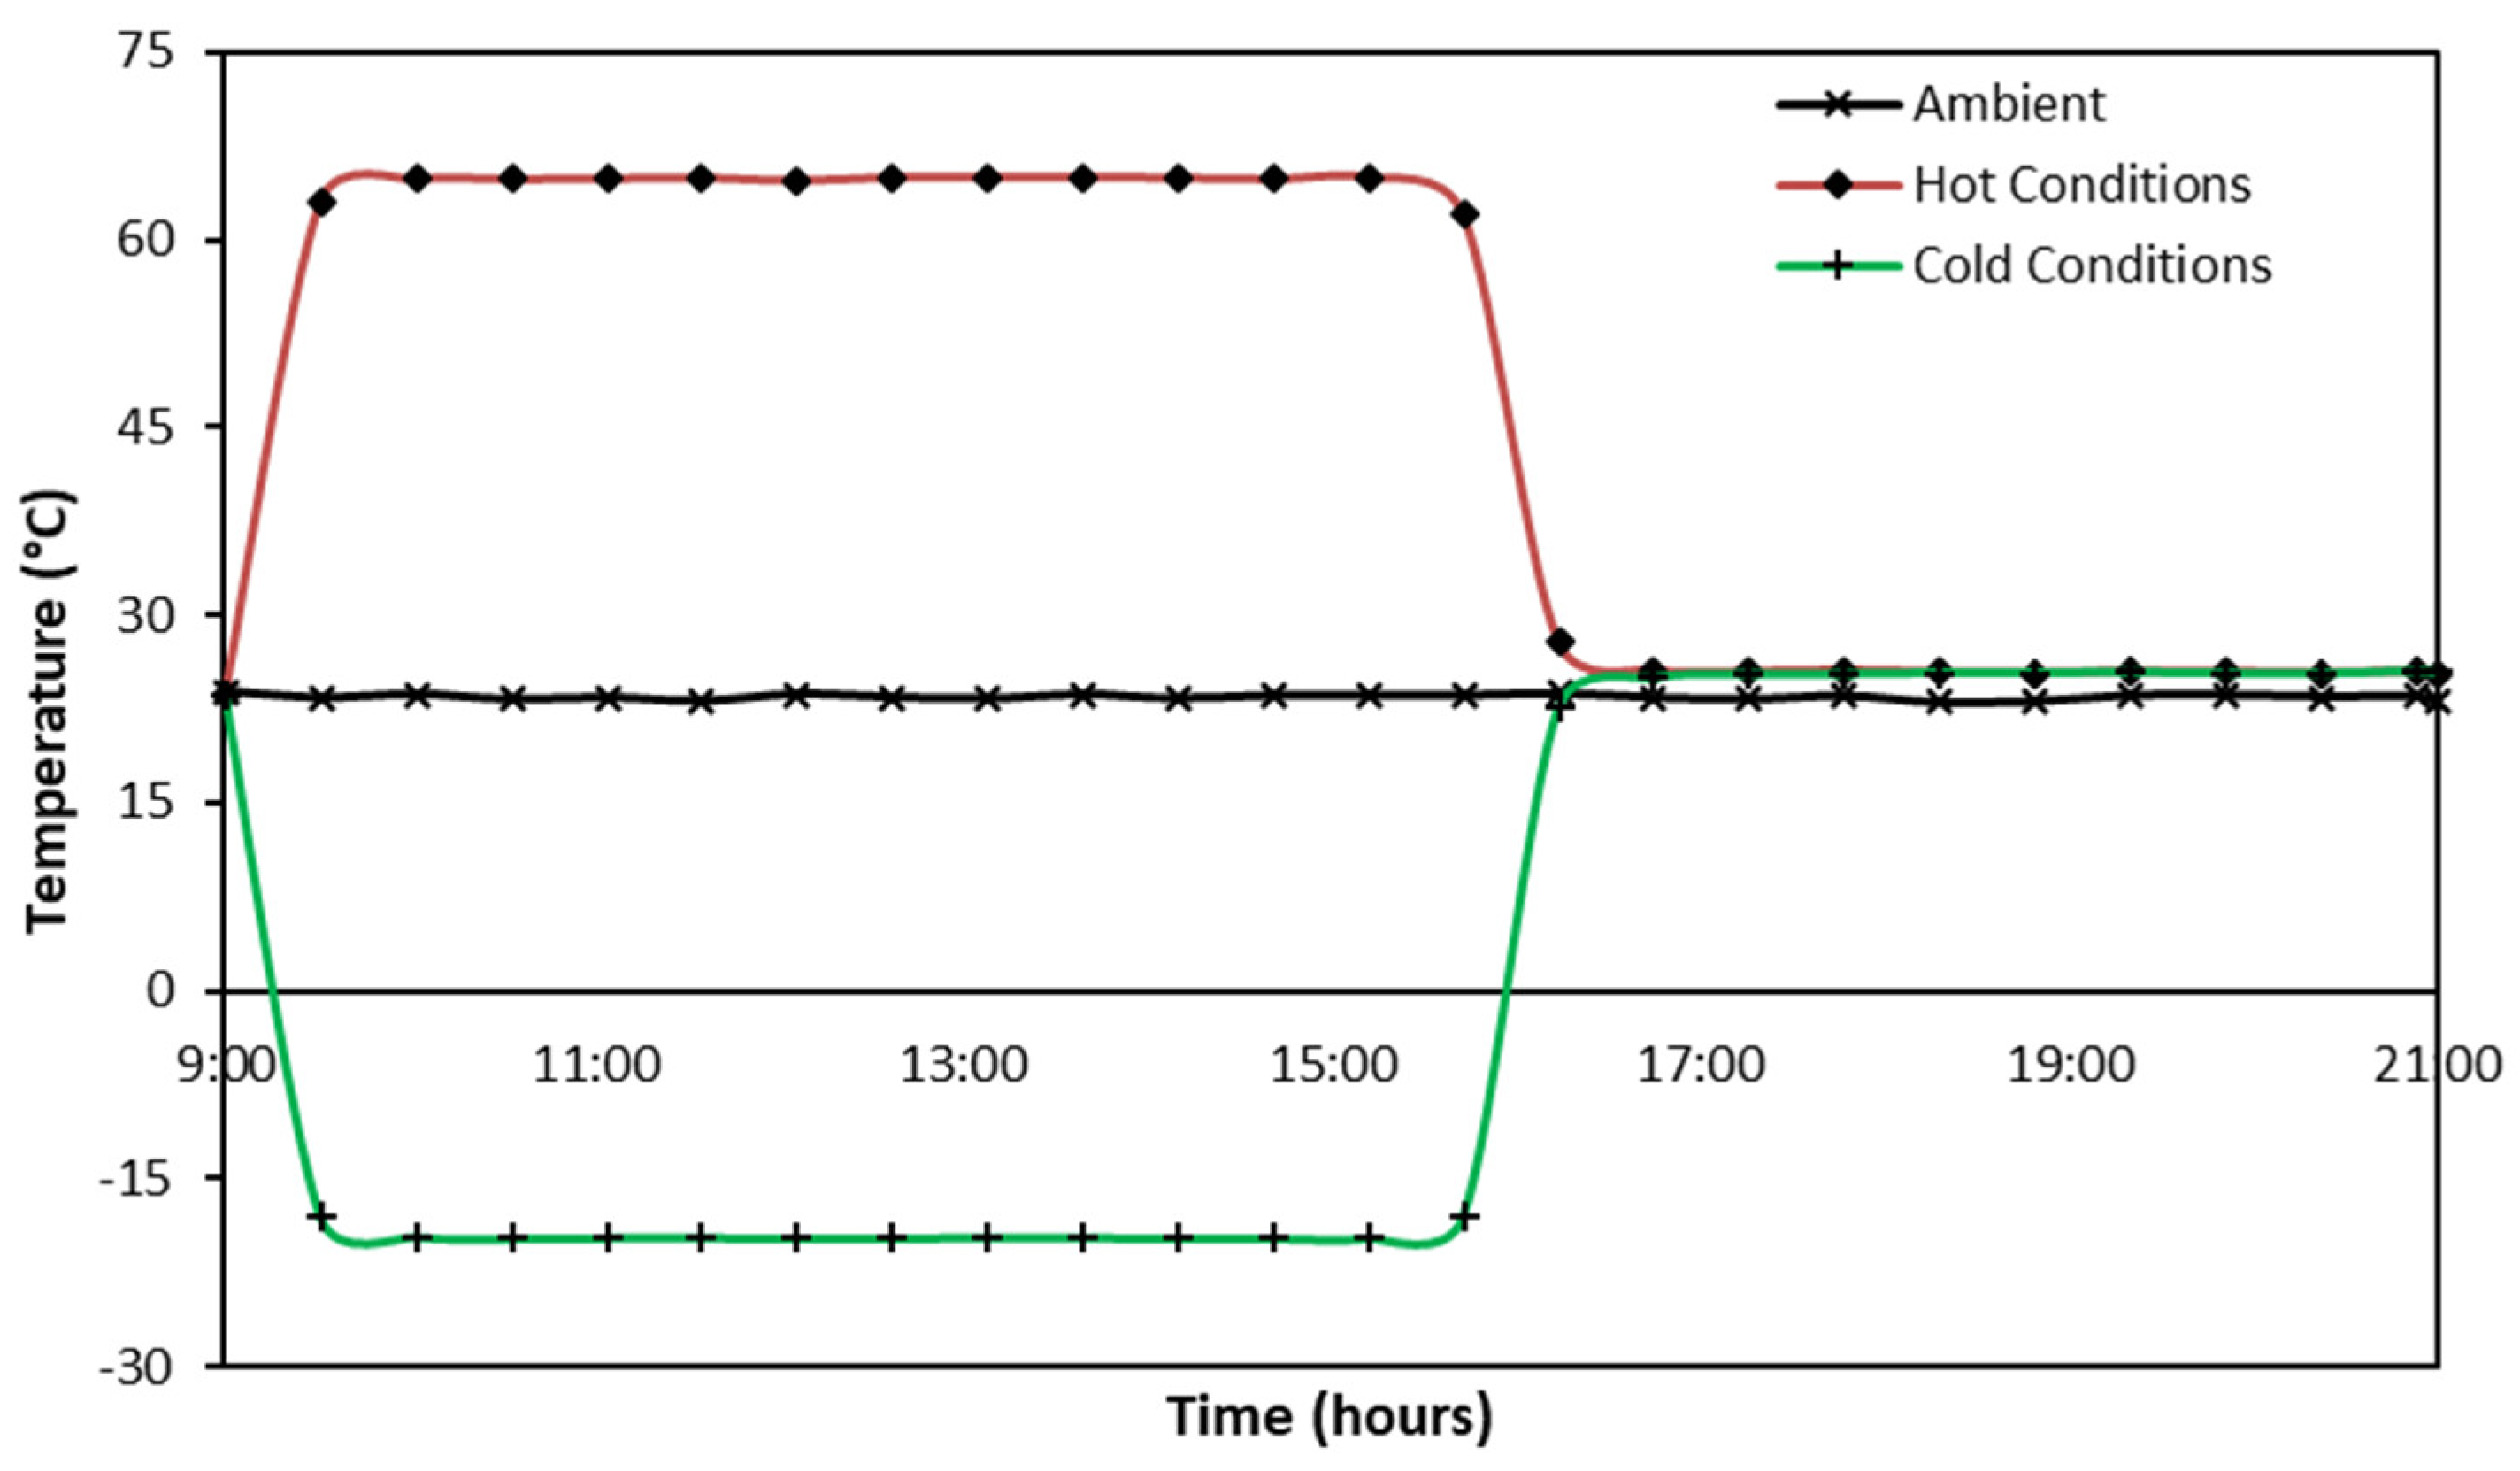
During this testing, temperature inside the thermal chamber was maintained at 65 °C for 7 h. Through several trials, it was confirmed that the surface temperature of the material exposed inside the chamber reach steady state even before 7 h. After 7 h, the temperature was reduced to 25 °C for next 5 h. Selection of this temperature was not arbitrary, rather it was based on previous observation in which front surface temperature of the concrete rose up to 58 °C during summer in United Arab Emirates (UAE) [
22]. Conditions inside the oven were adjusted at higher than this temperature so that front surface temperature of this range can be achieved, and heat transmission characteristics of different materials can be compared by mimicking real environmental conditions of the UAE. During the experiments, all temperatures were recorded with a time interval of one minute. Temperatures inside the thermal chamber and indoor space are shown in
Figure 2 (red line for heating experiment profile and black line for the ambient).
2.2.2. Cold Climatic Conditions
During this testing, temperature inside the thermal chamber was maintained at −20 °C for 7 h and then dropped to 25 °C for next 5 h. All temperatures were recorded with a time interval of one minute. Applied temperature profiles for this step are also represented in
Figure 2 (green line for cooling temperature profile and black line for the ambient).
2.2.3. Energy Analysis
The amount of heat transfer between the back surface of the samples and the indoor air is calculated based on convective heat transfer. The amount of radiative heat transfer is neglected because the temperature difference between the surface temperature and ambient is low which governs the heat transfer of very small magnitude compared to the convection. Furthermore, a correlation for convective heat transfer coefficient (
hc) was used given as (1) which is calculated on the basis of full-scale enclosure with input temperature difference across the building components similar to the current research [
23].
where Δ
T corresponds to the difference in the surface temperature and temperature of ambient air. For a single convective transfer coefficient value, average temperatures for the back surfaces of all compositions at the steady state and average indoor temperature were taken which produced the value of
hc to be 3.74 W m
−2 K
−1. The amount of heat transferred in the hot climatic conditions or heat lost in the cold climatic conditions are calculated using (2).
where
Ts is the back surface temperature,
T∞ is the ambient temperature,
A is the surface area of the cube and
hc is the convective heat transfer coefficient.
3. Experimental Results
Experimental results of different temperature profiles caused by different insulation materials on the front and back surface of concrete cubes are presented in the following sections. The temperature curves are very close to each other and hence it is difficult to distinguish performance. For clarity, only steady state results are plotted in figures (
Figure 3,
Figure 4,
Figure 5 and
Figure 6) with reduced
y-axis values. The steady state temperatures for all configuration of the test duration are summarized in
Table 2 for quick overview. Energy analysis is also carried out for clear understanding of the reader and presented in the results.
3.1. Thermal Performance in Hot Climatic Conditions
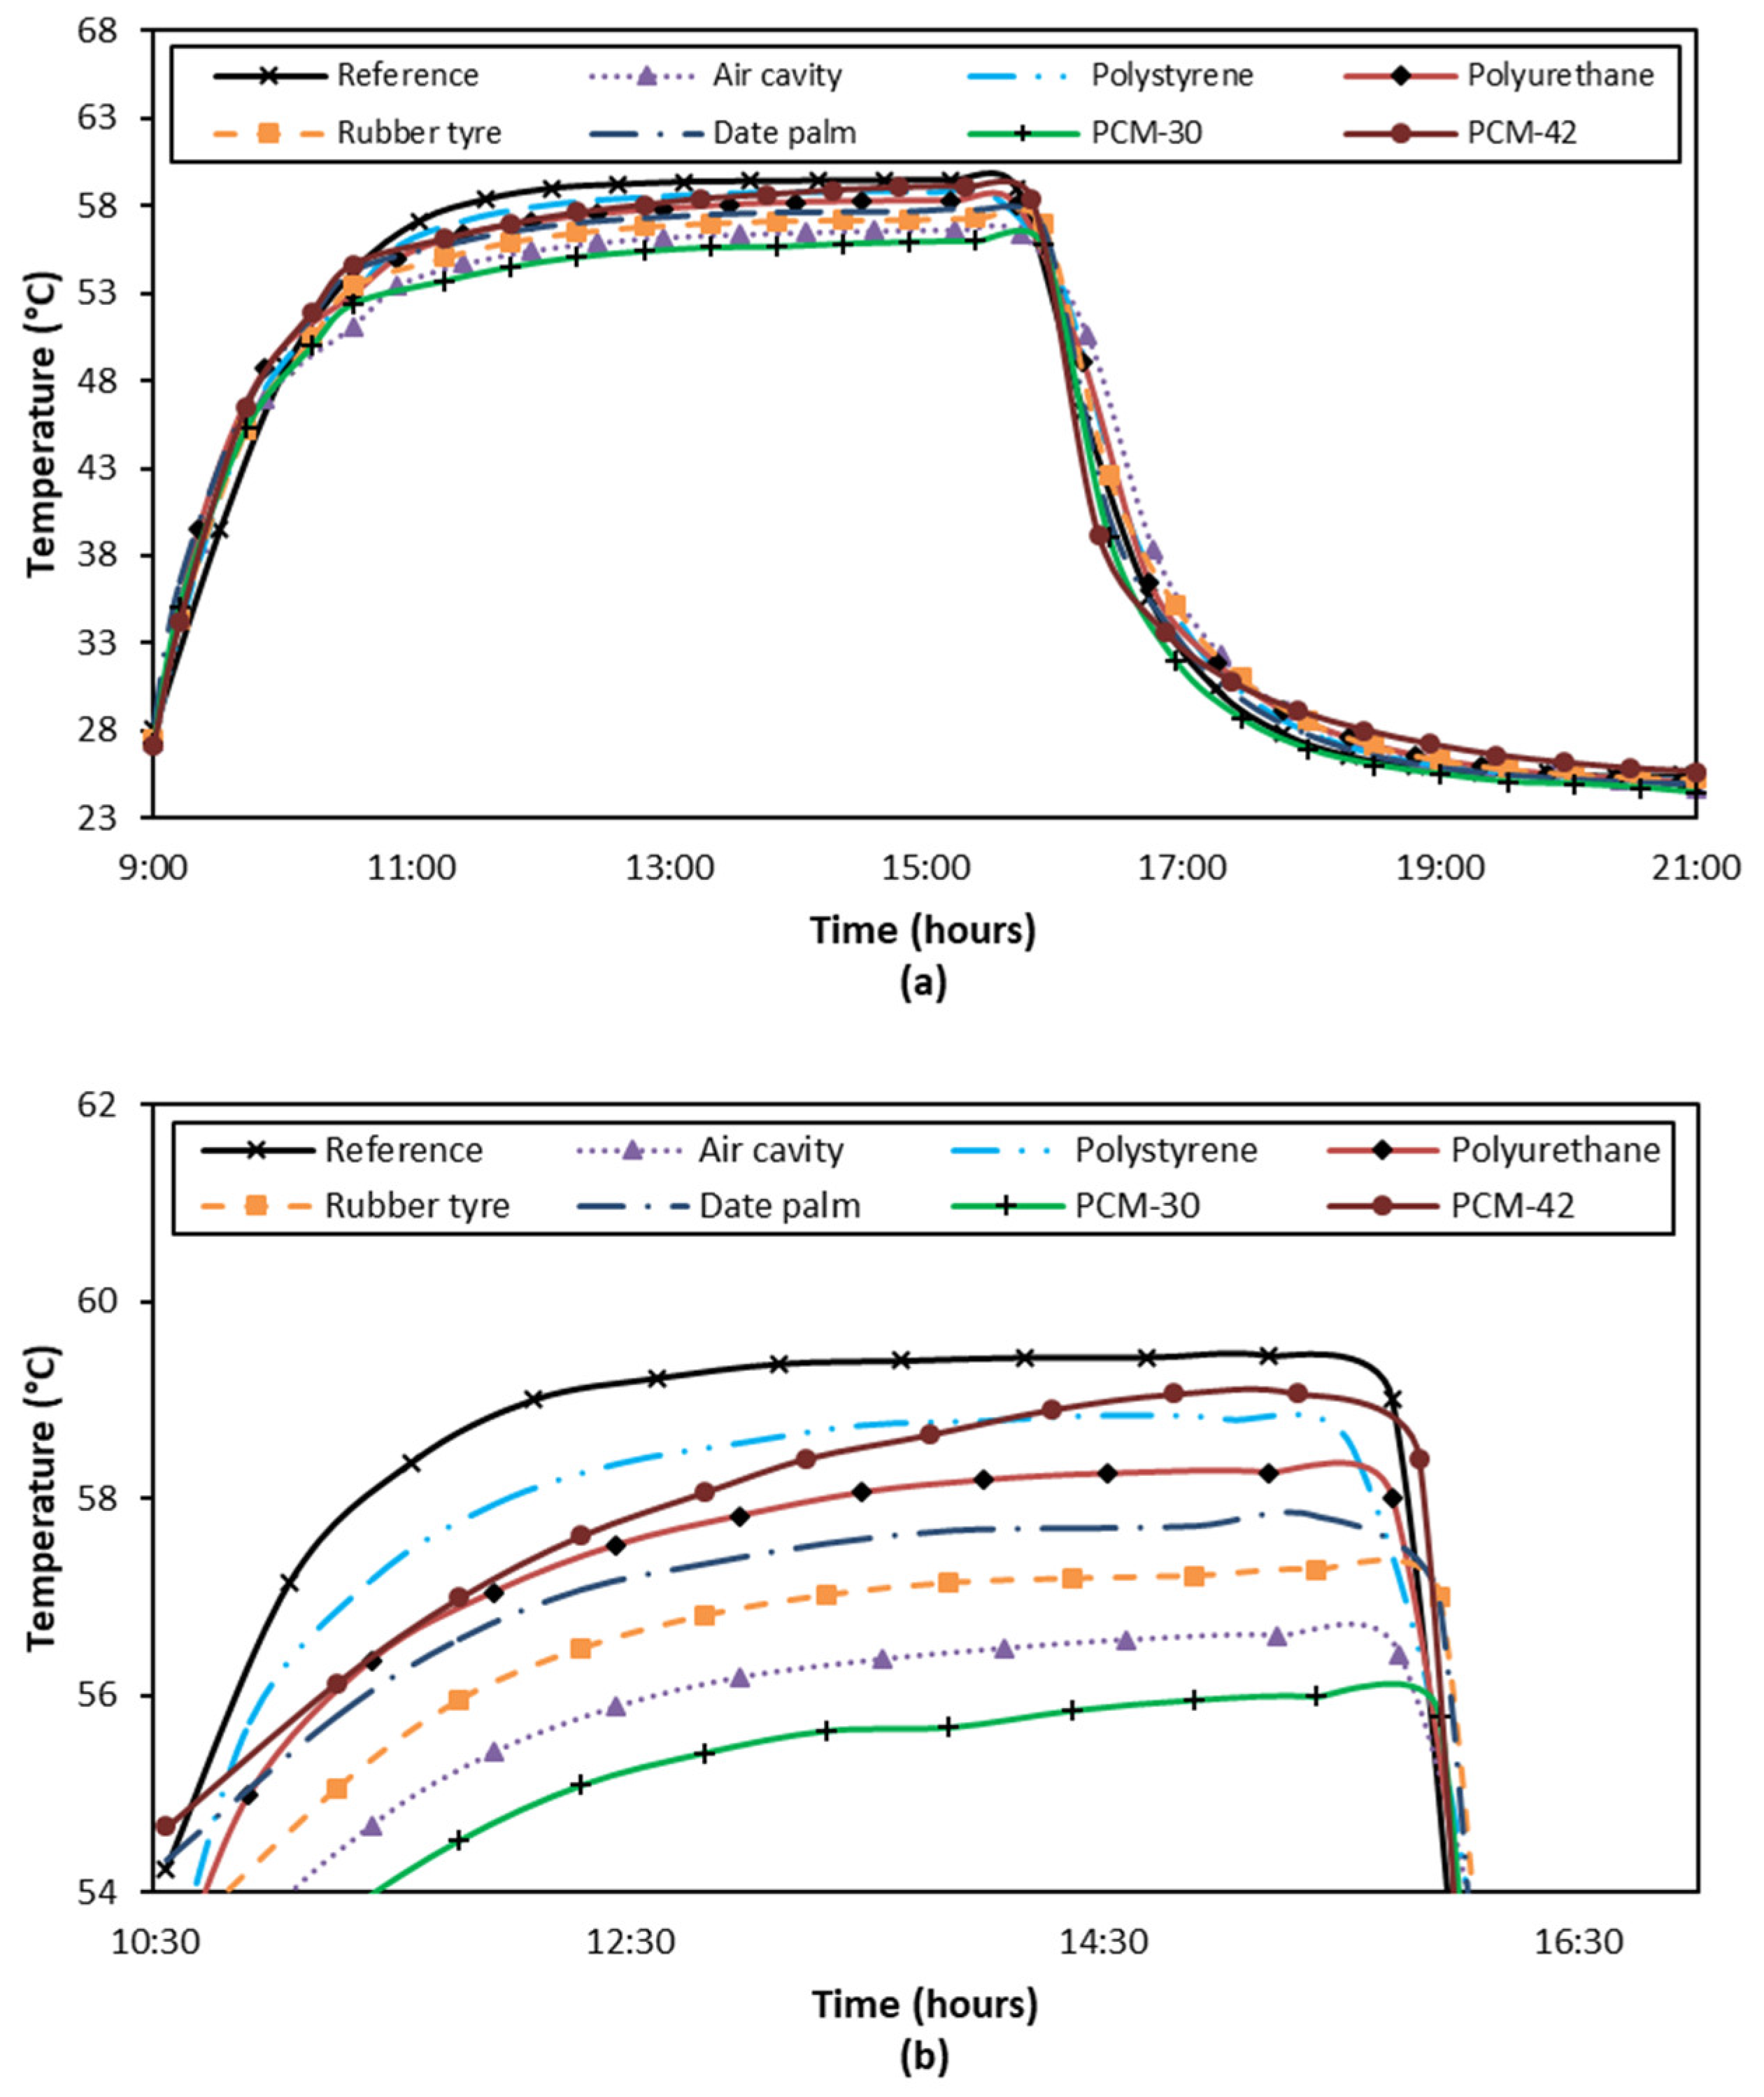
Figure 3 represents the temperature profiles for the front surface during experimentation of hot climatic conditions.
Figure 3a represents temperature curves from the start to end while only a range of temperatures from 53 °C to 60 °C is plotted in
Figure 3b to visualize the difference in temperatures at the steady state. For the front surface, steady state was achieved at 59.4 °C at the maximum for the reference concrete while it was 56.1 °C for the case of PCM-30. All other compositions attained steady state in between these two peaks. The difference of the steady state peaks is 3.3 °C which can influence energy saving in hot climates.
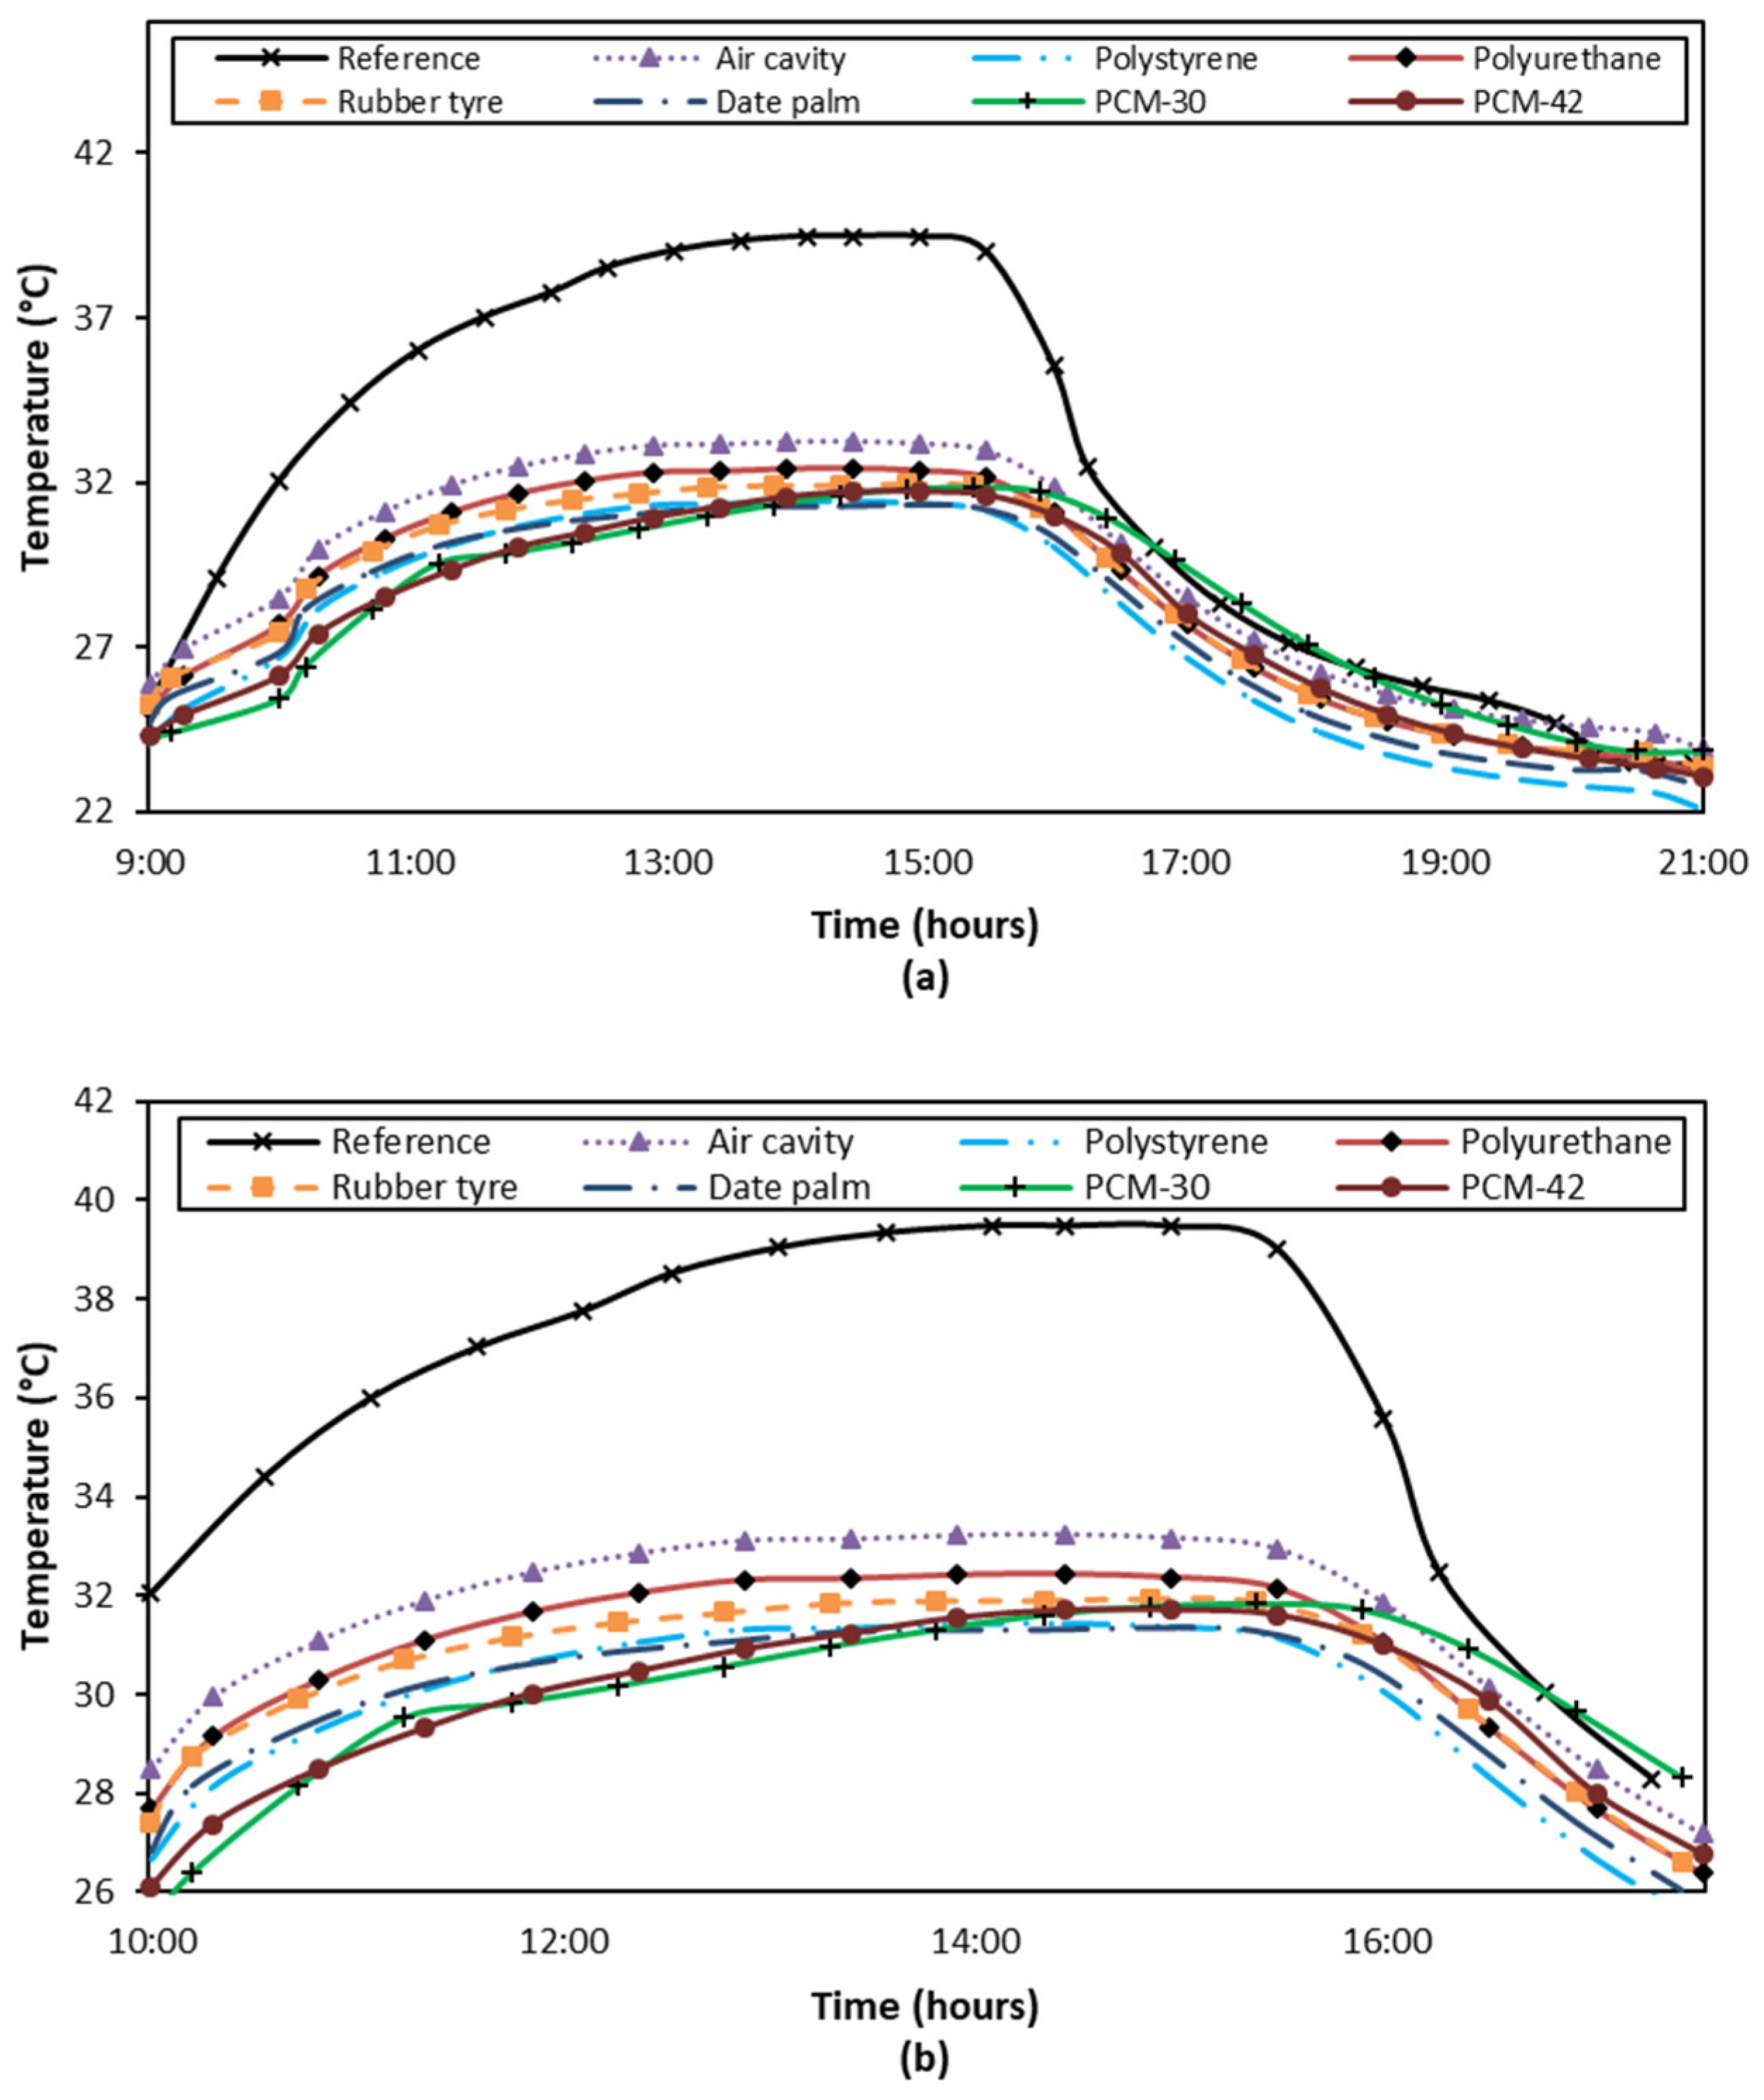
The difference of back surface temperature for all compositions was significant with respect to the reference sample as represented in
Figure 4. At the back surface, reference concrete achieved steady state at 39.5 °C. It was 33.2 °C for air cavity which is obvious that K-value of air is very low compared with concrete. Other reason is that in the case of a solid concrete cube, heat transmission was due to conduction while through air, convection and radiation is dominant mode of heat transfer. Among all materials, back surface temperature remained lower for the case of PCM-30 for the longer time. It is due to the melting of PCM in the range of 27 °C to 33 °C. In the case of PCM-42, the material behaved only as a thermal mass and it conducted heat with the sensible rise in temperature. The benefits of latent heat of PCM for energy storage can be exploited if temperature swings across the surfaces are high and enough heat flux is struck on the surface that can melt PCM. It happened only in the case of PCM-30 because temperature rose to that level and the curve for PCM-30 stayed in its melting range for approximately 2 h. In earlier studies, application of phase change material and polystyrene foam (as conventional insulation material) in the form of multilayered wall was investigated in the hot climatic conditions of UAE. The research reported a temperature drop of 8.5% at the maximum at the indoor space and shifted off the peak by 2.6 h with the overall energy benefits of 44% reduction in heat gain [
22]. Recently, PCM as an insulation contained in the aluminum frame was stacked on the inner surfaces of a room and the thickness of the PCM was varied to test its effect on the energy performance [
24]. Through the investigations, a temperature drop of 3.32 °C in the indoor air was achieved at the maximum. Simultaneously, the cooling load in the maximum case was lowered by 20.9% using 1cm thick PCM layers in all walls and roofs for the peak hour [
24]. A similar study was conducted in the central United States exploiting PCM to reduce heat flux to indoor space. On average, the peak heat flux was delayed by 1.5 h and the magnitude of the heat flux was decreased by 38.5% at the maximum [
25].
Steady state temperatures for back surface of all materials are summarized in
Table 2. The current research investigated that all materials have the potential to drop back surface temperature. A temperature drop of 8.2 °C was achieved at the maximum using date palm as an insulation material between two halves of the geopolymer concrete.
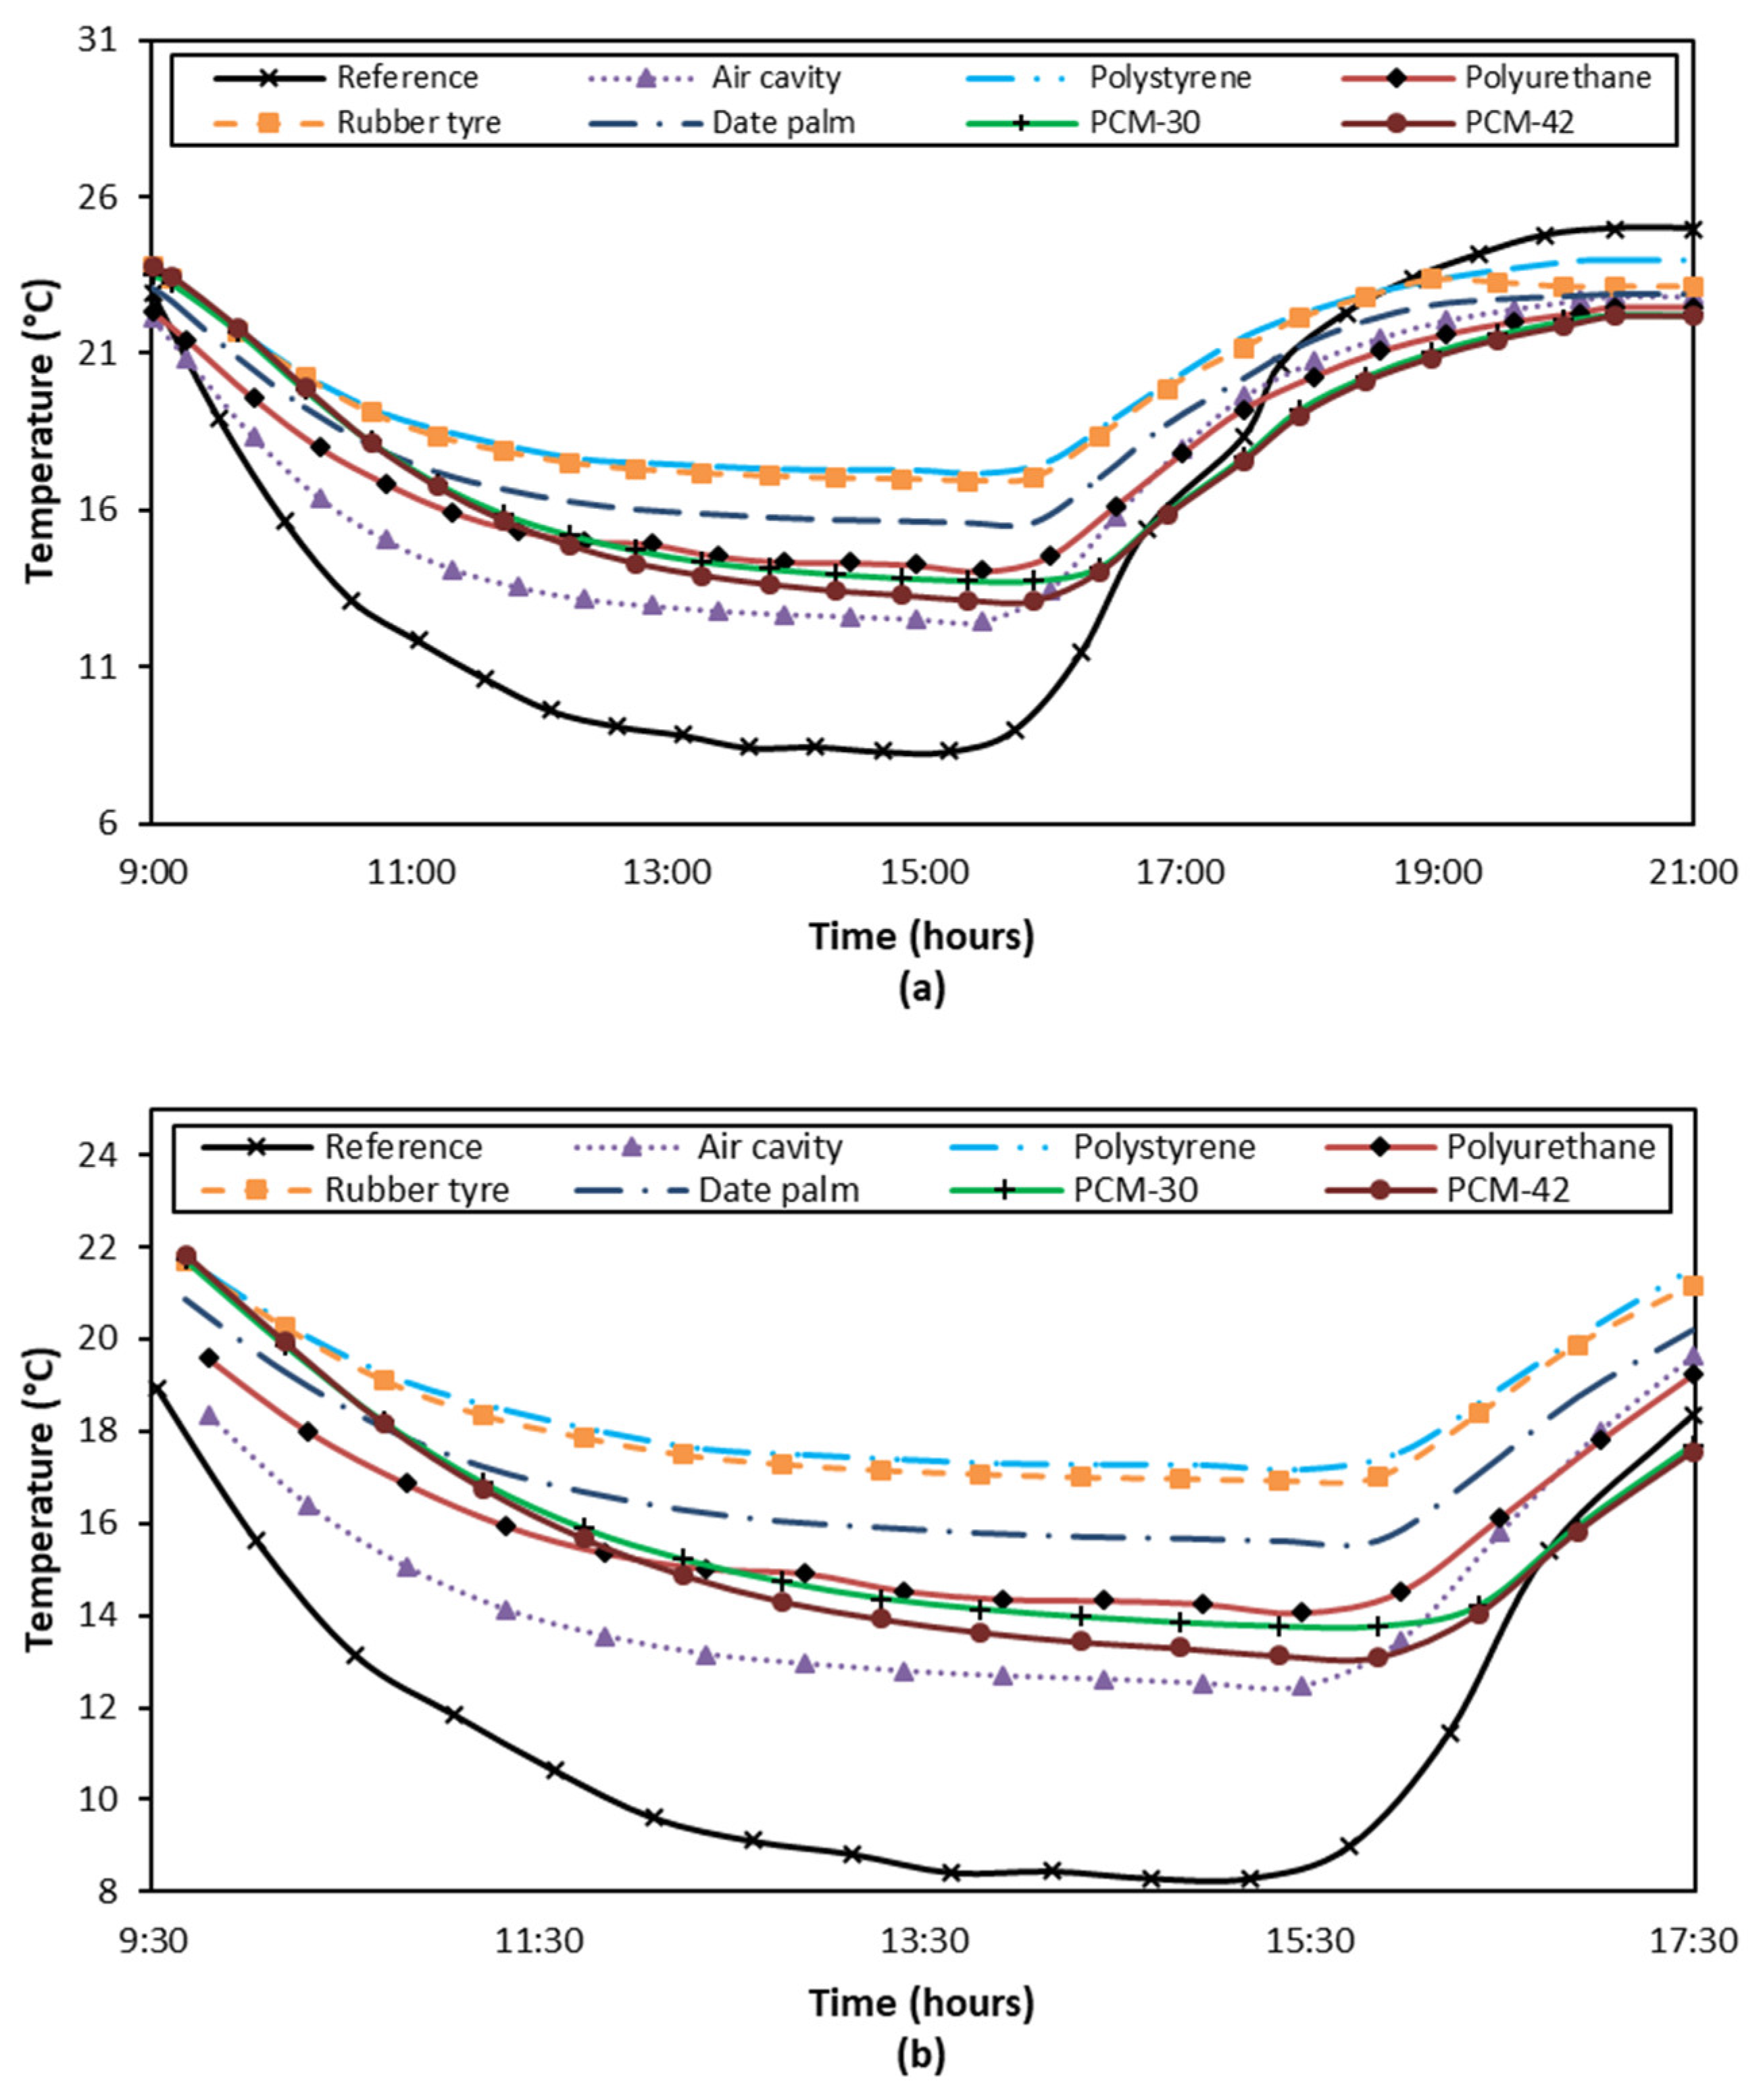
3.2. Thermal Performance in Cold Climatic Conditions
Difference in the steady state temperature was observed after exposing all samples to the extreme cold conditions, as represented in
Figure 5. It was the lowest for the reference case at the value of −13.3 °C while all other materials including air cavity exhibited increase in front surface temperature. Other than the reference, the steady state temperature for front surfaces stayed in the range of −10.5 °C to −12.4 °C.
Performance of the insulation materials was significant at the back surface of the samples as shown in
Figure 6. Reference geopolymer concrete cube attained its steady state at 8.3 °C which is 4.1 °C lower than the least performing insulation material (i.e., air). Expanded polystyrene foam performed excellent among all materials and reached to the steady state temperature at the back surface at 17.2 °C. Insulation effect of almost same level was achieved using rubber tire which attained its steady state at 16.9 °C. Similarly, polyurethane foam, PCM-30 and PCM-42 increased the back surface steady state temperatures by the values of 5.8, 5.5 and 4.8 °C compared to the reference respectively. In a similar study, Šimko et al. proposed insulation panels embedded with water circulation pipes for existing and new construction for dual functions of the configuration (space heating and thermal barrier to reduce heat flow outside from indoor). During the operation phase of space heating, the proposed design reduced heat capacity by 50% compared to the system when pipes are embedded in concrete rather than insulation and reduced the heat capacity by 63% compared to the design when pipes are arranged under the surface [
26].
Steady state temperatures for front and back surfaces during testing of hot and cold climatic conditions are summarized in
Table 2 for succinct overview.
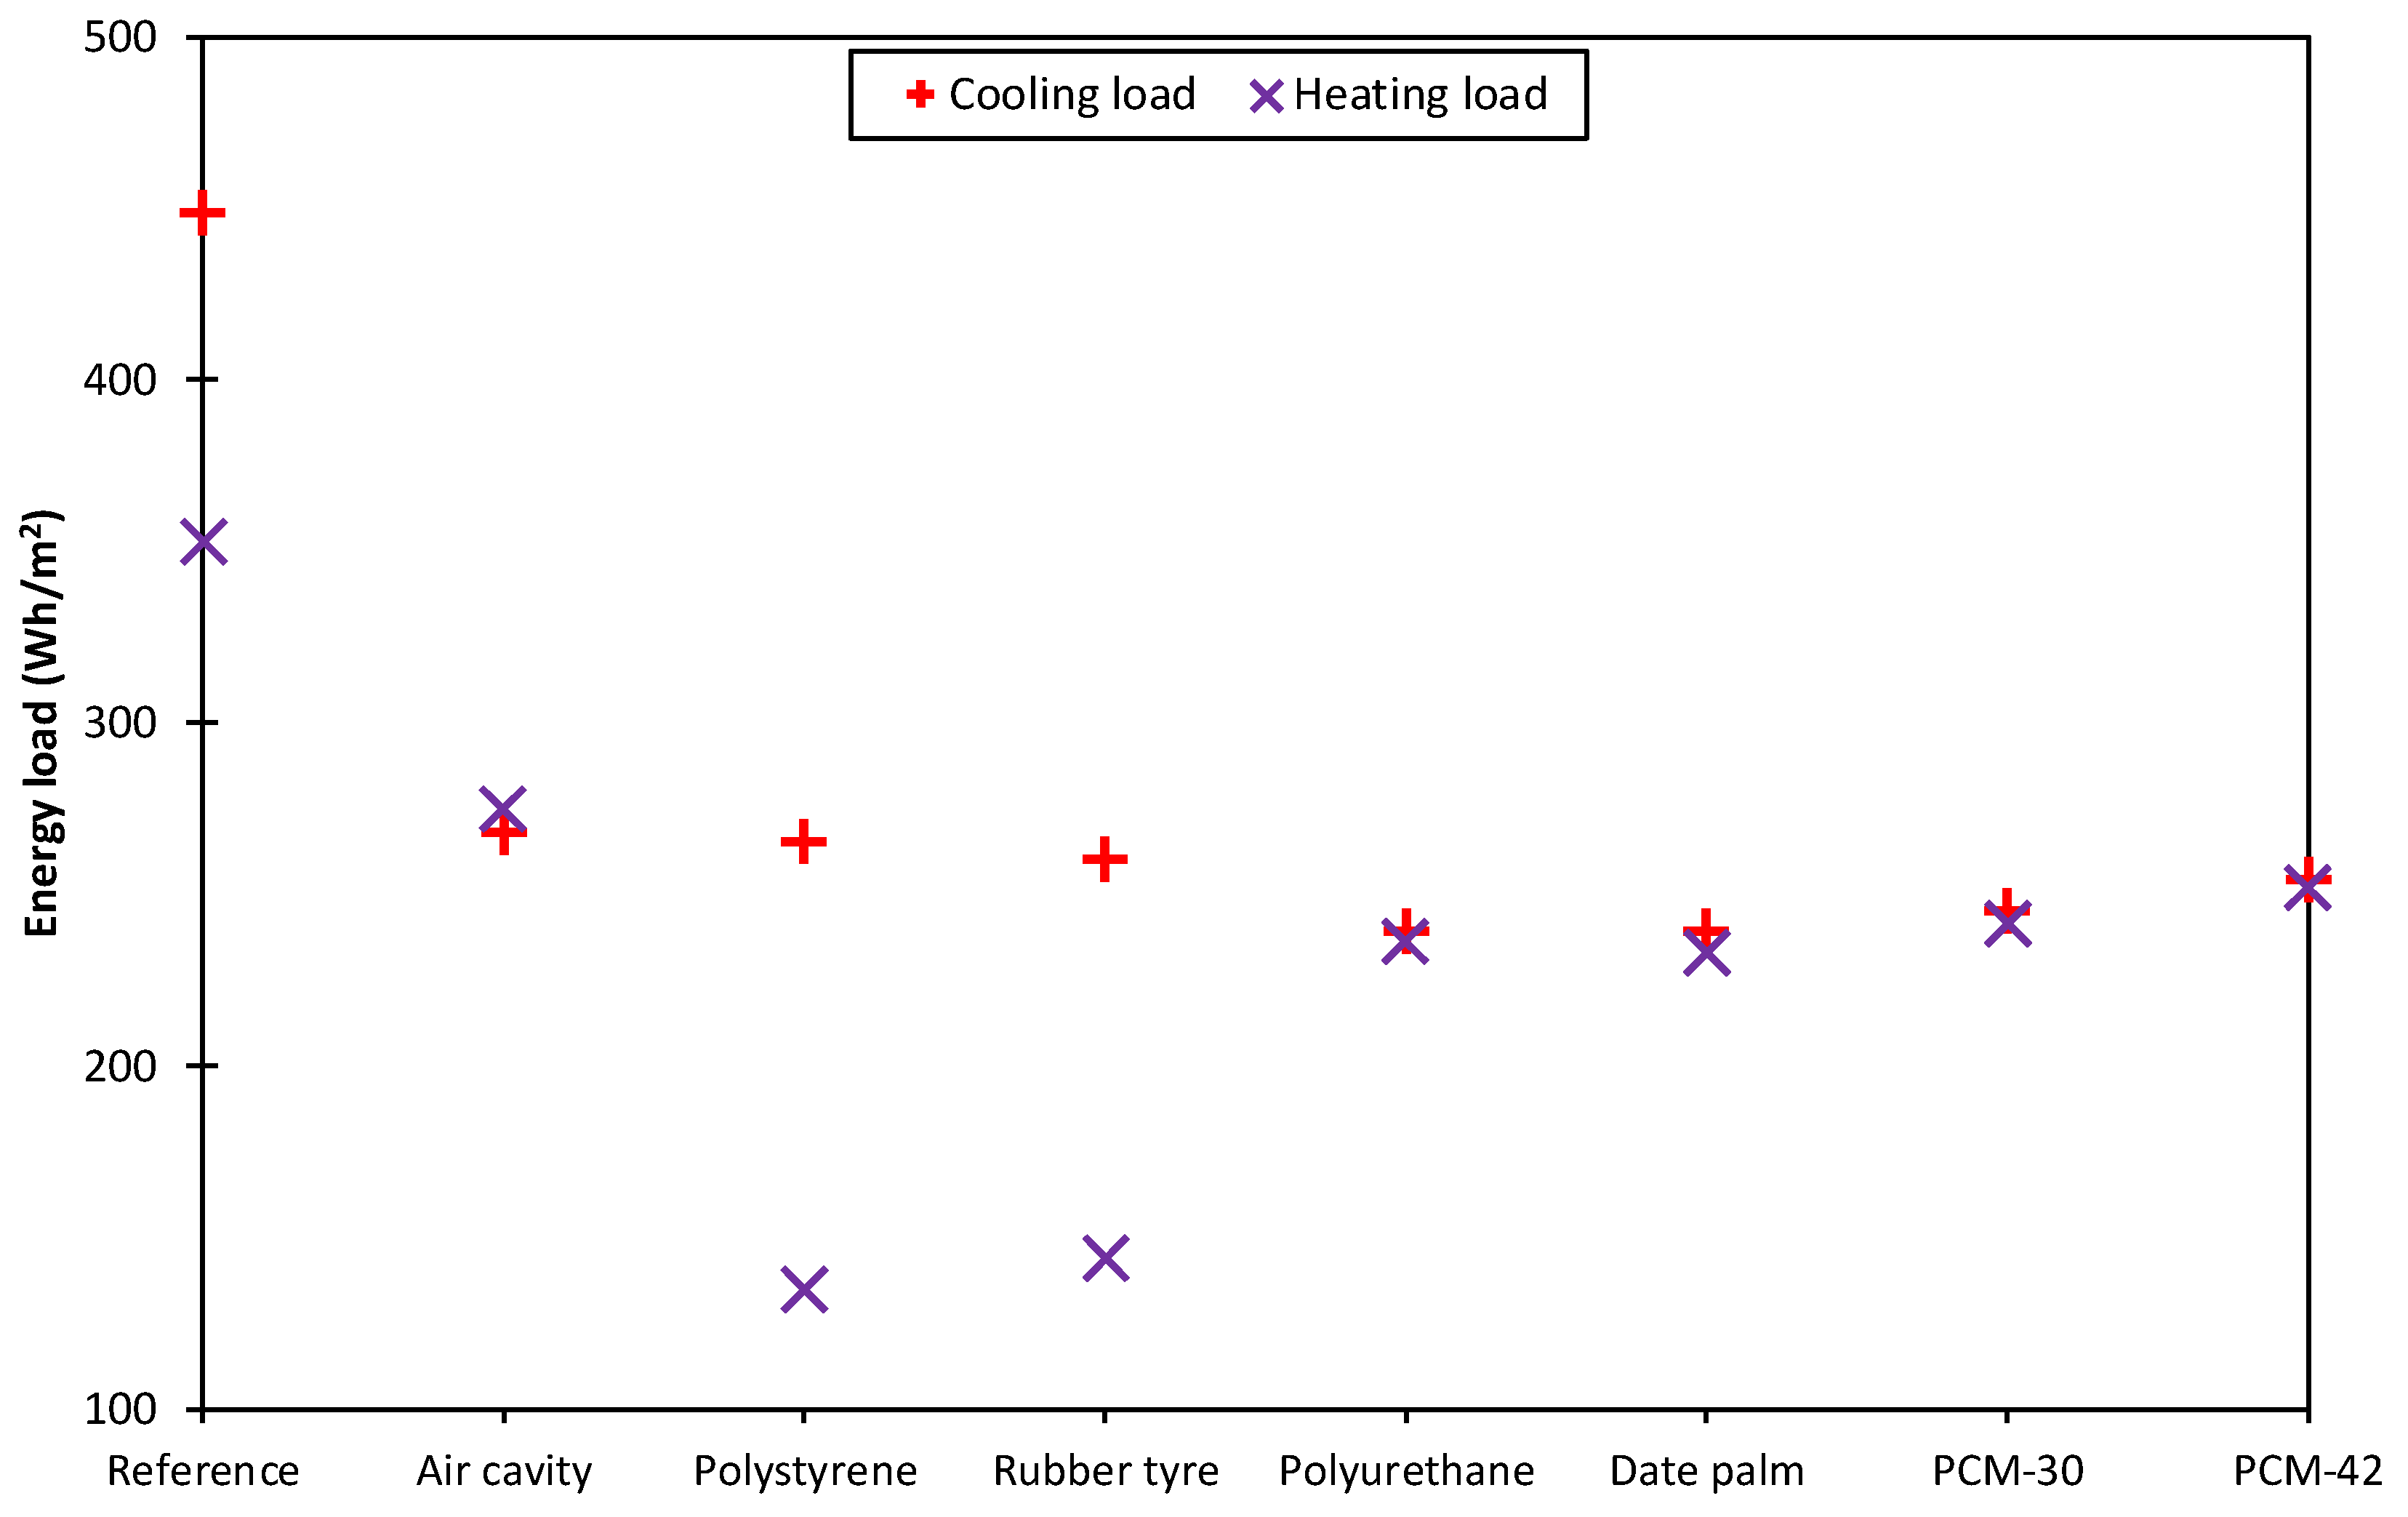
3.3. Energy Analysis
Figure 7 shows heating/cooling load in cold and hot climatic conditions calculated using (2) for the 12-h time duration of the experiments similar to the energy calculation of cooling load reduction by Hasan et al. [
22]. Air cavity and expanded polystyrene foam layers were used as a benchmark and the results revealed that other waste materials (rubber tire, date palm) or industrial by-products (polyurethane foam, paraffins) have comparable thermal performance to the traditional insulation materials (polystyrene). In hot conditions, the amount of heat transferred from the back surface to the indoor ambient through convection is 448.6 Wh m
−2 which is too high as compared to other materials. For all sandwich geometries imbedded with insulations, the amount of heat was in the range of 239.4 Wh m
−2 to 267.9 Wh m
−2.
In cold conditions, the amount of heat transferred from the indoor air to the cold chamber was 353.1 Wh m−2 for the reference cube. However, it was very low for other materials being 134.8 Wh m−2 as the minimum for expanded polystyrene foam and 144.1 Wh m−2 for rubber tire. For remaining materials, the amount of heat was in the range of 233 Wh m−2 to 274.8 Wh m−2.
The energy saving performance of materials is the reduction in cooling/heating load by using insulation materials as compared to the reference geopolymer concrete cube. In hot climatic conditions, the peak energy saving is achieved in the case of polyurethane foam and date palm with the value of 46.6% each as shown in
Figure 8. Using PCM-30, cooling load can be reduced with the magnitude of 45.4%. Interestingly, all materials can save cooling load above 40% in comparison to the reference. In cold conditions, expanded polystyrene foam and rubber tire contributed the most in energy saving resulting in drops in heating load by 61.8% and 59.2% respectively. Energy saving in the case of all other materials was in the range of 22.2% for air to 34% for date palm as represented in
Figure 8.
The energy saving calculation are carried out for 12 h of the experiments. It is predicted that more benefits can be harvested in real practice because the materials will save energy for 24 h rather than 12 h. Furthermore, the reported values are for 1 m2 surface area of inside wall while in practice, the surface area of buildings is much larger.
4. Conclusions
In this research, thermal performance of different waste materials and by products of industrial processes is investigated experimentally. A solid geopolymer concrete block was considered as a reference to compare the heat transfer and energy saving. In other geometries, central 2.5 cm thickness of the block was replaced with waste materials (air cavity, expanded polystyrene foam, polyurethane foam, rubber tire, date palm, PCM-30 and PCM-42). Heat transmission across the thickness concluded that waste materials can be used as vertical thermal barrier in walls in extreme hot and cold conditions. The maximum impact of these thermal insulation in terms of energy saving is 59.2% in the case of rubber tire for 12 h of experiment duration. Furthermore, the materials can be effectively utilized in opposite extreme weather conditions (extreme cold and extreme hot). The research shed light on the potential of effective utilization of waste material and to reduce indoor air-conditioning demand in the extreme climatic conditions. It is recommended that these waste materials and industrial by-products be used for building insulation. This research covers a few of the several scenarios which buildings experience in real circumstances due to diurnal, seasonal, and geographical variations. Modeling will be used in future work to incorporate all the influential factors to quantify the energy performance of the buildings by using waste materials as insulations.


