1. Introduction
The energy markets of the whole world are influenced by increasing energy production from renewable sources (electricity, heating, and cooling). Distributed generation is favored by people concerned about climate change and the increasing consumer demand for electricity. A good option for consumers to protect themselves against changes in energy prices is to invest in on-site distributed generation for energy self-consumption. Also, distributed generation offers the opportunity to sell surplus power to other consumers. The lowering of capital costs for small-scale power plants increases the feasibility and attractiveness of this option. The combined heat and power (CHP) plants have many benefits in this context. The CHP is flexible, has low gas emissions and provides a rapid response to energy needs. Competition on liberalized power markets creates incentives that lead to more efficient decisions in the operation of power systems and the investments in energy sources.
The electricity must be generated at the moment of demand. Currently, at the level of the power system, the quantities of electricity that can be stored are insignificant compared to the power. Thus, most electricity transactions take place before the time of delivery.
The ability to forecast prices on the power market is important for energy producers in long-term strategic planning [
1,
2,
3]. In reference [
4], the authors analyze the interaction between the green certificate prices, the carbon dioxide emission price, and the electricity prices in Nord Pool Spot. A detailed description of an electricity national market, such as the case of Croatia, can be found in [
5]. The liberalization of the national electricity markets in the European Union (EU) has the ultimate goal of integrating these markets into a pan-European network. There are already several regions in the EU whose electricity markets are coupled by price [
6,
7].
Lately, changes in the power markets offers various opportunities to increase revenues for the cogeneration producers. Programming the operation of the combined heat and power (CHP) plants can be achieved with the help of operating strategies depending on the potential incomes from the power markets. The decision to allocate the quantities of electricity on the electricity markets should be taken on after a detailed analysis of the operating regimes for each cogeneration plant. Different approaches to the participation of the CHP plants in the energy markets can be found in works [
8,
9,
10,
11,
12,
13]. There are several publications that take various aspects into consideration (low operation cost, reduction of fuel consumption, low carbon dioxide emission) and therefore algorithms for economic dispatching of CHP are proposed [
14,
15,
16,
17,
18]. A model for economic assessment of virtual power plants using the scenario methodology is presented in [
19].
The economic feasibility of a cogeneration project for a university campus is presented in [
20]. The results highlight the economic and environmental viability of the cogeneration project. Reference [
21] investigates the effect of electricity price, natural gas price, and taxation on the profitability of cogeneration plants.
In references [
22,
23], the situation of cogeneration in the EU and in the Nordic Area is analyzed in terms of electricity and gas prices estimates. The importance of support schemes to minimize the risk of investments in cogeneration is highlighted.
The paper [
24] presents an analysis of the residential heating systems in terms of the equivalent annual costs and the electricity price variation. The heating technologies with low carbon emissions are important options in this analysis. In reference [
25], a cogeneration system versus natural gas steam boiler is analyzed.
The need of small cogeneration producers to adapt their trading behavior to changes in competitive electricity markets is the motivation of this paper. An algorithm for determining the operating strategies of the CHP plants is proposed in this paper. The quantities of electricity to be bidding on the liberalized electricity markets are determined by this algorithm. The operating strategies are based on the generated electricity in high efficiency cogeneration and the correlated prices of heat and electricity for the CHP plant to be operated profitably. This approach is the main contribution of this paper compared to the optimization algorithms that already exist in the literature. The algorithm proposed is used to determine the total costs and revenue according to the operating strategies of the CHP plant. The proposed methodology was applied in the case of a biomass CHP plant with organic Rankine cycle (ORC). The nominal technical specifications of the CHP are: electrical output of 1278 kWe and a heat output of 5380 kWth. The CHP plant became operational in the year 2015 and benefits from the green certificates support scheme for electricity generated in high efficiency cogeneration and from renewable sources. Based on the proposed algorithm, an optimization problem has been formulated in this case and the minimum value of the useful heat demand for which the operation of the CHP plant is profitably has been identified.
The paper is structured as follows.
Section 2 presents a brief description of the liberalized power markets in Romania.
Section 3 presents the used methodology.
Section 4 presents a case study for a biomass CHP plant with Organic Rankine Cycle. Finally, the conclusions of this paper are summarized in
Section 5.
2. A Brief Description of the Liberalized Power Markets in Romania
Electricity trading between market participants is performing on the following specific markets [
26,
27,
28]: The centralized market for electricity bilateral contracts (CMBC); The day-ahead market (DAM); The intra-day market (IDM); The balancing market (BM); The ancillary services market (ASM); The capacity allocation market (CAM); green certificates market (GCM). Small producers can trade the electricity generated mainly in the first three markets, namely: CMBC, DAM, and IDM.
The CMBC works as a market where participants may propose contracts containing their own delivery graphs, delivery periods (more than a month), hourly power levels and contractual conditions. The electricity bilateral contracts are traded individually between market players. The trading mechanisms used are extended auctions and continuous negotiation. These allow competition and the interaction between buyers and sellers. The bilateral contract includes all aspects of the sale and purchase of electricity. The main advantage of the CMBC is the long-term price stability (during the term of validity of the contract).
The DAM is a spot market where the transactions take place the day before the day of delivery. The main purpose of the DAM is to achieve a balance between the quantities of electricity already traded on the bilateral contract market and the next day’s consumption forecast. The transactions are independent for each time interval of the delivery day. The closing price of the market is determined by the supply and demand of electricity on each trading time interval.
The IDM is the last component of the wholesale electricity market where transactions can be made before the physical delivery of electricity. The technical availability of the generating units, the consumption forecast, and the quantities of electricity already traded are taken into account to minimize the operational risks. Minimizing the balancing costs is the main purpose of participating in this market. The transactions in the IDM take place after the DAM closure, up to two hours before the physical delivery of electricity. The market participant must register as a party responsible for balancing or associate with a party in charge of balancing who already exists. The main purpose of short-term transactions is to enable market participants to adjust their contracting portfolio almost in real time. The electricity producers can adjust their planned production, and suppliers can increase or decrease the amount of electricity they buy. Intraday traders always face inherent risks that exist in the stock markets. The price volatility is the main risk of short-term markets.
Figure 1 shows the main moments of electricity trading for the three components of the wholesale electricity market as compared to the delivery day.
Transactions of electricity can be achieved in the short or long term. The electricity is delivered the same day or the next day in the case of short-term transactions. The long-term transactions have a longer delivery time, usually between one month and one year, and the physical delivery of electricity begins at a later date of the trading day.
Currently, there is a trend towards a single European electricity market by price coupling of regions for the day ahead market. Starting in 2014, the DAM of Romania is coupling with the DAM of Czech Republic, Slovakia, and Hungary through a price coupling mechanism.
Figure 2 shows the monthly average values of electricity price and market share for CMBC, DAM, and IDM in 2017.
The majority of the electricity quantities are traded on the CMBC and the DAM. The IDM has a lower participation at present. The deviations from the programmed values of electricity production and consumption are then offset on the balancing market. The balancing costs are significant and should be avoided.
The trading principles and the particularities of the electricity markets must be understood for avoiding market risks by the participants. The main advantage of long-term transactions is to hedge market participants against short term prices in the liberalized contest.
In Romania, the generation of electricity from renewable energy sources is supported by the green certificates system and mandatory annual quotas. The green certificates (GC) can be traded separately from renewable electricity. The green certificates are traded between the electricity producers from renewable sources and the electricity suppliers.
The process of liberalization of the electricity markets in Romania was accompanied by the creation of new pricing mechanisms for trading electricity. The DAM represents the component of the wholesale electricity market on which competition is best manifested.
3. Cost Allocation and Estimation of Market Prices for the CHP Plant
3.1. Algorithm for Determining the Operating Strategies of the CHP Plant
There are different cost allocation methods for a cogeneration plant [
29,
30,
31,
32,
33]. The main difference between the different methods used is the allocation of fuel consumption for the production of electricity and respectively of heat in cogeneration. Cost allocation must consider the demand conditions of the two utilities generated at the same time in cogeneration. The heat and electricity prices must ensure the profitability and competitiveness of the cogeneration plant compared to other production options.
The annual revenues of a cogeneration plant must cover the production costs but also the desired benefit (profit). The total costs
TC of the cogeneration plant can be expressed with the equation:
where
FC are fixed annual costs: costs for depreciation of investments, personnel costs, operating and maintenance costs, taxes, and fees;
VC (H, E) are variable annual costs that are dependent on the heat and electricity production of the cogeneration plant: especially fuel costs, costs of accidental outages, variable start-up costs.
The fuel costs have the largest share in total annual costs. However, applying a cost allocation method to a cogeneration plant is an energy policy decision. Thus, for a cogeneration plant, regardless of the technology used, one can write the following equation between production costs and possible annual incomes:
where
b is the minimum desired benefit (%);
pE is the price of the delivered electricity (EUR/kWh),
pH is the price of the delivered heat (EUR/kWh);
E is the delivered electricity (kWh);
H is delivered heat (kWh);
B are bonuses/incomes from support schemes.
Equation (2) represents the equation of a straight line in
pE and
pH coordinates. In
Figure 3 the following notations were used:
pE and
pH are the current prices that can be practiced by the electricity and heat producer;
pE0 and
pH0 are the expected prices on the electricity and heat markets;
pEMax is the maximum electricity price when
pH = 0 and
pHMax is the maximum heat price when
pE = 0.
The configuration of the cogeneration units varies significantly from site to site. Accordingly, the components of variable cost, as well as the magnitude of each component, are site-specific depending upon the respective configuration. The fuel costs are one of the largest components of variable cost.
The minimum correlated prices below which the heat and electricity producer cannot sell without reducing its profit or/and production costs result from Equation (2):
where
C is the heat to power ratio (
C = E/
H).
The heat and electricity producer can sell at lower prices than those in the market, provided that the price intersection (pE and pH) is inside the ABC triangle. In this case, the heat and electricity producer can fully cover its production costs and can achieve a higher profit or at least equal to the proposed profit. The intersection of the pE0 and pH0 lines should always be above the straight line between pEMax and pHMax. Otherwise, either the production costs are too high, or the producer has set out to achieve an excessively high profit.
The bonuses come from support schemes for sustaining the production of electricity from renewable energy sources and/or cogeneration. In Romania, the support scheme for the production of renewable electricity started in 2008. The support scheme in operation through green certificates and mandatory annual quotas has been adopted. The number of green certificates depends on the type of technology used. The electricity production from biomass is supported by two green certificates for each MW delivered to the public network. Also, the electricity production in high efficiency cogeneration is additionally supported by a green certificate. The high efficiency cogeneration (HEC) is based on useful heat demand and primary energy saving (PES) compared to alternative options of separate production [
34,
35]:
The quality factor
QF considers options for the separate production of electricity and heat and can be defined as [
36]:
where
ηe,CHP is the electricity efficiency of the CHP plant;
ηh,CHP is the heat efficiency of the CHP plant;
ηe,Ref is the reference value of electricity efficiency;
ηh,Ref is the reference value of heat efficiency;
ploss is the network loss correction factor.
In reference [
37], the reference values for the separate production of heat and electricity that have been reviewed for application after 1 January 2016 are found.
The minimum value of the quality factor for which the electricity production fulfills the requirements of high efficiency cogeneration is QFmin = 111.112. This corresponds to the primary energy saving of 10%.
If the quality factor determined with Equation (6) does not respect the minimum condition, the recalculated values of electrical and thermal efficiency that meet
QFmin are:
where
β is the reduction factor of power for the condensing steam turbine and extraction outlet (
β = 0 if the cogeneration unit does not have extraction steam outlet).
The production of electricity considered in high efficiency cogeneration:
where
H is the useful heat and
Cech is the power to heat equivalent ratio:
Based on the above, an algorithm has been proposed for establishing the operating strategies of the cogeneration unit (
Figure 4). The economic opportunity costs and revenues are the basis for setting the operating strategies of the CHP plant. It is important to distinguish between the technical potential of cogeneration and its economic and financial potential. An operational strategy is economically viable if the total costs are less than the possible revenues.
The amount of electricity traded on the bilateral contracts market is set according to the demand for useful heat. This quantity will ensure the long-term economic operation of the CHP plant and protecting the heat and electricity producer against price variations on spot markets. The amount of available electricity will be traded on the DAM. The costs due to accidental shutdowns of the CHP plant may be reduced by purchasing electricity on the IDM in the delivery day. Thus, the costs due to the imbalance between the electricity production and the one scheduled on the delivery day can be significantly reduced.
3.2. Optimization Problem Formulation
The objective function is formulated to maximize the profit of the cogeneration plant operation in the new conditions of the power market:
The algorithm proposed in
Figure 4 is used to determine the total costs and revenue according to the operating strategies of the CHP plant. The quantities of electricity to be bidding on the different components of the power market (CMBC, DAM and IDM) are determined by this algorithm. The generated electricity in high efficiency cogeneration and technical possibilities of the CHP plant are considered. The operating strategy of the CHP plant over a specific trading interval or time period can be accepted only if the possible revenue is higher than the costs. Thus, the possible revenues of the cogeneration plant on the energy markets can be expressed with the equation:
where
pE,CMBCi, pE,DAMi and
pE,IDMi are the electricity prices on CMBC, DAM and IDM in (EUR/kWh);
ECMBCi, EDAMi and
EIDMi are the selling electricity on CMBC, DAM and IDM in (kWh);
pGC is the green certificates price in (EUR/GC);
nGC is the total number of green certificates (GC);
pHi is the delivered heat price in (EUR/kWh);
Hi is the delivered heat in (kWh);
i is the time interval.
The total number of green certificates is as follows:
where
nGC,RES is the number of green certificates allocated depending on the technology used for harnessing renewable energy sources in (GC/MWh);
Edelivered is the delivered electricity to the public network in (MWh);
nGC,HEC is the number of green certificates allocated for electricity generated in high efficiency cogeneration in (GC/MWh);
EHEC is the electricity generated in the high efficiency cogeneration in (MWh);
The total costs from Equation (1) can be expressed in terms of electricity and heat production by the following [
38,
39]:
where
Hi and
Pi are the heat and electrical power output of the cogeneration unit in (kW);
a,
b,
c,
d,
e, and
f are the cost coefficients of CHP unit in (EUR/h) or (EUR/kW/h) or (EUR/kW
2/h), as the case may be;
thi is the operating time of the cogeneration plant in that regime in (hours).
The optimal operation of the CHP unit is determined by fulfilling the following set of constraints:
The optimization problem of CHP plant was defined as a linear mixed-integer problem (MILP), divided into two subproblems: maximizing revenue and minimizing costs. Mathematically, this can be easily solved by classical mathematical techniques. The Excel Solver program was used to solve the optimization problem.
4. Case Study
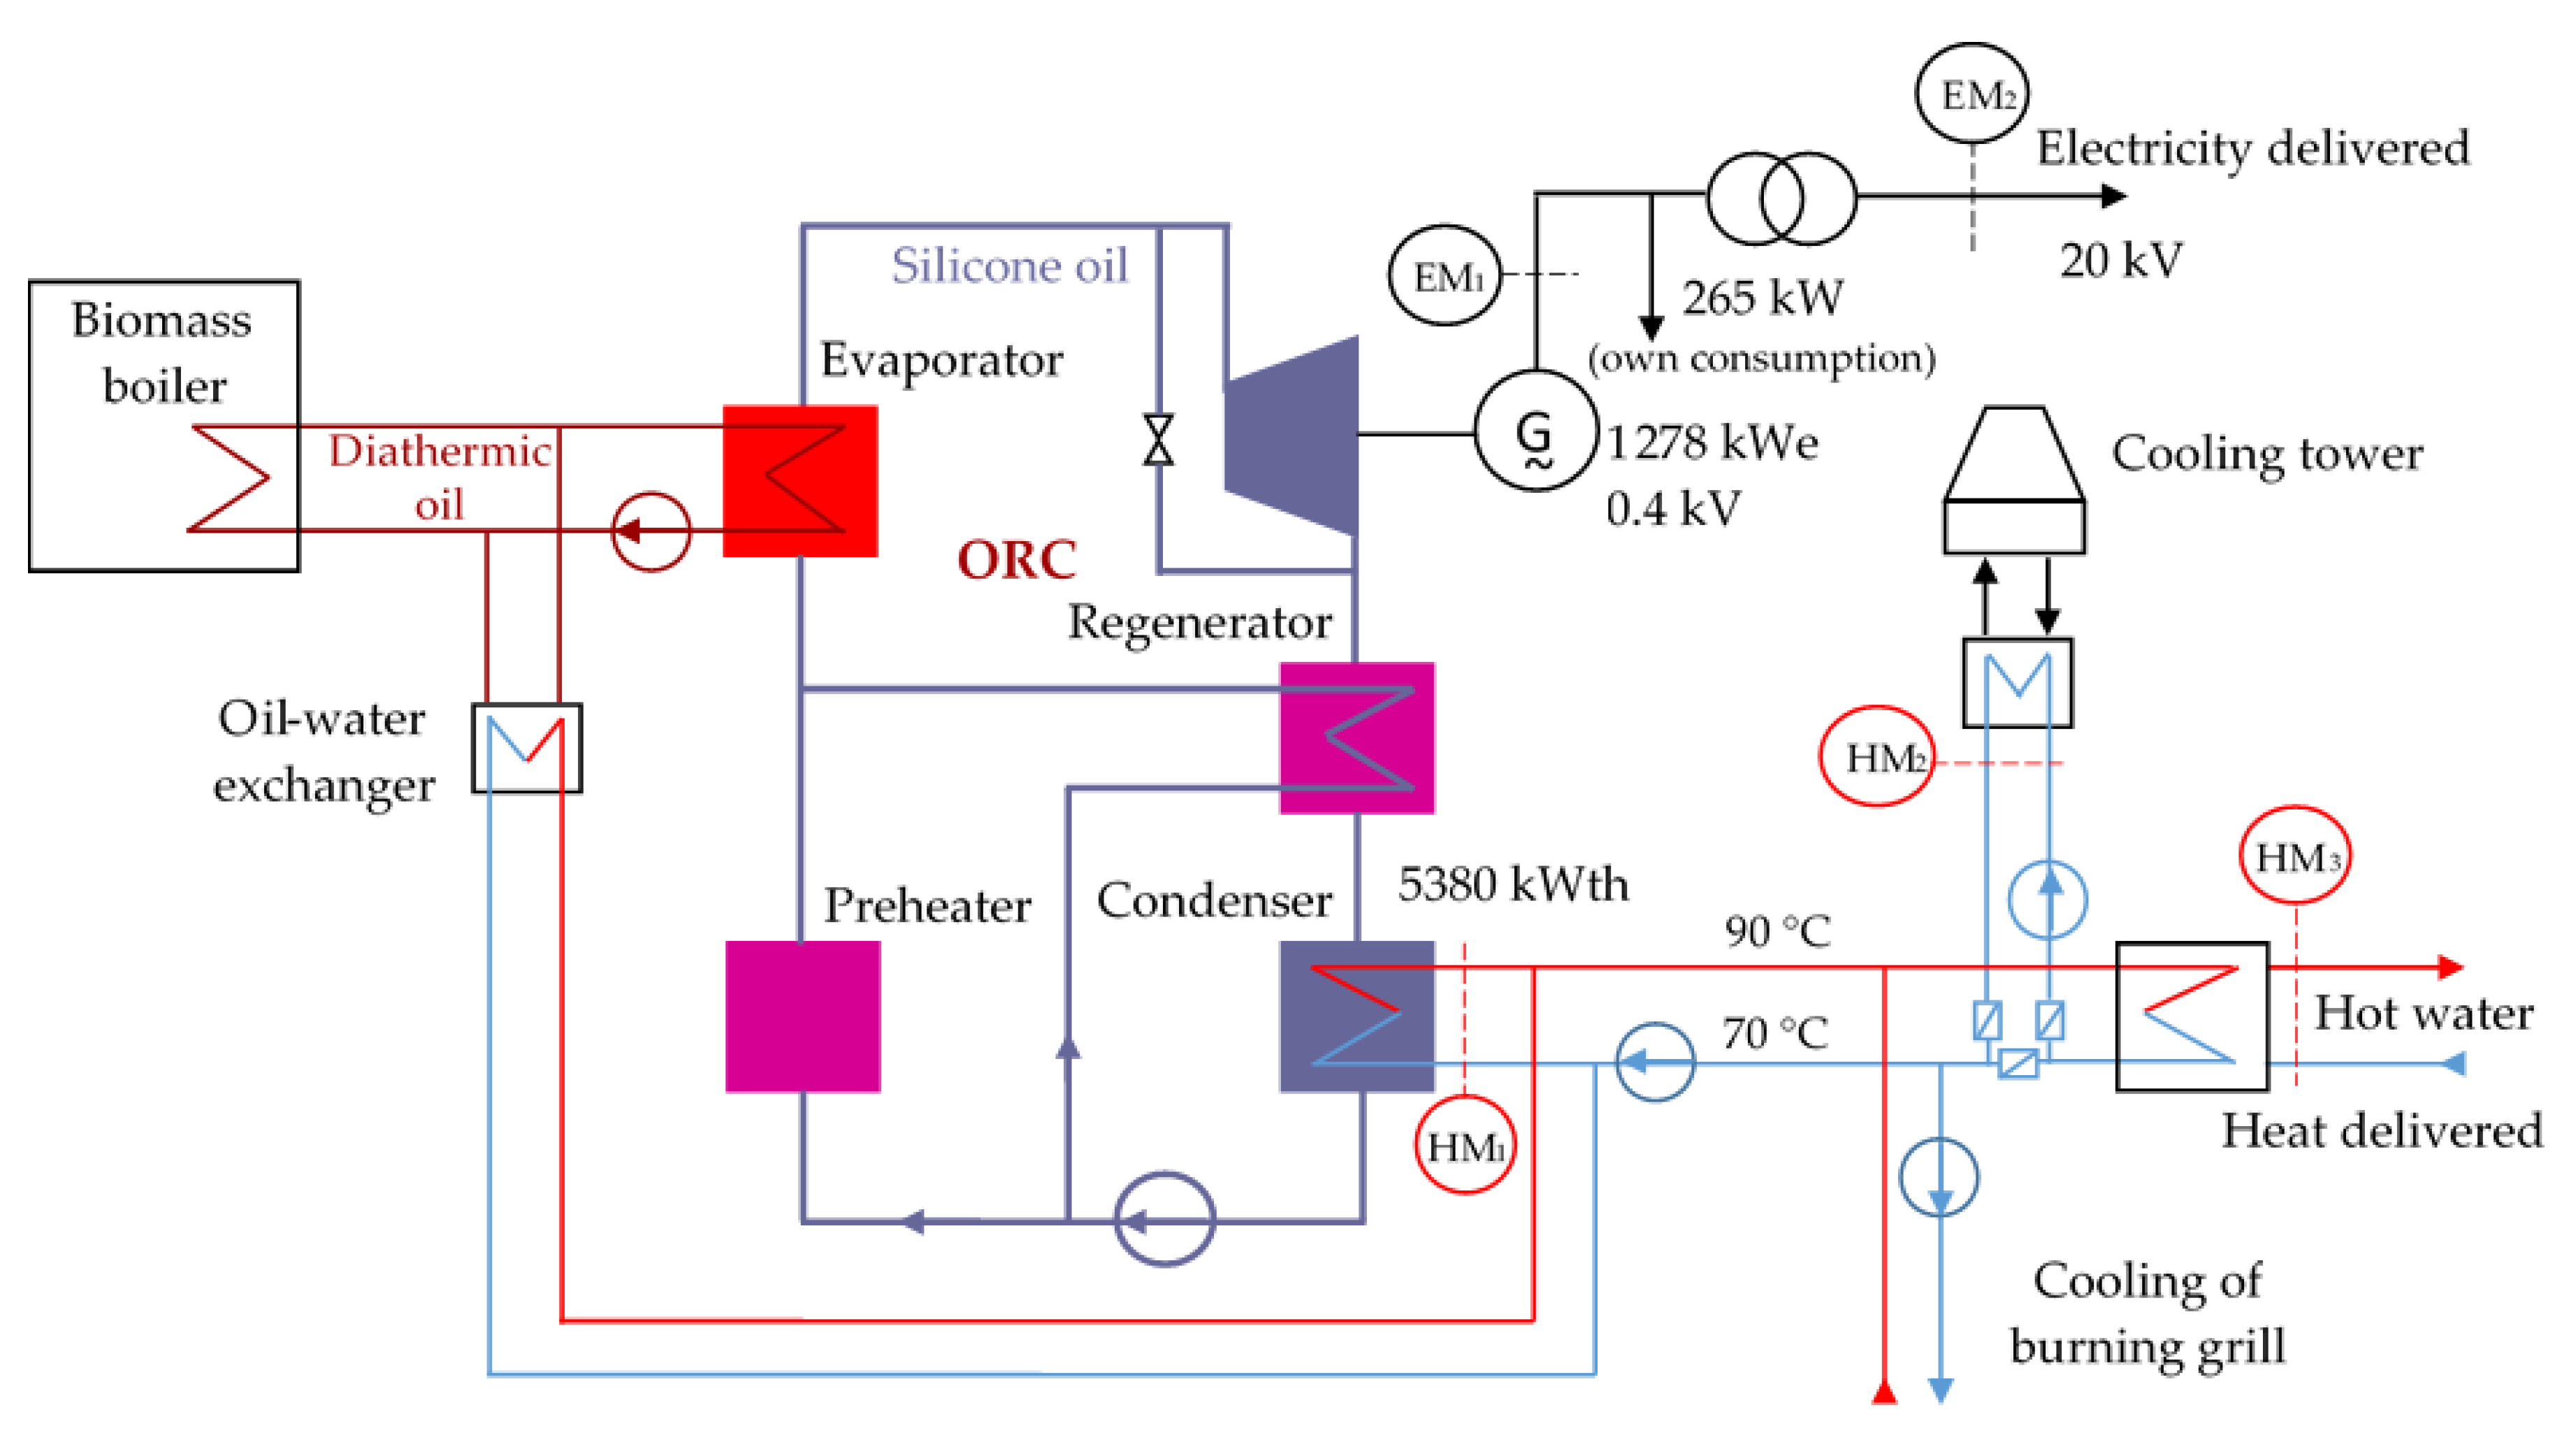
A CHP plant based on Organic Rankine Cycle (ORC) is studied in this section. The CHP plant became operational in the year 2015. The nominal technical specifications of the CHP are: electrical output 1278 kWe and heat output 5380 kWth. The own consumption of electricity is 265 kW. The schematic diagram of the CHP plant is shown in
Figure 5. The CHP plant uses biomass from various sources: wastes from the forestry and related industries (wood chips, wood debris, bark, sawdust); wastes from agriculture (straw, stems, branches, leaves, husks, seeds). The delivered heat by the CHP plant is in the form of hot water at 90 °C. The heat is used for technological purposes in the primary woodworking process.
The heat consumers are powered from the following sources: the ORC condenser (cogeneration regime), the cooling plant of the burning grill and the oil-water heat exchanger (non-cogeneration regime). The useful heat is considered only heat generated in cogeneration regime. The oil-water exchanger is kept warm for safety reasons. This exchanger provides evacuation of the main flow of heat to emergency stops of the cogeneration group. Also, the consumers are supplied with heat in this way in situations where the ORC module is shut down for maintenance. The amounts of heat associated with the non-cogeneration regimes in which the electric generator is disconnected of the public network must be excluded from the amount of useful heat delivered to consumers. In order to identify the useful heat delivered from the CHP plant, the following measurement groups are used: the electricity generated (EM1); the delivered electricity to the public network (EM2); the heat generated by the ORC cogeneration unit (HM1); the heat transferred to the cooling tower (HM2), and the heat delivered to consumers (HM3).
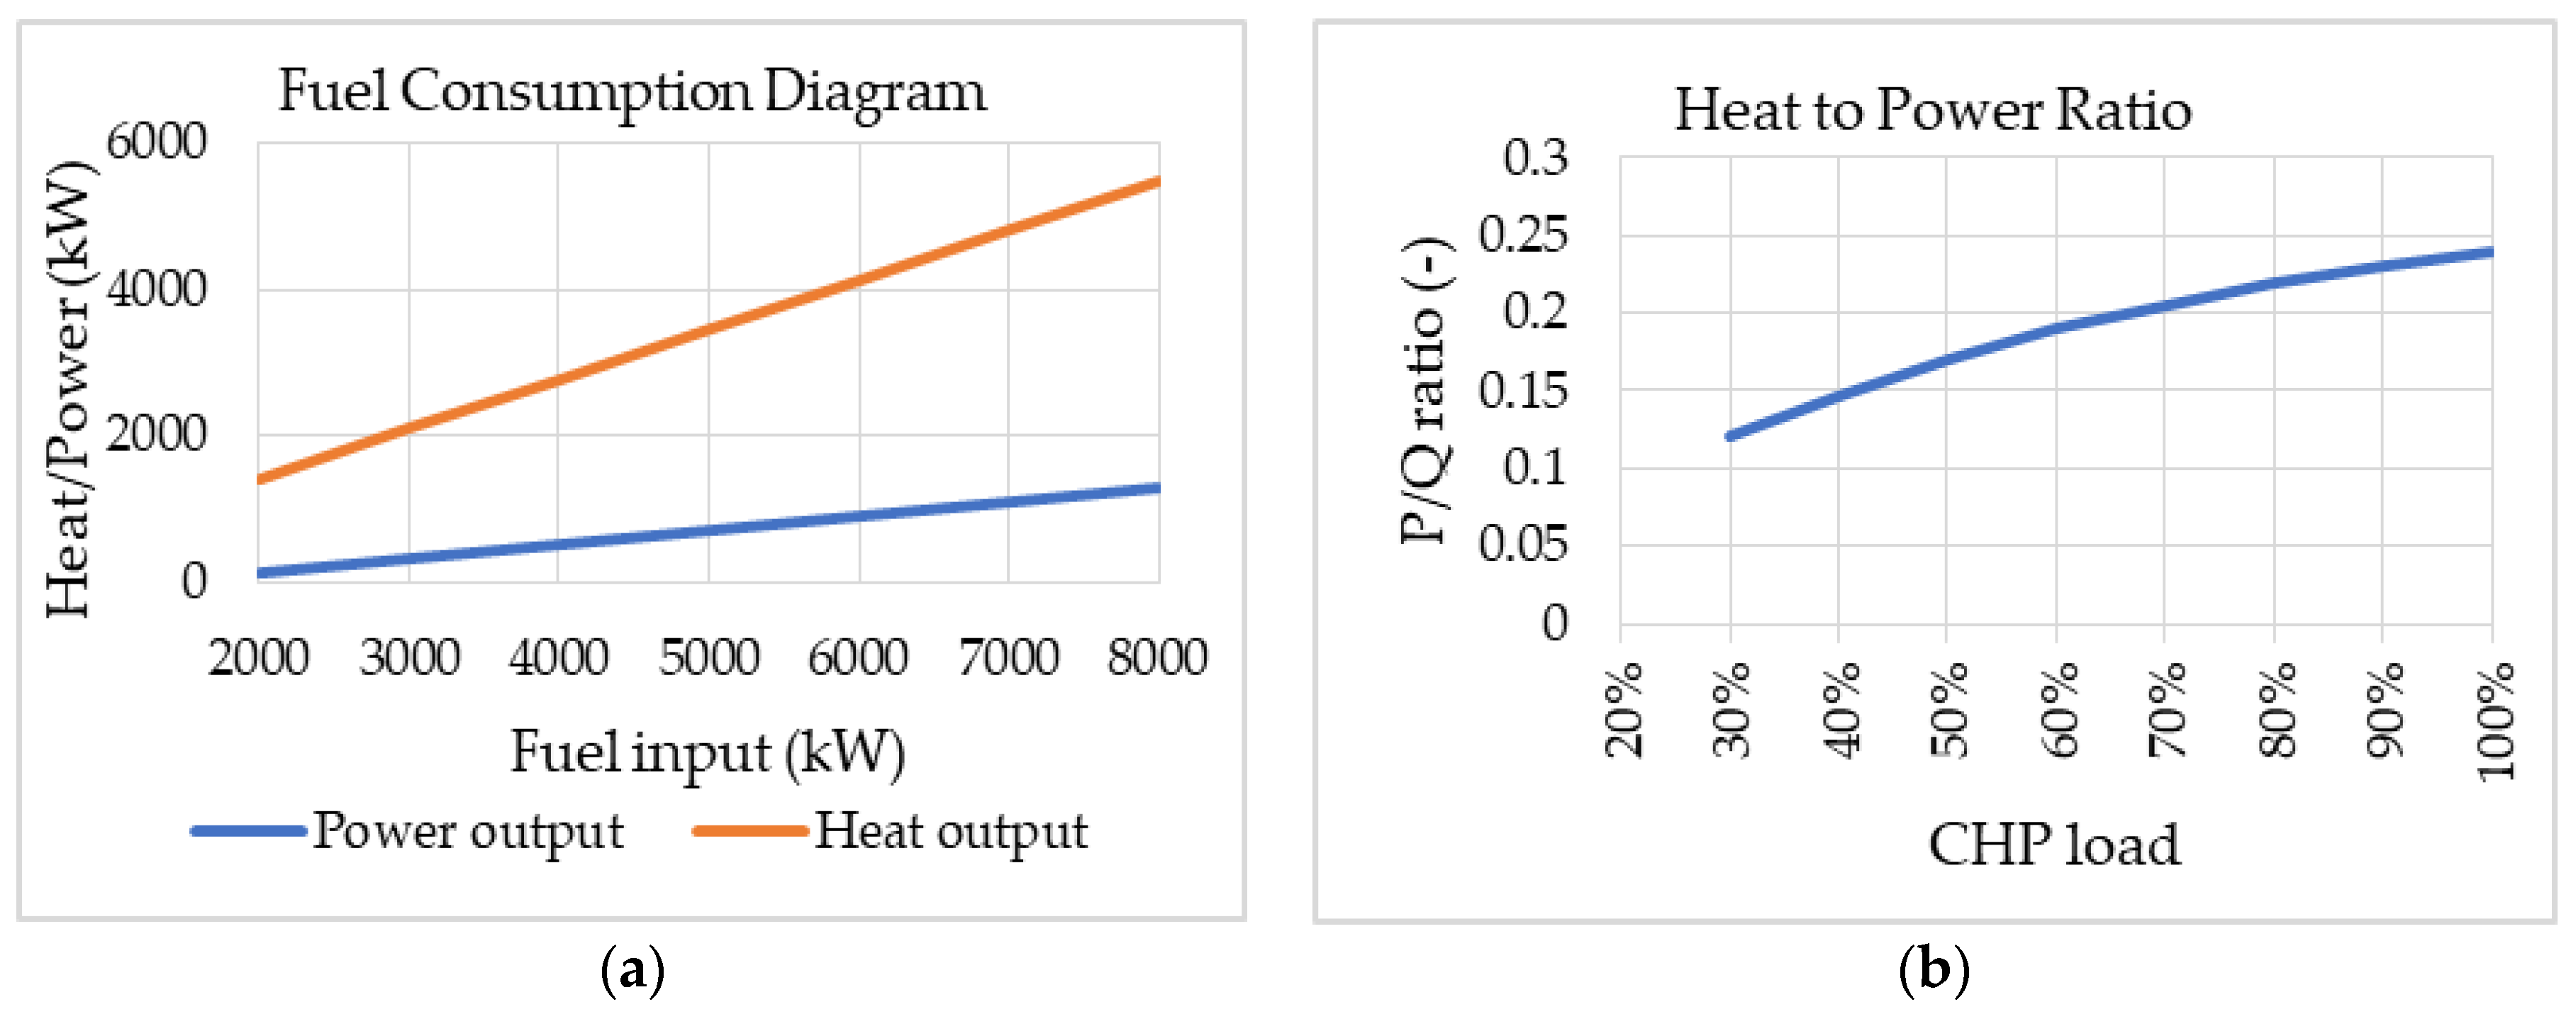
Figure 6 shows the regime diagrams of the CHP unit: fuel consumption diagram and heat to power ratio. These diagrams are useful for analyzing the operation of the CHP plant at partial loads.
The establishment of the operating strategies of the CHP plant is based on the forecast heat demand of the consumers. Five cases were analyzed and compared.
4.1. Case 1: Full Cogeneration Regime (100% Heat Demand)
The CHP plant is loaded to the nominal design values. The useful heat consumption of the CHP plant is maximum. All the delivered electricity is generated in high efficiency cogeneration, so it benefits from the green certificates support scheme. The delivered electricity is traded on the centralized market of bilateral contracts.
4.2. Case 2: Cogeneration Regime (76% Heat Demand)
The electrical load of the CHP plant has its nominal value. The useful heat consumption of the CHP plant is reduced to the minimum value for which the primary energy saving is positive (PES > 0). Therefore, all the delivered electricity is considered to be generated in high efficiency cogeneration and benefits from the green certificates support scheme. The delivered electricity is traded on the centralized market of bilateral contracts.
4.3. Case 3: Non-Cogeneration Regime (0% Heat Demand)
The CHP plant works in condensation mode. The useful heat consumption of the CHP plant is missing. The heat generated by the cogeneration unit is ceded to the cooling tower.
4.4. Case 4: Cogeneration Regime at Partial Load (30% Heat Demand)
The electrical load of the CHP plant has its nominal value. The useful heat consumption of the CHP plant is low (30% heat demand). The 70% remaining difference is transferred to the cooling tower.
4.5. Case 5: Optimized Cogeneration Regime at Partial Load (30% Heat Demand)
This case is the same as Case 4 in terms of useful heat demand but the electric load of the CHP plant is reduced so that the possible revenues are higher than the costs. Only the amount of electricity generated in high efficiency cogeneration is traded on the bilateral contracts market. The CHP plant has an electrical load reserve. This amount of available electricity can be traded on the spot markets (DAM and IDM) when the electricity price is convenient.
An example of calculating revenue for a typical day of operation of the CHP plant at partial loads is presented in
Table 1.
The main characteristics of the analyzed cases (average hourly values of useful heat, electricity and fuel) are presented in
Table 2.
Figure 7 shows the costs, revenue, and profit in the analyzed cases. The following values as input data were considered: 20 EUR/MWh the cost of fuel; 4,765,200 EUR the investment cost of the CHP; 40 EUR/MWh the delivered heat price; 45 EUR/MWh the CMBC electricity price; 55 EUR/MWh the DAM electricity price; 29 EUR/GC the green certificate price and 8000 hours/year the scheduled operating time of the CHP.
The payback period of the investment depending on the heat demand (in percentage of rated load) and the annual operating time is shown in
Figure 8. The investment is recovered within a reasonable time (less than 20 years) for an annual operating time of 8000 h if the heat demand is higher than 40%. For an annual operating time of 4500 h, the heat demand must be greater than 50%. The operation of the CHP plant at low thermal loads (Case 2 and Case 5) can be accepted if the revenues obtained are higher than the operating costs. However, it is found that the annual heat demand must be higher than 40% so that the investment is recovered in a maximum acceptable payback period. The annual heat demand should increase if the plant's annual operating time is reduced.
When estimating the market prices for heat and electricity generated in the CHP plant, the basic principle of cogeneration should be considered: the costs of heat and electricity generated in cogeneration must not be higher than in the case of separate electricity and heat generation. As a general rule, in the case of cogeneration plants, heat consumers are captive and the heat market has a monopoly character in which competition is missing. However, the alternative options for separate heat generation must be considered. Therefore, the price of heat in cogeneration should not be higher than the heat produced separately with alternative technologies that would use the same type of fuel.
Figure 9 shows the economic characteristics of the CHP plant operation in the five cases. Equation (2) has been customized for each case.
The main goal of the proposed algorithm is to establish the operating strategies of the cogeneration plant according to revenue potentials in the different markets. Case 1 is the reference case in which the CHP plant can achieve the highest revenue. The operating costs are the same in Cases 2–4 as in Case 1 but possible revenues are lower due to reduced consumption of useful heat. The operation of the CHP plant in Cases 3 and 4 is uneconomical, the possible revenues are lower than the operating costs. The heat demand is missing in Case 3 and the revenues obtained only from the sale of electricity are insufficient. The same finding is also observed in Case 4 because the heat demand is reduced. This situation can be corrected by choosing an appropriate mode of operation. Case 5 is the same as Case 4 in terms of the useful heat demand (30% heat demand) but the electric load of the CHP plant is reduced so that the possible revenues are higher than the costs. The profit in Case 5 increased to 11% compared to Case 4 where the operation of the CHP plant is uneconomic with a negative profit (−21%).
Figure 8 shows that the prices of heat and electricity in the market do not cross the economic operating characteristics in Cases 3 and 4. The operation of the CHP plant in these cases is uneconomical. In Case 1, the intersection points of the correlated prices should lie within the ABDFGE area above the economic characteristic. The area can be extended to A'B'D'F' points if a part of the electricity is traded on the DAM. Similarly, in Case 2 intersection points should be inside the ABDE area and respectively inside the ABC area in Case 5.
The correlated prices of heat and electricity generated in cogeneration can be suited to market conditions to achieve maximum revenue.
The useful heat demand directly influences the production of electricity in high efficiency cogeneration. The minimum value of the useful heat demand is identified by the proposed algorithm and the optimization problem formulated in
Section 3.2.
Figure 10 shows the feasible operating area for heat and electricity production in the CHP plant. The feasible operation area of the CHP plant increased in the case of the optimized regime. The minimum heat demand for which the CHP plant starts to have a profit is 26% compared to a useful heat demand of over 80% in the reference case. However, the revenue generated by such a reduced heat demand is not sufficient to recover the investment. In the current conditions of the power market, the annual heat demand must be higher than 40% so that the investment is recovered in a maximum acceptable payback period (
Figure 8). Therefore, the CHP plant can be economically operated at a thermal load of at least 40% when the operating strategies are applied.
5. Conclusions
Currently, there is a trend towards generating useful energy (electricity, heating, and cooling) as close to the place of consumption as possible. The increasing installed capacity of small CHP plants is accompanied with several new challenges in the planning and operation of CHP plants on power markets.
The daily variations of the electric load in the case of a small cogeneration unit do not essentially affect the structure of the power system. However, the expansion of distributed generation will be a challenge for both the electricity distribution network operator and the small cogeneration producers in terms of ensuring a balance between the physical notification and achieved production. These imbalances can be avoided by the realistic programming of production depending on the operating regimes and the technical state of the cogeneration units as close as possible to the moment of dispatch (day of electricity delivery).
An algorithm for determining the operating strategies of the CHP plant is proposed in this paper. The solution to the problem of economic dispatch is based on the amount of electricity generated in high efficiency cogeneration and the correlated prices of heat and electricity. This approach is the main contribution of this paper compared to optimization algorithms existing in literature. The algorithm can be used to identify the opportunities on the liberalized power markets for the increasing flexibility in the operation of the cogeneration plant. The price coupling of regions is the new change in the liberalized power markets and the usefulness of the proposed algorithm is viable in this context.
The results show that the operating strategies of cogeneration plants have a significant impact on their operating costs and profitability. The minimum heat demand of 40% is identified for which the CHP plant can be economically operated under the current conditions of power markets. Obviously, the profit of the cogeneration plant increases if the useful heat demand is higher than this value. The average prices recorded in the power markets were used to solve the optimization problem. The proposed model could be improved in future research by using an algorithm in which predicted prices are used. The main purpose of presenting the paper in this form is highlighting the operating strategies of the CHP plants. Starting from these possibilities of operation of the CHP plants in the new conditions of the power markets, different optimization algorithms can be used to solve the practical needs of the cogeneration producers.
The main goal of the operating strategies is to achieve revenues over expenses in the operation of the cogeneration plant. The fact that fuel and electricity prices may be volatile can create not only risks, but also opportunities for the cogeneration plant owners to incur profits.


