A Geospatial Assessment of Small-Scale Hydropower Potential in Sub-Saharan Africa

 , and
, and
Abstract
1. Introduction
1.1. Role of Hydropower
1.2. Scope of the Study
2. Material and Methods
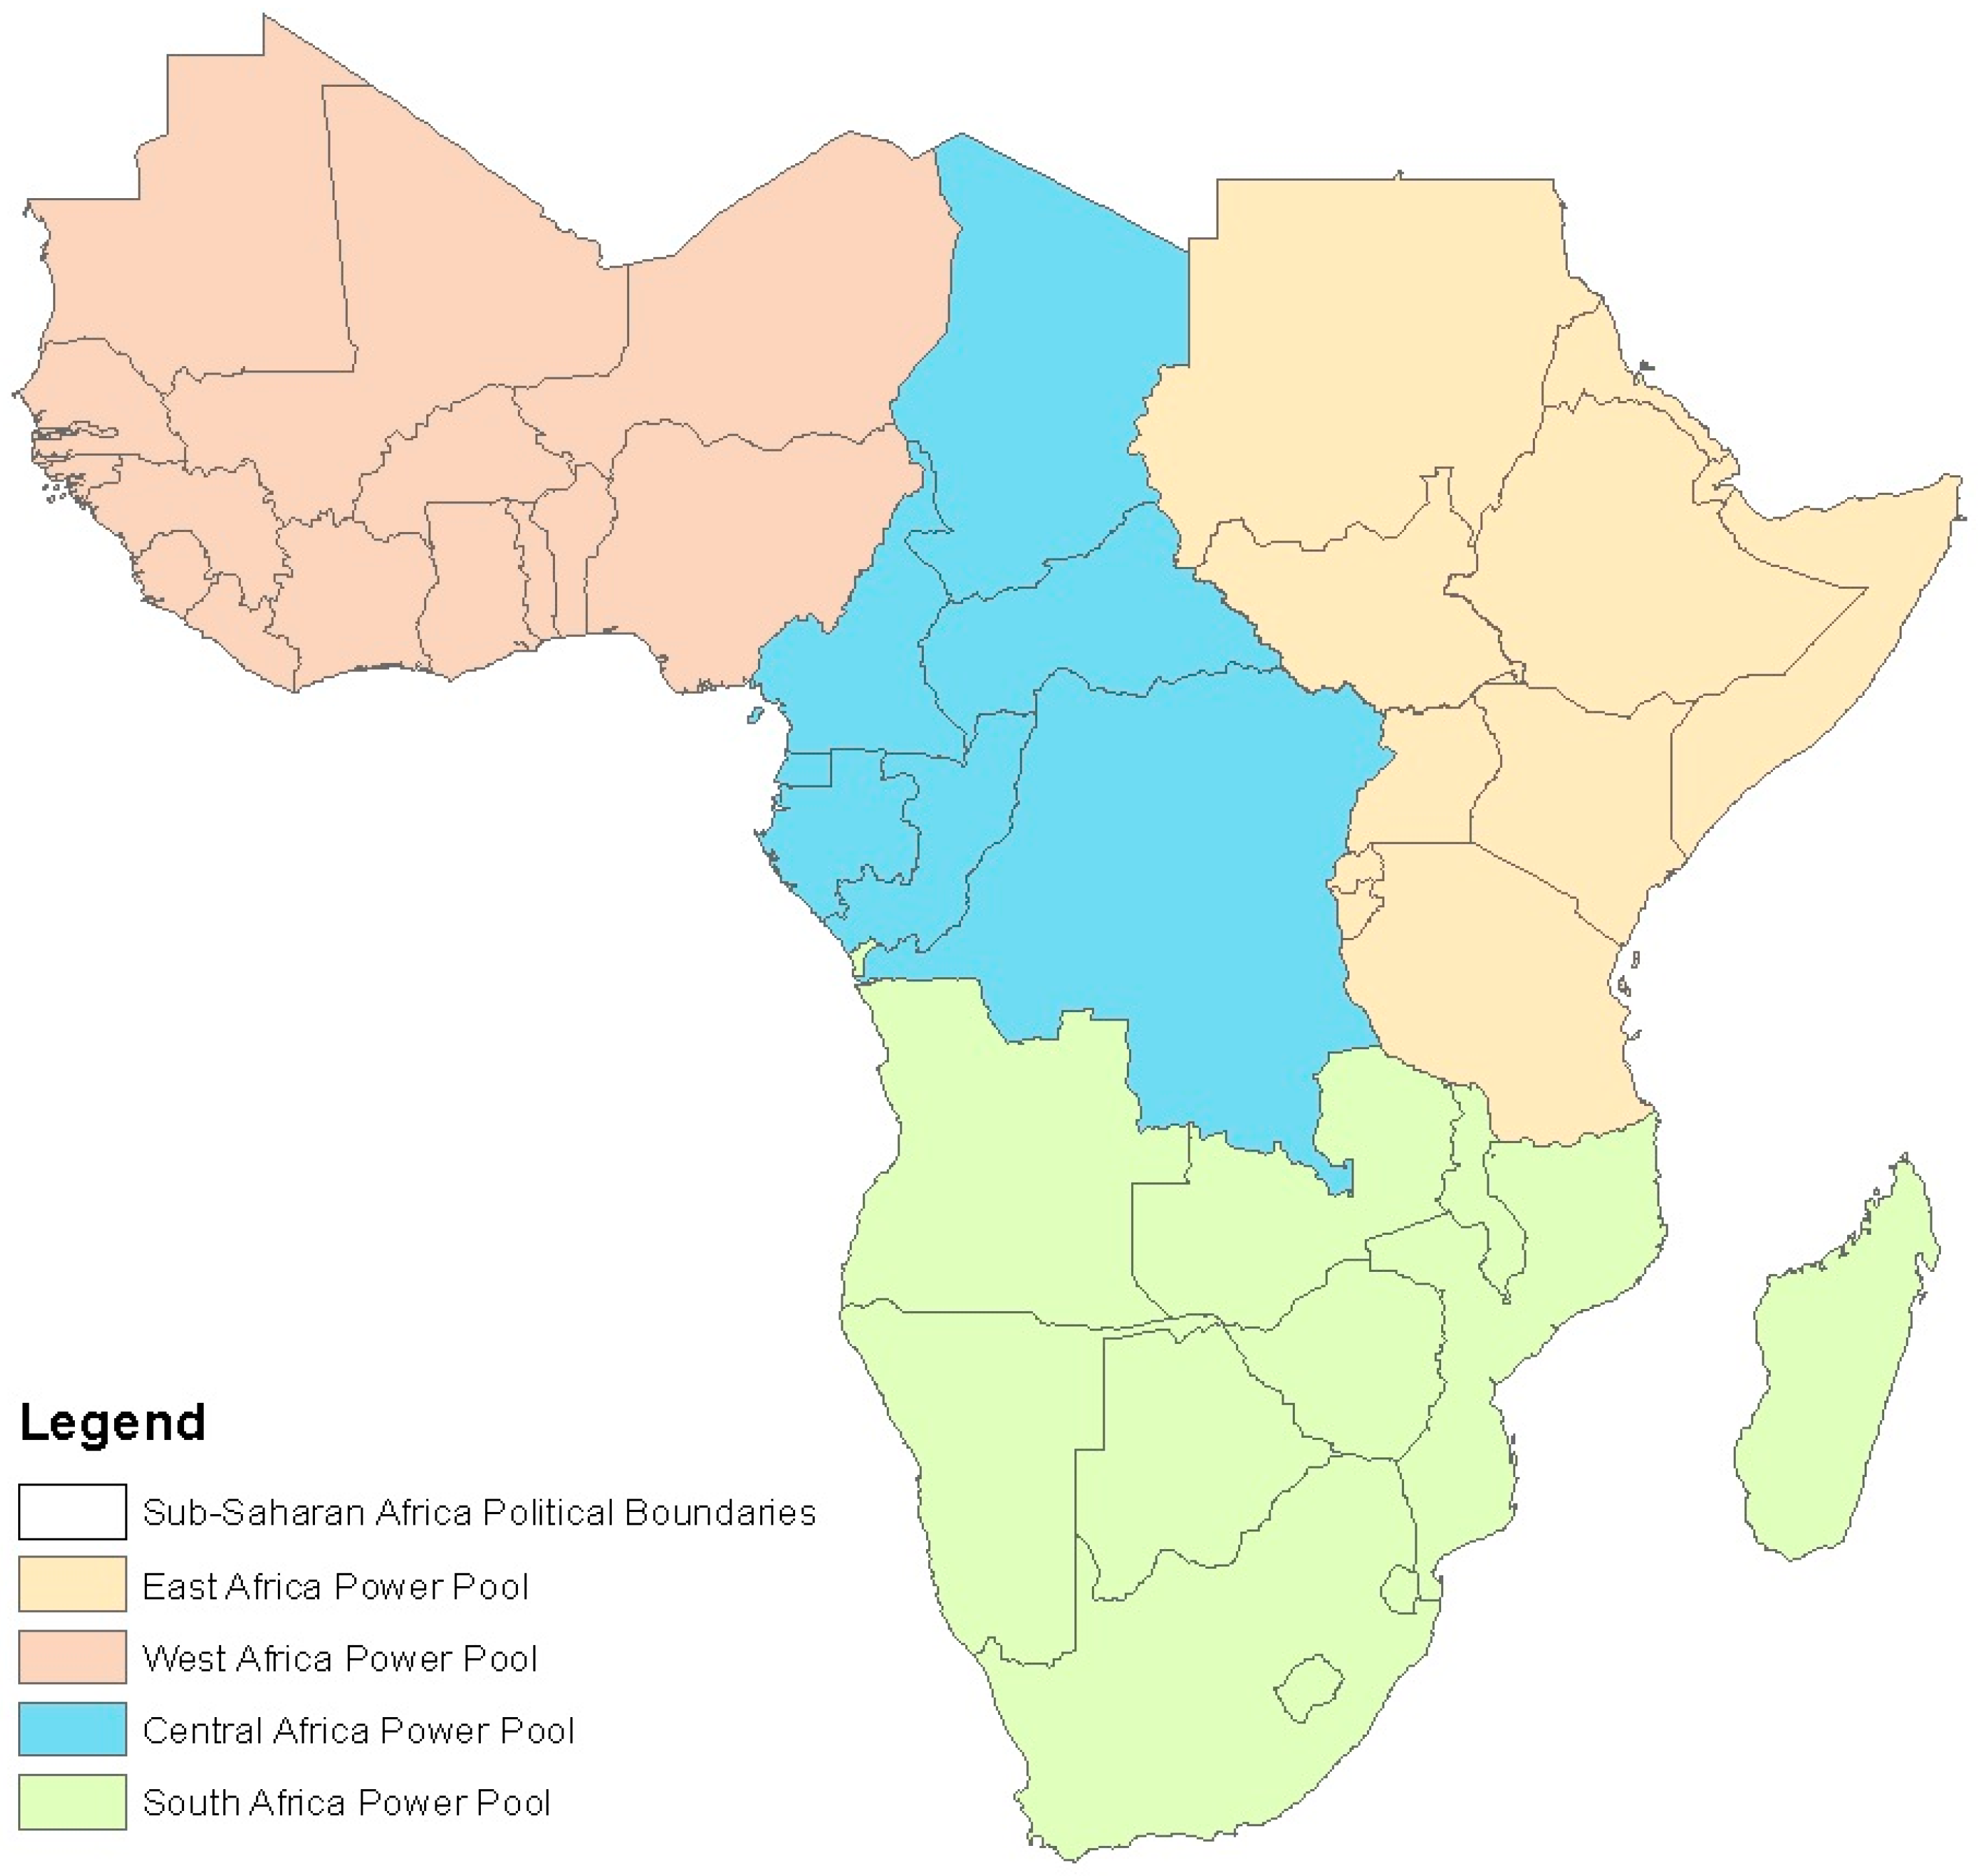
2.1. Study Area
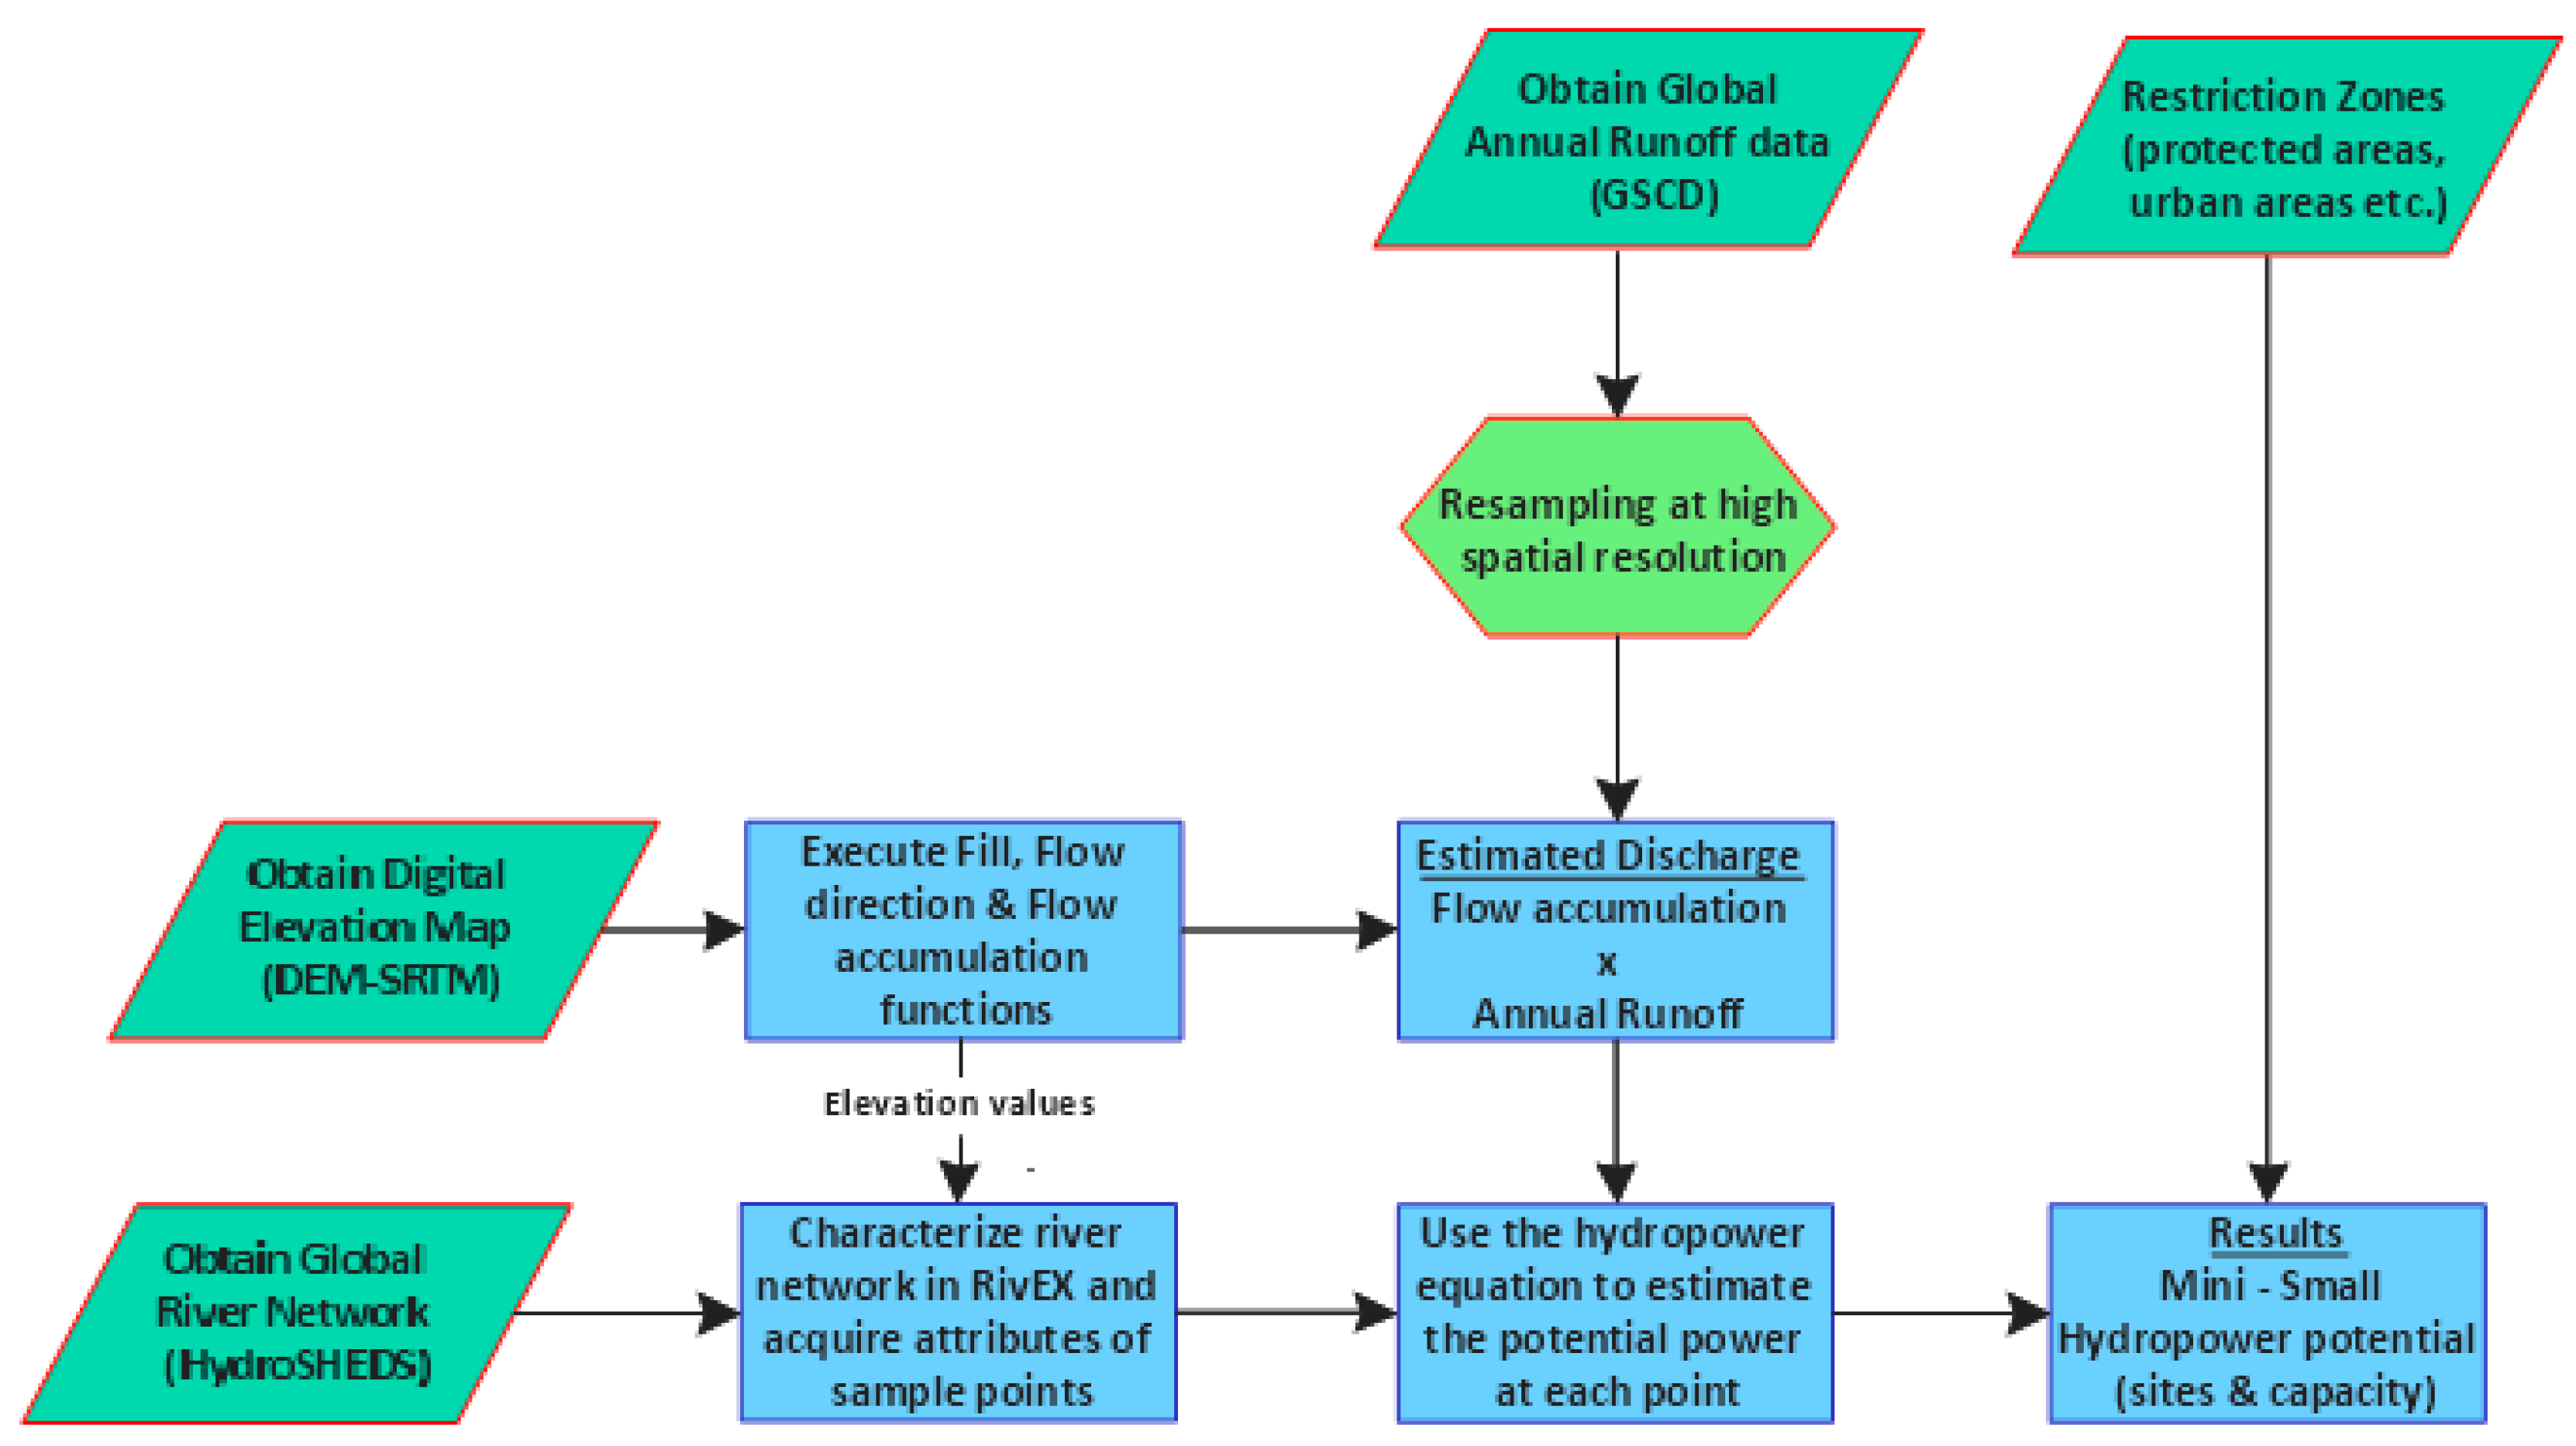
2.2. Methodology
2.3. Input GIS Data
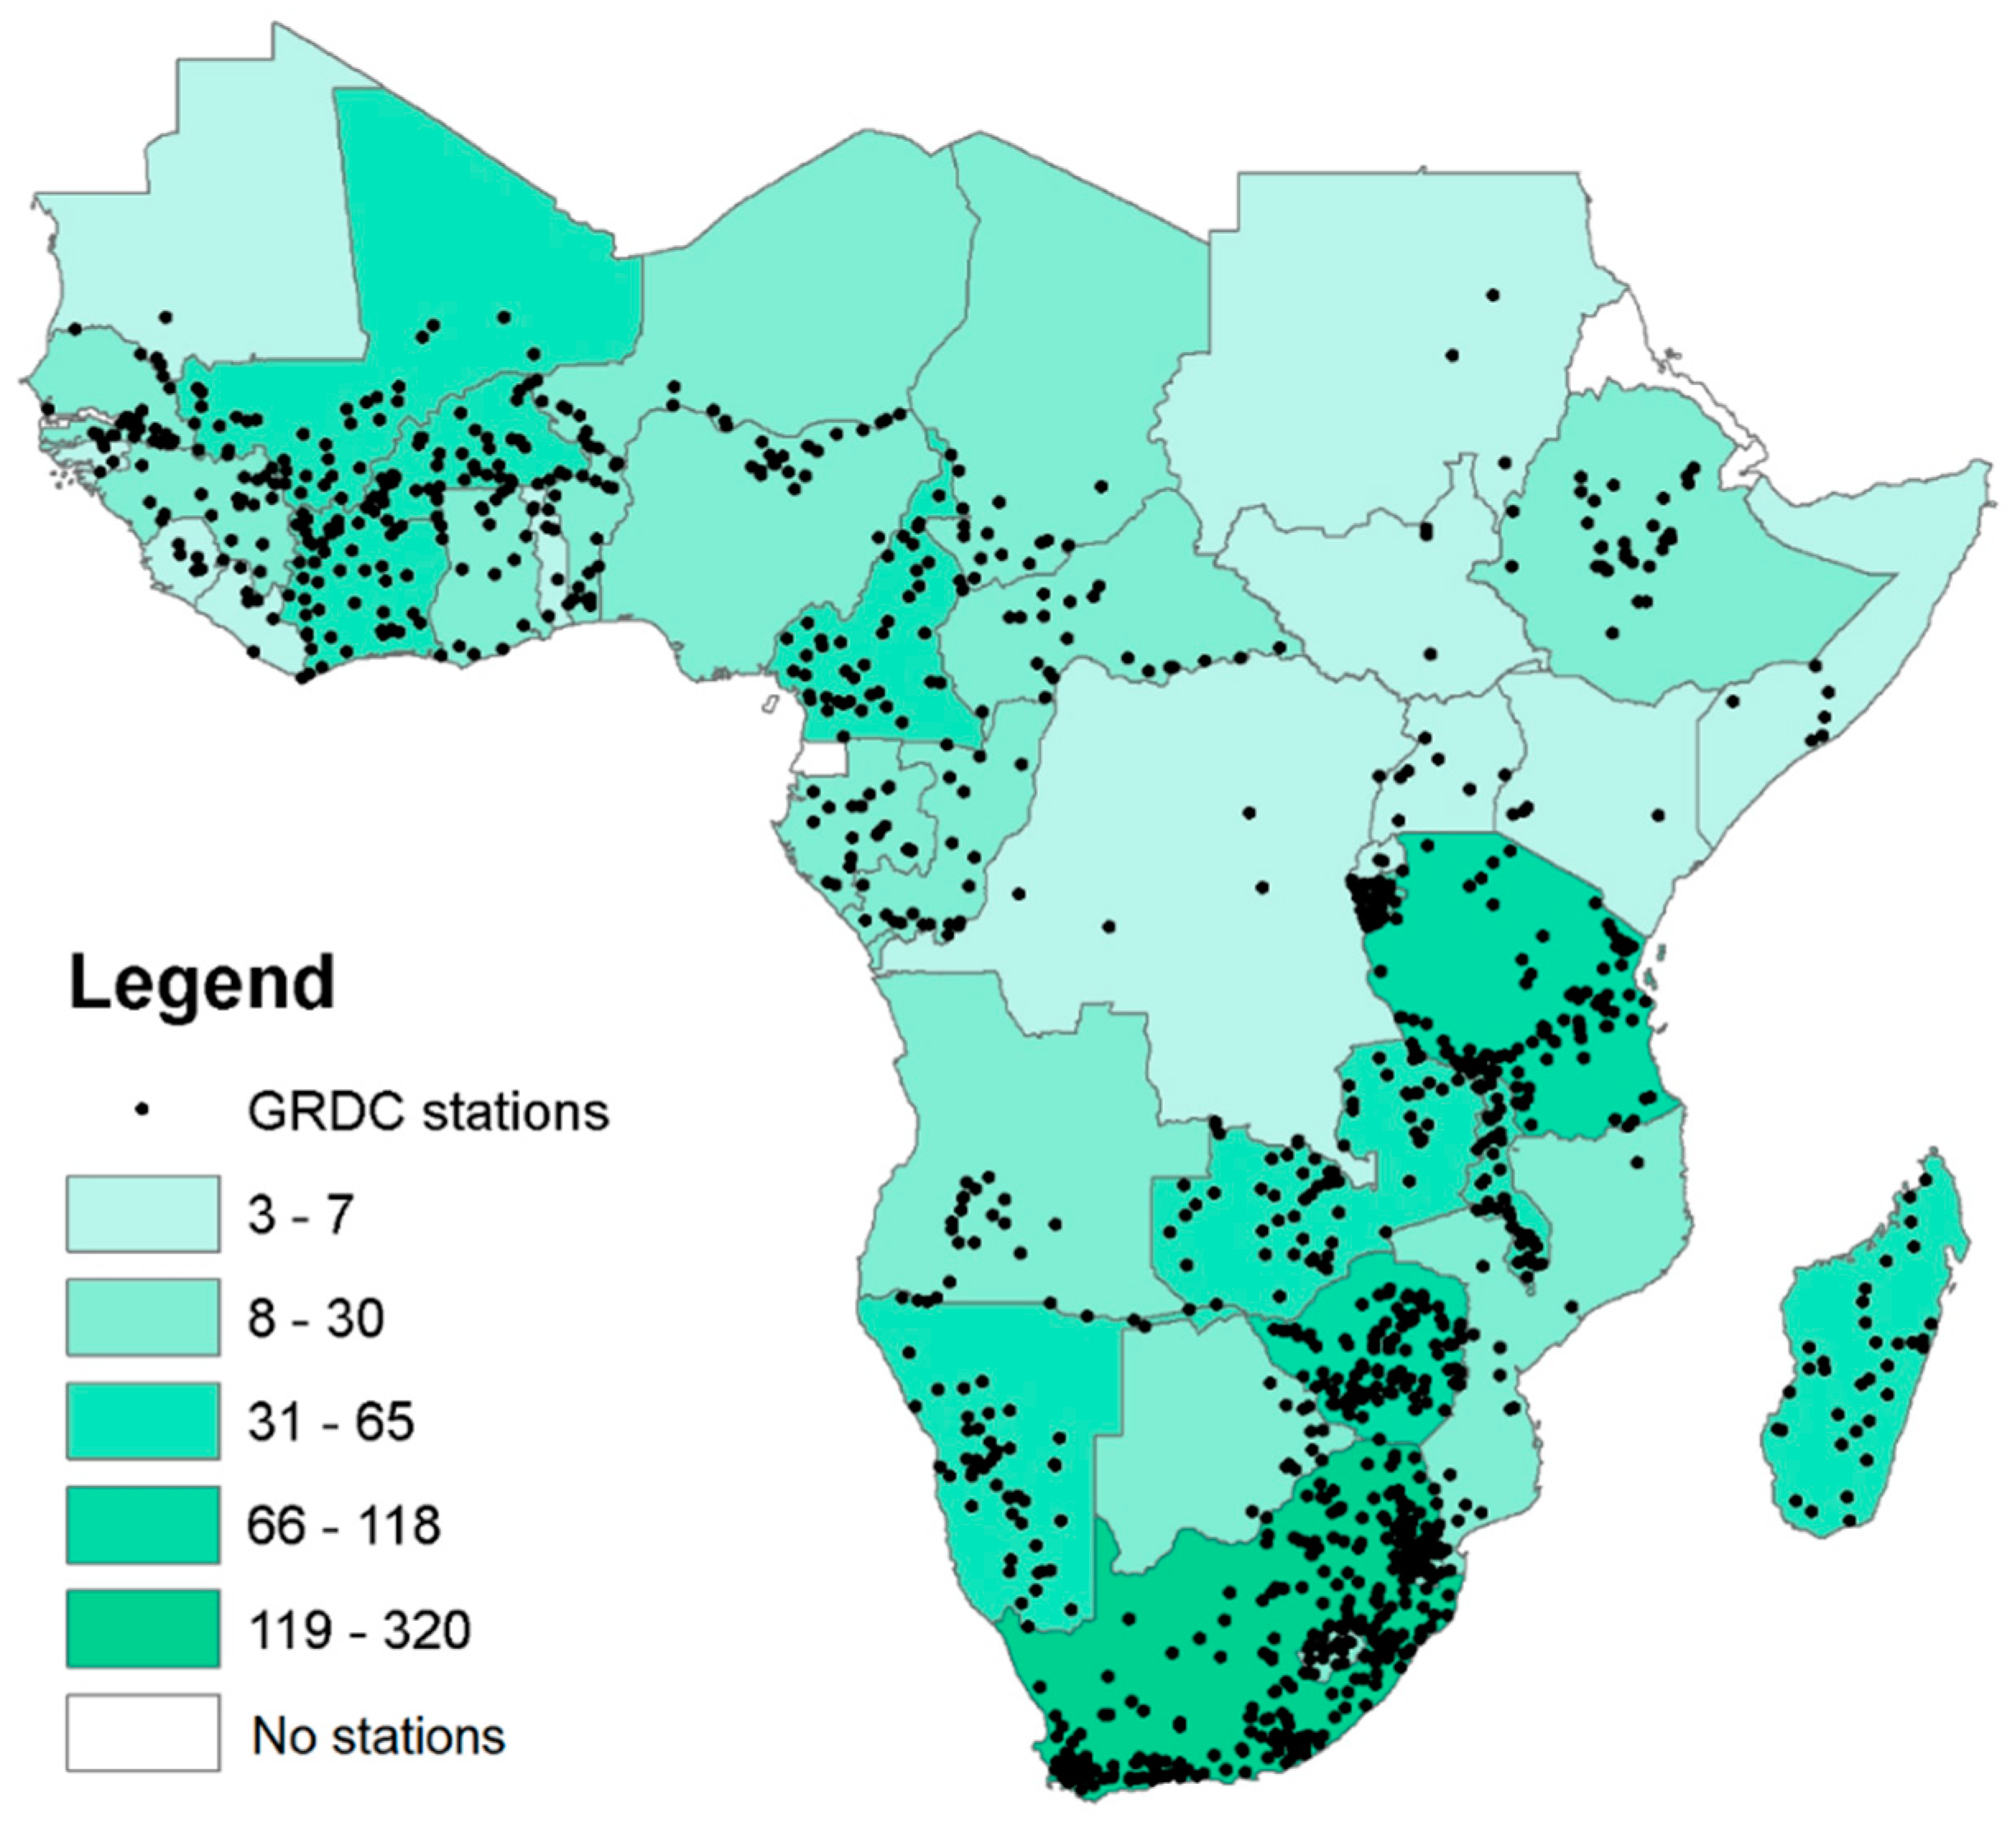
2.4. Discharge Quality Assessment
2.4.1. Assessment of the DEM-GSCD Discharge Layer
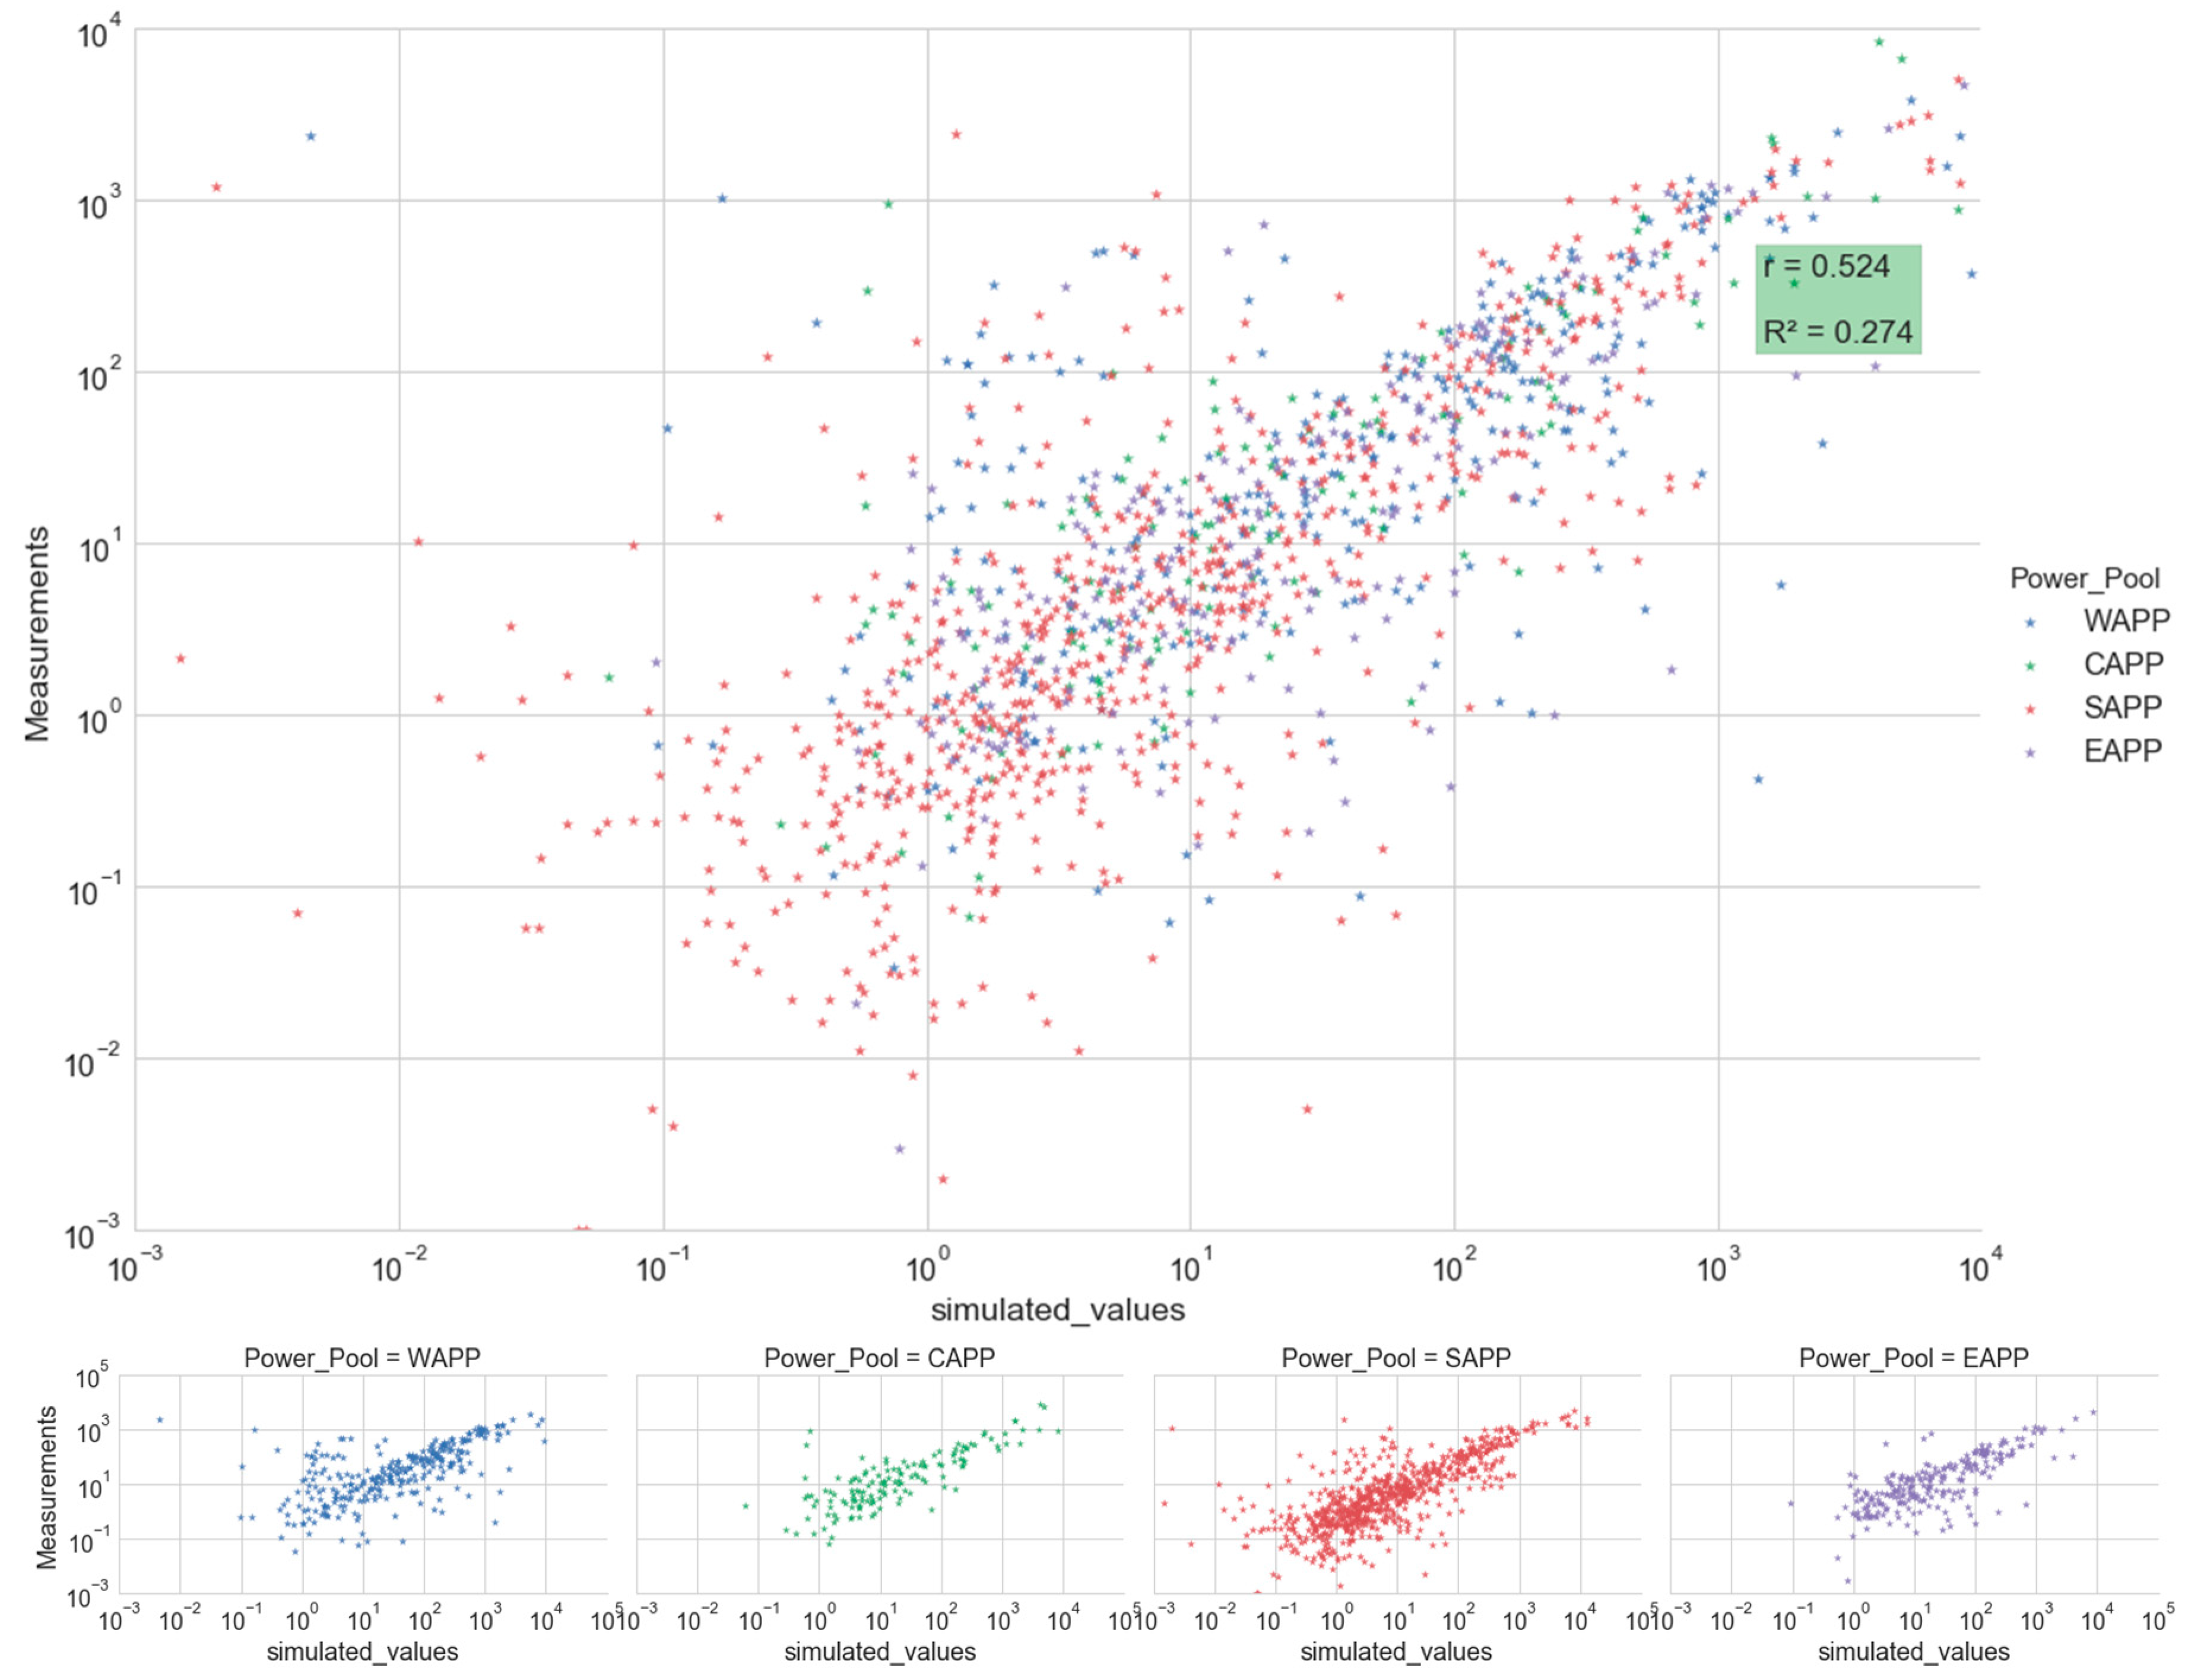
2.4.2. Assessment of the LISFLOOD Discharge Layer
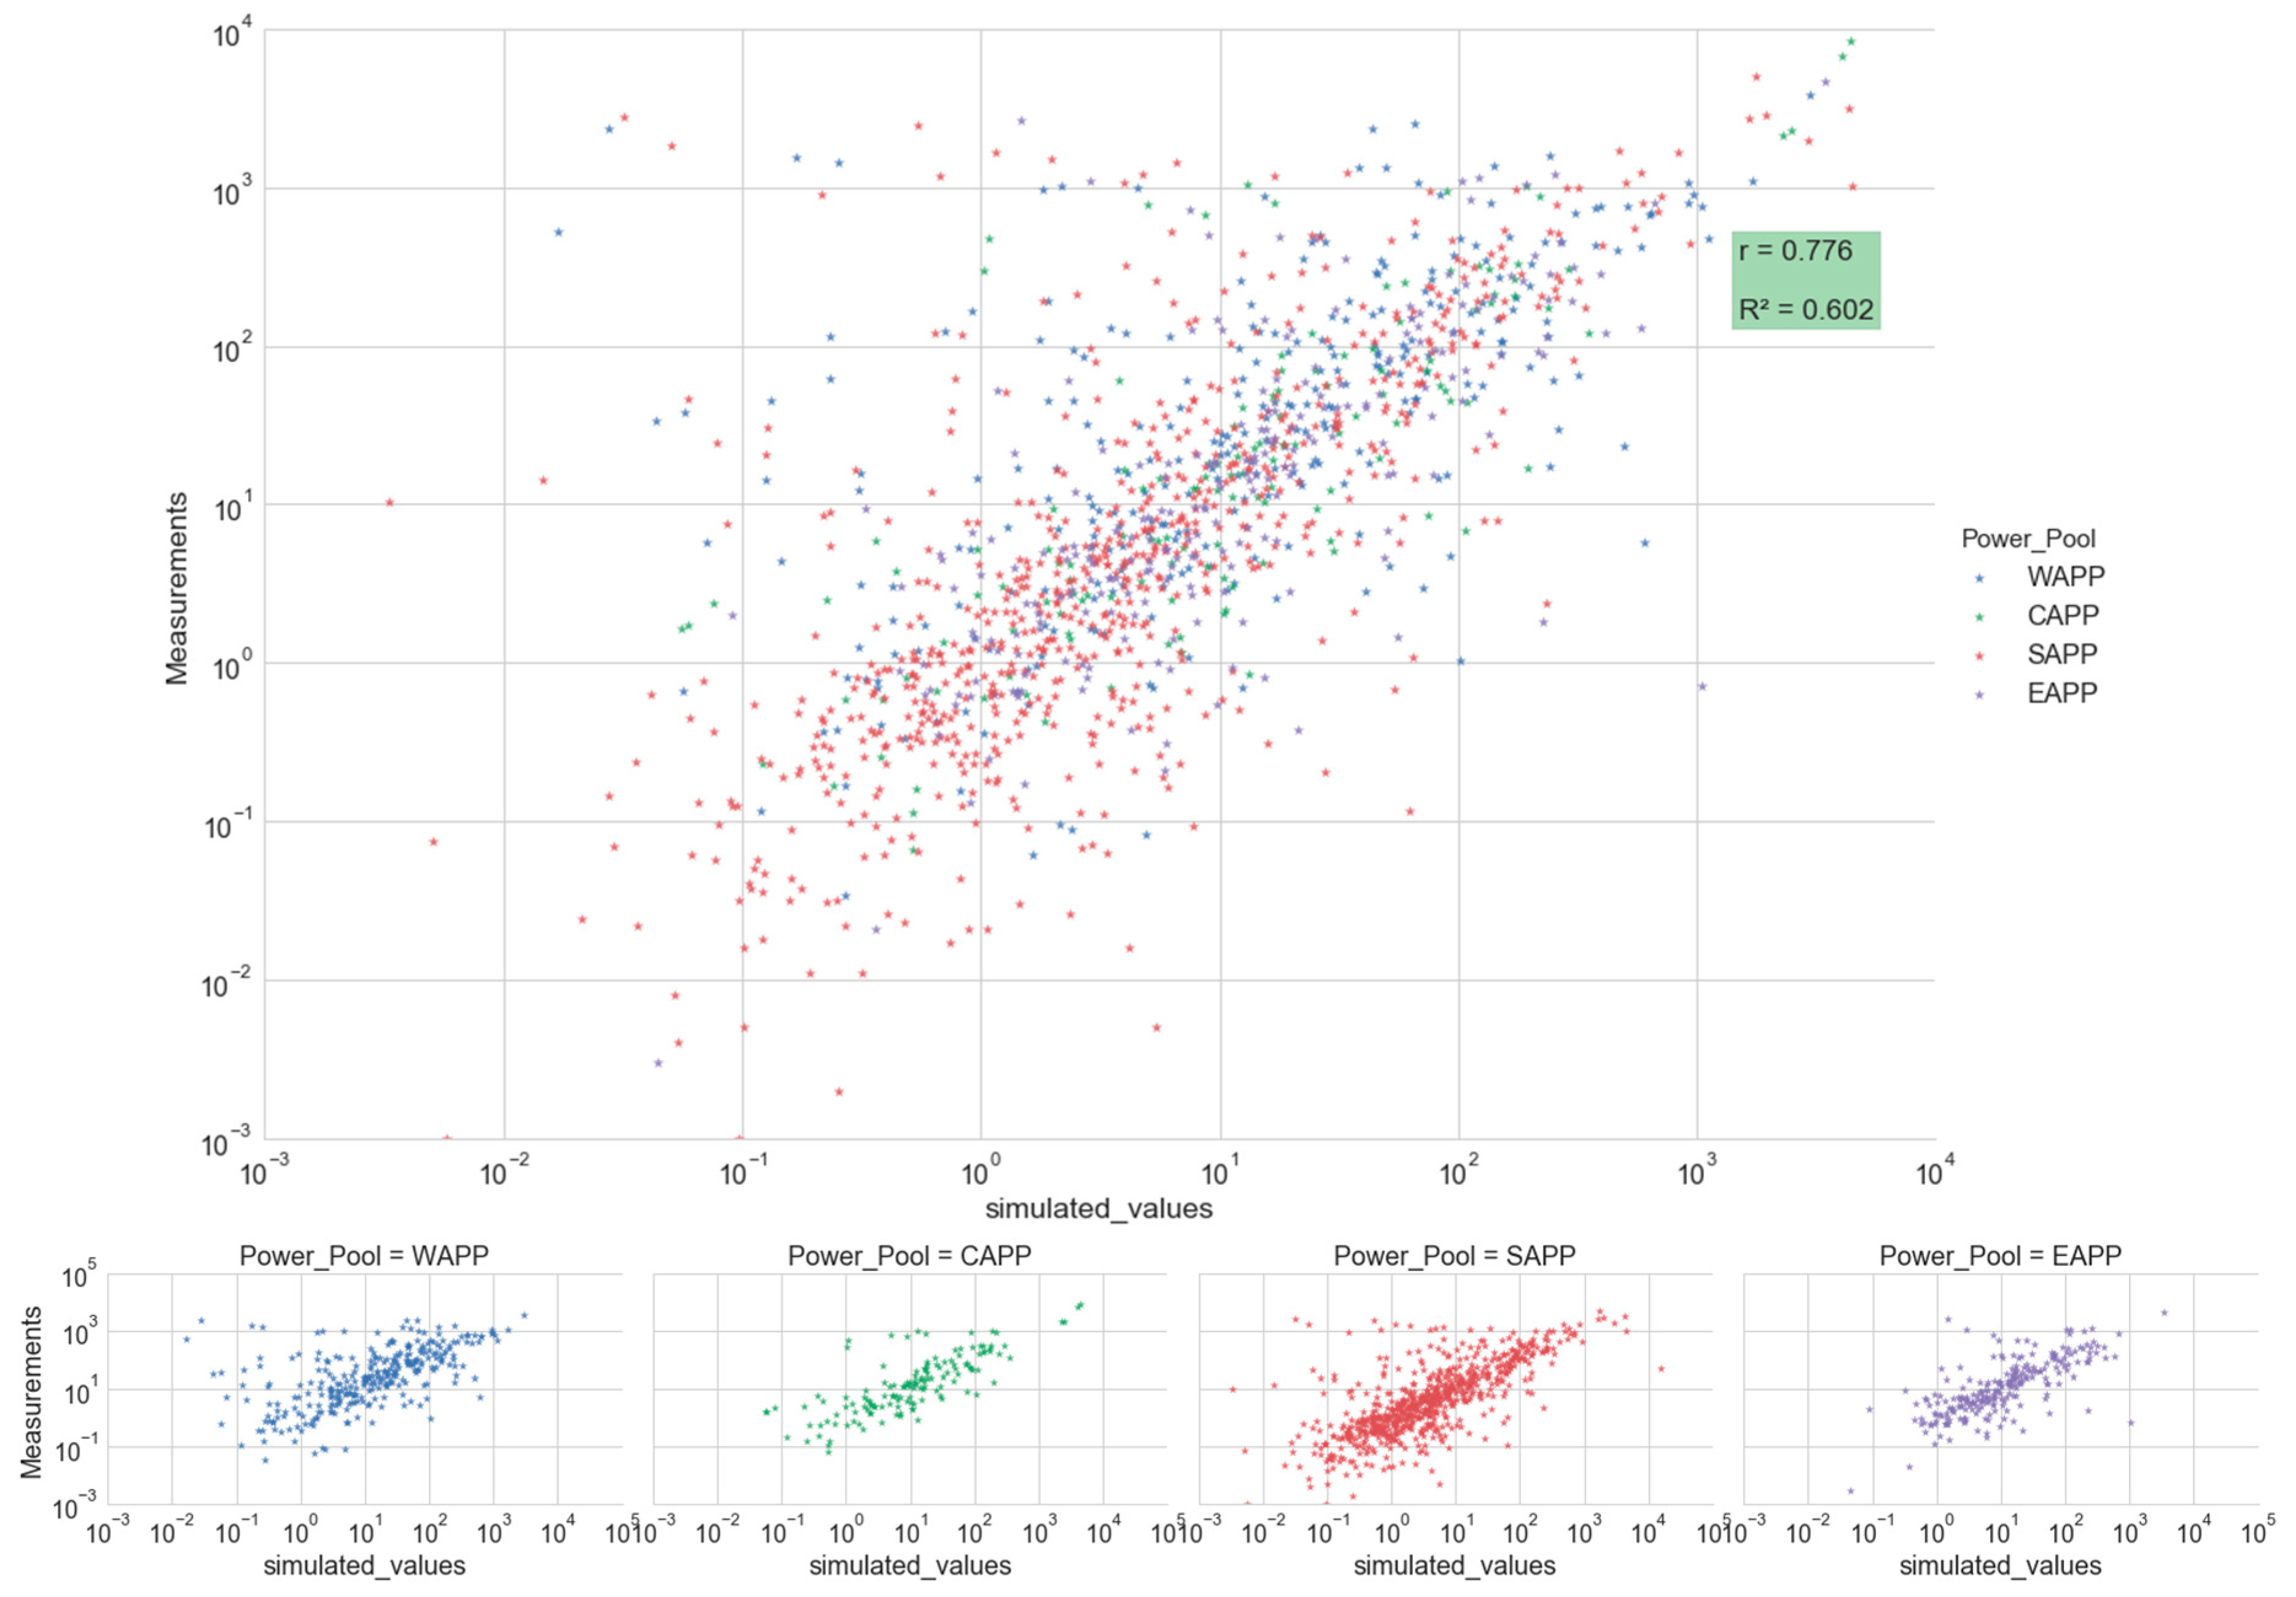
2.4.3. Comparison and Assessment
2.5. Estimating Hydropower Potential
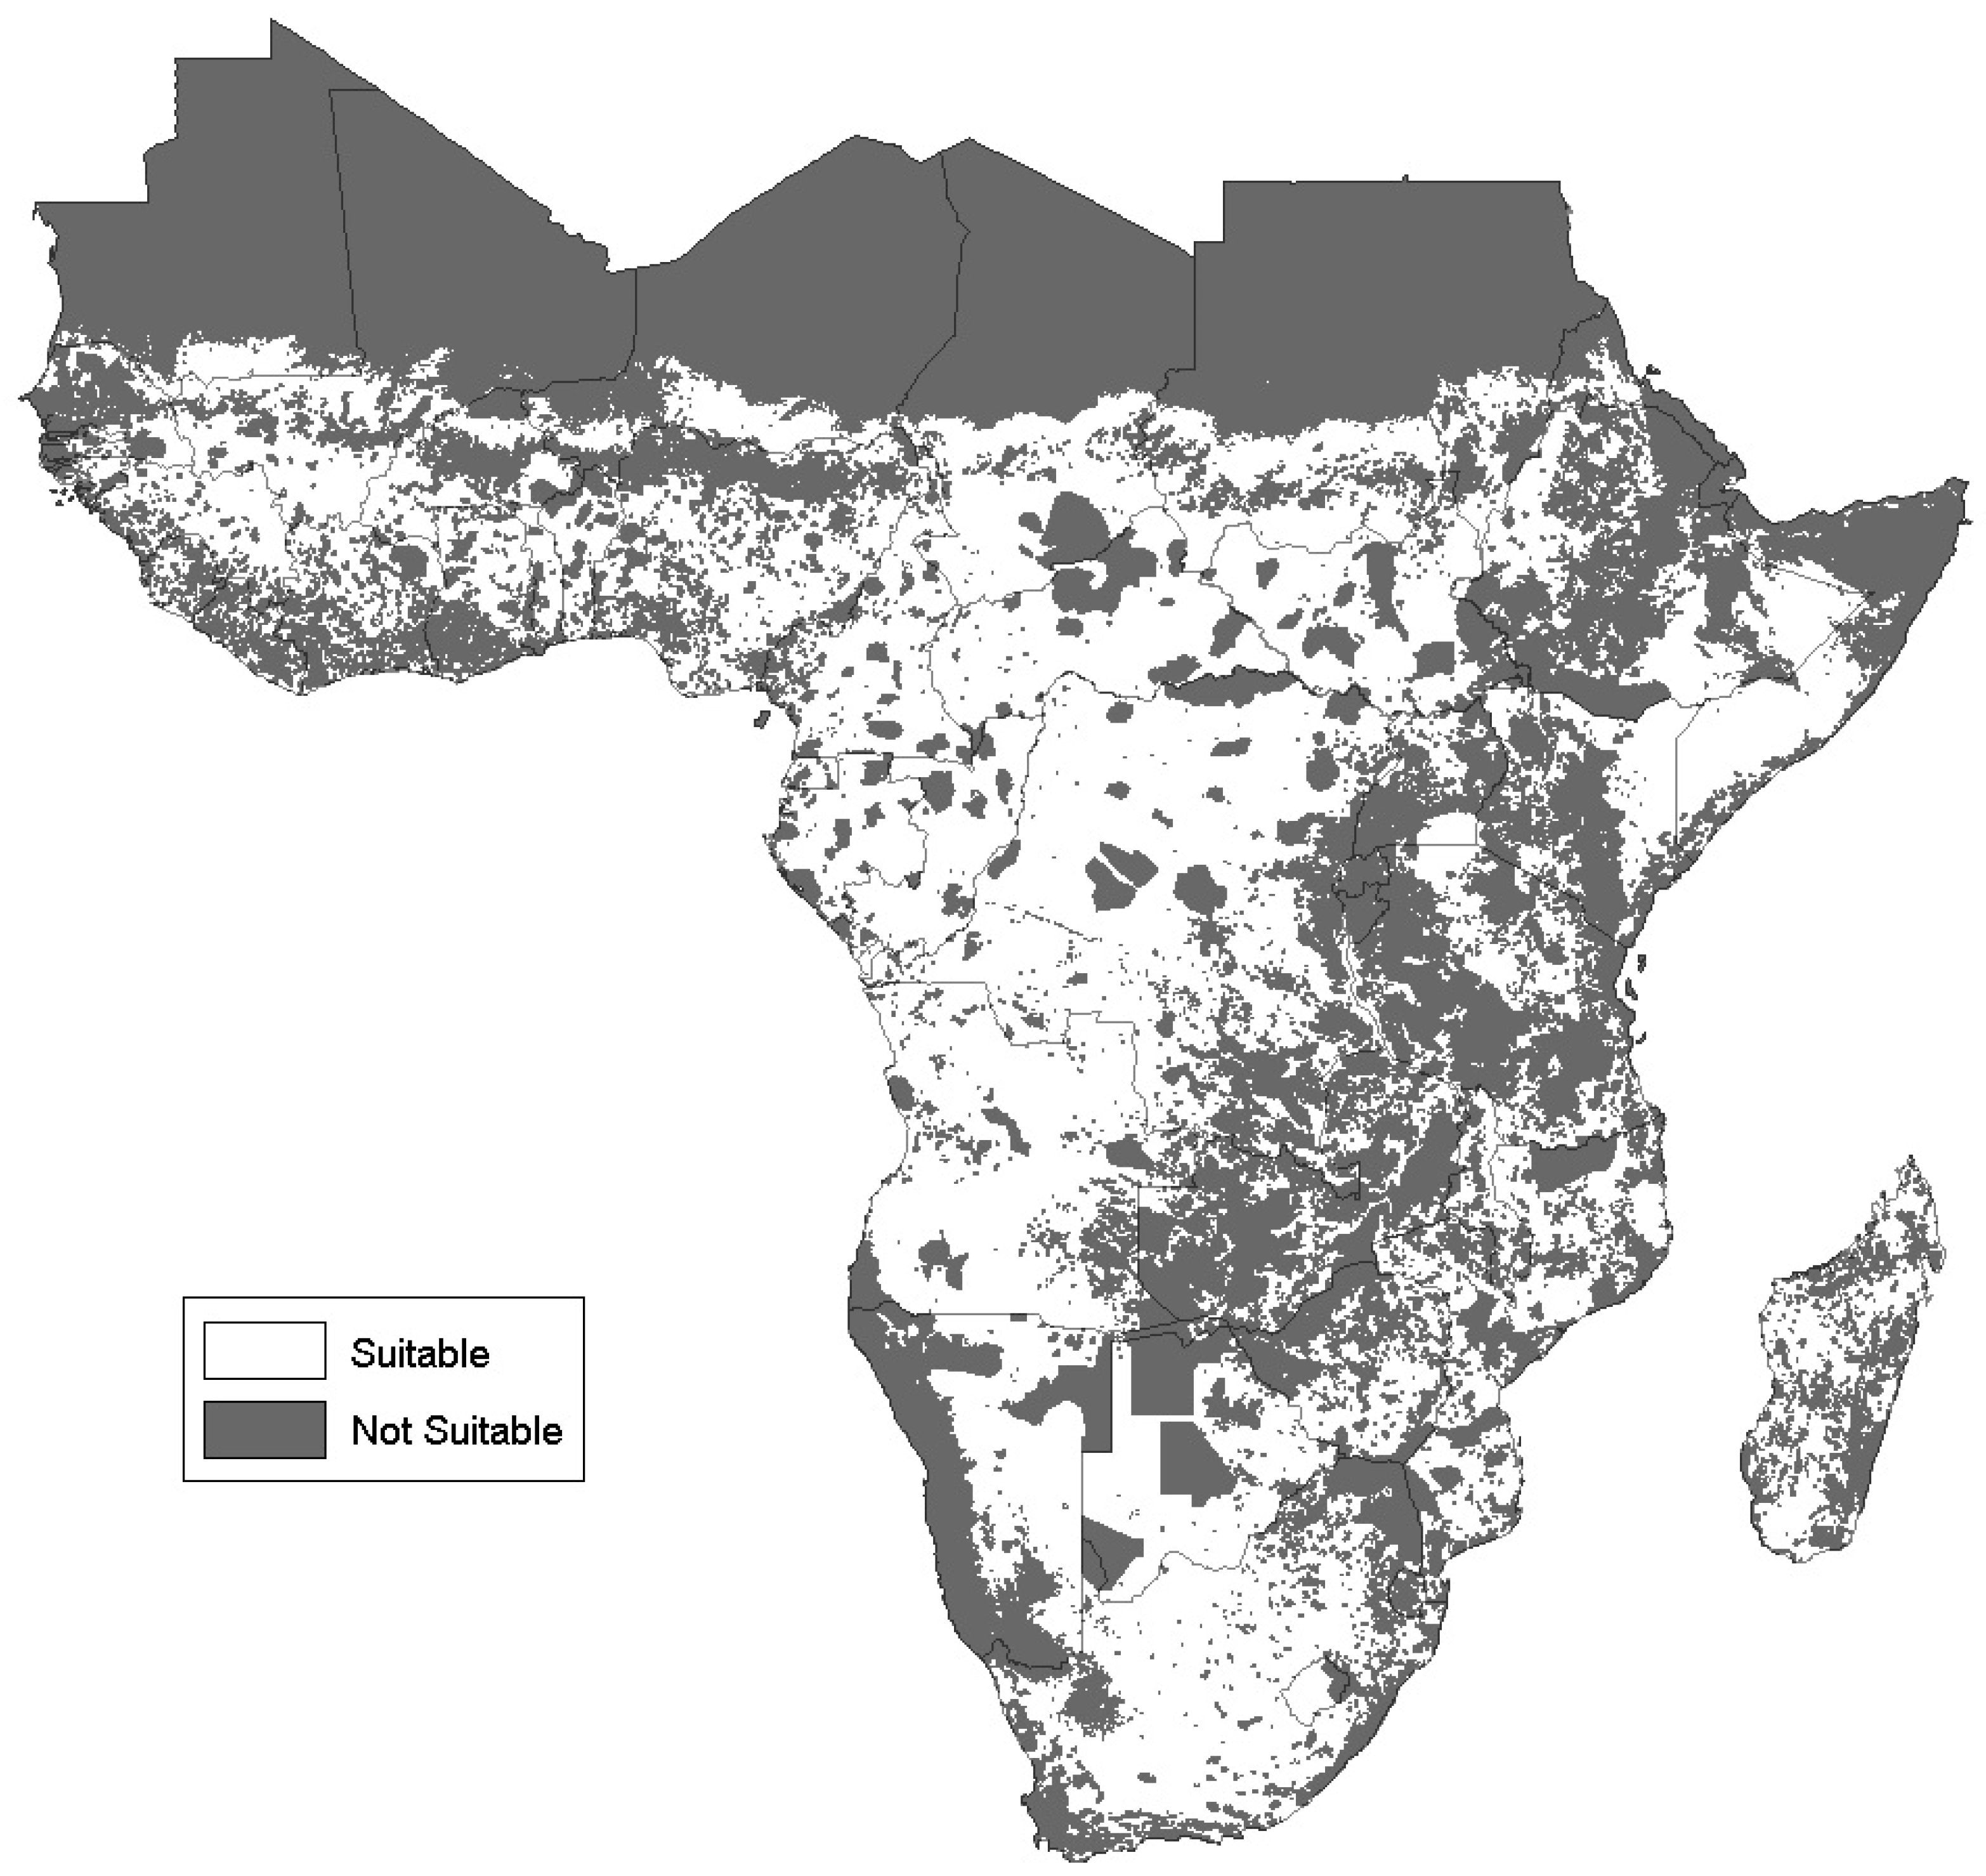
2.6. Restriction Zones and Selection of Suitable Sites
- Inland water: Water areas with limited flow, such as lakes, wetlands and stagnant waters, un-favouring run-off hydropower plants and therefore were excluded from this analysis.
- Agricultural zones: Water regulation in hydropower plants may affect agricultural practices in the vicinity. In order to avoid conflicts stimulated by problematic and inefficient water management and sustain biodiversity, exclusion zones were applied to all identified croplands.
- Urban built-up areas: Residential areas with intense human activity (cities, towns) and commercial/industrial infrastructure were assigned a 100 m buffer zone within which hydropower development was restricted in order to avoid technical, economic and social constraints.
- Barren land: Areas with limited water resources and arid land were excluded from this analysis due to unsuitability for hydropower deployment.
- Stream order: According to the hydropower equation presented above, a conversion factor has been taken into consideration in order to account for the environmental flow. In order to ensure sufficient amount of water flow at the hydro plant location, only rivers with Strahler (Strahler number: A numerical measure of branching complexity [72]) stream order greater or equal than three were included in this analysis [9].
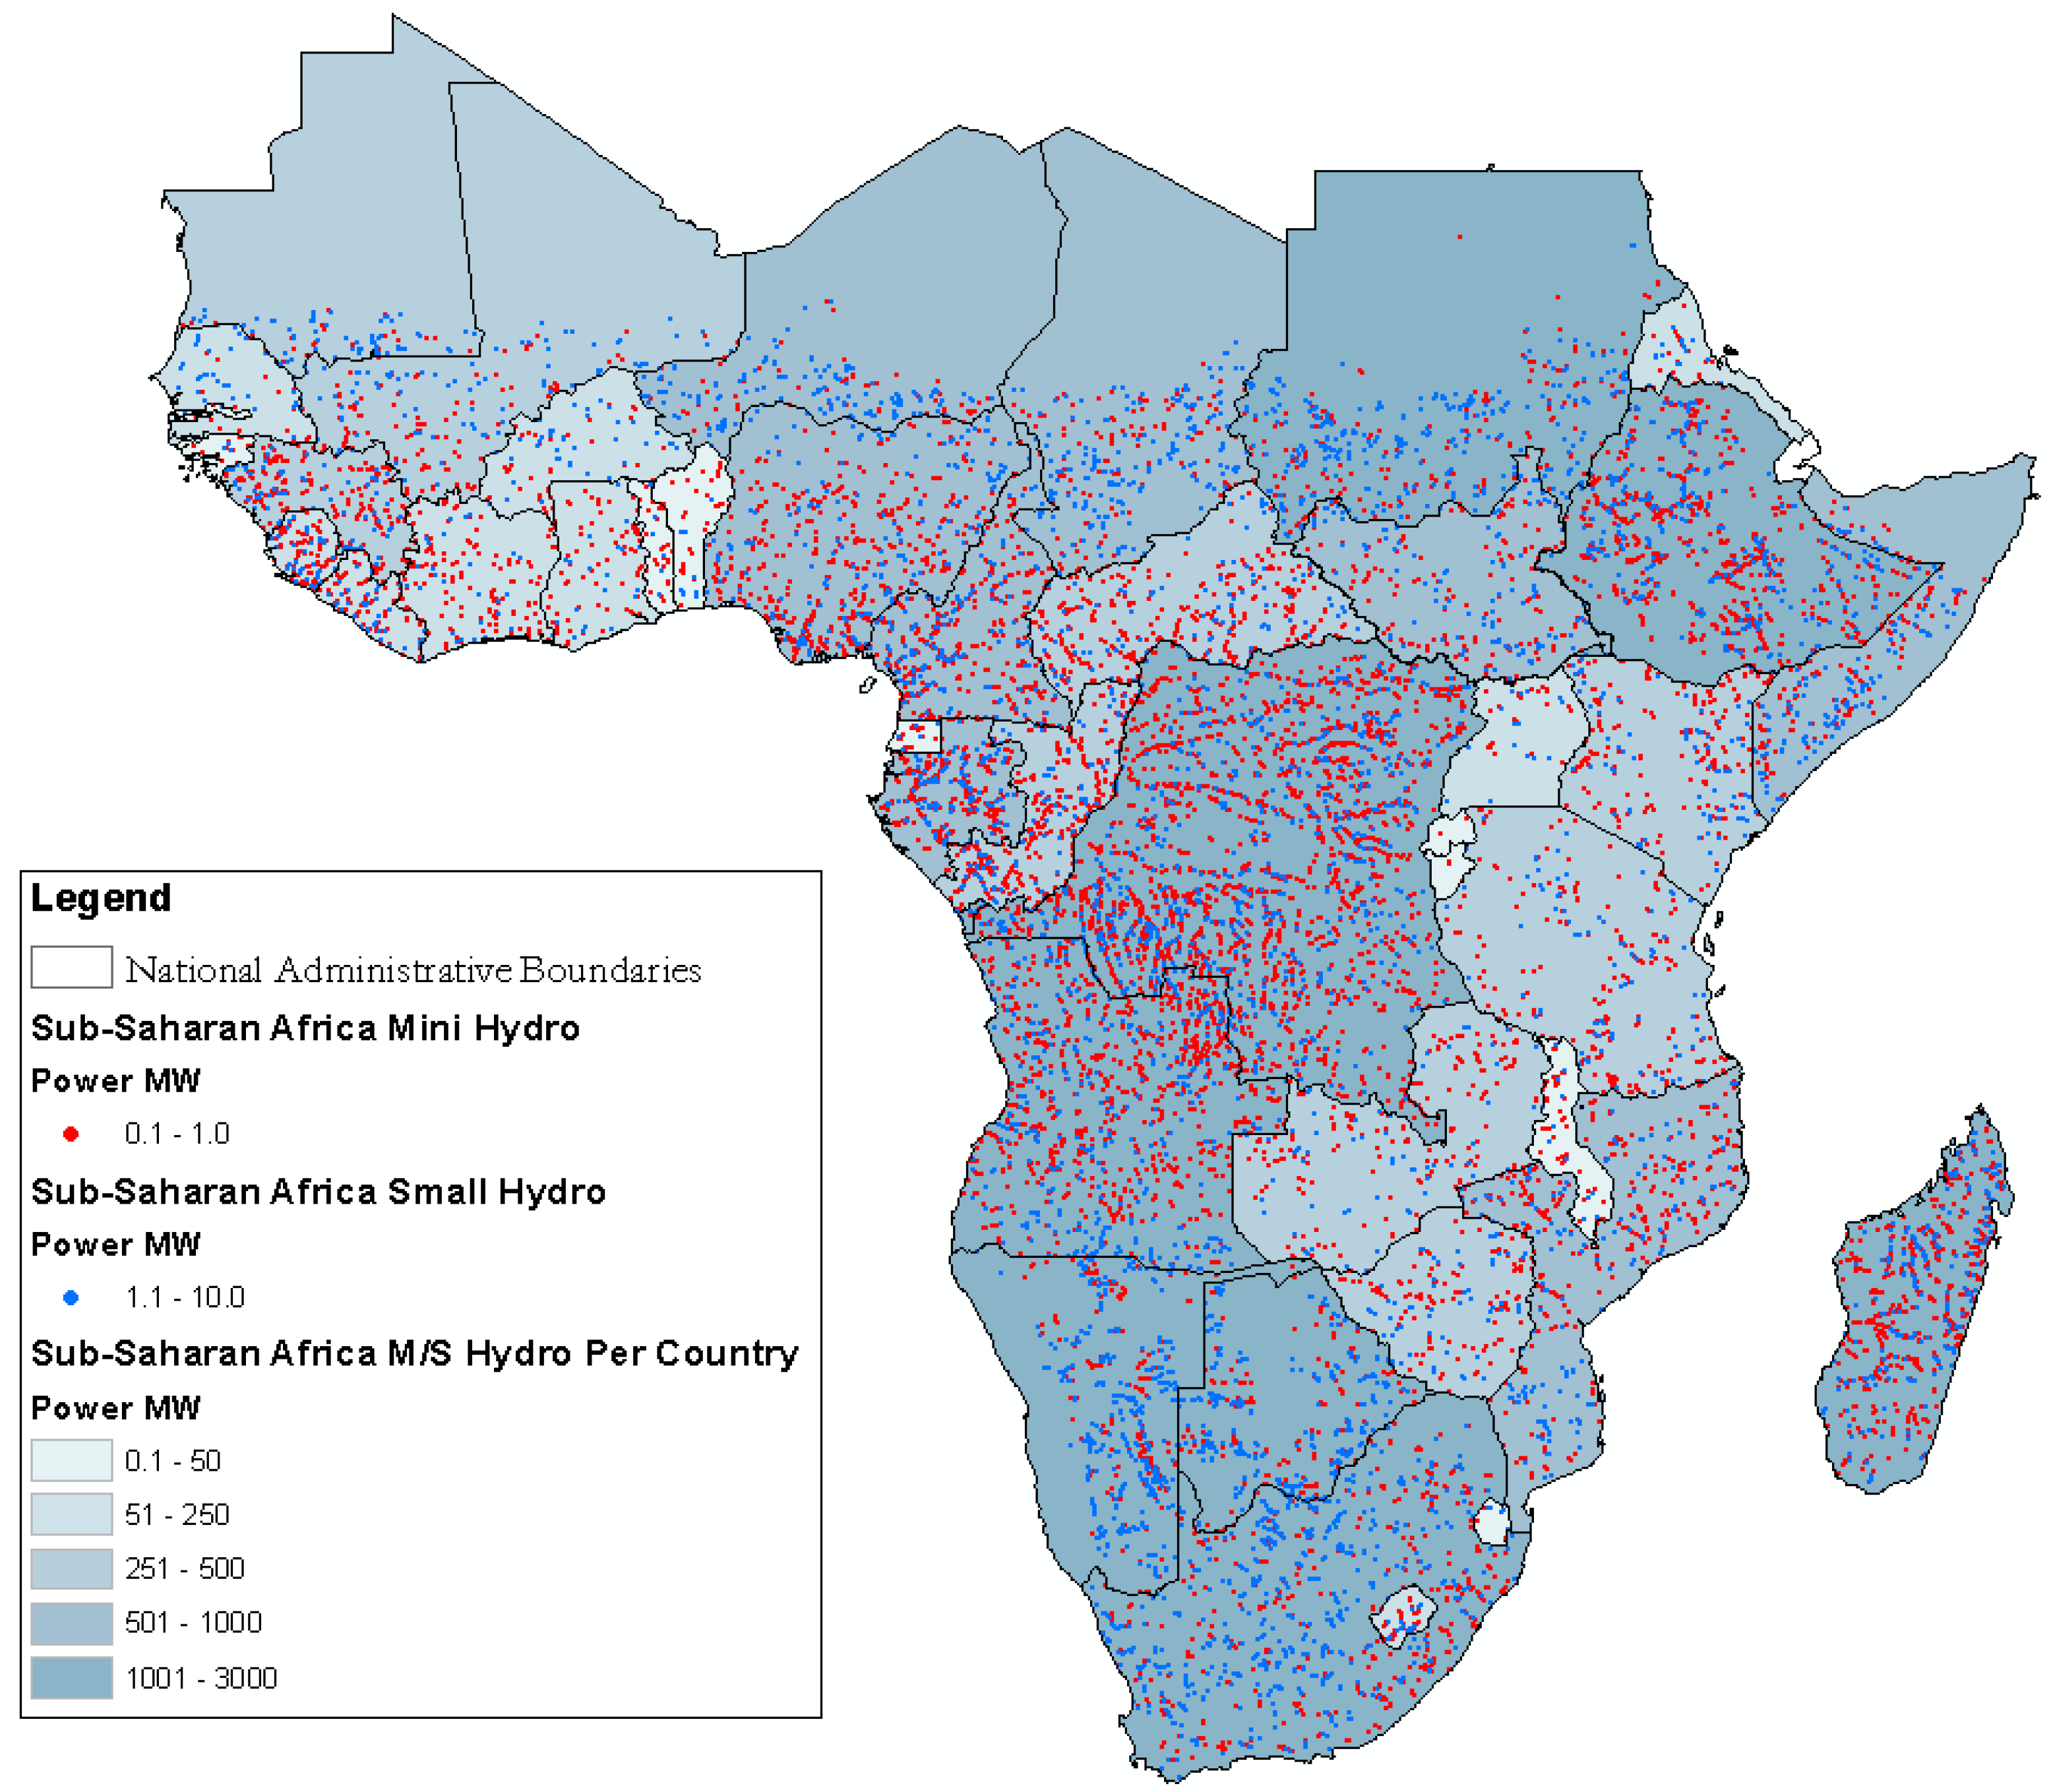
3. Results and Visualization
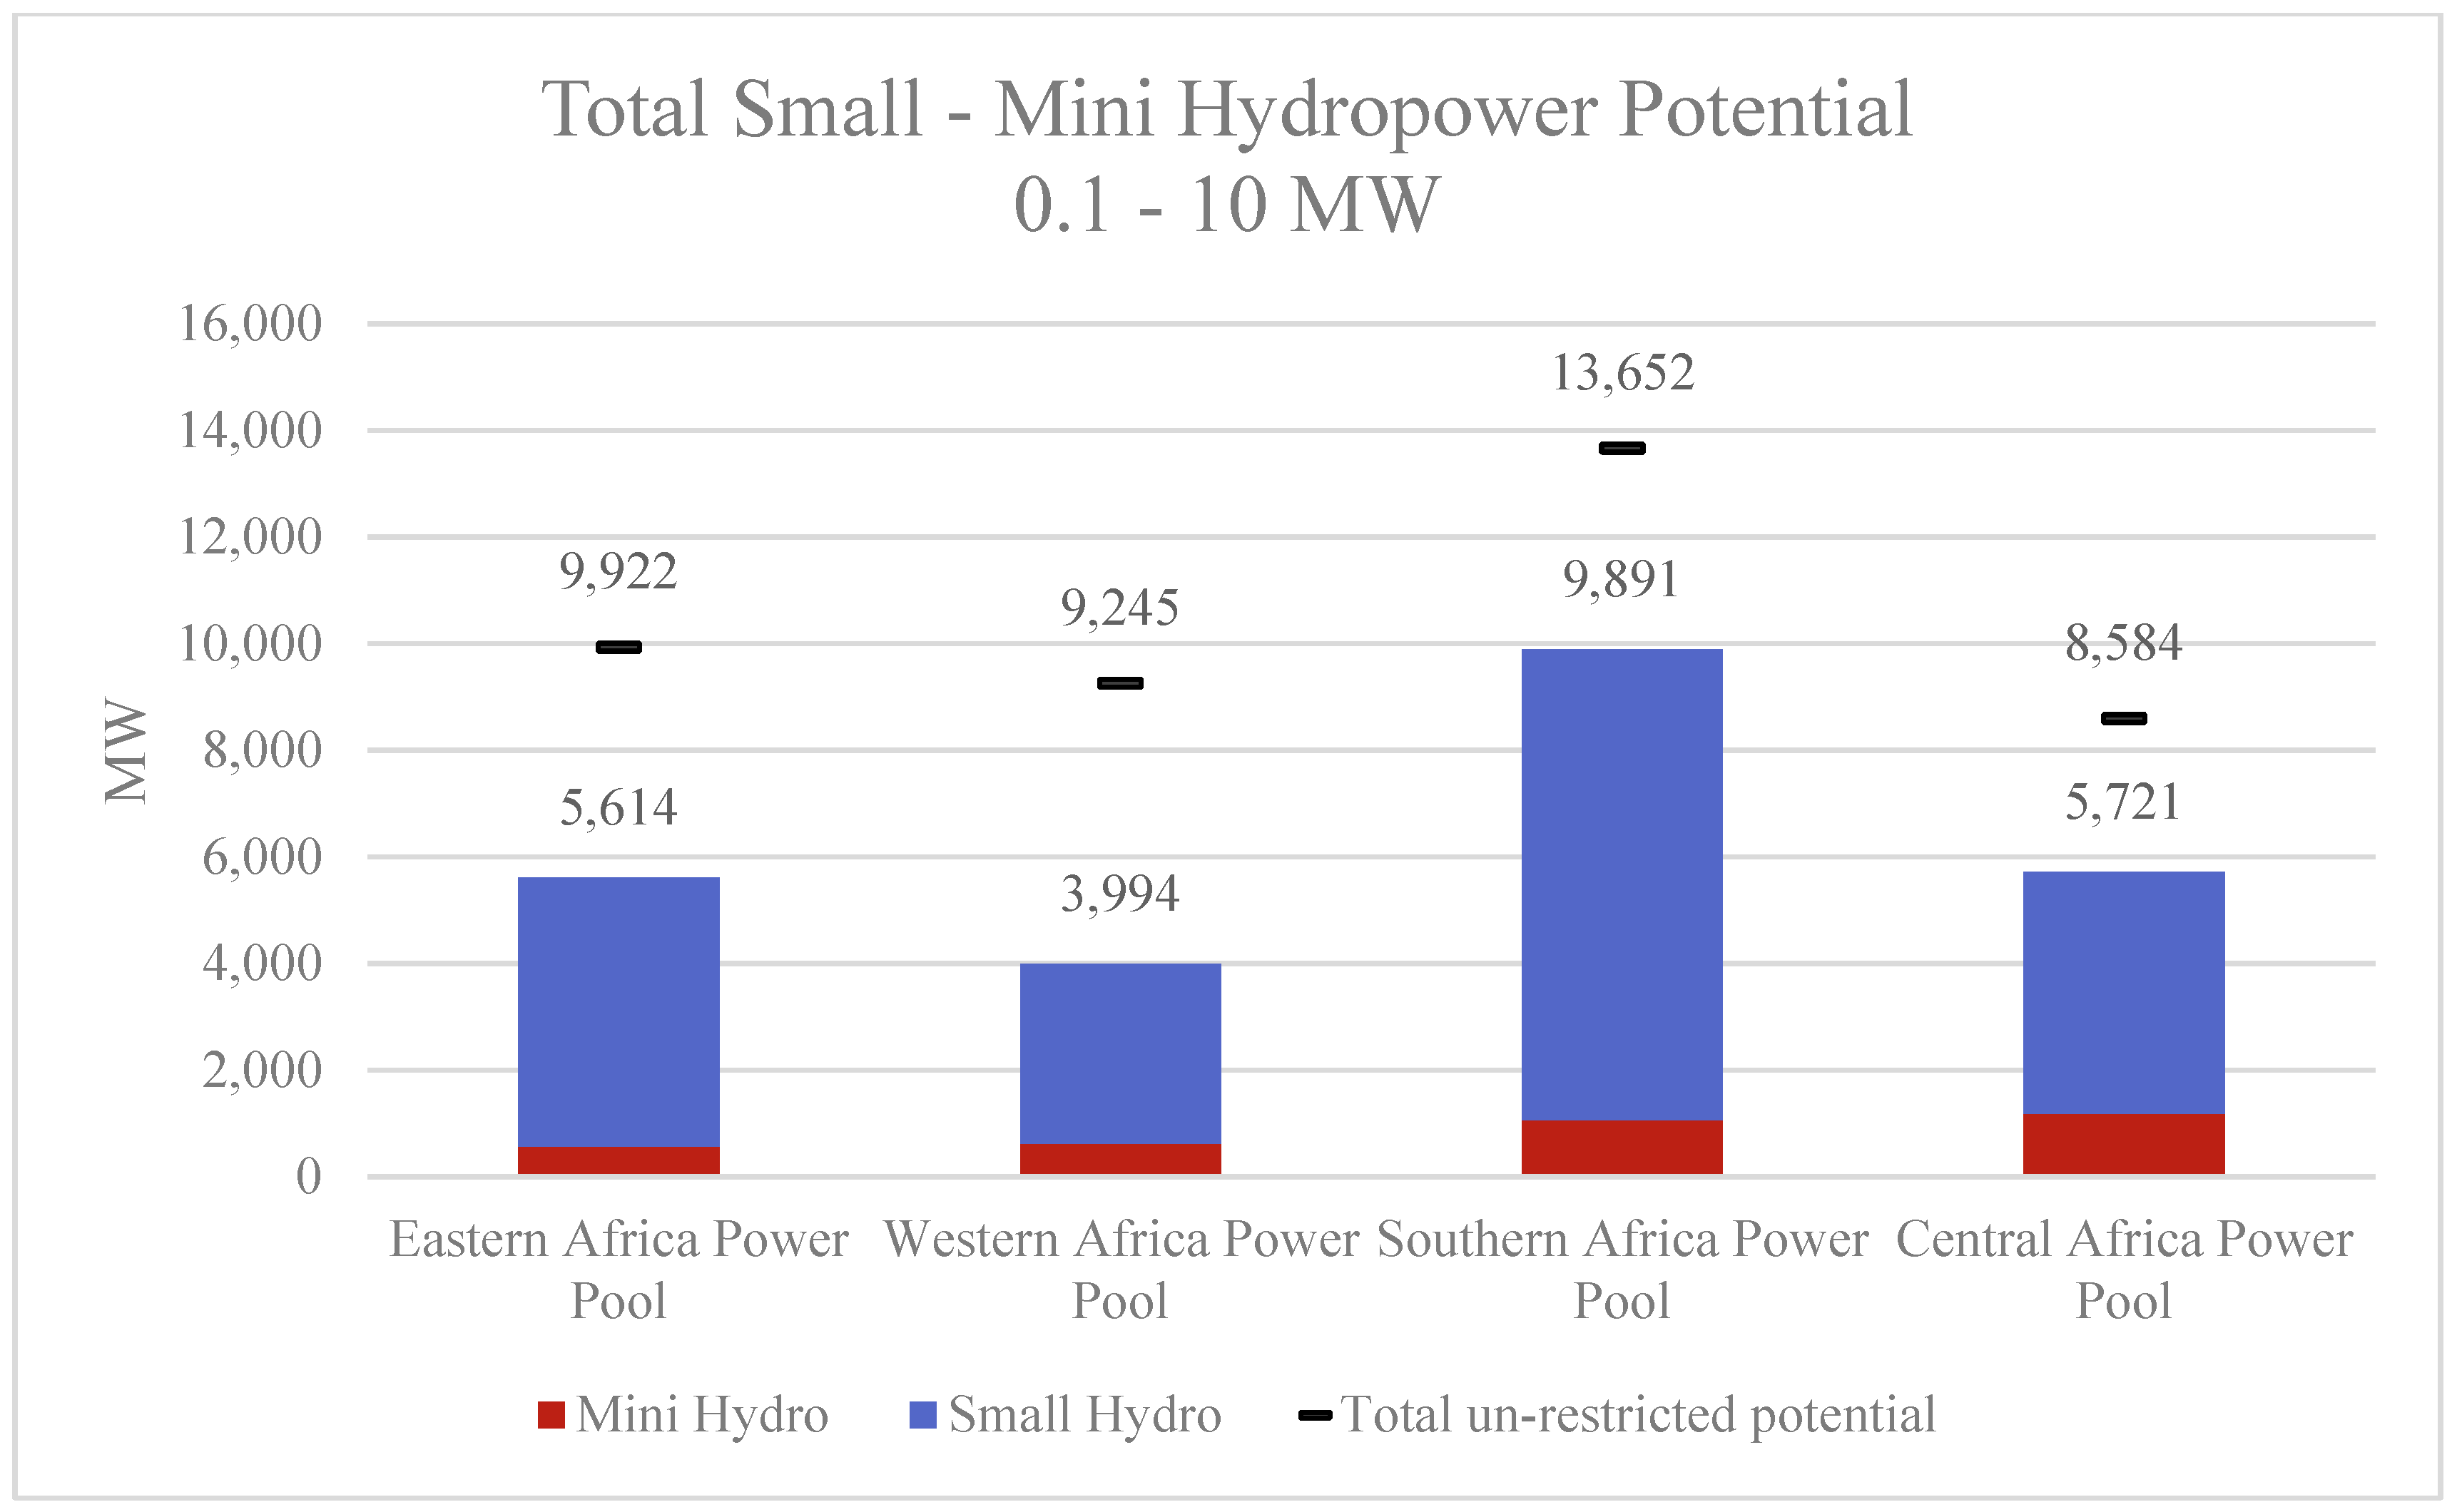
3.1. Mini Hydropower Potential
3.2. Small Hydropower Potential
4. Discussion
5. Conclusions and Final Remarks
Author Contributions
Funding
Conflicts of Interest
Appendix A

| Western Africa Power Pool | Eastern Africa Power Pool | Southern Africa Power Pool | Central Africa Power Pool |
|---|---|---|---|
| Benin | Burundi | Angola | Cameroon |
| Burkina Faso | Djibouti | Botswana | Central African Republic |
| Cote d’Ivoire | Eritrea | Lesotho | Chad |
| The Gambia | Ethiopia | Madagascar | Congo |
| Ghana | Kenya | Malawi | Democratic Republic of Congo |
| Guinea | Rwanda | Mozambique | Equatorial Guinea |
| Guinea Bissau | Somalia | Namibia | Gabon |
| Liberia | Sudan | South Africa | |
| Mali | South Sudan | Swaziland | |
| Mauritania | Tanzania | Zambia | |
| Niger | Uganda | Zimbabwe | |
| Nigeria | |||
| Senegal | |||
| Sierra Leone | |||
| Togo |
Appendix B
| Country Name | Country Code | Natural Mean Annual Runoff 999(Billion m3) | Mini Hydro (0.1–1 MW) | Small Hydro (1.01–10 MW) | Total (MW) | ||
|---|---|---|---|---|---|---|---|
| Identified Sites (#) | Potential Power (MW) | Identified Sites (#) | Potential Power (MW) | ||||
| Angola | AO | 269.2 | 931 | 301.6 | 364 | 1330.5 | 1632.1 |
| Benin | BN | 13.0 | 33 | 11.7 | 10 | 31.8 | 43.5 |
| Botswana | BC | 4.7 | 159 | 70.4 | 292 | 1218.6 | 1288.9 |
| Burkina Faso | UV | 13.4 | 36 | 13.2 | 42 | 232.9 | 246.1 |
| Burundi | BY | 10.6 | 2 | 0.4 | 0 | 0.0 | 0.4 |
| Cameroon | CM | 284.9 | 420 | 144.0 | 142 | 459.2 | 603.2 |
| Central African Republic | CT | 124.5 | 321 | 101.1 | 94 | 287.7 | 388.8 |
| Chad | CD | 20.7 | 111 | 38.1 | 201 | 910.7 | 948.7 |
| Congo | CF | 199.2 | 335 | 106.8 | 96 | 335.1 | 441.9 |
| Congo, DRC | CG | 1075.0 | 2129 | 673.4 | 673 | 2122.2 | 2795.6 |
| Cote d’Ivoire | IV | 91.2 | 146 | 50.0 | 34 | 97.4 | 147.3 |
| Djibouti | DJ | 1.3 | 0 | 0.0 | 0 | 0.0 | 0.0 |
| Equatorial Guinea | EK | 31.5 | 30 | 10.9 | 6 | 13.5 | 24.4 |
| Eritrea | ER | 14.9 | 23 | 8.1 | 16 | 42.9 | 51.0 |
| Ethiopia | ET | 314.3 | 840 | 267.5 | 292 | 947.8 | 1215.4 |
| Gabon | GB | 235.2 | 343 | 105.9 | 129 | 412.1 | 518.1 |
| Ghana | GH | 63.9 | 85 | 29.1 | 21 | 100.8 | 129.9 |
| Guinea | GV | 182.5 | 235 | 80.6 | 71 | 235.6 | 316.3 |
| Guinea-Bissau | PU | 15.8 | 12 | 2.9 | 4 | 15.6 | 18.5 |
| Kenya | KE | 73.0 | 211 | 63.1 | 97 | 399.7 | 462.8 |
| Lesotho | LT | 9.8 | 44 | 10.8 | 17 | 60.9 | 71.7 |
| Liberia | LI | 144.9 | 94 | 30.6 | 37 | 114.3 | 144.9 |
| Madagascar | MA | 376.3 | 660 | 210.7 | 224 | 766.4 | 977.1 |
| Malawi | MI | 27.5 | 56 | 15.8 | 12 | 28.2 | 44.0 |
| Mali | ML | 37.8 | 113 | 35.5 | 89 | 413.4 | 448.9 |
| Mauritania | MR | 11.6 | 27 | 10.1 | 66 | 358.2 | 368.2 |
| Mozambique | MZ | 140.6 | 346 | 110.3 | 151 | 578.6 | 688.9 |
| Namibia | WA | 8.0 | 218 | 96.2 | 371 | 1588.9 | 1685.1 |
| Niger | NG | 11.4 | 71 | 27.1 | 167 | 759.6 | 786.7 |
| Nigeria | NI | 286.7 | 476 | 164.7 | 187 | 653.9 | 818.6 |
| Rwanda | RW | 8.7 | 2 | 0.9 | 0 | 0.0 | 0.9 |
| Senegal | SG | 7.5 | 20 | 6.4 | 34 | 153.7 | 160.1 |
| Sierra Leone | SL | 113.2 | 111 | 36.1 | 48 | 166.0 | 202.1 |
| Somalia | SO | 28.6 | 150 | 50.6 | 141 | 565.9 | 616.5 |
| South Africa | SF | 76.2 | 471 | 165.0 | 583 | 2688.2 | 2853.2 |
| South Sudan | SS | 39.9 | 157 | 52.2 | 125 | 635.9 | 688.1 |
| Sudan | SU | 34.0 | 352 | 123.2 | 435 | 2105.4 | 2228.6 |
| Swaziland | WZ | 2.4 | 5 | 1.5 | 6 | 35.0 | 36.5 |
| Tanzania | TZ | 148.2 | 221 | 76.5 | 81 | 309.0 | 385.5 |
| The Gambia | GA | 0.4 | 1 | 0.5 | 3 | 19.0 | 19.5 |
| Togo | TO | 11.2 | 28 | 8.7 | 6 | 24.7 | 33.4 |
| Uganda | UG | 40.8 | 28 | 8.7 | 15 | 41.1 | 49.8 |
| Zambia | ZA | 140.3 | 204 | 61.3 | 63 | 240.4 | 301.7 |
| Zimbabwe | ZI | 40.6 | 116 | 38.5 | 63 | 299.0 | 337.6 |
| Total | - | 4785 | 10,216 | 3421 | 5383 | 21,800 | 25,221 |
References
- Pachauri, S.; Rao, N.D.; Nagai, Y.; Riahi, K. Access to Modern Energy: Assessment and Outlook for Developing and Emerging Regions; IIASA: Laxenburg, Austria, 2012. [Google Scholar]
- The International Energy Agency (IEA). Energy Access Outlook 2017: From Poverty to Prosperity; International Energy Agency: Paris, France, 2017. [Google Scholar]
- International Energy Agency; International Renewable Energy Agency; United Nations; World Bank; World Health Organization. Tracking SDG7: The Energy Progress Report 2018; World Bank Group: Washington, DC, USA, 2018. [Google Scholar]
- UN Sustainable Development—Knowledge Platform. Available online: https://sustainabledevelopment.un.org/sdg7 (accessed on 17 June 2017).
- Agency, T.I.E. The World Energy Outlook 2014: Outlook for African Energy to 2040; International Energy Agency: Paris, France, 2014. [Google Scholar]
- Hughes, T.P. Networks of Power—Electrification in Western Society, 1880–1930; The John Hopkins University Press: Baltimore, MD, USA, 1983; ISBN 0801846145. [Google Scholar]
- Barnes, D.F. Meeting the Challenge of Rural Electrification in Developing Nations: The Experience of Successful Programs; Energy Sector Management Assistance Program (ESMAP): Washington, DC, USA, 2005. [Google Scholar]
- Javadi, F.S.; Rismanchi, B.; Sarraf, M.; Afshar, O.; Saidur, R.; Ping, H.W.; Rahim, N.A. Global policy of rural electrification. Renew. Sustain. Energy Rev. 2013, 19, 402–416. [Google Scholar] [CrossRef]
- Szabó, S.; Bódis, K.; Huld, T.; Moner-Girona, M. Sustainable energy planning: Leapfrogging the energy poverty gap in Africa. Renew. Sustain. Energy Rev. 2013, 28, 500–509. [Google Scholar] [CrossRef]
- Szabó, S.; Bódis, K.; Huld, T.; Moner-Girona, M. Energy solutions in rural Africa: Mapping electrification costs of distributed solar and diesel generation versus grid extension. Environ. Res. Lett. 2011, 6, 34002. [Google Scholar] [CrossRef]
- Mentis, D.; Howells, M.; Rogner, H.; Korkovelos, A.; Arderne, C.; Zepeda, E.; Siyal, S.; Taliotis, C.; Bazilian, M.; De Roo, A.; et al. Lighting the World: The first application of an open source, spatial electrification tool (OnSSET) on Sub-Saharan Africa. Environ. Res. Lett. 2017, 12. [Google Scholar] [CrossRef]
- Mentis, D.; Andersson, M.; Howells, M.; Rogner, H.; Siyal, S.; Broad, O.; Korkovelos, A.; Bazilian, M. The benefits of geospatial planning in energy access—A case study on Ethiopia. Appl. Geogr. 2016, 72. [Google Scholar] [CrossRef]
- Pachauri, S.; van Ruijven, B.J.; Nagai, Y.; Riahi, K.; van Vuuren, D.P.; Brew-Hammond, A.; Nakicenovic, N. Pathways to achieve universal household access to modern energy by 2030. Environ. Res. Lett. 2013, 8, 24015. [Google Scholar] [CrossRef]
- Mandelli, S.; Barbieri, J.; Mereu, R.; Colombo, E. Off-grid systems for rural electrification in developing countries: Definitions, classification and a comprehensive literature review. Renew. Sustain. Energy Rev. 2016, 58, 1621–1646. [Google Scholar] [CrossRef]
- Greacen, C.; Nsom, S.; Rysankova, D. Scaling Up Access to Electricity; The World Bank: Washington, DC, USA, 2015. [Google Scholar]
- International Hydropower Association (IHA). Hydropower Status Report; International Hydropower Association: London, UK, 2018. [Google Scholar]
- SciDevNet Africa’s Hydropower Future. Available online: https://www.scidev.net/global/energy/data-visualisation/africa-hydropower-future-interactive.html#introduction (accessed on 23 October 2018).
- World Resources Institute (WRI). Global Power Plant Database. Available online: http://datasets.wri.org/dataset/globalpowerplantdatabase (accessed on 23 October 2018).
- African Development Bank Light up and Power Africa. Available online: https://www.afdb.org/en/documents/ (accessed on 23 October 2018).
- Zhou, Y.; Hejazi, M.; Smith, S.; Edmonds, J.; Li, H.; Clarke, L.; Calvin, K.; Thomson, A. A comprehensive view of global potential for hydro-generated electricity. Energy Environ. Sci. 2015, 8, 2622–2633. [Google Scholar] [CrossRef]
- Liu, H.; Masera, D.; Esser, L. World Small Hydropower Development Report; United Nations Industrial Development Organization: New York, NY, USA; International Center on Small Hydro Power: Hangzhou, China, 2013. [Google Scholar]
- Stockholm Environment Institute. Renewable Energy Mini-Grids: An Alternative Approach to Energy Access in Southern Africa; Stockholm Environment Institute: Stockholm, Sweden, 2016. [Google Scholar]
- Yadoo, A.; Cruickshank, H. The role for low carbon electrification technologies in poverty reduction and climate change strategies: A focus on renewable energy mini-grids with case studies in Nepal, Peru and Kenya. Energy Policy 2012, 42, 591–602. [Google Scholar] [CrossRef]
- World Small Hydropower Development Report 2016; United Nations Industrial Development Organization: Vienna, Austria; International Center on Small Hydro Power: Hangzhou, China, 2016.
- The International Renewable Energy Agency (IRENA). Africa 2030: Roadmap for a Renewable Energy Future; IRENA: Bohn, Germany, 2015. [Google Scholar]
- Kougias, I.; Szabo, S.; Monforti-Ferrario, F.; Huld, T.; Bodis, K. A methodology for optimization of the complementarity between small-hydropower plants and solar PV systems. Renew. Energy 2016, 87, 1023–1030. [Google Scholar] [CrossRef]
- Ebhota, W.S.; Inambao, F.L. Facilitating greater energy access in rural and remote areas of sub-Saharan Africa: Small hydropower. Energy Environ. 2017, 28, 316–329. [Google Scholar] [CrossRef]
- Hermann, S.; Miketa, A.; Fichaux, N. Estimating the Renewable Energy Potential in Africa; International Renewable Energy Agency, Abu Dhabi and KTH Royal Institute of Technology: Stockhom, Sweden, 2014. [Google Scholar]
- Kaunda, C.S.; Kimambo, C.Z.; Nielsen, T.K. Potential of Small-Scale Hydropower for Electricity Generation in Sub-Saharan Africa. ISRN Renew. Energy 2012, 2012, 132606. [Google Scholar] [CrossRef]
- Adu, D.; Zhang, J.; Fang, Y.; Suoming, L.; Darko, R.O. A Case Study of Status and Potential of Small Hydro-Power Plants in Southern African Development Community. Energy Procedia 2017, 141, 352–359. [Google Scholar] [CrossRef]
- Kling, H.; Stanzel, P.; Fuchs, M. Regional Assessment of the Hydropower Potential of Rivers in West Africa. Energy Procedia 2016, 97, 286–293. [Google Scholar] [CrossRef]
- Klunne, J.W. Small hydropower in Southern Africa—An overview of five countries in the region. J. Energy S. Afr. 2013, 24, 14–33. [Google Scholar]
- Klunne, W.J. Barriers to the uptake of small hydropower for rural electrification in Africa. In Proceedings of the 30th ISES Biennial Solar World Congress 2011, Kassel, Germany, 28 August–2 September 2011; Volume 2, pp. 1034–1042. [Google Scholar]
- Larentis, D.G.; Collischonn, W.; Olivera, F.; Tucci, C.E.M. Gis-based procedures for hydropower potential spotting. Energy 2010, 35, 4237–4243. [Google Scholar] [CrossRef]
- Palomino Cuya, D.G.; Brandimarte, L.; Popescu, I.; Alterach, J.; Peviani, M. A GIS-based assessment of maximum potential hydropower production in La Plata basin under global changes. Renew. Energy 2013, 50, 103–114. [Google Scholar] [CrossRef]
- Dudhani, S.; Sinha, A.K.; Inamdar, S.S. Assessment of small hydropower potential using remote sensing data for sustainable development in India. Energy Policy 2006, 34, 3195–3205. [Google Scholar] [CrossRef]
- Soulis, K.X.; Manolakos, D.; Anagnostopoulos, J.; Papantonis, D. Development of a geo-information system embedding a spatially distributed hydrological model for the preliminary assessment of the hydropower potential of historical hydro sites in poorly gauged areas. Renew. Energy 2016, 92, 222–232. [Google Scholar] [CrossRef]
- Cyr, J.F.; Landry, M.; Gagnon, Y. Methodology for the large-scale assessment of small hydroelectric potential: Application to the Province of New Brunswick (Canada). Renew. Energy 2011, 36, 2940–2950. [Google Scholar] [CrossRef]
- Ballance, A.; Stephenson, D.; Chapman, R.; Muller, J. A geographic information systems analysis of hydro power potential in South Africa. J. Hydroinform. 2000, 2, 247–254. [Google Scholar] [CrossRef]
- Rojanamon, P.; Chaisomphob, T.; Bureekul, T. Application of geographical information system to site selection of small run-of-river hydropower project by considering engineering/economic/environmental criteria and social impact. Renew. Sustain. Energy Rev. 2009, 13, 2336–2348. [Google Scholar] [CrossRef]
- Coskun, H.G.; Alganci, U.; Eris, E.; Agiralioglu, N.; Cigizoglu, H.K.; Yilmaz, L.; Toprak, Z.F. Remote Sensing and GIS Innovation with Hydrologic Modelling for Hydroelectric Power Plant (HPP) in Poorly Gauged Basins. Water Resour. Manag. 2010, 24, 3757–3772. [Google Scholar] [CrossRef]
- Yi, C.S.; Lee, J.H.; Shim, M.P. Site location analysis for small hydropower using geo-spatial information system. Renew. Energy 2010, 35, 852–861. [Google Scholar] [CrossRef]
- Wali, U.G. Estimating Hydropower Potential of an Ungauged Stream. Int. J. Emerg. Technol. Adv. Eng. 2013, 3, 592–600. [Google Scholar]
- Kusre, B.C.; Baruah, D.C.; Bordoloi, P.K.; Patra, S.C. Assessment of hydropower potential using GIS and hydrological modeling technique in Kopili River basin in Assam (India). Appl. Energy 2010, 87, 298–309. [Google Scholar] [CrossRef]
- Bayazıt, Y.; Bakış, R.; Koç, C. An investigation of small scale hydropower plants using the geographic information system. Renew. Sustain. Energy Rev. 2017, 67, 289–294. [Google Scholar] [CrossRef]
- Serpoush, B.; Khanian, M.; Shamsai, A. Hydropower plant site spotting using geographic information system and a MATLAB based algorithm. J. Clean. Prod. 2017, 152, 7–16. [Google Scholar] [CrossRef]
- Müller, M.F.; Thompson, S.E.; Kelly, M.N. Bridging the information gap: A webGIS tool for rural electrification in data-scarce regions. Appl. Energy 2016, 171, 277–286. [Google Scholar] [CrossRef]
- Moya, I.; Gastón, M.; Casajús, L.; Sánchez, D.; Cantero, E.; Togeby, M.; Energianalyse, E.; Jafaru, H.E.; Rahman, A.; Vilar, D.; et al. Africa Power Sector: Planning and prospects for Renewable Energy; The International Renewable Energy Agency: Abu Dhabi, UAE, 2015. [Google Scholar]
- Marks, J.; Burles, D.; Ford, M.; Marks, D.; Slater, D. Status Report Update: 2016 A Mid-Term Report on Progress, Achievements and Future Perspectives; European Union Energy Initiative Partnership Dialogue Facility (EUEI PDF): Eschborn, Germany, 2016. [Google Scholar]
- GADM Maps and Data: Global Administrative Boundaries. Available online: https://gadm.org/ (accessed on 23 October 2018).
- Shahin, M. Hydrology and Water Resources of Africa. In Hydrology and Water Resources of Africa; Springer: Dordrecht, The Netherlands, 2002; pp. 1–24. [Google Scholar]
- United Nations Environment Programme (UNEP). Africa Water Atlas; United Nations Environment Programme: Nairobi, Kenya, 2010. [Google Scholar]
- Lehner, B.; Verdin, K.; Jarvis, A. New Global Hydrography Derived From Spaceborne Elevation Data. Eos Trans. Am. Geophys. Union 2008, 89, 93. [Google Scholar] [CrossRef]
- Jarvis, A.; Guevara, E.; Reuter, H.I.; Nelson, A.D. Hole-Filled SRTM for the Globe Version 4, Available from the CGIAR-CSI SRTM 90m Database; CGIAR-CSI: Cali, Colombia, 2008. [Google Scholar]
- Beck, H.E.; van Dijk, A.I.J.M.; Miralles, D.G.; de Jeu, R.A.M.; Sampurno Bruijnzeel, L.A.; McVicar, T.R.; Schellekens, J. Global patterns in base flow index and recession based on streamflow observations from 3394 catchments. Water Resour. Res. 2013, 49, 7843–7863. [Google Scholar] [CrossRef]
- Beck, H.E.; de Roo, A.; van Dijk, A.I.J.M. Global Maps of Streamflow Characteristics Based on Observations from Several Thousand Catchments. J. Hydrometeorol. 2015, 16, 1478–1501. [Google Scholar] [CrossRef]
- NASA Socioeconomic Data and Applications Center (SEDAC) Millennium Ecosystem Assessment: MA Ecosystems. Available online: http://sedac.ciesin.columbia.edu/data/set/ma-ecosystems (accessed on 23 October 2018).
- UNEP-WCMC and IUCN Protected Planet: The World Database on Protected Areas (WDPA). Available online: https://www.protectedplanet.net/c/terms-and-conditions (accessed on 23 October 2018).
- USGS/Earth Resources Observation and Science (EROS). Center Land Cover Type Yearly L3 Global 0.05Deg CMG, MCD12C1 Courtesy of the NASA Land Processes Distributed Active Archive Center (LP DAAC). Available online: https://lpdaac.usgs.gov/dataset_discovery/modis/modis_products_table/mcd12c1 (accessed on 23 October 2018).
- Van Der Knijff, J.M.; Younis, J.; De Roo, A.P.J. LISFLOOD: A GIS—Based distributed model for river basin scale water balance and flood simulation. Int. J. Geogr. Inf. Sci. 2010, 24, 189–212. [Google Scholar] [CrossRef]
- The Global Runoff Data Centre. GRDC Station Catalogue; Federal Institute of Hydrology (BfG): Koblenz, Germany, 2016. [Google Scholar]
- Hennemuth, B.; Bender, S.; Bülow, K.; Dreier, N.; Keup-Thiel, E.; Krüger, O.; Mudersbach, C.; Radermacher, C.; Schoetter, R. Statistical Methods for the Analysis of Simulated and Observed Climate Data Applied in Projects and Institutions Dealing with Climate Change Impact and Adaptation; Climate Service Center (CSC): Hamburg, Germany, 2013. [Google Scholar]
- Moriasi, D.N.; Arnold, J.G.; Van Liew, M.W.; Binger, R.L.; Harmel, R.D.; Veith, T.L. Model evaluation guidelines for systematic quantification of accuracy in watershed simulations. Trans. ASABE 2007, 50, 885–900. [Google Scholar] [CrossRef]
- International Renewable Energy Agency. Renewable Energy Technologies: Cost Analysis Series; IRENA: Abu Dhabi, UAE, 2012. [Google Scholar]
- Weedon, G.P.; Balsamo, G.; Bellouin, N.; Gomes, S.; Best, M.J.; Viterbo, P. The WFDEI meteorological forcing data set: WATCH Forcing Data methodology applied to ERA-Interim reanalysis data. Water Resour. Res. 2014, 50, 7505–7514. [Google Scholar] [CrossRef]
- Hijmans, R.J.; Cameron, S.E.; Parra, J.L.; Jones, P.G.; Jarvis, A. Very high resolution interpolated climate surfaces for global land areas. Int. J. Climatol. 2005, 25, 1965–1978. [Google Scholar] [CrossRef]
- International Finance Corporation (IFC). Hydroelectric Power: A Guide for Developers and Investors; International Finance Corporation (IFC): Washington, DC, USA, 2015. [Google Scholar]
- Wagner, H.-J.; Mathur, J. Introduction and Status of Hydropower. In Introduction to Hydro Energy Systems. Green Energy and Technology; Introduction to Hydro Energy Systems; Green Energy and Technology Springer: Berlin, Heidelberg, 2011; pp. 1–20. [Google Scholar]
- Acreman, M.C.; Dunbar, M.J. Defining environmental river flow requirements—A review. Hydrol. Earth Syst. Sci. 2004, 8, 861–876. [Google Scholar] [CrossRef]
- European Small Hydropower Association. How to Develop a Small Hydropower Plant ESHA 2004; ESHA: Brussels, Belgium, 2004. [Google Scholar]
- Ebhota, W.; Tabakov, P.Y. Hydropower Potentials and Effects of Poor Manufacturing Infrastructure on Small Hydropower Development in Sub-Saharan Africa. Int. J. Energy Econ. Policy 2017, 7, 60–67. [Google Scholar]
- Strahler, A.N. Quantitative analysis of watershed geomorphology. Trans. Am. Geophys. Union 1957, 38, 913. [Google Scholar] [CrossRef]
- Hornby, D. RivEX ArcMAP Plugin for River Network Delineations, Version 10.26. Available online: http://www.rivex.co.uk/index.html (accessed on 24 July 2016).
- Partow, H. Water Issues in the Democratic Republic of the Congo Challenges and Opportunities; United Nations Environment Programme (UNEP): Nairobi, Kenya, 2011. [Google Scholar]
- UNDESA/UNDP Modelling Tools for Sustainable Development. Available online: https://un-modelling.github.io/electrification-paths-presentation/ (accessed on 10 November 2018).
- The World Bank Electrification Pathways Web Application. Available online: http://electrification.energydata.info/presentation/ (accessed on 10 November 2018).
- Scharfetter, B.; Van Dijk, M. Legislation governing the implementation of small-scale hydropower projects for rural electrification in South Africa. J. Energy S. Afr. 2017, 28, 14. [Google Scholar] [CrossRef]
- Bonthuys, G.J.; Van Dijk, M.; Bhagwan, J.N. A feasibility and implementation model of small-scale hydropower development for rural electrification in South Africa: A case study of Kwa Madiba SSHP Plant. Water SA 2016, 42, 528. [Google Scholar] [CrossRef]
- Idiaghe, L. Legislation on Hydropower Use and Development. Sustain. Hydropower West Afr. 2018, 159–187. [Google Scholar] [CrossRef]
- The International Renewable Energy Agency. Renewable Power Generation Costs in 2017; IRENA: Abu Dhabi, UAE, 2018. [Google Scholar]
- Williams, J.C. Otherwise a mere clod: California rural electrification. IEEE Technol. Soc. Mag. 1988, 7, 13–19, 29. [Google Scholar] [CrossRef]
- Jiahua, P.; Li, M.; Xiangyang, W.; Lishuang, W.; Elias, R.J.; Victor, D.G.; Zerriffi, H.; Zhang, C.; Wuyuan, P. Rural Electrification in China 1950–2004: Historical Processes and Key Driving Forces; Center for Environmental Science and Policy at Stanford University: Stanford, CA, USA, 2006. [Google Scholar]
- Alam, Q.; Reza, S.; Khurshid-ul-Alam, S.M.; Saleque, K. A Review of Hydropower Projects in Nepal. Energy Procedia 2017, 110, 581–585. [Google Scholar] [CrossRef]
- Ahlborg, H.; Sjöstedt, M. Small-scale hydropower in Africa: Socio-technical designs for renewable energy in Tanzanian villages. Energy Res. Soc. Sci. 2015, 5, 20–33. [Google Scholar] [CrossRef]
- ESMAP Tracking SDG7 | Progress Towards Sustainable Energy. Available online: https://trackingsdg7.esmap.org/ (accessed on 26 October 2018).
- Taliotis, C.; Shivakumar, A.; Ramos, E.; Howells, M.; Mentis, D.; Sridharan, V.; Broad, O.; Mofor, L. An indicative analysis of investment opportunities in the African electricity supply sector—Using TEMBA (The Electricity Model Base for Africa). Energy Sustain. Dev. 2016, 31, 50–66. [Google Scholar] [CrossRef]
- Korkovelos, A. Sub Saharan Africa—Small and Mini Hydropower Potential. 2016. Available online: https://energydata.info/dataset/small-and-mini-hydropower-potential-in-sub-saharan-africa (accessed on 25 October 2018).


| Dataset | Type | Source |
|---|---|---|
| Digital Elevation Map (DEM-SRTM) | Raster | [54] |
| Global River Network (HydroSHEDS) | Vector (Polyline) | [53] |
| Global Streamflow Characteristics Dataset (GSCD) | Raster | [55,56] |
| Administrative Boundaries | Vector (Polygon) | [50] |
| Restriction Zones | Raster–Vector | [57,58,59] |
| Source of Discharge Layer | Spatial Resolution (Degrees) | Available Time Resolution | Successful Value Assignment to 1393 Measurement Points (Gauged Stations) | Pearson’s Correlation Coefficient (r) | Coefficient of Determination (R2) | |
|---|---|---|---|---|---|---|
| Over All Stations (%) | Simulated Values within ±10% from Observed Values (%) | |||||
| DEM + GSDC | 0.00083 | Yearly average | 98.6 | 73.4 | 0.776 | 0.602 |
| LISFLOOD | 0.1 | Daily values (1999–2000) | 92.8 | 80.3 | 0.524 | 0.274 |
| Layer | Type | Buffer | Source |
|---|---|---|---|
| Inland water | Lakes, Wetlands, Stagnant Waters | - | [57] |
| Croplands | Cultivated Areas | 200 m | [59] |
| Built-Up | Residential Areas | 100 m | [59] |
| Protected areas | Strict Nature Reserves, Wilderness Areas, National Parks, Natural Monument, Habitat/Species Management, Protected Landscape, Managed Resource Protected Areas | 500 m | [58] |
| Barren land | Desert and Inhabitable Areas | - | [59] |
| Stream order | Confluence of more than three rivers | - | using [73] |
| Power Pool. | Total Area | Restrictions | Share |
|---|---|---|---|
| Name | (Million km2) | (%) | |
| Southern Africa Power Pool | 7.5 | 2.6 | 34.7 |
| Western Africa Power Pool | 6.5 | 4.2 | 64.6 |
| Eastern Africa Power Pool | 7 | 3.4 | 48.6 |
| Central Africa Power Pool | 5.5 | 1.8 | 32.7 |
| Total Sub-Saharan Africa | 26.5 | 12 | 45.3 |
| Power Pool | Natural Mean Annual Runoff | M/S Hydropower Sites | M/S Hydropower Potential | Suitable Land | Small-Scale Hydropower Availability Index |
|---|---|---|---|---|---|
| Name | (billion m3) | # | (MW) | (Million km2) | (kW/km2) |
| Southern Africa Power Pool | 1095 | 5356 | 9917 | 4.9 | 2.02 |
| Western Africa Power Pool | 1004 | 2307 | 3884 | 2.3 | 1.69 |
| Eastern Africa Power Pool | 714 | 3188 | 5699 | 3.6 | 1.58 |
| Central Africa Power Pool | 1341 | 5030 | 5721 | 3.7 | 1.55 |
| Total Sub-Saharan Africa | 4785 | 15,881 | 25,221 | 14.5 | 1.74 |
© 2018 by the authors. Licensee MDPI, Basel, Switzerland. This article is an open access article distributed under the terms and conditions of the Creative Commons Attribution (CC BY) license (http://creativecommons.org/licenses/by/4.0/).
Share and Cite
Korkovelos, A.; Mentis, D.; Siyal, S.H.; Arderne, C.; Rogner, H.; Bazilian, M.; Howells, M.; Beck, H.; De Roo, A. A Geospatial Assessment of Small-Scale Hydropower Potential in Sub-Saharan Africa. Energies 2018, 11, 3100. https://doi.org/10.3390/en11113100
Korkovelos A, Mentis D, Siyal SH, Arderne C, Rogner H, Bazilian M, Howells M, Beck H, De Roo A. A Geospatial Assessment of Small-Scale Hydropower Potential in Sub-Saharan Africa. Energies. 2018; 11(11):3100. https://doi.org/10.3390/en11113100
Chicago/Turabian StyleKorkovelos, Alexandros, Dimitrios Mentis, Shahid Hussain Siyal, Christopher Arderne, Holger Rogner, Morgan Bazilian, Mark Howells, Hylke Beck, and Ad De Roo. 2018. "A Geospatial Assessment of Small-Scale Hydropower Potential in Sub-Saharan Africa" Energies 11, no. 11: 3100. https://doi.org/10.3390/en11113100
APA StyleKorkovelos, A., Mentis, D., Siyal, S. H., Arderne, C., Rogner, H., Bazilian, M., Howells, M., Beck, H., & De Roo, A. (2018). A Geospatial Assessment of Small-Scale Hydropower Potential in Sub-Saharan Africa. Energies, 11(11), 3100. https://doi.org/10.3390/en11113100