When the completed fuel economy prediction model was applied to fixed-type and variable-type cylinder deactivation for each vehicle, the fuel economy improvement was examined and we confirmed the cause of difference in fuel economy improvement between two cylinder deactivation control methods. Furthermore, the effects of variables that may occur when the engine load and engine thermal efficiency were changed under cylinder deactivation application were investigated.
3.1. Comparision of Fuel Economy Improvement by Cylinder Deactivation Method
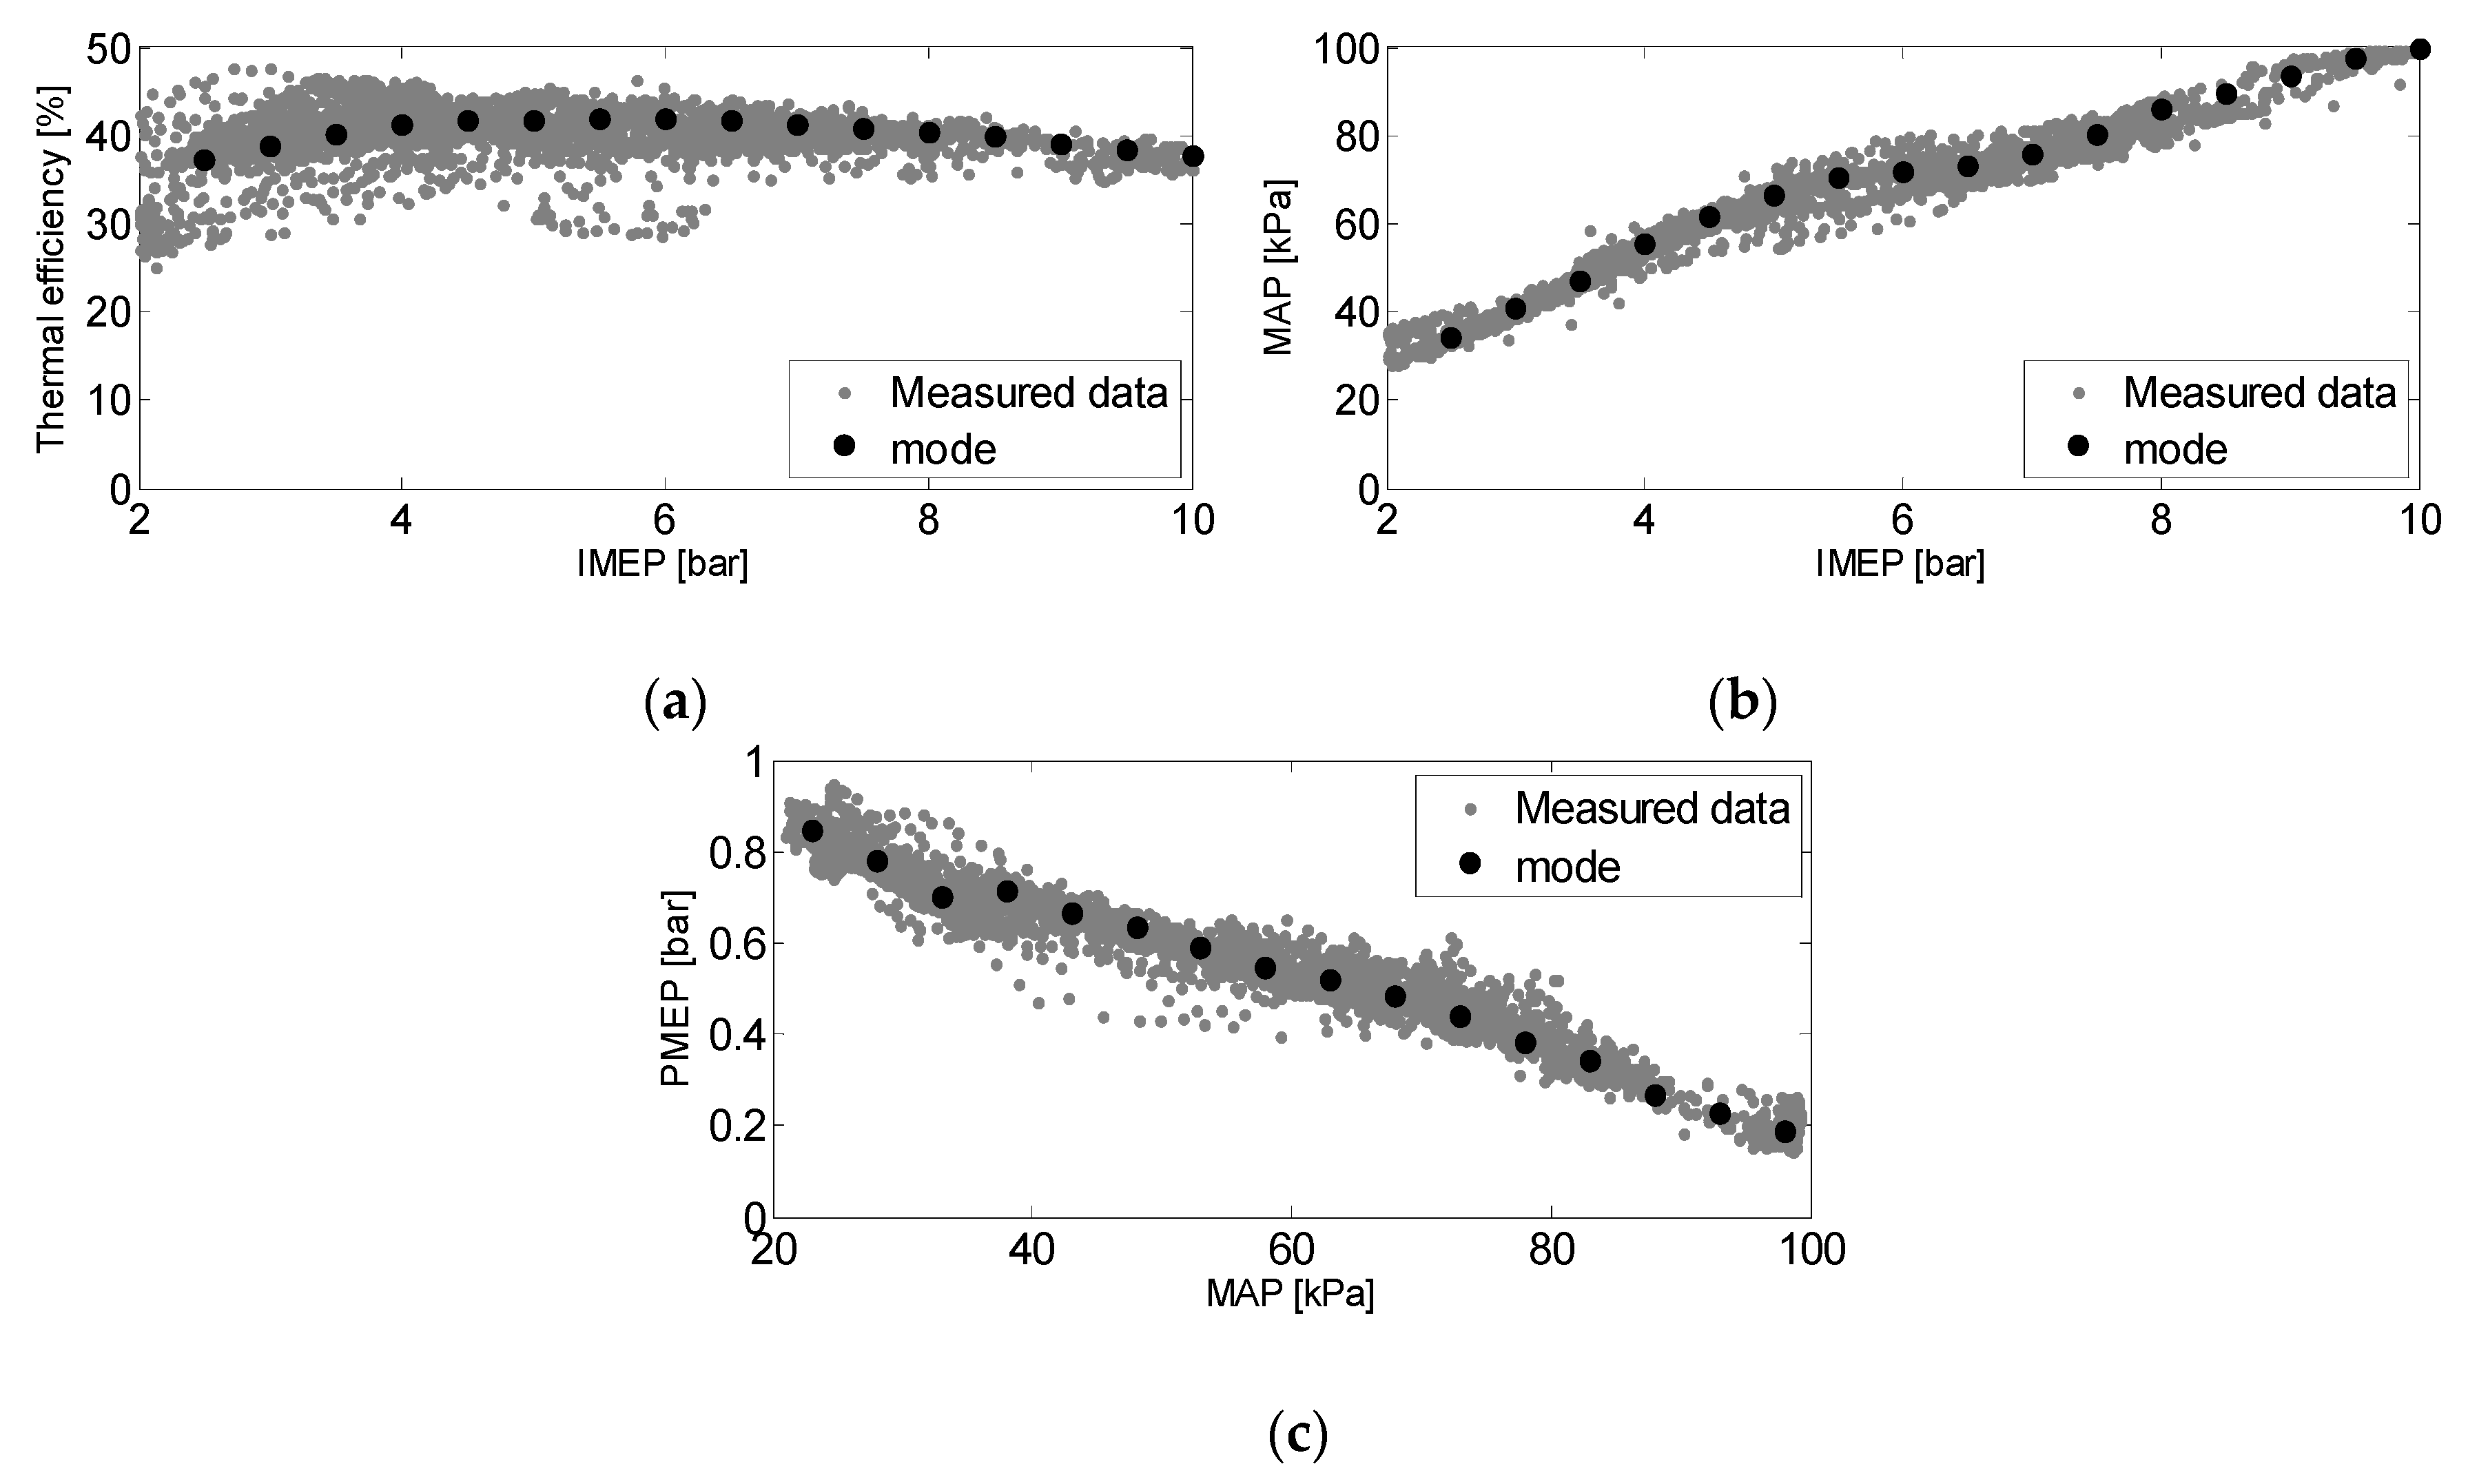
In this study, fixed-type and variable-type cylinder deactivation fuel economy simulations were performed for the test vehicles, and the fuel economy improvement depending on the cylinder deactivation method were compared using the obtained IMEP, PMEP, MAP, and fuel.
Table 3 summarizes the fuel economy improvement simulation results under cylinder deactivation application for each vehicle. The mean NMEP values are different because the engine displacement and equivalent test weight (ETW) are different. Furthermore, the fuel economy improvement ranges from 2.2% to 12.9%; it was lowest for vehicle 1 and highest for vehicle 4.
A comparison of the fuel economy improvement between variable-type cylinder deactivation and fixed-type cylinder deactivation revealed that the fuel economy improvement was larger as the number of cylinders and displacement increased and the effect was smaller as the engine size decreased. The fuel economy improvement of variable-type cylinder deactivation increased for engines with larger displacement because the number of cylinders to be controlled increased.
Although the predicted fuel economy improvement was compared, as shown in
Table 3, instantaneous simulation data were used to examine the fuel economy improvement under cylinder deactivation application in more detail. Instantaneous data were examined using the data for vehicle 3.
Table 4 summarizes the mean engine performance data of the driving cycle.
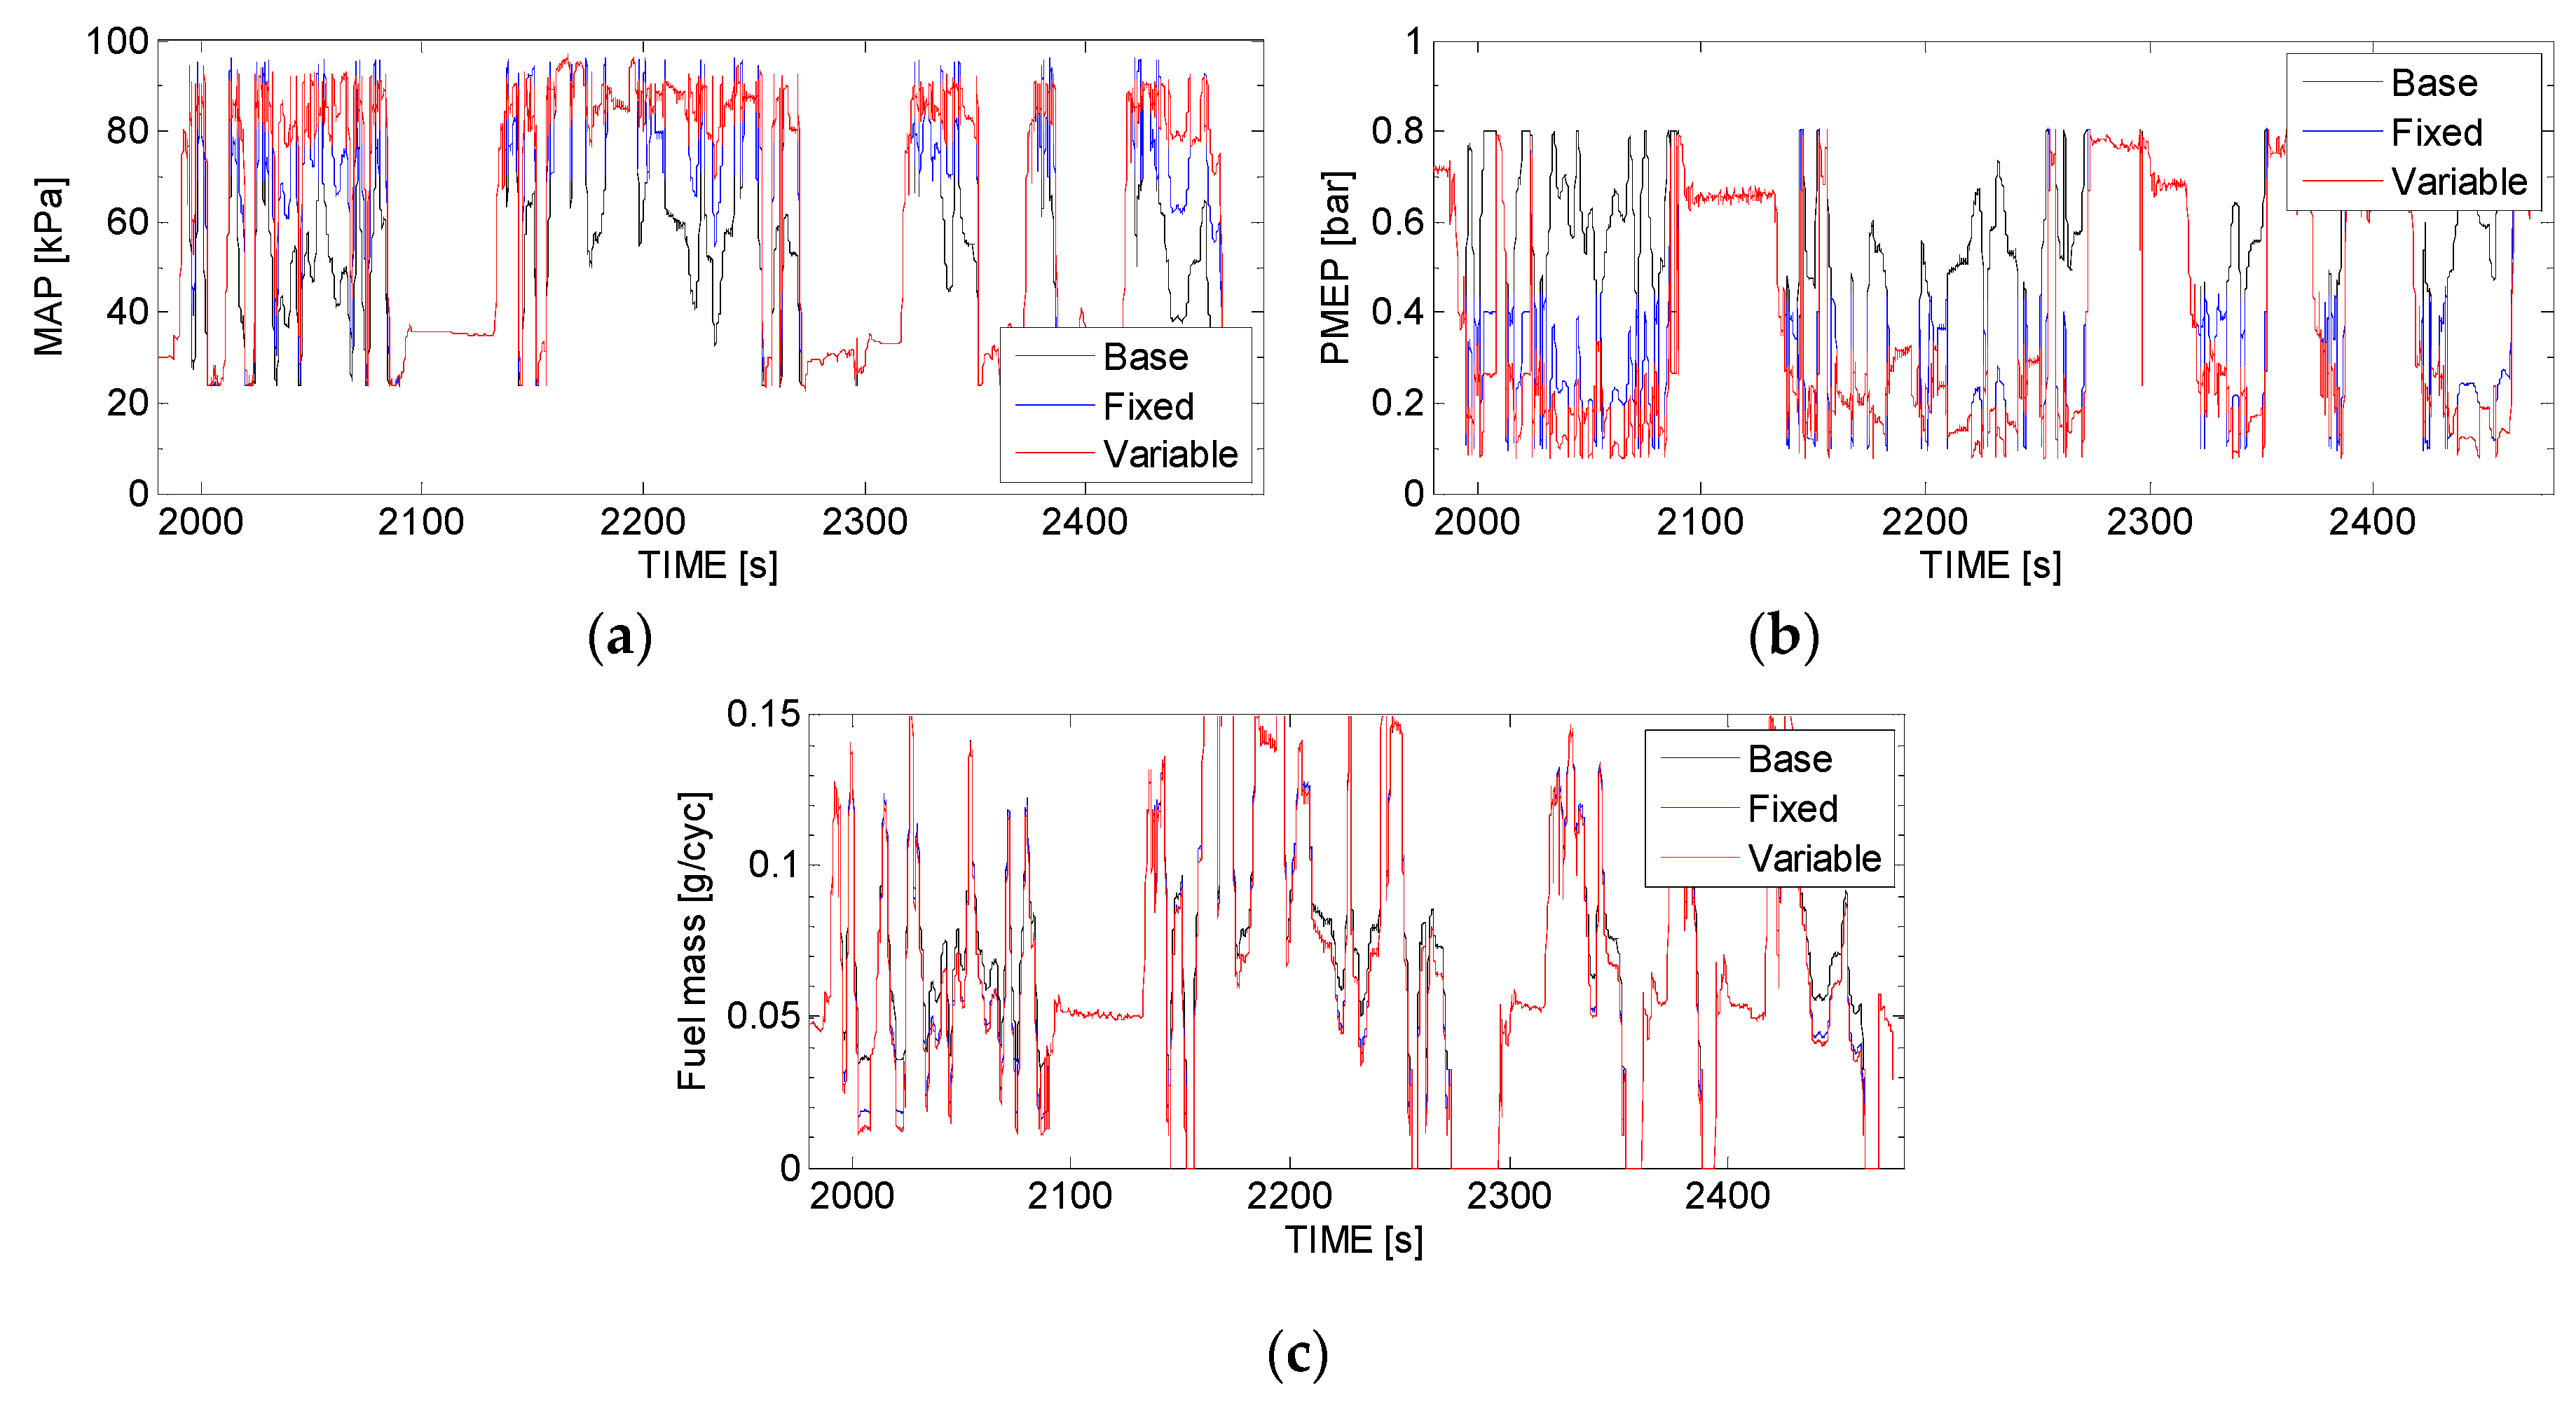
Figure 4 show the instantaneous data in phase 3.
In
Table 4, the NMEP values are the same but the IMEP, PMEP, and MAP values are different. As the cylinder deactivation engine is a technology for decreasing the pumping loss by increasing the load of activated cylinders, it has higher mean MAP than the base engines and the fuel economy improvement occurs due to the decrease in the average PMEP.
As for the cylinder deactivation control methods, variable-type cylinder deactivation can control the number of cylinders more easily than fixed-type cylinder deactivation. Variable-type cylinder deactivation exhibited 1.4% higher fuel economy improvement than fixed-type cylinder deactivation because the average MAP increased and the average PMEP decreased.
Figure 4a shows the instantaneous MAP values of the base engine and cylinder deactivation engine. The black line represents the base engine, the blue line the fixed-type cylinder deactivation engine, and the red line the variable-type cylinder deactivation engine. Both cylinder deactivation engines exhibited higher MAP than the base engine, and the parts without cylinder deactivation operation operated in the same way as the base engine. Under the operation of variable-type cylinder deactivation, the MAP increased to favorable 80–90 kPa due to cylinder deactivation operation. In the case of fixed-type cylinder deactivation, however, the region with an excellent fuel economy improvement could be exceeded depending on the load because the number of deactivated cylinders was limited.
Figure 4b shows comparisons of the PMEP values. Under cylinder deactivation operation, the PMEP becomes lower compared to that of the base engine. For fixed-type cylinder deactivation, the pumping loss reduction decreased compared to variable-type cylinder deactivation due to the same reason as the MAP.
Figure 4c shows the comparisons of the instantaneous fuel masses. The fuel mass decreased significantly in the low-load region where the PMEP was reduced significantly in
Figure 4b; however, it decreased only slightly in the high-load region where the PMEP difference was small. For fixed-type cylinder deactivation, the instantaneous fuel amount was high compared to variable-type cylinder deactivation because of many areas with high PMEP.
In previous papers, the fuel economy improvement of cylinder deactivation presented by previous studies was between 6% and 22%, and the fuel economy improvement by cylinder deactivation control method differed by more than 10%. However, it significantly varied depending on the condition and control of the applied vehicle. This study confirmed the fuel economy improvement by cylinder deactivation under the same conditions and control. When the cylinder deactivation was applied to the test vehicle, it was confirmed that the fuel efficiency improvement of 2.2–12.9%. Depending on the engine displacement, the fuel economy improvement was changed by up to 10.7%. Depending on the cylinder deactivation control method, the fuel economy improvement was changed by up to 2.9%.
The fuel economy improvement of cylinder deactivation varied depending on the engine as well as vehicle specifications. As the fuel economy improvements shown in
Table 3 resulted from applying all the aforementioned variables, they differed depending on the vehicle.
Under cylinder deactivation application, the influence of the aforementioned variables must be examined because they may change the fuel economy improvement. Therefore, a simulation was performed to examine the influence of changes in engine load and thermal efficiency at high load on fuel economy improvement, which may occur owing to the use of the cylinder deactivation engine.
3.2. Fuel Economy Improvement under Cylinder Deactivation According to Engine Load Change
After this section, fuel economy prediction was performed only for variable-type cylinder deactivation, which exhibited a larger fuel economy improvement than fixed-type cylinder deactivation. The target vehicle was vehicle 3.
When a cylinder deactivation engine is used in a vehicle, the change in driving resistance is small because the vehicle exterior is the same but the vehicle weight changes with the engine replacement. If the vehicle weight changes, the engine load changes; thus, the fuel economy improvement also changes. Furthermore, the fuel economy improvement will change owing to engine load changes caused by other external factors.
A simulation was performed to examine the fuel economy improvement under 10% increase and 10% decrease in vehicle weight. In addition, the tendency of fuel economy improvement according to engine load changes was identified.
Table 5 shows comparisons of the engine mean NMEP values and fuel economy improvements according to vehicle weight change. As the vehicle weight increased, the engine load increased and the fuel economy improvement decreased.
Table 6 shows the tendency of fuel economy improvement according to engine load change. As shown by the results in
Table 5, the fuel economy improvement decreased as the engine load increased.
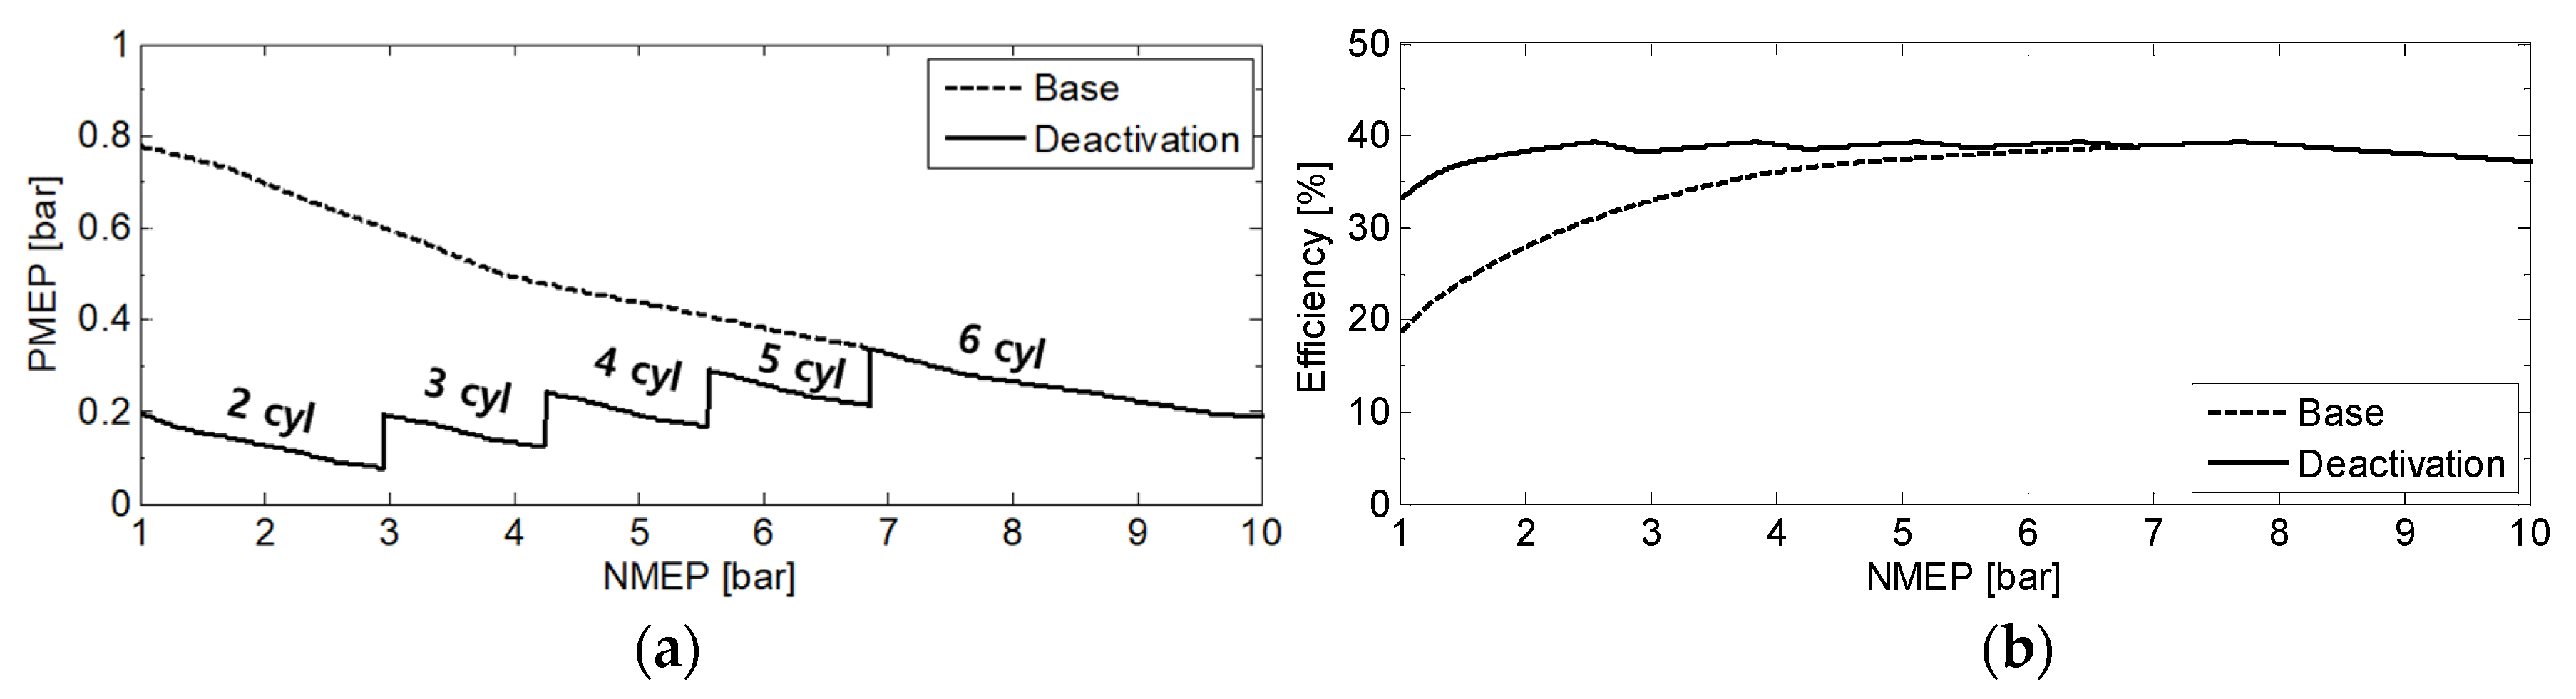
Figure 5 explain these results.
Figure 5a shows the PMEP according to the NMEP. The dotted and solid lines represent the base engine and cylinder deactivation engine, respectively. In the low-load region, the difference in the PMEP was large because the number of deactivated cylinders was large. However, as the engine load increased, the number of deactivated cylinders decreased, resulting in no difference in the PMEP from the NMEP of ~7 bar. From 7 bar, the engine operated similarly as the base engine because the cylinder deactivation application afforded no advantage.
Figure 5b shows the engine efficiency according to the NMEP. The difference between the solid line, which represents the efficiency of the cylinder deactivation engine, and the dotted line, which represents the efficiency of the base engine, is the fuel improvement that can be obtained owing to cylinder deactivation operation according to the load. The fuel improvement occurs owing to the aforementioned difference in the PMEP and in the thermal efficiency of the activated cylinders caused by cylinder deactivation operation; this can be confirmed from
Figure 5a.
Therefore, when the mean engine load increases, the reduction in pumping loss under cylinder deactivation operation decreases because the engine operates under higher loads than the base engine; thus, the fuel economy improvement is decreased.
3.3. Fuel Economy Improvement under Cylinder Deactivation According to Engine Thermal Efficiency Change at High Load
A simulation was performed to examine the fuel economy improvement under the assumption that all control is the same as that of the base engine under cylinder deactivation application. However, as each vehicle has a specific output, and drivability, its thermal efficiency may change at high load. Therefore, the effect of engine thermal efficiency on fuel economy improvement was examined through a simulation.
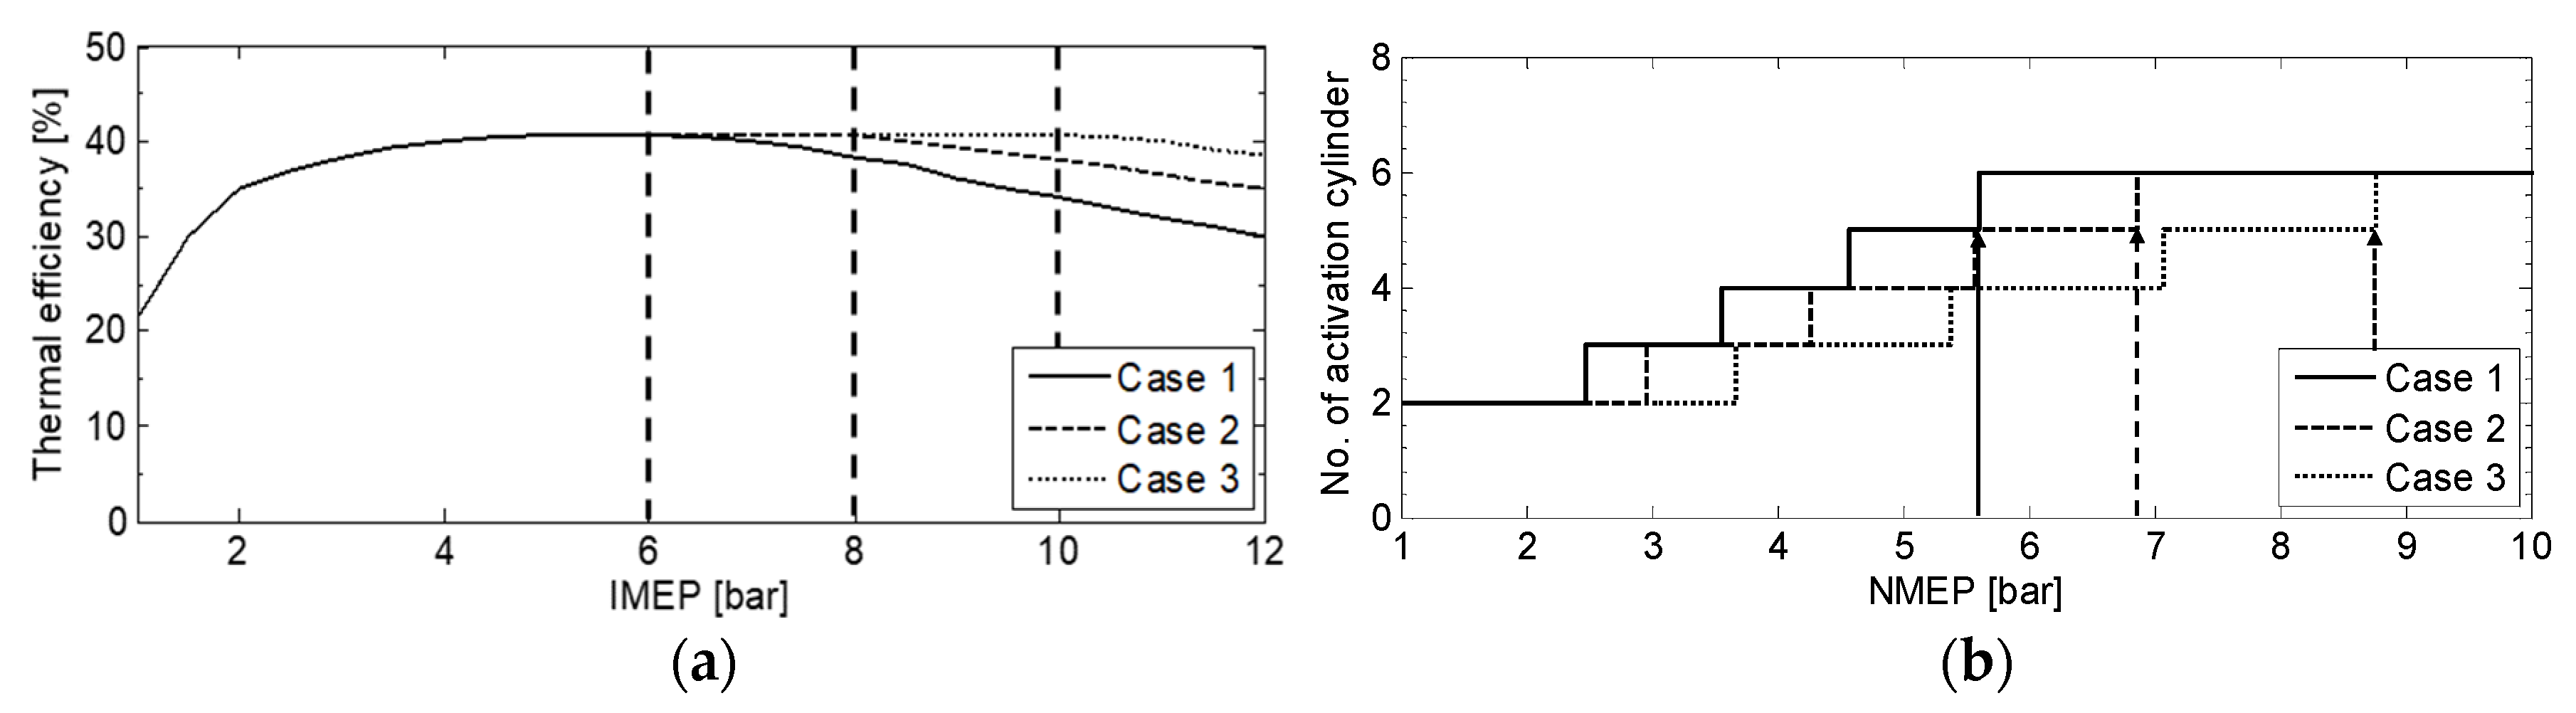
The thermal efficiency curves actually obtained from the data of various vehicles were used, and a total of three curves were chosen as shown in
Figure 6. Case 1 is the thermal efficiency curve from phase 3 of vehicle 4, and Case 2 is the thermal efficiency curve from phase 3 of vehicle 3. Case 3 present data obtained from the vehicle with the best thermal efficiency curve among the test vehicles. The cause of the difference between the thermal efficiency curves of Case 1 and Case 2 is not ignition retard due to the suppression of knock because the coolant temperature of both vehicles operates similarly. However, it is expected that the efficiency is reduced by the calibration for the ride comfort because vehicle 4 emphasizes the ride comfortable rather than the fuel consumption as compared with vehicle 3.
The IMEP value for the highest thermal efficiency was 6, 8, and 10 bar for cases 1, 2, and 3, respectively; this can be considered the maximum operating region of the activated cylinders under cylinder deactivation operation.
Figure 6b shows the number of activated cylinders according to the NMEP under cylinder deactivation operation. The NMEP of the cylinder deactivation termination point increased in the order of Cases 3, 2, and 1. The IMEP values for the highest thermal efficiency show the same order, indicating that the cylinder deactivation region increases when the region with excellent engine thermal efficiency operates at high load.
Table 7 summarizes the fuel economy improvement in the three cases under cylinder deactivation operation. As the operating region of cylinder deactivation increases, the mean PMEP decreased and the mean MAP increased because the activated cylinders operated at high load. The fuel economy improvement was in the order of cases 3, 2, and 1; the operating region of cylinder deactivation showed the same order.
The fuel economy improvement showed a difference of 0.6% from the value shown for vehicle 3 in
Table 3. This is because the thermal efficiency curve obtained from each phase was applied when the fuel economy improvement in vehicle 3 was examined, although the thermal efficiency for each case was applied throughout the entire driving cycle intervals to examine the fuel economy improvement according to the difference in thermal efficiency.
In summary, Case 1 exhibited the lowest thermal efficiency while Case 3 exhibited the highest thermal efficiency from the thermal efficiency curves alone, indicating that the test vehicles had some differences in thermal efficiency. Such differences are caused by vehicle temperature control or vehicle drivability, and thus they may occur depending on the vehicle calibration. As the fuel economy improvement of 2.3% may occur depending on the thermal efficiency, calibration for using the high-load region with low pumping loss is required for the development of a cylinder deactivation vehicle. In addition, more precise vehicle thermal management and knock control are required for using the high-load region.

 ,
, 

