Article

Analysis of the Impact of Auxiliary Ventilation Equipment on the Distribution and Concentration of Methane in the Tailgate

by
Magdalena Tutak
1,* and
Jarosław Brodny
2
1
Faculty of Mining and Geology, Silesian University of Technology, 44-100 Gliwice, Poland
2
Faculty of Organization and Management, Silesian University of Technology, 44-100 Gliwice, Poland
*
Author to whom correspondence should be addressed.
Energies 2018, 11(11), 3076; https://doi.org/10.3390/en11113076
Submission received: 7 October 2018 / Revised: 30 October 2018 / Accepted: 2 November 2018 / Published: 8 November 2018
(This article belongs to the Special Issue Computational Fluid Dynamics (CFD) 2018)

Abstract

:
Methane, which is commonly found in hard coal deposits, represents a considerable threat to the safety of mining operations in these deposits. The paper presents the results of tests, aiming to limit the negative impact of methane on hard coal exploitation and improve work safety. The tests encompassed an analysis of methane concentration distributions in the tailgate (in the intersection area with the longwall), with account being taken of auxiliary ventilation equipment. This equipment is responsible for reducing methane concentration levels in the intersection area between the longwall and the tailgate. The analyses presented in the article were conducted for a spatial model of a longwall area, using the Computational Fluid Dynamics (CFD) method. Account was taken of the real-world measurements of the headings as well as the measurement data concerning methane concentration and ventilation parameters. The tests took into account methane emissions from the mined coal and from the goaf with caving. The analyses were performed for the system with and without auxiliary equipment, for different velocities of the additional air stream. This made it possible to compare both systems and determine the impact of auxiliary equipment on the distribution and concentration of methane in the most vulnerable area of exploitation. The distributions of the air and gas mixture were also determined in the analysed headings and goaf with caving. The results obtained clearly demonstrate that using auxiliary equipment has a significant effect on the ventilation parameters of the air stream and leads to reduction in methane concentrations in the most vulnerable section of the longwall. These results also confirmed the advantages of auxiliary ventilation equipment, which should contribute to their wider application in underground hard coal exploitation.

1. Introduction

Due to a series of inherent hazards, underground mining exploitation is very dangerous. One of such threats that are commonly faced by hard coal mines is the methane threat [1,2,3,4,5]. It is related to the risk of methane ignition and explosion in mine headings. Due to its serious consequences, it belongs to one of the most dangerous hazards. This is evidenced by the statistics related to methane explosions in underground mine headings [6,7,8]. A summary of the most tragic disasters related to methane explosions in the world and in Poland is presented in Table 1.
Methane (CH4) is a naturally occurring gas, formed during the process of coalification [2,9,10]. In coal deposits, methane is present in two fundamental forms: as sorbed methane, which is physicochemically bound with a carbon substance, and as free methane, occurring in pores and crevices of gangues and coal. When enclosed in pores, methane, in the process of coal mining, is released into the mine’s atmosphere which is also filled with other gases, including flammable and explosive. The inflammable gas mixture, mostly CH4 (80–96%) with minor constituents of other gases, such as N2, CO2, C2H4, and C2H6 and occasionally containing CO and H2S, is called a firedamp [11,12]. Methane, being the major constituent of firedamp, is also synonymously referred to as firedamp [10].
Methane is odourless and colourless, and lighter than air (its density is 0.656 kg/m³). When its concentration level in the air ranges between 5% and 15%, it becomes explosive (in mixture with the air in which oxygen concentration is at least 12%) and hence is extremely dangerous.
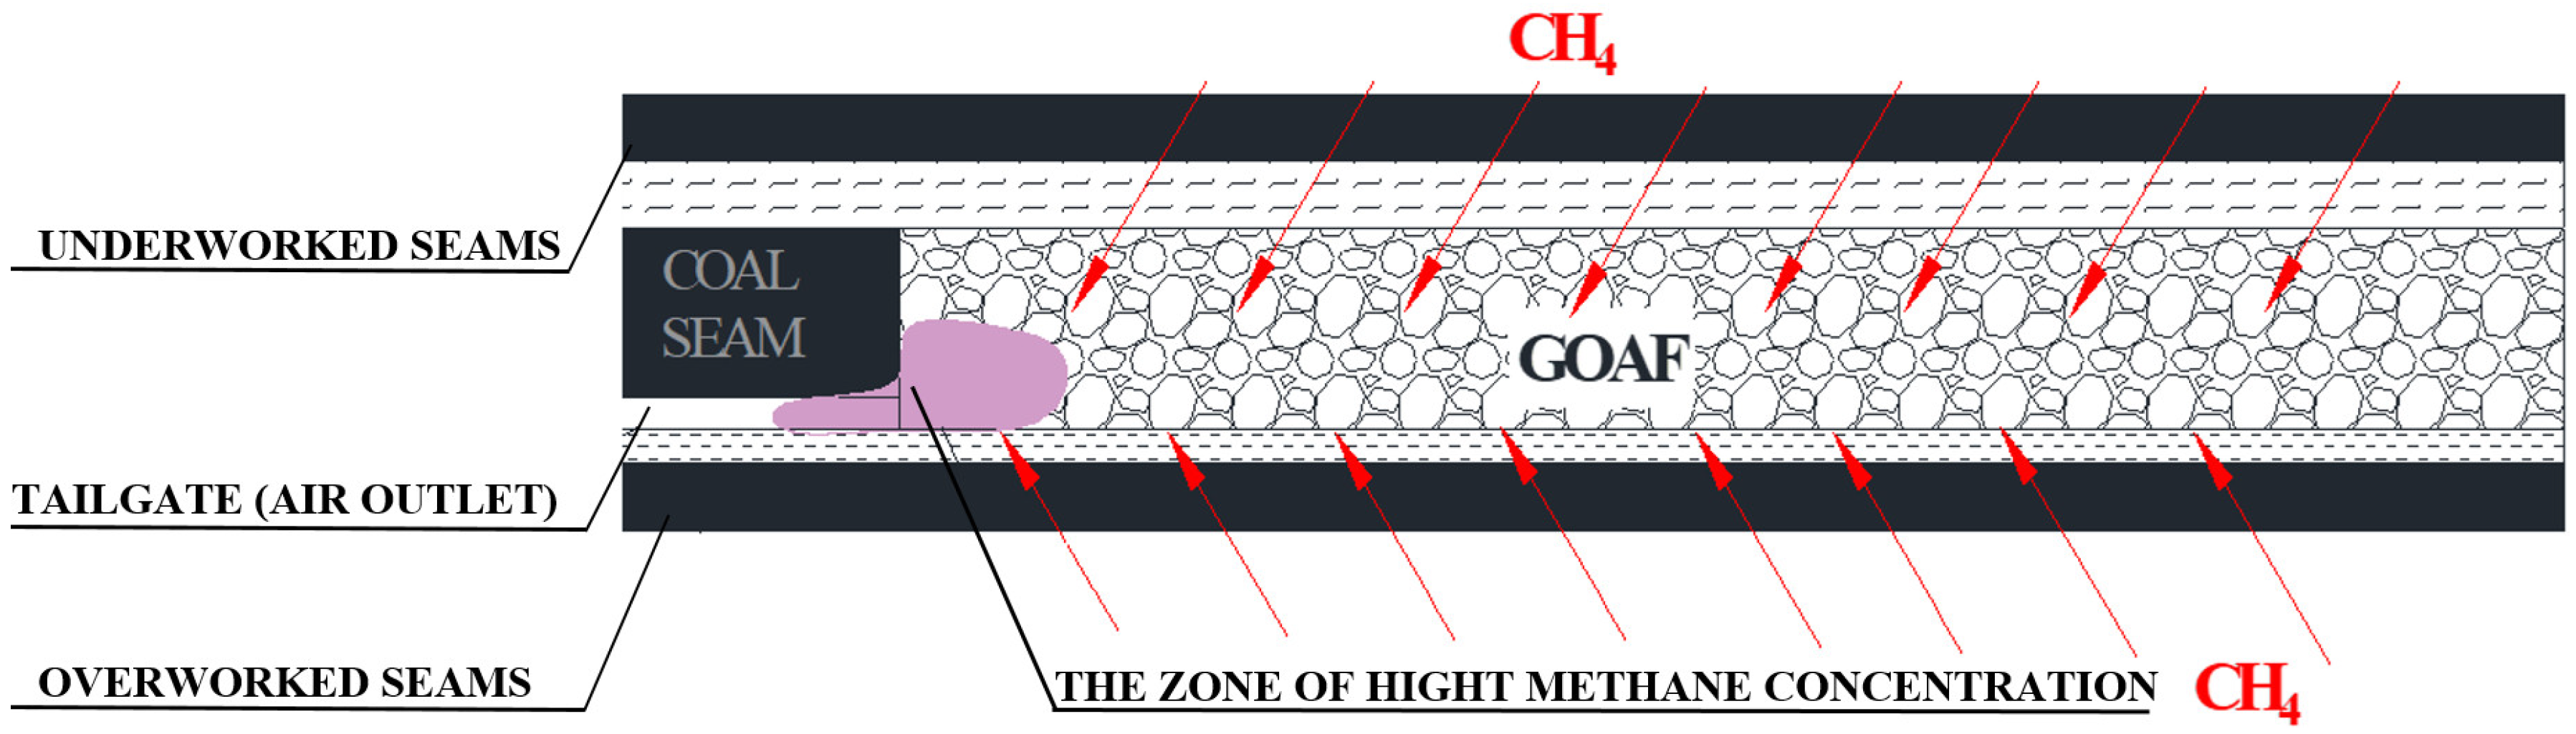
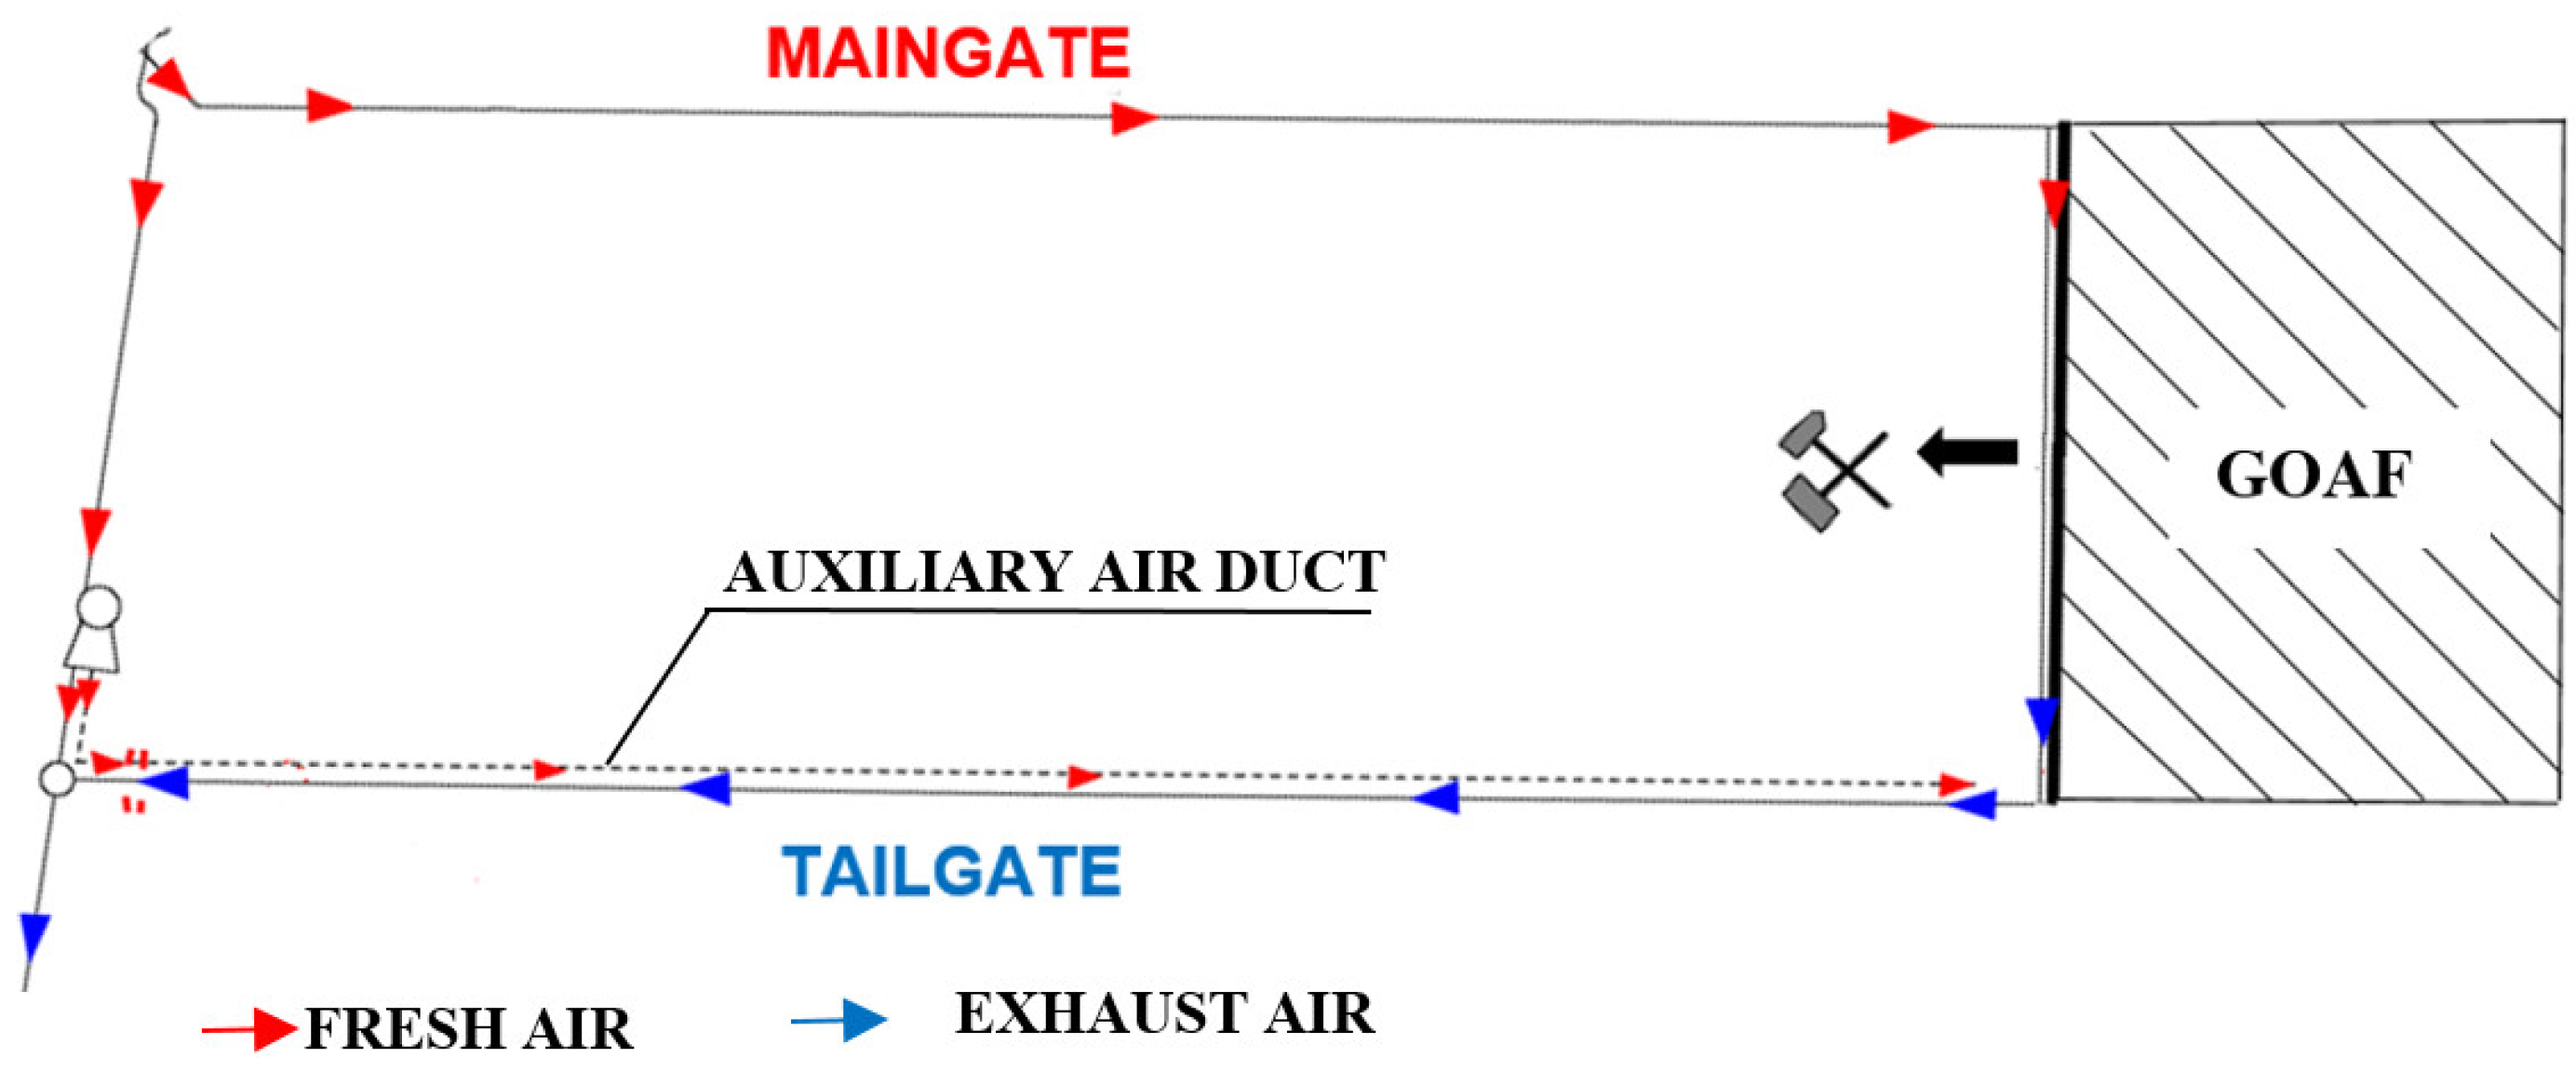
During mining exploitation, the areas of longwalls are the most common points of methane accumulation. Methane is released into the longwall and its adjacent headings from the mined coal, the exposed body of coal and goaf with caving. In the case of goaf with caving, the sources of methane include the coal left in this area as well as the methane flowing out of the undertaken and overtaken seams through the cracks and crevices in the rock mass. The flow directions of methane from the goaves with caving to the longwall and the tailgate have been demonstrated in Figure 1.
It is most common for methane to accumulate in the upper (roof) section of mine headings and in places with no air supply (the so-called dead zones). The accumulation of methane in the roof section of a mine heading is termed as methane layering [13].
The stability and dispersion of methane layer in underground coal mines are affected by various geo-mining parameters, such as the velocity of airflow, the location of methane source, the rate of methane emission, the width, surface roughness and inclination of mine airway, the presence of bends and obstructions in the airway, the relative density of air and methane, and the type of mine ventilation (ascensional or descensional) [14]. Some of these governing parameters jointly define the dimensionless methane layering number (L):
L = v [ g Δ ρ Q ρ W ] 1 3
where g is the acceleration due to gravity (m/s2), Δρ is the density difference of air and methane (kg/m3), ρ is the density of air (kg/m3), v is the average air velocity (m/s), Q is the quantity of methane emitted into the mine airway (m3/s) and W is the width of the airway (m).
The length of methane layer is defined as the distance from the methane source to a point where the mean concentration of methane in the layer is 5% [11].
Equation (1) indicates that the most crucial aspect for methane layering to occur is the velocity of the air flowing through headings. With increase in air velocity, the layering number increases and the probability of occurrence of methane layering decreases. Hence, dispersion of methane layering more strongly depends on air velocity than the making of gas [10].
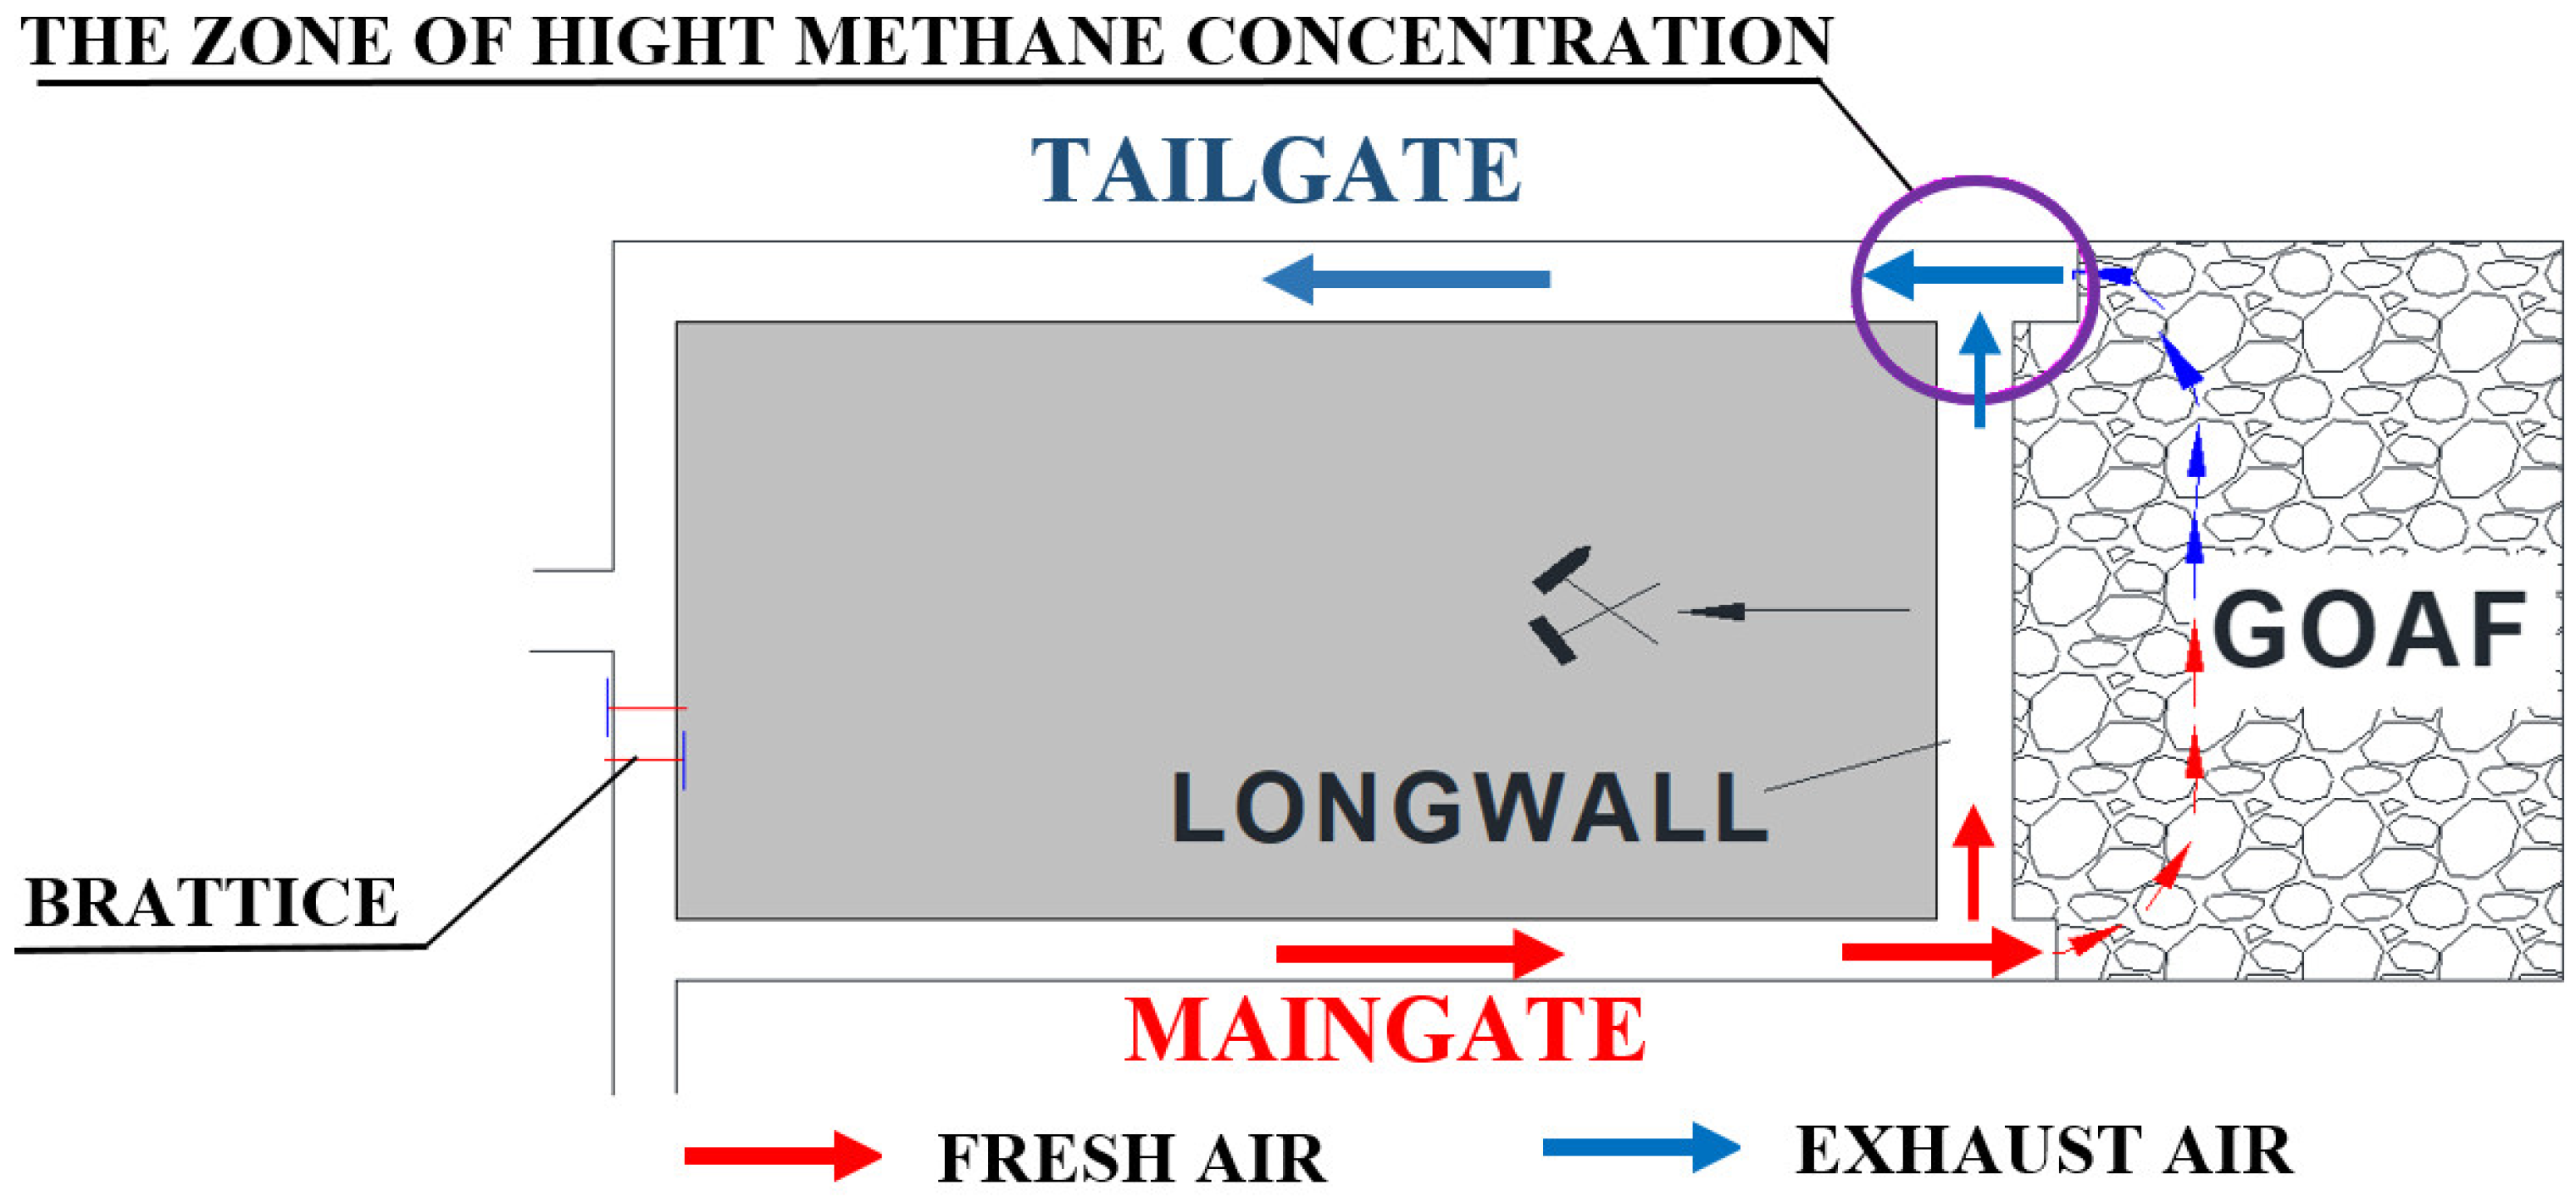
The place most vulnerable to the phenomenon of methane layering is the areas of longwalls ventilated by means of the “U-type” systems from the borders (Figure 2). This system is currently used in more than 75% of all longwall headings in Poland. As a result of its application under methane hazard conditions, the highest risk of increased methane concentration occurs in the area of the intersection between the longwall and the tailgate, which are adjacent to the goaf with caving (Figure 2).
In order to use the “U-type” longwall ventilation system from the borders, it is necessary to maintain longwall galleries along the body of coal, and their liquidation, after the extraction front is shifted, is carried out by caving. However, this liquidation does not take place on a continuous basis, yet with a certain time delay. This is due to the fact that they cannot be liquidated along with the progressing excavation face. The maximum length of the unliquidated sections of longwall headings left behind the longwall according to applicable provisions is up to 6.0 m [15]. It is most common for methane to accumulate in this zone after flowing from the goaf with caving, and due to inadequate intensity of ventilation, the permissible methane concentrations in mixture with air may often be exceeded in this area. This is also corroborated by the results of the measurements conducted in real-world conditions [16,17].
In order to limit the possibilities for dangerous methane concentrations to accumulate in this zone, auxiliary ventilation equipment is used. These primarily include air brattices (ventilation curtains) and auxiliary air ducts installed in the tailgate. Their task is to reduce the concentration of methane by diluting it with an additional stream of air (the air duct) and properly directing the air stream flowing out of the longwall (the air brattice).
Auxiliary ventilation equipment is used when the amount of methane released in the area of ongoing exploitation is up to 15 m3/min, with the cross-sectional area of the tailgate from 6 to 8 m2, as well as when the methane-bearing capacity amounts to 25 m3/min and the cross-section area of the tailgate exceeds 8 m2 [18,19].
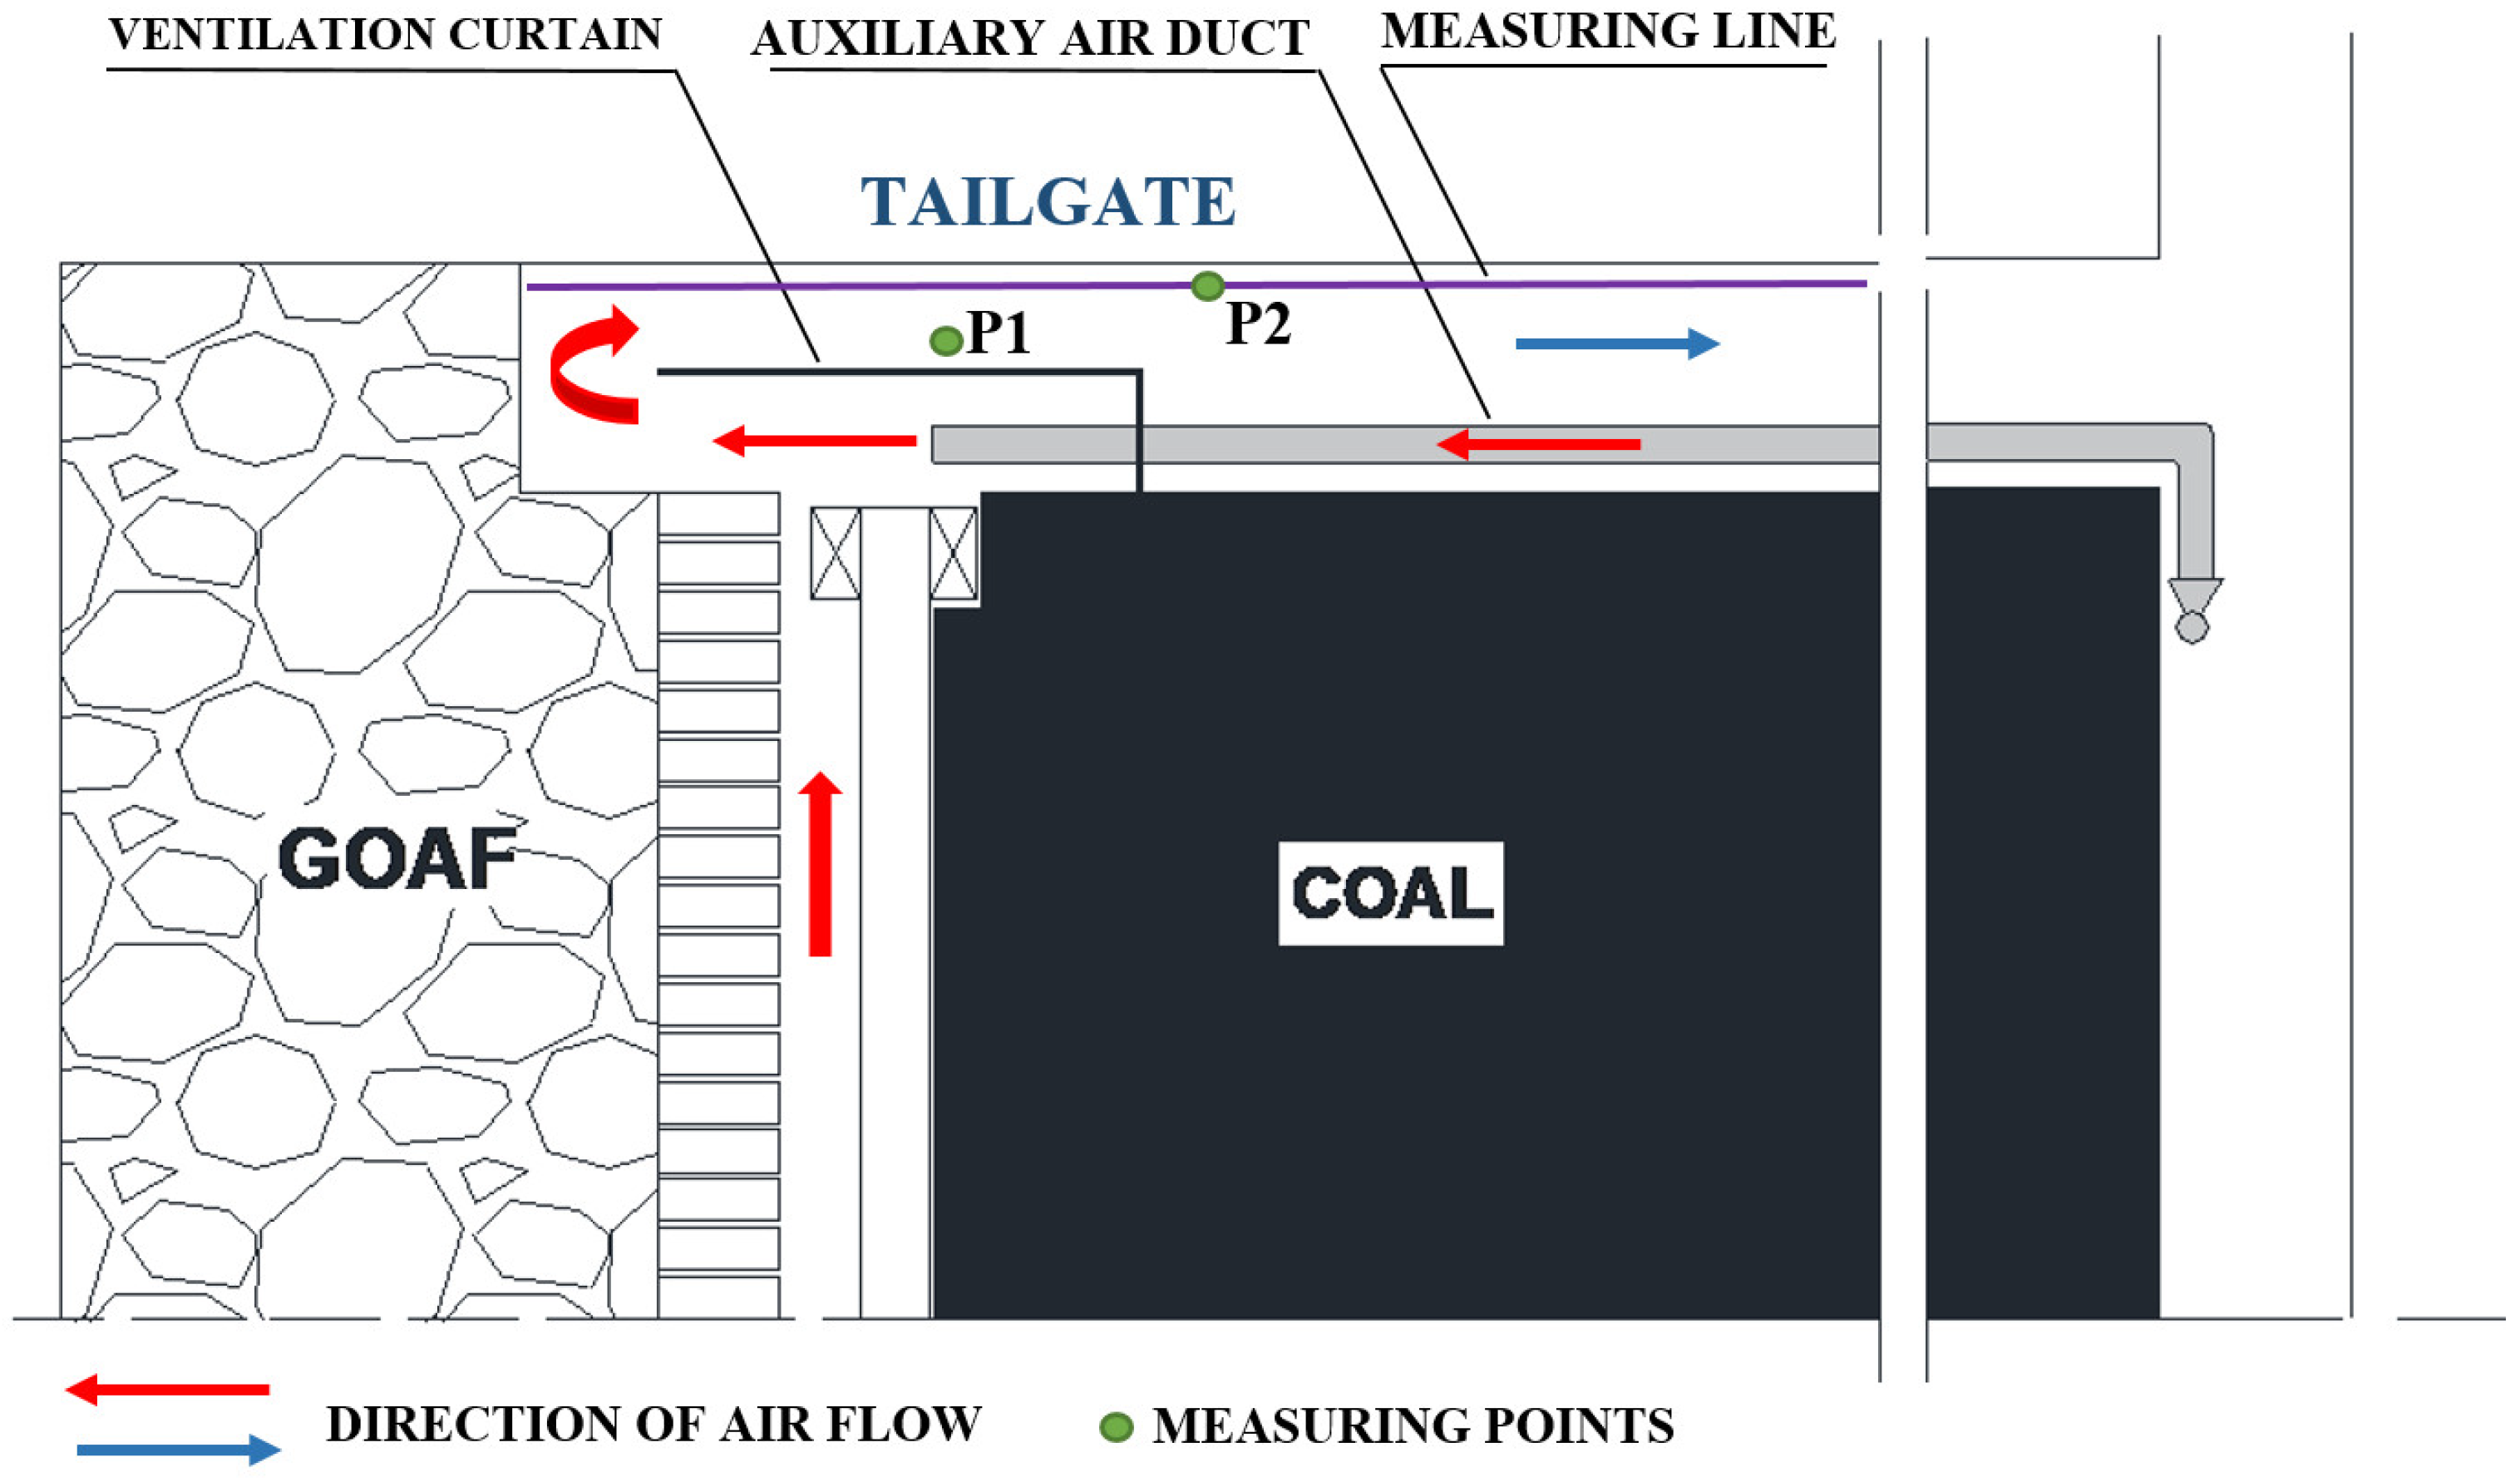
The schematic location of the auxiliary ventilation equipment in the tailgate (at the outlet from the longwall ventilated by means of the U-type system from the borders) is presented in Figure 3.
To ensure the safety of ongoing exploitation, it is necessary to determine the effectiveness of the equipment in use. This, in particular, involves determining its impact on methane concentration values in the area of exploitation.
Works describing analyses of ventilation systems in mine headings have been presented in numerous publications [1,3,5,20,21,22,23,24,25,26,27,28,29,30,31,32]. They encompassed both real-world tests [16,17,21,24,25,26,29,31] and model-based analyses [1,2,3,4,5,10,20,23,27,28,30,32,33,34,35,36,37]. In the authors’ opinion, the works which are particularly interesting in this regard are those presenting the results of model-based tests related to the release of methane into mine headings. This is because they make it possible to determine a series of essential physical and chemical parameters related with ventilation processes, the measurement of which in real-world conditions is extremely difficult if not impossible. Particular potential in this regard is offered by numerical simulations based on the Computational Fluid Dynamics (CFD) method.
Oberholzer and Meyer [38] used CFD method to evaluate the performance of different ventilation systems for the purpose of methane dilution and dust removal at development headings. Branny [20] studied the flow of air and methane mixture in the longwall-return crossing zone and investigated the impact of jet fan positions on the methane distribution. Wala et al. [33,34,35] validated the CFD simulation results with experimental data for designing mine face ventilation systems. Wala et al. [33] in their study on airflow patterns and methane distribution in the mine face area observed good agreement between the methane concentrations predicted by CFD simulations and those determined from experiments. In a numerical study on airflow recirculation and methane distribution in auxiliary ventilation in deep underground coal mine, Torano et al. [29] found higher methane concentrations than the statutory levels in some roadway zones due to presence of dead zones. Kurnia et al. [23] observed that methane dispersion inside mine tunnel is greatly influenced by the number as well as location of methane sources and the quantity of methane released from each source. They enunciated that methane concentration can be reduced below safe level by properly directing the ventilation flow to the location of methane accumulation. Mishra et al. [2,10] and Kumar et al. [27] concluded that ventilation plays a vital role in dispersion of methane and breaking methane layering to a safe level in underground coal mines. These authors examined and described the impact of selected geological and mining factors on the distribution of methane concentration levels in the tailgate [10].
However, the literature does not provide any works concerning the impact of auxiliary ventilation equipment on the ventilation parameters of the air flowing through longwall headings. The only works that take into consideration such equipment concern the mined dog heading [23,29,39,40,41].
The works discussed explain some of the phenomena related to the release of methane into mine headings and its distribution. However, in most cases, they merely concern the outflow of methane into the tailgate. Moreover, they fail to take into consideration the influence of goaf with caving on the distribution and concentration of methane in the area of ongoing exploitation. Experience shows that, in a number of cases, the size and porosity of this highly porous medium determine the effectiveness of the entire ventilation process in a given mine.
It is therefore reasonable to carry out tests in order to determine the impact of auxiliary ventilation equipment on the distribution of methane concentrations in the area of ongoing exploitation, with account being taken of the goaf with caving. Such an approach to the issues at hand will make it possible to perform a more in-depth analysis of the ventilation phenomena present during mining operations. At the same time, it helps to unambiguously determine the actual impact of auxiliary ventilation equipment on the ventilation parameters of the air and methane concentration levels.
To fill this gap, the authors developed a research methodology and carried out model-based tests, the objective of which was to determine the impact of auxiliary ventilation equipment on the distribution of methane concentration in the area of ongoing mining operation. The tests were performed for a real-world system of headings in one of the mines, preserving their geometry and taking into account the ventilation parameters obtained on the basis of measurements in real-world conditions. This also concerns the auxiliary ventilation equipment which was used in the area of the longwall under analysis. The analyses also took into consideration the goaves with caving along with their actual physical parameters.
The tests were conducted using CFD. The related calculations were performed in ANSYS Fluent, based on the finite volume method (FVM). The analyses performed made it possible to identify the concentrations levels of methane and the physical parameters of the flowing gas mixture at each spatial point of the area under examination, for the boundary conditions adopted. To unambiguously determine the influence of auxiliary equipment on the distribution of methane concentration in the area examined, the analyses were conducted for a system with and without such equipment. The results obtained from model-based tests were compared with the results of the measurements in real-world conditions, and there was satisfactory coherence between them. This confirmed the correctness of the assumptions made and the methodology developed. To more precisely determine the impact of the applied ventilation equipment on the ventilation parameters of the air stream, additional simulations were conducted for three different values of the volume output of the air flowing out of the auxiliary air duct. The results obtained indicate that the use of auxiliary equipment had an extremely positive impact on the distribution of methane concentration in the area under analysis.
The primary objective of the paper was to develop a methodology of model-based tests for analysing ventilation phenomena, with account being taken of the largest possible number of factors that affect this process. Undoubtedly, a unique achievement of the paper is that the analysis takes into consideration the impact of goaf with caving, as a porous medium, on the ventilation parameters of the air stream. Another advantage of the paper is also the fact that the analysis was performed for a functioning exploitation area with real-world measurement data. This lends credence to the tests conducted and the results obtained.
The practical result of the paper is the qualitative and quantitative representation of the ventilation phenomena occurring in the area under analysis. The determined distributions of methane concentration and the trajectories of the air–methane mixture flow, with account being taken of the different volume outputs of the air supplied along the air duct into the area under analysis, provide an essential source of information for the ventilation services. In practice, they can serve as the basis for selecting ventilation parameters for a given area in order to ensure safe and effective exploitation.
It is therefore reasonable to state that the methodology developed, which uses the CFD techniques and the results of the measurements in in-situ conditions, offers extensive possibilities in terms of application for effective diagnosis and forecasting of the methane hazard in mine headings.

2. Materials and Methods

2.1. Study Area

The model-based tests were conducted for the real-world longwall in one of the mines located in the GZW (Upper Silesian Coal Basin) area in Poland (Figure 4). This coal mine is located in the southern part of GZW (Upper Silesian Coal Basin). Its exploitation area is 44.4 km2, whereas its extractable resources amount to 155.9 million tonnes of coal [42,43]. The mine has five shafts, including two ventilation shafts, two materials and personnel transport shafts and one extraction shaft.
Interventionary studies involving animals or humans, and other studies require ethical approval must list the authority that provided approval and the corresponding ethical approval code.
The coal mine faces a series of natural mining hazards. According to Polish regulations, they include water hazard (1st and 2nd degree), methane hazard (4th category), methane and rock outburst hazard in some of the seams, rock burst hazard (1st degree in some of the seams) and dust hazard (Classes A and B of coal dust explosion hazard). It must be assumed that this is a mine where exploitation is exposed to a series of safety hazards.
The legal regulations currently in force in Poland require that the exploited seams or their parts be classified into a relevant methane hazard category, with the assumption that the higher the hazard scale is, the higher its category is. The hazard category is highly dependent on the quantity of natural methane included in a weight unit (Mg) of the body of coal. For the first (lowest) category of methane hazard, this quantity ranges from 0.1 to 2.5 m3/Mg (in terms of pure coal substance), while for the fourth (highest) category, it is over 8 m3/Mg [44].

Description of the Geological and Mining Conditions of the Longwall under Analysis

The W-1 longwall under analysis was a longitudinal system with a roof fall from the exploitation field borders. Its length was 216.0 m, with a panel length of 1050 m and a seam thickness of 2.54 m; its longitudinal inclination is 4.9°, while its transverse inclination is 1.9°.
The longwall was ventilated by means of the U-type system, with fresh air being supplied along the tailgate through an auxiliary air duct. It also had a built-in air brattice (ventilation curtain). The ventilation diagram for the longwall under analysis, along with indicated directions of air flow, is presented in Figure 5.
At the stage of designing mining exploitation and developing the technical design specifications for the longwall, calculations were performed for the minimum volume output of fresh air that needs to be supplied to the longwall due to the methane hazard. This value amounted to not less than 762.5 m3/min. This stage also involved determination of the forecasted methane amounts that will be released during exploitation. This value amounted to 12.36 m3CH4/min.
During exploitation, air was supplied to the longwall along the maingate at the average rate of 1000 m3/min, whereas the air supply rate along the tailgate with a built-in auxiliary air duct into the intersection area between this tailgate and the longwall was equal to approx. 141 m3/min.
The amount of methane released from the goaf with caving during exploitation was, on average, 12.36 m3CH4/min, with the average value of its concentration in the tailgate, in the measurement point located at a distance of 10 m from the longwall outlet, throughout the exploitation period, being equal to 0.96%.

2.2. Methods

The purpose of the model-based tests conducted was to determine the impact of auxiliary ventilation equipment installed in the tailgate on the distribution of methane concentration in the area of the longwall, with account being taken of the goaf with caving. The tests were conducted for a spatial model of the area under analysis, using CFD. The authors’ experiences and the results by other researchers indicate that this method is widely applied for analysing phenomena related with the flows of fluids and gases, the transfer of mass and heat or the processes of combustion [45].
The paper made use of the ANSYS Fluent software, which is one of the most popular tools for the CFD method, whereas the discretisation process was carried out by means of the FVM. The methodology for conducting tests by means of this programme encompasses development of a mathematical model of the phenomenon in question, adoption of boundary conditions, performance of calculations and analysis of the results obtained. The most important stages of the work methodology are briefly discussed in the subsequent chapters.

2.2.1. Mathematical Models

The airflows at the maingate, tailgate and longwall were simulated as fully developed turbulent flow by using a k–ε model standard. The numerical tests made use of the Species Transport Without Reactions model implemented in the ANSYS Fluent software.

Basic Flow Equations

The system of balance equations of mass, momentum and energy (equations of fluid handling) of one-component flow takes the following form [46,47]:
t ( ρ ) + d i v ( ρ v ) = 0
t ( ρ v ) + d i v ( ρ v v ) = = d i v ( p I + τ m + τ t ) + ρ s b
t ( ρ v ) + d i v ( ρ e v ) = = d i v [ ( p I + τ m + τ R ) v + q s m + q s R ] + ρ s e
The system of Equations (2)–(4) in a vector form can be written as [46,47]:
t ( ρ ρ v ρ e ) + d i v ( ρ v ρ v v + p I ρ e v + p I v ) = = d i v ( 0 τ m + τ R ( τ m + τ R ) v + q s m + q R ) + ( 0 ρ s p ρ s e )
The variables presented in the system of Equations (2)–(5) are [46,47]:
{ ρ , v , p , τ m , τ t , s p , e , s e , q s m , q s R }
where ρ is the fluid density (kg/m3), v is the air velocity (m/s), p is the static pressure (Pa), τ m the viscous molecular stress tensor (Pa), τ t is the turbulent Reynolds stress tensor (Pa), Sb is the source of forces (N/m3), e is the sum of kinetic and internal energy (J/kg), q m is the molecular heat flux (J/(m2·s)), q R is the turbulent heat flux (J/(m2·s)), Se is the source of heat (J/(m3·s)).
The basis for a mathematical description of the transportation process of methane released into underground headings is the principle of mass conservation referred to this gas. The mathematical model of transportation, being a set of advection–diffusion equations, which for i-th of this substance i = 1,….n, assumes the following form [48]:
t ( ρ Y i ) + ( ρ v Y i ) = J i + R i + S i
where Ri is the net rate of production of species i by chemical reaction and Si is the rate of creation by addition from the dispersed phase plus any user-defined sources, Ji is the diffusion flux of species and Yi is the local mass fraction of each species.
The flow of air stream through a longwall is a turbulent flow. This flow features irregular movements of the air stream particles, and the parameters of this flow undergo unpredictable random changes in space and time. A characteristic phenomenon for this type of flow is the occurrence of vortices of different sizes.
The analysis made use of the kε standard turbulence model, which belongs to semi-empirical models and is characterized by parameters determined on the basis of experimental tests. This model describes the components of the Reynolds turbulent stress tensor according to Boussinesq hypothesis [23].
In the turbulence model k–ε, in the standard variation, the basic Navier–Stokes equation has been transformed into the Reynolds averaged equation. This equation includes an additional term in the form of the Reynolds stress tensor. Due to this term, the set of equations is not closed. To close the set of equations, it is necessary to introduce additional differential equations, which include the equation of kinetic turbulent energy and the equation of kinetic turbulent energy dissipation in the following form [48]:
ρ k t + x i ( ρ k u i ) = x j [ ( μ + μ t σ k ) k x j ) ] + G k + G b ρ ε Y M + S k
ρ ε t + x i ( ρ ε u i ) = x j [ ( μ + μ t σ ε ) ε x j ) ] + C 1 ε ε k ( G k + C 3 ε G b ) C 2 ε ρ ε 2 k + S ε
where C, C2ερ, and C are constants, σk, and σε are turbulent Prandtl numbers for k and ε, respectively, Gb is the generation of turbulence kinetic energy due to buoyancy, Gk is the generation of turbulence kinetic energy due to the mean velocity gradients, YM is the contribution of the fluctuating dilatation in compressible turbulence to the overall dissipation rate, and Sk, and Sε are user-defined source terms.
The flow turbulence model k–ε includes several variants, such as the k–ε standard, the k–ε Renormalisation Group (RNG) and the k–ε Realizable. These variants differ, above all, in the method for determining turbulence viscosity and the Prandtl number, as well as in the constants present in the equations describing the kinetic energy of turbulence—k and the dissipation of turbulence kinetic energy—ε [49,50,51]. The turbulence model k–ε is the most common model used for analysing ventilation-related issued in underground mine headings [1,2,3,4,5,10,23,35,51], since it provides the best representation of the actual course of this process.

Constitutive Equations

A ternary species mixture comprising oxygen, water vapour and methane exists in the ventilation air in the mining headings. The interaction between the species is captured in the mixture density which follows incompressible ideal gas law given by [4]:
ρ = p M R T
where R is the universal gas constant and M refers to the mixture molar mass.
Mixture molar mass is given by:
M = [ ω O 2 M O 2 + ω C H 4 M C H 4 + ω N 2 M N 2 + ω H 2 O M H 2 O ] 1
where Mi is the molar mass of species i.
Mass fraction of nitrogen is calculated as:
ω N 2 = 1 ( ω O 2 + ω C H 4 + ω H 2 O )
The air–methane mixture viscosity is calculated as:
μ = i x i μ i j x i Φ i , j
where xi, and xj, are the mole fraction of species i and j, respectively, and:
Φ i , j = 1 8 ( M i M j ) 1 2 [ 1 + ( μ i μ j ) 1 2 ( M i M j ) 1 4 ] 2
The mole fractions are related to the mass fractions by:
x i = ω M M i
For practical purpose, methane concentration is presented in terms of percentage of methane concentration, defined as CH4 = ωCH4 ×100%.
The mine walls roughness, Ks, is estimated from the correlation developed by [52] as a function of flow resistance, described as:
K s = 4.49 μ ρ C μ 1 / 4 k 0 1 / 2 C s [ 0.342 × exp ( 4341 α ρ ) 1 ]
where α is the air resistance coefficient, Cs is the roughness coefficient which identifies the roughness shape and is equal to 0.5 for spherical sand grains, whereas C μ 1 / 4 and k 0 1 / 2 is the dynamic velocity.

Permeability of the Goafs

The coefficient value of goaf permeability depends on the rocks types forming the caving. The parameter which characterises these rocks (roof) with respect to their permeability is their stratification resistance [53].
The destratification resistance of rocks is natural capability of the rock mass to oppose stratification and caving of roof rock to the heading surface. This capability is equal to the tensile strength of the forces directed vertically.
The destratification resistance of rocks is determined based on laboratory tests using downhole penetrometers or by disruption segments of vertical drilling of bore in the direction of longitudinal axis of opening. The value of this resistance is determined on the basis of the following dependence:
R r r i = 0.8 F d 2
where Rrri is the destratification resistance of rocks (Pa), F is the tensile strength (Pa) and d is the diameter (m2).
The resistance of roof rock stratification forming caving is calculated from dependence [53]:
R r r s = i = 1 n R r r i m i i = 1 n m i
where Rrrs is resistance of roof rock stratification (Pa), and mi is the thickness of layers (m).
The resistance of roof rock stratification calculated on the basis of Equation (18) enables us to determine the permeability coefficient of goaf with caving from Equations (19) and (20) [53]:
k ( x ) = μ r 0 + a x 2   for   0 x 2 3 l
k ( x ) = μ r 0 + a ( 4 3 l x ) 2   for   2 3 l x l
where k(x) is the permeability coefficient of goaf (m2), μ is the coefficient of dynamic viscosity (Ns∙m−2), l is the total length of the longitudinal longwalls (m), r0 and a are empirical factors depending on the mining geological conditions of the goafs.

3. Problem Statement and Boundary Conditions

The fundamental role for the correctness of the tests conducted is played by the development of a model, which best represents the real-world exploitation area, including the longwall, the goaf with caving, as well as other mine headings and the conditions present in them.
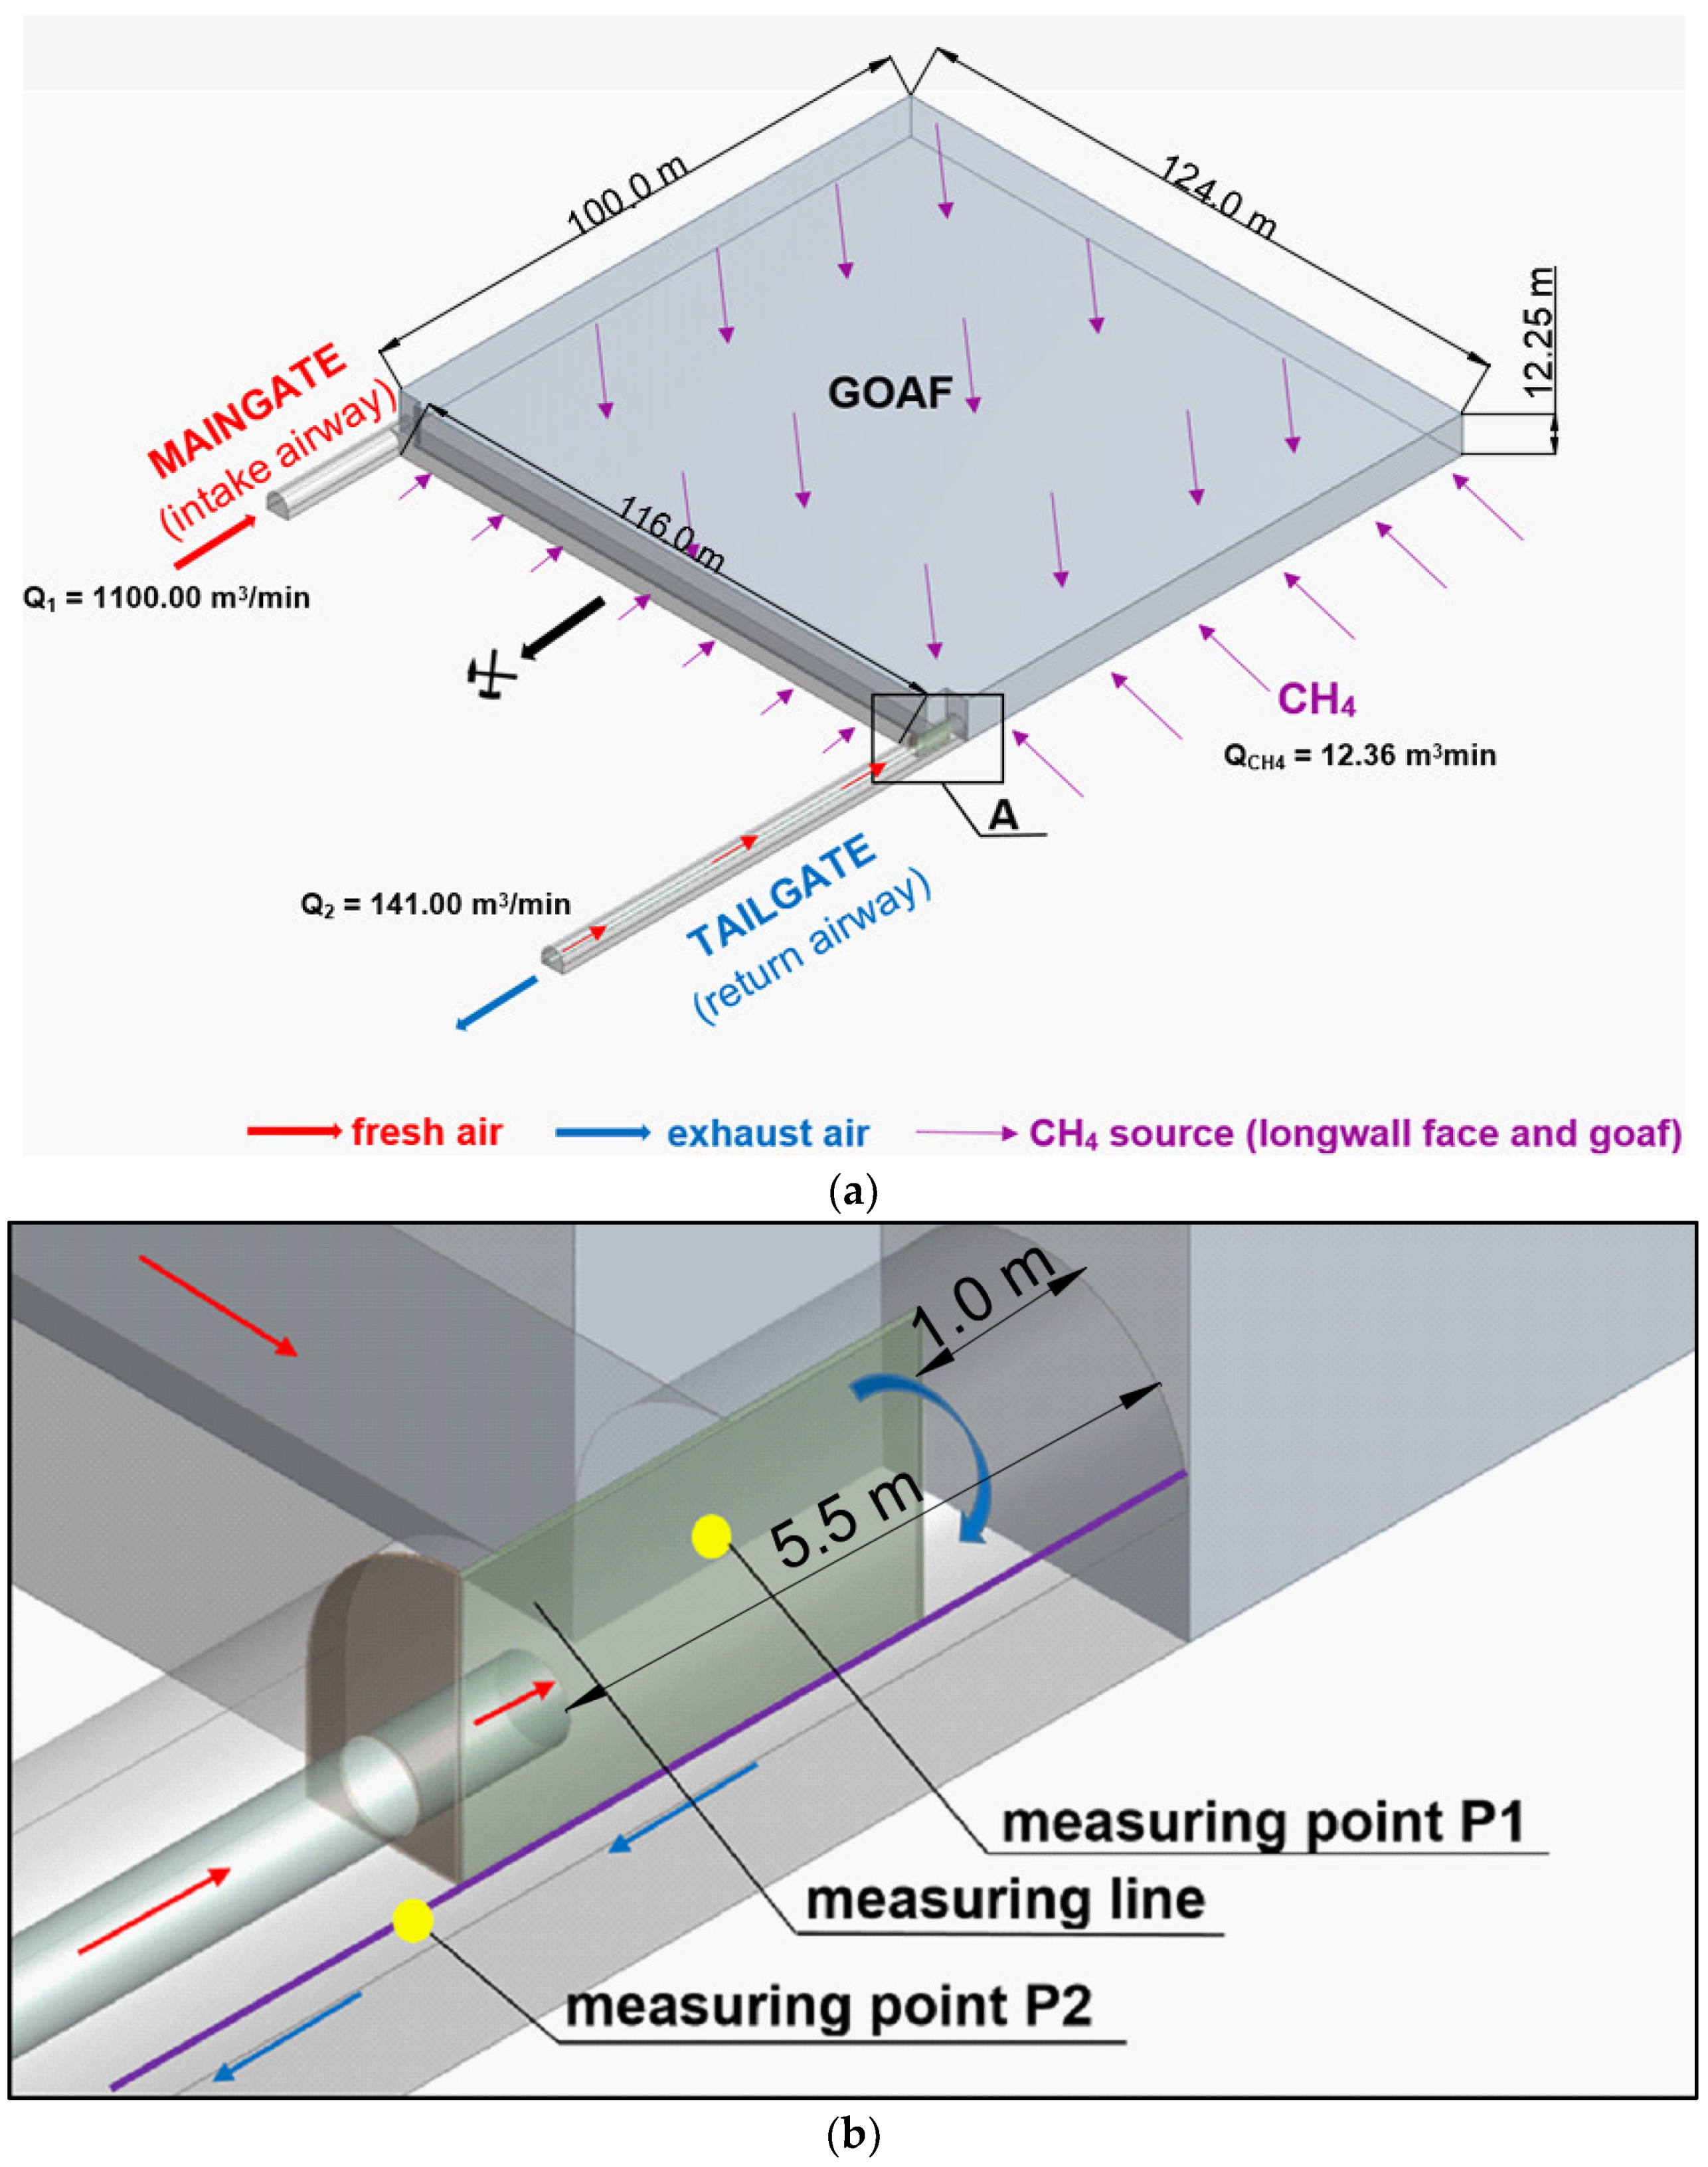
For this purpose, a geometrical model was developed for the area under analysis, with account being taken of the geometry parameters of the longwall, the longwall headings (the maingate and the tailgate) and the goaf with caving, which constitute the flow area for the air and methane mixture (Figure 6a). This model also included the auxiliary ventilation equipment (Figure 6b).
The geometry parameters of the area under analysis and the ventilation parameters of the flowing air stream are presented in Table 2, and Table 3 contains a summary of the strength parameters of the roof rocks forming the goaf with caving, which are necessary to determine the permeability of this medium, according to Equations (18) and (19).
At the next stage, discretisation of the model was performed, involving generation of a mesh consisting of a finite number of control volumes. The mesh generated for the geometric model consisted of hexahedron elements. Its dimensions are 0.15 m × 0.15 m × 0.15 m. Before selecting the size of the mesh elements, there was an analysis of its sensitivity to the calculation results obtained. Based on this analysis, it was assumed that, for model-based tests of air flow through the goaf with caving, one may adopt a numerical mesh with a size of the cubic elements equal to 0.15 m × 0.15 m × 0.15 m. Smaller elements significantly extend the time of calculations, without making any changes in the results obtained.
Next, boundary conditions were adopted along with a physical model, which was used for numerical calculations. The case at hand employed the standard turbulence model k–ε. The authors in their earlier study also found that the standard turbulence model k–ε is the most preferred model for studying the methane layering behavior and dispersion of methane [2,10]. The model thus developed was subjected to a numerical analysis. After setting the boundary conditions, the solutions were initialized. During iterations, the convergence was set at 1 × 10⁻⁶ (as per the “Fluent” support documentation) [48].

4. Results and Discussion

The calculations performed helped to obtain a series of interesting results. Particular significance was ascribed to determining the impact of auxiliary ventilation equipment on the parameters of the ventilation system. As mentioned before, no such tests had ever been carried out before. Therefore, analyses were conducted for two ventilation systems: one without and the other one with auxiliary ventilation equipment. In order to compare these systems, all the input geometry, physical and chemical parameters were the same in both cases.
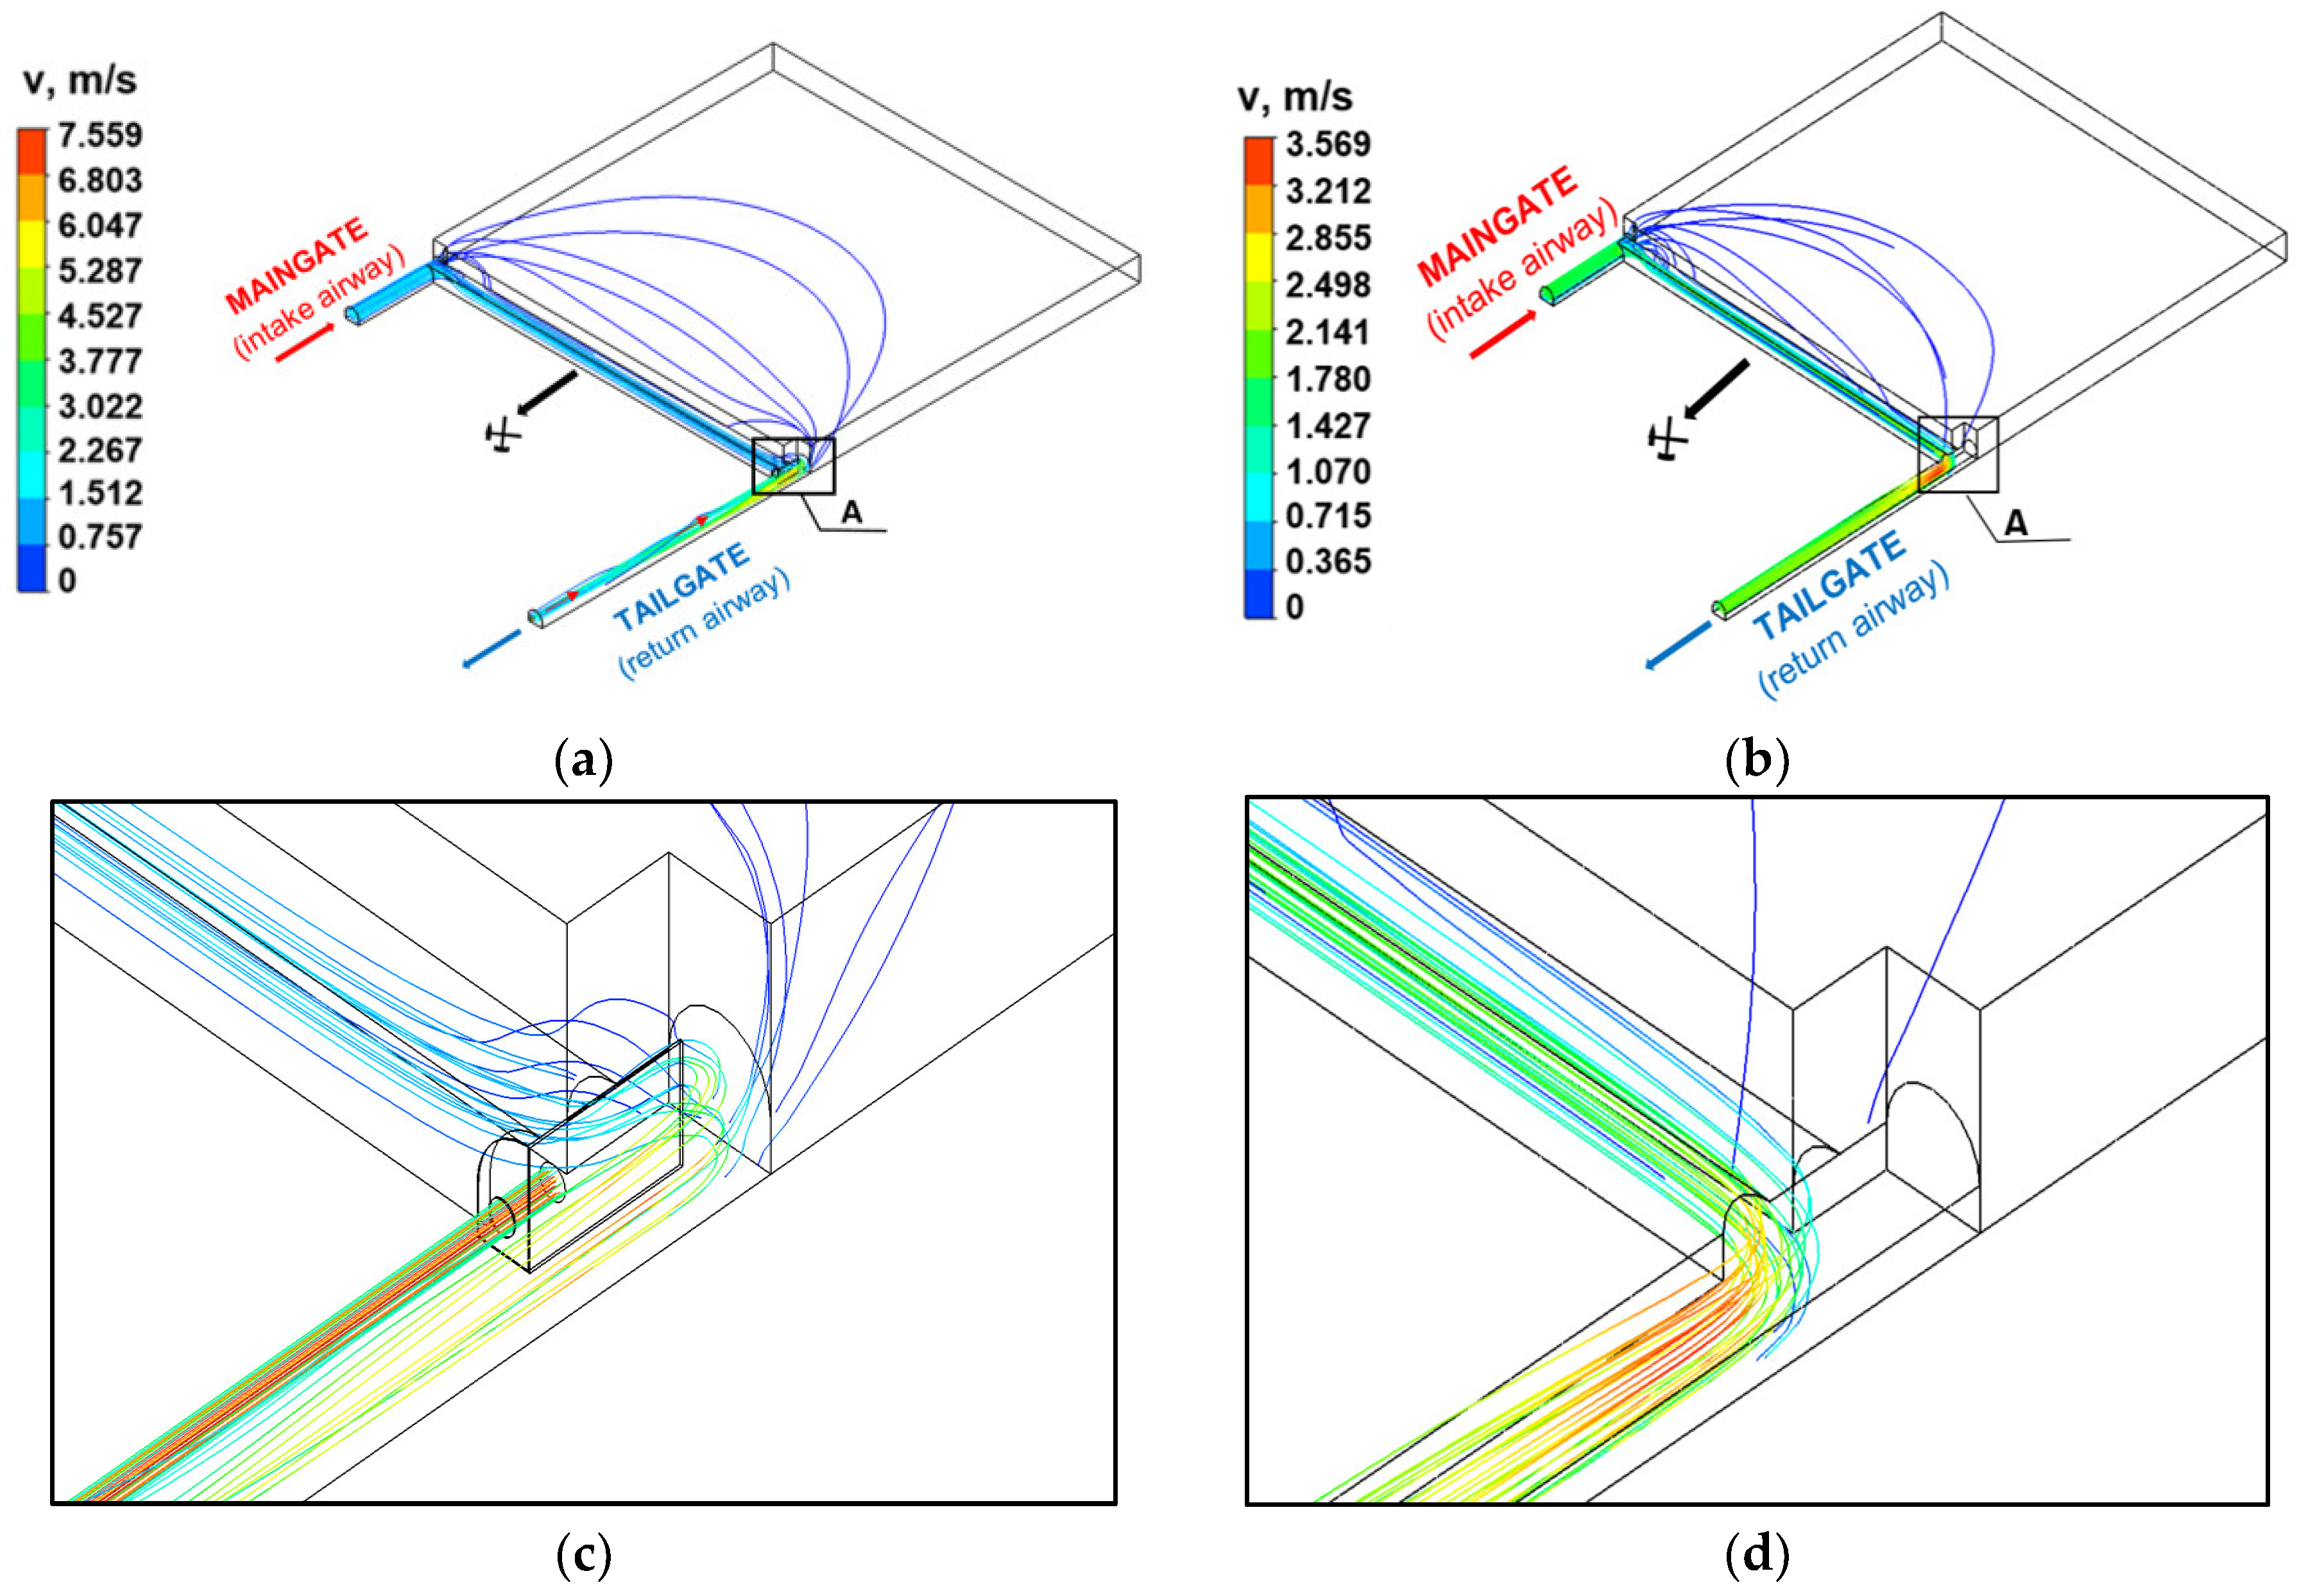
The results obtained demonstrated significant differences for both the systems under analysis. This concerned the parameter values of the air and gas mixture flowing in the analysed headings and goaves with caving, as well as the distribution of methane concentration. In order to illustrate the differences between both systems, Figure 7 presents the trajectories of the air flowing through the goaves with caving and the intersection area between the longwall and the tailgate with built-in auxiliary ventilation equipment (Figure 7a,c) and without such equipment (Figure 7b,d).
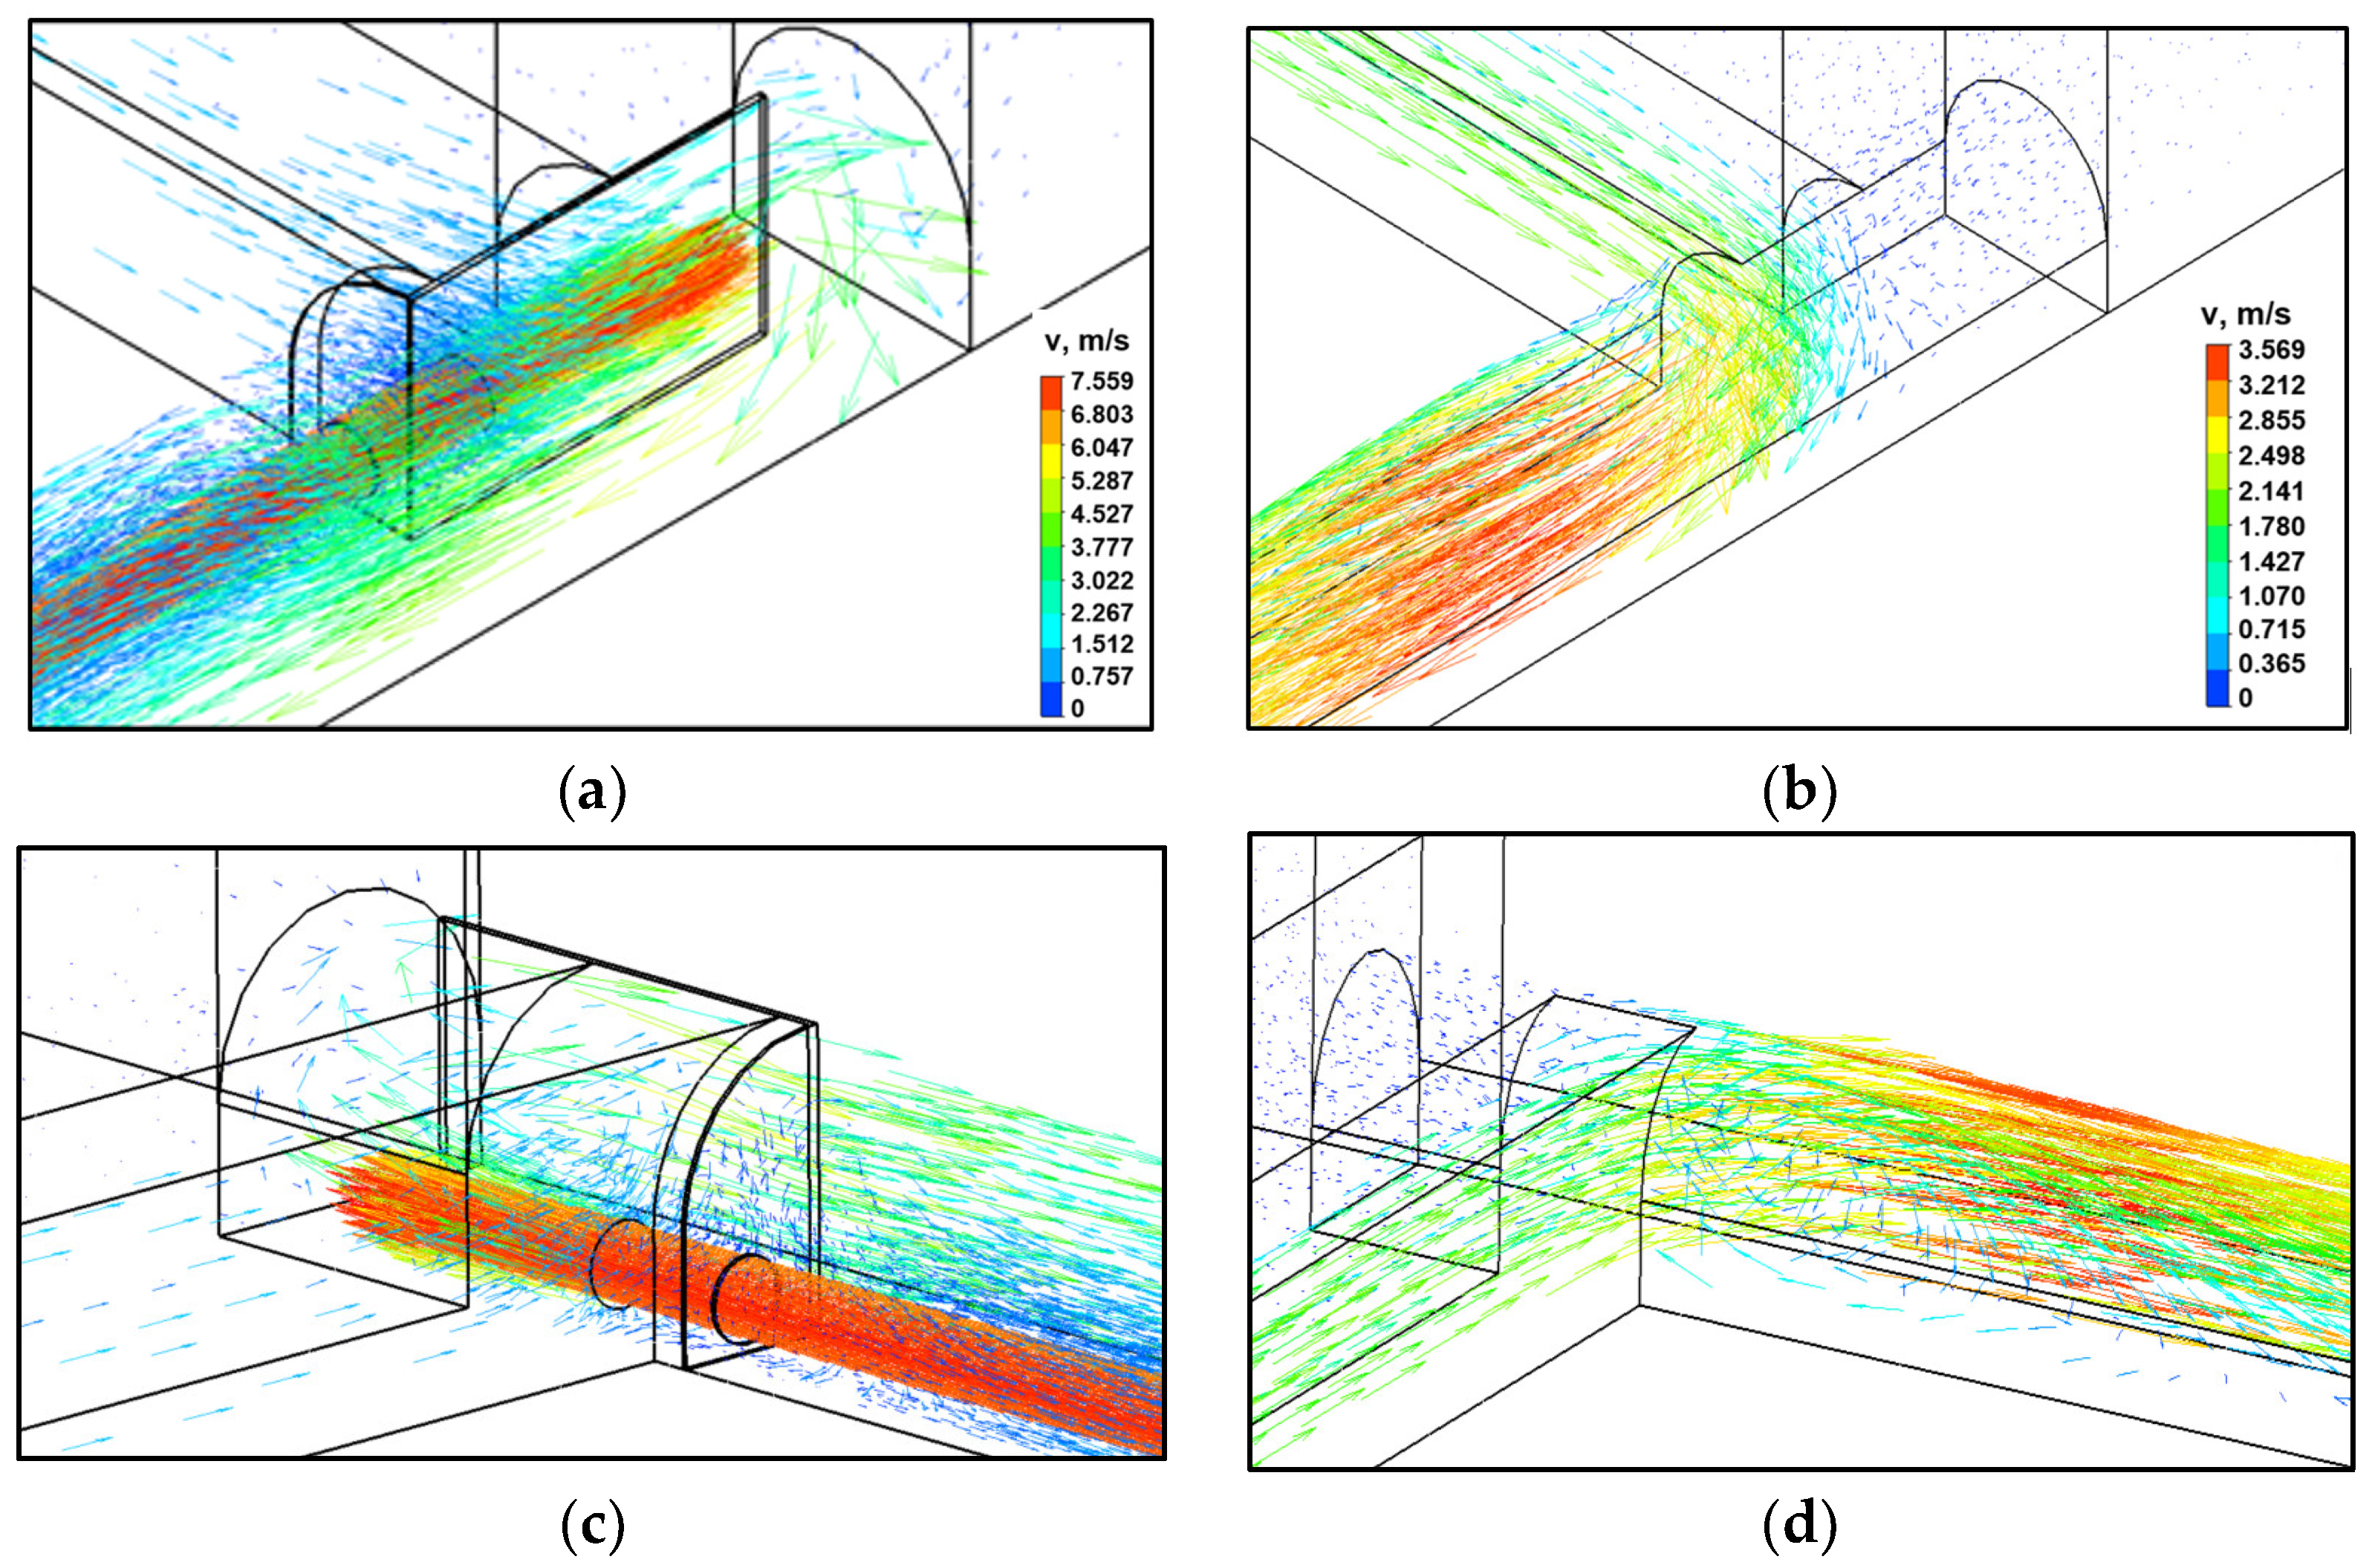
Figure 8, on the other hand, presents the distributions of velocity vectors for the mixture of gases flowing through the area under analysis with auxiliary ventilation equipment installed in the tailgate (Figure 8a,c) and without such equipment (Figure 8b,d).
The analysis of the distributions obtained clearly demonstrates that the application of auxiliary ventilation equipment has a very important effect on the manner, in which the mixture of gases flows through the area in question.
In the case of the system with auxiliary ventilation equipment, the air stream flowing out of the longwall hits the air brattice (ventilation curtain) located in the tailgate. After it bounces off, the air stream travels towards the unliquidated section of the tailgate located behind the caving line of the longwall and hence also towards the goaf with caving. This leads to the formation of a gyrating flow and recirculation of air at the outlet from the longwall. Such a flow generates large curvatures of the current line. Two air streams overlap in this section of the tailgate: the main stream flowing out of the longwall and the refreshing stream flowing out of the auxiliary air duct. This leads to significant changes in the distribution of methane concentrations in this area (Figure 9a).
In the absence of auxiliary equipment, the air stream flowing through the longwall changes its flow angle by 90° and flows into the tailgate. The section of this tailgate located behind the caving line of the longwall continues to be an area which is practically not accessed by the air stream. As a result, this is the accumulation area for the methane flowing from the goaf with caving (Figure 9b).
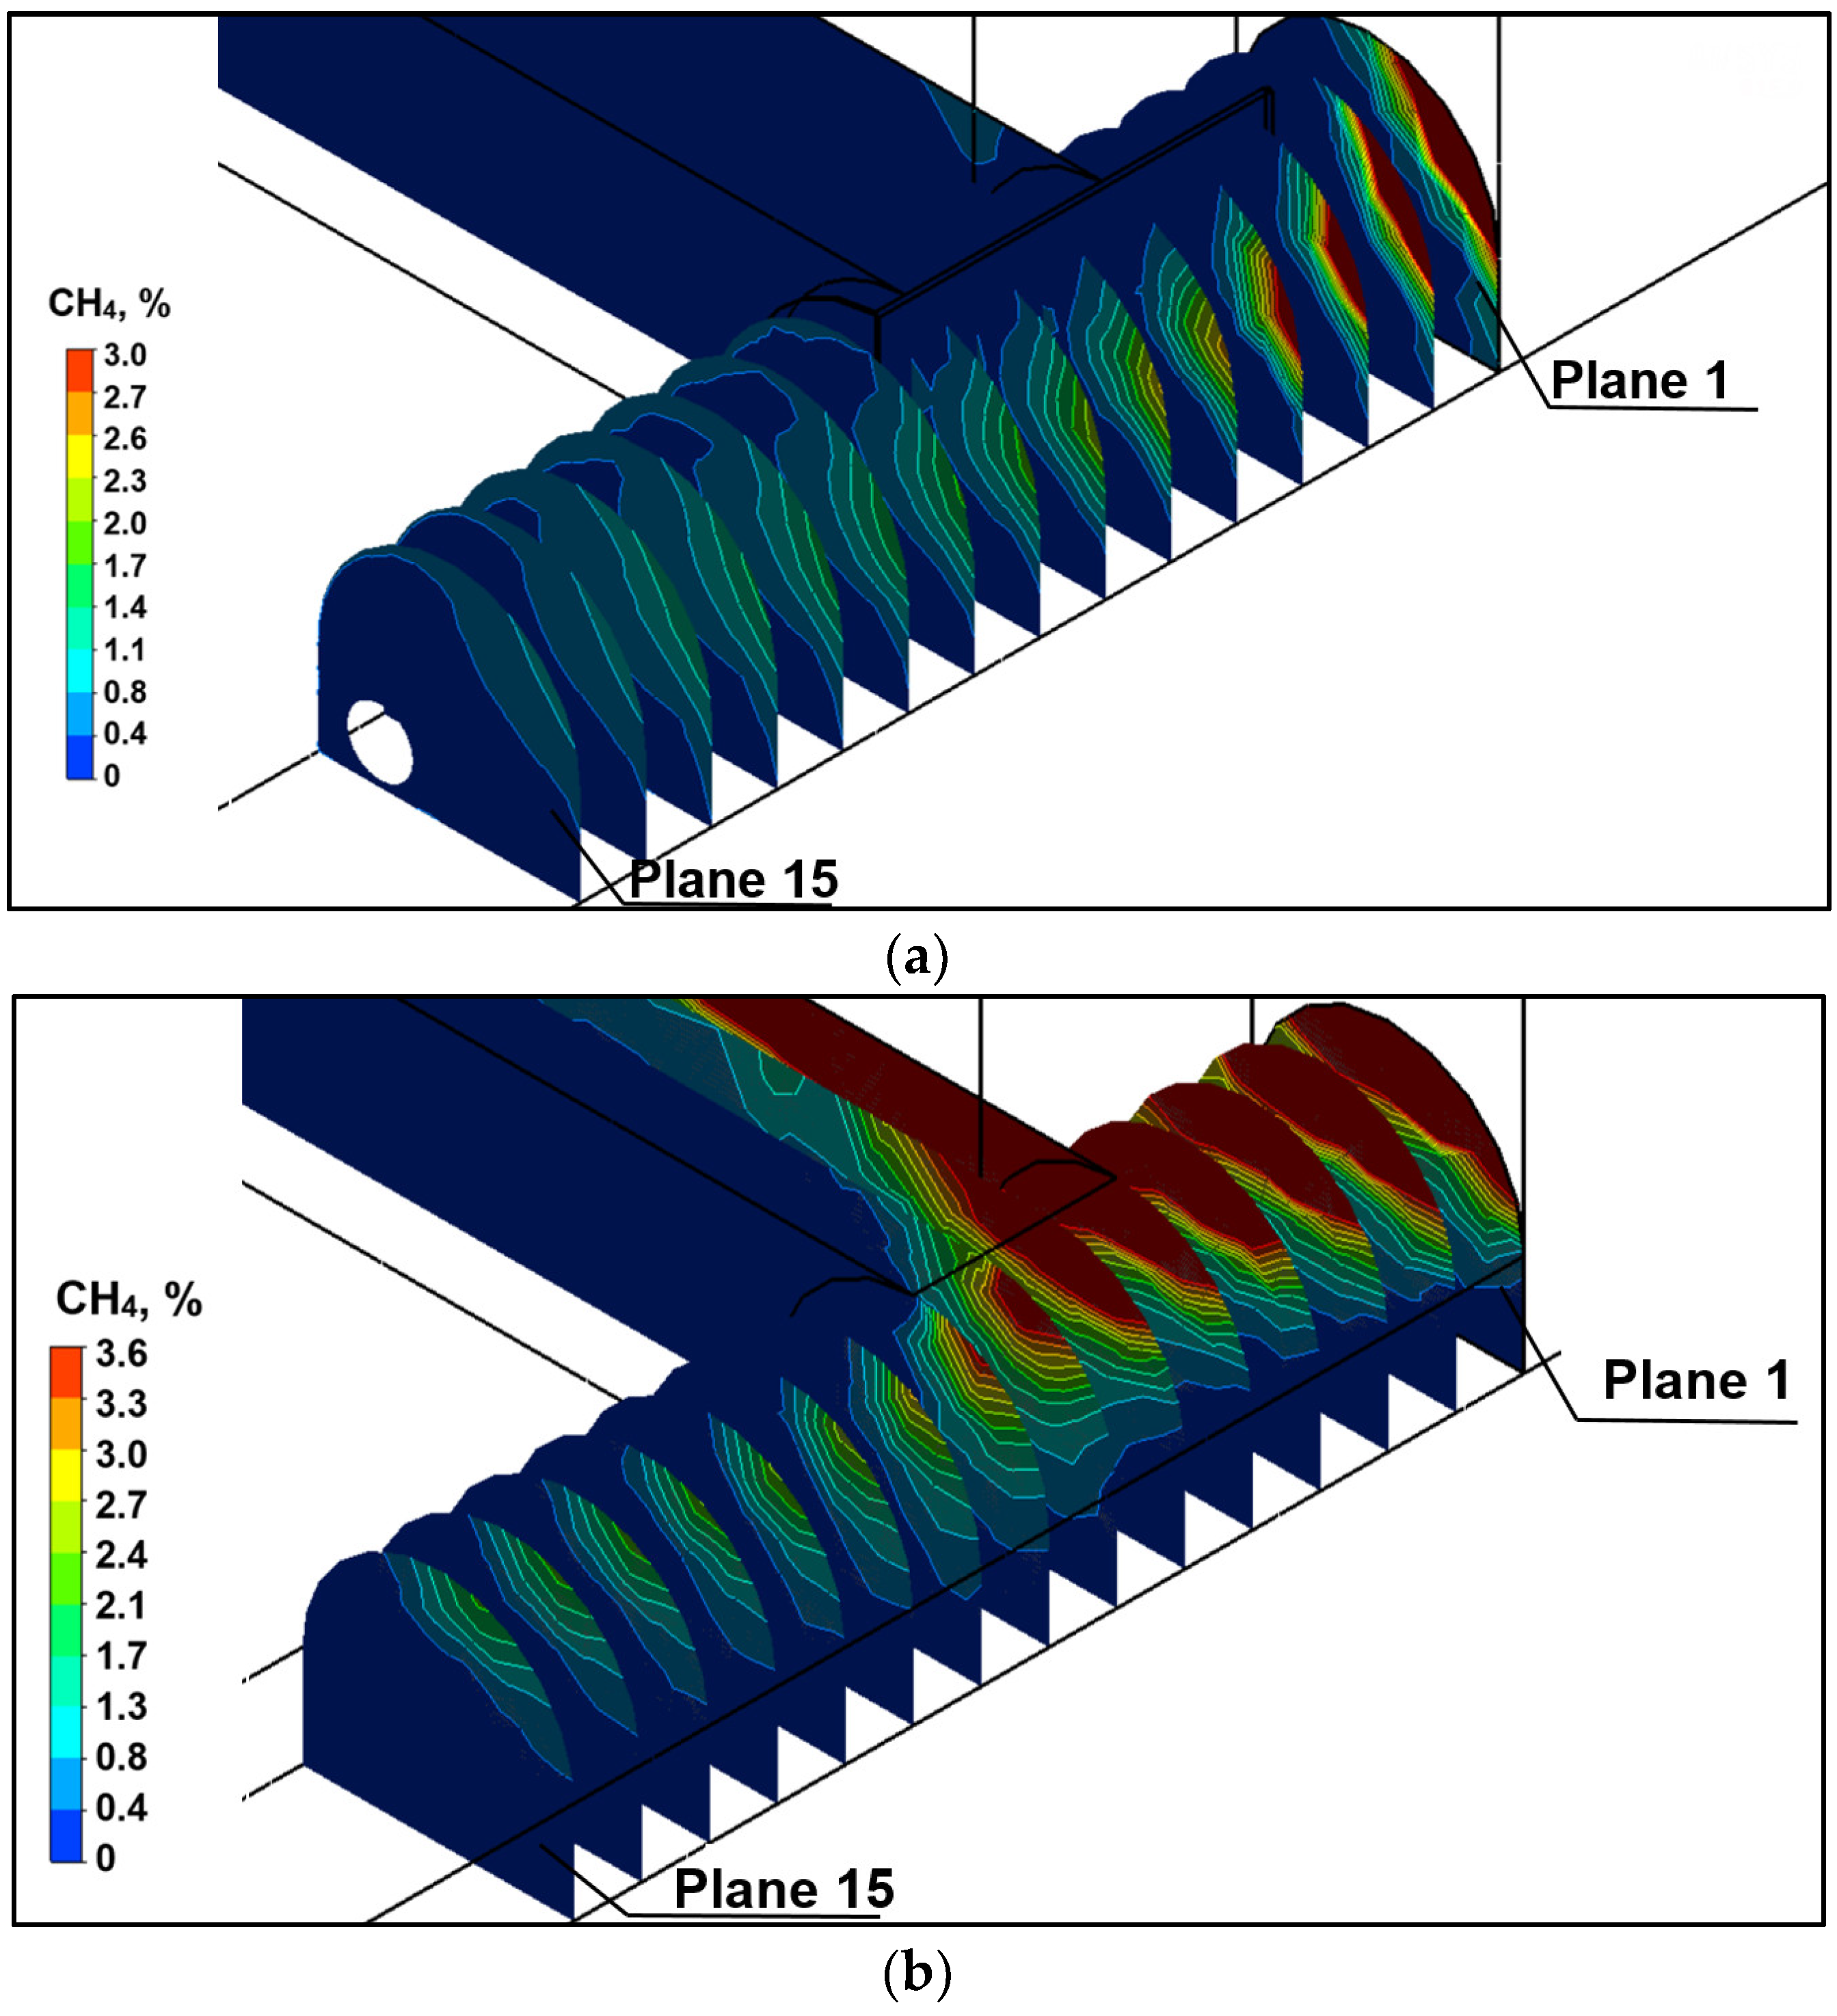
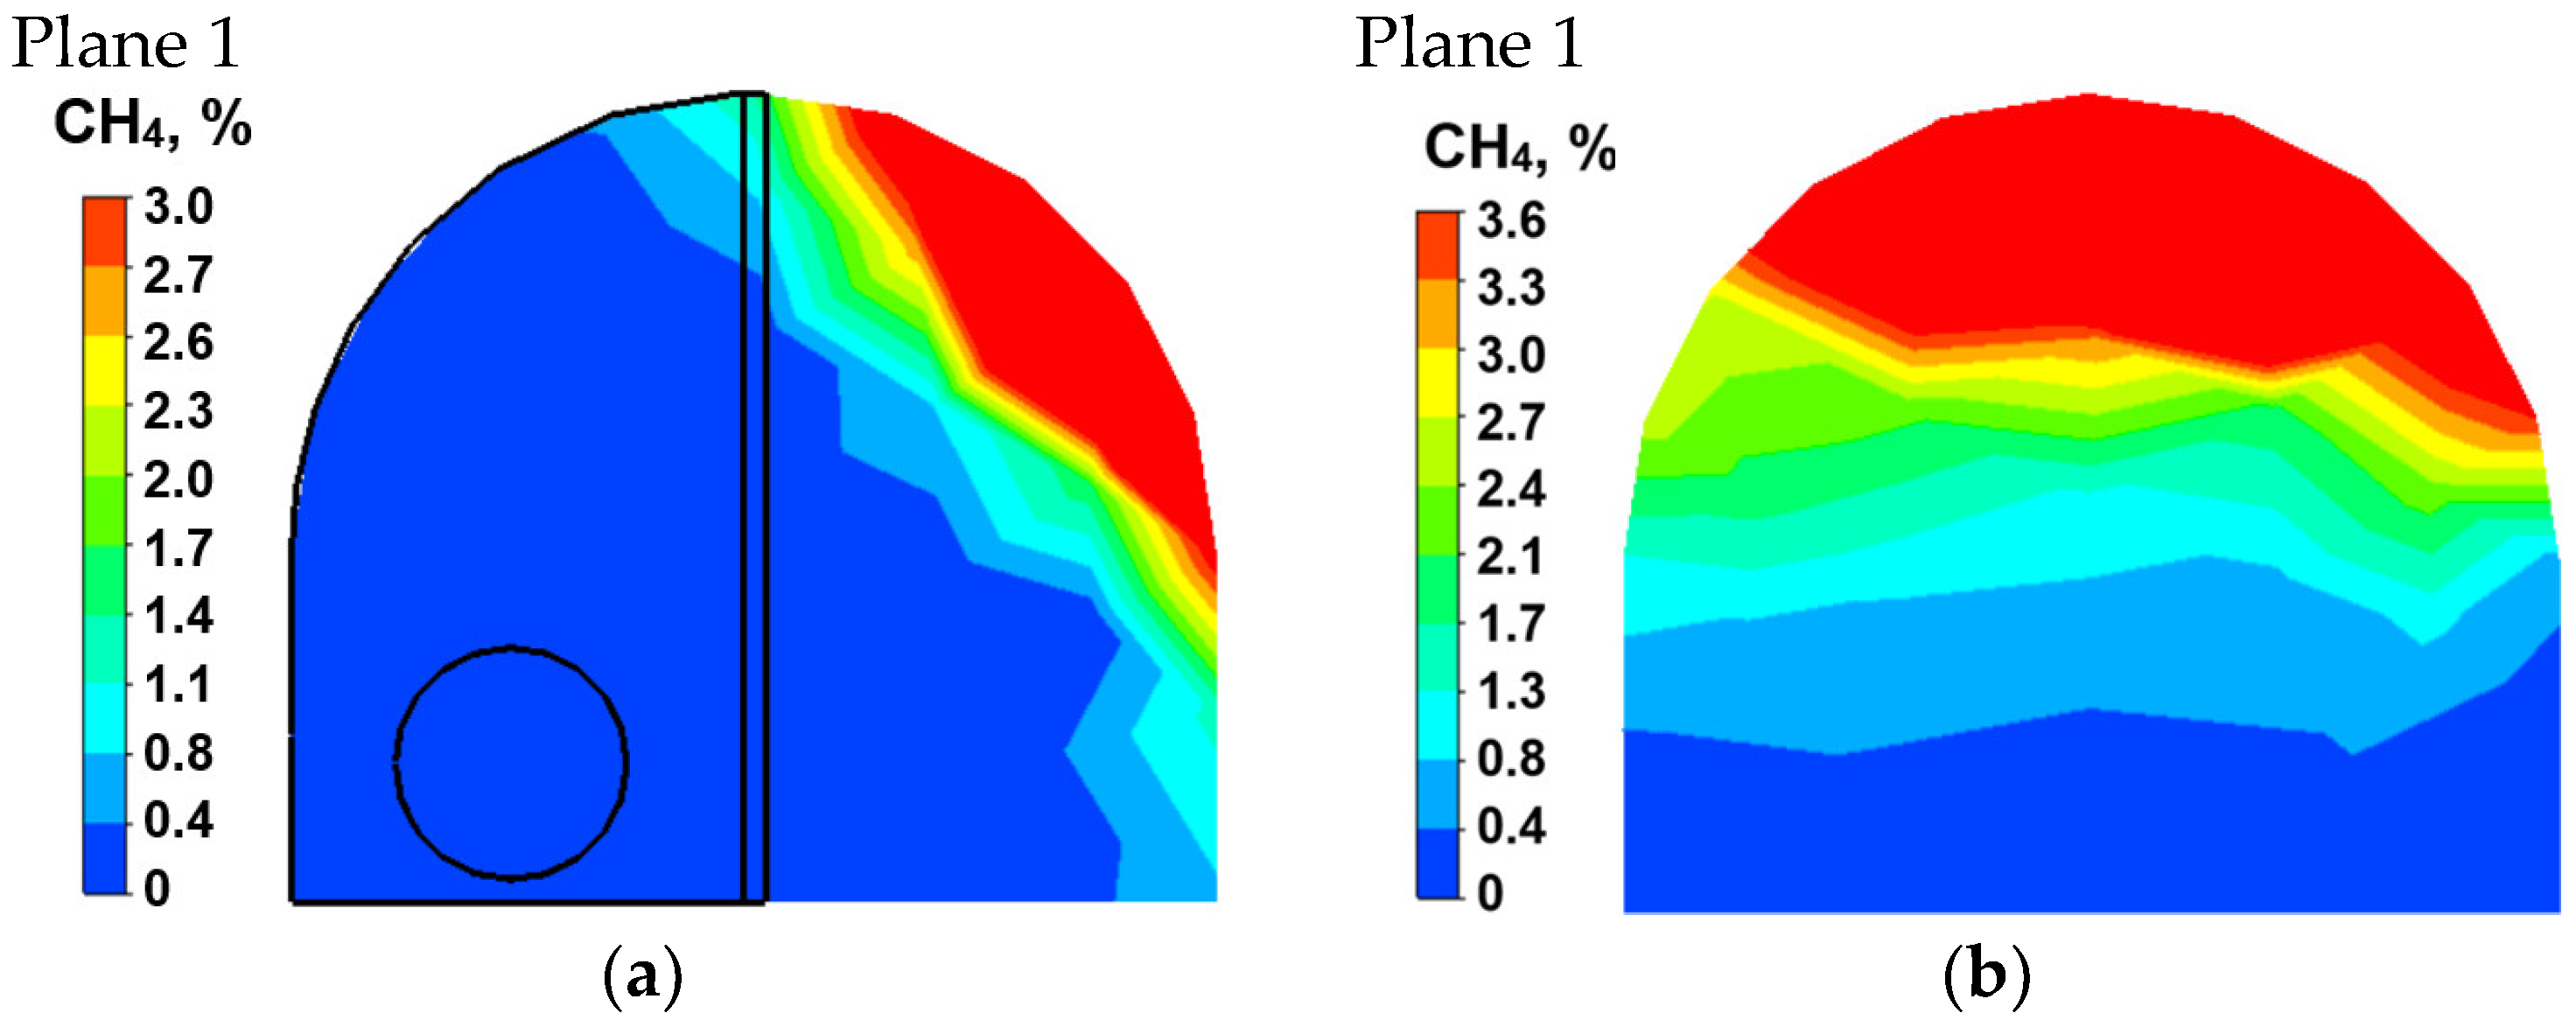
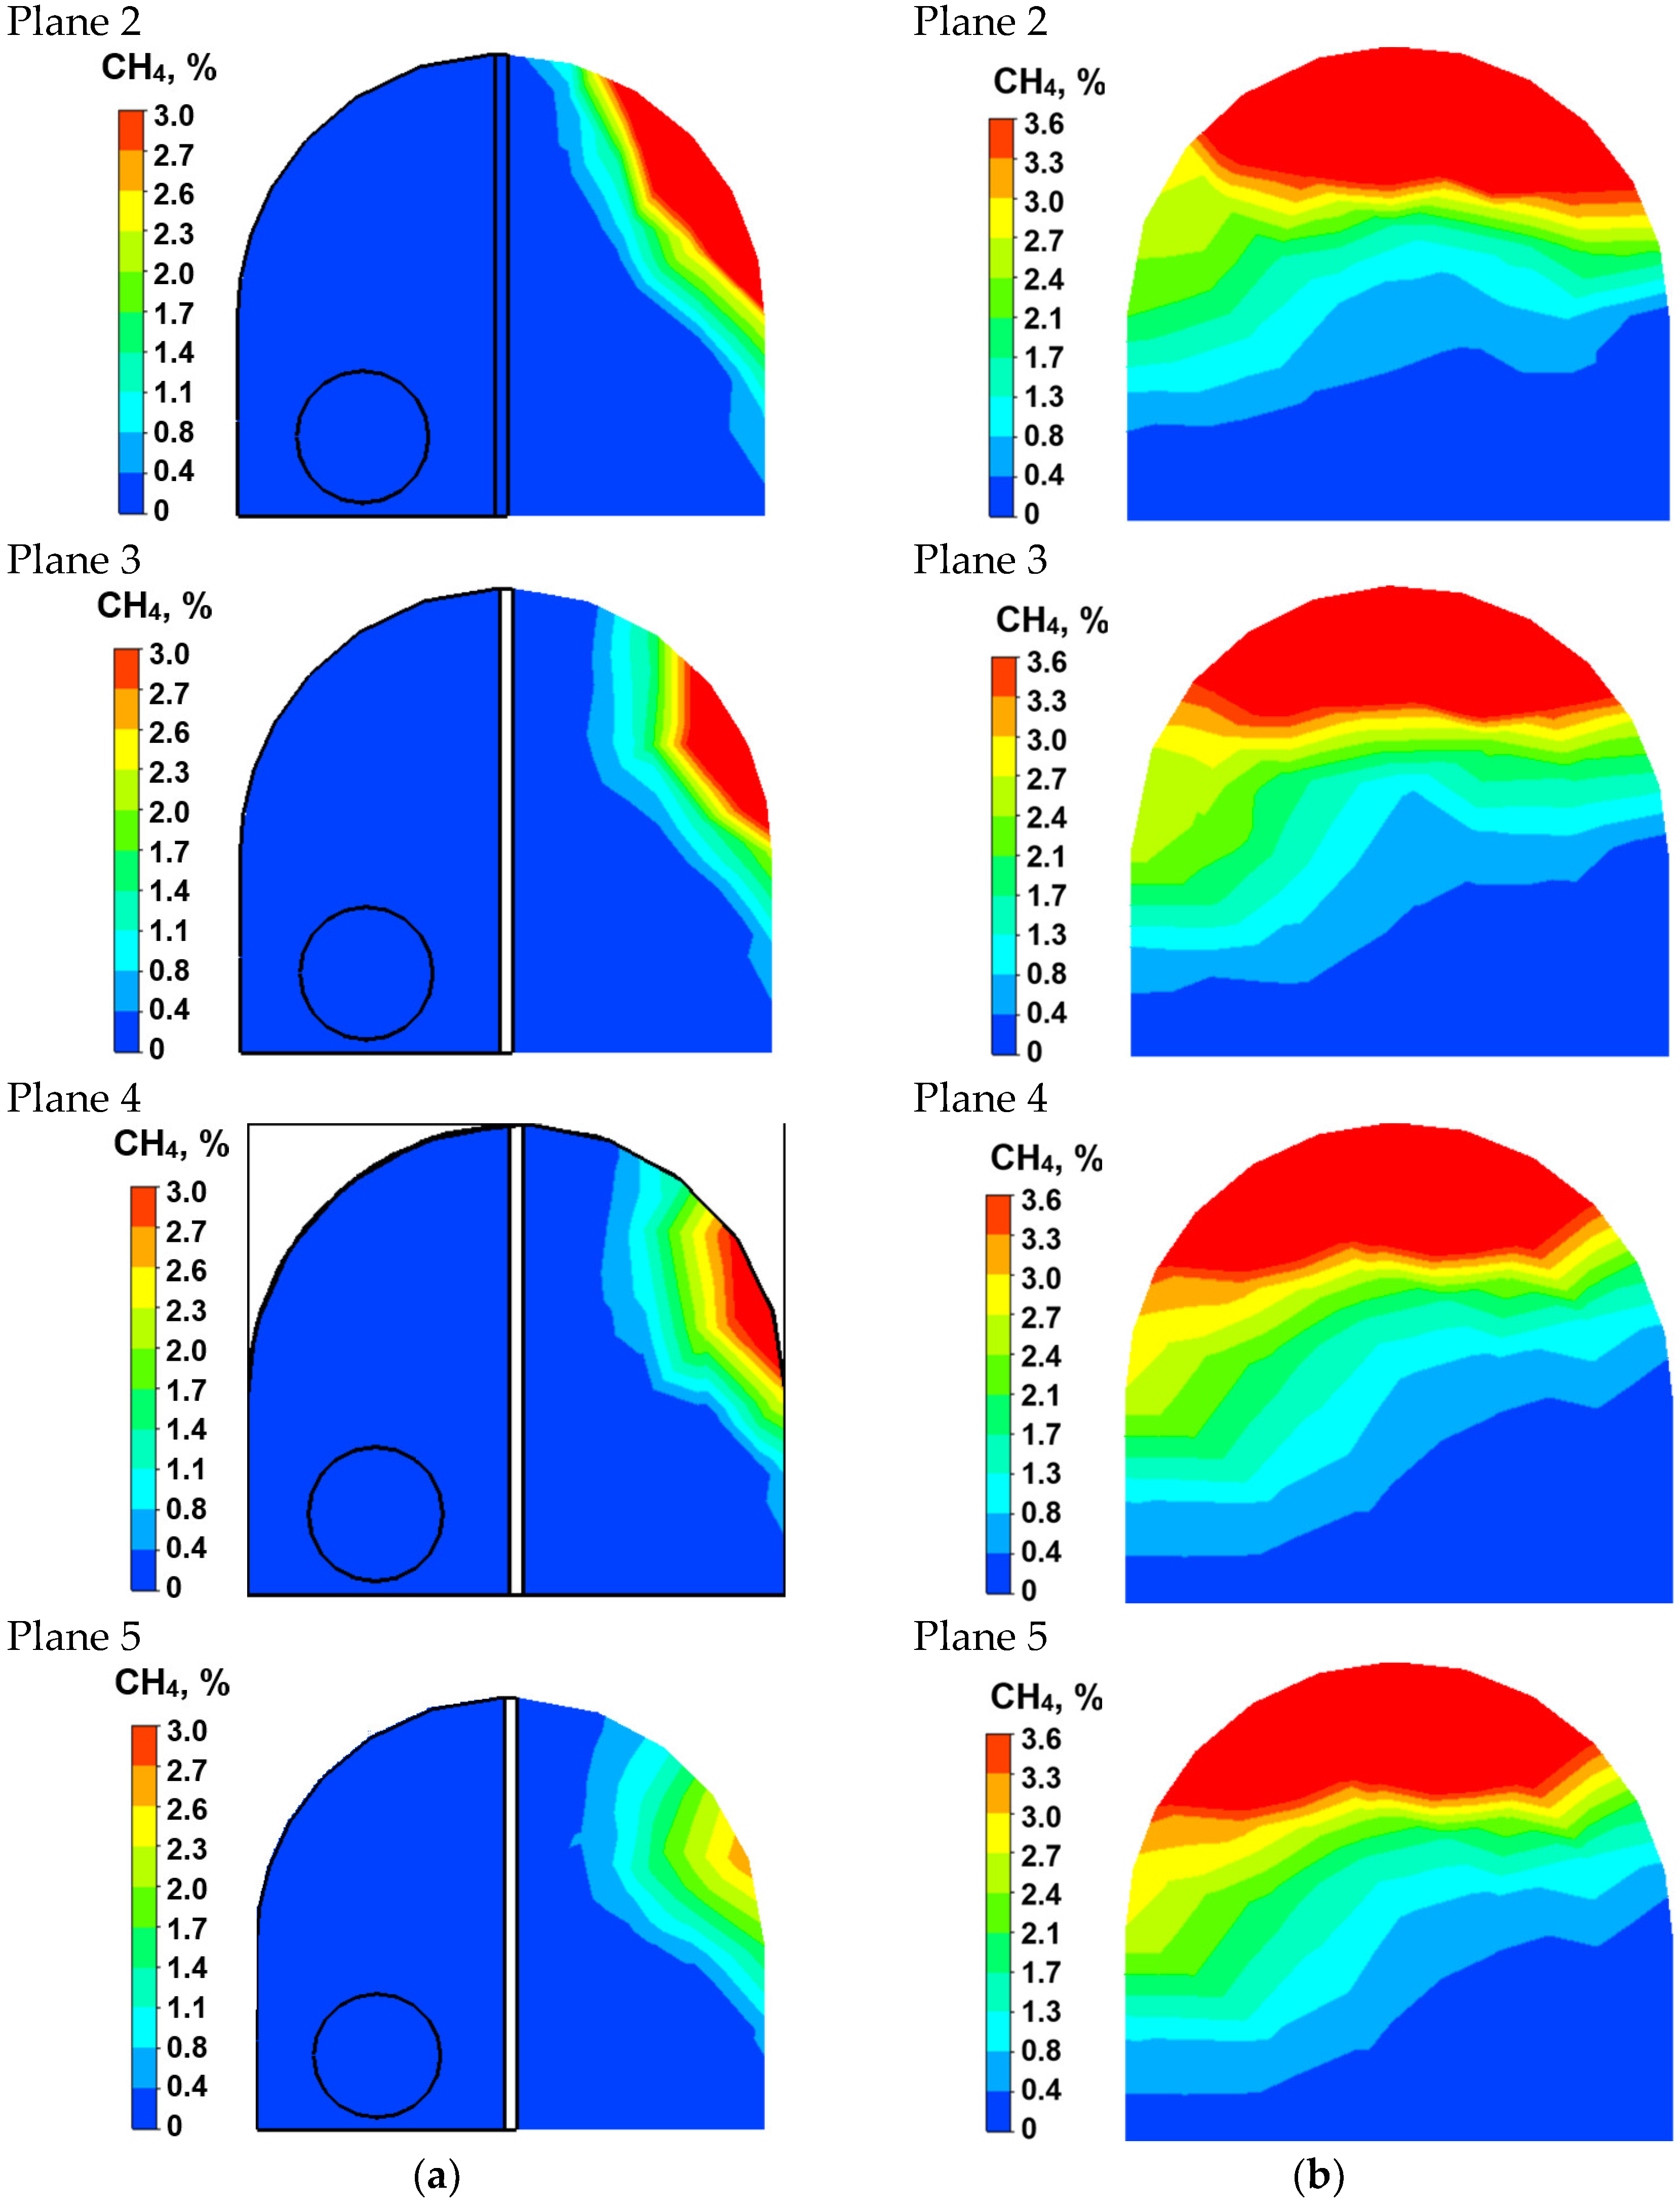
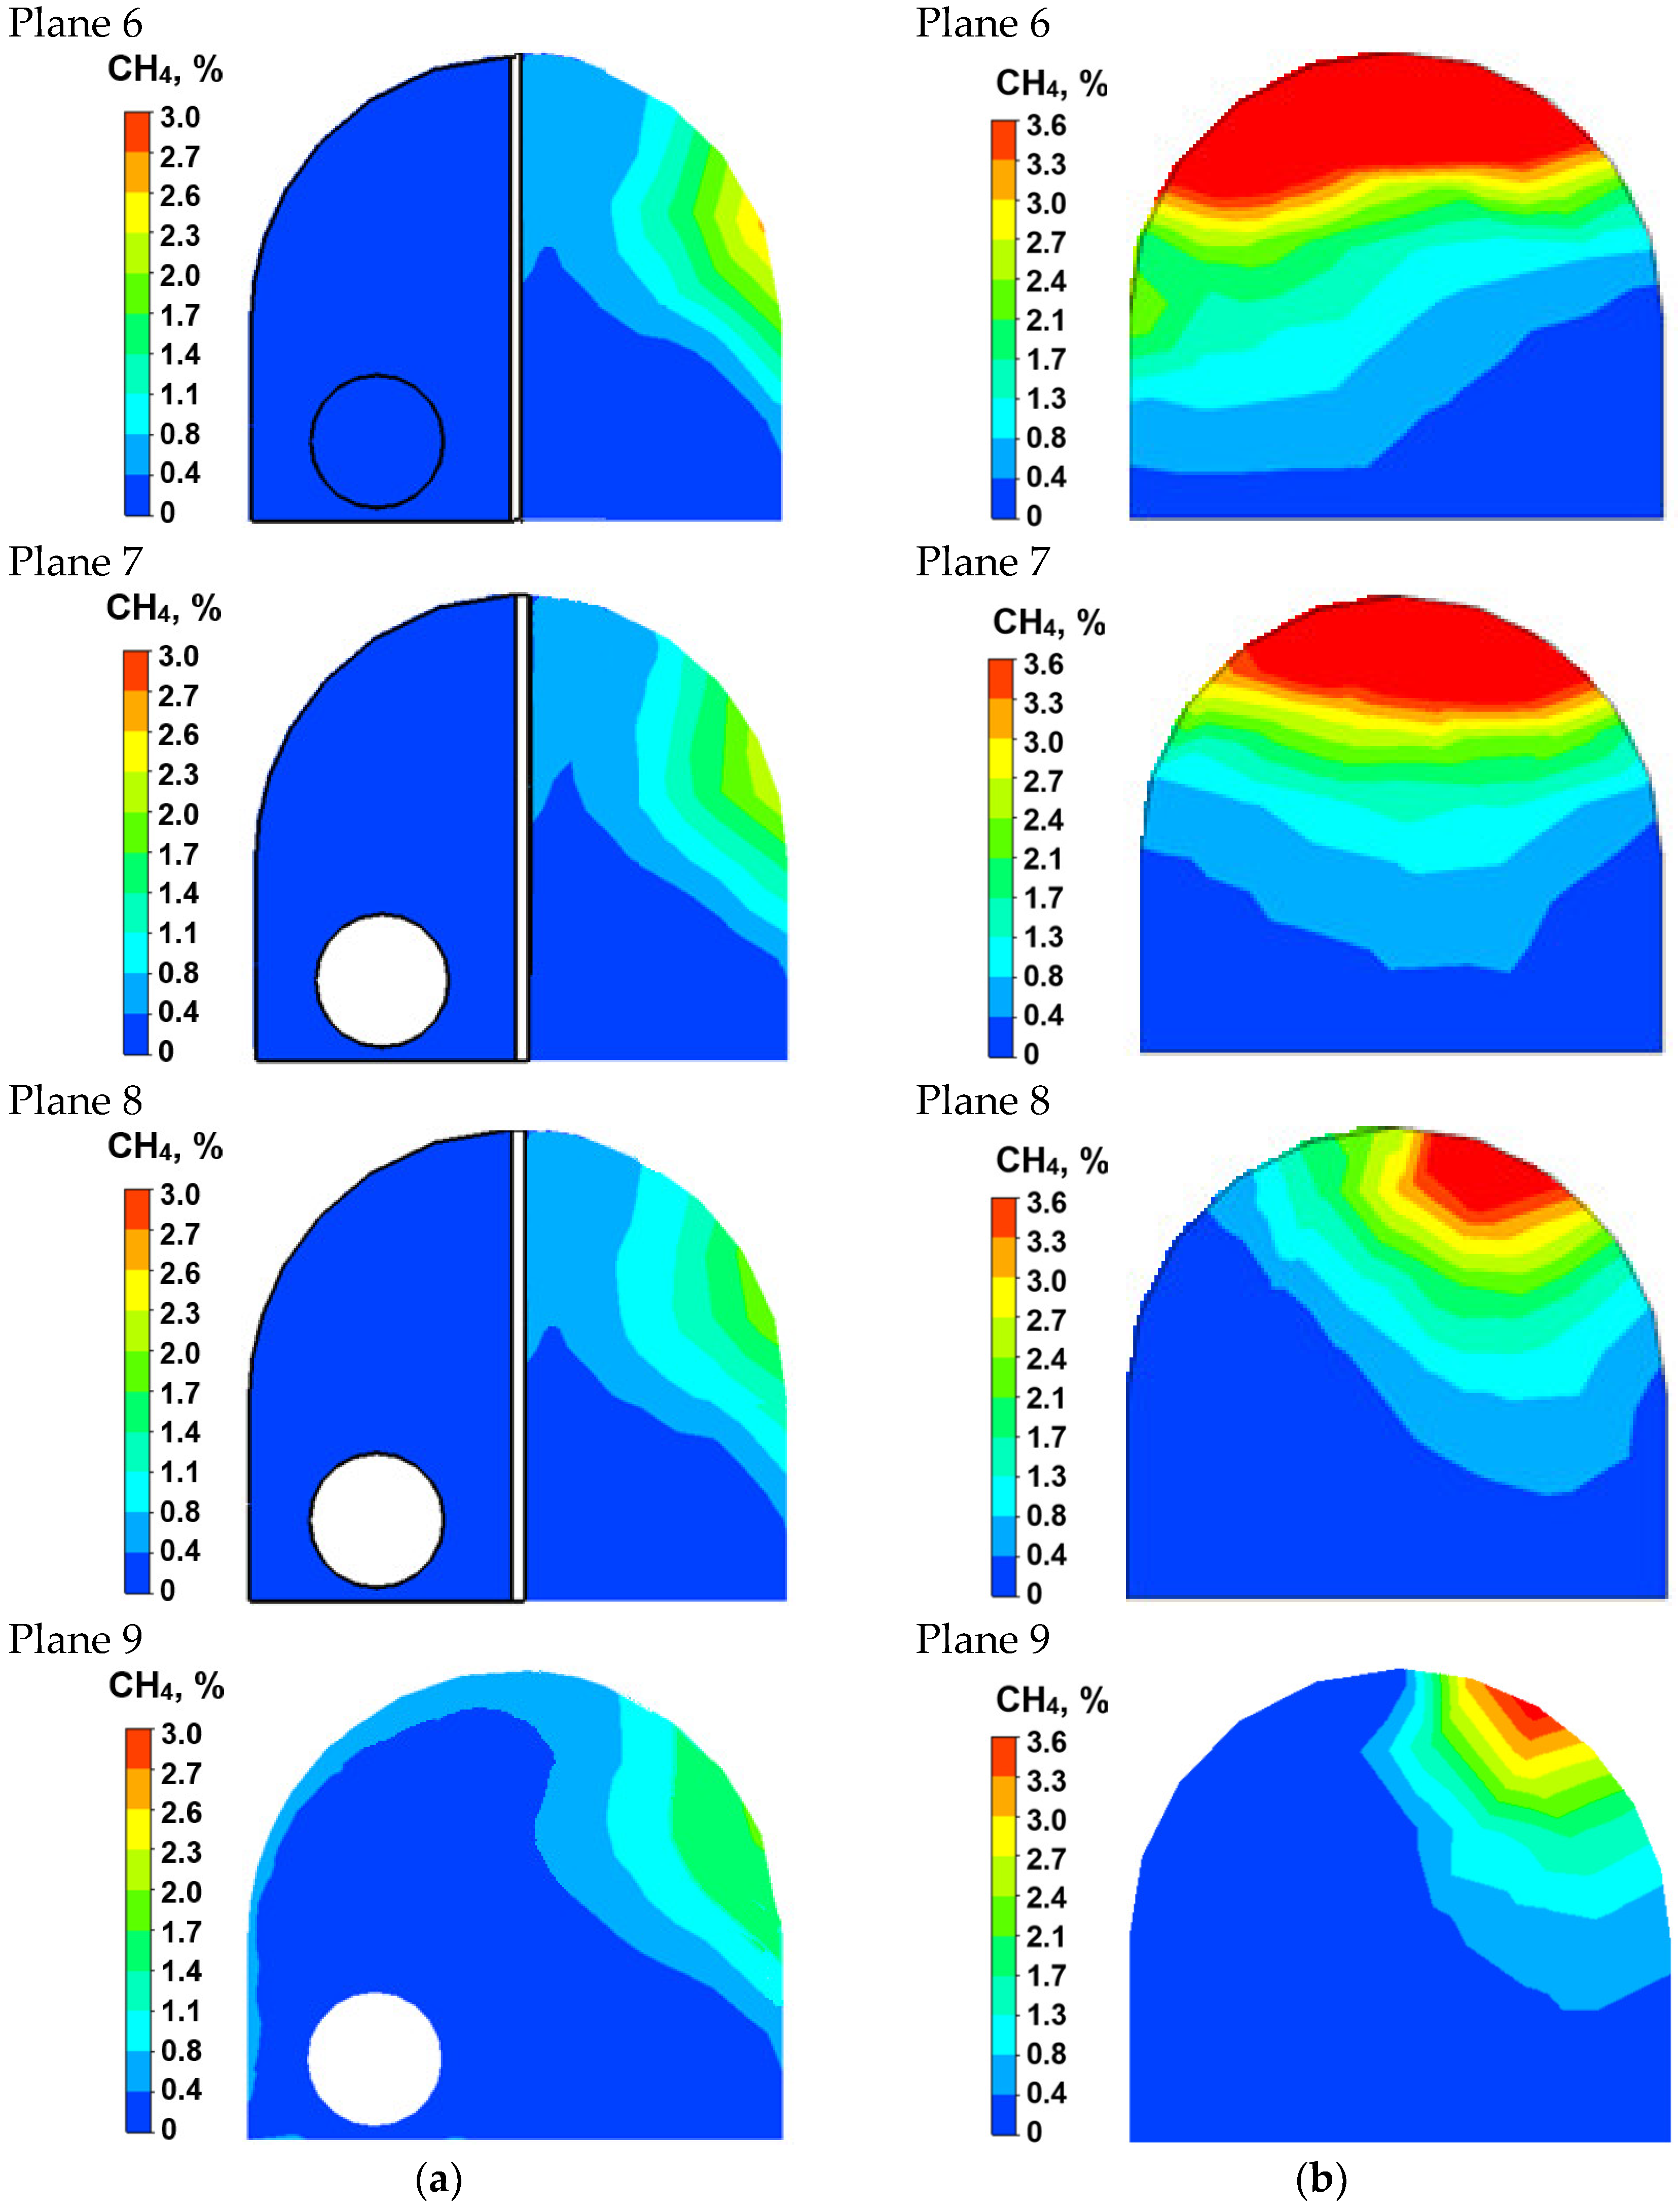
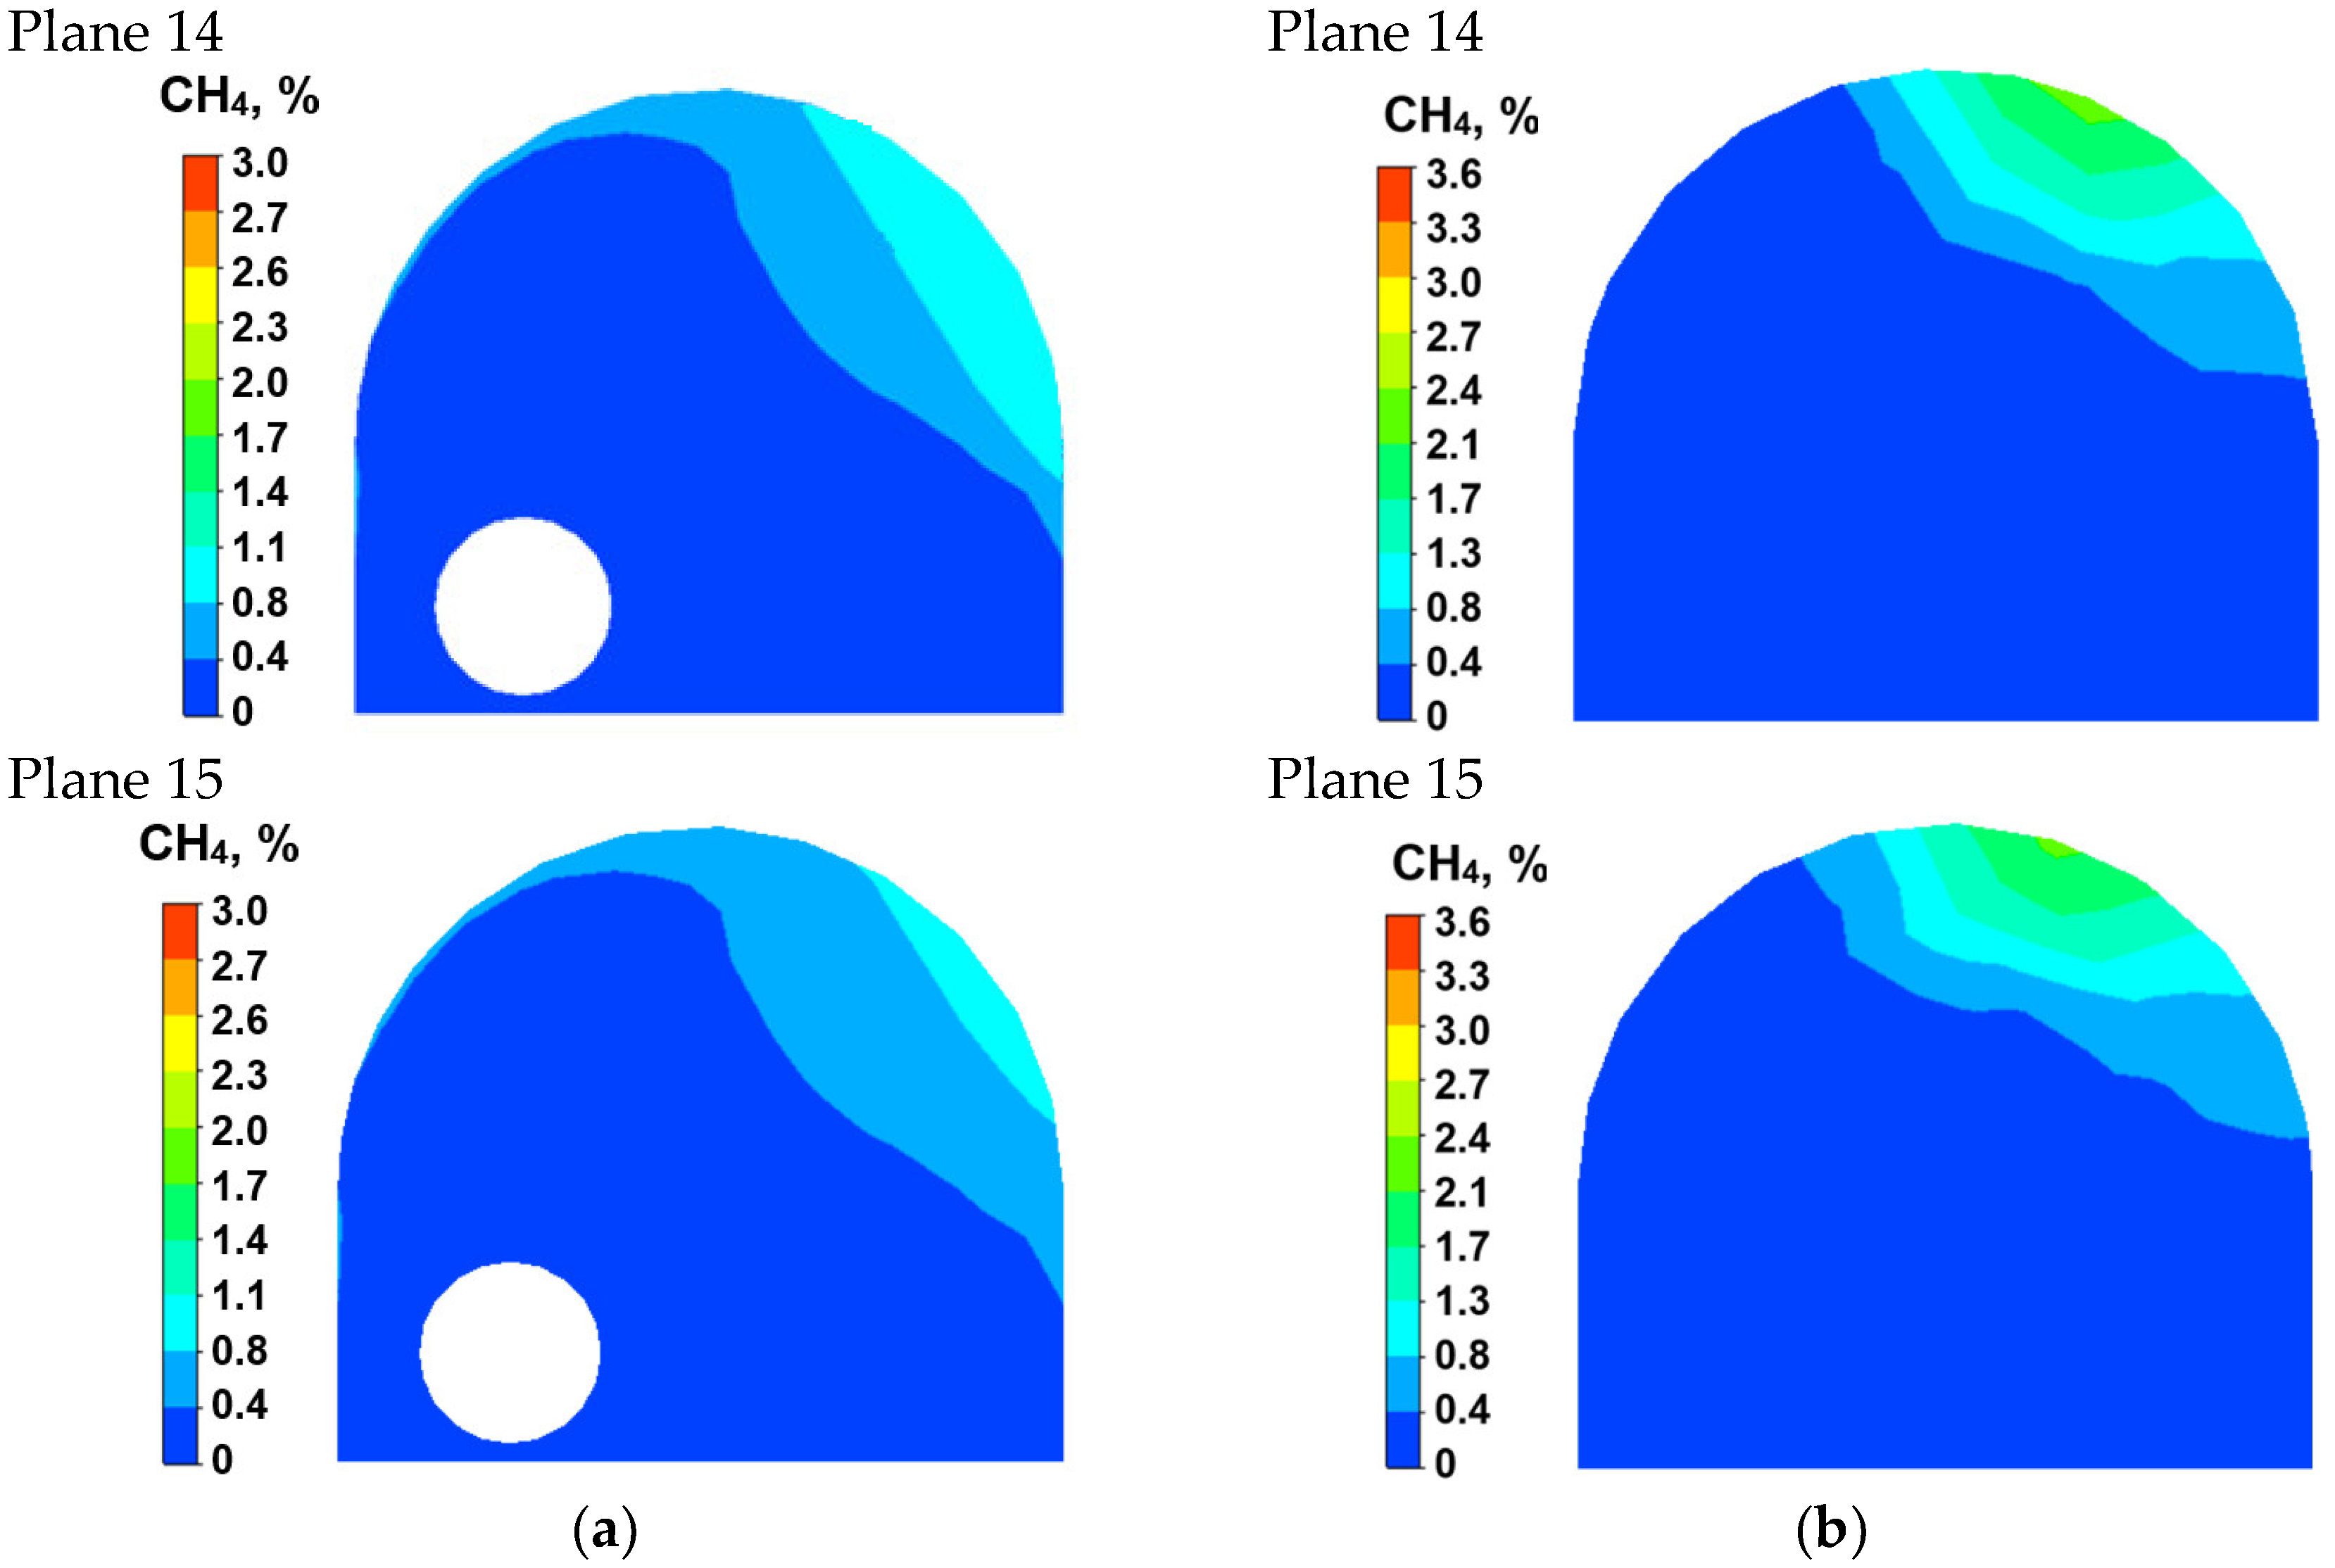
The distributions of methane concentrations in vertical sections of the tailgate with built-in auxiliary ventilation equipment (a) and without such equipment (b) are presented in Figure 8. They are presented in vertical sections located every 1.0 m from the liquidation line of the tailgate (for 15 sections). Figure 10, Figure 11, Figure 12, Figure 13 and Figure 14, on the other hand, presents the distributions of methane concentrations in selected vertical sections of the tailgate with built-in auxiliary ventilation equipment (a) and without such equipment (b).
Analysing the presented distributions of methane concentration, one can conclude that auxiliary ventilation equipment has a fairly significant impact on such distributions.
Installing this equipment in the tailgate significantly changes the location of the area with maximum methane concentrations. In the event where auxiliary ventilation equipment is not installed, the maximum methane concentration values are present in the roof section of the heading, whereas in the case where this equipment is used, the maximum methane concentration values are present in the lateral (sidewall) section of the heading. Moreover, when auxiliary equipment is used, the section of the unliquidated tailgate behind the longwall caving line is intensively ventilated, thus preventing the accumulation of methane which flows out of the goaves. In the event where this equipment is not present, the unliquidated section of the tailgate is an ideal location for methane to accumulate due to lack of air supply. The equipment applied, besides changing the location of the zone exposed to high methane concentration levels, contributes to significant reduction in the size of this zone (Figure 8 and Figure 9). This leads to a more favourable distribution of methane concentrations in this region.
It is also evident that the absence of auxiliary ventilation equipment in the case of high methane-bearing capacities of the longwall, which may practically make it impossible to maintain safe values for methane concentrations in mixture with air. As a consequence, this significantly limits the possibilities for safe exploitation to be carried out.
The distributions presented in Figure 9 and Figure 10 are significantly affected by the manner in which air and methane flow through the goaf with caving.
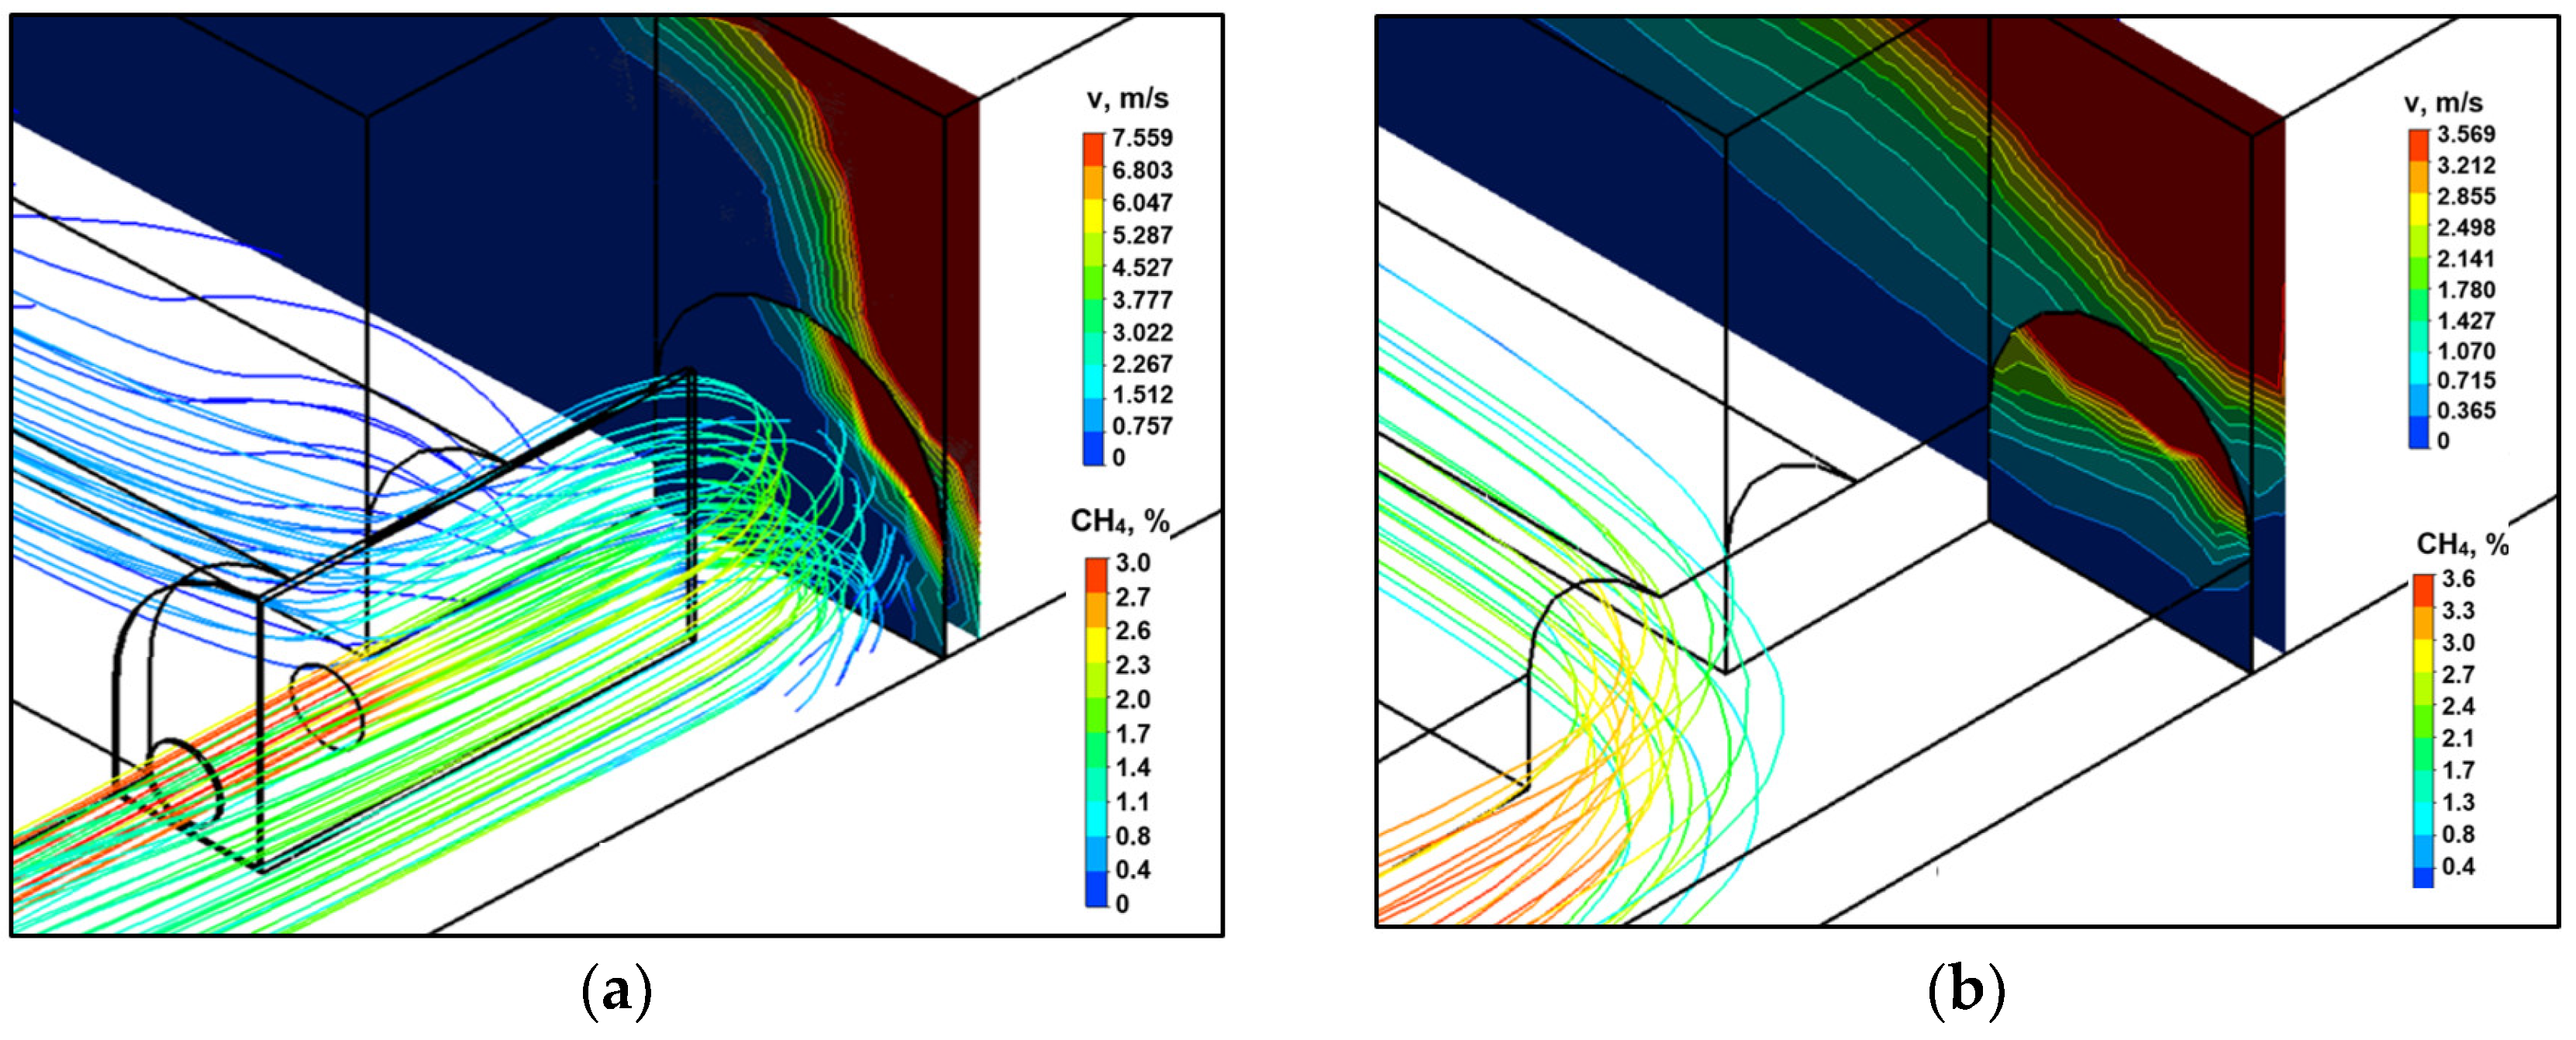
As a result of using auxiliary ventilation equipment, methane flows out of the goaf at the lateral (side) surface of the gallery (Figure 15a). On the other hand, when no such equipment is present, methane is released through the upper section of the surface adjacent to the goaf (Figure 15b). This is due to the fact that auxiliary ventilation equipment directs the air stream towards the goaf with caving, thereby preventing the free flow of methane into the tailgate with the entire surface adjacent to the goaf.
Taking account of the goaf with caving in the analysis shows how important they are for the flow of gases and the values of methane concentration (Figure 15).
In order to verify the results obtained from model-based tests, they were compared with the results of the measurements performed in the gallery under analysis. Methane concentration levels in Polish mines are measured on a point-to-point (local) basis, only in places (points) specified in relevant regulations. Methane detection sensors, which measure methane concentration values in the air flowing out of the longwall, are installed in the tailgate, at a distance of up to 10.0 m from the longwall outlet. The schematic distribution of the automatic manometry sensors for the area of the longwall under analysis is presented in Figure 3. Additionally, Figure 3 shows the measurement line which is located along the tailgate and crosses the measurement point (P2). This line is situated at a height of 2.7 m and at a distance of 3.5 m from the outlet of the longwall (Figure 3 and Figure 6b). The arrangement of sensors for measuring methane concentration levels and the measurement line in the region was made under analysis.
The comparison of the methane concentration values obtained from the measurements in real-world conditions and those determined through model-based tests, for a system with auxiliary ventilation equipment, is presented in Table 4.
The relative error between the values of methane concentration levels from the measurements and those obtained through the numerical method does not exceed 12.2%. It can, therefore, be assumed that the results obtained for the calculations are close to the values measured in real-world conditions. This shows that the real-world system has been well reproduced in the model.
No measurements were performed for methane concentration values in real-world conditions for the system without auxiliary equipment. The comparison of the methane concentration values determined on the basis of model-based tests, for systems with and without auxiliary ventilation equipment in the measurement points (P1 and P2), is shown in Table 5.
The results obtained confirm the effectiveness of using auxiliary ventilation equipment.
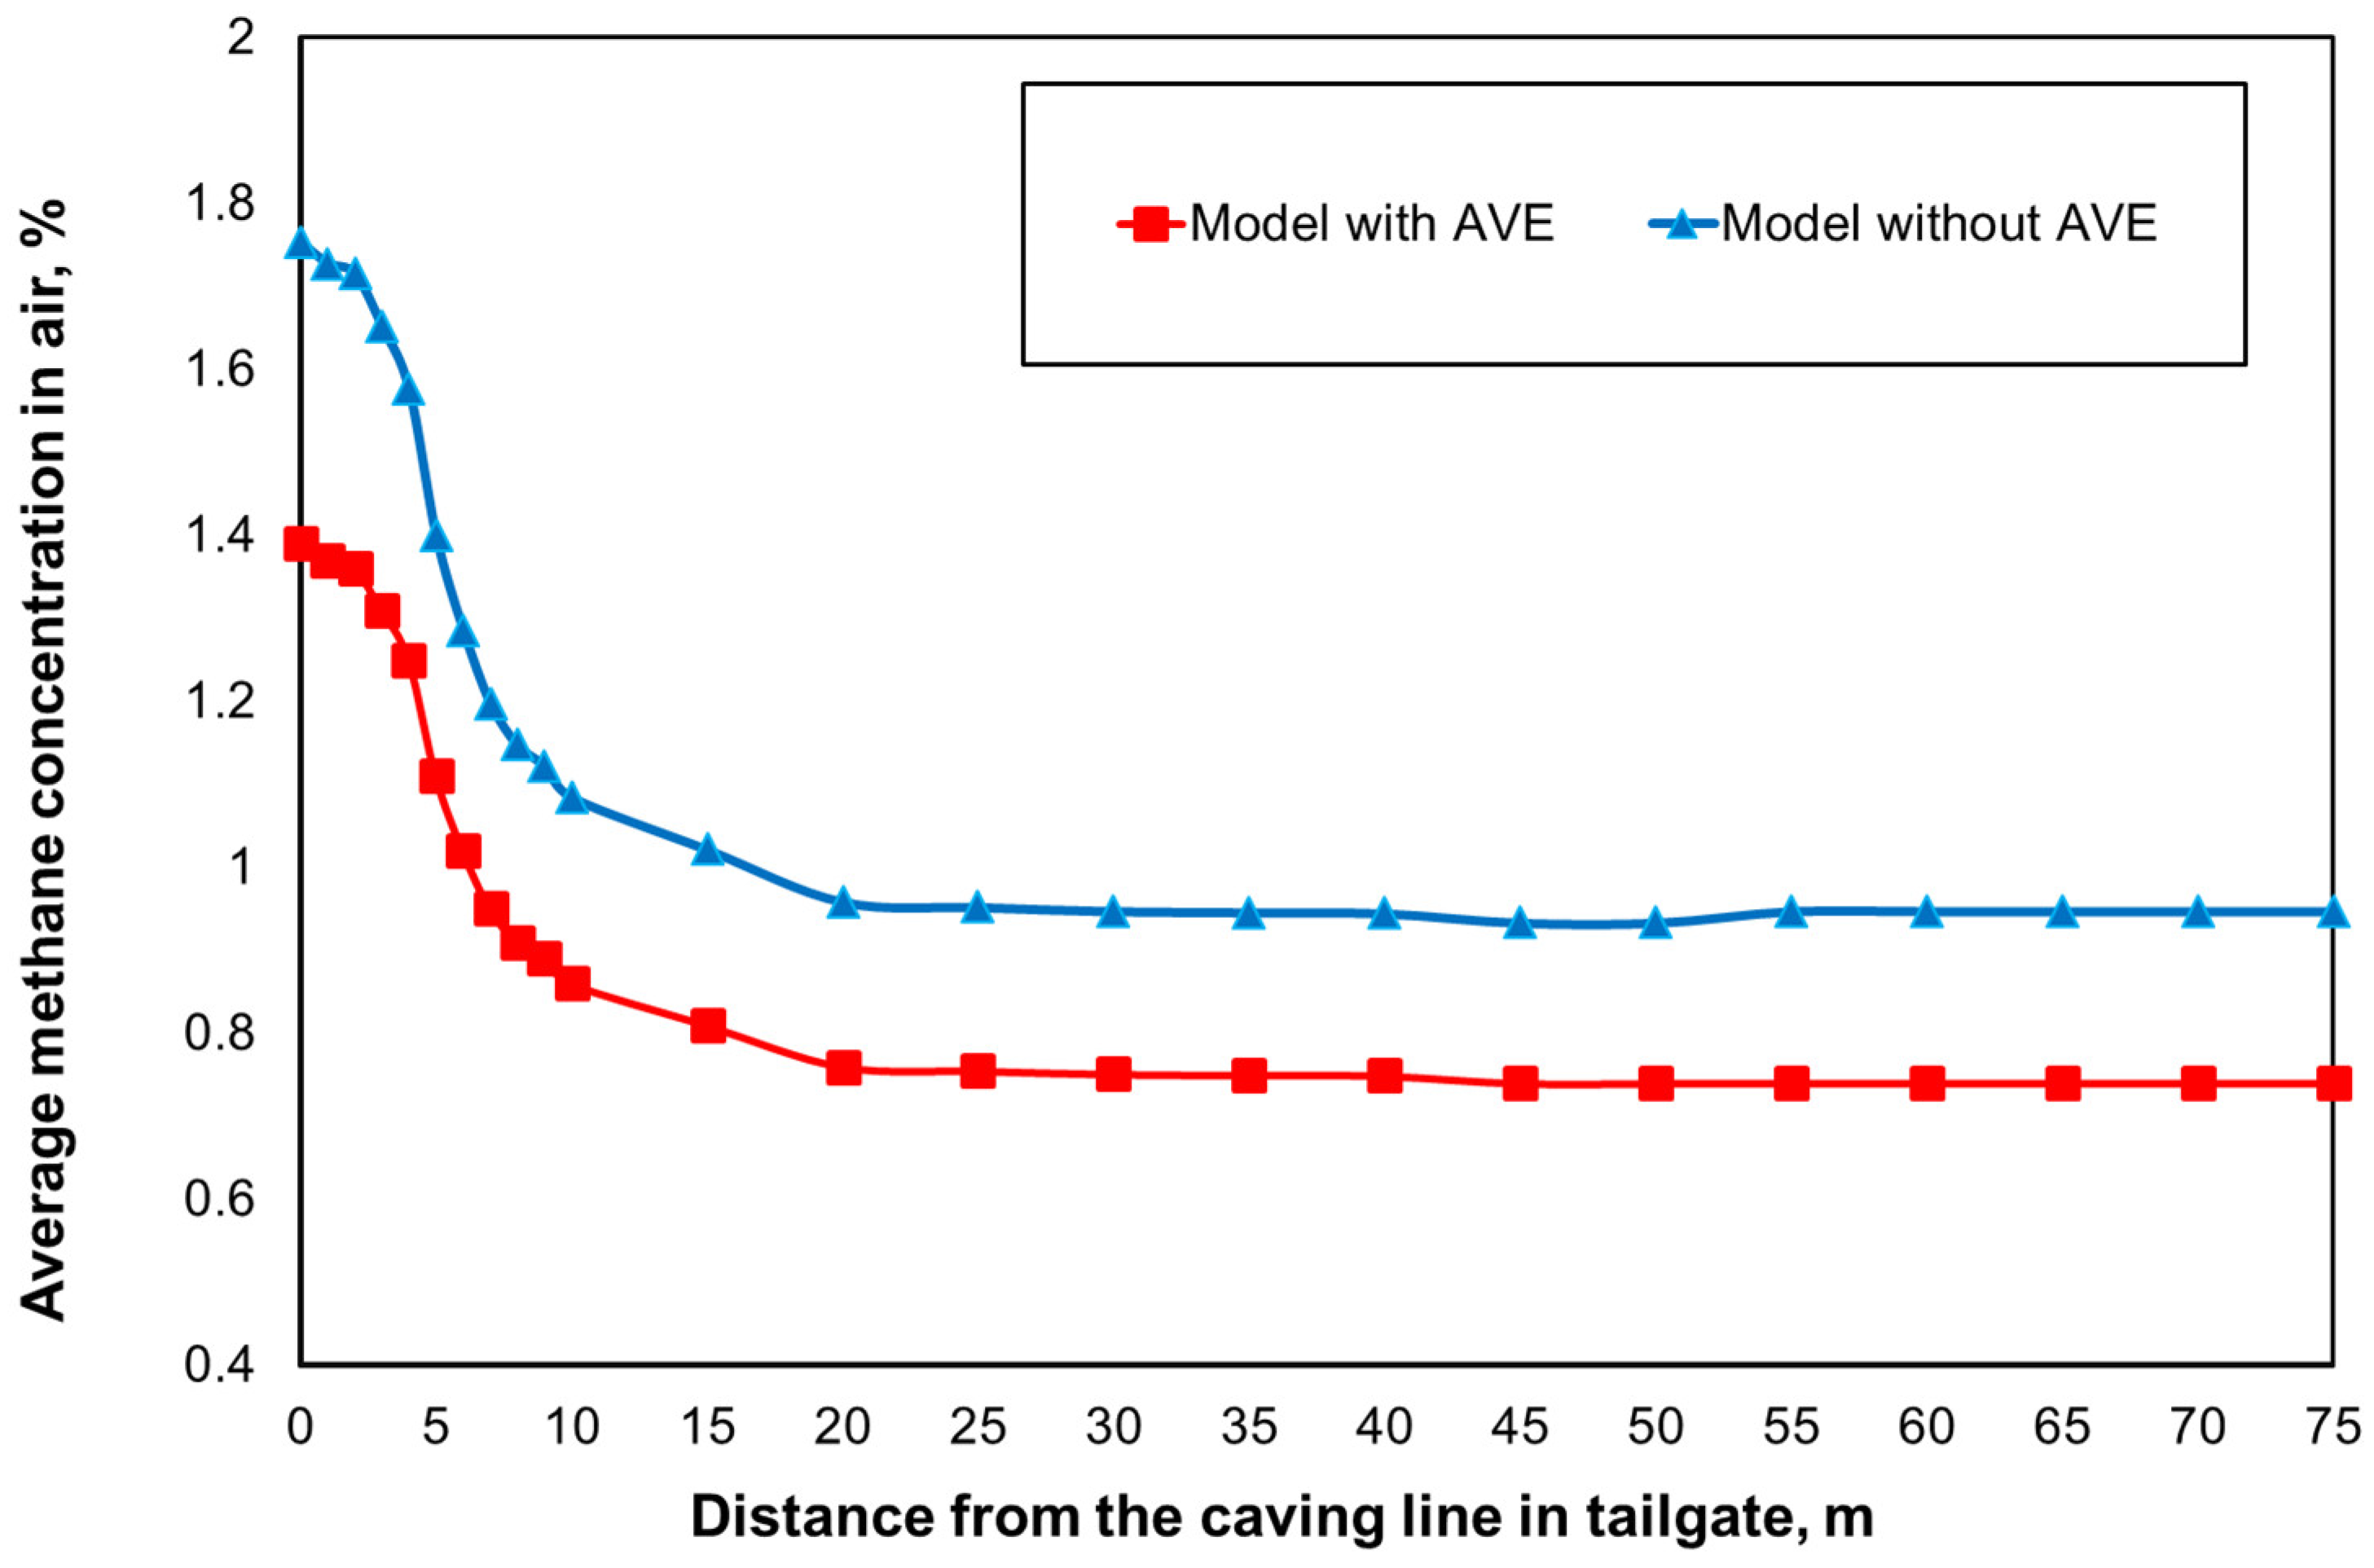
The authors of the paper also determined the average values for methane concentration levels in the cross-sections of the tailgate. It was assumed that such a presentation of results will provide a fuller explanation of the methane distributions in this tailgate and the impact of auxiliary ventilation equipment of these distributions. The distributions obtained for the systems with this equipment and without it for 75 m of the tailgate’s length, counting from the goaf side, are presented in Figure 16.
It should also be stressed that such measurements cannot be performed in real-world conditions.
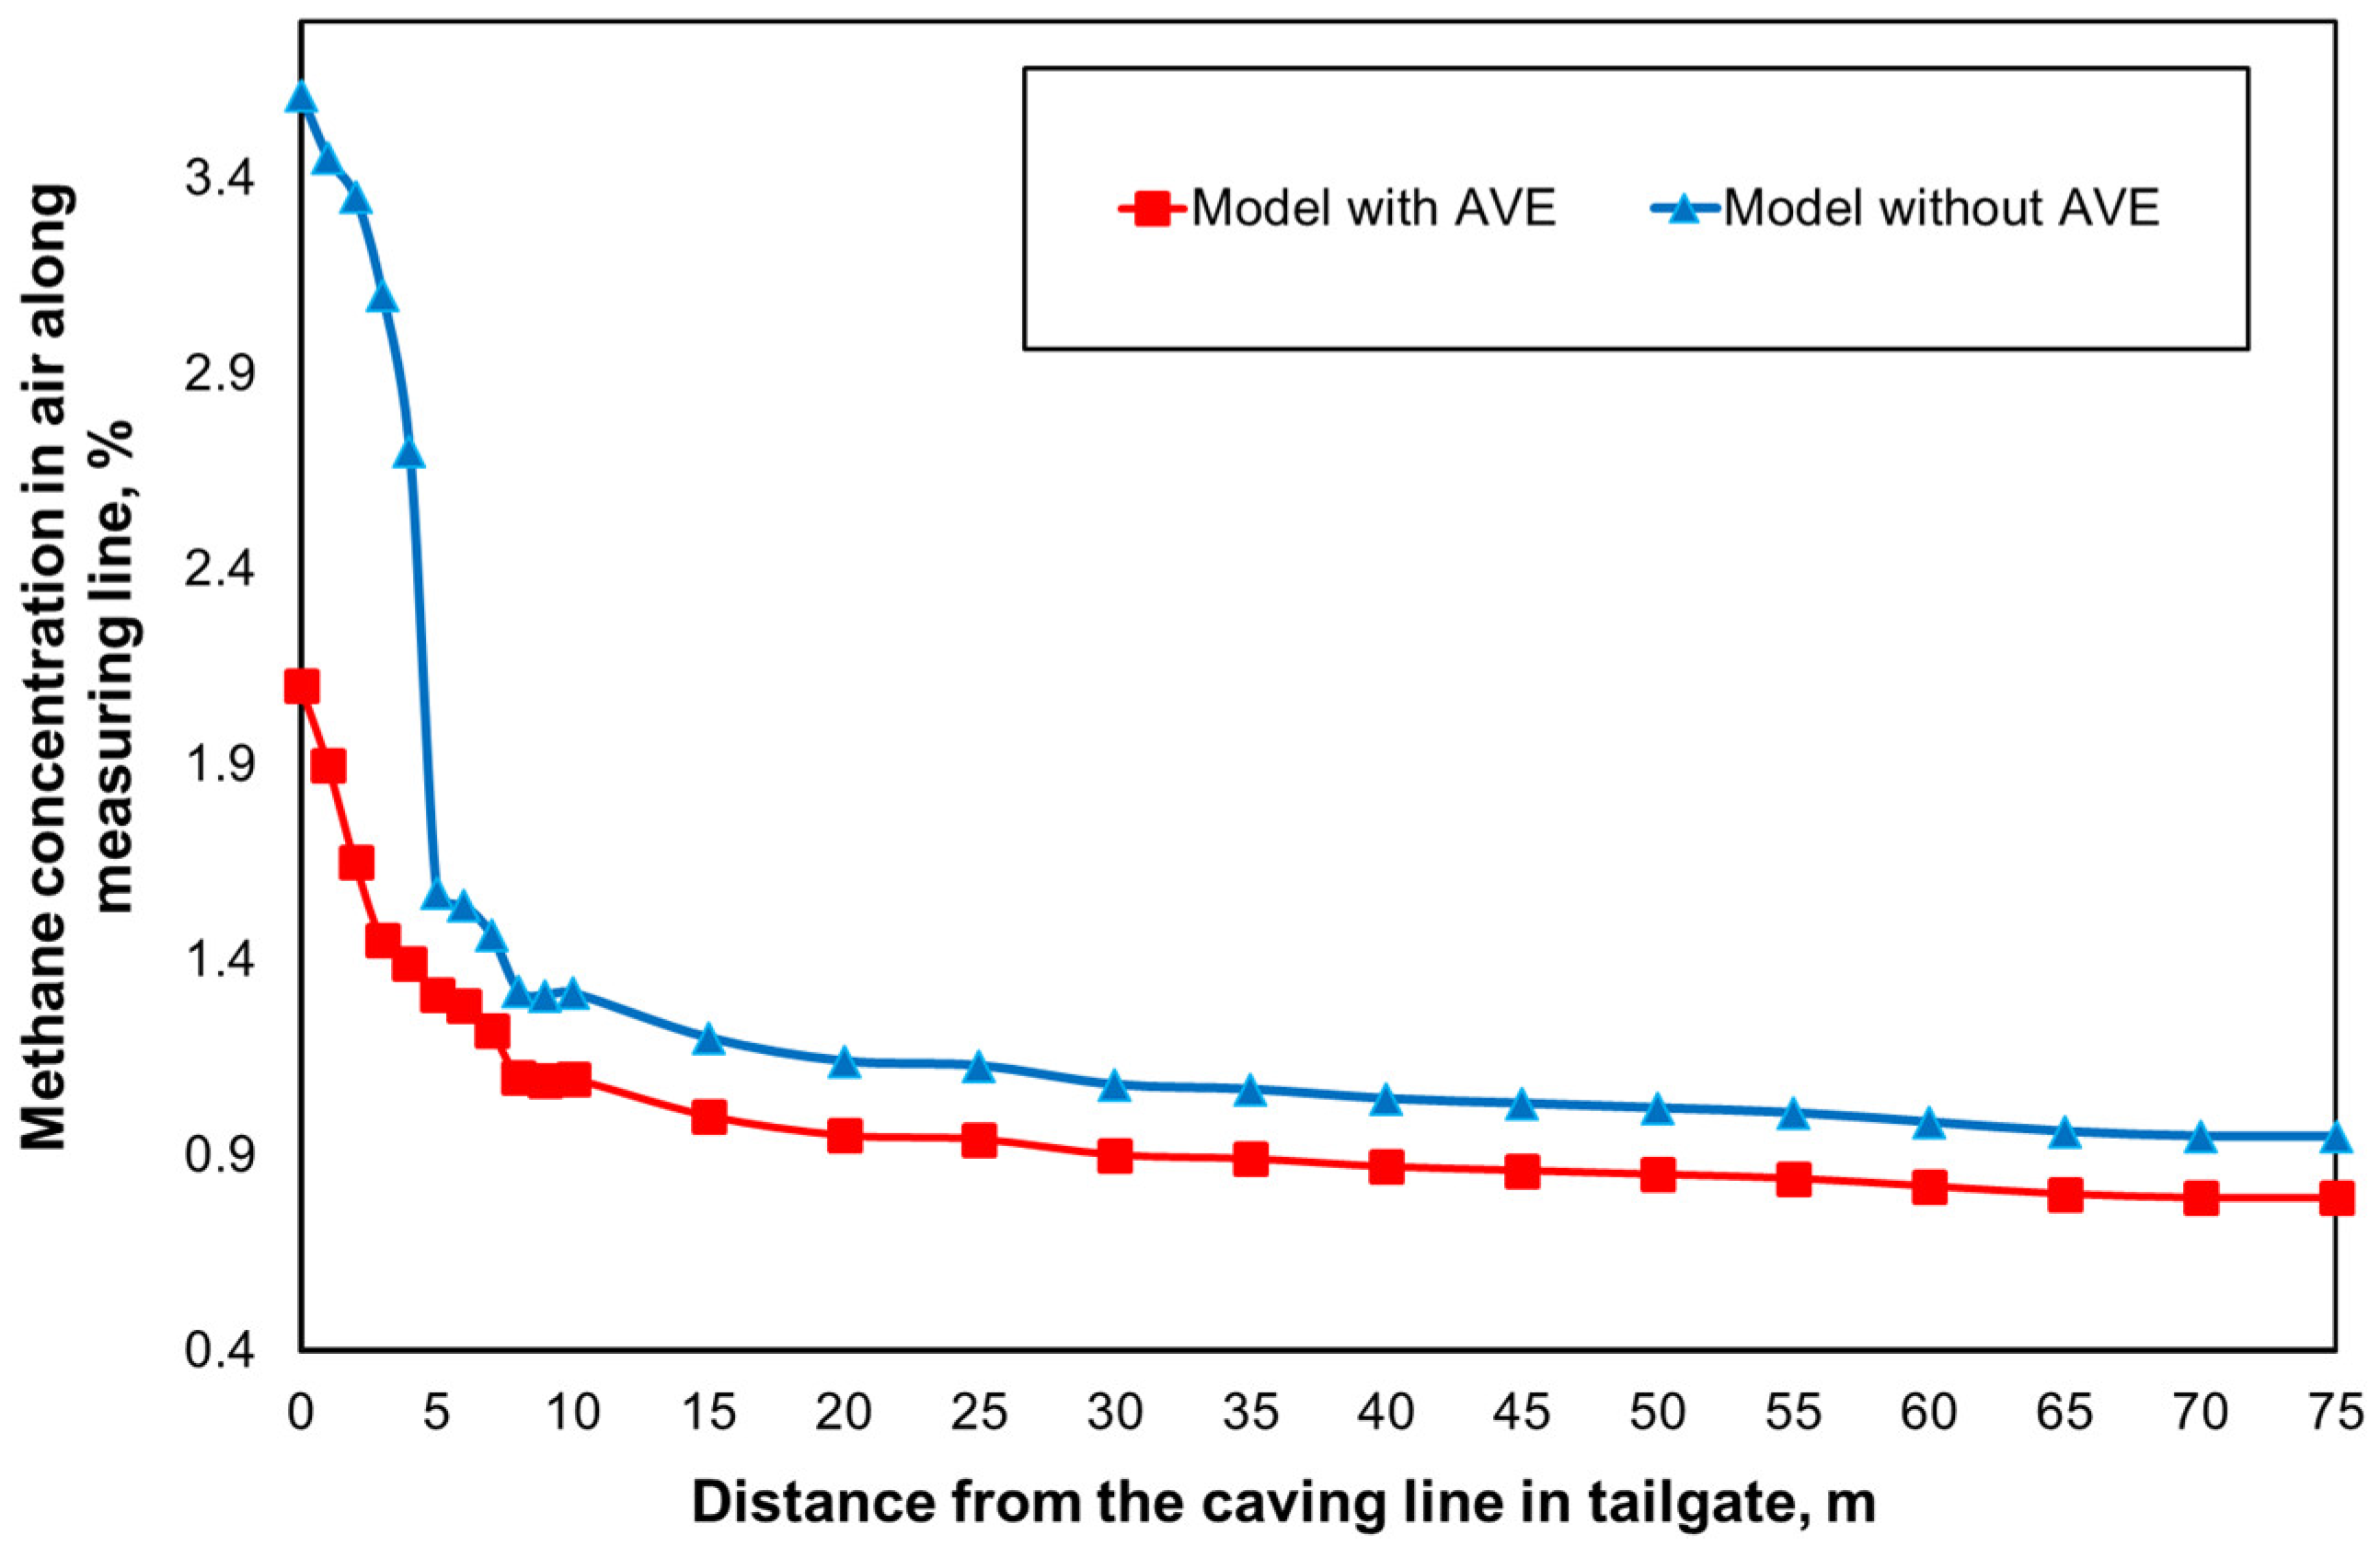
Using the measurement line assumed and marked in Figure 3 and Figure 11, the distributions of methane concentration values were determined in the points located along this line (24 points). As mentioned before, this line is located in the tailgate at the installation height of the sensor for measuring methane concentrations in the real-world heading. The values of methane concentrations in the points located on the assumed measurement line for the systems with and without auxiliary ventilation equipment are presented in Figure 17.
Analysing the distributions obtained (Figure 16 and Figure 17), one may conclude that the application of auxiliary ventilation equipment has a significant impact on the reduction of methane concentration levels in the tailgate.
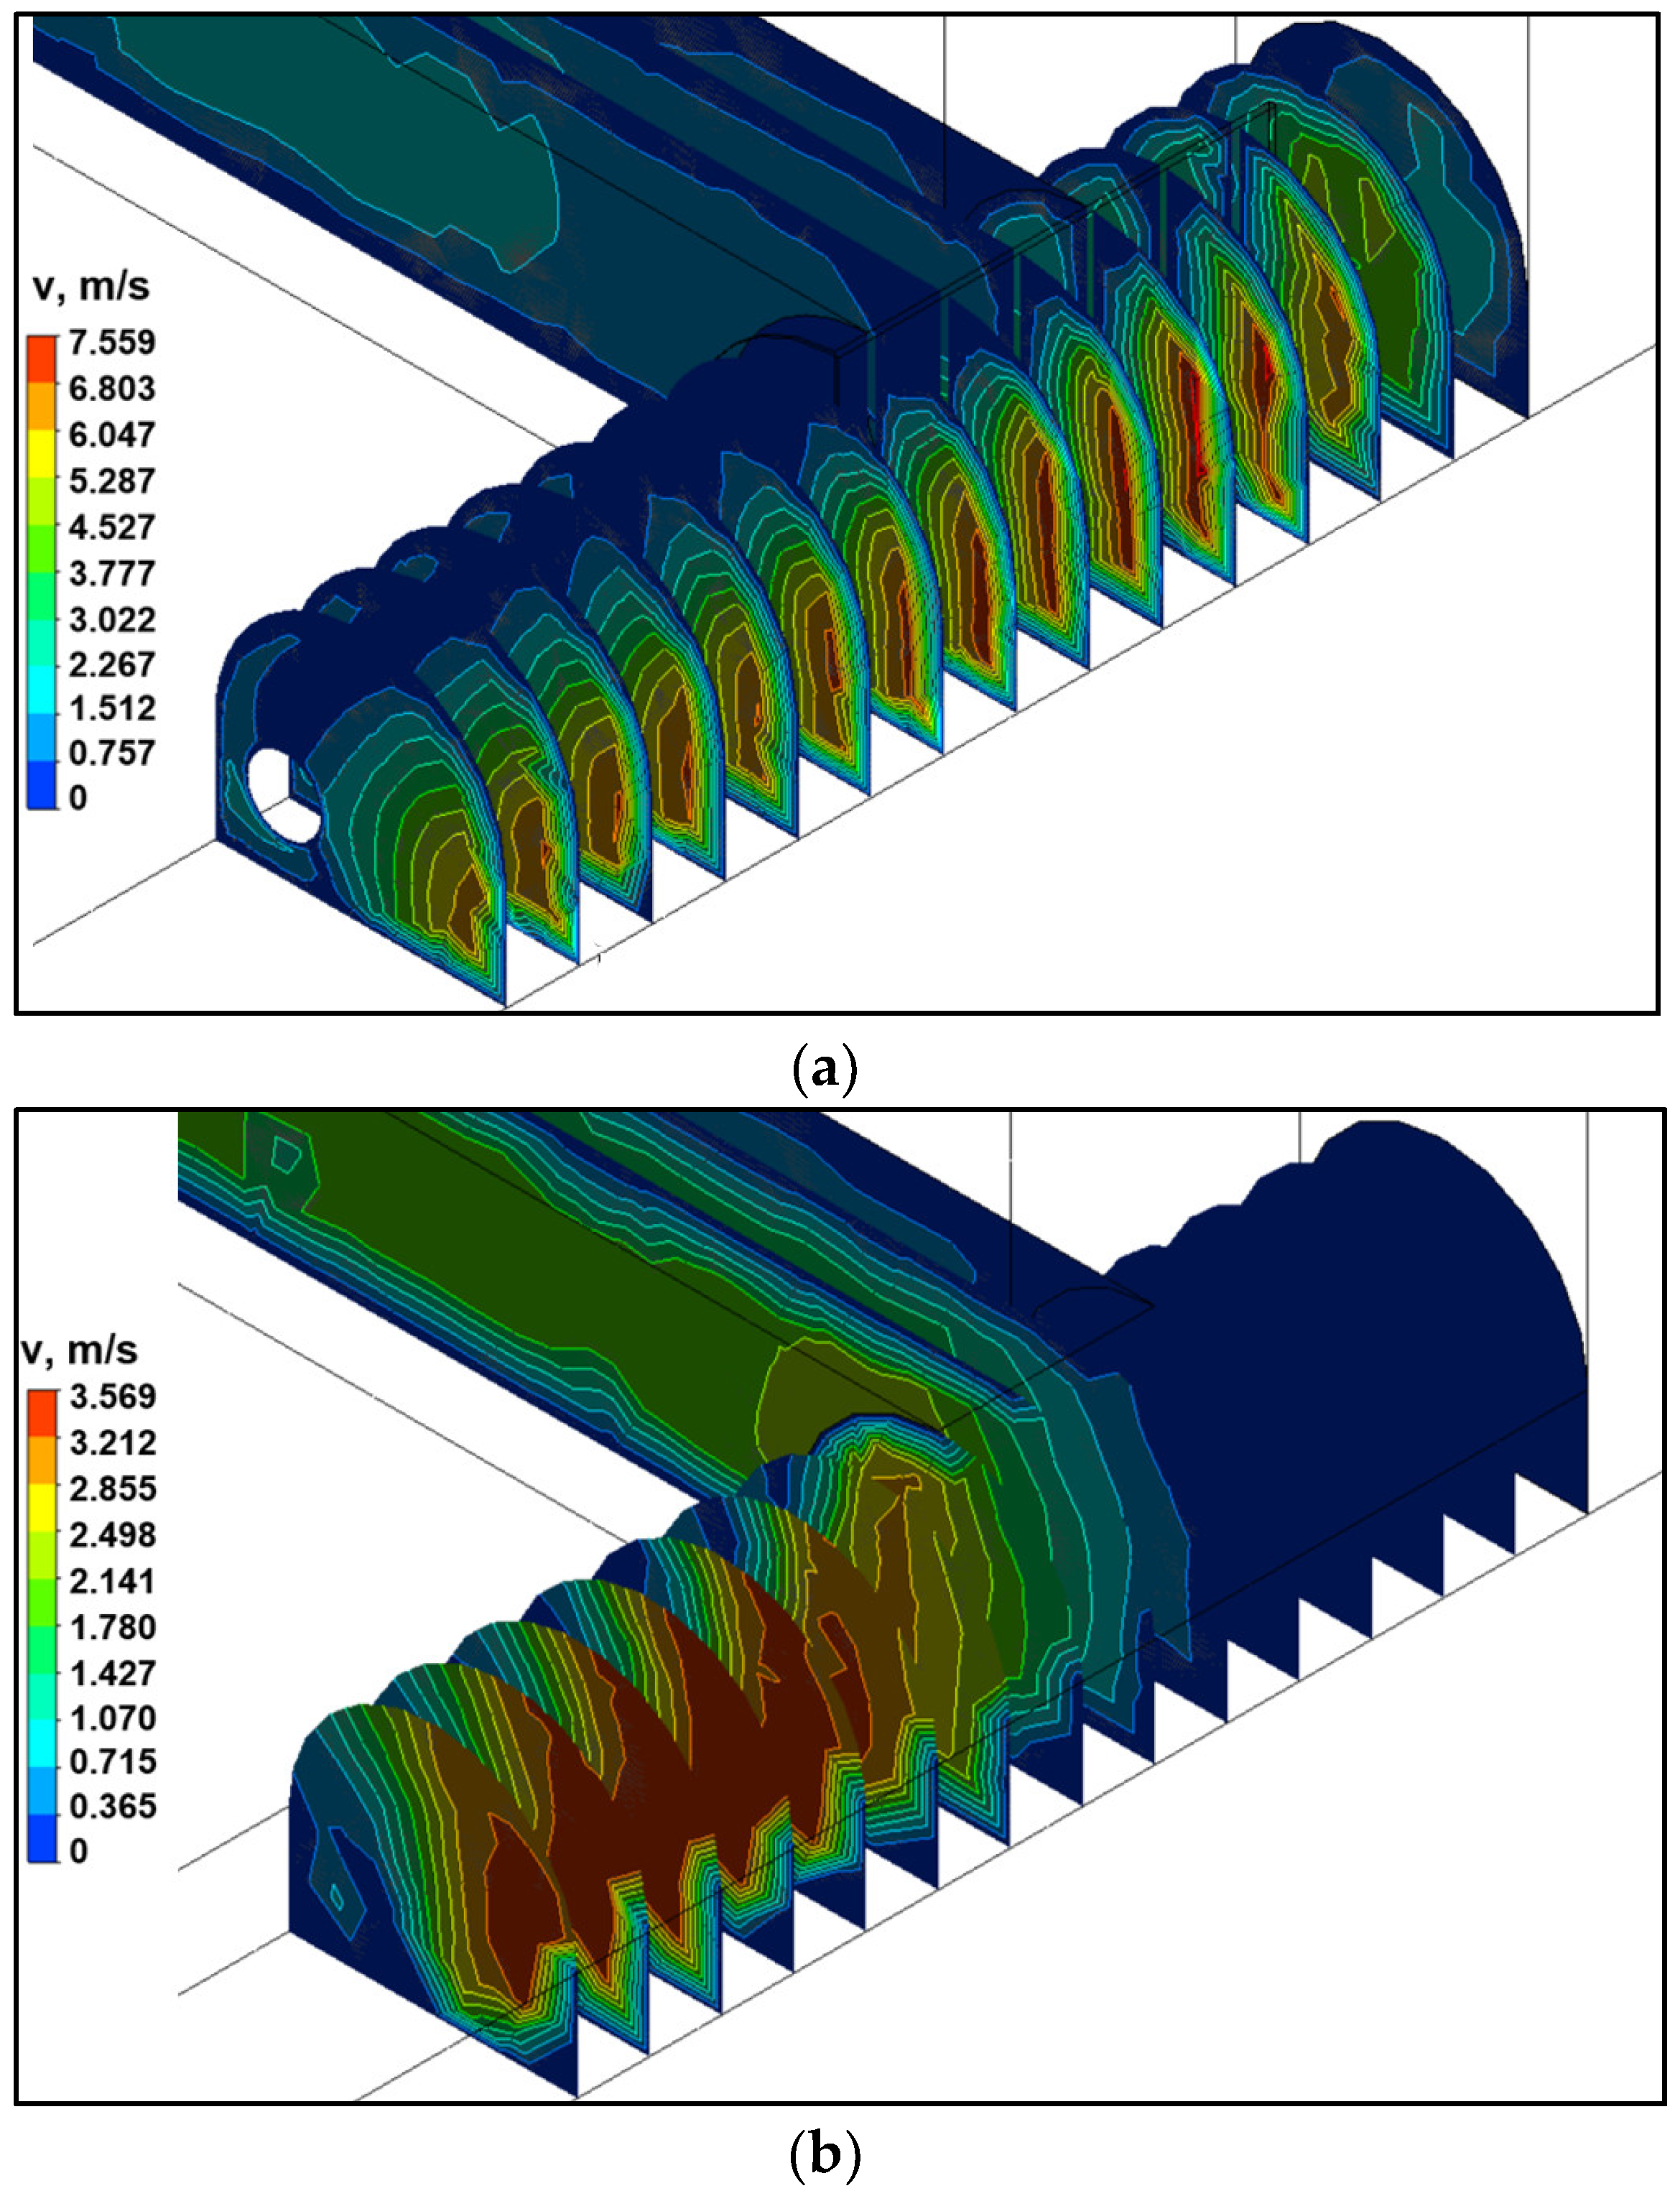
In order to illustrate the impact of auxiliary ventilation equipment on the velocities of the air flowing through the tailgate, the distributions of these velocities are presented in Figure 18. These distributions are presented on the planes located every 1.0 m from the caving line in the tailgate.
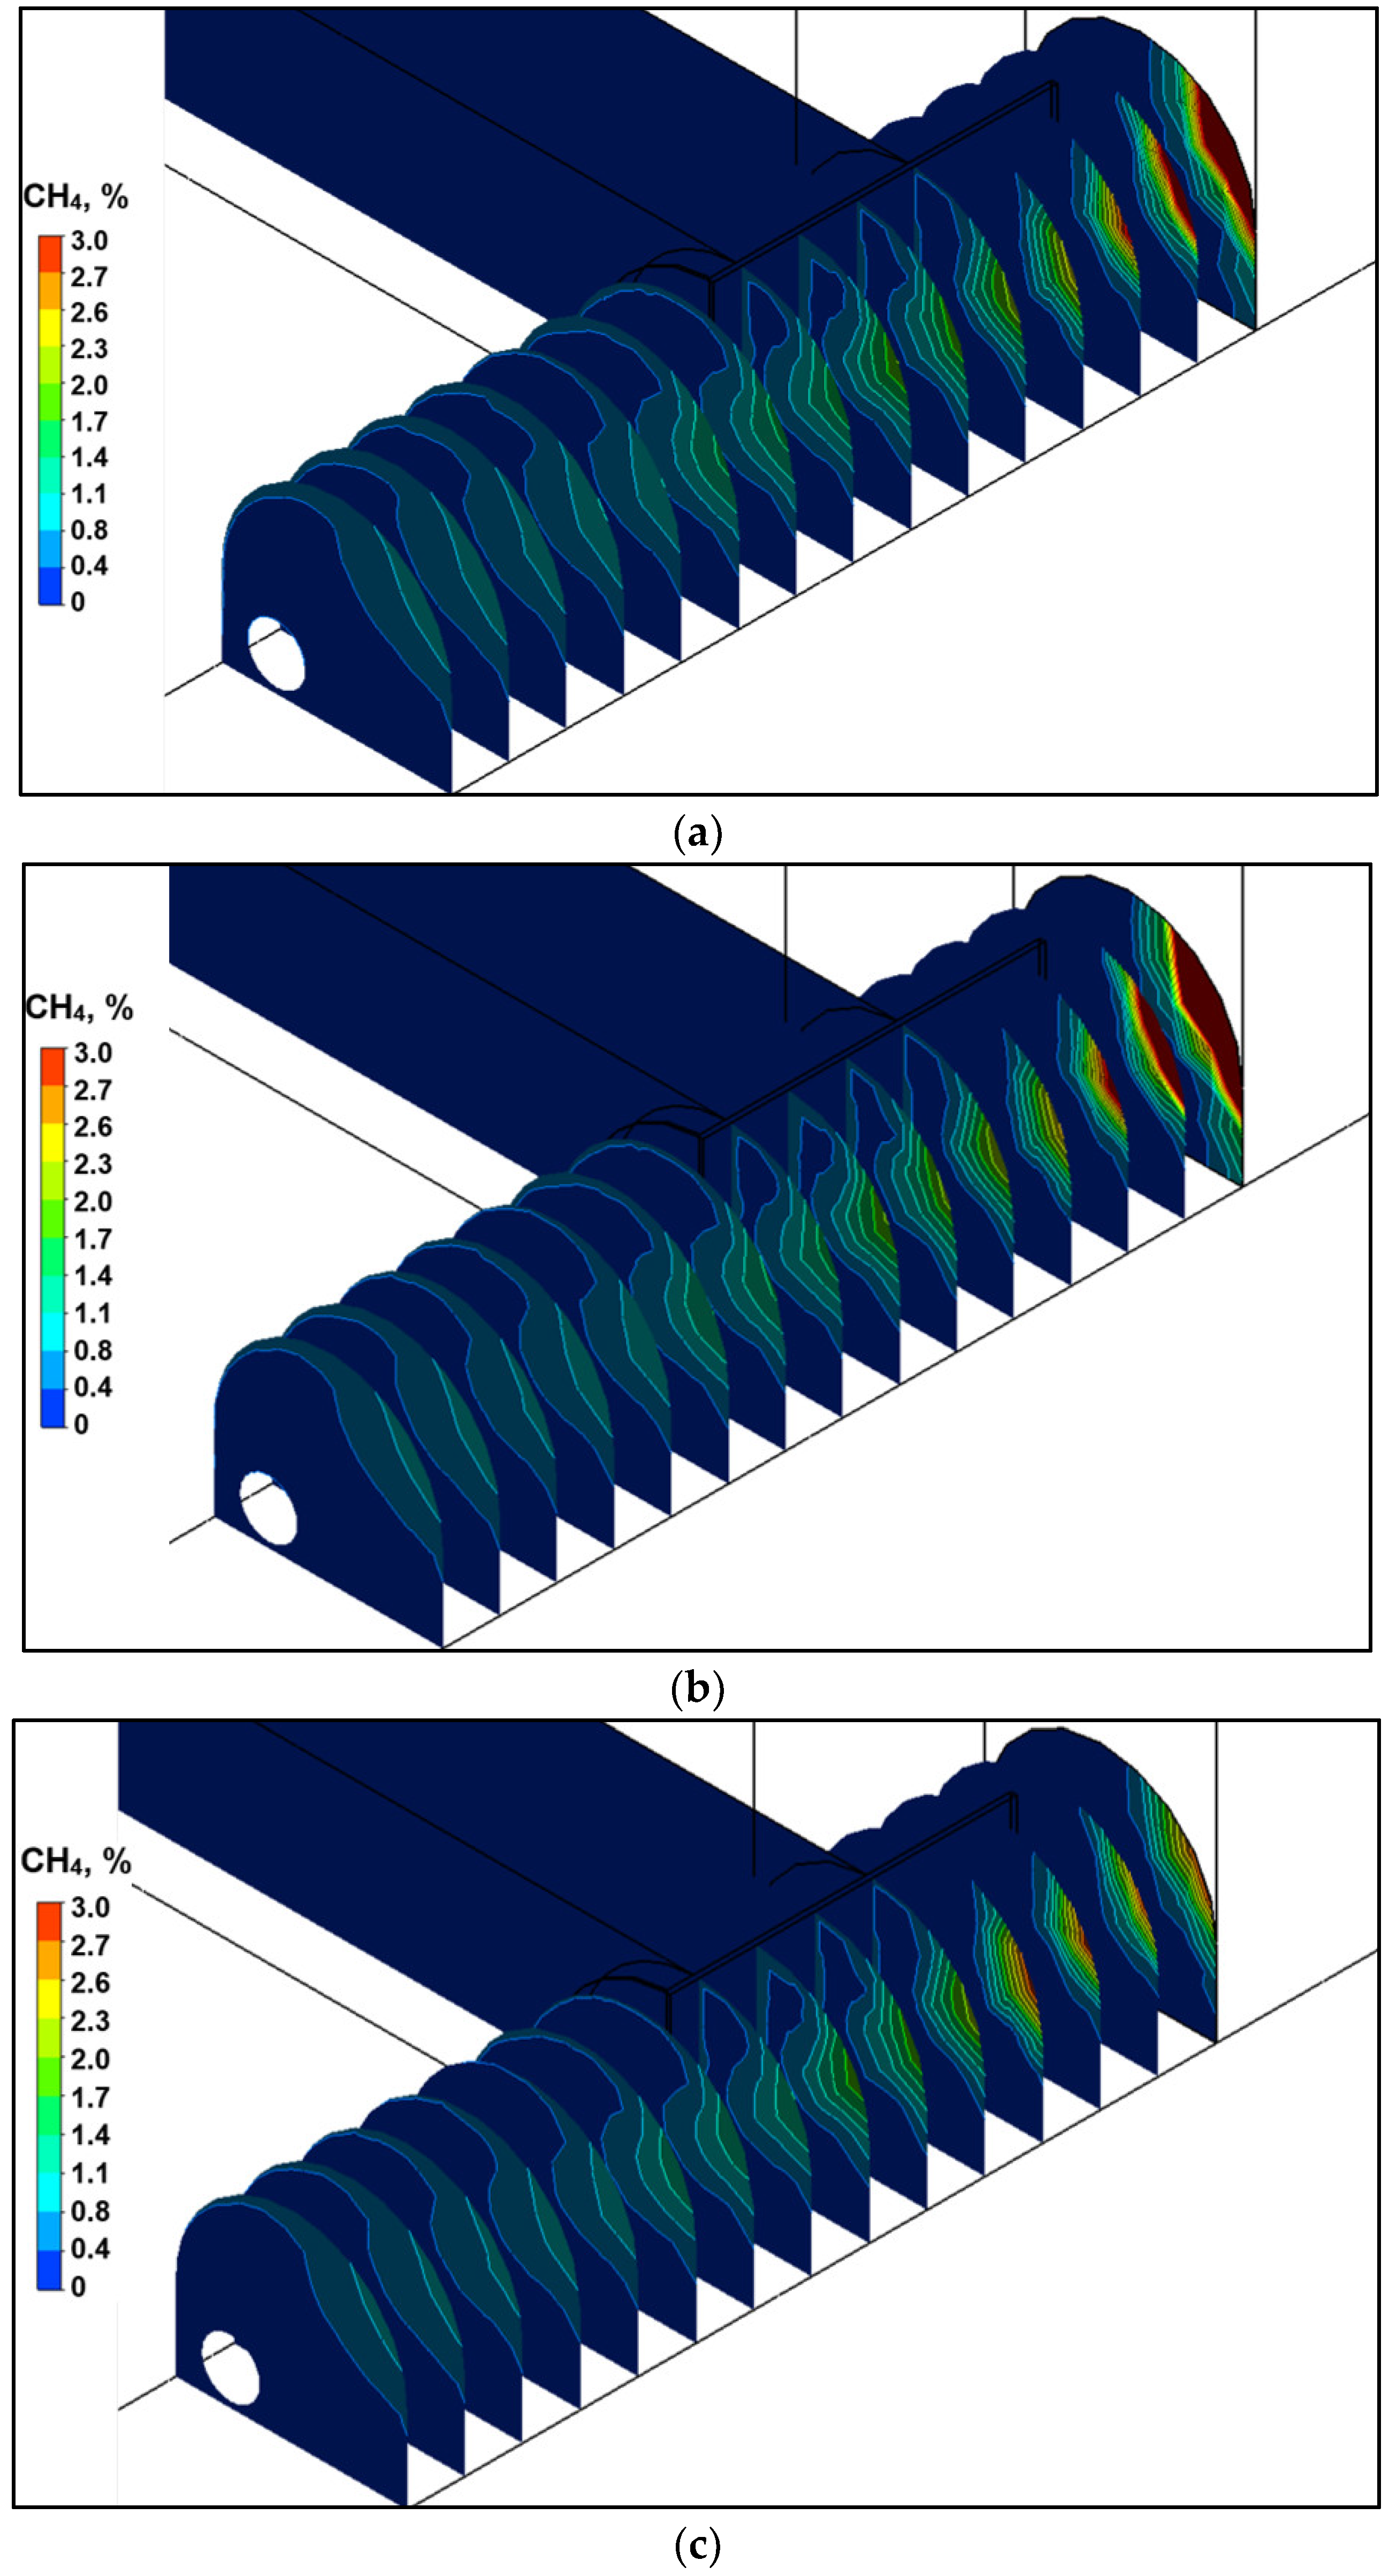
For a more complete analysis of the phenomenon at hand, the authors also determined the impact of the volume output of the additional air stream supplied along the auxiliary air duct on the distribution of methane concentration in the tailgate. Moreover, the calculations were carried out for three additional values of air volume output, amounting to 165.0 m3/min, 188.0 m3/min and 212.0 m3/min. The distributions of methane concentrations obtained for these cases are presented in Figure 19.
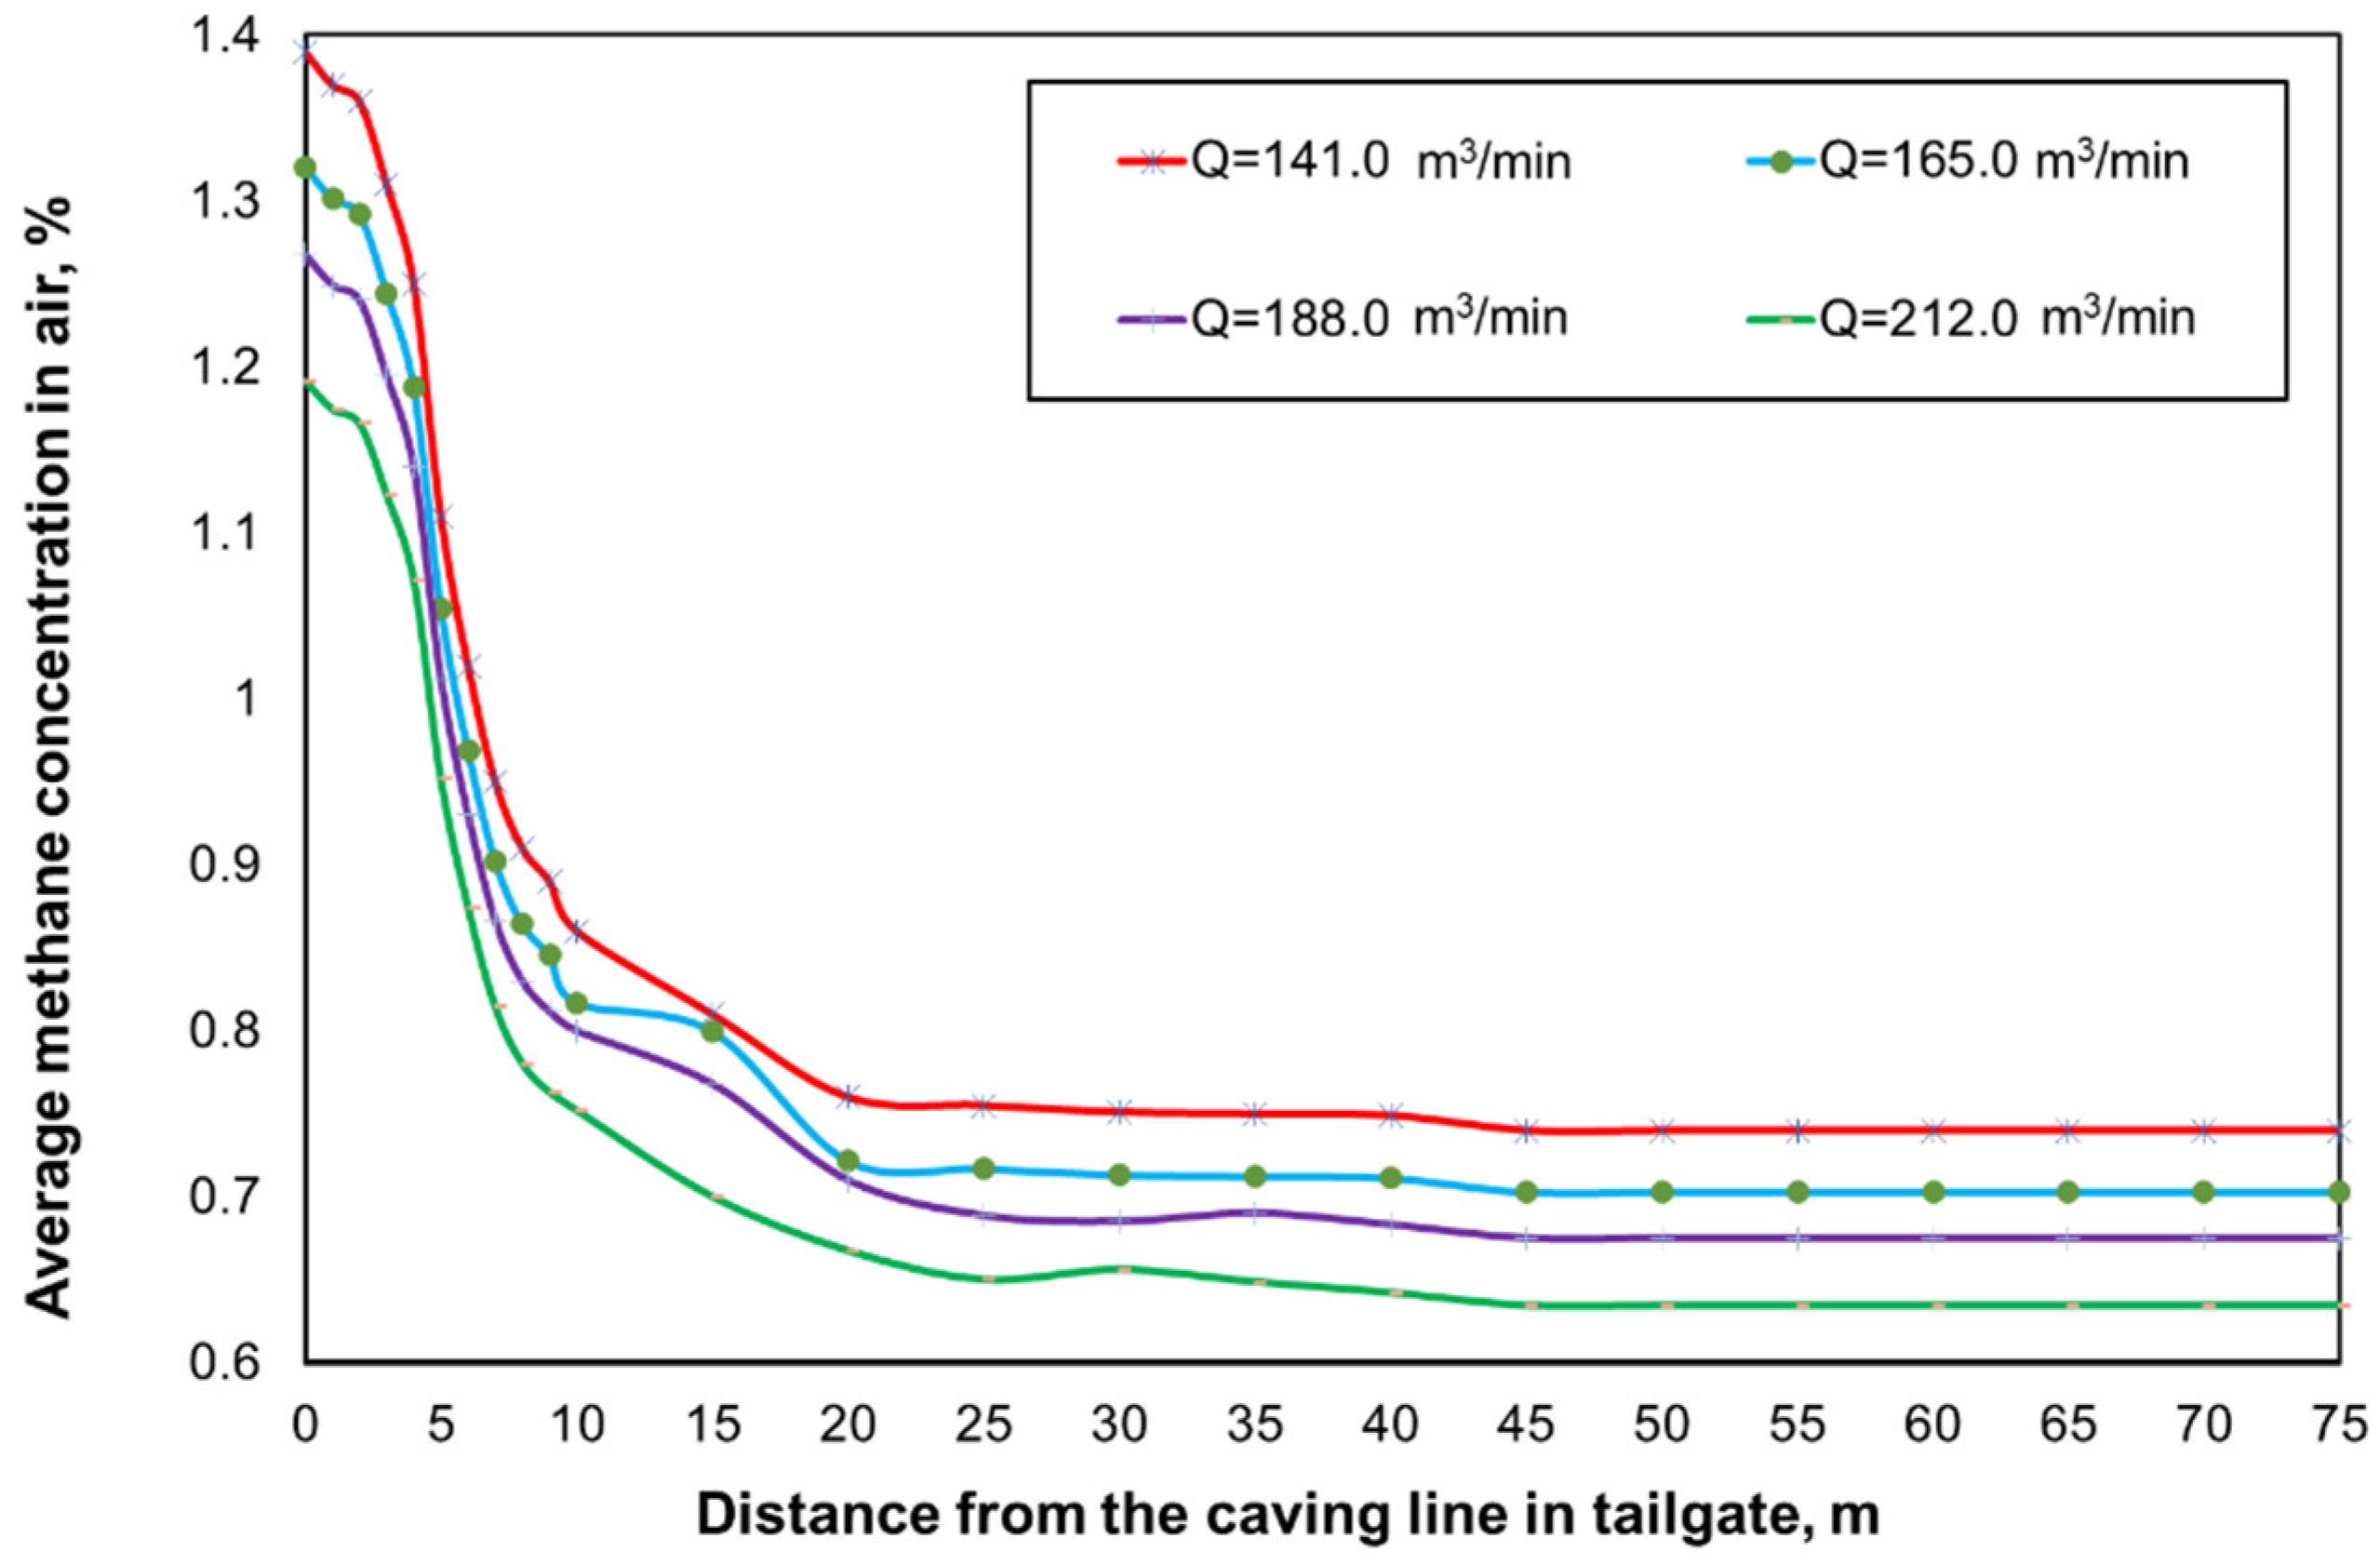
The average methane concentration values in the cross-sections of the tailgate for the analysed volume outputs of the air stream supplied along the auxiliary air duct are presented in Figure 20. 
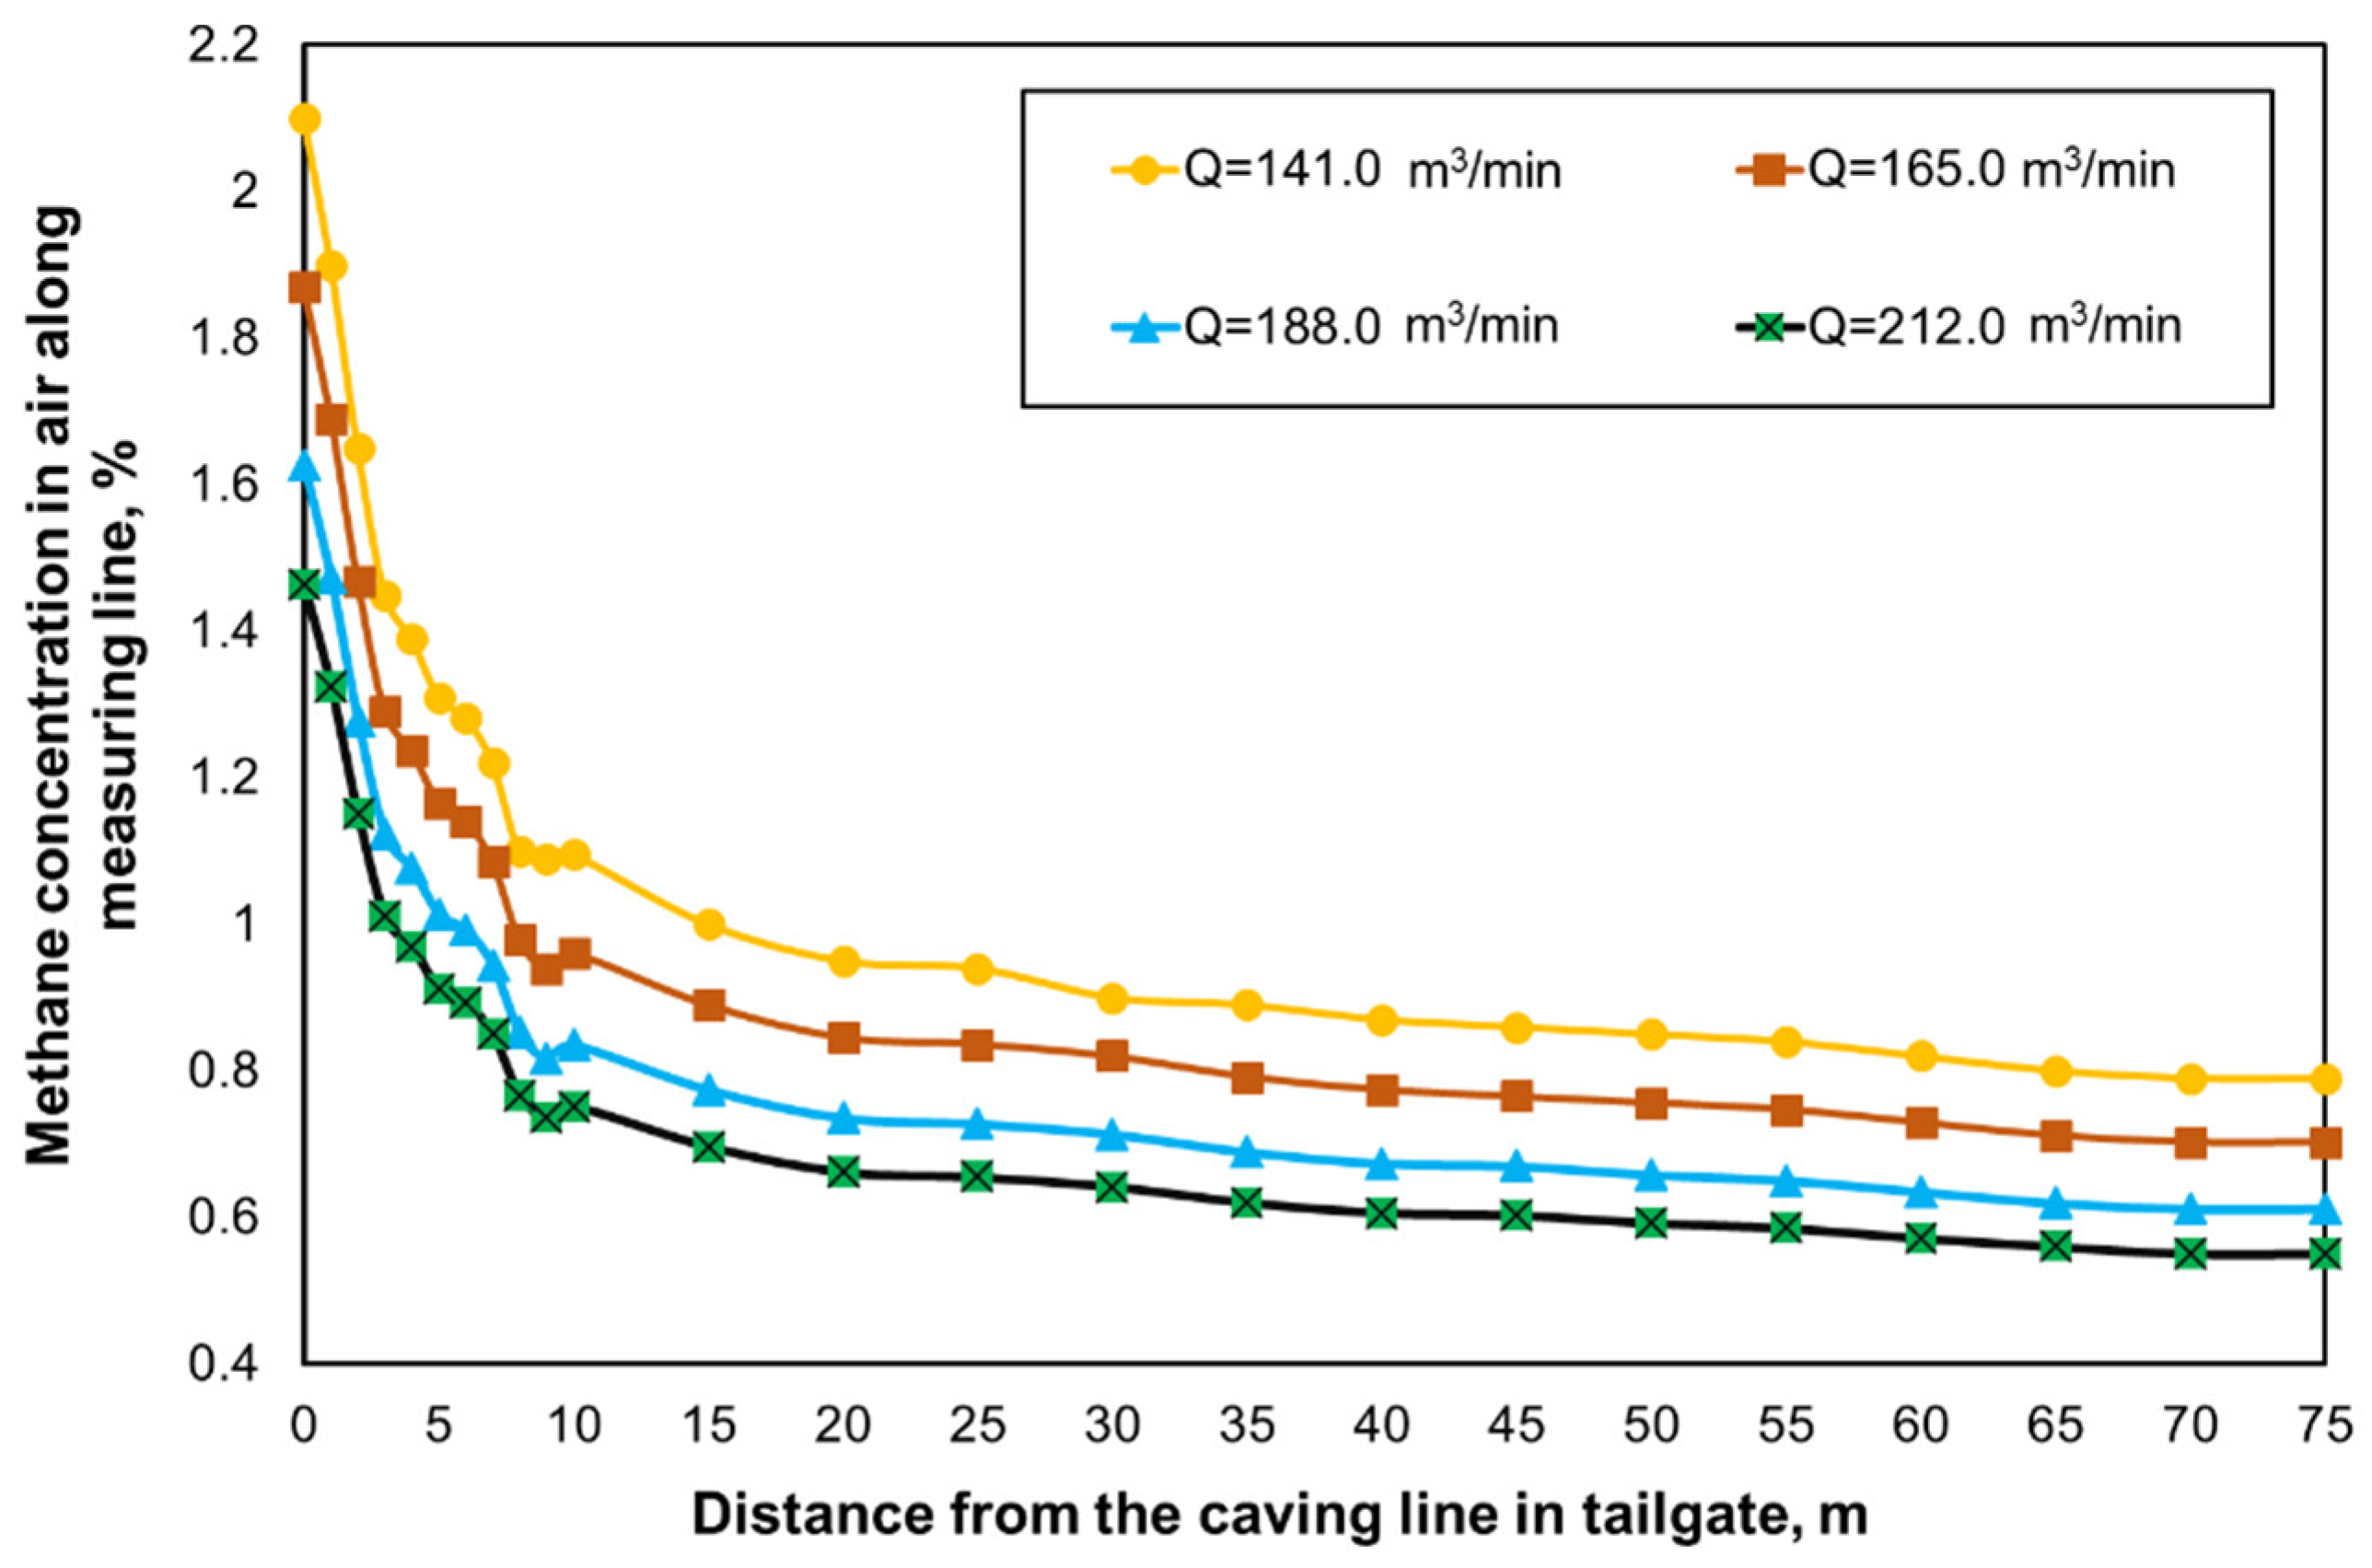
Figure 21, on the other hand, demonstrates the changes in methane concentration values along the measurement line (marked in Figure 3) for the analysed capacities of the auxiliary air stream.
The distributions determined indicate that, with a constant inflow of methane into the tailgate, increasing the air stream volume supplied along the auxiliary air duct leads to significant reduction in the concentration of this gas in the headings under analysis.

5. Conclusions

Underground mining exploitation, due to the conditions in which it is carried out, is exposed to various types of risks referred to as natural hazards in Poland. Based on many years of experience and the analysis of critical events, it can be concluded that methane represents one of the most dangerous hazards to this process and, above all, to the mining crew working in the headings. It is therefore necessary to conduct tests with a view to developing effective methods for limiting the risk of its ignition and explosion. The solution analysed in the paper is fully in line with this course of action.
The objective of the tests was to determine the impact of auxiliary ventilation equipment on the distribution and concentration of methane in the area of ongoing exploitation. The analysis was based on the tests carried out on a model representing a real-world area under mining exploitation, with account being taken of the test results in real-world conditions.
The results obtained unambiguously indicate that the application of auxiliary ventilation equipment, in the form of an air brattice (ventilation curtain) and an auxiliary air duct, significantly improves the ventilation parameters of the air stream in the area under analysis. An unquestionable advantage of the paper, which demonstrates its uniqueness, is the precise spatial representation of the real-world exploitation area as well as the consideration given to the impact of goaf with caving on the distributions determined. This made it possible to obtain reliable results that can be used in practice. A lack of reliable tests results for the impact of such equipment on the ventilation system raises serious concerns about its application.
For this reason, the present paper should provide an essential source of knowledge concerning the effects of using auxiliary ventilation equipment in areas of mining operations. The multivariate analysis concerning the selection of the velocity for the air stream supplied along the auxiliary air duct indicates a wide scope of possibilities in terms of adjusting the parameters of this equipment to real-world conditions. The drops in methane concentration levels obtained in the entire area under analysis, as well as the practical elimination of the zone of hazardous methane accumulation in the remaining section of the tailgate, bear testimony to the effectiveness of the auxiliary ventilation equipment in use.
The results obtained corroborate the advantages of this equipment and should lead to its wider application in practice, all the more so since this equipment is of simple design, easy to assemble and requires no complicated operation.
Therefore, the present paper represents an example of practical application of advanced computational tools and complex theories. Therefore, it seems reasonable to conclude that tests carried out according to the CFD methodology, besides their scientific aspect, also carry a huge application potential.
In the authors’ opinion, the methodology developed for assessing ventilation systems in mines by means of numerical modelling, with the use of real-world test results (even partial), should be more widely applied in practice. This should particularly concern the multivariate analyses of emergency situations and the forecasting of ventilation-related hazards. This is best illustrated by the methodology developed, the analyses performed and the results obtained for the case at hand.

Author Contributions

Conceptualization, J.B.; methodology, J.B. and M.T.; software, M.T.; validation, J.B. and M.T.; formal analysis, J.B. and M.T.; investigation, J.B. and M.T.; resources, J.B. and M.T.; data curation, J.B. and M.T.; writing of the original draft preparation, J.B. and M.T.; writing of review and editing, J.B. and M.T.; visualization, M.T.; supervision, J.B.; project administration, J.B.; funding acquisition, M.T.

Funding

This research was funded by MNiSW, grant number 06/030/BK_18/37.

Acknowledgments

The authors would like to thank MESco Sp. z o.o. for providing software support.

Conflicts of Interest

The authors declare no conflicts of interest.

References

  1. Brodny, J.; Tutak, M. Analysis of methane hazard conditions in mine headings. Tehnički Vjesnik/Tech. Gazette 2018, 25, 271–276. [Google Scholar] [CrossRef]
  2. Mishra, D.P.; Kumar, P.; Panigrahi, D.C. Dispersion of methane in tailgate of a retreating longwall mine: A computational fluid dynamics study. Environ. Earth Sci. 2016, 75, 475. [Google Scholar] [CrossRef]
  3. Ren, T.X.; Edwards, J.S. Three-dimensional computational fluid dynamics modelling of methane flow through permeable strata around a longwall face. Min. Technol. 2000, 109, 41–48. [Google Scholar] [CrossRef]
  4. Sasmito, A.P.; Birgersson, E.; Ly, H.C.; Mujumdar, A.S. Some approaches to improve ventilation system in underground coal mines environment—A computational fluid dynamic study. Tunn. Undergr. Space Technol. 2013, 34, 82–95. [Google Scholar] [CrossRef]
  5. Tutak, M.; Brodny, J. Analysis of Influence of Goaf Sealing from Tailgate on the Methane Concentration at the Outlet from the Longwall. IOP Conf. Ser. Earth Environ. Sci. 2017, 95, 042025. [Google Scholar] [CrossRef]
  6. Wu, L.R.; Jiang, Z.G.; Cheng, W.M.; Zuo, X.W.; Lv, D.W.; Yao, Y.J. Major accident analysis and prevention of coal mines in China from the year of 1949 to 2009. Min. Sci. Technol. 2011, 21, 693–699. [Google Scholar] [CrossRef]
  7. Mining Technology, the World’s Worst Coal Mining Disasters. Available online: https://www.mining-technology.com/features/feature-world-worst-coal-mining-disasters-china/ (accessed on 29 September 2018).
  8. Wyższy Urząd Górniczy. Available online: www.wug.pl (accessed on 29 September 2018).
  9. Mattus, R.; Kallstrand, A. Fossil energy and ventilation air methane. In Methane and Climate Change; Smith, P., Reay, D., Amstel, A.V., Eds.; Earthscan Ltd., Dunstan House: London, UK, 2010; pp. 201–210. [Google Scholar]
  10. Mishra, D.P.; Panigrahi, D.C.; Kumar, P. Computational investigation on effects of geo-mining parameters on layering and dispersion of methane in underground coal mines—A case study of Moonidih Colliery. J. Nat. Gas Sci. Eng. 2018, 53, 110–124. [Google Scholar] [CrossRef]
  11. Misra, G.B. Mine Environment and Ventilation; Oxford University Press: New Delhi, India, 2010. [Google Scholar]
  12. Misra, G.B. Mine Environment and Ventilation, 1st ed.; Oxford University Press: New Delhi, India, 1986. [Google Scholar]
  13. McPherson, M.J. Subsurface Ventilation and Environmental Engineering; Chapman & Hall: New York, NY, USA, 1993. [Google Scholar]
  14. Bakke, P.; Leach, S.J. Principles of formation and dispersion of methane roof layers and some remedial measures. Min. Eng. 1962, 121, 645–669. [Google Scholar]
  15. Ordinance of the Minister of Energy of 9 June 2016 on the Detailed Requirements for Operating the Underground Mines (Dz.U. 2017 poz. 1118). Legal Act, Warszawa; 9 June 2016. Available online: http://prawo.sejm.gov.pl/isap.nsf/DocDetails.xsp?id=WDU20170001118 (accessed on 29 September 2018).
  16. Dylong, A. Monitoring and prediction of methane emission in the longwall and possibilities to control the longwall system. Min. Inform. Autom. Electr. Eng. 2016, 54, 5–14. [Google Scholar]
  17. Szlązak, N.; Borowski, M.; Obracaj, D.; Swolkień, J. Estimation of methane hazard in longwall with U ventilation system U. Górnictwo i Geologia 2013, 8, 115–128. [Google Scholar]
  18. Łukowicz, K.; Krause, E. Zagrożenie metanowe—Metody oceny stanu zagrozenia i metody profilaktyki. In Warunki Bezpiecznej Eksploatacji Pokładów Węgla Zagrozonych Metanem, Tąpaniami i Pozarami Endogeniczymi; Konpoko, W., Ed.; GIG: Katowice, Poland, 2010. [Google Scholar]
  19. Krause, E.; Łukowicz, K. Dynamic Prediction of Absolute Methane Emissions on Longwalls; Technical Guide; GIG: Katowice, Poland, 2000. [Google Scholar]
  20. Branny, M. Computer simulation of flow of air and methane mixture in the longwall-return crossing zone. Arch. Min. Sci. 2006, 51, 133–145. [Google Scholar]
  21. Felka, D.; Brodny, J. Application of Neural-Fuzzy System in Prediction of Methane Hazard. In Proceedings of the International Conference on Intelligent Systems in Production Engineering and Maintenance, Wroclaw, Poland, 28–29 September 2017; Springer: Berlin/Heidelberg, Germany, 2017; pp. 151–160. [Google Scholar]
  22. Karacan, C.Ö.; Ruiz, F.A.; Cotè, M.; Phipps, S. Coal mine methane: A review of capture and utilization practices with benefits to mining safety and to greenhouse gas reduction. Int. J. Coal Geol. 2011, 86, 121–156. [Google Scholar] [CrossRef]
  23. Kurnia, J.C.; Sasmito, A.P.; Mujumdar, A.S. CFD simulation of methane dispersion and innovative methane management in underground mining faces. Appl. Math. Model. 2014, 38, 3467–3484. [Google Scholar] [CrossRef]
  24. Krause, E.; Smoliński, A. Analysis and Assessment of Parameters Shaping Methane Hazard in Longwall Areas. J. Sustain. Min. 2013, 12, 13–19. [Google Scholar] [CrossRef]
  25. Krause, E.; Wierzbiński, K. Wpływ przekrojów wyrobisk oraz uwarunkowań wentylacyjno-metanowych w środowisku ścian na kształtowanie się zagrożenia metanowego. Przegląd Górniczy 2009, 65, 52–60. [Google Scholar]
  26. Krog, R.B.; Schatzel, S.J.; Garcia, F.; Marshall, J.K. Predicting methane emissions from wider longwall panels by analysis of emission contributors. In Proceedings of the 11th U.S./North American Mine Ventilation Symposium, Pennsylvania, PA, USA, 5–7 June 2006. [Google Scholar]
  27. Kumar, P.; Mishra, D.P.; Panigrahi, D.C.; Sahu, P. Numerical studies of ventilation effect on methane layering behaviour in nderground coal mines. Curr. Sci. 2017, 112, 1873–1881. [Google Scholar] [CrossRef]
  28. Ren, T.; Edwards, J.S.; Jozefowicz, R.R. CFD modelling of methane flow around longwall coal faces. In Proceedings of the 6th International Mine Ventilation Congress, Pittsburgh, PA, USA, 17–22 May 1997. [Google Scholar]
  29. Toraño, J.; Torno, S.; Menendez, M.; Gent, M.; Velasco, J. Models of methane behaviour in auxiliary ventilation of underground coal mining. Int. J. Coal Geol. 2009, 80, 35–43. [Google Scholar] [CrossRef]
  30. Wang, Z.; Ren, T.; Cheng, Y. Numerical investigations of methane flow characteristics on a longwall face Part I: Methane emission and base model results. J. Nat. Gas Sci. Eng. 2017, 43, 242–253. [Google Scholar] [CrossRef]
  31. Wang, Z.; Ren, T.; Cheng, Y. Numerical investigations of methane flow characteristics on a longwall face Part II: Parametric studies. J. Nat. Gas Sci. Eng. 2017, 43, 254–267. [Google Scholar] [CrossRef]
  32. Zheng, Y.; Tien, J.C. Simulation of longwall face methane distribution. In Proceedings of the SME Annual Meeting, Colorado, FL, USA, 22–25 February 2009. [Google Scholar]
  33. Wala, A.M.; Vytla, S.; Taylor, C.D.; Huang, G. Mine face ventilation: A comparison of CFD results against benchmark experiments for the CFD code validation. Min. Eng. 2007, 59, 49–57. [Google Scholar]
  34. Wala, M.A.; Jacob, J.; Turner, D. Experimental study of mine face ventilation system for validation of numerical models. In Mine Ventilation, Proceedings of the North American/Ninth US Mine Ventilation Symposium, Kingston, Ontario, Canada, 8–12 June 2002; De Souza, E., Ed.; Swets & Zeitlinger: Lisse, The Netherlands, 2002; pp. 191–196. [Google Scholar]
  35. Wala, M.A.; Stoltz, J.; Jacob, J. Numerical and experimental study of a mine face ventilation system for CFD code validation. In Proceedings of the Seventh International Mine Ventilation Congress, Cracow, Poland, 17–22 June 2001; Wasilewski, S., Ed.; pp. 411–417. [Google Scholar]
  36. Geng, F.; Luo, G.; Wang, Y.; Peng, Z.; Hu, S.; Zhang, T.; Chai, H. Dust dispersion in a coal roadway driven by a hybrid ventilation system: A numerical study. Process Saf. Environ. Prot. 2018, 113, 388–400. [Google Scholar] [CrossRef]
  37. Cheng, J.; Li, S.; Zhang, F.; Zhao, C.; Yang, S.; Ghosh, A. CFD modelling of ventilation optimization for improving mine safety in longwall working faces. J. Loss Prev. Process Ind. 2016, 40, 285–297. [Google Scholar] [CrossRef] [Green Version]
  38. Oberholzer, D.R.J.W.; Meyer, C.F. The evaluation of heading ventilation systems through the use of computer simulations. In Proceedings of the 7th US Mine Ventilation Symposium, Lexington, KY, USA, 5–7 June 1995. [Google Scholar]
  39. Moloney, K.W. An Analysis of Airflow Patterns in Auxiliary Ventilated Drivages. Ph.D. Thesis, University of Nottingham, Nottingham, UK, 1997. [Google Scholar]
  40. Moloney, K.W.; Lowndes, I.S.; Hargrave, G.K. Analysis of flow patterns in drivages with auxiliary ventilation. Trans. Inst. Min. Metall. Sect. A Min. Ind. 1999, 108, A17–A26. [Google Scholar]
  41. Hargreaves, D.M.; Lowndes, I.S. The computational modeling of the ventilation flows within a rapid development drivage. Tunn. Undergr. Space Technol. 2007, 22, 150–160. [Google Scholar] [CrossRef]
  42. Jastrzębska Spółka Węglowa S.A. Available online: https://www.jsw.pl/raportroczny-2014/sprawozdania/skonsolidowany-raport-roczny/sprawozdanie-zarzadu-z-dzialalnosci-gk-jsw-sa-za-2014-rok/1-podstawowe-informacje-o-grupie-kapitalowej-jastrzebskiej-spolki-weglowej-sa/ (accessed on 29 September 2018).
  43. Jastrzębska Spółka Węglowa S.A. Available online: https://www.jsw.pl/o-nas/zaklady (accessed on 29 September 2018).
  44. Ordinance of the Minister of Environment on Natural Hazards in Mining Company of 19 February 2013 on the Detailed Requirements for Operating the Underground Mines. Legal Act, Warszawa; 9 June 2016. Available online: http://prawo.sejm.gov.pl/isap.nsf/DocDetails.xsp?id=WDU20130000230 (accessed on 25 October 2018).
  45. Veersteg, K.K.; Malalasekera, W. An Introduction to Computational Fluid Dynamics. The Finite Volumne Method; Pearson Education: London, UK, 2007. [Google Scholar]
  46. Sobieski, W. The basic closures of fluid mechanics in form characteristic for the Finite Volume Method. Tech. Sci. 2013, 16, 93–107. [Google Scholar]
  47. Sobieski, W. The basic equations of fluid mechanics in form characteristic of the Finite Volume Method. Tech. Sci. 2011, 14, 299–313. [Google Scholar]
  48. Ansys Theory Guide; ANSYS, Inc.: Southpointe, PA, USA, 2011.
  49. Xu, G.; Luxbacher, K.D.; Ragab, S.; Xu, J.; Ding, X. Computational fluid dynamics applied to mining engineering: A review. Int. J. Min. Reclam. Environ. 2016, 31, 251–275. [Google Scholar] [CrossRef]
  50. Xu, G.; Chang, P.; Mullins, B.; Zhou, F.; Hu, S. Numerical study of diesel particulate matter distribution in an underground mine isolated zone. Powder Technol. 2018, 339, 947–957. [Google Scholar] [CrossRef]
  51. Wang, Z.; Ren, T.; Ma, L.; Zhang, J. Investigations of Ventilation Airflow Characteristics on a Longwall Face—A Computational Approach. Energies 2018, 11, 1564. [Google Scholar] [CrossRef]
  52. Levin, L.Y.; Semin, M.A.; Klyukin, Y.A. Estimation of wall roughness functions acceptability in CFD simulation of mine ventilation networks. In Proceedings of the XLII International Summer School-Conference APM, St. Petersburg, Russia, 30 June–5 July 2014; pp. 25–32. [Google Scholar]
  53. Szlązak, J. The determination of a co-efficient of longwall gob permeability. Arch. Min. Sci. 2001, 46, 451–468. [Google Scholar]
Figure 1. The directions of methane flow through the goaf (from undertaken and overtaken seams) to the longwall and the tailgate.
Energies 11 03076 g001
Figure 2. Diagram of the “U-type” ventilation system from the borders with an indicated area of methane concentration increase.
Energies 11 03076 g002
Figure 3. Schematic location of the auxiliary ventilation equipment (AVE) in the tailgate.
Energies 11 03076 g003
Figure 4. Location of the region where the tests were conducted modified from [42].
Energies 11 03076 g004
Figure 5. The ventilation scheme of the longwall under analysis.
Energies 11 03076 g005
Figure 6. Geometry of the computational domain (longwall, longwall galleries, goaf and air duct, ventilation curtain, and ventilation sluice).
Energies 11 03076 g006
Figure 7. The trajectories of air flowing through the intersection of the longwall and the airway with built-in AVE (a,c) and without such equipment (b,d).
Energies 11 03076 g007
Figure 8. The distributions of velocity vectors for the air flowing through the intersection of the longwall and the tailgate with built-in AVE (a,c) and without such equipment (b,d).
Energies 11 03076 g008
Figure 9. The distributions of methane concentrations in vertical sections of the tailgate with built-in AVE (a) and without such equipment (b).
Energies 11 03076 g009
Figure 10. The distributions of methane concentrations in selected vertical sections (Plane 1) of the tailgate with built-in AVE (a) and without such equipment (b).
Energies 11 03076 g010
Figure 11. The distributions of methane concentrations in selected vertical sections (Planes 2–5) of the tailgate with built-in AVE (a) and without such equipment (b).
Energies 11 03076 g011
Figure 12. The distributions of methane concentrations in selected vertical sections (Planes 6–9) of the tailgate with built-in AVE (a) and without such equipment (b).
Energies 11 03076 g012
Figure 13. The distributions of methane concentrations in selected vertical sections (Planes 10–13) of the tailgate with built-in AVE (a) and without such equipment (b).
Energies 11 03076 g013
Figure 14. The distributions of methane concentrations in selected vertical sections (Planes 14 and 15) of the tailgate with built-in AVE (a) and without such equipment (b).
Energies 11 03076 g014
Figure 15. The manner in which methane is released from the goaf with caving into the tailgate with built-in AVE (a) and without such equipment (b).
Energies 11 03076 g015
Figure 16. The average values of methane concentrations in the cross-sections of the tailgate for the systems with and without AVE.
Energies 11 03076 g016
Figure 17. The values of methane concentrations in the points located on the assumed measurement line for the systems with and without AVE.
Energies 11 03076 g017
Figure 18. The distributions of air stream velocities in the tailgate with AVE (a) and without such equipment (b).
Energies 11 03076 g018
Figure 19. The distribution of methane concentration in the tailgate with built-in AVE and an additional stream of air supplied along the auxiliary air duct with the following capacities: 165.0 m3/min (a), 188.0 m3/min (b) and 212.0 m3/min (c).
Energies 11 03076 g019
Figure 20. Average methane concentration values in the cross-sections of the tailgate for the analysed volume outputs of the air stream supplied along the auxiliary air duct.
Energies 11 03076 g020
Figure 21. The values of methane concentrations along the measurement line (marked in Figure 3) for the analysed capacities of the air stream supplied through the air duct.
Energies 11 03076 g021
Table 1. Underground coal mine disasters related to methane explosions (examples) [6,7,8].
YearCountryCoal MineCause of ExplosionFatalities
1887AustraliaBulliIgnition of gas and coal dust81
1887BelgiumLa Boule, BorinageMethane explosion120
1914CanadaHillcrestMethane and coal dust explosion189
1914JapanMitsubishi HojyoMethane explosion687
1950ChinaHenanMethane explosion187
1960ChinaHenanMethane and coal dust explosion187
1972ZimbabweWankie Colliery DisasterMethane and coal dust explosion426
1991ChinaShanxiMethane and coal dust explosion147
2005ChinaLiaoningMethane explosion214
2006PolandHalembaMethane and coal dust explosion23
2007ChinaHanxiMethane explosion105
2009Poland“Wujek” (Śląsk)Methane and coal dust explosion20
2009ChinaHeilongjiangMethane explosion108
2014PolandMysłowice-WesołaMethane explosion5
Table 2. Geometry and ventilation parameters of the test region.
Geometry and Ventilation ParametersValues
Air emission rate (Q1)—maingate, m3/min1100.00
Air emission rate (Q2)—air duct in tailgate, m3/min141.0
Methane emission rate (absolute methane content—QCH4), m3CH4/min12.36
The height of longwall, m3.5
The length of longwall, m116.0
The width of longwall, m3.5
The width of longwall galleries, m4.0
The height of longwall galleries, m3.5
The area of longwall galleries, m212.283
The length of goaf, m100.0
The length of maingate, m25
The length of tailgate m79
The length of the unliquidated part of the airway behind the caving line of the longwall, m4.0
The location of the outlet from the air duct in relation to the liquidation line of the airway, m5.5
The location of the ventilation curtain in relation to the liquidation line of the airway1.0
Diameter of air duct, m1.0
Table 3. Parameters characterizing rocks littering in the roof of the longwall and forming goaf with caving.
Type of Roof RocksCompressive Strength, MPaTensile Strength, MPaRrrs, MPa
Clay slates with coal lamina17.50 2.083.88
Coarse-grained24.602.30
Sandstones53.606.10
Table 4. The comparison of the methane concentration values obtained from the measurements in real-world conditions and those determined through model-based tests, for a system with auxiliary ventilation equipment (AVE).
Methane Concentration Level, %Model with Auxiliary Ventilation EquipmentReal SystemError, %
Point P10.971.111.82
Point P20.870.9912.12
Table 5. The comparison of the methane concentration values determined on the basis of model-based tests, for systems with and without AVE in the measurement points (P1 and P2).
Methane Concentration Level, %Model with Auxiliary Ventilation EquipmentModel without Auxiliary Ventilation Equipment
Point P10.973.05
Point P20.871.75

