Article

A New GIS-Based Algorithm to Support Initial Transmitter Layout Design in Open-Pit Mines

Department of Energy Resources Engineering, Pukyong National University, Busan 48513, Korea
*
Author to whom correspondence should be addressed.
Energies 2018, 11(11), 3063; https://doi.org/10.3390/en11113063
Submission received: 26 September 2018 / Revised: 4 November 2018 / Accepted: 5 November 2018 / Published: 7 November 2018

Abstract

:
In this paper, a new geographic information systems (GIS)-based algorithm is proposed for supporting the initial design of a wireless communications system in open-pit mines. In this algorithm, multiple candidate transmitter (wireless access point) locations are selected considering the probability of further development and environmental factors in the mine. Then, a three-dimensional (3D) partial Fresnel zone between the transmitter and the receiver is defined and its 3D Fresnel index calculated by communication viewshed analysis of topographic data. The initial design for a transmitter layout is then determined based on the 3D Fresnel indices, which are calculated for all candidate transmitter locations. The proposed algorithm was applied to an open-pit mine located in Samcheok-si, Gangwon-do, South Korea. The 3D Fresnel indices were calculated for 15 candidate transmitter locations, and an initial transmitter layout then designed considering favorable combinations of two, three, and four transmitters. The proposed algorithm provided more precise Fresnel index overlay maps for the favorable transmitter candidate combinations than other algorithms based on line-of-sight and two-dimensional partial Fresnel zone analyses. Application of the algorithm to an open-pit mine where a wireless communications system is already installed revealed that the initial transmitter layout design is acceptable in terms of providing reasonable information on the coverage area of transmitters. Because the proposed algorithm provides an initial transmitter layout that can be modified after field investigations, it can support efficient design of wireless communications systems for use in open-pit mines.

1. Introduction

Global declines in the price of minerals and the depletion of high quality mineral reserves have caused drops in both mineral production and profits for mining companies [1]. Accordingly, a significant amount of new technology and equipment has been developed to improve the productivity and efficiency of mining [2,3,4]. One recent trend is the emergence of digital technologies for mining operations [5], including fleet management systems for maximizing the operation of equipment [6,7,8,9,10,11], safety management systems for monitoring worker safety at mining sites in real time [12,13,14,15,16], and production management systems for real-time reporting and scheduling [12,17]. Other examples include equipment automation systems [18,19] and technology for the remote operation of mining sites [12,20]. In these systems, data pertaining to equipment operation, worker safety, and production processes is commonly collected in real time on a web server or in the cloud, thereby enabling scheduling and instructions to be delivered in real time. These types of digital technologies require a wireless communications network for proper operation [21], which typically means that wireless access points (APs) are installed at the mining site to form a wireless LAN (WLAN) [22] that allows for wireless communications among workers, equipment, and devices in the field or at the field office [23]. Such WLANs are commonly ultra-high frequency (UHF) wireless networks based on the 802.11X IEEE standard.
Various methods have been proposed to aid the design of wireless communications systems in open-pit mines [22,23] and involve the selection of appropriate frequency bands for mining applications, such as equipment monitoring, voice communications, and data exchange. Furthermore, studies have been conducted to develop propagation models for wireless communication network planning in open-pit mines [24,25,26,27]. In addition, many commercial applications have been developed for this purpose, including Masterlink® by Modular Mining and IMPACT® by Mine Site Technologies, which provide wireless communications system planning functions such as initial site assessment, communications system design, hardware installation, and support and maintenance monitoring [28,29].
An efficient and economical WLAN network design approach is to install the minimum number of wireless APs without introducing shadow areas [30,31,32,33]. In addition, to prevent unstable signal propagation due to topography or mine structures, the stability of the radio signal propagation and the coverage area should be quantitatively analyzed during the system design stage [22]. If wireless APs are installed at inappropriate locations such that multiple shadow areas exist, this will compromise the ability to accurately monitor the site in real time.
Until recently, the majority of wireless APs in open-pit mines have been located based on subjective and empirical judgments of both mining and radio communications experts. Locations at higher altitudes in open-pit mines were considered to be suitable candidate points for transmitters, and temporary transmitters and receivers were used in field tests to qualitatively calculate the overall coverage area. However, such field tests are time consuming and it is often not possible to determine the coverage in inaccessible areas due to ongoing blasting and mining activities. Accordingly, a new method to support initial transmitter layout design is required. This method should help to objectively and quantitatively determine the locations and number of wireless APs without introducing shadow areas.
In this paper, a new geographic information systems (GIS)-based algorithm is proposed for supporting the initial design of transmitter layouts for wireless communications systems in open-pit mines. The proposed algorithm considers the probability of additional development activities and environmental factors when selecting multiple candidate transmitter locations. In the algorithm, three-dimensional (3D) communication viewshed analysis of topographic data is conducted to calculate 3D Fresnel indices of candidate transmitter locations. The candidate transmitter combinations are then ranked based on the index maps to determine the initial transmitter layout in the open-pit mine. This paper reports the concept and details of the algorithm, as well as its application to real-world datasets.

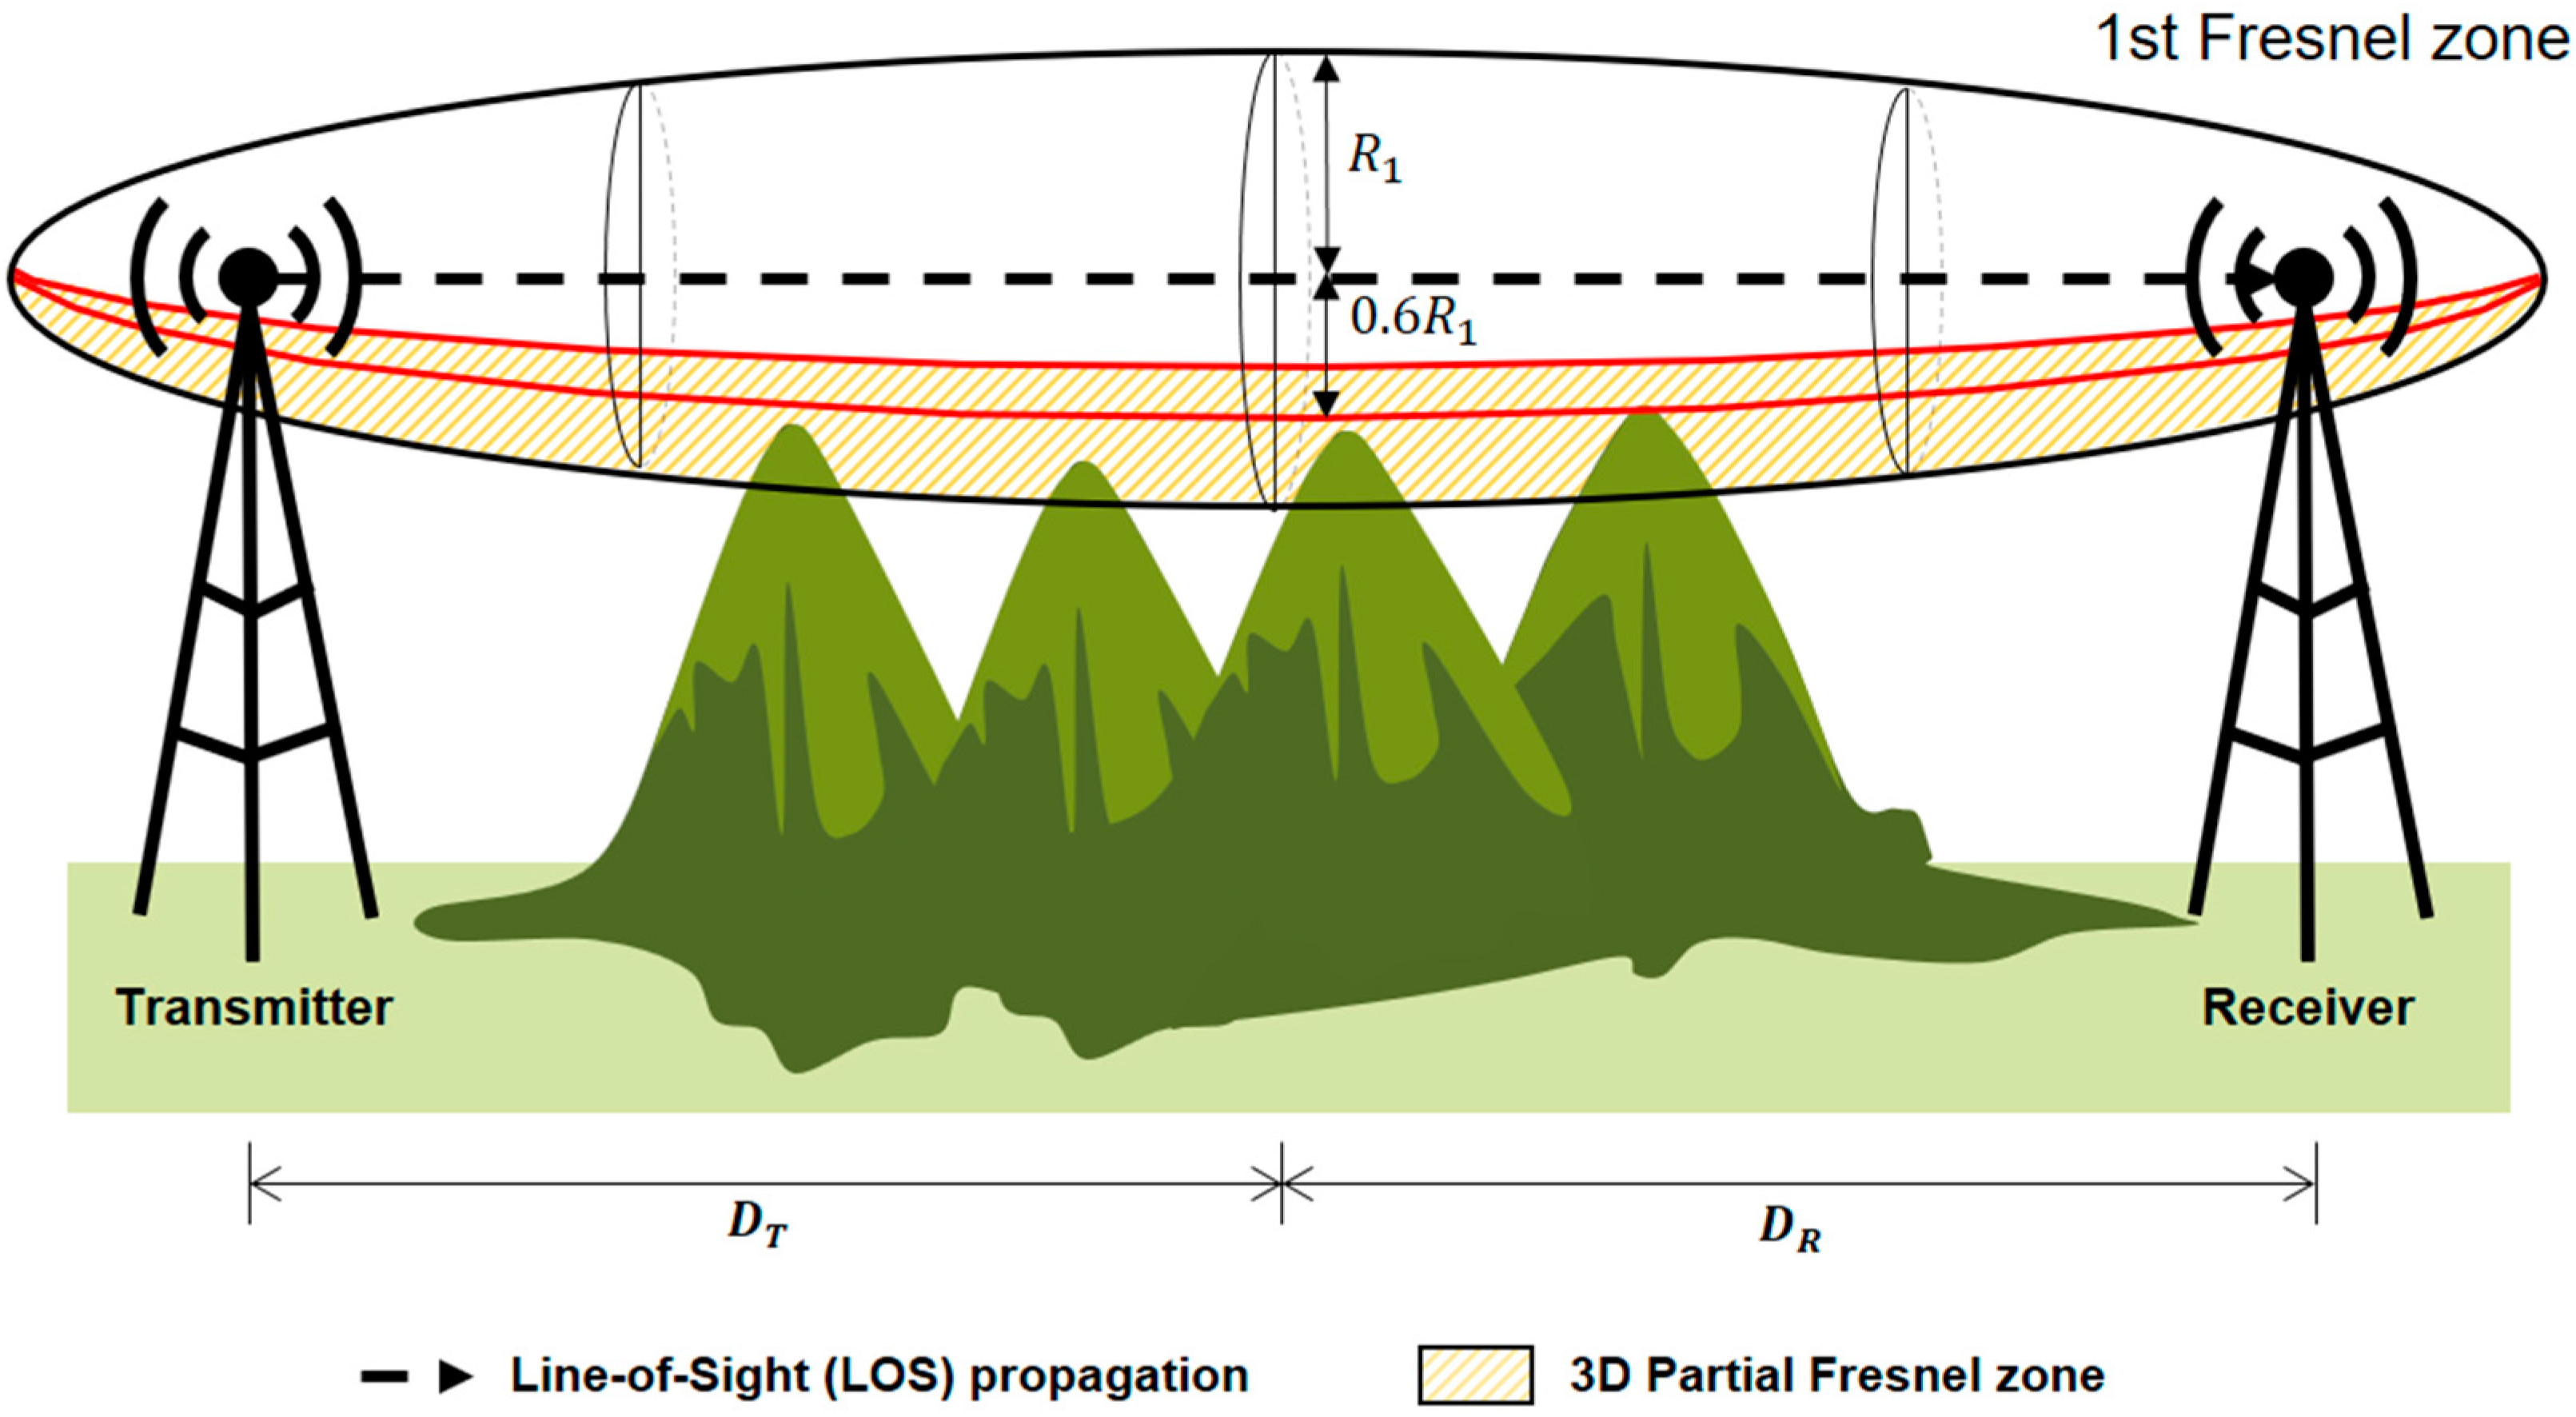
2. Principles of the Fresnel Zone and the 3D Fresnel Index

As is well known, when ultra-high frequency (UHF) signals propagate from a transmitter to a receiver, the signals travel along a line-of-sight (LOS) path, which is a straight line connecting the transmitter and receiver [21,33]. When there are obstacles, such as trees, buildings, or other topological features, in a particular signal propagation area, some signals follow a LOS path while others are reflected by an obstacle before arriving at the receiver. In this case, the antenna receives both the LOS and reflected signals, and a signal thus received experiences a phase shift due to the difference in length between the LOS and reflection paths, which results in an unstable state wherein the level of the received signal may be higher or lower than that of the LOS signal [33].
In the field of communications, Fresnel zones, which are the signal propagation areas between transmitters and receivers, are employed to evaluate the stability of LOS signal propagation [33,34,35,36,37,38,39]. Fresnel zones can be defined from two perspectives. From the perspective of geometry, Fresnel zones are defined as the ellipsoids of revolution surrounding a LOS path [35]. Here, the transmitter and receiver are assumed to be located at the focal points of the ellipsoids of revolution. In contrast, from the perspective of communications technology, when the difference between the sum of the distances from any point on an ellipsoid of revolution to a transmitter and receiver, respectively, and the straight line distance between them is n · λ 2 , the ellipsoid of revolution is defined as the n-th Fresnel zone [36], where λ indicates the wavelength of the signal. The radius of any Fresnel zone can be calculated by considering the wavelength of the signal [37].
R n =   n · λ · D T · D R D T + D R ,
λ =   c f ,
where R n is the radius of the n-th Fresnel zone, n is the number of Fresnel zones, D T and D R are the distances (m) from a transmitter and a receiver, respectively, to any point located along the revolution axis of the ellipsoid, λ is the wavelength (m) of the signal, f is the frequency (Hz) of the signal, and c is the velocity of light ( 2.997 × 10 8   m / s ) .
The possibility of LOS propagation is evaluated for the first Fresnel zone among the infinite number of Fresnel zones (Figure 1). As a first step, a 3D partial Fresnel zone between any surfaces is defined as 0.6 times the radius of the Fresnel zone based on a cross-section along the direction of the major axis of the first Fresnel zone and the bottom surface of the first Fresnel zone. If the elevation of an obstacle is higher than or equal to that of the 3D partial Fresnel zone, LOS propagation is considered to be impossible [35,36].
The basic equation for the first Fresnel zone is shown in Equation (3), and Equation (4) is the Fresnel zone equation defined when the Y axis revolves an angle of θ degrees due to the difference in height between the transmitter and receiver. Equation (5) is presented to calculate the top surface elevation of the 3D partial Fresnel zone, and Equation (6) presents the transformation equations for a Y-axis rotation.
x 2 ( a 3 D ) 2 + y 2 ( b 3 D ) 2 + z 2 ( b 3 D ) 2 = 1 ,
( x · cos θ z · sin θ ) 2 ( a 3 D ) 2 + ( y ) 2 ( b 3 D ) 2 + ( x · sin θ + z · cos θ ) 2 ( b 3 D ) 2 = 1 ,
( x · cos θ z · sin θ ) 2 ( a 3 D ) 2 + ( y ) 2 ( b 3 D ) 2 + ( x · sin θ + z · cos θ ) 2 ( 0.6 · b 3 D ) 2 = 1 ,
x = x · cos θ + z · sin θ ,   y = y ,   z = z · cos θ x · sin θ ,  
a 3 D =   1 2 · SD ,   b 3 D =   1 2 λ · SD ,
θ = tan 1 ( Offset T     Offset R D ) ,
where a 3 D is half of the major axis length of the 3D first Fresnel zone (m), b 3 D is the radius of the first Fresnel zone at the center of the revolution axis (m) [38], SD is the major axis length of the ellipsoid in the x-direction (m), θ is the angle between the transmitter and the receiver, Offset T is the elevation of the transmitter (m, above sea level), Offset R is the elevation of the receiver (m, above sea level), and D is the physical distance (m) connecting both ends of the major axis of the ellipsoid of revolution.
The conventional method of evaluating the stability of communications assesses the possibility of LOS propagation as either possible or impossible. However, when the topography is included in a 3D partial Fresnel zone, signals can be reflected by the topography, which makes stable LOS propagation impossible. Accordingly, in this study, the effect of topography on a 3D partial Fresnel zone was considered in the development of a new 3D Fresnel index that will be used to quantitatively evaluate the stability of communications. The 3D Fresnel index is calculated as follows:
FI = 0 Elev ( T ) Elev ( US ) 1 Elev ( T ) Elev ( LS ) 1 V T V PF Elev ( LS ) < Elev ( T ) < Elev ( US )  
where FI is the 3D Fresnel index, Elev ( T ) is the elevation of the terrain at any point (m, above sea level), Elev ( US ) is the elevation of the upper surface in the 3D partial Fresnel zone (m, above sea level), Elev ( LS ) is the elevation of the lower surface in the 3D partial Fresnel zone (m, above sea level), V T is the total terrain volume included in the 3D partial Fresnel zone ( m 3 ) , and V PF is the volume of the 3D partial Fresnel zone ( m 3 ).

3. Algorithm Development

The proposed GIS-based algorithm for supporting transmitter layout design consists of three steps. In Step 1, several candidate transmitter locations are selected while considering the possibility of additional development and environmental factors in and around the mine. In Step 2, a communication viewshed analysis is conducted for every candidate transmitter location in order to generate the 3D Fresnel index maps. In Step 3, all possible combinations of transmitters are considered and the corresponding 3D Fresnel index maps are overlapped to determine the most favorable combination. The sum of the 3D Fresnel indices of all cells on the overlapped maps is then considered when determining the most favorable locations and combination of transmitters.

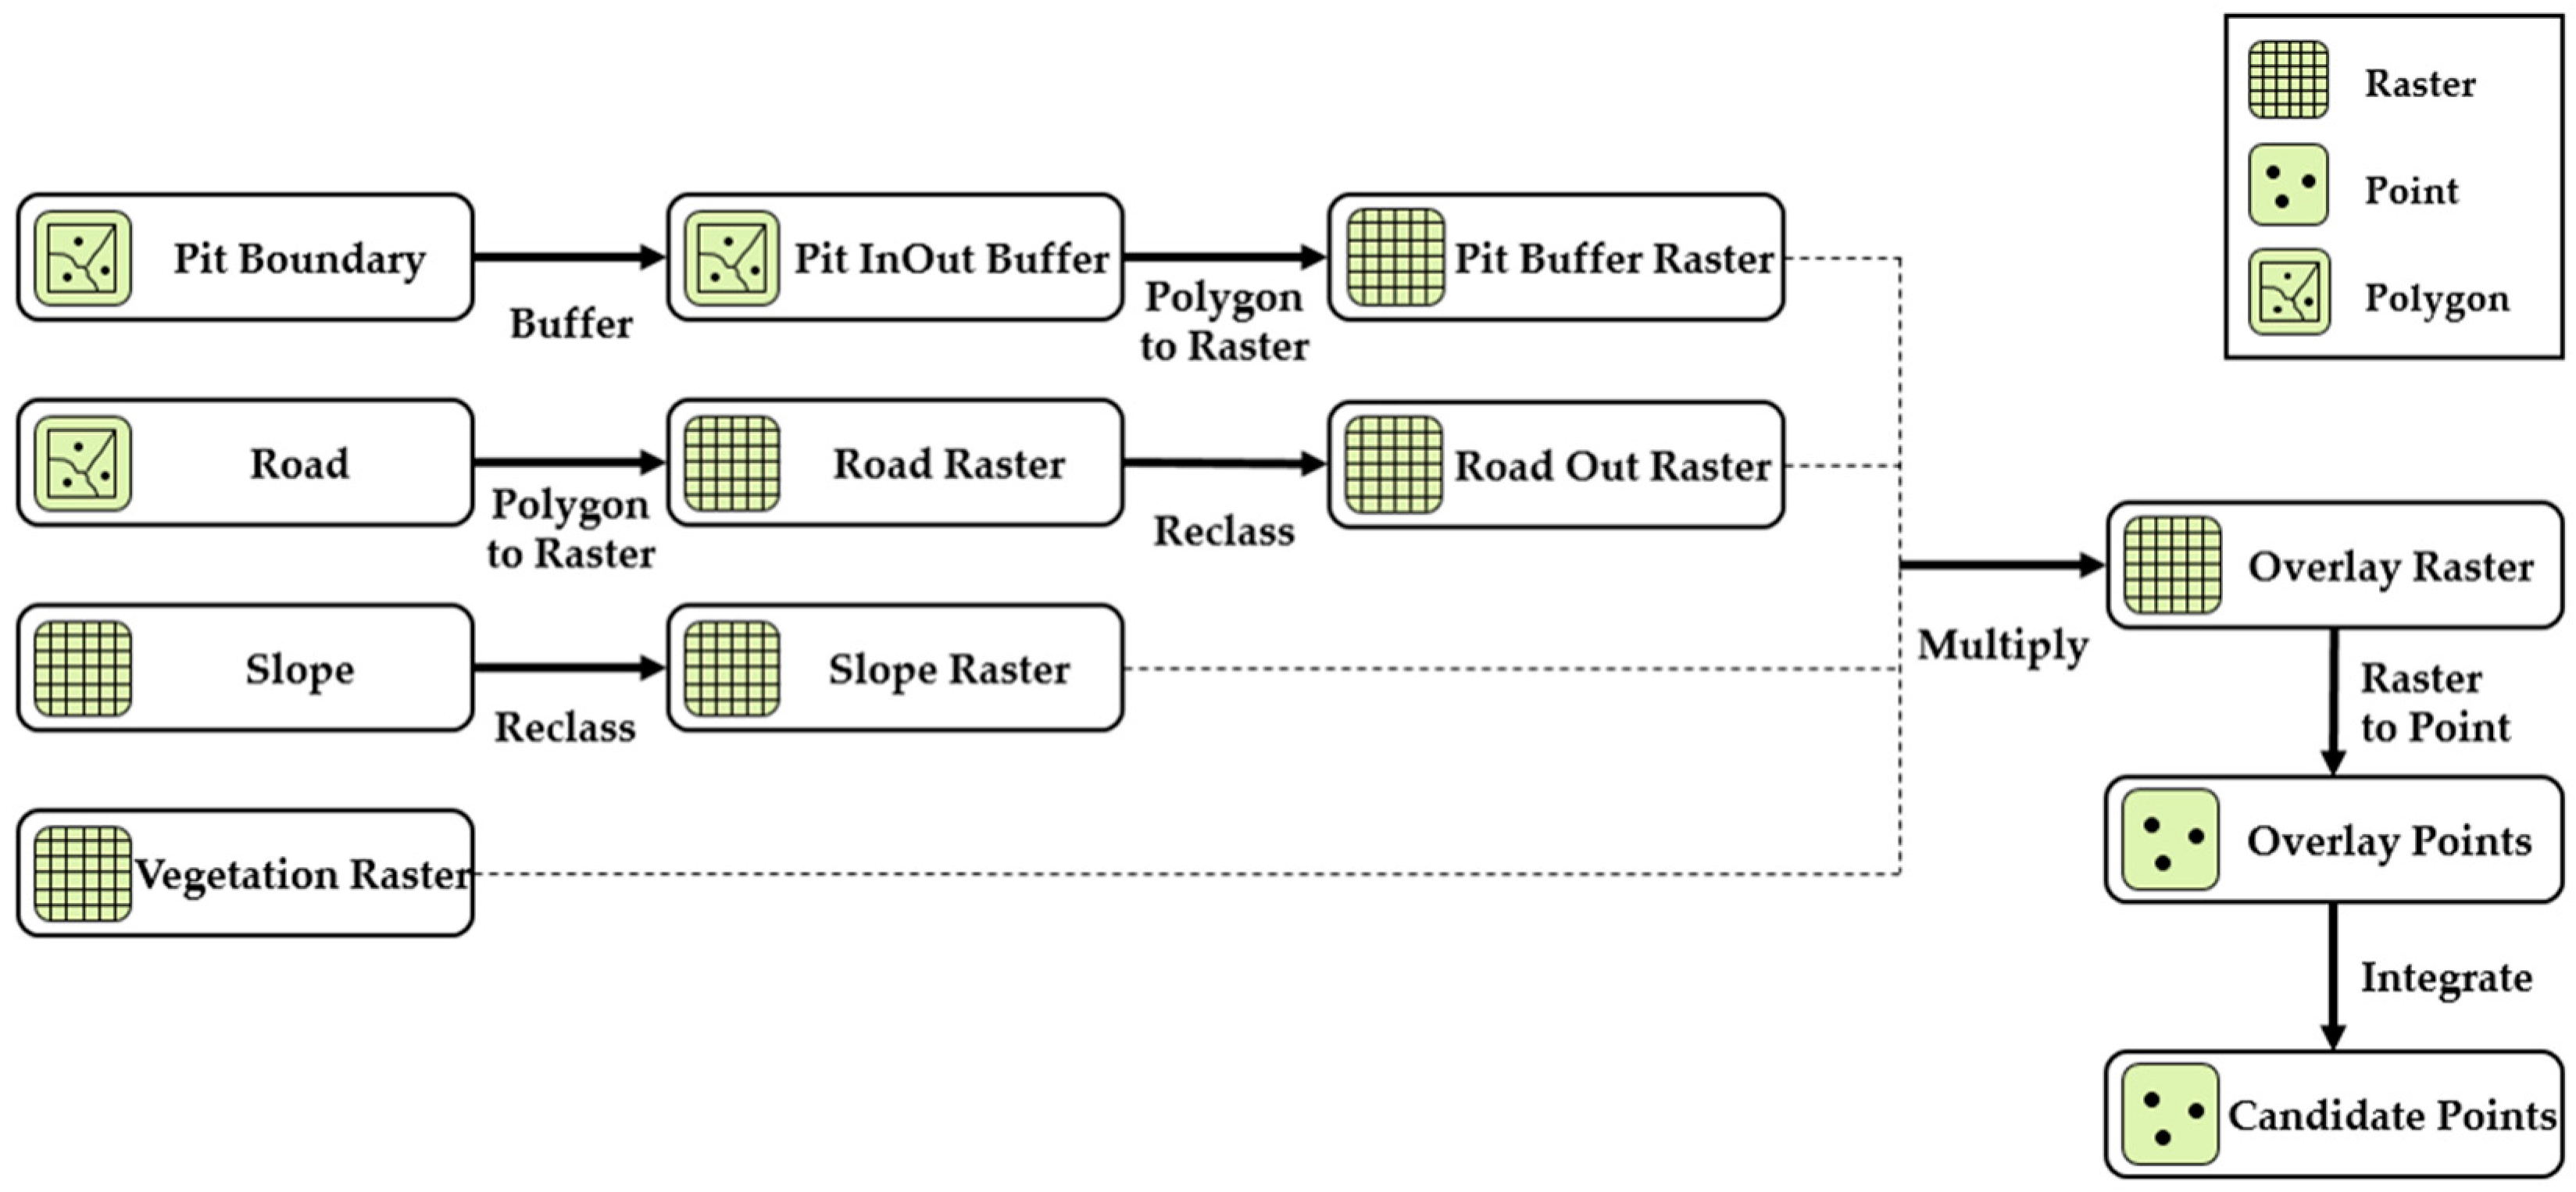
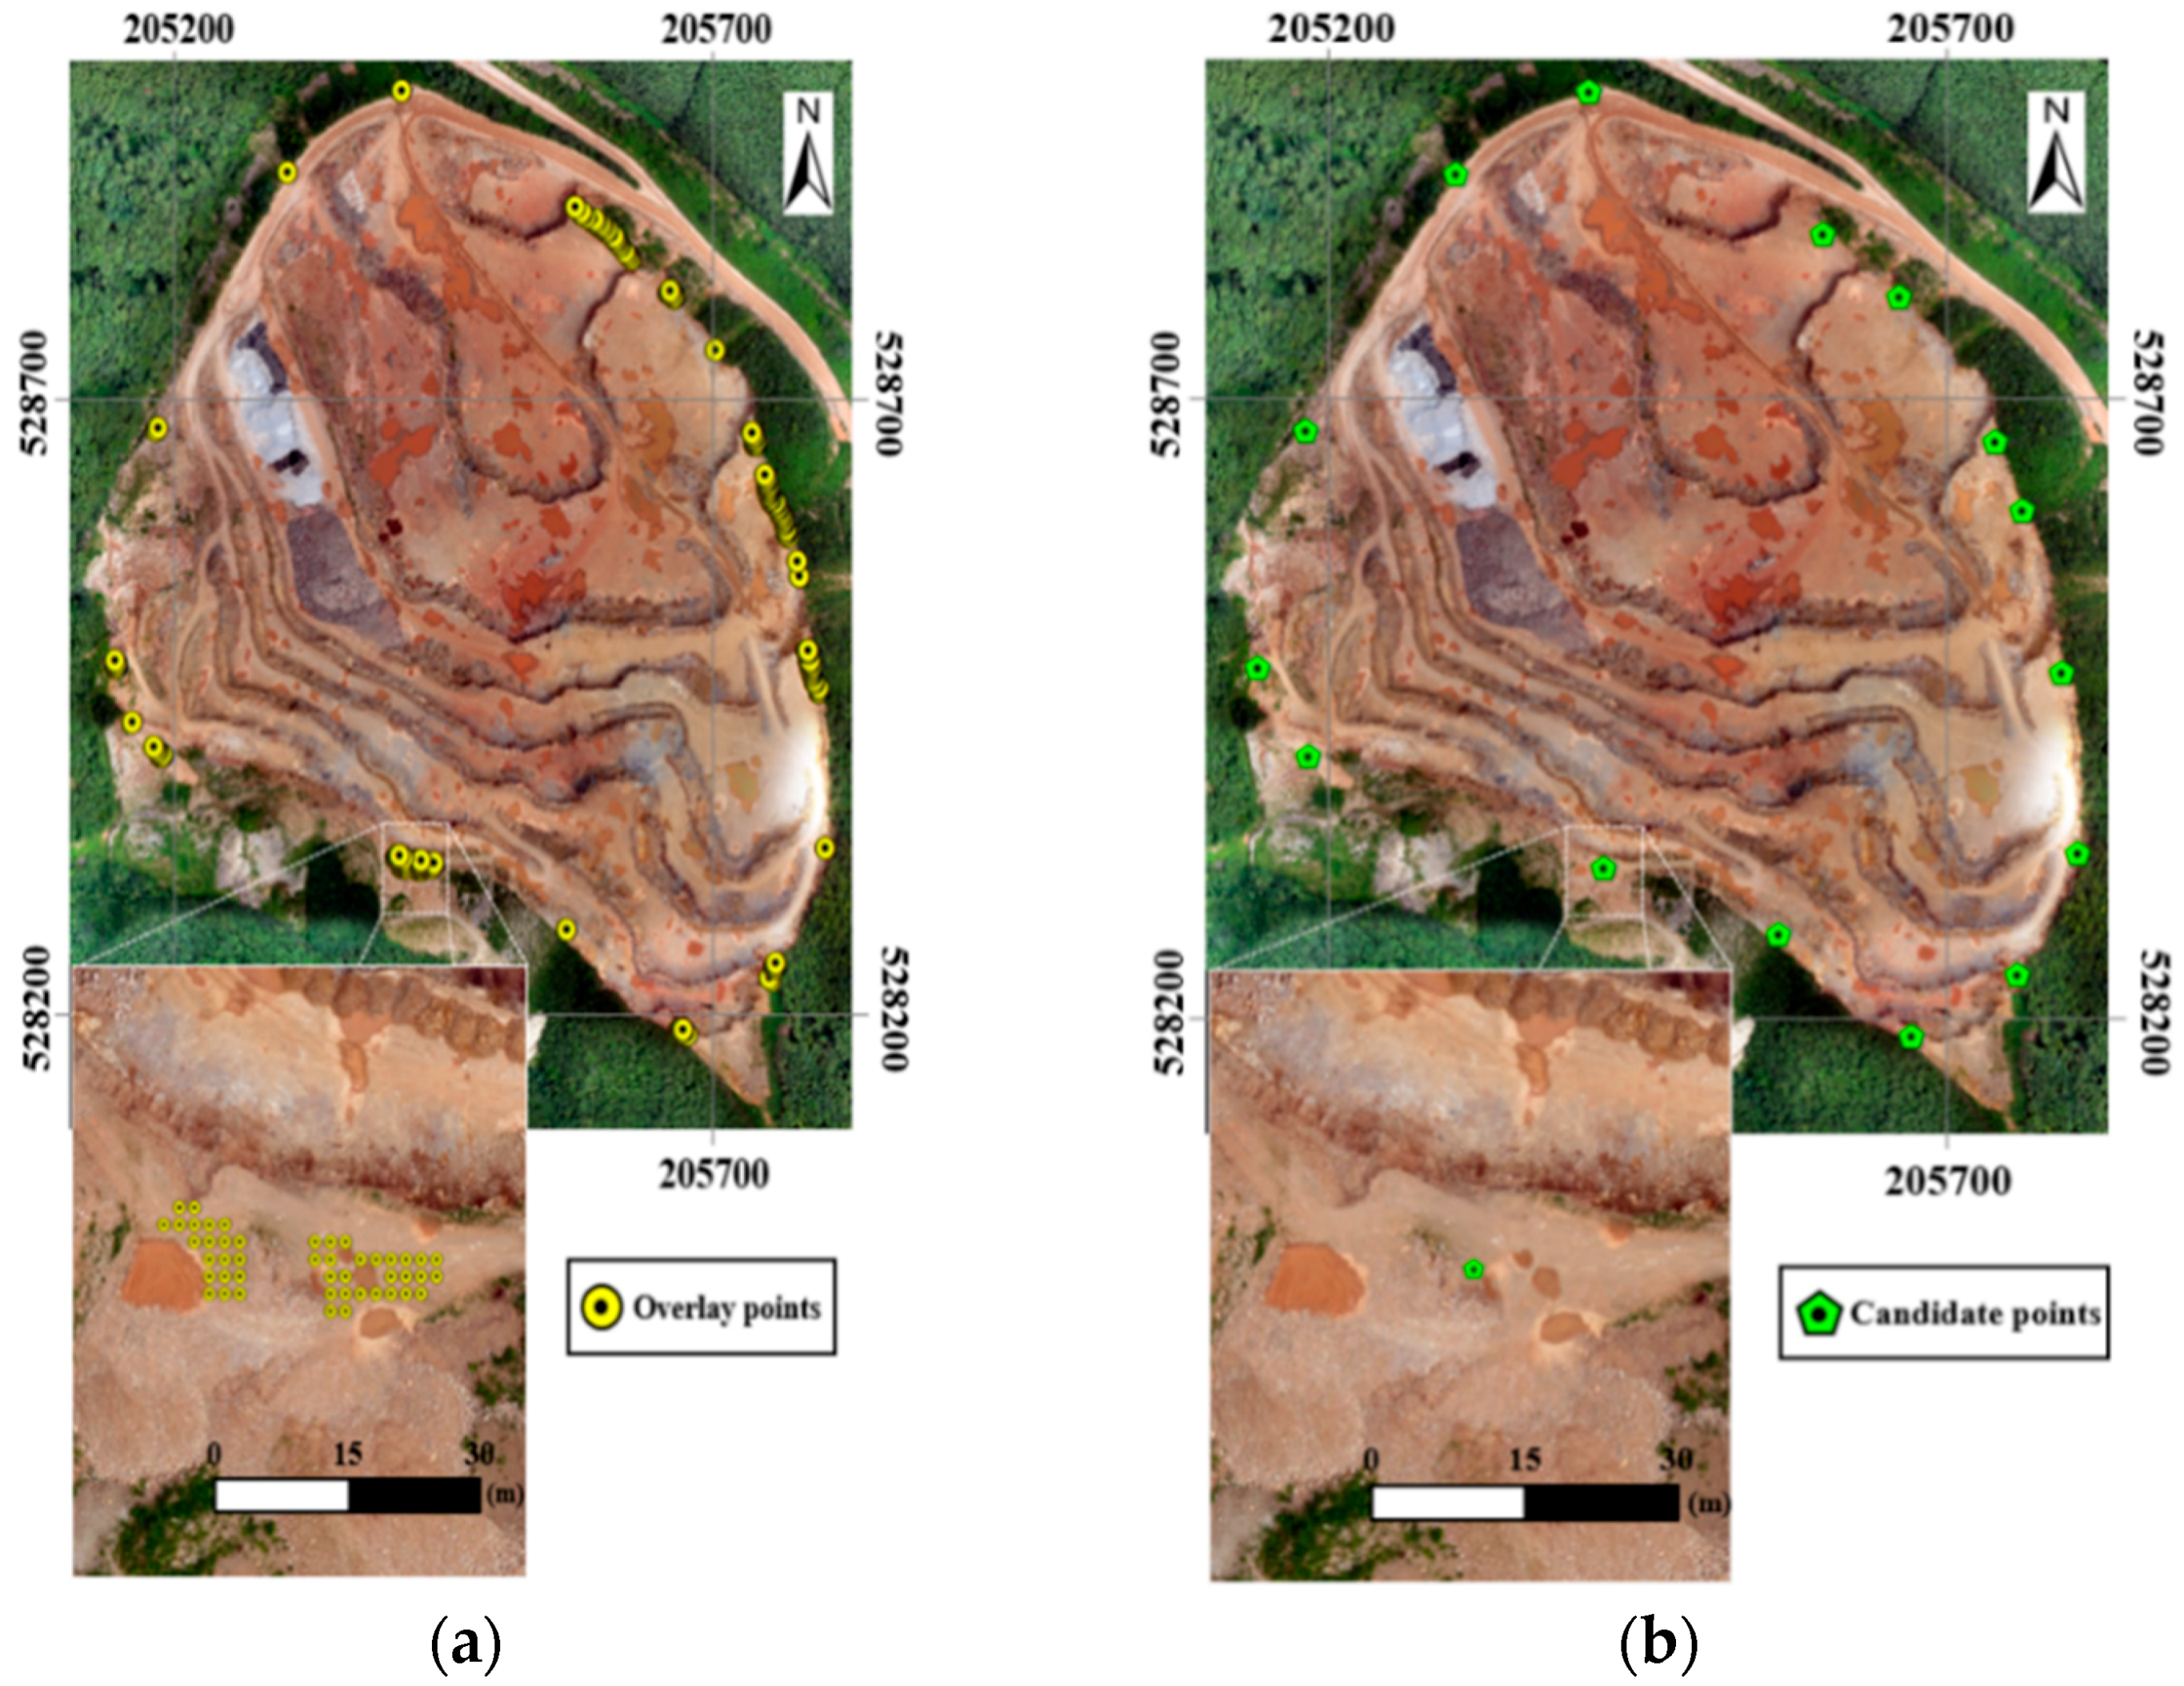
3.1. Selecting Multiple Candidate Locations of Transmitters

When installing transmitters for a WLAN, it is common to consider various factors, such as building construction, the presence of vegetation in the direction of signal propagation, water surfaces, terrain gradients, roads, etc. [39]. In addition, in an open-pit mine, blasting works, roads for transportation, terrain gradients, and vegetation also should be considered. In this study, all relevant factors were modified so as to be applicable to open-pit mines.
In the proposed algorithm, candidate locations for transmitters are determined based on aerial photos and a digital surface map (DSM) that includes terrain elevations of the open-pit mine and surrounding cells, and road features represented by lines. Every cell within the open-pit mine area is converted to a point in the terrain data and all points are assumed to be potential locations for transmitters. In an operating mine, blasting work is conducted from time to time for mining purposes. If a transmitter is installed in a location where blasting work may be conducted, the transmitter may be damaged by broken rock or blast shock waves. If transmitters must be moved to avoid damage, this will increase the cost of installation. Accordingly, it is necessary to avoid any points in the terrain of an open-pit mine that may be developed or blasted in the future. For similar reasons, transmitters are excluded from being installed on roadways and similar locations. Ideally, transmitters should be installed on relatively flat terrain. Thus, terrains with gradients between 0° and 5° are considered suitable. Finally, as for the presence of vegetation in the direction of signal propagation, if vegetation exists within a 5 m radius of a point, it cannot be a candidate location. This also applies to any points that are identified as vegetation in the aerial photos (Figure 2).

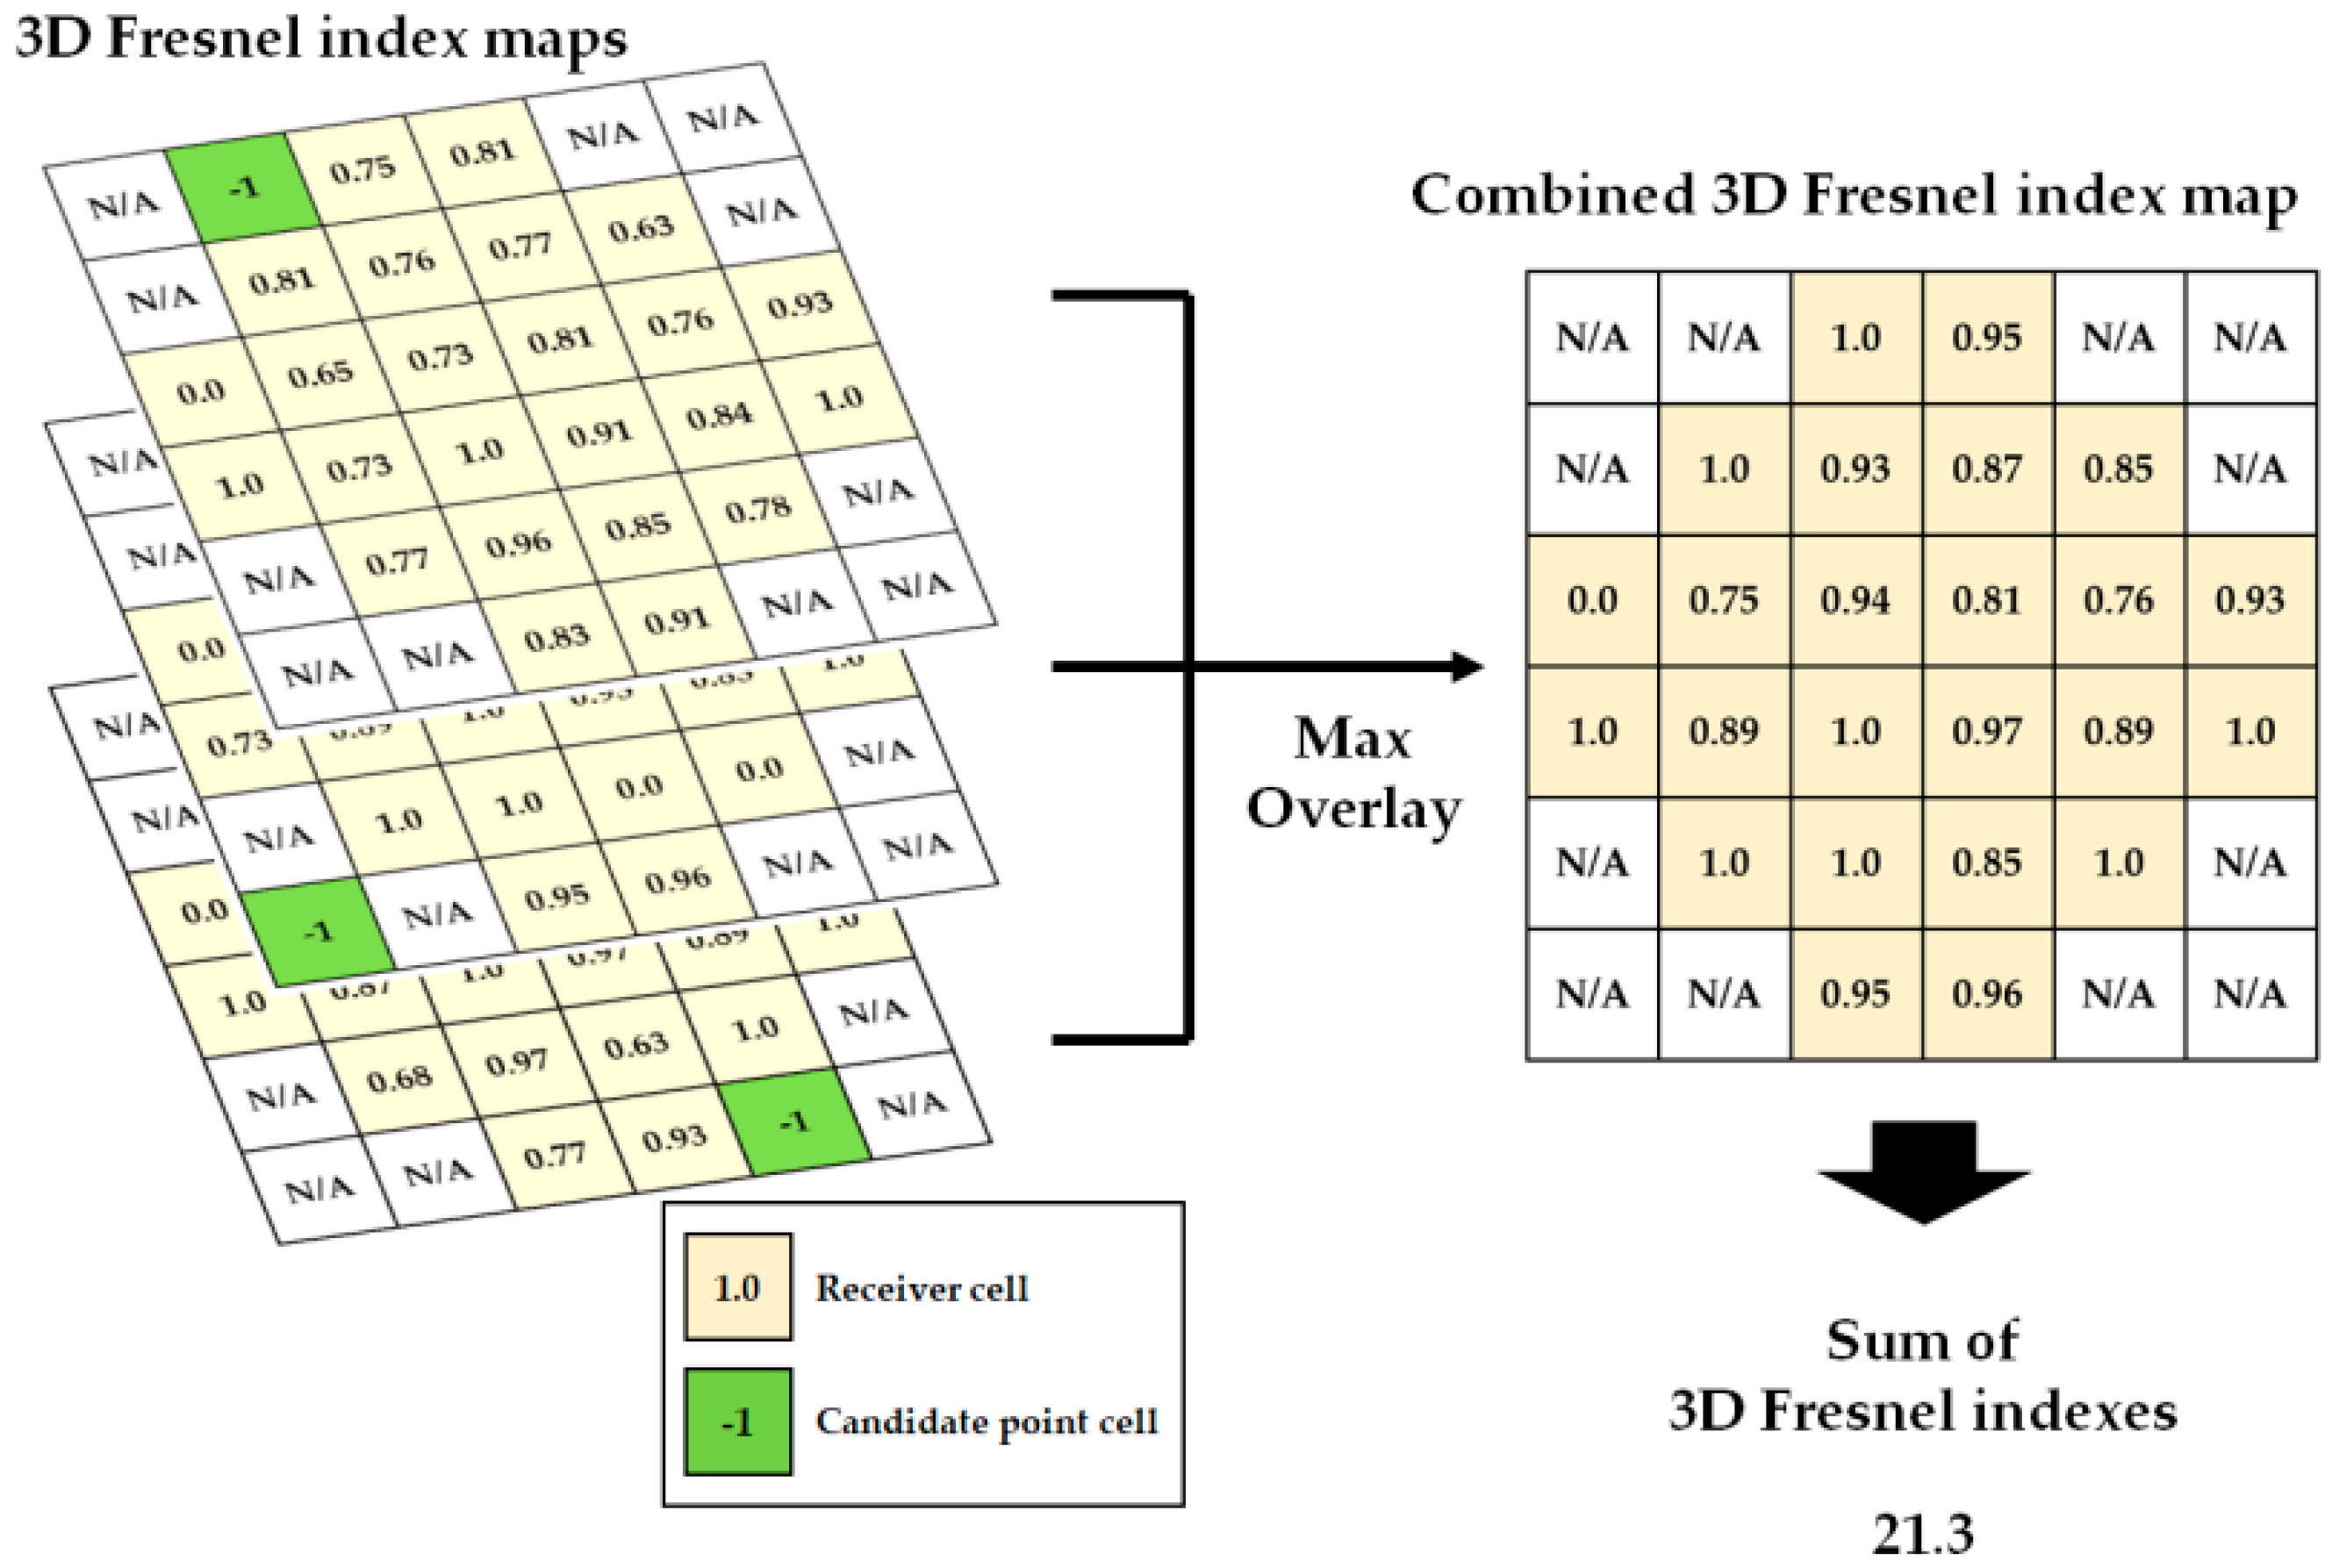
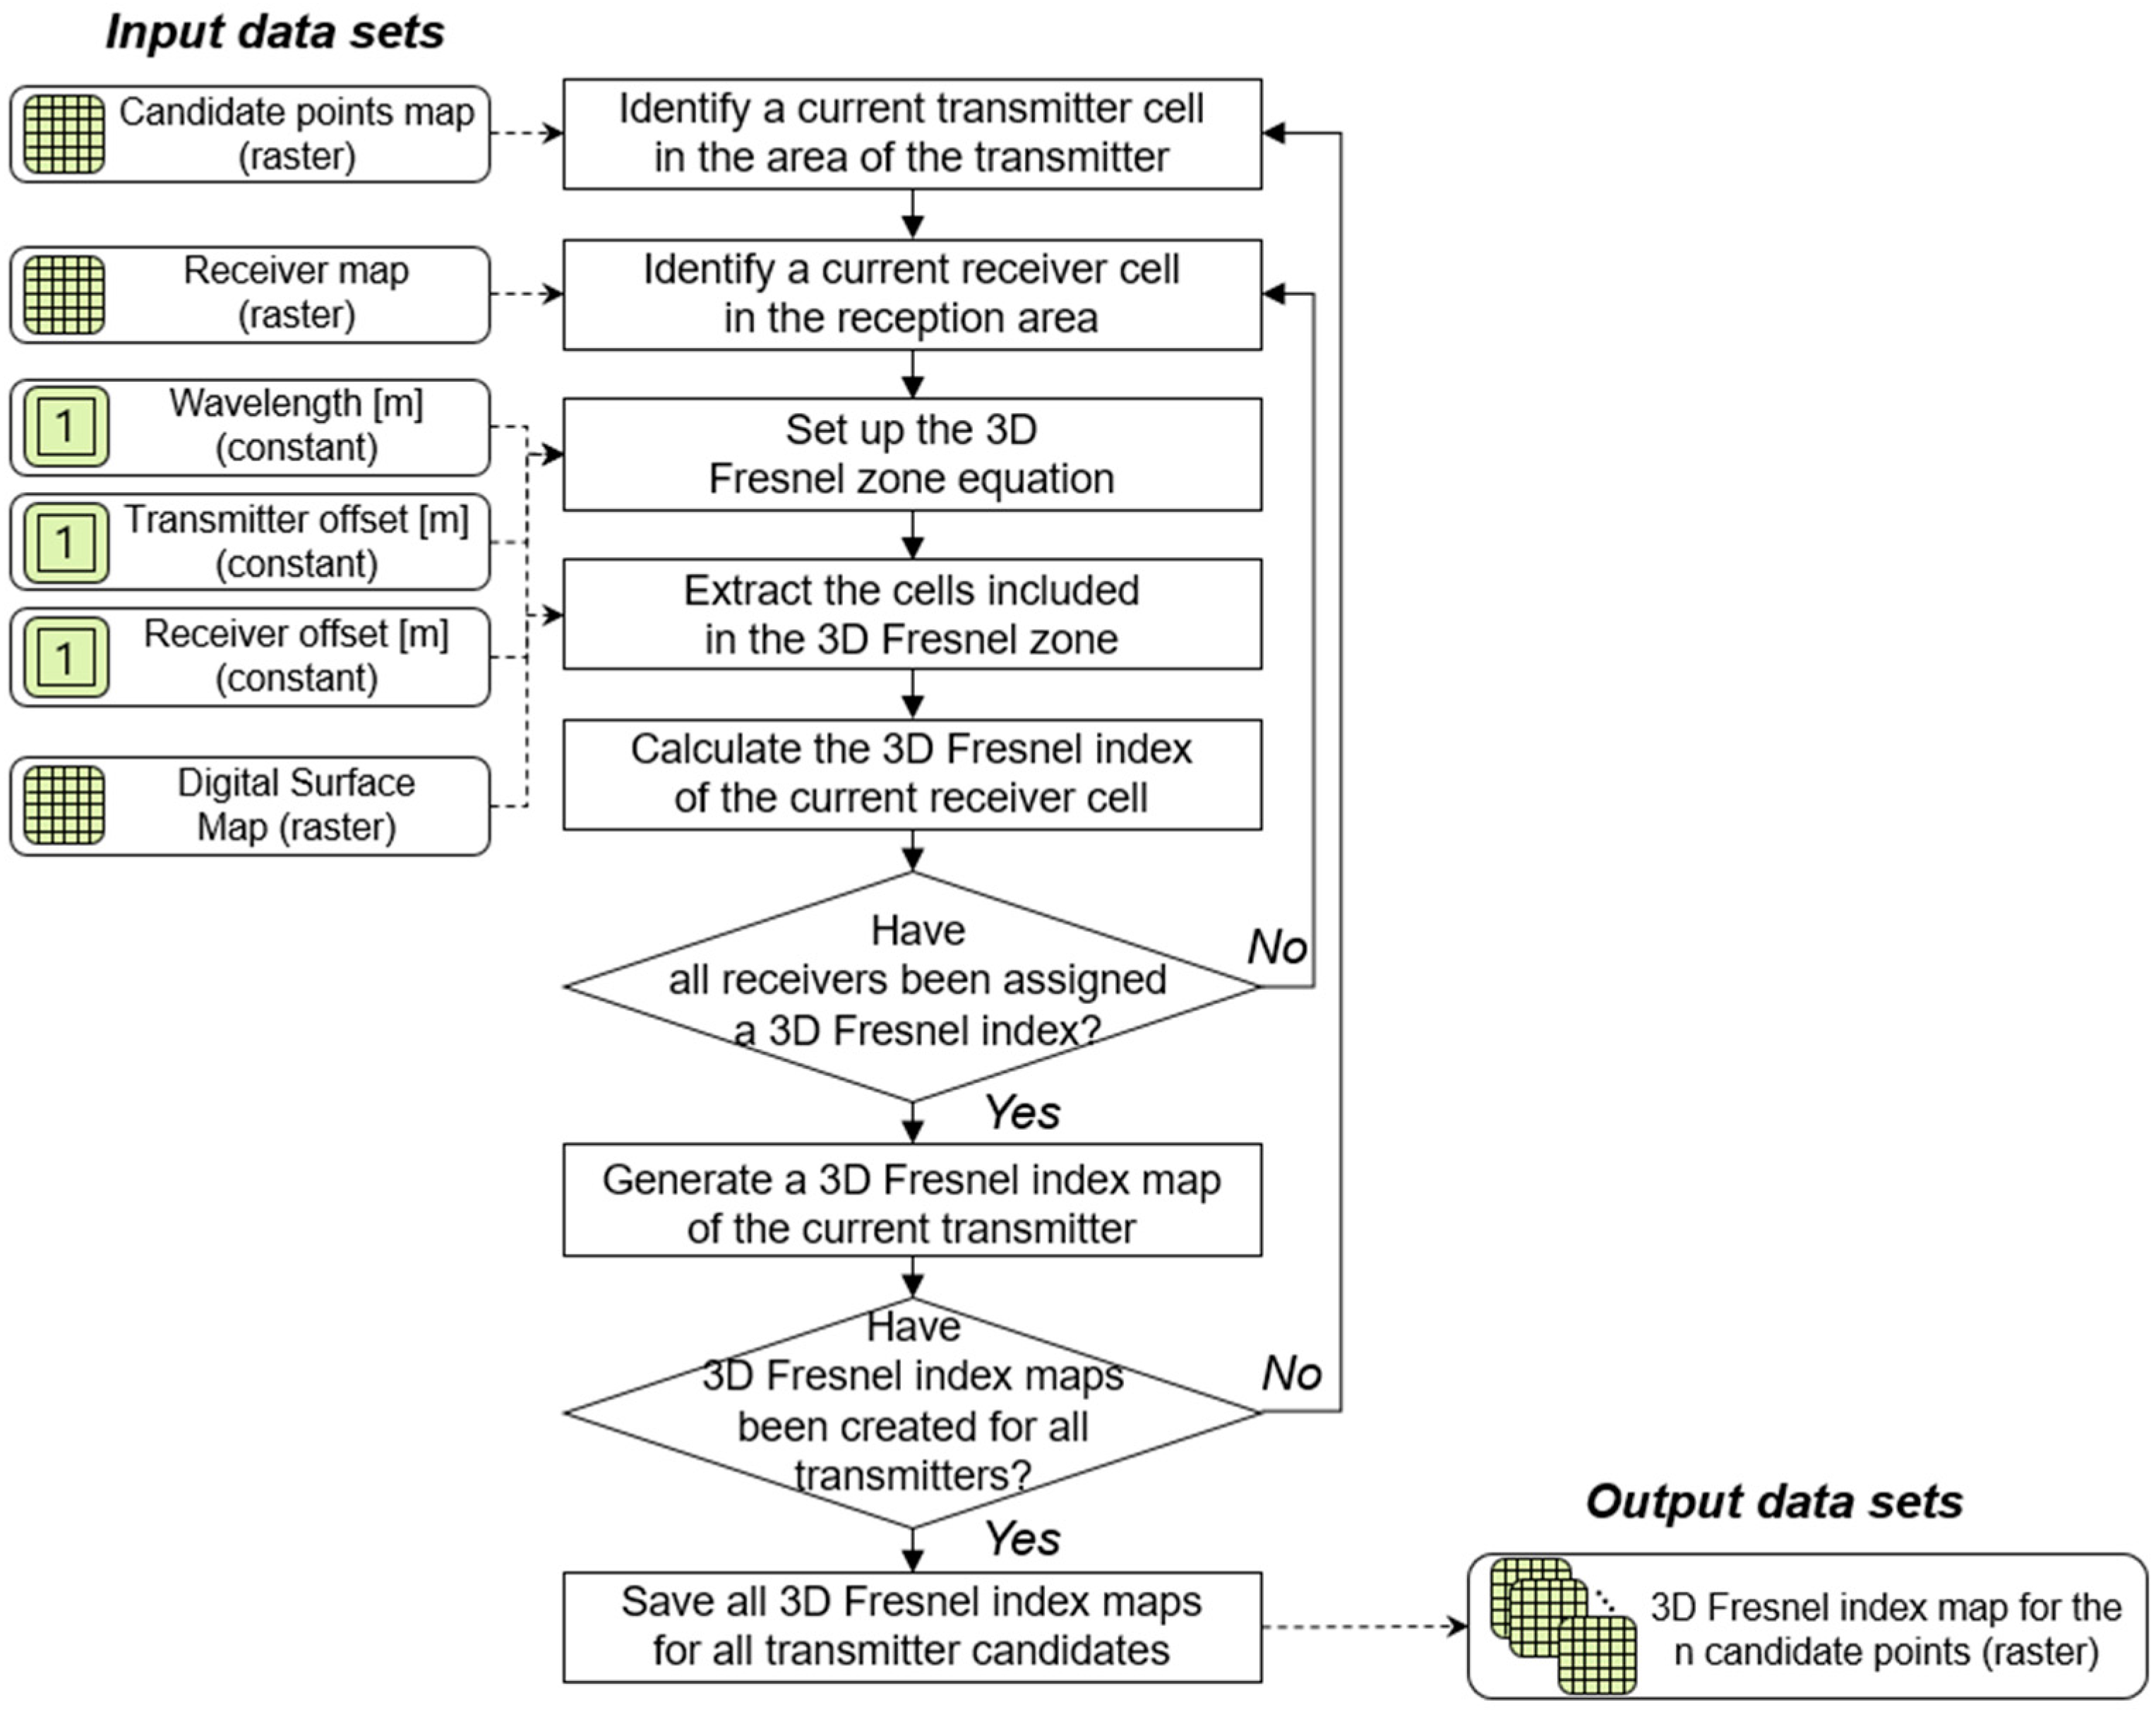
3.2. Calculating the 3D Fresnel Index

Typical methods of calculating a coverage area are LOS analysis [40,41,42,43,44,45,46,47] and two-dimensional (2D) Fresnel zone analysis [48,49,50,51], both of which use low resolution terrain data to extract a 2D profile of the terrain between a transmitter and a receiver in order to compare the LOS, Fresnel zone, and terrain elevations to evaluate the possibility of LOS propagation. Recently, it has become common to use unmanned aerial vehicles (UAVs) to acquire high resolution terrain data in which vegetation can be identified [52,53,54,55]. When high resolution terrain data are utilized to analyze a Fresnel zone, more terrain cells are included in the 3D Fresnel zone than when low resolution terrain data are used. Thus, this requires a new 3D Fresnel zone analysis method as conventional methods employ 2D terrain profiles to analyze the communications stability.
In this study, a 3D Fresnel zone analysis [56] was used to quantitatively calculate the 3D Fresnel index by considering the effects of the terrain in the 3D partial Fresnel zone between a transmitter and receiver (Figure 3). To conduct a 3D Fresnel zone analysis, the following is required: a DSM that includes the terrain dataset of the mine, a transmitter map indicating candidate locations, a receiver map displaying the desired signal reception area, wavelengths of the signals, elevations of the transmitters, and elevations of receivers.
As a first step, among the candidate transmitter locations displayed on the input transmitter map, a point is randomly selected and designated as the current transmitter cell. Among the receiver cells in a reception area, a point is randomly selected and designated as the current receiver cell. Then, Equation (4) is used to define the 3D Fresnel zone formed between the transmitter and the receiver (see Figure 4). To extract only the terrain cells included in the 3D Fresnel zone, a 2D elliptic equation (Equation (10)) is defined in which the 3D Fresnel zone is projected in the XY plane. In Equations (10)–(12), a 2 D represents half of the major axis length of the ellipse (m), b 2 D is the radius of the 2D Fresnel zone (m), and PD is the physical distance connecting both ends of the major axis of the ellipse (m).
x 2 ( a 2 D ) 2 + y 2 ( b 2 D ) 2 = 1 ,
a 2 D =   1 2 · PD ,
b 2 D =   1 2 λ · PD ,
After the terrain cells in the 3D Fresnel zone are extracted using the 2D elliptic equation, the elevations of the terrain cells are compared with those of the 3D partial Fresnel zone to calculate the 3D Fresnel index. The elevations of the upper and lower surfaces of the 3D partial Fresnel zone, which are located at the same point as each terrain cell, are calculated in order to obtain the 3D Fresnel index. The elevations of the upper and lower surfaces are obtained using the center X and Y coordinates of the terrain cells in Equation (5).
The 3D Fresnel index can be calculated in the following three cases. In the first case, the elevation of at least one cell among the m terrain cells that exist in the Fresnel zone is higher than that of the upper surface elevation of the 3D partial Fresnel zone. The 3D Fresnel index of a receiver has a value of zero, which indicates very low communications stability because the terrain is higher than the elevation of the 3D partial Fresnel zone. In the second case, the elevations of the m terrain cells that exist in the Fresnel zone do not exceed the upper surface elevation of the 3D partial Fresnel zone but exceed the lower surface elevation. In this case, after the ratio of the total volume of terrain cells included in the 3D partial Fresnel zone to the volume of the Fresnel zone is calculated, a value of one is subtracted from the result, and the final value is the 3D Fresnel index. The calculation indicates the percentage of empty space in the 3D partial Fresnel zone and quantitatively expresses the interference of the terrain on the LOS propagation. In the third case, the elevations of all m terrain cells that exist in the Fresnel zone do not exceed the lower surface elevation of the 3D partial Fresnel zone. In this case, the Fresnel index of a receiver is one, which indicates that the LOS propagation is stable.
FI i = { 0 Elev ( Cell j ) Elev ( US ) 1 Elev ( Cell j ) Elev ( LS ) 1 V ( Cell j ) V ( PF ) Elev ( LS ) < Elev ( Cell j ) < Elev ( US ) i = { 1 ,   2 , , n } ,   j = { 1 ,   2 ,   , m } ,  
V ( Cell j ) = { Elev ( Cell j ) Elev ( LS ) }   × Seg ( Cell j ) 2 ,
V ( PF ) =   1 2 × 4 3 { a 3 D · b 3 D 2 a 3 D · b 3 D · 0.6 · b 3 D } ,
where FI i is the 3D Fresnel index of the i-th receiver, Elev ( Cell j ) is the elevation of the j-th terrain cell included in the 3D Fresnel zone (m, above sea level), Elev ( US ) is the upper surface elevation of the 3D partial Fresnel zone (m, above sea level), Elev ( LS ) is the lower surface elevation of the 3D partial Fresnel zone (m, above sea level), V ( Cell j ) is the volume of the j-th terrain cell included in the 3D partial Fresnel zone, V ( PF ) is the volume of the 3D partial Fresnel zone ( m 3 ) , n is the number of receiver cells in a reception area, m is the number of terrain cells in the 3D Fresnel zone, and Seg ( Cell j ) is the resolution of a terrain cell (m). The 3D Fresnel index of a receiver is used to calculate the 3D visibility index (3DVI) as follows.
3 DVI i = { 0 FI i = 0 1 FI i > 0    i =   { 1 ,   2 , , n } ,  
where 3 DVI i is the 3D visibility index of the i-th receiver.
The 3D Fresnel index calculation is iterated until index values are assigned to every receiver cell in a reception area. A 3D Fresnel index map is then generated in which the calculated index values are assigned to a raster map. This map illustrates the stability of reception by the receiver cells in a reception area in which transmitters can be installed at any point. The number of maps generated is equal to the number of user designated transmitters in a transmitter map.

3.3. Analyzing Favorable Transmitter Combinations

As mentioned earlier, a 3D Fresnel index indicates the communications stability between a single transmitter cell and each receiver cell. To determine a favorable location for a transmitter in an open-pit mine, Fresnel index values of all receiver cells belonging to a reception area are summed for each candidate transmitter point. The favorability is ranked by considering the sum of the 3D Fresnel indices of every candidate transmitter point.
FI ( T 1 ) =   i = 1 n FI i ( T 1 ) ,
where FI ( T 1 ) is the sum of the 3D Fresnel index values of all receiver cells, which are calculated for the candidate point of transmitter No. 1, FI i ( T 1 ) is the 3D Fresnel index calculated in the i-th receiver cell in a reception area, and n is the number of receiver cells in a reception area.
When selecting a favorable combination of candidate transmitter points, every possible combination of candidate points is extracted according to the number of transmitters. Then, 3D Fresnel index maps of the candidate points included in the extracted cases are overlapped. The number of possible combinations of candidate points according to the number of transmitters can be calculated with Equation (18), and the 3D Fresnel index values of all cells constituting the overlapped 3D Fresnel index maps can be summed using Equations (19) and (20).
C x l =   l ! x ! · ( l x ) ! ,
FI i ( Max ) = Maximum { FI i ( T 1 ) , FI i ( T 2 ) ,   ,   FI i ( T l ) } ,
FI ( All ) =   i = 1 n FI i ( Max ) ,
where C x l is the number of possible combinations of candidate points for the number of transmitters, x is the number of transmitter combinations, l is the number of candidate points for installing transmitters, FI i ( Max ) is the maximum value of the 3D Fresnel index values of the i-th receiver cell, FI ( All ) is the sum of the 3D Fresnel index values of all receiver cells in a reception area of the overlapped 3D Fresnel index maps, FI i ( T k ) is the 3D Fresnel index of the i-th receiver cell in a 3D Fresnel index map created for the k-th candidate location of transmitters, and n is the number of receiver cells. Figure 4 is an example illustrating generation of the 3D Fresnel index overlay map. If the sum of the 3D Fresnel index values is high, the location can be considered favorable.

4. Application

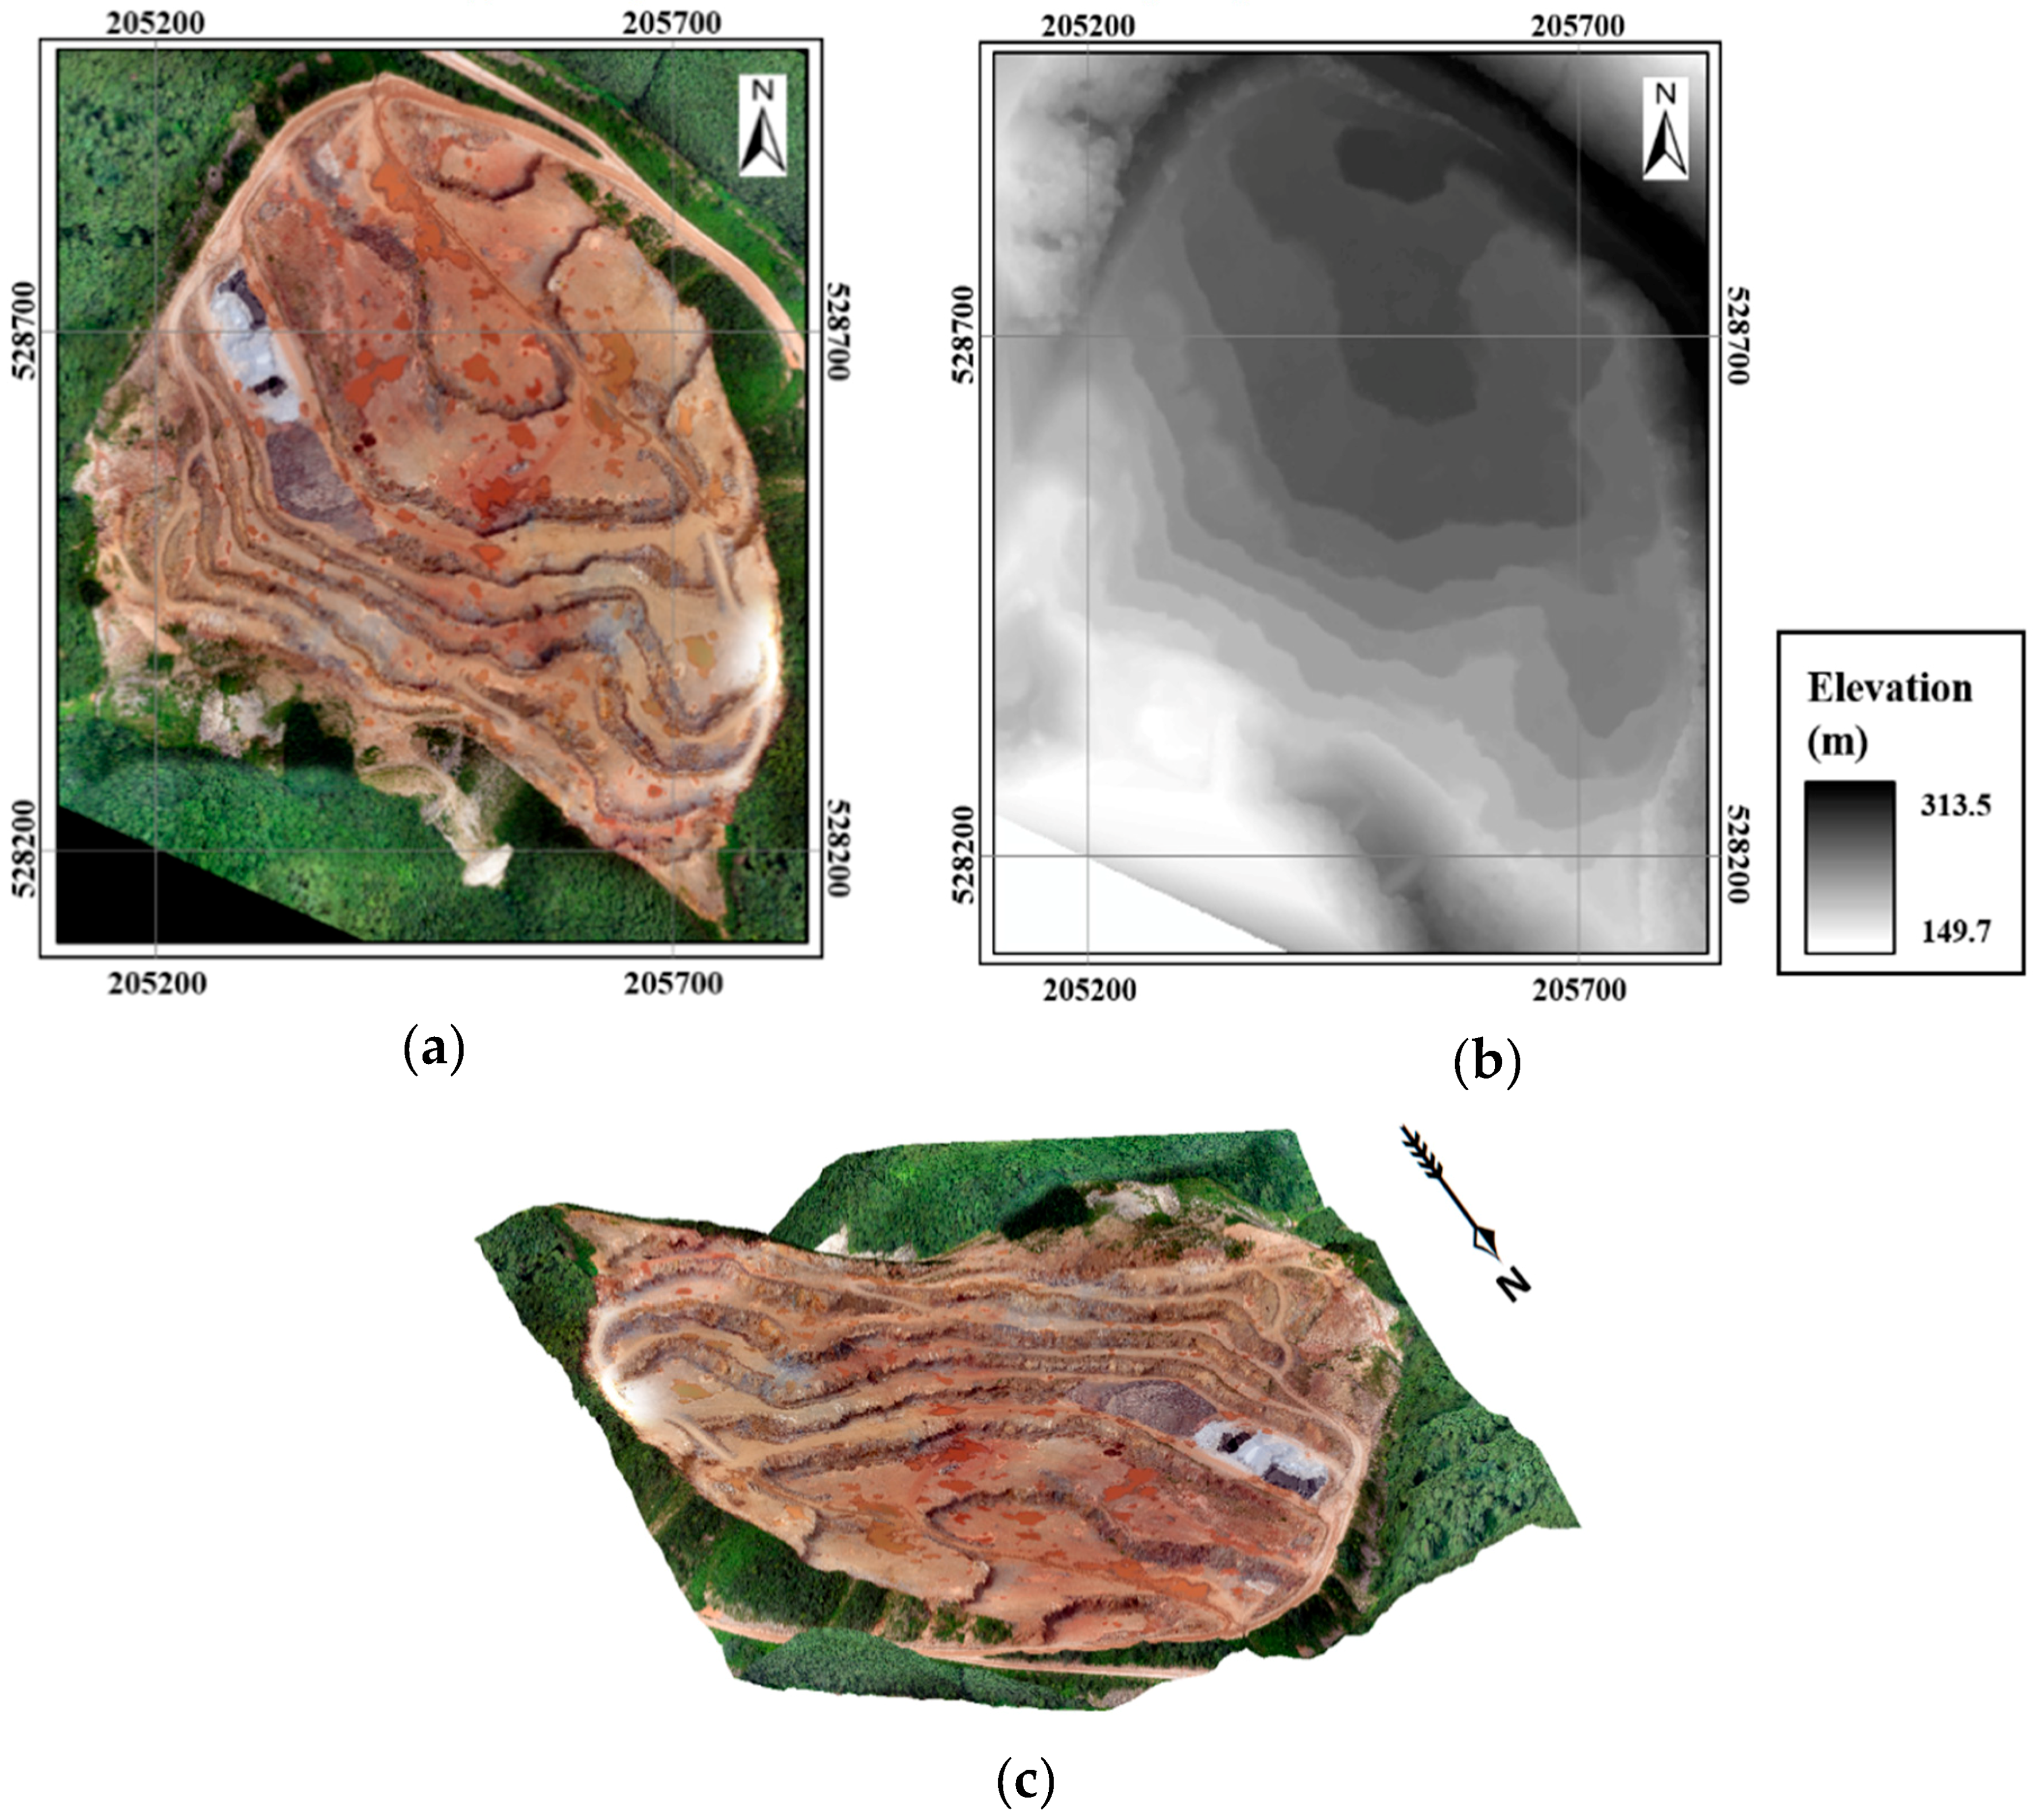
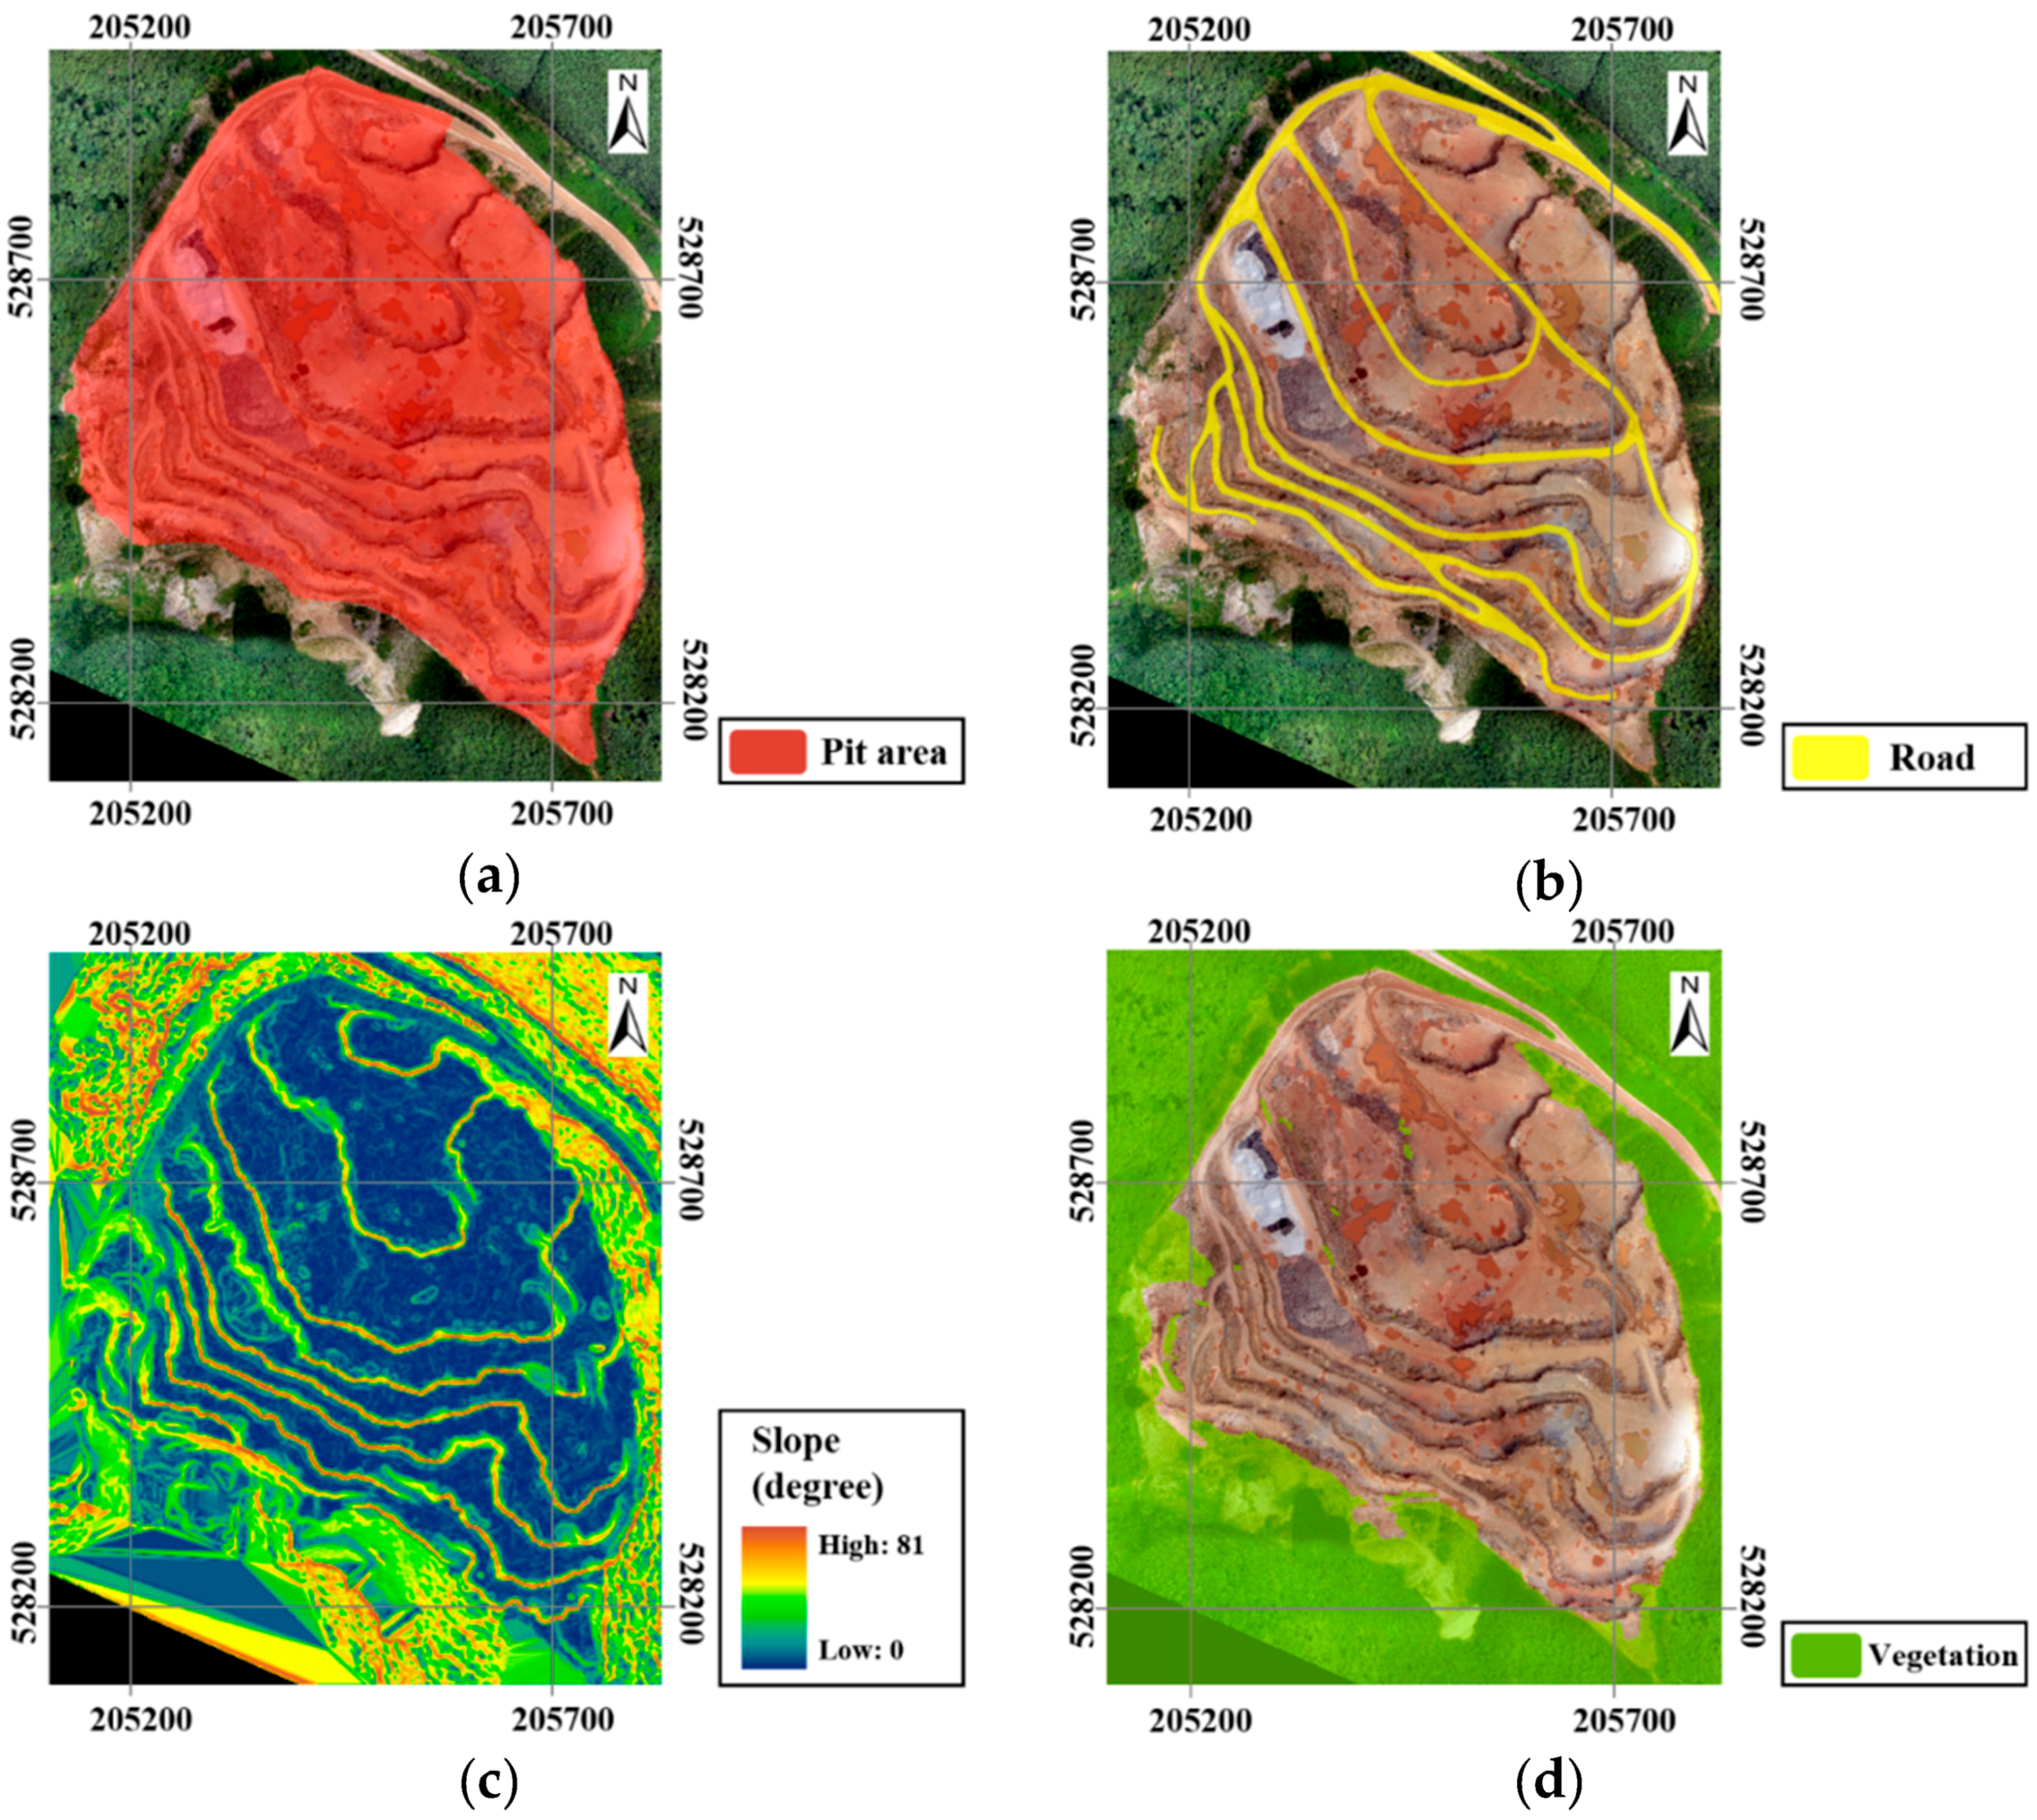
4.1. Study Area and Data

The proposed algorithm was applied to a currently operating open-pit mine to quantitatively analyze the communications stability of the mining site and to determine a favorable combination of transmitter points. The study area was the Singi office of SsangYong Resource Development in Samcheok-si, Gangwon-do, Korea (37°21′33′′ N, 129°3′4′′ E) (see Figure 5). In this mine, low quality limestone is mined for cement production, and in 2015, a total of 7.87 Mt of limestone was mined. The size of the study area was about 726 × 866 m, the highest and lowest elevations were about 297 m and about 192 m, respectively, and the depth of the open-pit was about 100 m.
To acquire the necessary topographical data for the mine, the study area was surveyed using an eBee (Sensefly, Lausanne, Switzerland), which is a fixed-wing drone. The results of the survey were used to produce an orthographic image with a resolution of 8.6 cm, and then a DSM with 2 m resolution was formed by resampling the images (Figure 5). Three thematic layers—specifically, pit area, road, and vegetation—were generated from the orthographic image via manual screen digitization. The slope layer was automatically generated from the DSM using GIS (see Figure 6).

4.2. Result of Selecting Transmitter Candidates

Candidate transmitter points were selected by considering the possibility of additional blasting, roads for transportation, terrain gradients, and vegetation conditions in the study area. As there was likely to be additional development and blasting in the future, candidate points were not selected inside the boundary of the mining site, but were selected within a 10 m buffer zone outside the boundary. A total of 6020 points on a 2 × 2 m grid were selected within the buffer zone, polylines were formed along the roads both inside and outside the mining site, and seven points that were on roads were excluded. As for the terrain gradient of the study area, 5480 points with gradient steeper than 5° were excluded. Points where vegetation was present within a 5 m radius in the direction of signal propagation were also excluded by visual inspection. In total, 352 points were excluded. A total of 181 points were grouped according to regions to form 15 clusters (Figure 7a). The integrate function in the GIS application was utilized to select one representative cluster from the candidate clusters. In GIS applications, the integrate function extracts a new representative point from the input data within a tolerance specified by a user. Here, tolerances of 10 and 15 m were set to extract candidate representative points of 15 clusters. In the end, a total of 15 candidate transmitter points were extracted (Figure 7b).

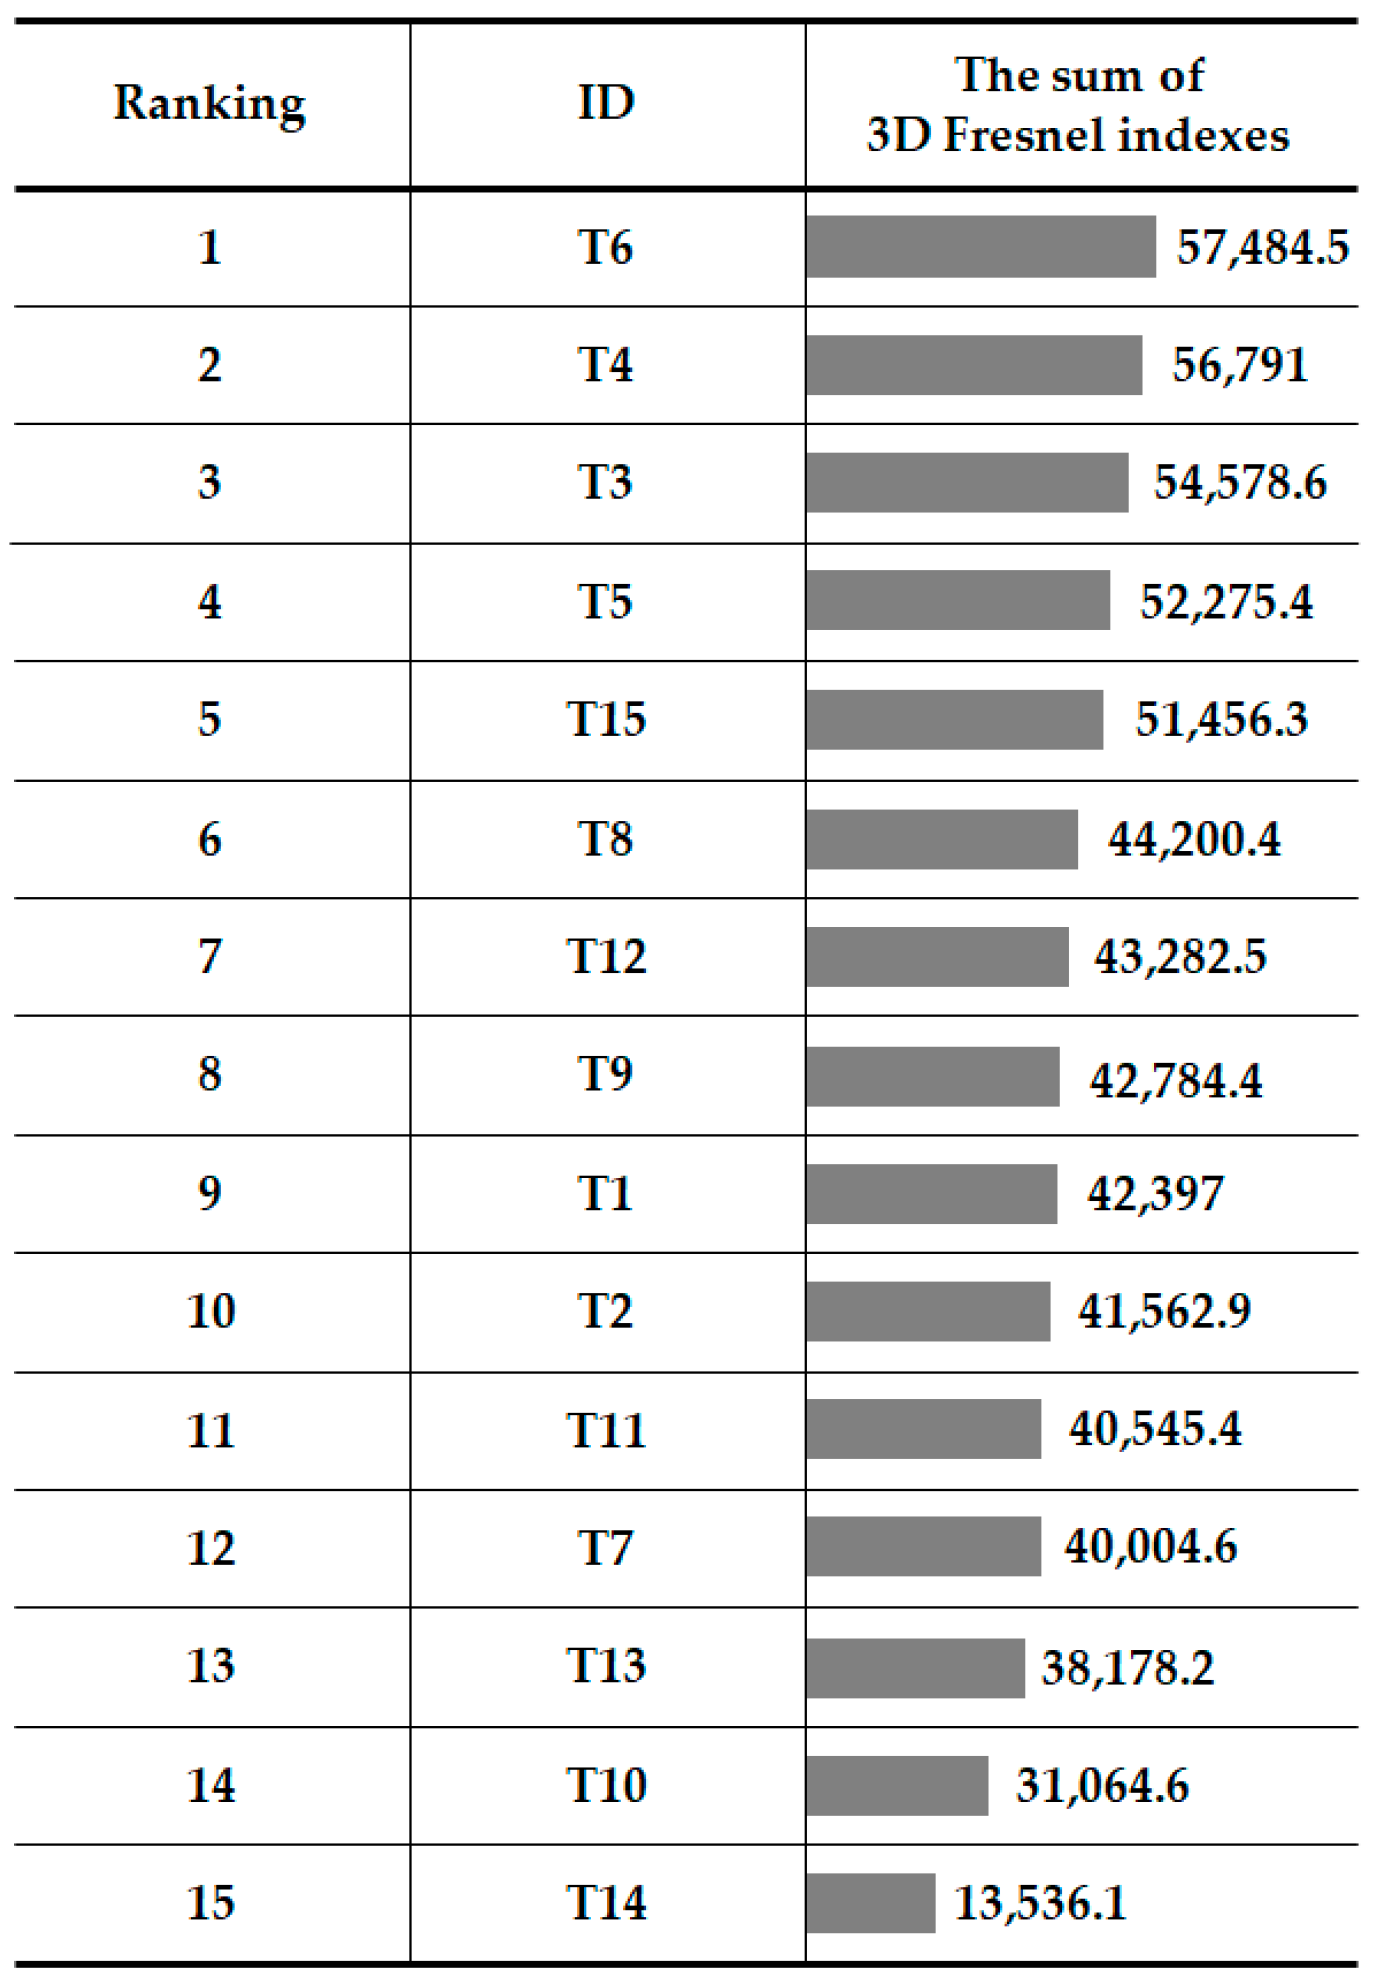
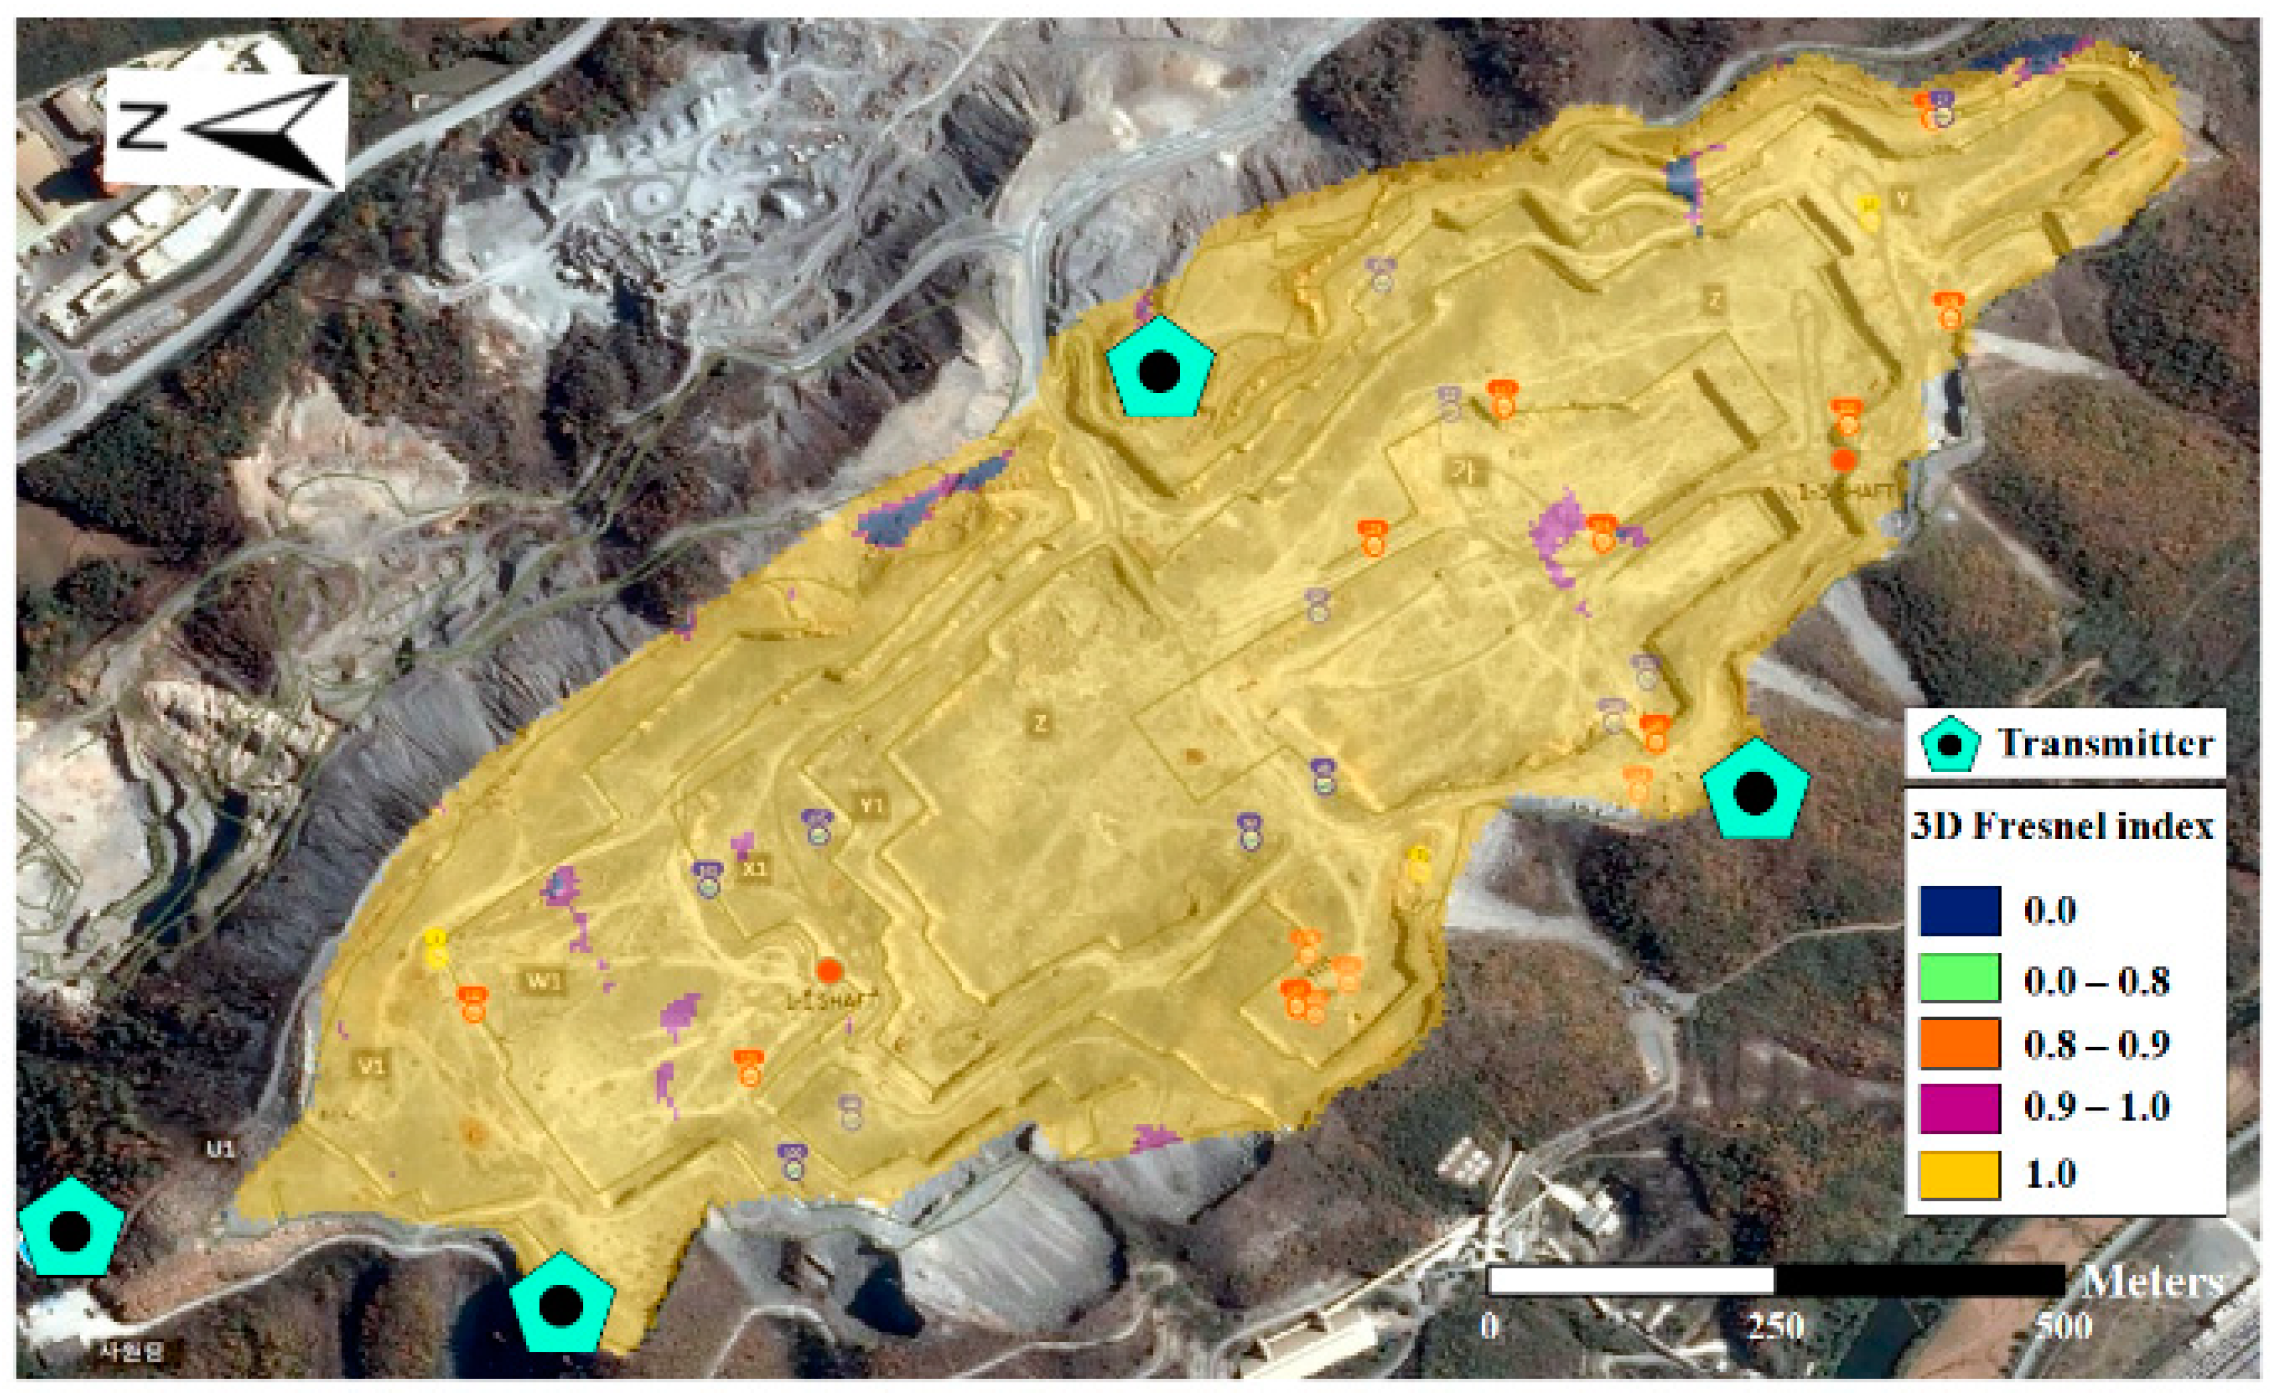
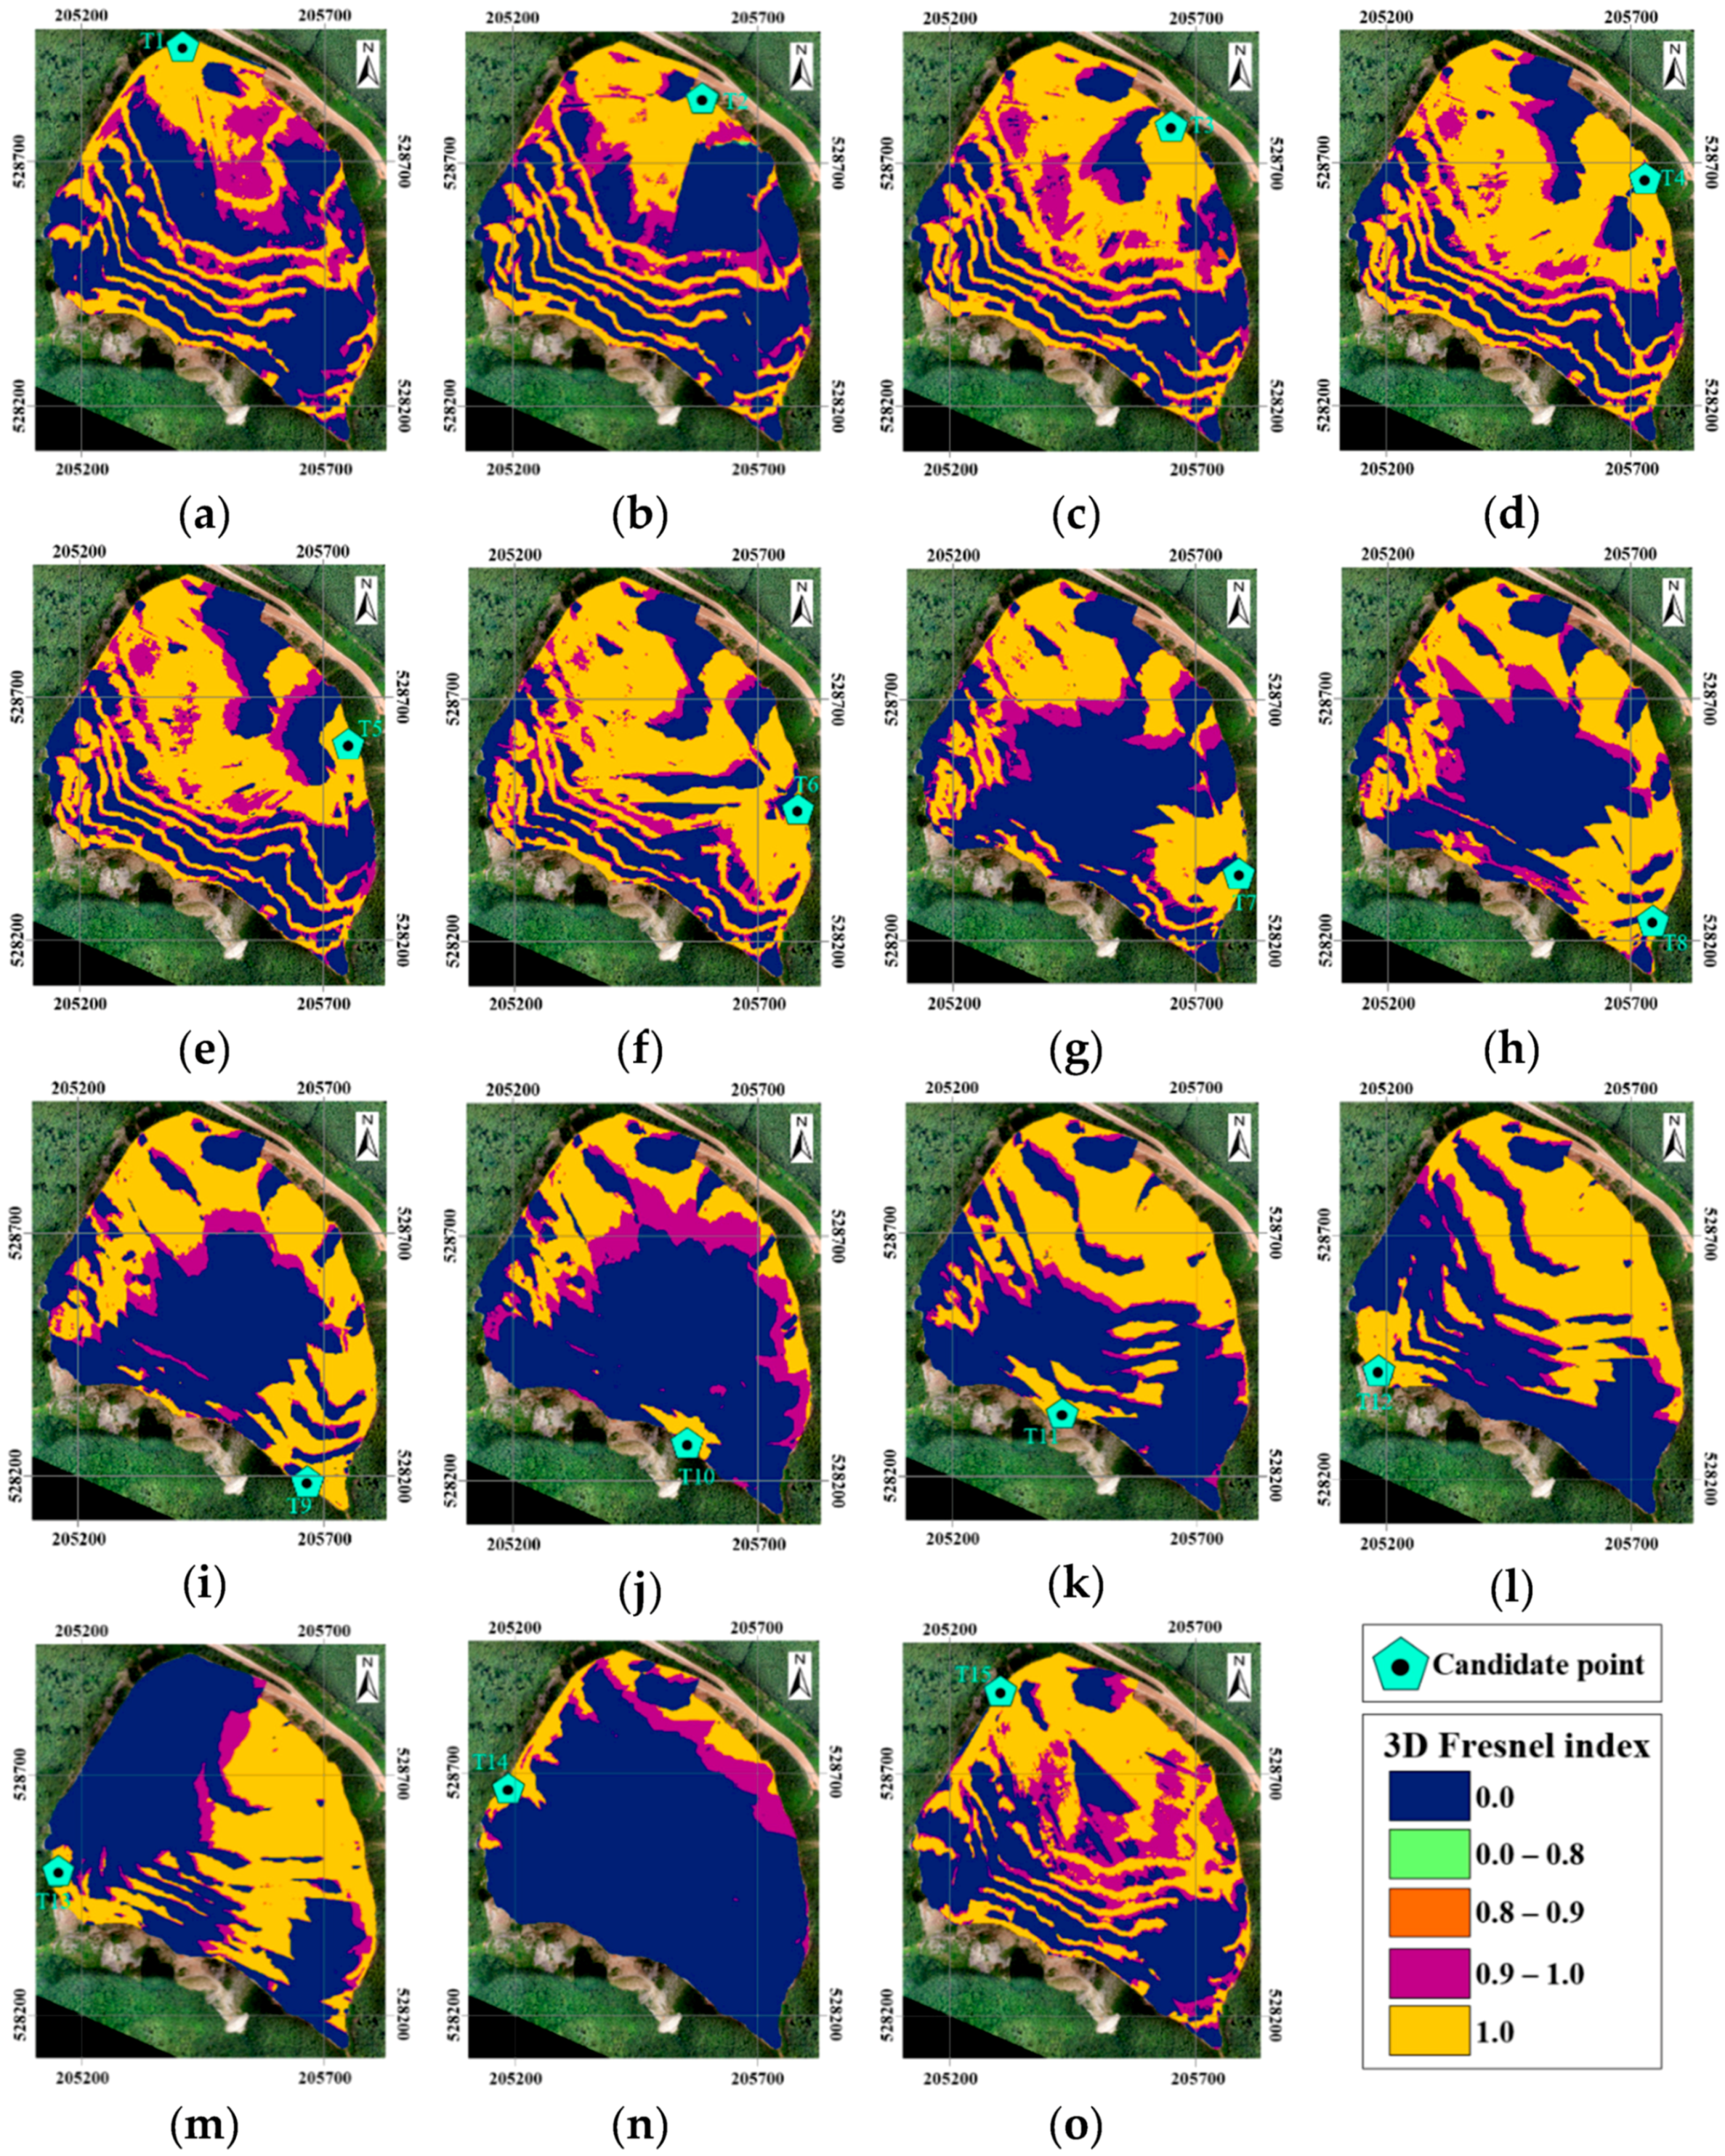
4.3. Result of Generating 3D Fresnel Index Maps

The communications stability at the open-pit mine was calculated by analyzing the 3D Fresnel zone under the assumption that 15 transmitters were installed. For the analysis, transmitter maps were fabricated that indicated 15 candidate transmitter points. A receiver map was also formed that restricted the reception area to be within the boundary of the mining site. In addition, the heights of the transmitters and receivers were assumed to be 10 and 2 m, respectively. The frequency band in the analysis was chosen to be 900 MHz (wavelength: 0.333 m) as this is typically used in Korean open-pit mines.
The 3D Fresnel index maps for the 15 candidate transmitter points that were obtained via the 3D Fresnel zone analysis are shown in Figure 8. On the maps, the 3D Fresnel index values can be classified into three cases. The index in the first case was zero as some terrain was higher than the 3D partial Fresnel zone, which indicates unstable LOS propagation. In the two remaining cases, the index was between zero and one, which means that while communications are possible, some terrain inside the 3D partial Fresnel zone will cause signals to be reflected, thereby causing unstable LOS propagation. If the index for any cell is 0.9, it indicates that clear space makes up about 90% of the 3D partial Fresnel zone and the LOS propagation stability is calculated to be about 90%. The remaining 10% of the zone is affected by the terrain. When the index is one, it indicates there is no terrain inside the 3D partial Fresnel zone. Based on these results, LOS propagation is considered to be stable and signals are consistently received in each cell.
For every cell in the 3D Fresnel index map, after the index values were summed, the candidate locations of the transmitters were ranked (Figure 9). Upon review, candidate transmitter point 6 was found to have the largest aggregate 3D Fresnel index, while point 14 had the lowest value. Accordingly, if a single transmitter is installed in the mining site, the best performance will be achieved by installing it at point 6.

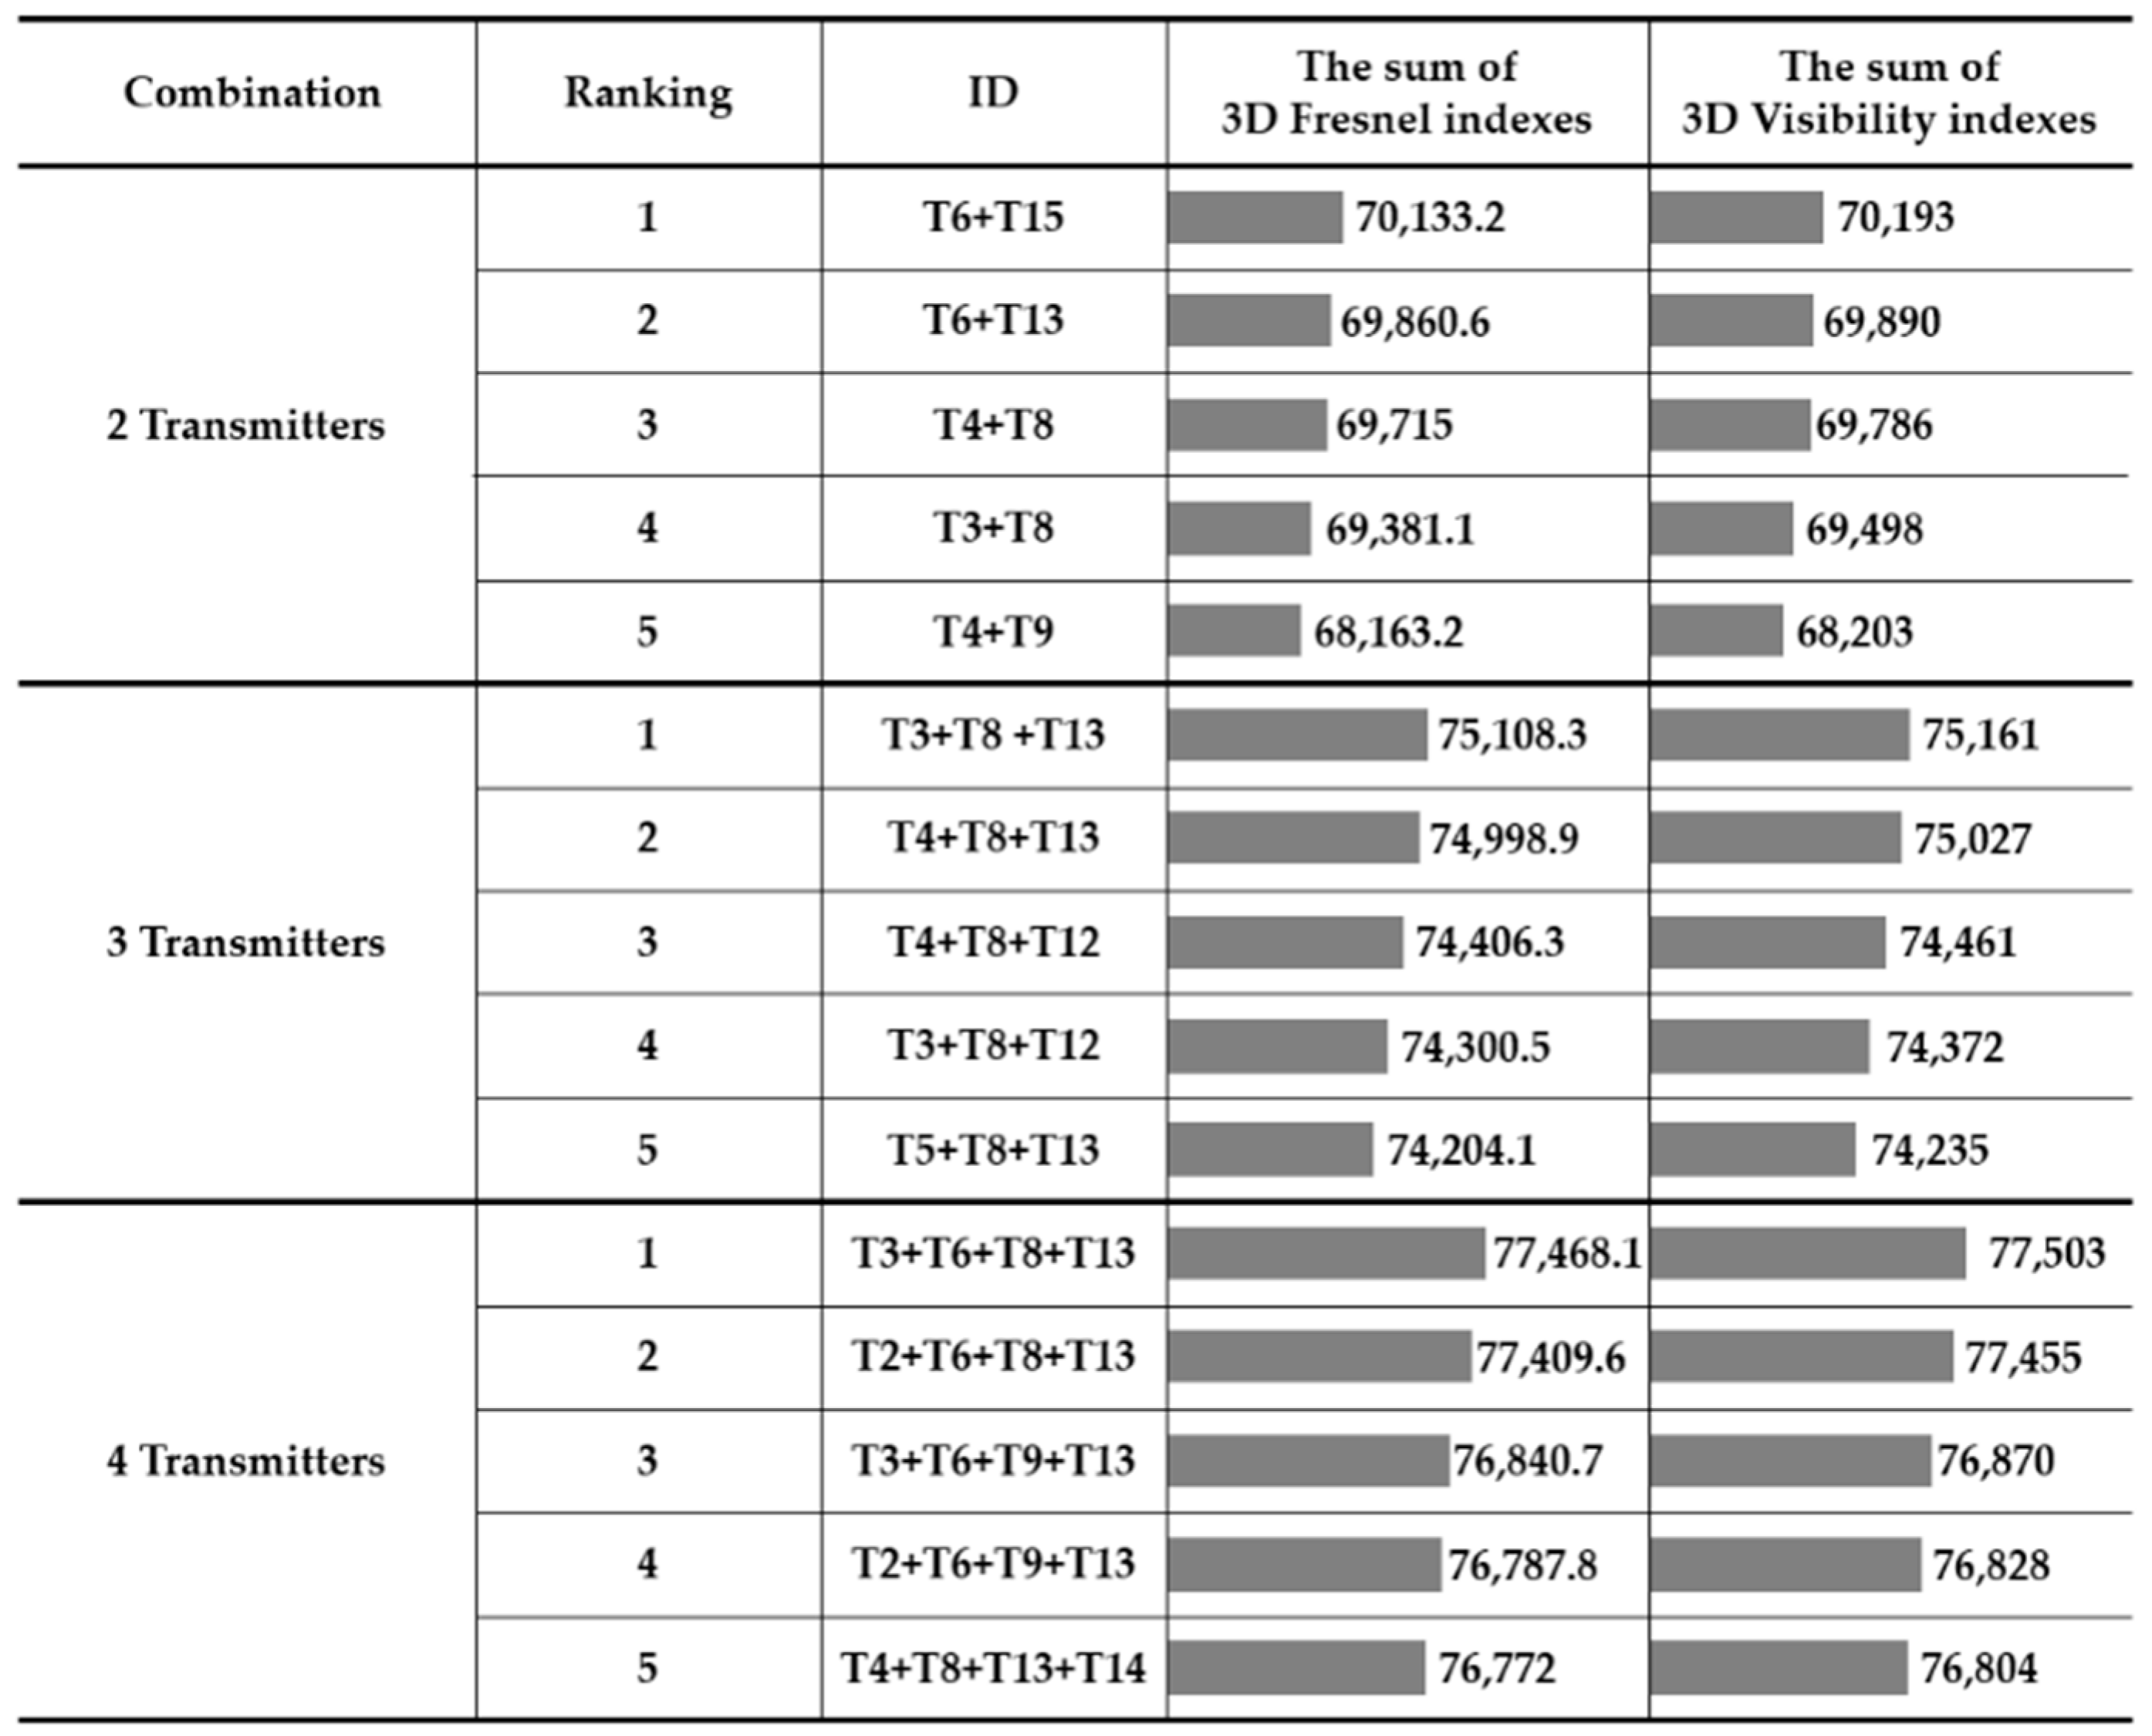
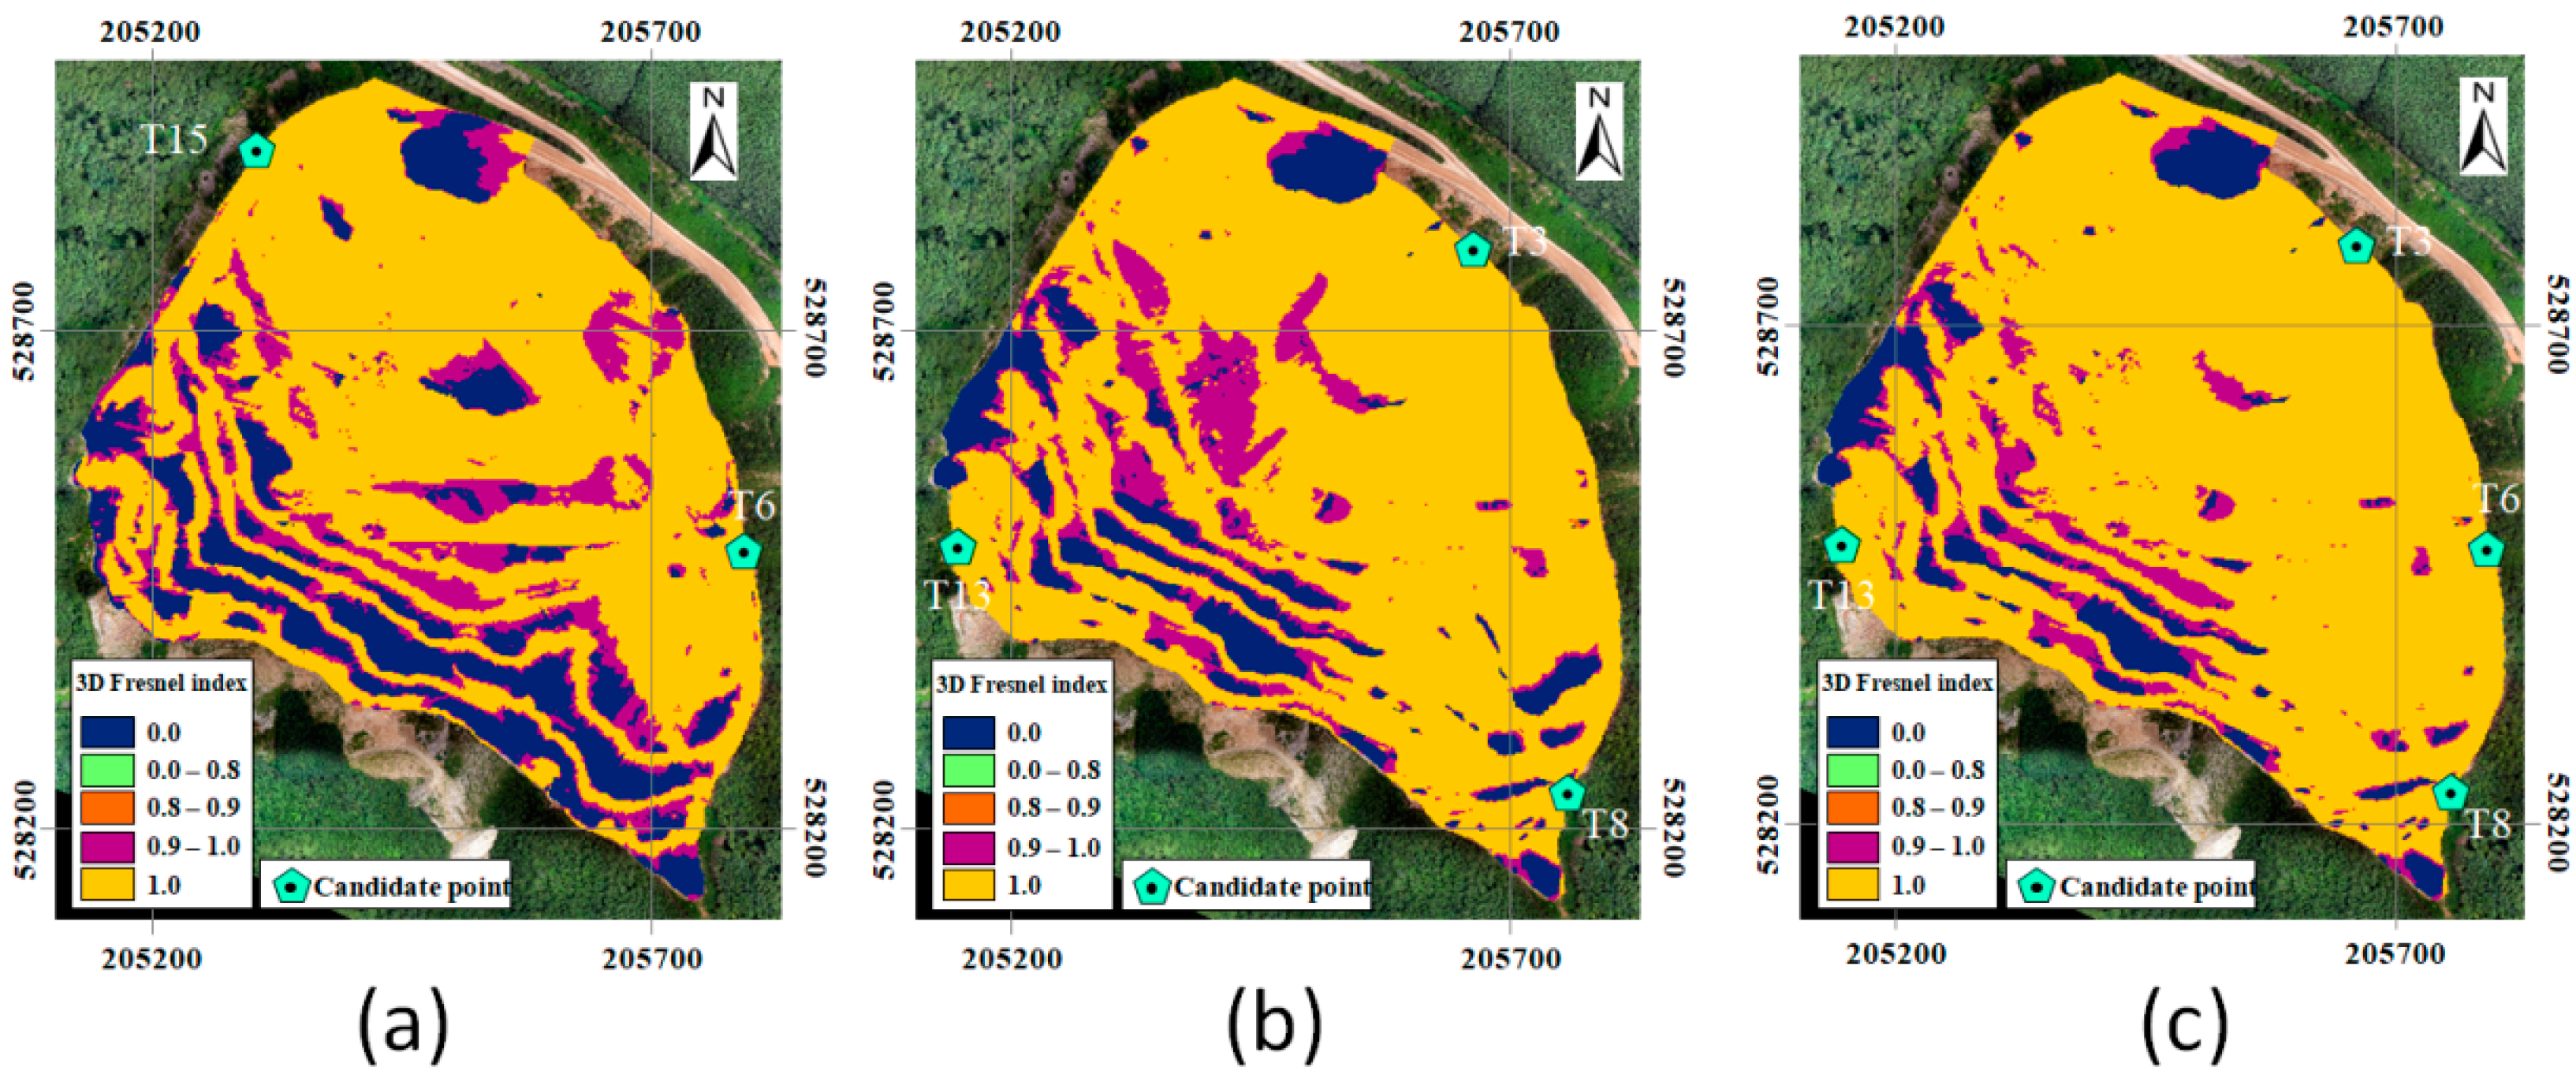
4.4. Result of Analyzing the Favorable Transmitter Combinations

For the 15 candidate transmitter points, favorable combinations of two, three, and four transmitters were identified. When two transmitters were evaluated, the number of available cases was 105. In contrast, when three and four transmitters were used, the numbers of available cases was 455 and 1365, respectively. Three-dimensional Fresnel index overlay maps were prepared for all possible combinations, and the 3D Fresnel index values of all of the cells constituting the maps were summed.
The top five transmitter combinations for cases of two, three, and four transmitter combinations are shown in Figure 10. When two transmitters were evaluated, the sum of the 3D Fresnel indices was analyzed to be 70,133.2 from the combination of candidate points 6 and 15. In the case of four transmitters, the combination of candidate points 3, 6, 8, and 13 provided the sum of the 3D Fresnel index values of 77,468.1. When the candidate transmitter points were ranked according to the sum of 3D visibility index values, these results did not affect the rank. It should be noted that the differences between the sums of 3D Fresnel index values and those of 3D visibility index values are small because the cells where the 3D visibility index value is one mostly have the 3D Fresnel index value larger than 0.9.
The 3D Fresnel index overlay maps based on the top results for transmitter combinations determined according to the number of combined transmitters are shown in Figure 11. In Figure 11c, it can be seen that cells with indices of one were capable of stable communications with four transmitters while other cells with an index of zero were not able to communicate with any of the four installed transmitters. In the cases of cells with indices between zero and one, these exhibited unstable LOS propagation due to adverse topographical features.

5. Discussion

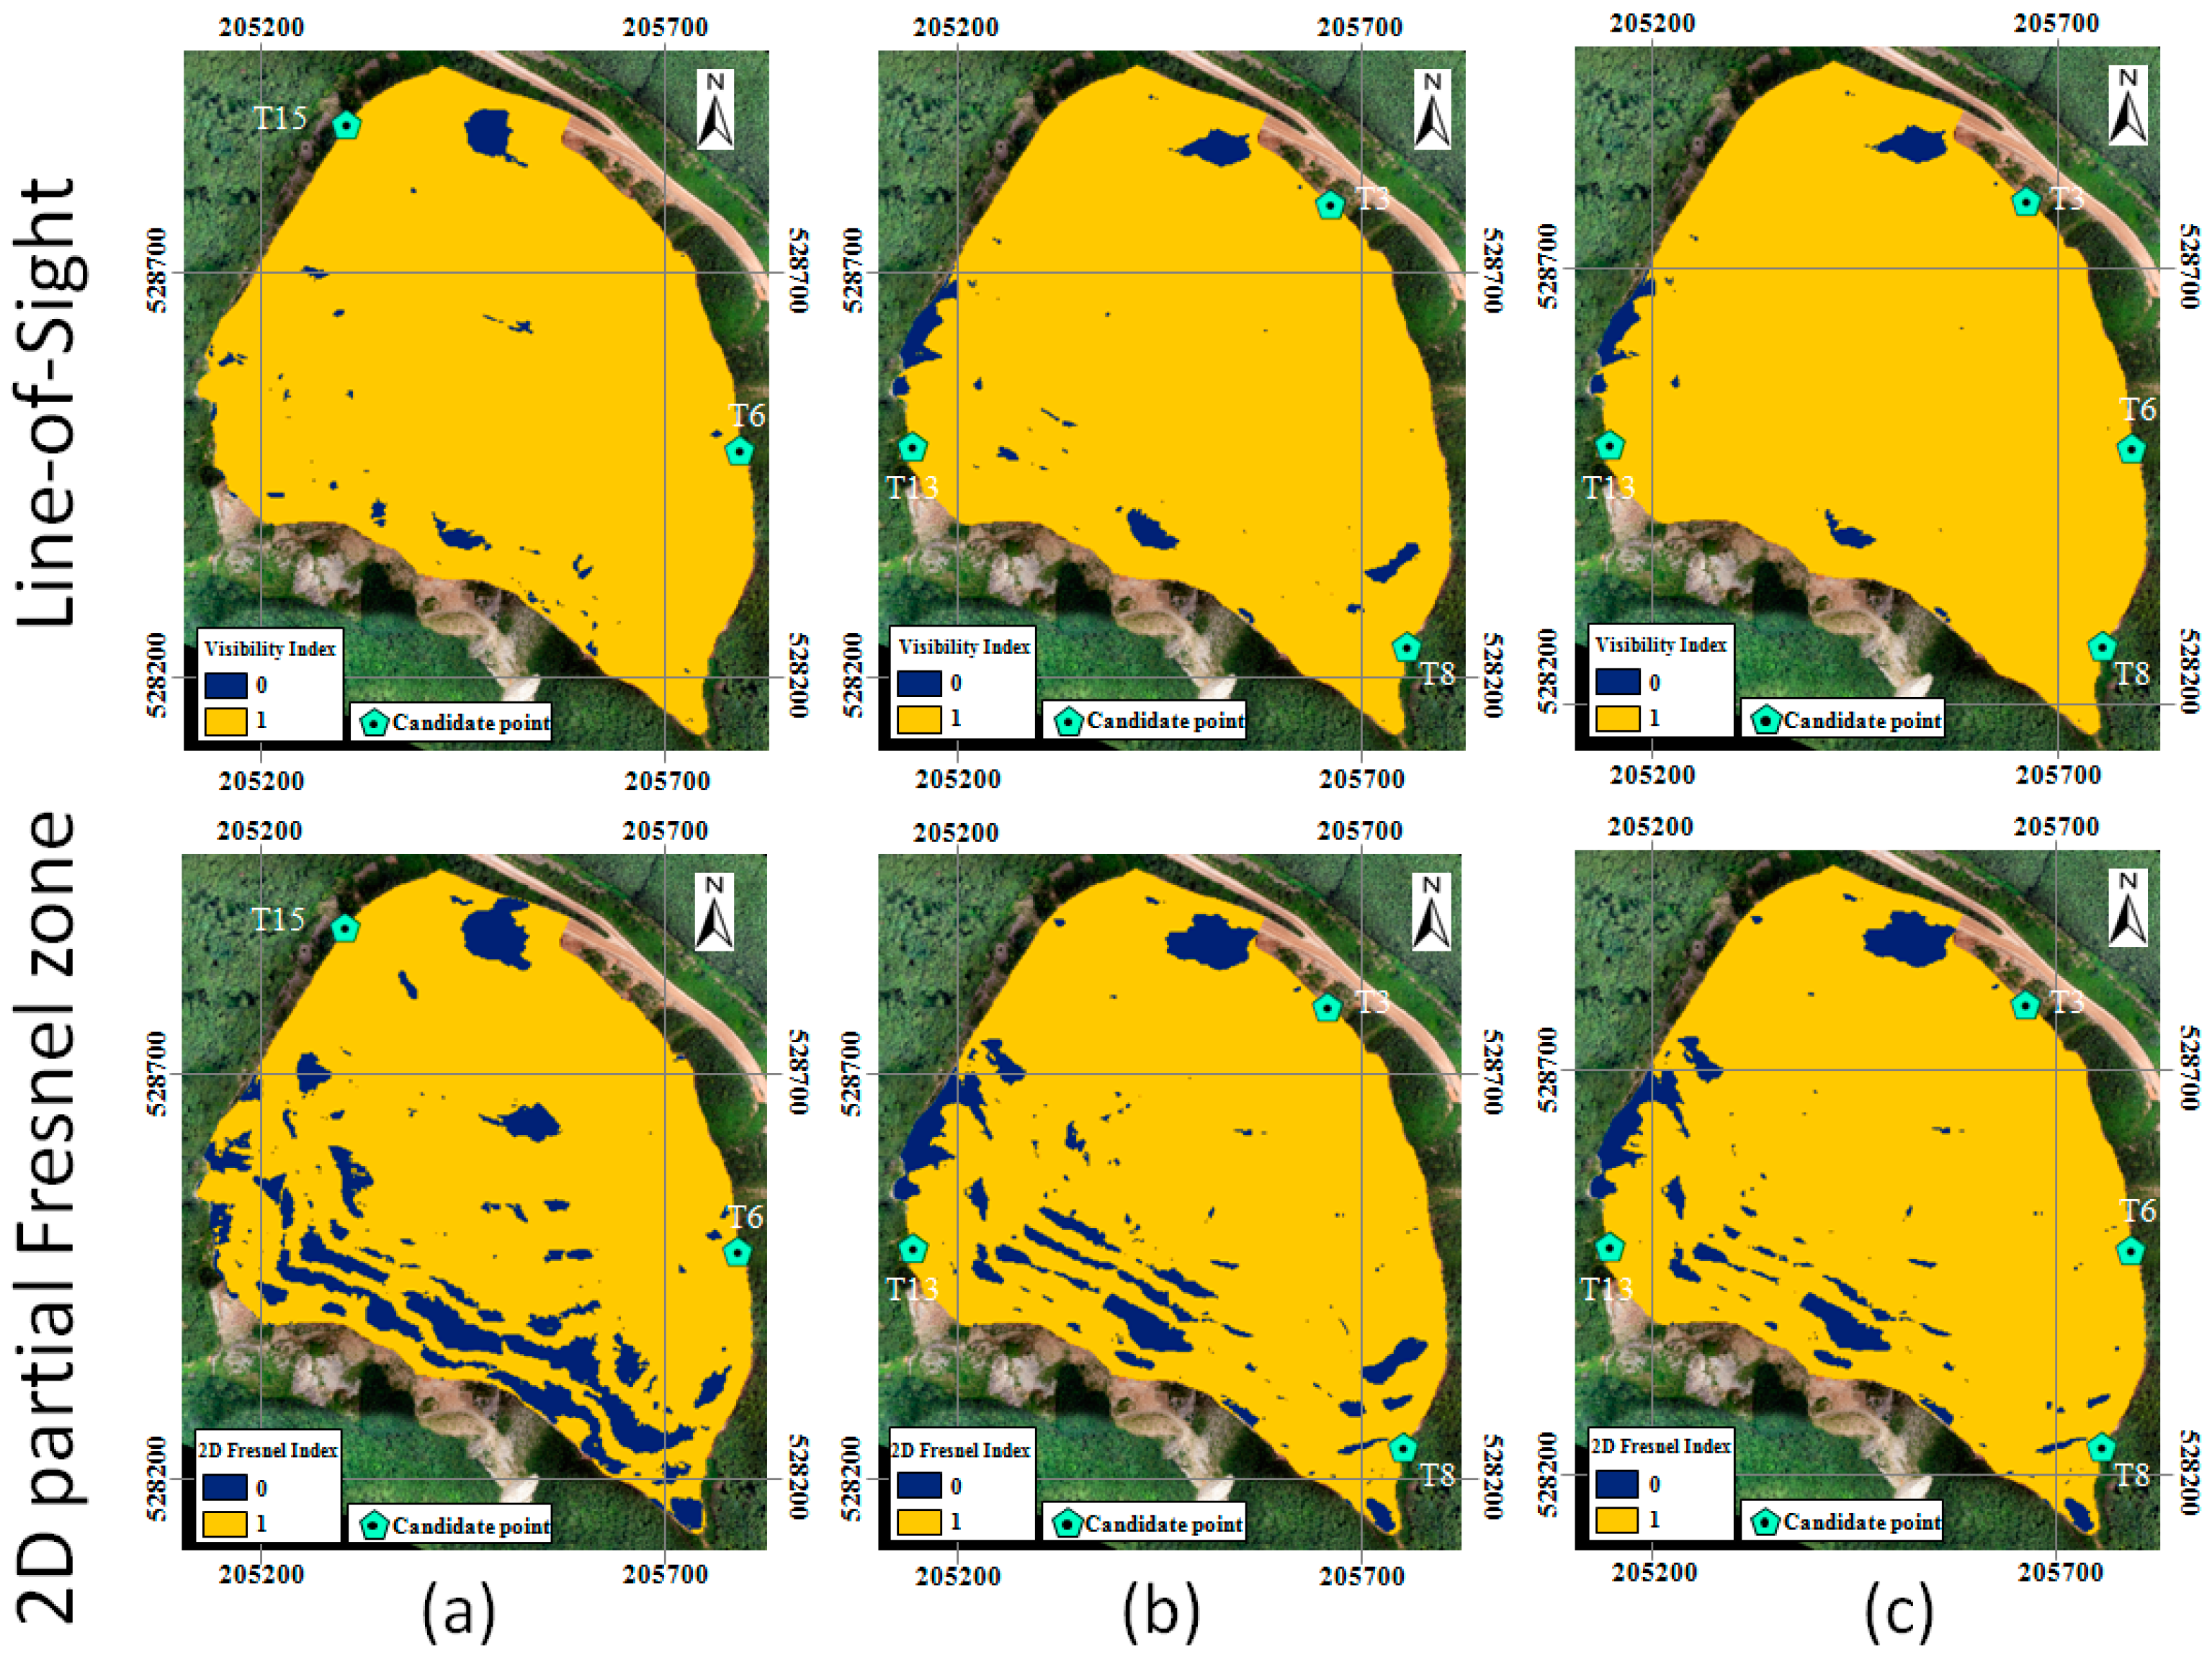
5.1. Comparison with Existing Algorithms Based on LOS and 2D Partial Fresnel Zone Analyses

Visibility and 2D Fresnel index overlay maps were generated from the same data utilized above using existing algorithms based on LOS and 2D Fresnel zone analyses (Figure 12). Those maps indicated only the possibility (one)/impossibility (zero) of communications. In addition, existing algorithms only consider vertical terrain cells included in the LOS and 2D Fresnel zones. Because the proposed algorithm considers all horizontal and vertical terrain cells included in the 3D partial Fresnel zones, it could provide more precise Fresnel index overlay maps (Figure 11) for the favorable transmitter candidate combinations than existing algorithms.

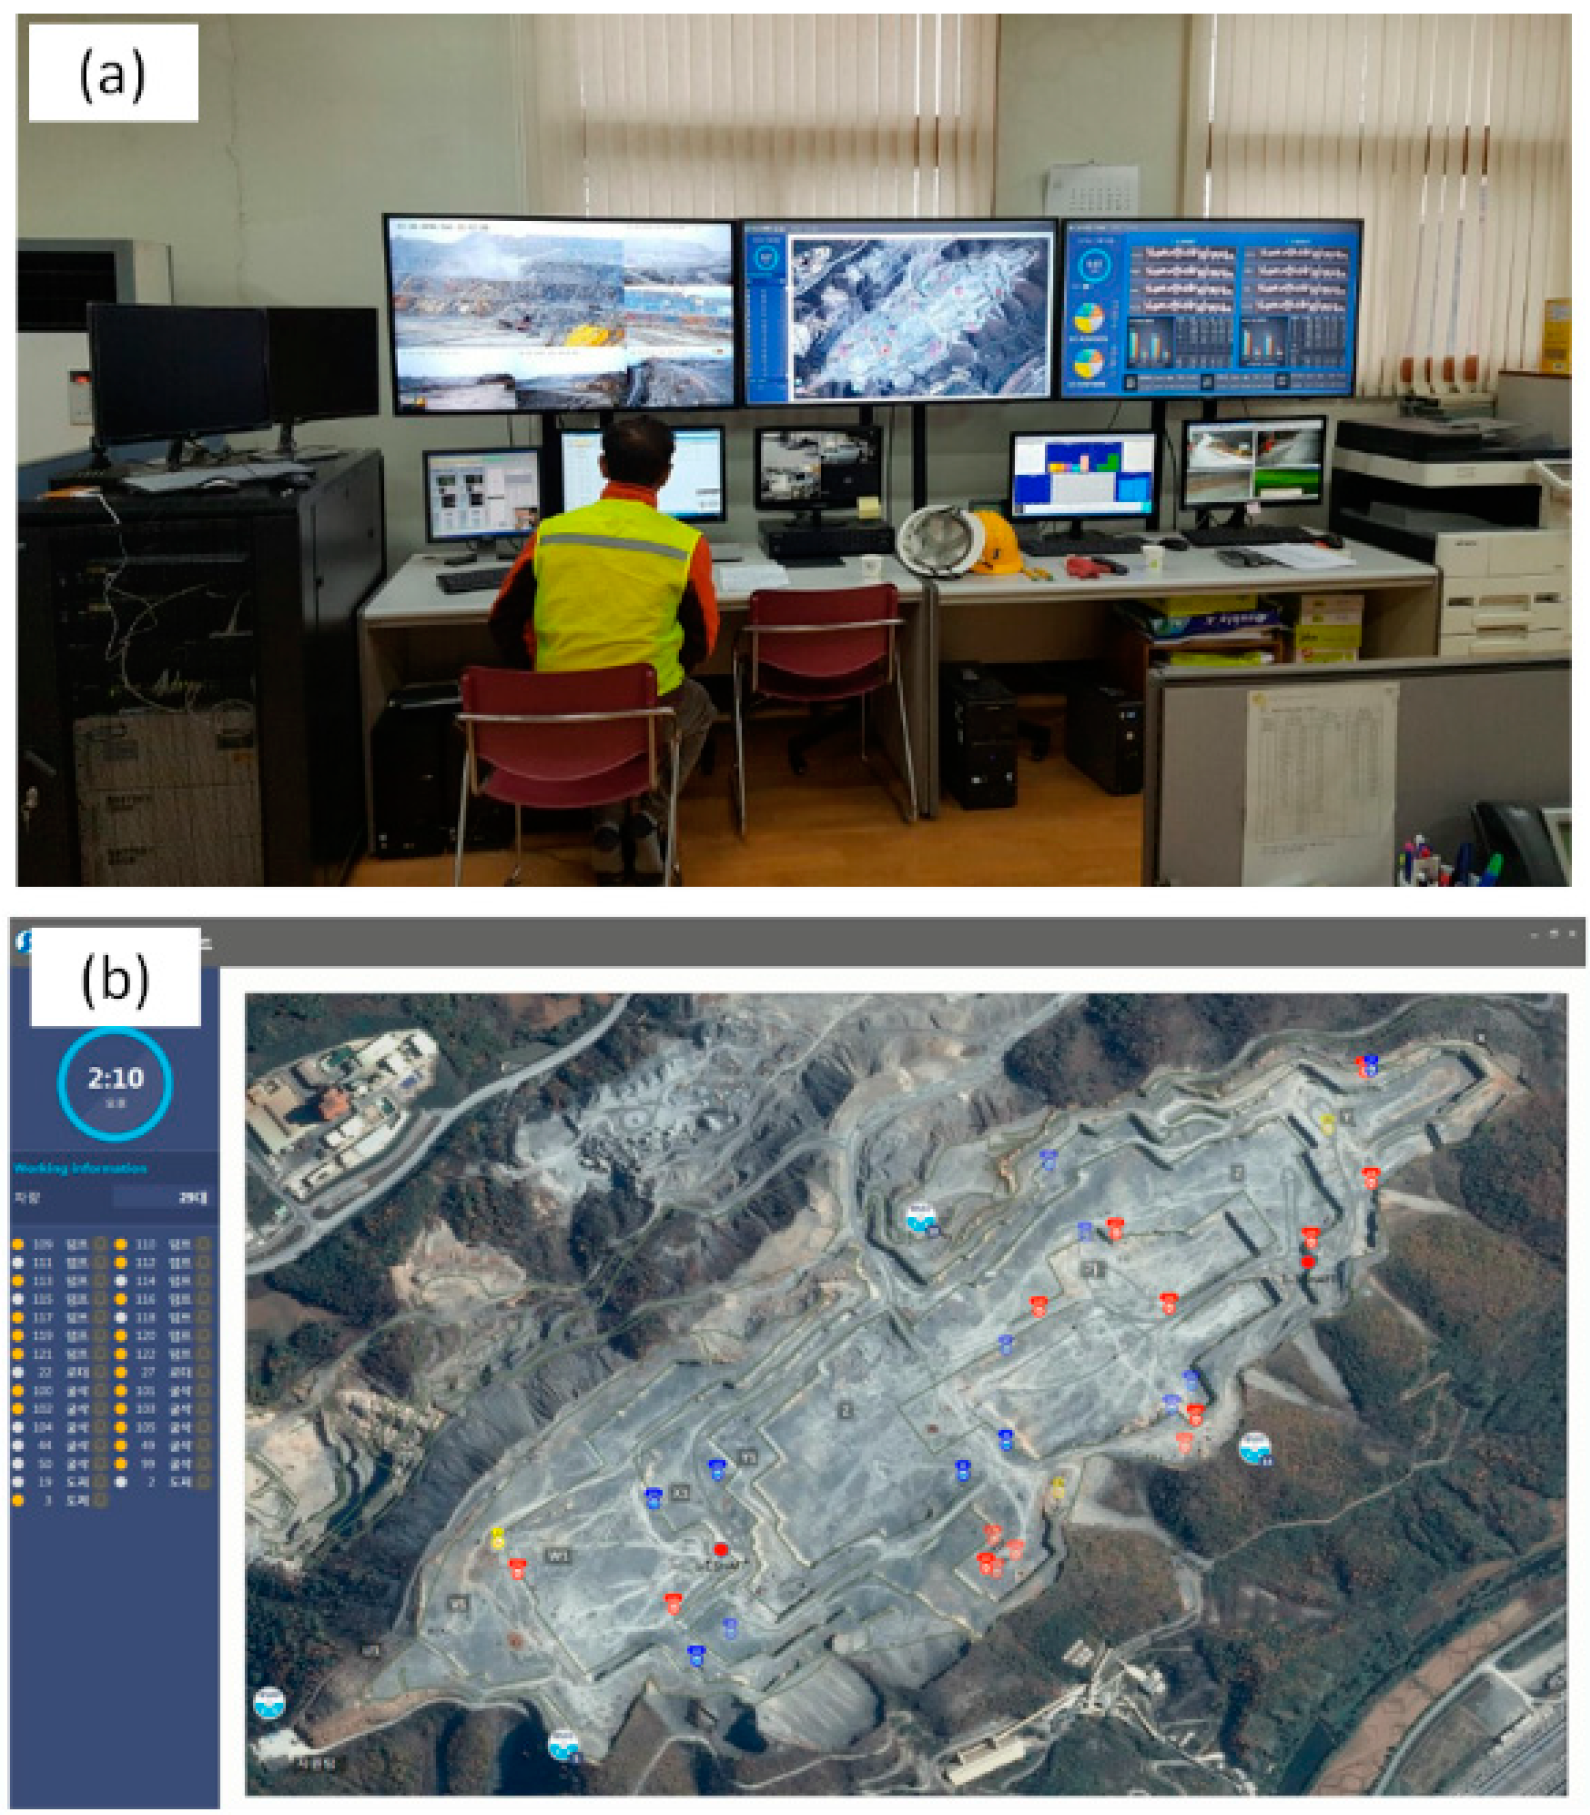
5.2. Site Acceptance Test

The proposed algorithm was also applied to an open-pit limestone mine (Hanil Cement Co., Ltd., in Danyang-gun, Chungcheong buk-do, Korea, 37°01′58′′ N, 128°19′52′′ E), where a wireless communications system was already installed and has been used for fleet management of mine equipment. Figure 13 shows the control center of the mine and the main dashboard that displays the movement of mine equipment in real time. Four transmitters with a frequency band of 900 MHz and 10 m height were installed in the mine site based on empirical judgments of both mining and radio communications experts and field tests to qualitatively calculate the overall coverage area.
Figure 14 shows the 3D Fresnel index overlay map for the four transmitters generated by the proposed algorithm. Most parts of the mine have a 3D Fresnel index higher than zero. However, there are a few parts with shadow areas where the 3D Fresnel index is zero. Field surveying showed that these areas with a 3D Fresnel index of zero are located on the pit slope and are not used as a part of the moving route of mine equipment. From this point of view, the initial transmitter layout design determined by the new algorithm is acceptable in terms of providing reasonable information on the coverage area of transmitters.

6. Conclusions

In this paper, a GIS-based algorithm was proposed to support the initial design of a wireless communications system in open-pit mines. The proposed algorithm identifies multiple candidate transmitter points in an open-pit mining site while considering possible future development, road, vegetation, and terrain gradient conditions. Communication viewshed analysis based on the 3D partial Fresnel zone was conducted for all selected candidate points in order to calculate the 3D Fresnel indices. Subsequently, the initial design of the transmitter layout was then determined based on the 3D Fresnel indices, which were calculated for all candidate transmitter locations. The proposed algorithm was also applied to an operational open-pit mine. The 3D Fresnel indices for 15 candidate transmitter points in the mining site were quantitatively calculated, and favorable combinations of two, three, and four transmitters were evaluated by overlapping the 3D Fresnel index maps.
The GIS-based algorithm proposed in this paper can provide an initial transmitter layout design in advance and allow for field tests to be conducted based on the results. In this way, the effectiveness of the layout can be verified. In addition, this algorithm can be used to design initial transmitter layouts for construction sites, which are often in remote locations and require reliable wireless communications networks.
In this study, the stability of the LOS propagation was evaluated by considering the influence of obstacles in the 3D partial Fresnel zone formed between the transmitter and the receiver. This allowed analysis of the favorable transmitter placement in the open pit mine. Sometimes, in real applications, even with no obstacles in the Fresnel zone, communication is not possible between the transmitter and the receiver owing to attenuation of the wireless channel. In contrast, communication is still possible when there is no LOS between the transmitter and the receiver, especially in the ultra-high frequency (UHF) range, through the phenomenon of diffraction. Additionally, many factors affect communication stability, including reflections from surfaces and network capacity. Therefore, further studies are required in order to implement an advanced transmitter layout optimization algorithm that considers the aspects listed above.

Author Contributions

Y.C. conceived and designed the experiments; J.B. performed the experiments; J.B. and Y.C. analyzed the data; Y.C. contributed reagents/materials/analysis tools; J.B. and Y.C. wrote the paper.

Funding

This work was supported by (1) a KETEP grant funded by the Korea Government’s Ministry of Trade, Industry and Energy (Project No. 20182510102370) and (2) the Korea Energy and Mineral Resources Engineering Program funded by the Ministry of Trade, Industry and Energy.

Acknowledgments

The authors thank Gaphyeon Kwon and the anonymous peer reviewers, who provided useful comments that significantly improved our analysis and the final paper.

Conflicts of Interest

The authors declare no conflict of interest.

References

  1. Durrant-Whyte, H.; Geraghty, R.; Pujol, F.; Sellschop, R. Mining’s Next Performance Horizon: Capturing Productivity Gains from Innovation. Available online: https://www.mckinsey.com/~/media/mckinsey/dotcom/client_service/metals%20and%20mining/pdfs/minings_next_performance_horizon.ashx (accessed on 30 May 2018).
  2. Baek, J.; Choi, Y.; Park, H. Uncertainty Representation Method for Open Pit Optimization Results Due to Variation in Mineral Prices. Minerals 2016, 6, 17. [Google Scholar] [CrossRef]
  3. Baek, J.; Choi, Y. A New Method for Haul Road Design in Open-pit Mines to Support Efficient Truck Haulage Operations. Appl. Sci. 2017, 7, 747. [Google Scholar] [CrossRef]
  4. Baek, J.; Choi, Y.; Lee, C.; Suh, J.; Lee, S. BBUNS: Bluetooth Beacon-Based Underground Navigation System to Support Mine Haulage Operations. Minerals 2017, 7, 228. [Google Scholar] [CrossRef]
  5. World Economic Forum. Digital Transformation Initiative Mining and Metals Industry. Available online: http://reports.weforum.org/digital-transformation/wp-content/blogs.dir/94/mp/files/pages/files/wef-dti-mining-and-metals-white-paper.pdf (accessed on 30 May 2018).
  6. Modular Mining Systems’ DISPATCH. Available online: http://www.modularmining.com/product/dispatch-underground/ (accessed on 30 May 2018).
  7. Hexagon Mining’s Jtruck. Available online: http://hexagonmining.com/products/all-products/jtruck/ (accessed on 30 May 2018).
  8. Mine Site Technologies’ Asset Tracking System. Available online: http://mstglobal.com/solutions/asset-people-tracking/underground-hard-rock/ (accessed on 30 May 2018).
  9. MISOM Technologies’ FARA (Field Analysis & Reporting Application). Available online: http://misom.com/applications/fara/ (accessed on 30 May 2018).
  10. Minlog’s MineSuite Fleet Management System. Available online: http://www.minlog.com/minesuite/ (accessed on 01 November 2018).
  11. Hexagon Mining’s Jigsaw Operations Suite. Available online: http://hexagonmining.com/products/ operations-suite/fleet-management/ (accessed on 30 May 2018).
  12. Caterpillar’s MineStar. Available online: http://www.cat.com/en_US/campaigns/awareness/cat-minestar-command.html/ (accessed on 30 May 2018).
  13. GE mining’s Digital Mine: Safety Solutions. Available online: https://www.ge.com/digital/products/digital-mine-safety-solutions (accessed on 30 May 2018).
  14. Modular Mining Systems’ MineAlertTM. Available online: http://www.modularmining.com/product/minealert/ (accessed on 30 May 2018).
  15. Mine Site Technologies’ IMPACT Proximity Awareness. Available online: http://mstglobal.com/solutions/proximity-detection/surface-mining/ (accessed on 30 May 2018).
  16. Strata’s Hazardavert®. Available online: https://www.strataworldwide.com/proximity-detection (accessed on 30 May 2018).
  17. Mine Site Technologies’ FARA (Field Analysis and Reporting Application). Available online: http://mstglobal.com/solutions/productivity/fara-underground-and-surface-mining/ (accessed on 30 May 2018).
  18. Modular Mining Systems’ ProVision Machine Guidance System. Available online: http://www.modularmining.com/product/provision/#tab-0 (accessed on 30 May 2018).
  19. Modular Mining Systems’ AHS (Autonomous Haulage System). Available online: http://www.modularmining.com/solution/autonomous-haulage/#tab-0 (accessed on 30 May 2018).
  20. Modular Mining Systems’ RemoteCareTM. Available online: http://www.modularmining.com/product/minecare-3/#tab-4 (accessed on 30 May 2018).
  21. Vellingiri, S.; Tandur, D.; Kande, M. Energy Efficient Wireless Infrastructure Solution for Open Pit Mine. In Proceedings of the 2013 Advances in Computing, Communications and Informatics (ICACCI), Mysore, India, 22–25 August 2013; IEEE: New York, NY, USA, 2013; pp. 1463–1467. [Google Scholar]
  22. Kennedy, B.A. Surface Mining, 2nd ed.; Society for Mining, Metallurgy and Exploration (SME): Littleton, CA, USA, 1990; ISBN 9780873351027. [Google Scholar]
  23. Darling, P. SME Mining Engineering Handbook, 3rd ed.; Society for Mining, Metallurgy and Exploration (SME): Littleton, CA, USA, 2011; pp. 1–1840. ISBN 9780873352642. [Google Scholar]
  24. Aitken, J.J. Development of a Radio Propagaion Model for an Open Cut Mine. In Proceedings of the 20th International Electronics Convention & Exhibition (IREECON ’85), Melbourne, Australia, 30 September–4 October 1985; pp. 639–641. [Google Scholar]
  25. Almeida, E.P.L.; Caldwell, G.; Rodriguez, I.; Abreu, S.; Vieira, R.D.; Barbosa, V.S.B.; Sprensen, T.B.; Mogensen, P.; Garcia, L.G.U. Radio Propagation in Open-pit Mines: A First Look at Measurements in the 2.6 GHz band. In Proceedings of the 2017 IEEE 28th Annual International Symposium on Personal, Indoor, and Mobile Radio Communications (PIMRC), Montreal, QC, Canada, 8–13 October 2017; IEEE: New York, NY, USA, 2017; pp. 1–6. [Google Scholar]
  26. Almeida, E.P.L.; Caldwell, G.; Rodriguez, I.; Vieira, R.D.; Soerensen, T.B.; Mogensen, P.; Garcia, L.G.U. 5G in Open-Pit Mines: Considerations on Large-Scale Propagation in Sub-6 GHz Bands. In Proceedings of the 2017 IEEE Globecom Workshops (GC Wkshps), Marina Bay Sands Expo and Convention Centre, Singapore, 4–8 December 2017; IEEE: New York, NY, USA, 2017; pp. 1–6. [Google Scholar]
  27. Almeida, E.P.L.; Caldwell, G.; Rodriguez, I.; Vieira, R.D.; Sorensen, T.B.; Mogensen, P.; Garcia, L.G.U. An Empirical Study of Propagation Models for Wireless Communications in Open-pit Mines. In Proceedings of the 2018 IEEE 88th Vehicle Technology Conference (VTC2018), Chicago, IL, USA, 27–30 August 2018; IEEE: New York, NY, USA, 2018; pp. 1–6. [Google Scholar]
  28. Modular Mining Systems’ Masterlink®. Available online: http://www.modularmining.com/wp-content/uploads/MasterLink-Enterprise-Flyer-English.pdf (accessed on 30 May 2018).
  29. Mine Site Technologies’ IMPACT® WSN Wireless Sensor Network. Available online: http://mstglobal.com/?resources=wsn-wireless-sensor-network (accessed on 30 May 2018).
  30. Sherali, H.D.; Pendyala, C.M.; Rappaport, T.S. Optimal location of transmitters for micro-cellular radio communication system design. IEEE J. Sel. Areas Commun. 1996, 14, 662–673. [Google Scholar] [CrossRef]
  31. Jaber, M.; Dawy, Z.; Akl, N.; Yaacoub, E. Tutorial on LTE/LTE-A Cellular Network Dimensioning Using Iterative Statistical Analysis. IEEE Commun. Surv. Tutor. 2016, 18, 1355–1383. [Google Scholar] [CrossRef]
  32. Puspitasari, N.F.; Al Fatta, H.; Wibowo, F.W. Layout Optimization of Wireless Access Point Placement Using Greedy and Simulated Annealing Algorithms. Network 2016, 2. [Google Scholar] [CrossRef]
  33. Freeman, R.L. Fundamentals of Telecommunications, 2nd ed.; John Wiley & Sons: Hoboken, NJ, USA, 2005; pp. 1–720. ISBN 9780471720935. [Google Scholar]
  34. Parsons, J.D. The Mobile Radio Propagation Channel, 2nd ed.; John Wiley & Sons: Chichester, UK, 2000; pp. 1–401. ISBN 978-0-471-98857-1. [Google Scholar]
  35. Campbell Scientific, Inc. Line of Sight Obstruction. Available online: https://s.campbellsci.com/documents/us/technical-papers/line-of-sight-obstruction.pdf (accessed on 23 May 2018).
  36. Coleman, D.D.; Westcott, D.A. CWNA: Certified Wireless Network Administrator Official Study Guide: Exam PW0-105, 3rd ed.; Kellum, J., Ed.; Wiley: New York, NY, USA, 2012; pp. 1–768. ISBN 978-1-118-12779-7. [Google Scholar]
  37. Bertoni, H.L. Radio Propagation for Modern Wireless Systems; Goodwin, B., Ed.; Prentice Hall PTR: Upper Saddle River, NJ, USA, 1999; pp. 1–276. ISBN 0-13-026373-7. [Google Scholar]
  38. Kapusuz, K.Y.; Kara, A. Determination of Scattering Center of Multipath Signals Using Geometric Optics and Fresnel Zone Concepts. Eng. Sci. Technol. Int. J. 2014, 17, 50–57. [Google Scholar] [CrossRef]
  39. White, R.F. Engineering Considerations for Microwave Communications Systems; Lenkurt Electric Co., Inc.: San Carlos, CA, USA, 1970; pp. 1–119. [Google Scholar]
  40. Fisher, P.F. Algorithm and Implementation Uncertainty in Viewshed Aanalysis. Int. J. Geogr. Inf. Syst. 1993, 7, 331–347. [Google Scholar] [CrossRef]
  41. Sorensen, P.A.; Lanter, D.P. Two Algorithms for Determining Partial Visibility and Reducing Data Structure Induced Error in Viewhshed Analysis. Photogramm. Eng. Remote Sens. 1993, 59, 1149–1160. [Google Scholar]
  42. Fisher, P.F. Stretching the Viewshed. In Advances in GIS Research, Proceedings of the 6th International Symposium on Spatial Data Handling, Waugh, University of Edinburgh, Edinburgh, UK, 1994; Waugh, T.C., Healey, R.G., Eds.; Taylor & Francis: London, UK, 1994; pp. 725–738. [Google Scholar]
  43. Wang, J.; Robinson, G.J.; White, K. A Fast Solution to Local Viewshed Computation Using Grid-Based Digital Elevation Models. Photogramm. Eng. Remote Sens. 1996, 62, 1157–1164. [Google Scholar]
  44. Izraelevitz, D. A Fast Algorithm for Approximate Viewshed Computation. Photogramm. Eng. Remote Sens. 2003, 69, 767–774. [Google Scholar] [CrossRef]
  45. Kim, Y.; Rana, S.; Wise, S. Exploring Multiple Viewshed Analysis Using Terrain Features and Optimisation Techniques. Comput. Geosci. 2004, 30, 1019–1032. [Google Scholar] [CrossRef]
  46. Chang, K. Introduction to Geographic Information Systems, 8th ed.; McGraw-Hill Education: New York, NY, USA, 2015; pp. 1–445. ISBN 978-9814636216. [Google Scholar]
  47. De Smith, M.J.; Goodchild, M.F.; Longley, P. Geospatial Analysis: A Comprehensive Guide to Principles, Techniques and Software Tools, 2nd ed.; Troubador Publishing Ltd.: Leicester, UK, 2007; pp. 1–516. ISBN 978-1906221522. [Google Scholar]
  48. TatukGIS’s Viewshed Generate Fresnel Method. Available online: http://docs.tatukgis.com/DK11/api:dk11:delphi:gisviewshed.tgis_viewshed.generatefresnel_void (accessed on 30 May 2018).
  49. Global Mapper User’s Mannual. Available online: http://www.globalmapper.com/helpv9/GlobalMapperHelp.pdf (accessed on 30 May 2018).
  50. Softwright’s Terrain Analysis Package (TAP). Available online: http://www.softwright.com/file-downloads/TAP%20Product%20Sheet.pdf (accessed on 30 May 2018).
  51. Cellular Expert’s Radio Network Planning in ArcGIS. Available online: https://www.esrifrance.fr/iso_album/brosiura_final_web.pdf (accessed on 30 May 2018).
  52. Lee, S.; Choi, Y. Topographic Survey at Small-scale Open-pit Mines using a Popular Rotary-wing Unmanned Aerial Vehicle (Drone). Tunn. Undergr. Space Technol. 2015, 25, 462–469. [Google Scholar] [CrossRef]
  53. Lee, S.; Choi, Y. On-site Demonstration of Topographic Surveying Techniques at Open-pit Mines using a Fixed-wing Unmanned Aerial Vehicle (Drone). Tunn. Undergr. Space Technol. 2015, 25, 527–533. [Google Scholar] [CrossRef] [Green Version]
  54. Lee, S.; Choi, Y. Comparison of Topographic Surveying Results using a Fixed-wing and a Popular Rotary-wing Unmanned Aerial Vehicle (Drone). Tunn. Undergr. Space Technol. 2016, 26, 24–31. [Google Scholar] [CrossRef] [Green Version]
  55. Lee, S.; Choi, Y. Reviews of unmanned aerial vehicle (drone) technology trends and its applications in the mining industry. Geosyst. Eng. 2016, 19, 197–204. [Google Scholar] [CrossRef]
  56. Baek, J.; Choi, Y. Comparison of Communication Viewsheds Derived from High-Resolution Digital Surface Models Using Line-of-Sight, 2D Fresnel Zone, and 3D Fresnel Zone Analysis. ISPRS Int. J. Geo-Inf. 2018, 7, 322. [Google Scholar] [CrossRef]
Figure 1. Conceptual view of the first Fresnel zone and the 3D Partial Fresnel zone.
Energies 11 03063 g001
Figure 2. Flow diagram showing procedures for selecting multiple candidate locations for transmitters in geographic information systems (GIS).
Energies 11 03063 g002
Figure 3. Procedure for generating 3D Fresnel index maps for all transmitter candidates via communication viewshed analysis of topographic data.
Energies 11 03063 g003
Figure 4. Example showing generation of a 3D Fresnel index overlay map.
Energies 11 03063 g004
Figure 5. Topographic information of the study area: (a) the orthographic image was obtained via unmanned aerial surveying; (b) a digital surface map of the open-pit mine; and (c) a 3D visualization of the study area using the orthographic image. The reference grid is in meters and the origin of the local Transverse Mercator coordinate system is 38°00′00′′ N, 129°00′00′′ E (map datum: GRS1980).
Energies 11 03063 g005
Figure 6. Input layers for selecting candidate transmitter locations in the open-pit mine: (a) pit area; (b) road; (c) slope gradient; and (d) vegetation.
Energies 11 03063 g006
Figure 7. Results of selecting (a) 181 points satisfying four conditions and (b) the final 15 transmitter candidate points in the study area.
Energies 11 03063 g007
Figure 8. Three-dimensional Fresnel index maps of the open-pit mine for 15 candidate transmitter locations: (a) T1, (b) T2, (c) T3, (d) T4, (e) T5, (f) T6, (g) T7, (h) T8, (i) T9, (j) T10, (k) T11, (l) T12, (m) T13, (n) T14, (o) T15.
Energies 11 03063 g008
Figure 9. Ranking of the sum of the 3D Fresnel indexes for 15 transmitter candidates.
Energies 11 03063 g009
Figure 10. Ranking of transmitter combination candidates selected by considering the sum of 3D Fresnel indices and the sum of 3D visibility indices.
Energies 11 03063 g010
Figure 11. Three-dimensional Fresnel index overlay maps for the favorable transmitter candidate combinations when two, three, and four transmitter candidates were combined: (a) combination of T6 and T15, (b) combination of T3, T8, and T13, and (c) combination of T3, T6, T8, and T13.
Energies 11 03063 g011
Figure 12. Visibility and 2D Fresnel index overlay maps generated from existing algorithms based on LOS and 2D partial Fresnel zone analyses: (a) combination of T6 and T15, (b) combination of T3, T8, and T13, and (c) combination of T3, T6, T8, and T13.
Energies 11 03063 g012
Figure 13. An open-pit mine in South Korea with a wireless communications system for fleet management of mine equipment. (a) Control center. (b) Main dashboard.
Energies 11 03063 g013
Figure 14. 3D Fresnel index overlay map for the four transmitters in the open-pit mine.
Energies 11 03063 g014

