Study on Dehumidification Performance of a Multi-Stage Internal Cooling Solid Desiccant Adsorption Packed Bed


1
School of Civil and Transportation Engineering, Guangdong University of Technology, Guangzhou 510006, China
2
School of Engineering, University of Hull, Hull HU6 7RX, UK
*
Author to whom correspondence should be addressed.
Energies 2018, 11(11), 3038; https://doi.org/10.3390/en11113038
Submission received: 30 September 2018
/
Revised: 21 October 2018
/
Accepted: 30 October 2018
/
Published: 5 November 2018
(This article belongs to the Special Issue 2018 EU–China Symposiums on Renewable Energy/Sustainable Energy and Energy Storage Technologies)
Abstract
:In this paper, the solid desiccant adsorption packed bed with a three-stage internal cooling (ICSPB) has been proposed to improve the dehumidification efficiency and make a comparison with that of non-internal cooling. To investigate the performance of the ICSPB, the dehumidification capacity, dehumidification efficiency, water content of solid desiccant, moisture ratio of solid desiccant, temperature of solid desiccant and inlet and outlet air temperature difference were discussed in different conditions of inlet air and supplying water temperature. It was found that the dehumidification performance of the bed with internal cooling could be improved greatly in the low temperature and low humidity conditions, while in the high temperature and humid, the improvement was not obvious. With internal cooling, the dehumidification efficiency and the water content of the solid desiccant could be improved 59.69% and 110.7%, respectively, and the temperature of solid desiccant could be reduced 2.2 °C when the ICSPB operated at the inlet air temperature of 20 °C, inlet humidity of 55%, and water temperature of 14 °C. Moreover, the dehumidification performance at each stage of ICSPB was studied. It was found that, the first stage played the most important role in the dehumidification process. In addition, the calculation models that can be used to predict the moisture ratio and the temperature of solid desiccant were established on the test results.
1. Introduction
With the improvement of people’s living standard, the requirements for indoor air quality are getting higher and higher. Air humidity is an important factor affecting indoor air quality. In traditional cooling dehumidification, air temperature must be reduced below the dew point in order to reduce the humidity of the air. Moreover, the outlet air temperature is usually lower than that of supplying air. So it is necessary to reheat the air [1]. The energy consumption of reheating air is serious in this process [2]. As a new method of dehumidification, the solid adsorption dehumidification relies on solid desiccant to absorb moisture and the desiccant can be recycled through the regeneration process. In its dehumidification process, the energy consumption of reheating air is not needed, so solid adsorption dehumidification has gained much attention by engineers and researchers. Nowadays, the rotary dehumidification and the solid desiccant fixed bed are becoming the most commonly used solid adsorption methods. Comparing with the rotary desiccant wheel, the fixed bed has received much attention due to its simple structure, low cost, easy operation, and large contact area [3].
Silica gel is one of the solid desiccants that commonly used [4]. The adsorption of solid desiccant is usually considered to be spontaneous and exothermic [5]. During the dehumidification process, it will release adsorption heat, which can increase the temperature of the silica gel and reduce the adsorption capacity of the desiccant [3]. In order to resolve this problem, much research has been carried out on fixed beds over the past few years. Yang et al. [6] designed a packed bed with water pipes with nominal diameter of 20 mm. It was found that the moisture absorption capacity of this bed was 1.17 times that of the conventional one. Another inter-cooling solid desiccant packed bed was designed by Ramzy et al. [7], and the total adsorbed mass was increased about 22% in comparison with the non-intercooled beds. It was also found that the relative growth rate could be affected by the air velocity that passing through the bed. A solid desiccant tray with cooling coil was designed by Hung et al. [8]. It was found that the mass ratio of solid desiccant could be increased about 10–40% compared with that non internal cooling. However, the adsorption heat was difficult to remove due to the desiccant thickness. Therefore, some scholars put forward the flow channel fixed bed. Then a modified cross-cooled compact solid desiccant dehumidifier was proposed by Yuan et al. [9]. The new dehumidifier was constructed with silica gel glued on the metal surface of the air flow channels. A 12.4% dehumidification efficiency was obtained in the condition of high humidity. However, the heat transfer efficiency was low through the gas-solid heat exchanging. As the heat transfer efficiency of the liquid-solid heat exchanger was higher than that of the air-solid heat exchanger, a fin-tube heat exchanging device coated with silica gel was designed by Peng et al. [10]. And Ge et al. [11,12,13] proposed a self-cooled solid desiccant cooling system with desiccant coated in the heat exchanger (SCDHE). It was found that the SCDHE system can improve the dehumidification efficiency by 17% compared to the conventional system. And then, the heat and mass transfer characteristic of a desiccant-coated fin-tube heat exchanger was investigated by Li et al. [14]. He also established the mathematic model of which. Finocchiaro et al. [15] made a comparison between a simple packed bed and a fin-tube heat exchanger with silica gel filled in the gaps between the fins. It can be concluded that most researches focus on the structure optimizing of the dehumidification bed. However, the effect of internal cooling on the release of adsorption heat did not attract much attention. In fact, the water supplying of internal cooling can greatly influence the adsorption heat and the dehumidification performance of solid desiccant fixed bed.
In this paper, a novel internal cooling solid adsorption packed bed (ICSPB) is proposed, which is supposed to reduce the effect of the adsorption heat and improve the efficiency of dehumidification. The performance of the internal cooling adsorption bed will be experimentally investigated and made a comparation with that without internal cooling. And the testing results will be analyzed for the set-up running at different test conditions, e.g., temperature and humidity of inlet air and supplying water temperature. This paper is aimed to increase the dehumidification efficiency, find the influence laws of the adsorption heat by the water supplying of internal cooling and enhance the utilization of solid desiccant, and indicate potential research areas for other researchers.
2. System Description
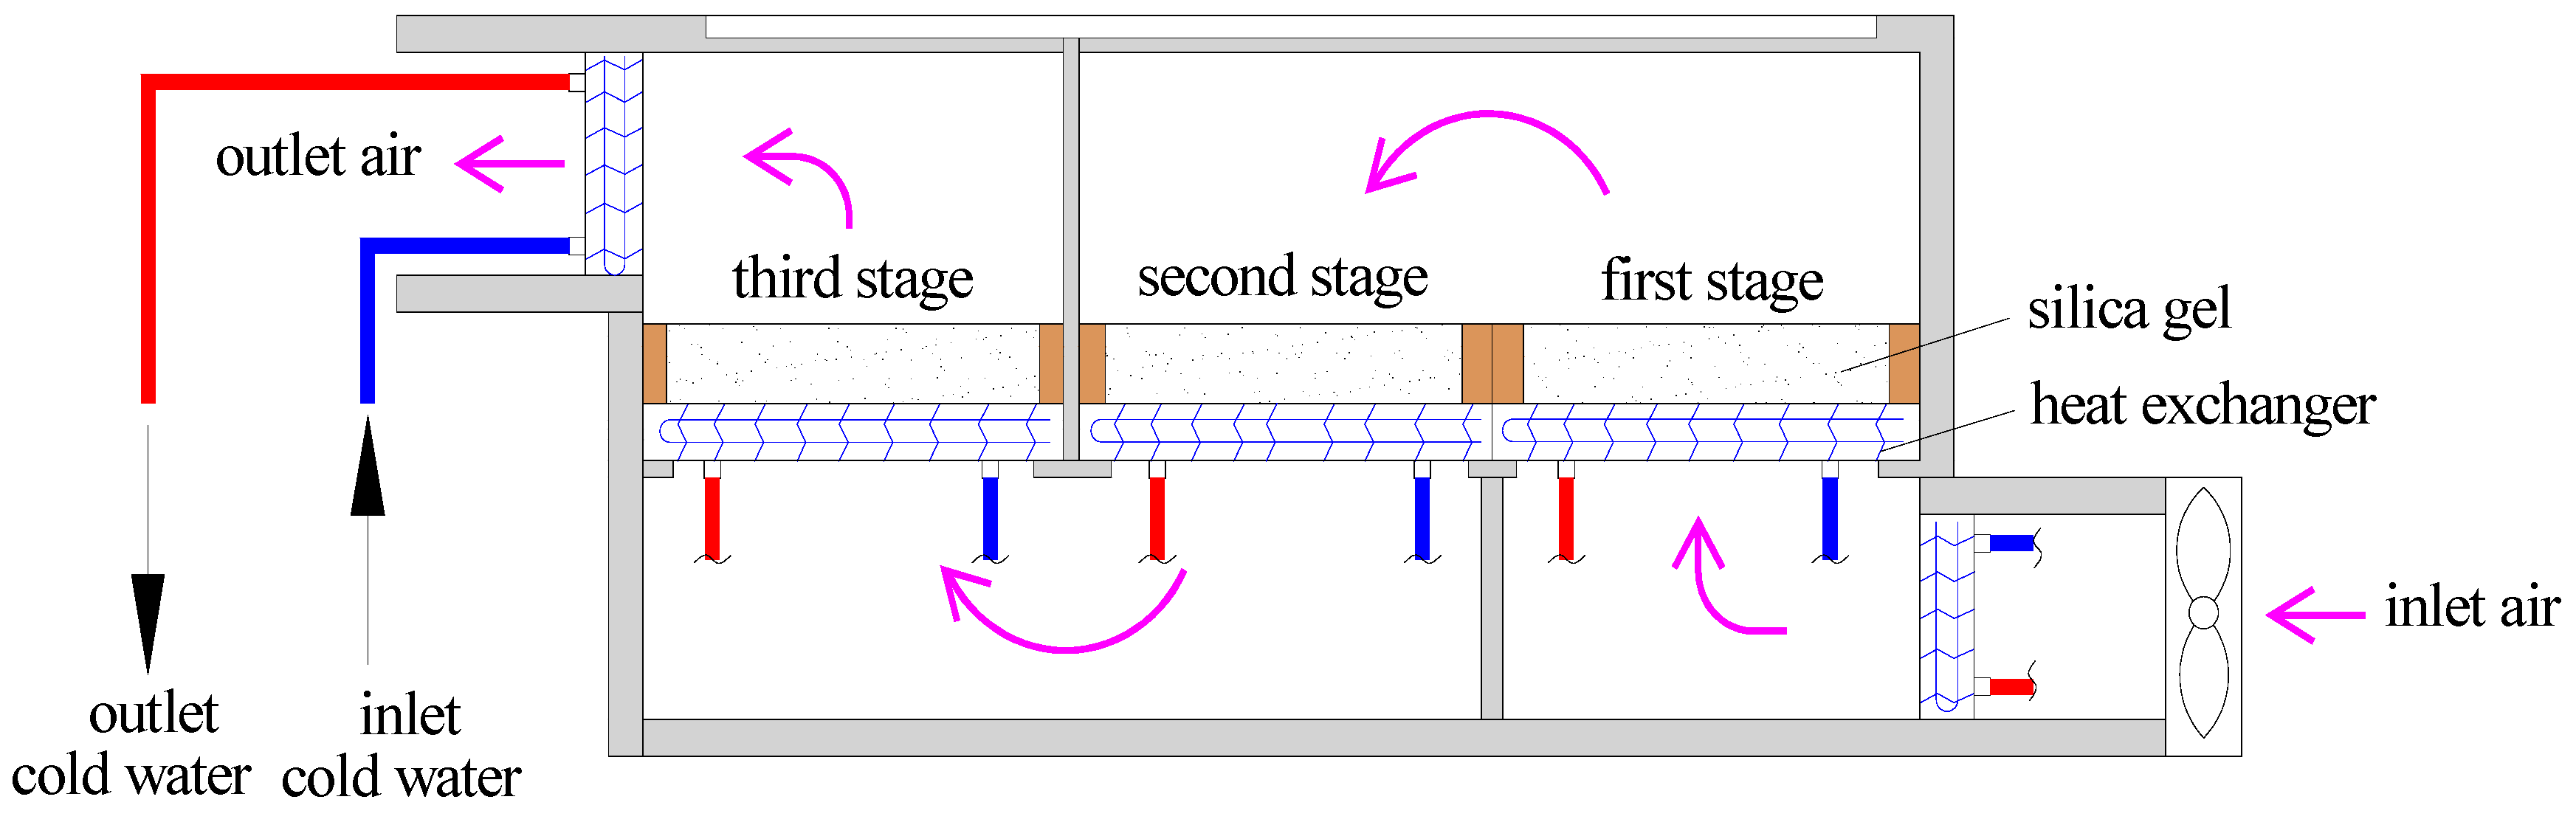
The proposed system (Figure 1) consists of two parts, i.e., dehumidification part and cooling part. Silica gel is used as desiccant in the dehumidification system. The cooling part is aimed to reduce the adsorption heat and improve the dehumidification efficiency during the dehumidification process. To achieve the cooling effect, cold water is used as a medium to pass through the heat exchangers.
The working principle of the proposed system can be summarised into two processes, i.e., pre-cooling and dehumidifying. When the inlet air flow into the ICSPB, it will pass through the heat exchanger firstly. With the heat exchanging, the air temperature will be reduced. Then the air will pass through the curved airflow channel in turn through the dehumidification modules and the heat exchangers. During the process, the moisture of the air will be absorbed and the adsorption heat will be taken away partly by the cold water.
The characteristics of the system can be presented as follows: (1) The heat exchangers can be used to reduce the temperature of solid desiccant and adsorption heat in the dehumidification process. (2) The utilization ratio of solid desiccant and the dehumidification efficiency can be improved effectively. (3) The outlet air temperature can be decreased, as well as the sensible heat load. (4) Nature cold source such as the surface water and cooling water from cooling towers can be used as cold source during the dehumidification process. Thus, the high temperature cold source will be used effectively. (5) The heat exchangers and the dehumidification beds are separate, so that the solid desiccant can be replaced conveniently. (6) The mass of the desiccant was weighed by samplers, so that the experimental operation can be simplified and the test results can be more accurate.
3. Construction of the Testing Rig
3.1. Testing Rig
In this paper, a novel testing rig has been constructed in Guangdong University of Technology, China to investigate the performance of the proposed set-up, as shown in Figure 2, Figure 3, Figure 4, Figure 5 and Figure 6. The testing rig mainly consist of four parts, i.e., packed bed dehumidification system, environmental cabinet, cold water supplying system, and data acquisition system. The packed bed dehumidification system is composed of three dehumidification modules and a fan that can drive the air through the bed. The cold water supplying system is composed of a water chiller, five heat exchangers, two pumps, a water tank, a water distributor, and a water collector. The data acquisition system is composed of a multi-channel temperature and humidity monitor, a multi-channel temperature logger, an electronic balance and an electronic scale.
The shell of the bed is made of several 20 mm plexiglass plates, and the external appearance size is 780 mm × 480 mm × 440 mm. The middle part of the device is solid adsorption layer and cooling layer. The two functional layers divide the whole device into two parts. There are 3 dehumidification modules in the device, and each module is separated by a thin perspex partition, which constitutes a three-stage adsorption bed. The dehumidification modules are made of wood and wire mesh, and the size of each module is 450 mm × 130 mm × 50 mm. Each module is equally divided into 3 spaces. A sampler that can be used to weigh the quality of the desiccant is placed in the middle of the module. The size of the sampler is 140 mm × 90 mm × 60 mm. In order to arrange the test probe and the thermocouple wire, some test holes were made in the shell of the device, and the diameter of the hole is 20 mm. The heat exchangers are connected with the water tank through a water distributor and a water collector. The temperature of the solid desiccant is collected by a multi-channel temperature logger, and the temperature and relative humidity of the air are collected by a multi-channel temperature and humidity monitor. The performance parameters of main components are listed in Table 1.
3.2. Test Methods and Conditions
Before test, the desiccant was placed in a drying oven at temperature of 120 °C for 12 h to be dried completely. Then, the temperature and humidity of the environmental cabinet and the cold water temperature were set to the experimental conditions (Table 2). The same weight of silica gel (1200 g) was placed in each of dehumidification module. The mass of silica gel in each sampler was 300 g, which accounted for 1/3 of the total mass of silica gel of a single module. Then the weighed modules were put in the corresponding position to begin the test. The weight of each sampler was recorded every 30 min by the electrical balance, and the experimental test lasted for 10 h. After test, the total mass of three dehumidification modules was weighed respectively by the electronic scale and new monitoring sensors “e-nose” [16] could be used for the air quality control.
In this test, the typical summer and winter weather conditions in southern China (Guangzhou) was selected as the testing conditions (Table 2), and the air temperature ranges from 20 °C to 34 °C and relative humidity ranges from 55% to 80%. The temperature of cold water was consistent with the natural water temperature in summer and winter of this district and it is higher than the dew point temperature under the corresponding inlet air condition.
4. Analysis and Discussion
Experiments on the dehumidification process of the bed with and without internal cooling have been conducted respectively, and the experimental results have been analysed and discussed to investigate the dehumidification performance of the ICSPB. Of which, dehumidification capacity, dehumidification efficiency, water content of solid desiccant, moisture ratio of solid desiccant, temperature of solid desiccant, inlet and outlet air temperature difference, and dehumidification performance at each stage of the ICSPB have been tested and analysed on the base of testing results.
4.1. Dehumidification Capacity
Dehumidification capacity is an important factor that reflects the difference of the humidity ratio of the passing air inlet and outlet the dehumidification bed. When din of inlet air was the same, the larger the Δd value, the greater dehumidification capacity of the bed. It is defined as Equation (1) [17]:
Figure 7 showed the variation of dehumidification capacity with time in different test conditions. It’s found that the maximum value occurred at the first few minutes of the test, then it decreased with the test time. The maximum value of the dehumidification capacity in each experimental condition was 3.50 g/kg, 6.16 g/kg, 5.11 g/kg, 9.20 g/kg, 15.91 g/kg, 17.71 g/kg, 16.11 g/kg and 20.14 g/kg respectively. And the average dehumidification capacity during 10 h was 0.65 g/kg, 1.39 g/kg, 1.14 g/kg, 1.70 g/kg, 1.99 g/kg, 2.15 g/kg, 2.00 g/kg and 2.02 g/kg respectively. That was to say, with internal cooling, the average dehumidification capacity of the ICSPB improved 94.6% in the low temperature and humidity conditions compared with that of non-internal cooling conditions. And the capacity increased by 9.6% on average for every 1 degree centigrade decrease in water temperature. While in the hot and humid, the average dehumidification capacity improved 4.3%.
4.2. Dehumidification Efficiency
Dehumidification efficiency is a reflection of the completion of the dehumidification process. With the same humidity ratio of the inlet air and test conditions, lager η value means the greater dehumidification efficiency of the bed. It is defined as Equation (2) [18]:
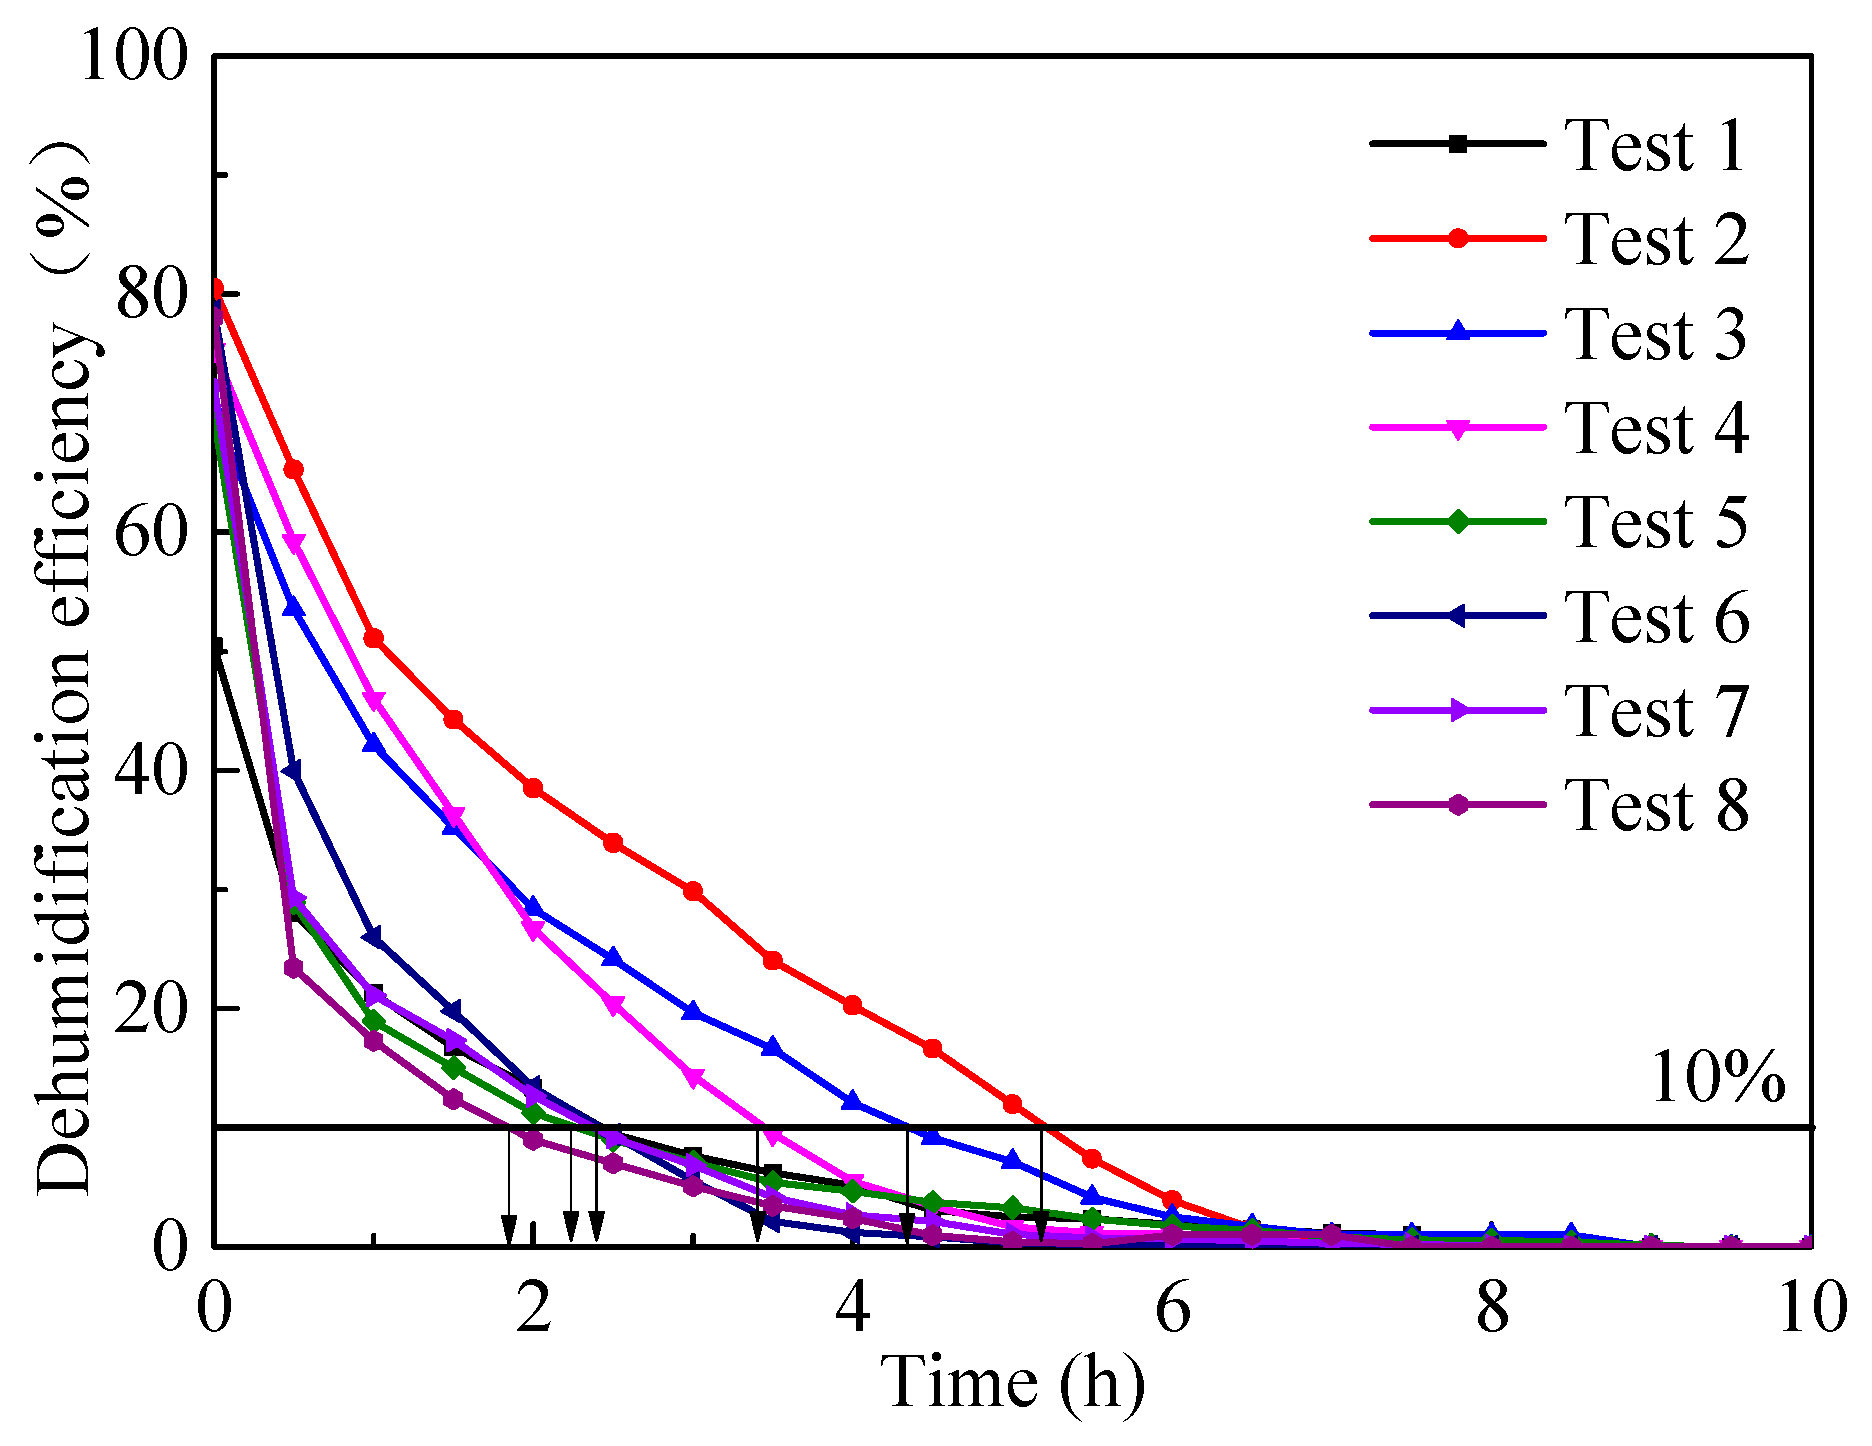
Figure 8 indicated the variation of dehumidification efficiency with time in different test conditions. It could be seen that the efficiency decreased with time. And the rate of descent which in hot and humid conditions was higher than that in the low temperature and low humidity. The largest dehumidification efficiency of the ICSPB in all tests could be reached about 80.50%, when the inlet air temperature was 20 °C and relative humidity was 55%, with cold water of 14 °C. In addition, the average efficiency of this condition was about 37.85%.
In this paper, the effective dehumidification process could be considered finished when the air dehumidification efficiency was less than 10%. This was because the dehumidification capacity in all the tests had been lower than 2 g/kg and the dehumidification speed was very slow at this time. According to this suppose, the effective dehumidification time of each test conditions could be determined and it was about 2.5 h, 5 h, 4.5 h, 3.5 h, 2.2 h, 2.5 h, 2.5 h and 1.8 h respectively. Then, it can be obtained that the internal cooling was conductive to extend the effective dehumidification time when the ICSPB operated under low temperature and humidity conditions, and the time could be extended by 1.9 h on average.
Running at the inlet air temperature of 20 °C and relative humidity of 55%, the air dehumidification efficiency of the ICSPB could be improved 59.69% and 39.32% respectively with the cold water of 14 °C and 18 °C flowing into the heat exchangers. While when the inlet air temperature was 34 °C, and relative humidity was 68%, the air dehumidification capacity could be improved 11.3% and 1.3% with cold water of 28 °C and 32 °C flowing into the heat exchangers respectively. From the above test results, we could conclude that the dehumidification efficiency of the ICSPB can be improved obviously in low temperature and low humidity conditions rather than in hot and humid.
4.3. Water Content
Water content is one of the most important parameters on the dehumidification bed. It determines the equilibrium relative humidity of the process air with the bed. It is defined as Equation (3) [19]:
4.3.1. Water Content of the Whole Dehumidification Device
Figure 9 showed the variation of water content of the whole dehumidification device with time in different test conditions. The average value of three dehumidification modules could be used to evaluate and analyse the water content. It was found that the water content of silica gel increased with time and finally tended to a constant value. The largest water content of each test condition during the process was about 0.14 kg/kg, 0.30 kg/kg, 0.22 kg/kg, 0.32 kg/kg, 0.26 kg/kg, 0.31 kg/kg, 0.27 kg/kg and 0.31 kg/kg respectively. That meant the water content could be increased around 5.7%–110.7% with internal cooling compared with that non-internal cooling conditions. When the ICSPB running at the inlet air temperature of 20 °C, relative humidity of 55% and water temperature of 14 °C, the water content could reach the maximum value. This was caused by a reduction in air temperature and desiccant temperature. So that the vapor pressure at the surface of the desiccant was lower than that without internal cooling and the higher moisture transfer process could be realized.
The experimental results indicated that the water content mainly depends on the inlet air parameters and cold water temperature. For the same period of dehumidification process, as air relative humidity increased and water temperature decreased, the water content of the bed could be increased. In the condition of low temperature and low humidity, the increase rate was better than that in the hot and humid.
4.3.2. Water Content of Each Stage
In order to study the variation of water content at each stage, experimental results of Test 5 and Test 6 were taken as examples to analyse. As shown in Figure 10, the water content of the three dehumidification modules were approximately equal when the moisture absorption reached saturation no matter with internal cooling or without internal cooling. The saturated water content with internal cooling could be improved about 18% compared with that without internal cooling. However, the growth rate of water content in two test conditions were different. When it operated under non-internal cooling, the water content of the first stage was the fastest, and then the second stage. The third stage was the slowest. With internal cooling, the first stage was still the fastest, but the third stage was faster than the second stage within 3 h. After 3 h, the second stage was faster than the third, and then they all reached a constant value. From above test results, we could find that the first stage played the most important role in the dehumidification process.
4.4. Moisture Ratio
The moisture ratio of solid desiccant reflects the utilization ratio of adsorbent during effective dehumidification time. It is defined as Equation (4) [20]:
where, me refers to the weight of silica gel after 10 h test.
4.4.1. Moisture Ratio of the Whole Dehumidification Device
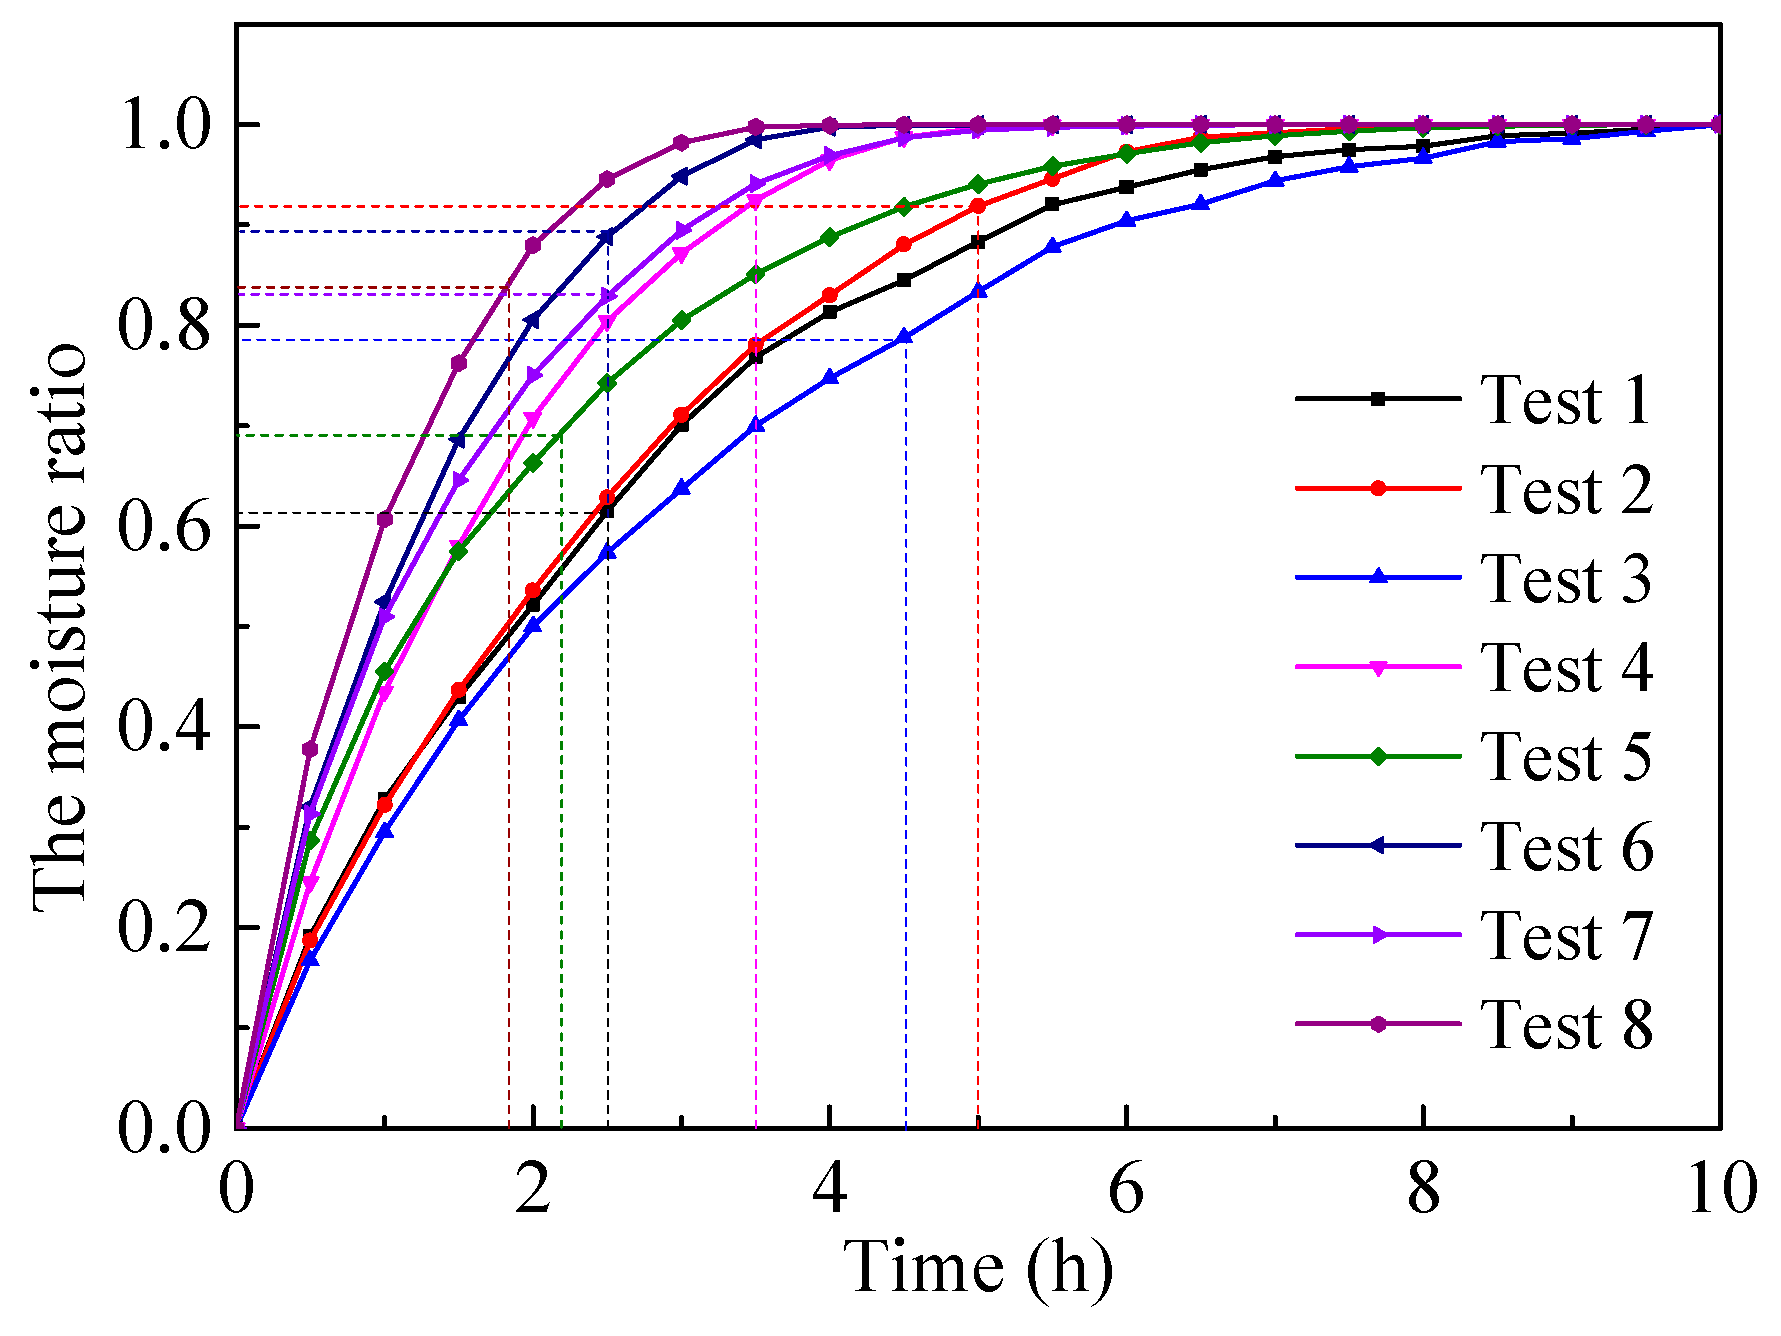
Figure 11 showed the variation of moisture ratio of the whole dehumidification device with time under different test conditions. It was found that the largest moisture ratio in different conditions was 0.62, 0.92, 0.78, 0.92, 0.68, 0.89, 0.83, and 0.84 respectively, within the effective dehumidification time. It’s clear that the utilization ratio of solid desiccant had been improved with internal cooling and the lower the temperature and the higher the relative humidity, the higher the utilization ratio of the desiccant. The moisture ratio of Test 4 was 1.2 times that of Test 3. While the ratio of Test 8 was the same as that of Test 7. That meant when the ICSPB was running at the same inlet air temperature and cold water, the moisture ratio of the desiccant in low temperature and humidity condition increased with the increasing humidity of the air. While in the hot and humid conditions, the effect was not obvious.
4.4.2. The Moisture Ratio of Each Stage
In order to further study, the effect of internal cooling on the moisture ratio of each stage within the effective dehumidification time, the mass of each dehumidification module was weighed by sampler. The test results have been plotted into charts as shown in Figure 12.
From Figure 12, it was found that the moisture ratio of the first stage was the largest among three stages and it played an important role in dehumidification process, and the third stage was the smallest under the condition of without internal cooling. Among which, the ratio of the third stage was only 0.5. With internal cooling, the moisture ratio of the first stage was still the largest, while the third stage became more than the second stage. And the first stage had been saturated. The ratio of the solid desiccant was also over 0.8 in the second and the third stage. That was to say, the utilization ratio of solid desiccant of each stage in the internal cooling test condition could be improved 7.5%, 15.5%, 44.1%, respectively.
4.5. The Temperature of Solid Desiccant
Due to the adsorption heat, the solid desiccant temperature will be risen. This will reduce the moisture absorption capacity of the desiccant. With internal cooling, the process air could be pre-cooling by the heat exchangers, so as to reduce the temperature of the desiccant. The temperature of silica gel under different experiment conditions was tested and the variation with time have been analysed by the test results.
4.5.1. The Average Temperature of the Whole Dehumidification Device
Figure 13 showed the variation of the average temperature of solid desiccant of the whole dehumidification device with time under different test conditions. Within the 5 min at the initial of the test, the temperature of the solid desiccant rose sharply to its peak. After 5 min, the temperature began to drop and eventually reached a balance state with the process air. The maximum value of the temperature was 25.8 °C, 23.6 °C, 24.5 °C, 31.5 °C, 50.7 °C, 48.2 °C, 49.1 °C and 54.6 °C under 8 test conditions respectively. The temperature in hot and humid conditions was higher than that of the low temperature and low humidity. This was because that the desiccant adsorbed more moisture in hot and humid, and then more adsorption heat was released. It’s also found that the temperature of solid desiccant was lower when the ICSPB operated with internal cooling. With the temperature difference between inlet air and cold water varied from 2 °C to 6 °C, the average temperature of silica gel dropped between 1.5 °C and 2.5 °C.
4.5.2. The Average Temperature of Each Stage
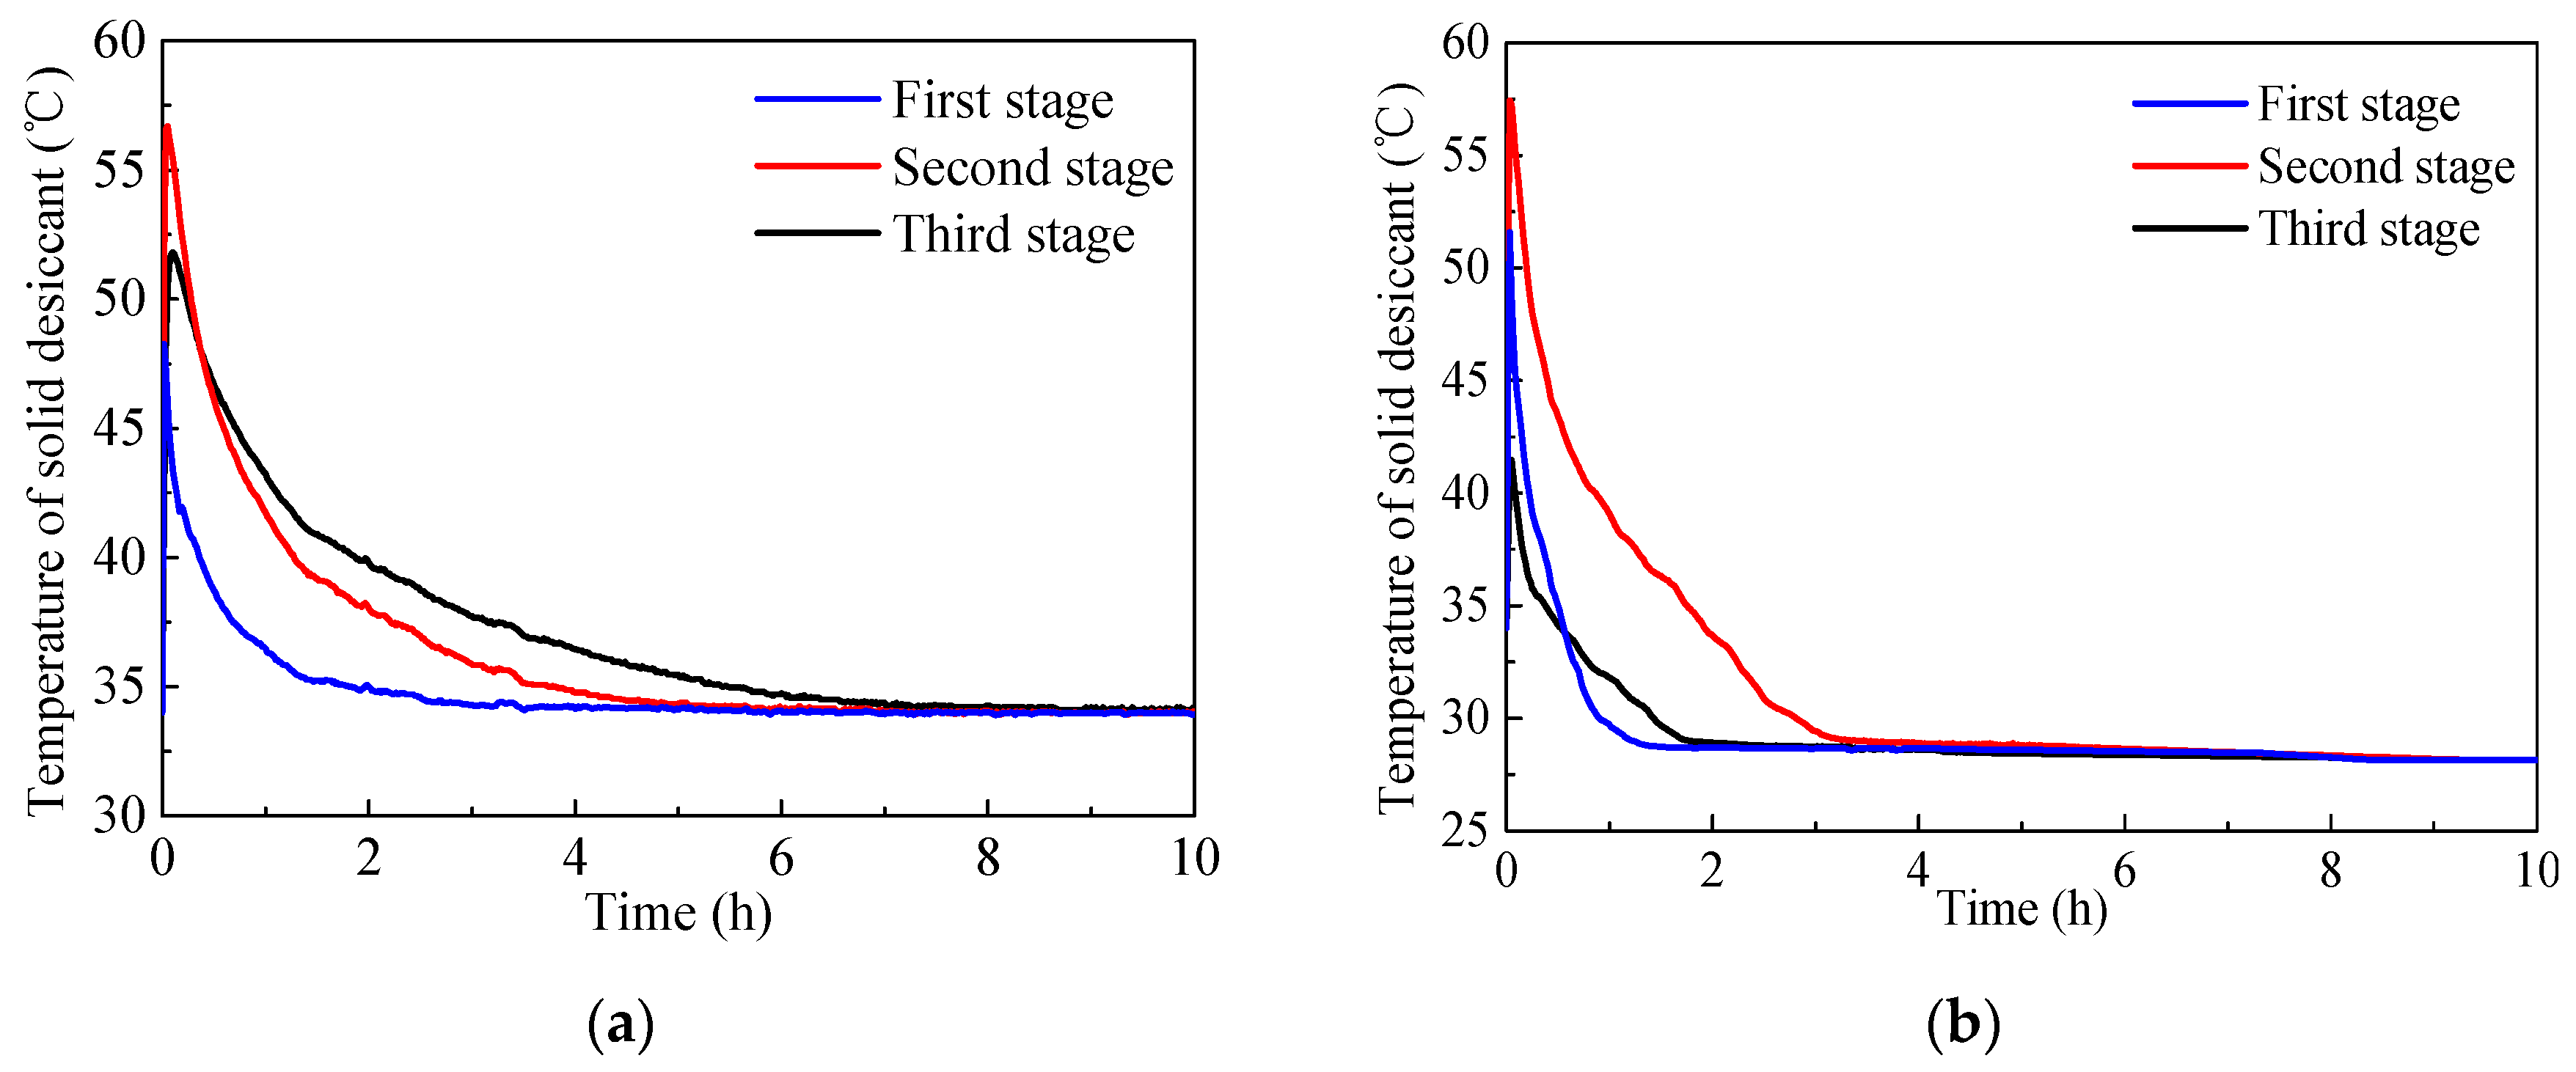
For the further study of the effect on the solid desiccant temperature of ICSPB at each stage with internal cooling, the silica gel temperature of Test 5 and Test 6 were analysed. The test results have been plotted into charts as shown in Figure 14.
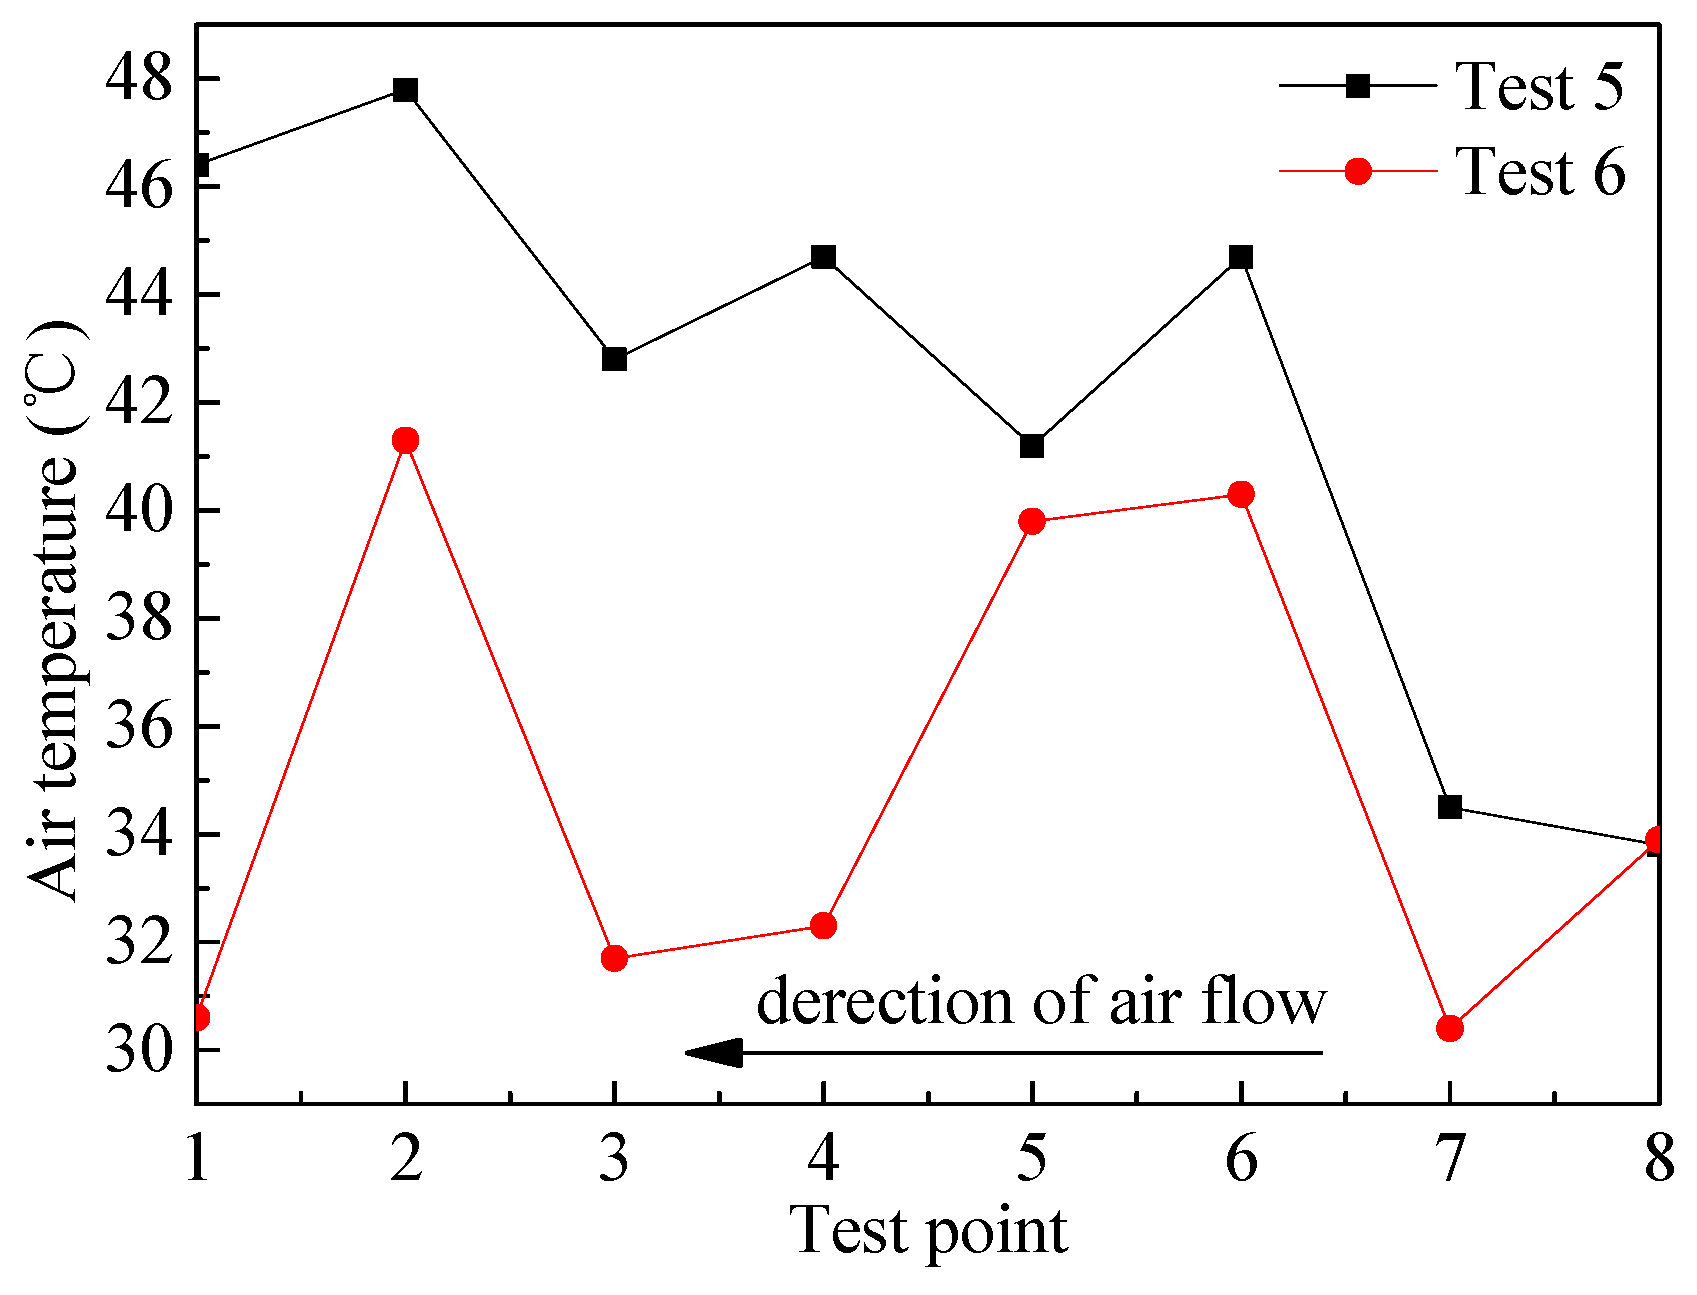
It could be seen from Figure 14 that the temperature of silica gel in the second stage is the highest, and the first stage is the lowest within the first 30 min in the non-internal cooling condition. After 30 min, the temperature of the third stage was becoming the highest while the first stage still kept the lowest. With internal cooling, the temperature of silica gel in the second stage was always keeping the highest during the dehumidification process. In terms of the other two stages, the third stage was lower than the second within 30 min, while 30 min later, the result was opposite. This was caused by the following factors. The first reason was that the first stage dehumidification module was close to the entrance of the device, so the heat was easily carried away by the flowing air. The second reason was that the amount of moisture absorption of the second stage was higher than the third stage, so it released more adsorption heat. The third was that twice heat exchange had been carried out before the process air pass through the third stage, so the temperature of the process air had been reduced effectively. In the ICSPB, the trend of the air temperature along the air flow was shown in Figure 15.
In this experiment, the process air flowed from the right side to the left side of the test rig. The value of test point 8 referred to the temperature of the inlet air, and test point 1 referred to the temperature of the outlet air. It could be seen from the figure above, the average temperature of the process air with internal cooling was 2.3 °C lower than that of non-internal cooling. As for each dehumidification module, the temperature of the air can be reduced about 8 °C by heat exchanging.
4.6. Temperature Difference between the Inlet and Outlet Air
Due to the adsorption heat, the temperature of the pass air would be risen. High outlet air temperature would increase the sensible heat load of air conditioning system.
Taking inlet air temperature was 34 °C and relative humidity was 68% for example, it could be seen from Figure 16 that the outlet temperature of the air was higher than the inlet air temperature when the ICSPB operated without internal cooling. When the dehumidification process was operating for 30 min, the air temperature difference reached to the maximum value i.e., 13.5 °C. In addition, during the effective dehumidification time, the temperature difference was always above 7 °C. However, the outlet air temperature was always lower than the inlet air temperature under the internal cooling test conditions. Since the water temperature fluctuated above and below the set value, the outlet air temperature was fluctuating. When the cold water was 4 °C below than the inlet air, the inlet and outlet air temperature difference fluctuated between −2.4~−4 °C during the effective dehumidification time. When the cold water was 2 °C below than the inlet air, the temperature difference fluctuated between −0.3~−1.6 °C during the effective dehumidification time.
5. Dehumidification Calculation Model
5.1. Mass Balance
The water content of solid desiccant is used to judge the degree of dehumidification. So, it was necessary to establish a calculation model to predict it. The heat and mass transfer model of dehumidification process has been shown in Figure 17. Four hypothetical conditions are taken into consideration to establish the model [21]:
- The water content of the desiccant in the axial gradient can be neglected.
- The solid desiccant and the exit air of the dehumidification module are mass equilibrium.
- Isothermal adsorption is achieved in the dehumidification process.
- The average volume of air is used to simulate the mass transfer process.
According to the law of mass conservation:
Vapor lost by air = Vapor adsorbed by solid desiccant.
The mass balance between the process air and the solid desiccant is given as follows Equation (5):
The moisture content of the outlet air is supposed to equal to the moisture content on the surface of the solid desiccant material, i.e., [22], with following Equation (6):
where, de is the moisture content of the air when it reaches the mass balance with the moisture on the surface of the desiccant (Equation (7)). It depends on the amount of dehumidification per unit mass of the desiccant and the thermo-physical properties of the solid adsorbent-adsorbate pair. When the adsorbates and adsorbents are silica gel and water vapor respectively, a linear function between d and w can be obtained as following Equation (7) [22]:
Substituting Equations (6) and (7) into Equation (5), gives following Equation (8):
Solving Equation (8) with the initial condition wτ = w0 at τ = 0, gives following Equation (9):
where, we refers to the saturated dehumidification quality of the solid desiccant.
Then, Equation (9) can be rewritten as the following Equation (10):
where β is calculated by following Equation (11):
Since the solid desiccant was supposed to completely dry in the initial time, w0 = 0. Therefore, the above formula can be simplified as the following Equation (12):
This experiment lasted for 10 h. The solid desiccant was nearly saturated at the end of the experiment. So the value of we could be derived from the test results and the constant β could be obtained through nonlinear fitting. The test results were shown in Table 3.
The calculation model could be used to predict the water content of solid desiccant at any time during the dehumidification process, so as to judge the degree of dehumidification. The fitting formula could be obtained as following Equations (13) and (14):
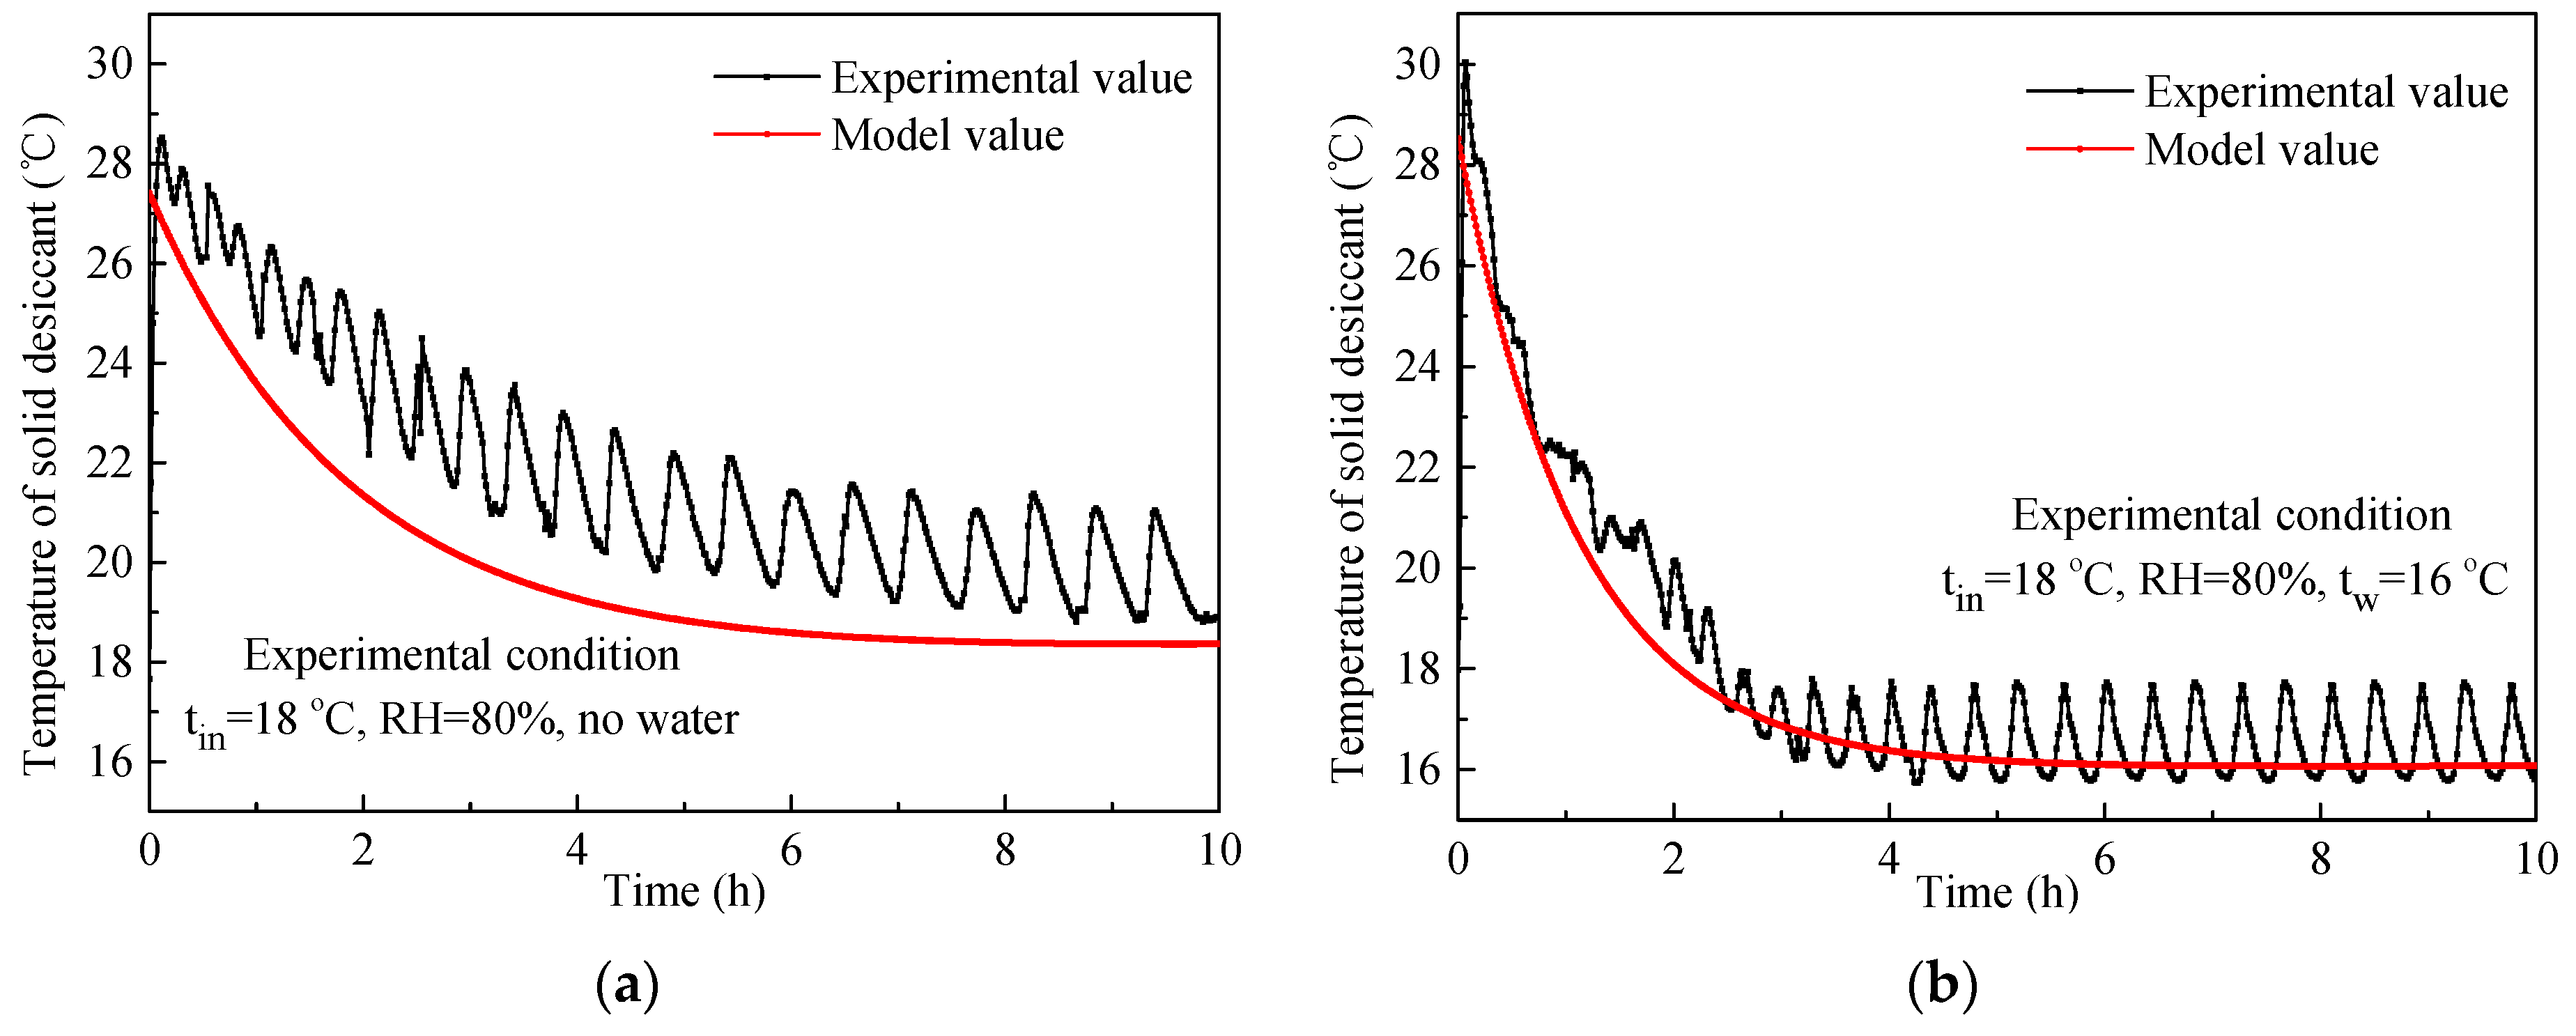
It should be noted that the Equation (13) was derived under the condition of non-internal cooling with inlet air temperature range from 20 °C to 34 °C, relative humidity range from 55% to 68%. Equation (14) was derived under the condition of internal cooling with inlet air temperature range from 20 °C to 34 °C, relative humidity range from 55% to 80% and cold water from 14 °C to 32 °C. Then a set of data that was not used in the fitting process was used to verify the accuracy of the formula respectively. The comparison results were shown in Figure 18.
From Figure 18, by comparing the testing results with the calculated results, the mean relative error of 11.5% was obtained under non-internal cooling condition. While under the internal cooling condition, the error was 5.9%.
5.2. Energy Balance
Under the influence of the adsorption heat, the temperature of the solid desiccant can be increased. The temperature variation of silica gel with time can be obtained from the energy balance of the dehumidification bed. The energy balance of the ICSPB in adsorption process as the following Equation (15):
where, the heat transfer coefficient h and the mass transfer coefficient hm are determined by the following Equations (16) and (17) [23]:
HA refers to the adsorption heat, and it can be calculated by the following Equation (18) [24]:
As it is difficult to obtain an exact analytic solution, h, hm and HA can be considered a constant. The solution model for calculating the can be obtained as following Equation (19):
where a0, a1 and a2 are constants, they can be obtained by nonlinear fitting. The constant a3 is related to the working condition of the system. When the system is running at the condition of internal cooling, the value of a3 is equal to the water temperature tw, while it is running with non-internal cooling, a3 is equal to the inlet air temperature tin. Then the following Equations (20) and (21) will be obtained.
The models above are built for auxiliary analysis of how much of the adsorption heat released from silica gel is carried away by cold water. Which can help us setting the temperature of cold water and the number of heat exchangers more reasonably. So as to provide basis for further improvement of the structure of the set-up. In order to verify the accuracy of the formula, a set of experimental data that did not used in the fitting was used for comparison respectively. The comparison results were shown in Figure 19.
Due to the unstable operation of the environmental cabinet under the test experimental conditions, the temperature of the silica gel fluctuates up and down. From Figure 19, by comparing the testing results with the calculated results, the mean relative error of 9.4% and 4.9% was obtained respectively. Which means the models can predict the temperature of the solid desiccant well during the experiments.
6. Conclusions
In this paper, a three-stage internal cooling solid adsorption packed bed was proposed. Tests on dehumidification performance have been carried out under different inlet air conditions and water temperature and making a comparation with that of non-internal cooling. The parameters used to evaluate the performance of the proposed bed, i.e., dehumidification capacity, dehumidification efficiency, water content of solid desiccant, moisture ratio of solid desiccant, temperature of solid desiccant, inlet and outlet air temperature difference were analysed. What is more, calculation models based on mass balance and energy balance were established to calculate the water content ratio and the temperature of the solid desiccant in the dehumidification process. It was found that:
- The internal cooling adsorption bed could improve the dehumidification efficiency effectively. It was more obvious in low temperature and low humidity conditions than in hot and humid. It could also be obtained with the use of free-cooling [25], refrigerators with new thermoacoustic technology [26], or the use of “Smart-windows” [27], for reducing the thermal required load.
- Water temperature has a great influence on the dehumidification effect. The lower the temperature of water, the more the dehumidification efficiency improves. For the ICSPB operating under the inlet air temperature of 20 °C and relative humidity of 55%, the dehumidification efficiency could be improved by 59.69% and 39.32% with cold water of 14 °C and 18 °C supplying to the heat exchangers respectively, for this purpose, geothermal heat pumps [28] could be used.
- Under the condition of low temperature and humidity, the utilization ratio of the solid desiccant with internal cooling was 1.2–1.5 times that of non-internal cooling test conditions in the effective dehumidification time.
- The outlet air temperature could be reduced by 14 °C maximally compared with that without internal cooling when the ICSPB operated at the inlet air temperature of 34 °C, relative humidity of 68% and water temperature of 28 °C. So that the sensible heat load could be reduced, and special heat recovery units [29] could be used.
- In the multi-stage dehumidification bed, the first stage adsorption bed played the most important role.
Author Contributions
W.Y. conceived and designed the study; J.R. and Z.L. performed the experiments and analysed the data; X.Z. contributed analysis tools; J.R. wrote the paper and Z.W. helped polish the language of the manuscript.
Funding
This work was financially supported by the National Key R&D Program of China: Low Energy Dew Point Cooling for Computing Data Centres (2016YFE0133300); ROPEAN COMMISSION: Horizon 2020-Research and Innovation Framework Programme: Low Energy Dew Point Cooling for Computing Data Centres (734340-DEW-COOL-4-CDC-MSCA-RIS); The Department of Science and Technology of Guangdong Province, China (2014A010106031 & 2013B091500094).
Conflicts of Interest
The authors declare no conflict of interest.
Nomenclature
| A | cross-sectional area, m2; |
| C | perimeter of air flow passage, m; |
| c | specific heat, kJ/kg K; |
| d | humidity ratio, g water/kg dry air; |
| G | mass flux, kg/m2 s; |
| K1 | regression constant depending on the inlet air temperature; |
| K2 | regression constant depending on the inlet air temperature; |
| h | heat transfer coefficient, kW/m2 K; |
| hm | mass transfer coefficient, kg/m2 s; |
| HA | adsorption heat, kJ/kg; |
| L | thickness of solid desiccant, m; |
| m | mass of the desiccant, kg; |
| MR | moisture ratio; |
| Re | Reynolds number; |
| T | temperature, °C; |
| u | velocity of the air, m/s; |
| w | water content ratio, kg water/kg dry silica; |
| τ | time, h; |
| ρ | density, kg/m3; |
| η | dehumidification efficiency, %; |
| ε | fractional void volume; |
| β | constant; |
| Subscript | |
| 0 | initial condition; |
| a | air; |
| e | final condition; |
| in | inlet; |
| out | outlet; |
| s | solid desiccant; |
| w | water |
References
- Hu, L.M.; Ge, T.S.; Jiang, Y.; Wang, R.Z. Performance study on composite desiccant material coated fin-tube heat exchangers. Int. J. Heat Mass Transf. 2015, 90, 109–120. [Google Scholar] [CrossRef]
- Jani, D.B.; Mishra, M.; Sahoo, P.K. Solid desiccant air conditioning—A state of the art review. Renew. Sustain. Energy Rev. 2016, 60, 1451–1469. [Google Scholar] [CrossRef]
- Yeboah, S.K.; Darkwa, J. A critical review of thermal enhancement of packed beds for water vapour adsorption. Renew. Sustain. Energy Rev. 2016, 58, 1500–1520. [Google Scholar] [CrossRef]
- Gandhidasan, P.; Al-Farayedhi, A.A.; Al-Mubarak, A.A. Dehydration of natural gas using solid desiccants. Energy 2001, 26, 855–868. [Google Scholar] [CrossRef]
- Golubovic, M.N.; Hettiarachchi, H.D.M.; Worek, W.M. Sorption properties for different types of molecular sieve and their influence on optimum dehumidification performance of desiccant wheels. Int. J. Heat Mass Transf. 2006, 49, 2802–2809. [Google Scholar] [CrossRef]
- Yang, L.J.; Li, W.; Chen, L.N.; Zheng, Q.; Chen, W. Effect of fixed adsorption bed structure on regeneration and dehumidification. J. Refrig. 2015, 36, 101–105. [Google Scholar]
- Ramzy, A.; Abdelmeguid, H.; Elawady, W.M. A novel approach for enhancing the utilization of solid desiccants in packed bed via intercooling. Appl. Therm. Eng. 2015, 78, 82–89. [Google Scholar] [CrossRef]
- Hung, B.N.; Nuntaphan, A.; Kiatsiriroat, T. Effect of internal cooling/heating coil on adsorption/regeneration of solid desiccant tray for controlling air humidity. Int. J. Energy Res. 2008, 32, 980–987. [Google Scholar] [CrossRef]
- Yuan, W.X.; Zheng, Y.; Liu, X.; Yuan, X.G. Study of a new modified cross-cooled compact solid desiccant dehumidifier. Appl. Therm. Eng. 2008, 28, 2257–2266. [Google Scholar] [CrossRef]
- Peng, Z.Z.; Dai, Y.J.; La, D.; Wang, R.Z. Transient dehumidification performance of a novel regenerative desiccant heat exchanger. Acta Energiae Sol. Sin. 2011, 32, 530–536. [Google Scholar]
- Ge, T.S.; Dai, Y.J.; Wang, R.Z.; Peng, Z.Z. Experimental comparison and analysis on silica gel and polymer coated fin-tube heat exchangers. Energy 2010, 35, 2893–2900. [Google Scholar] [CrossRef]
- Ge, T.S.; Dai, Y.J.; Li, Y.; Wang, R.Z. Simulation investigation on solar powered desiccant coated heat exchanger cooling system. Appl. Energy 2012, 93, 532–540. [Google Scholar] [CrossRef]
- Ge, T.S.; Dai, Y.J.; Li, Y.; Wang, R.Z. Feasible study of a self-cooled solid desiccant cooling system based on desiccant coated heat exchanger. Appl. Therm. Eng. 2013, 58, 281–290. [Google Scholar] [CrossRef]
- Li, Z.; Michiyuki, S.; Takeshi, F. Experimental study on heat and mass transfer characteristics for a desiccant-coated fin-tube heat exchanger. Int. J. Heat Mass Transf. 2015, 89, 641–651. [Google Scholar] [CrossRef]
- Finocchiaro, P.; Beccali, M.; Gentile, V. Experimental results on adsorption beds for air dehumidification. Int. J. Refrig. 2016, 63, 100–112. [Google Scholar] [CrossRef]
- Cannistraro, M.; Lorenzini, E. The Applications of the New Technologies “E-Sensing” in Hospitals. Int. J. Heat Technol. 2016, 34, 551–557. [Google Scholar] [CrossRef]
- Zhao, Y.; Dai, Y.J.; Ge, T.S.; Wang, H.H.; Wang, R.Z. A high performance desiccant dehumidification unit using solid desiccant coated heat exchanger with heat recovery. Energy Build. 2016, 116, 583–592. [Google Scholar] [CrossRef]
- Zhang, L.Z.; Niu, J.L. Performance comparisons of desiccant wheels for air dehumidification and enthalpy recovery. Appl. Therm. Eng. 2002, 22, 1347–1367. [Google Scholar] [CrossRef]
- Hamed, A.M.; El Rahman, W.R.A.; El-Emam, S.H. Experimental study of the transient adsorption/desorption characteristics of silica gel particles in fluidized bed. Energy 2010, 35, 2468–24837. [Google Scholar] [CrossRef]
- Koua, K.B.; Fassinou, W.F.; Gbaha, P.; Toure, S. Mathematical modelling of the thin layer solar drying of banana, mango and cassava. Energy 2009, 34, 1594–1602. [Google Scholar] [CrossRef]
- Yang, W.S.; Deng, H.; Wang, Z.Y.; Zhao, X.D.; He, S. Performance Investigation of the Novel Solar-Powered Dehumidification Window for Residential Buildings. Energies 2017, 10, 1369. [Google Scholar] [CrossRef]
- Kabeel, A.E. Adsorption–desorption operations of multilayer desiccant packed bed for dehumidification applications. Renew. Energy 2009, 34, 255–265. [Google Scholar] [CrossRef]
- Ramzy, K.A.; Babu, T.P.A.; Kadoli, R. Semi-analytical method for heat and moisture transfer in packed bed of silica gel. Int. J. Heat Mass Transf. 2011, 54, 983–993. [Google Scholar] [CrossRef]
- Pesaran, A.A.; Mills, A.F. Moisture transport in silica gel packed beds—I. Theoretical study. Int. J. Heat Mass Transf. 1987, 30, 1037–1049. [Google Scholar] [CrossRef]
- Cannistraro, G. Reducing the Demand of Energy Cooling in the CED, “Centers of Processing Data”, with Use of Free-Cooling Systems. Int J. Heat Technol. 2016, 34, 498–502. [Google Scholar] [CrossRef]
- Piccolo, A.; Siclari, R.; Rando, F.; Cannistraro, M. Comparative Performance of Thermoacoustic Heat Exchangers with Different Pore Geometries in Oscillatory Flow. Implementation of Experimental Techniques. Appl. Sci. 2017, 7, 784. [Google Scholar] [CrossRef]
- Cannistraro, M.; Castelluccio, M.E.; Germanò, D. New Sol-Gel Deposition Technique in the Smart-Windows—Computation of possible applications of Smart-Windows in Buildings. J. Build. Eng. 2018, 19, 205–301. [Google Scholar] [CrossRef]
- Cannistraro, M.; Mainardi, E.; Bottarelli, M. Testing a dual-source heat pump. Math. Model. Eng. Probl. 2018, 5, 205–210. [Google Scholar] [CrossRef]
- Cannistraro, G.; Cannistraro, M.; Galvagno, A.; Trovato, G. Analysis and measures for energy savings in operating theaters. Int. J. Heat Technol. 2017, 35, S442–S448. [Google Scholar] [CrossRef]
Figure 1.
Schematic of the proposed system.

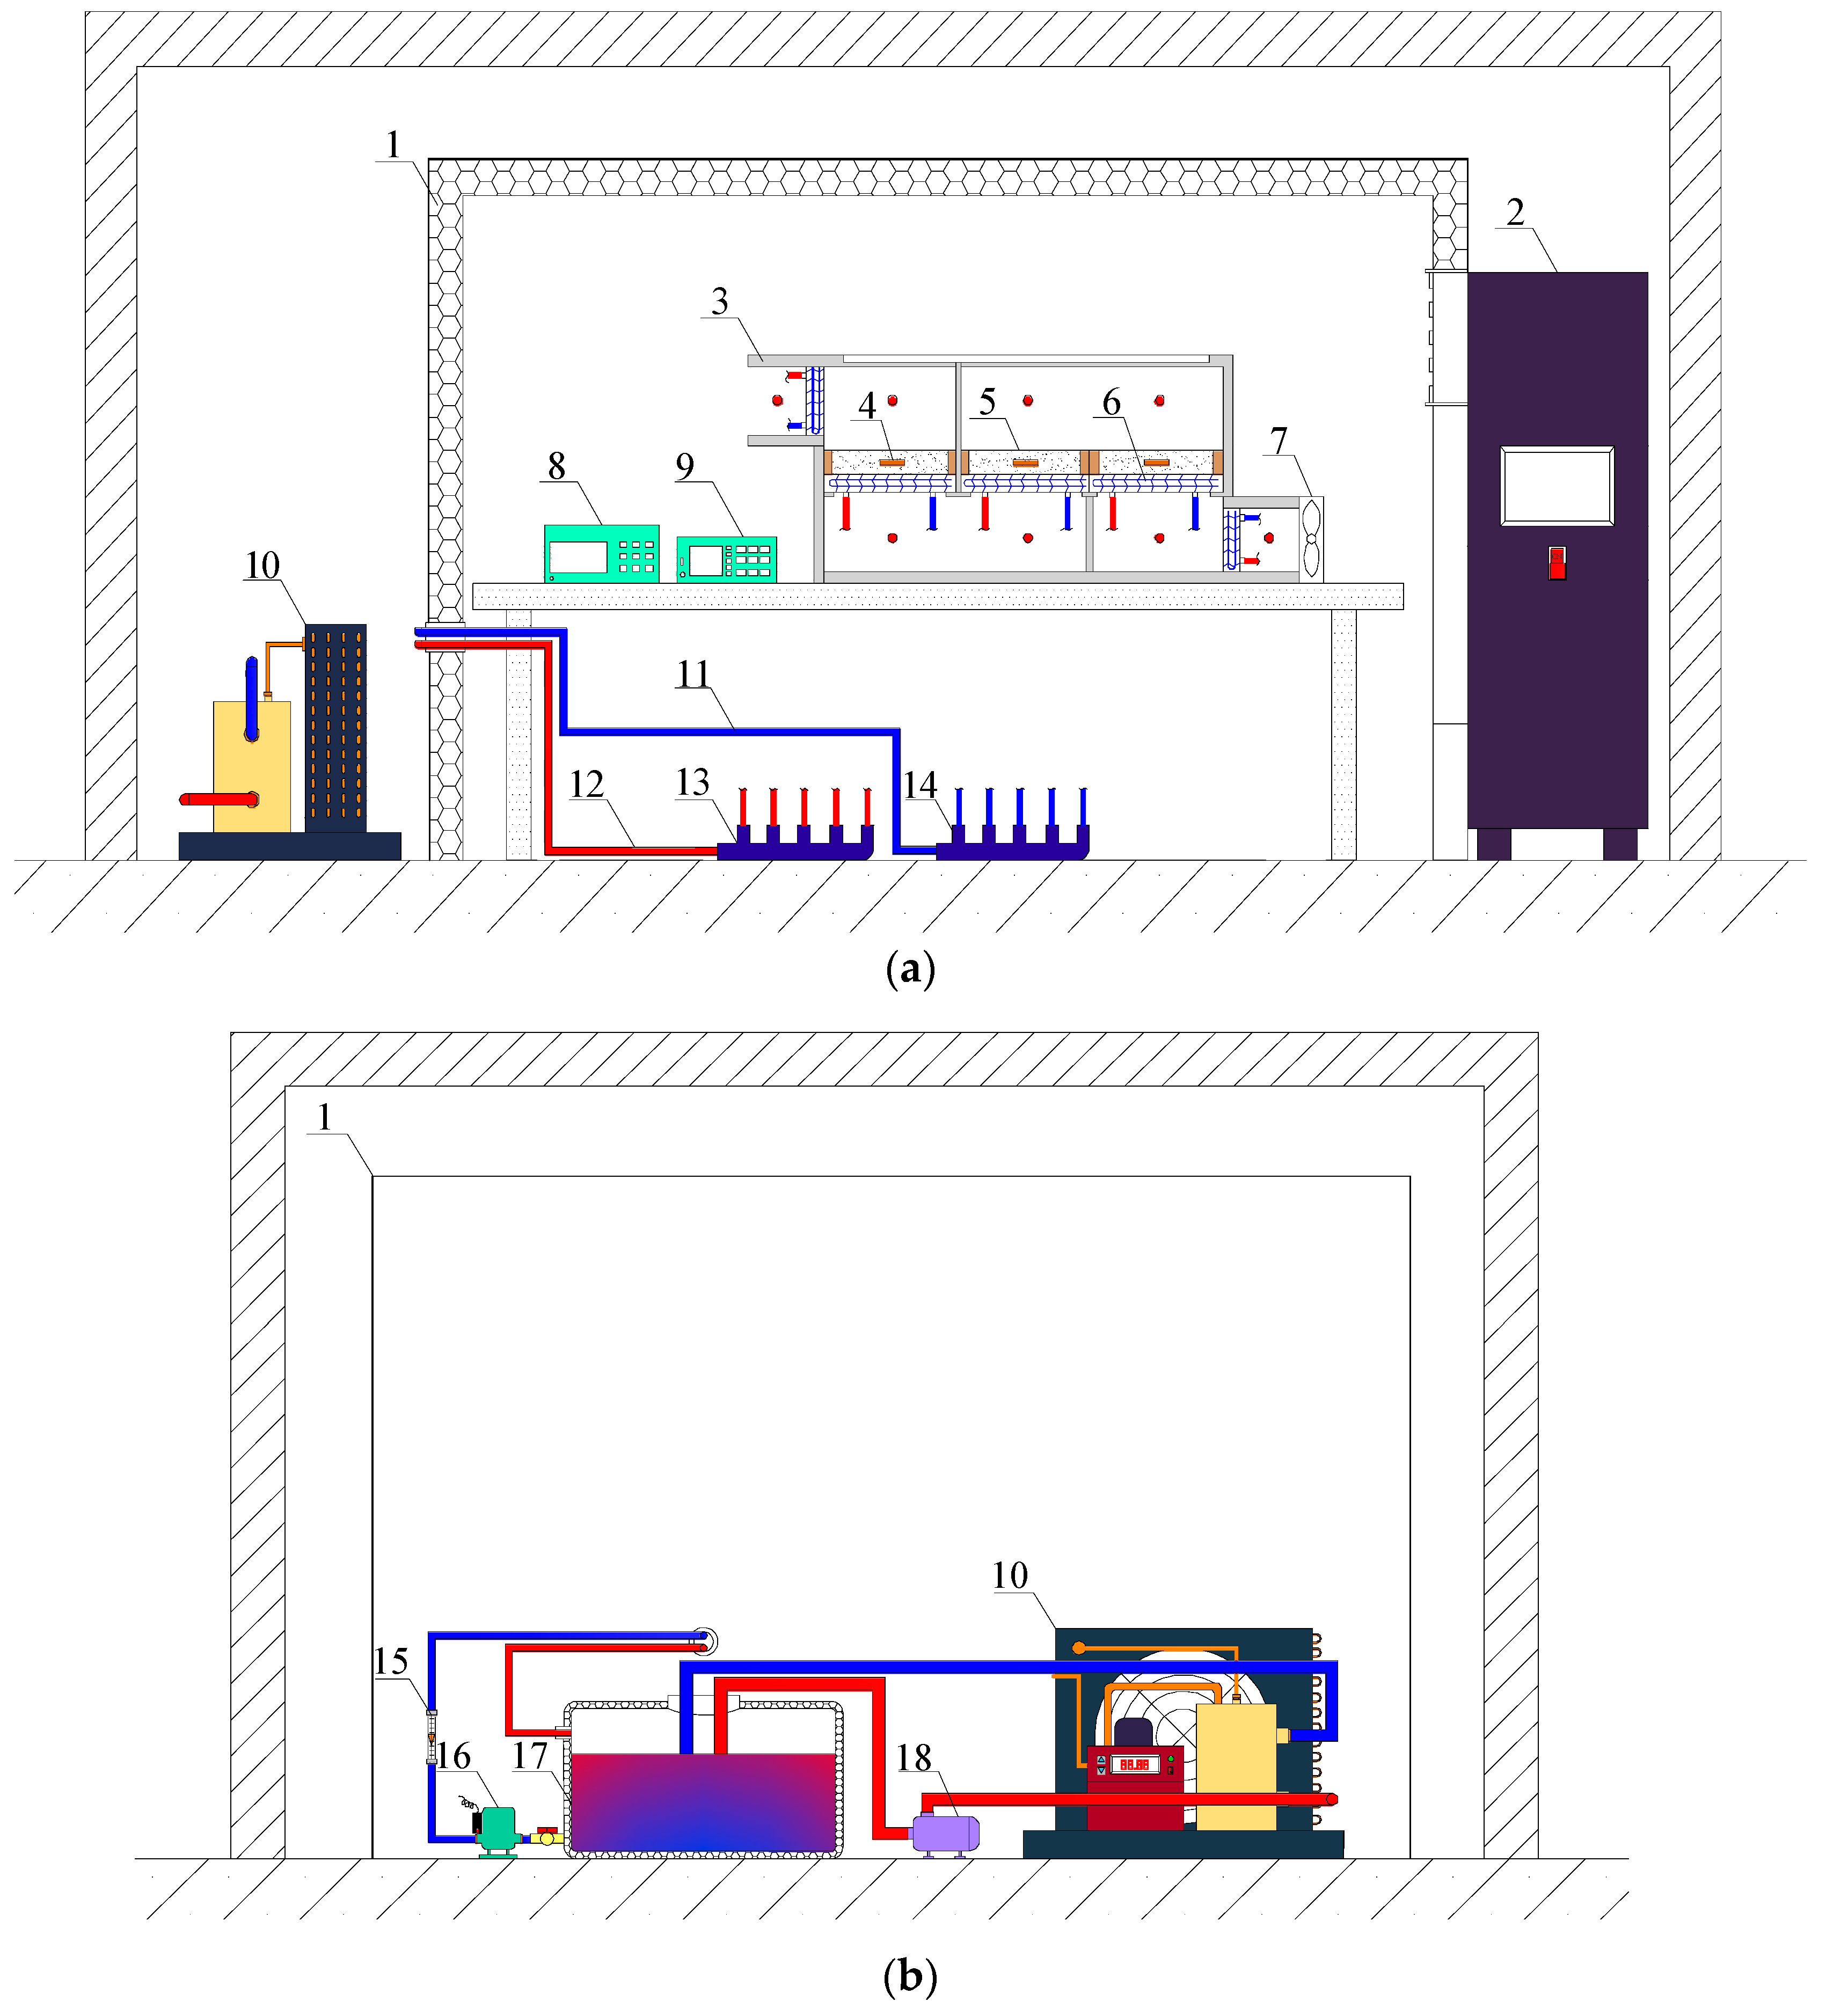
Figure 2.
Images of the test rig: (a) the front view; (b) the left view: 1—Environmental cabinet; 2—Control cabinet; 3—Shell; 4—Thermocouple; 5—Silica gel; 6—Fin-tube heat exchanger; 7—Fan; 8—Multi-channel temperature and humidity monitor; 9—Multi-channel temperature logger; 10—Water chiller; 11—Water supply pipe; 12—Return pipe; 13—Water collector; 14—Water distributor; 15—Rotameter; 16—Booster pump; 17—Water tank; 18—Self-priming pump.

Figure 3.
Image of the environmental cabinet.
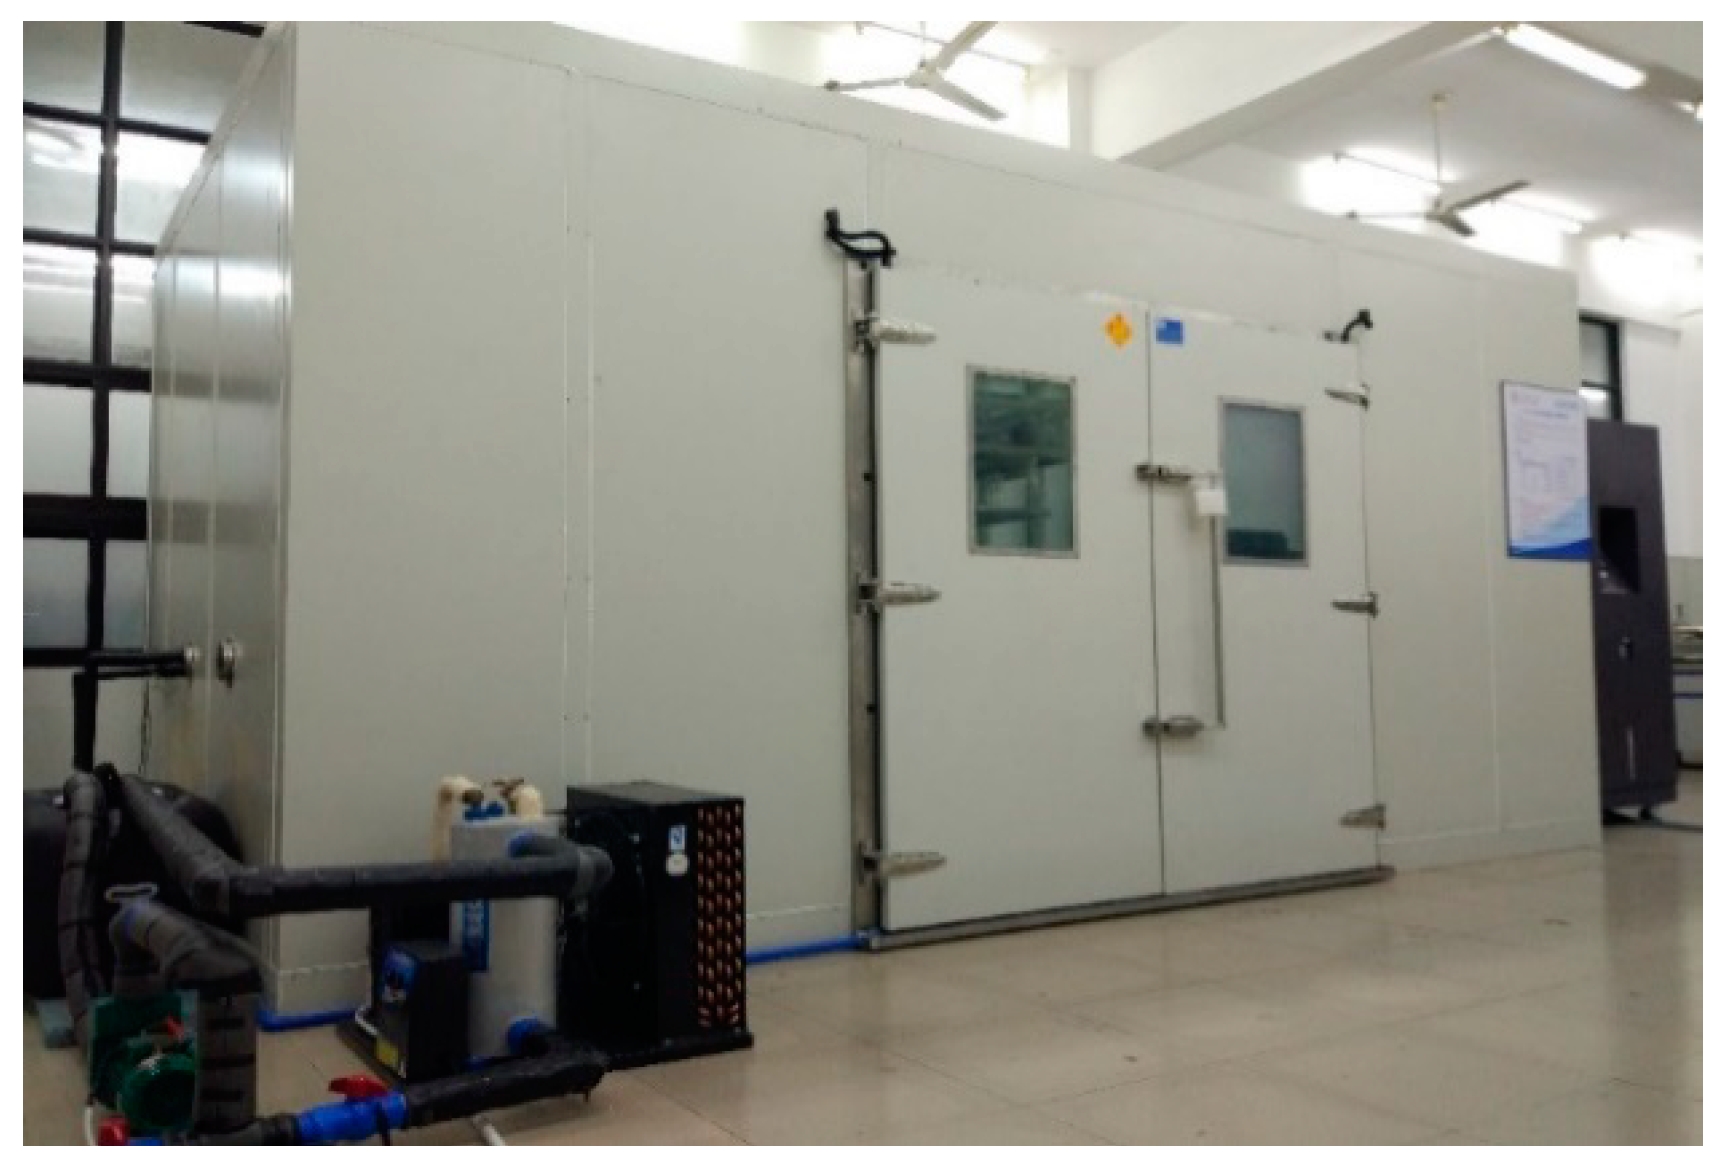
Figure 4.
Image of the packed bed dehumidification system.
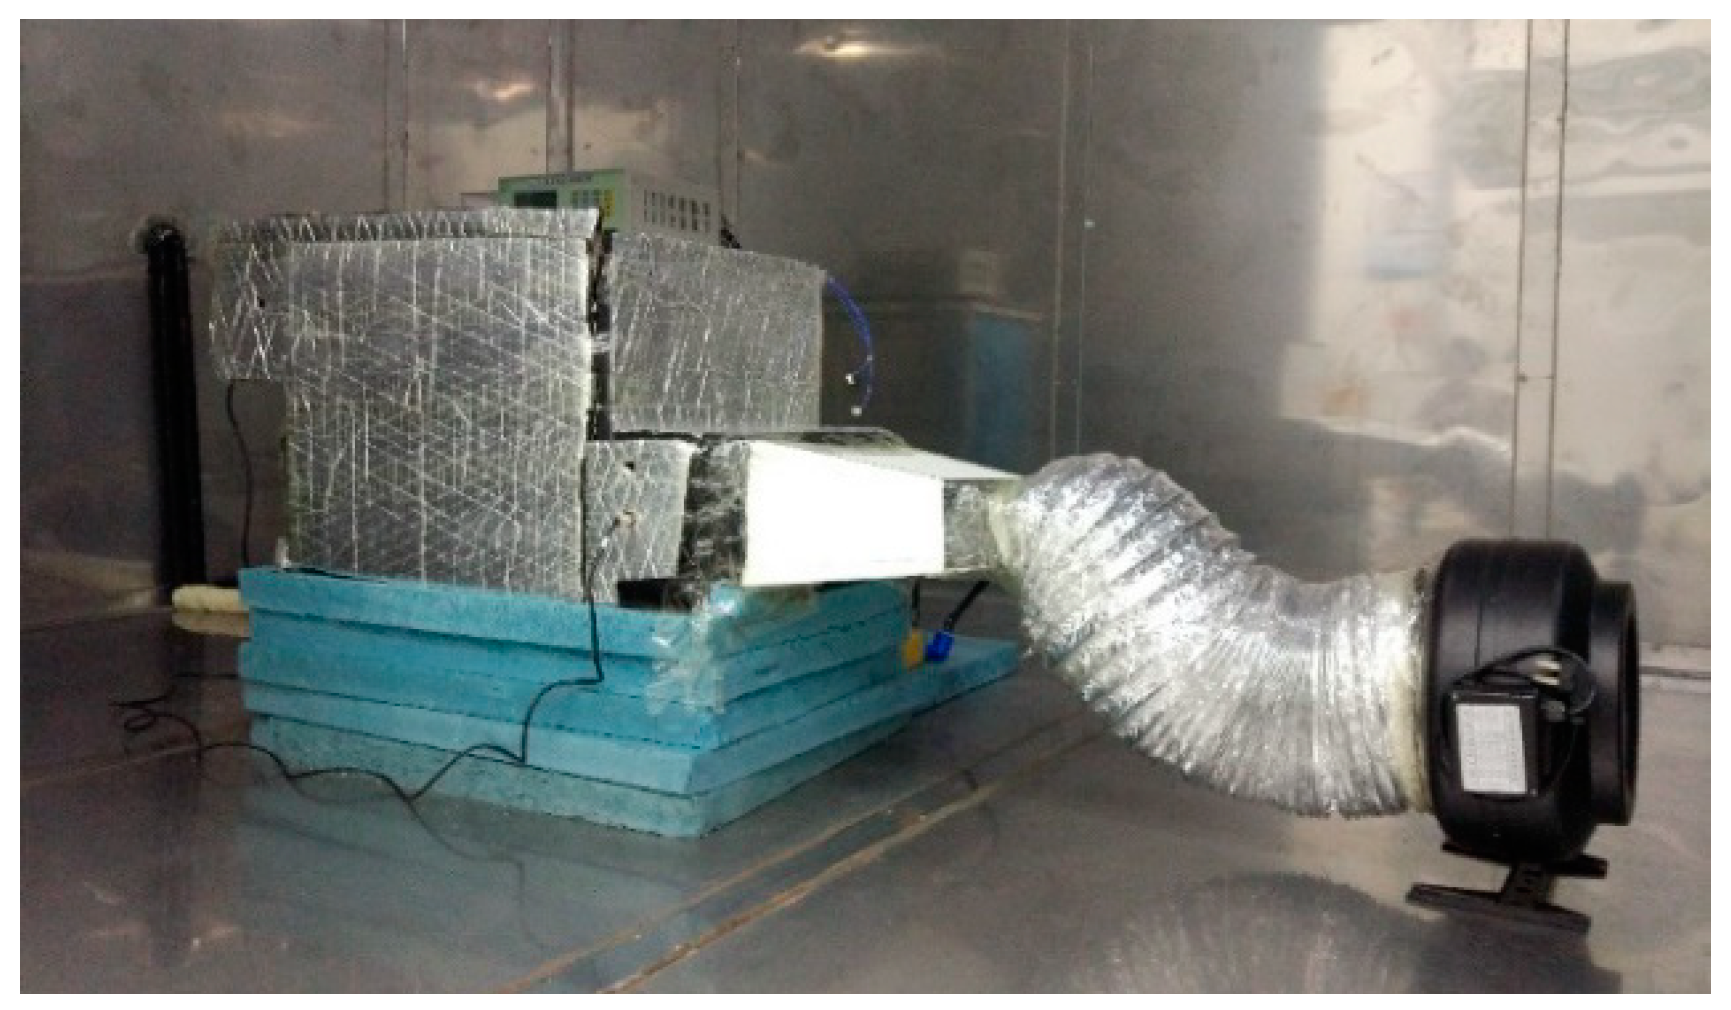
Figure 5.
Image of the cold water supplying system.
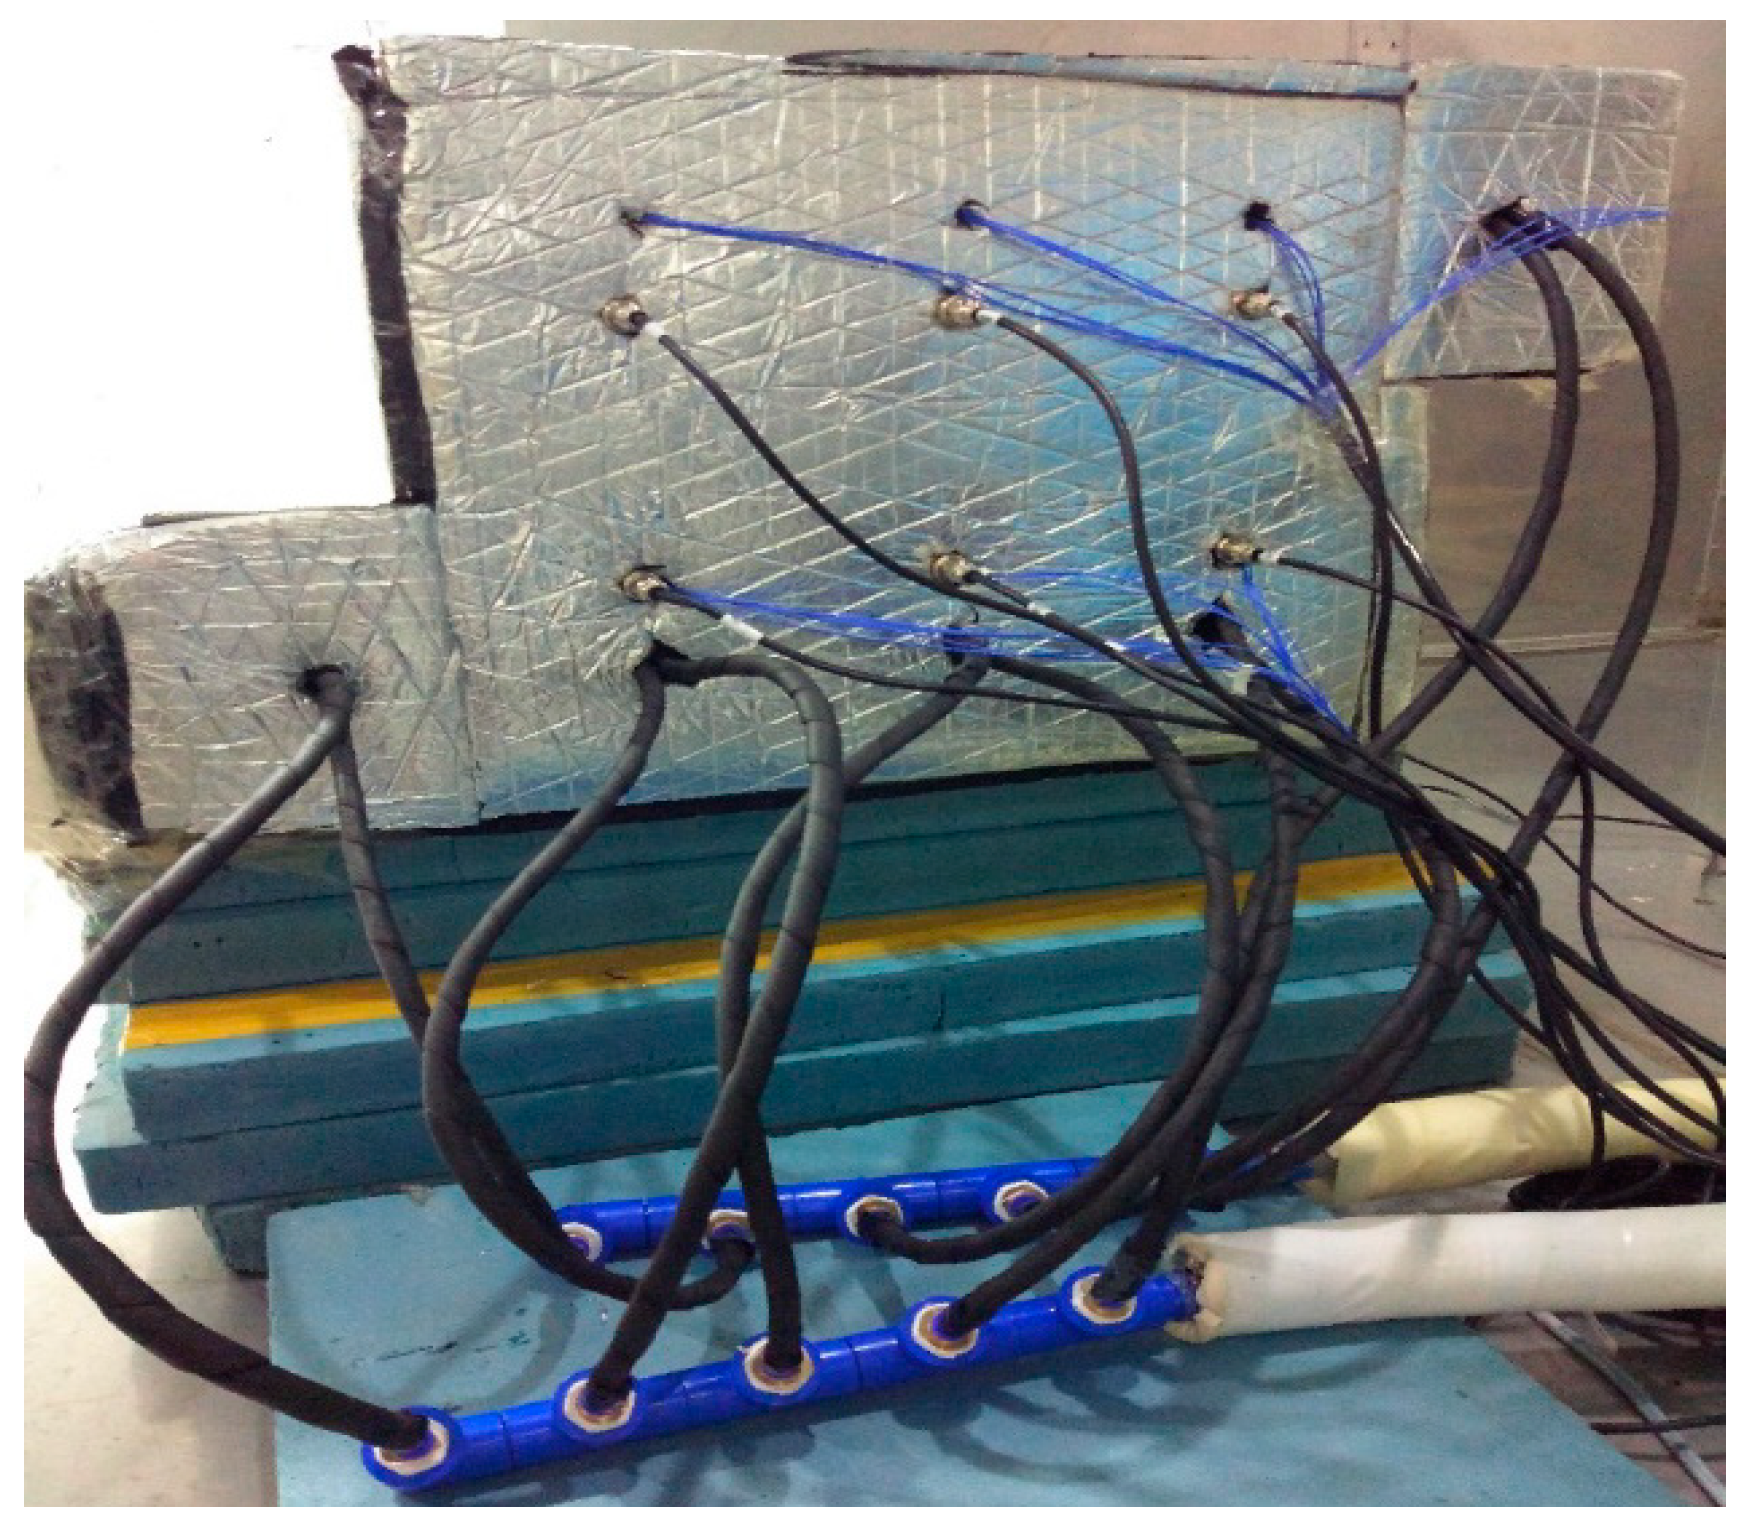
Figure 6.
Image of the data acquisition system.
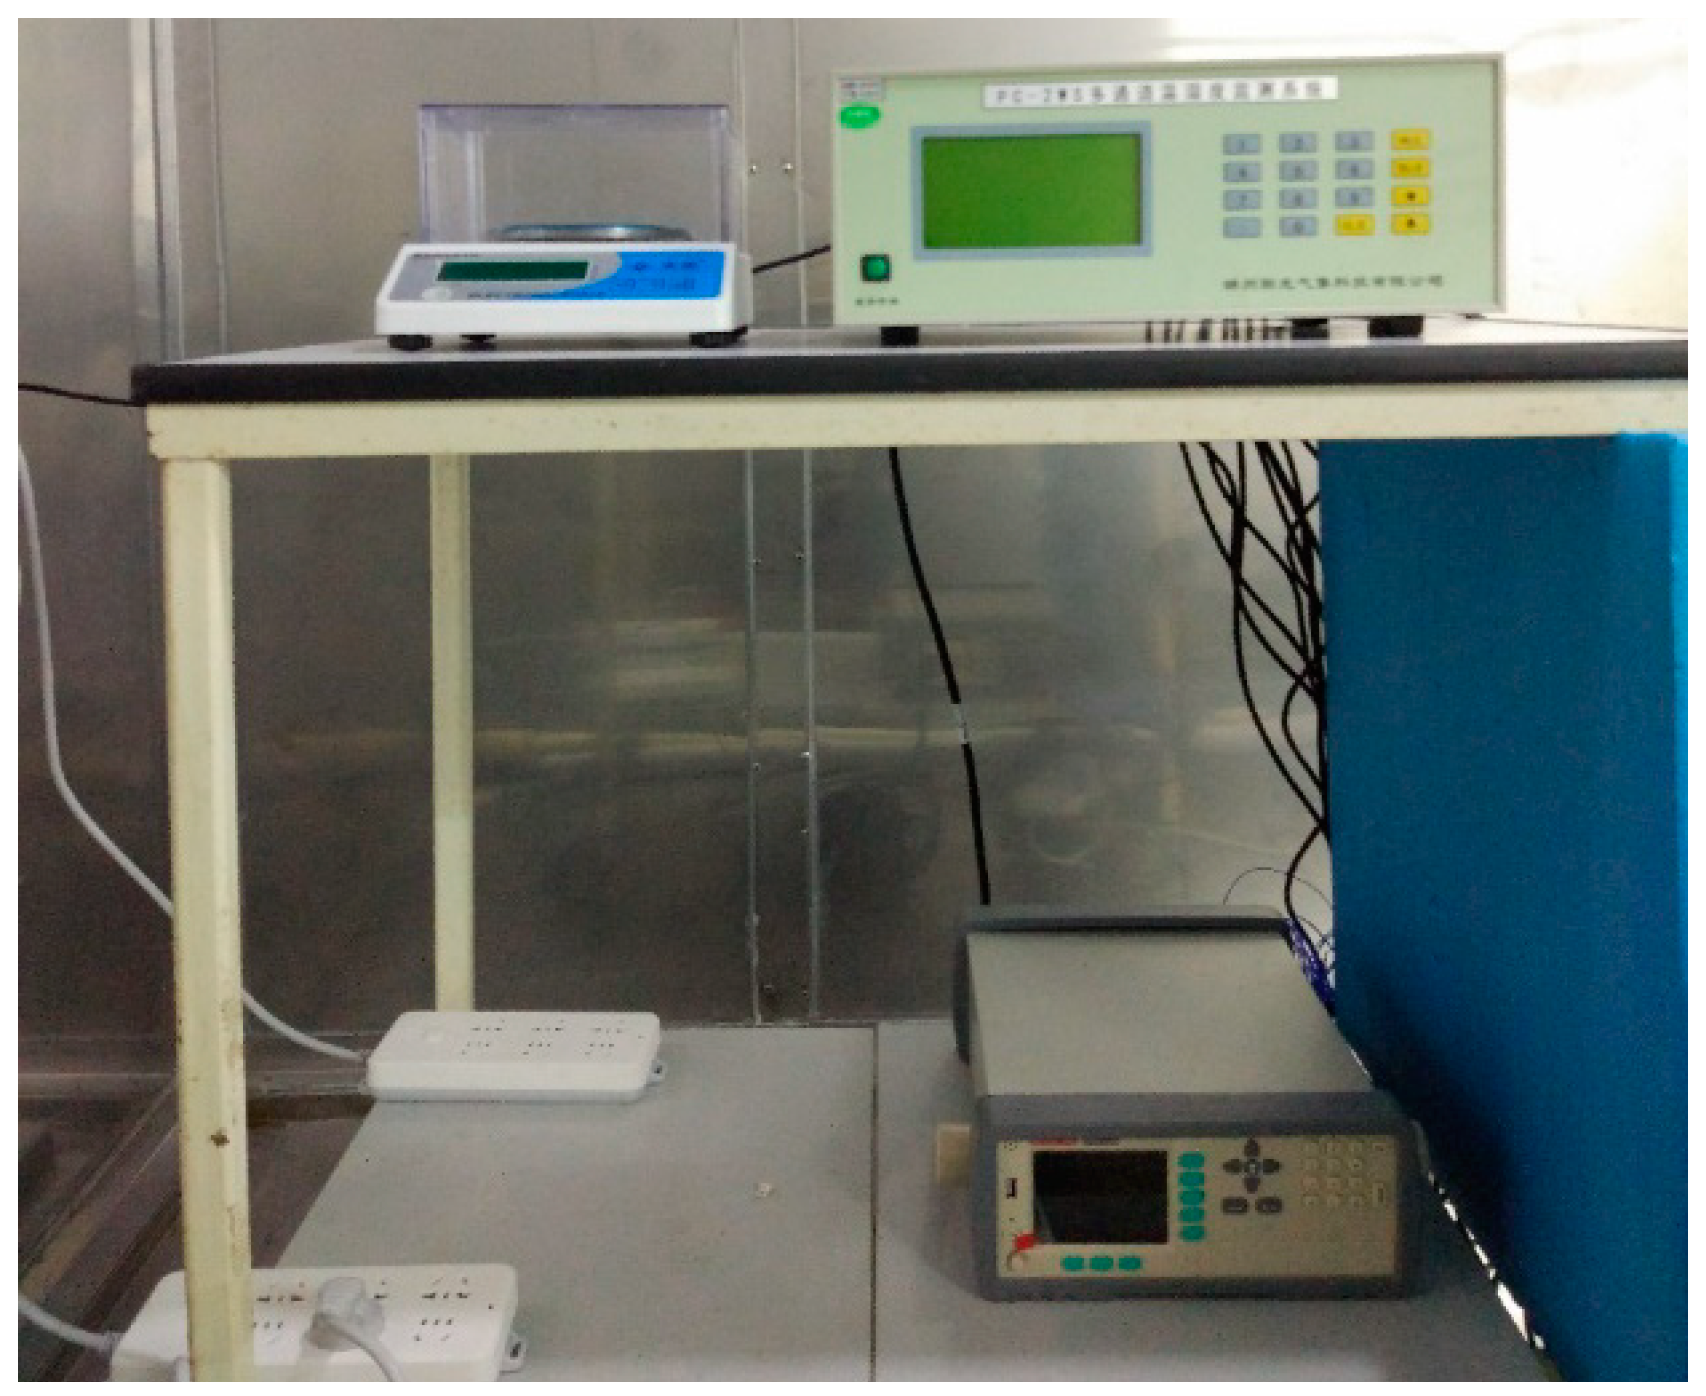
Figure 7.
Variation of the dehumidification capacity with time.
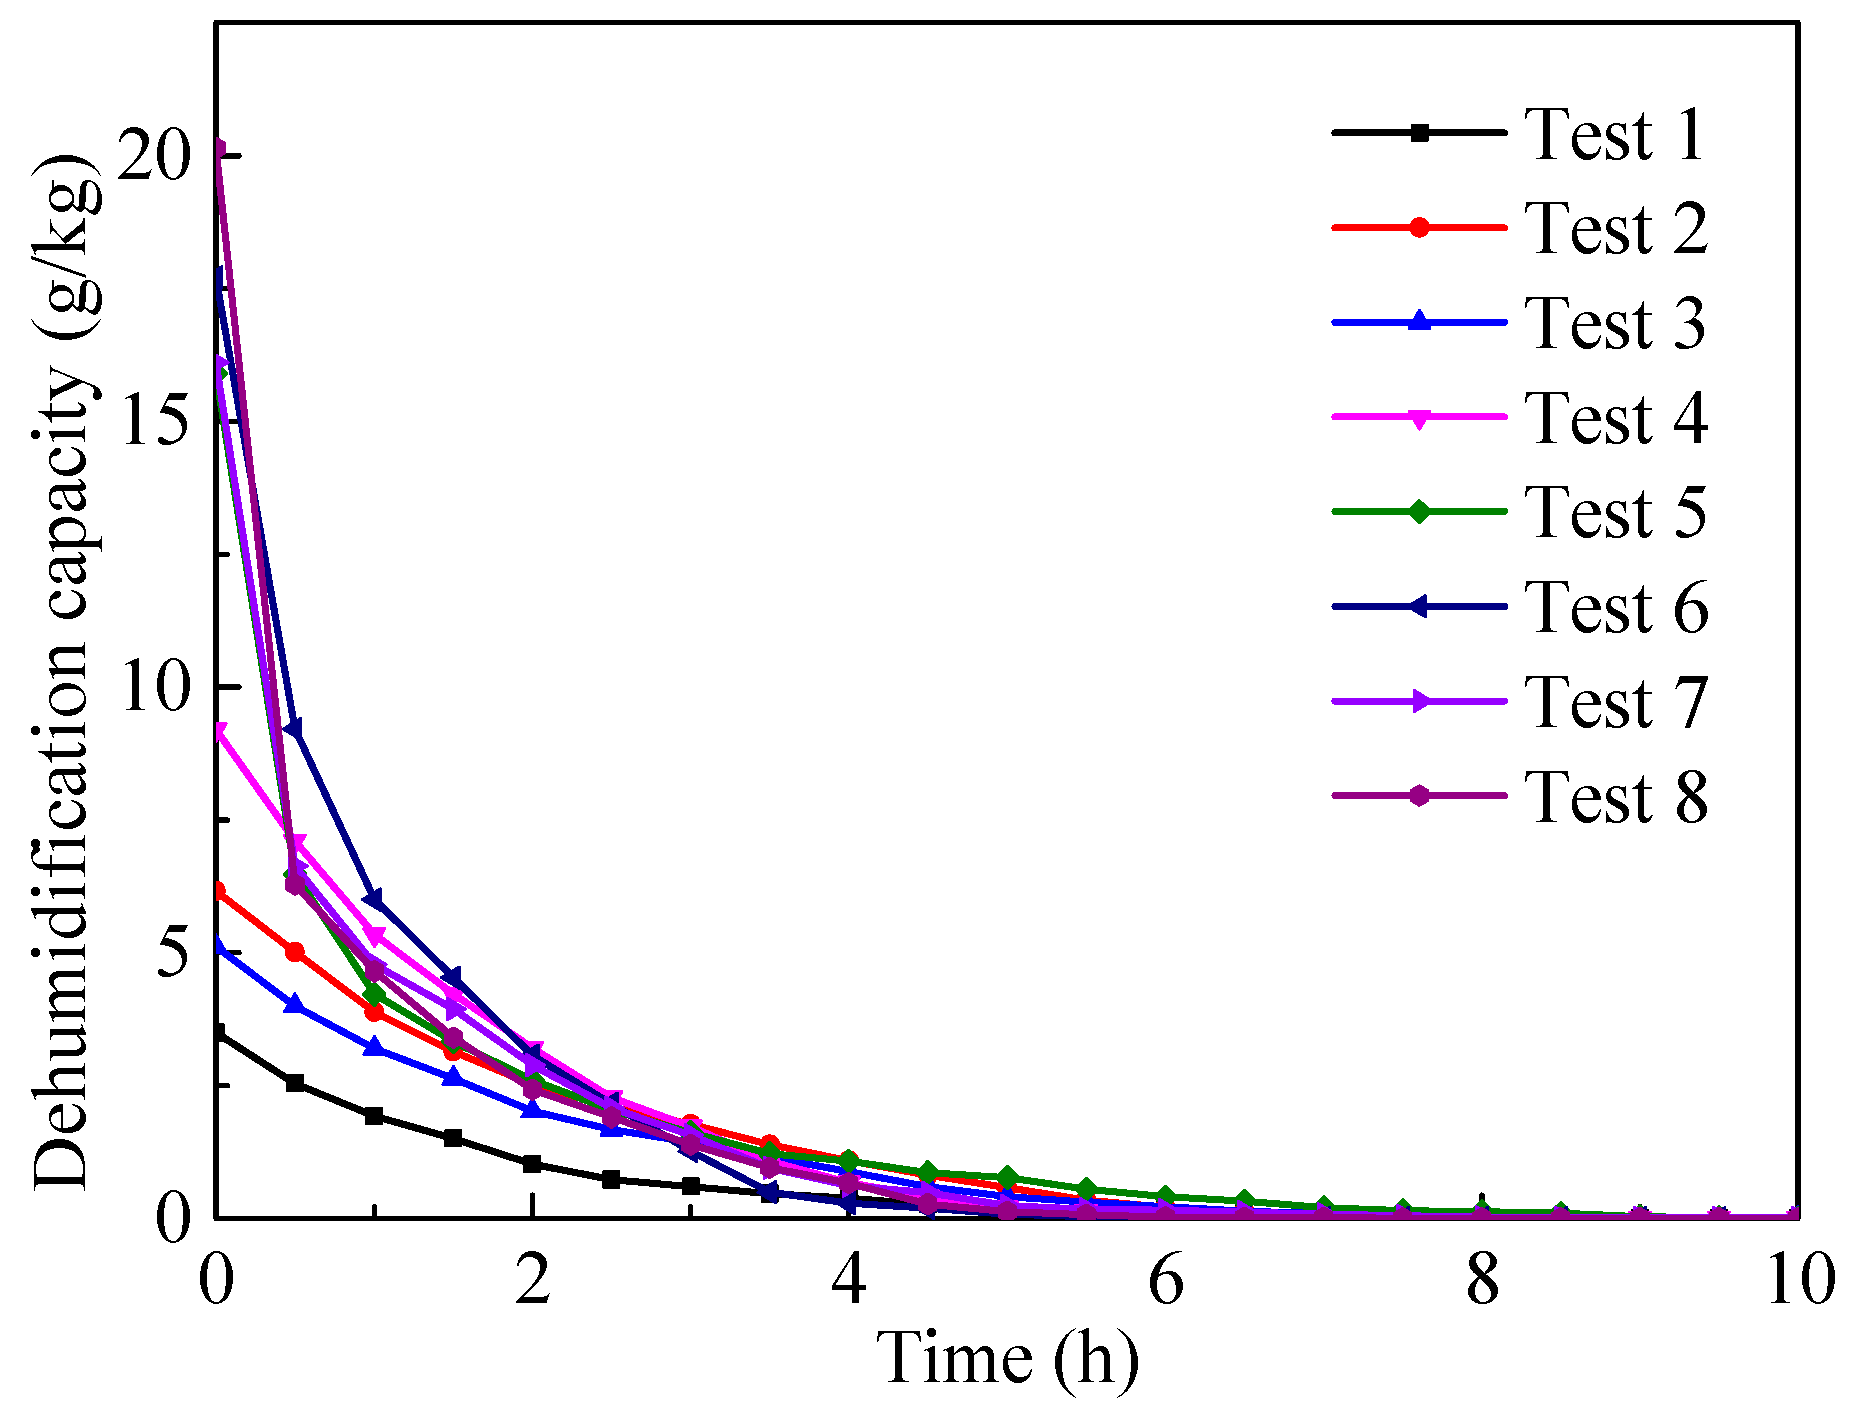
Figure 8.
Variation of the dehumidification efficiency with time.

Figure 9.
Variation of the water content of the whole dehumidification device with time.
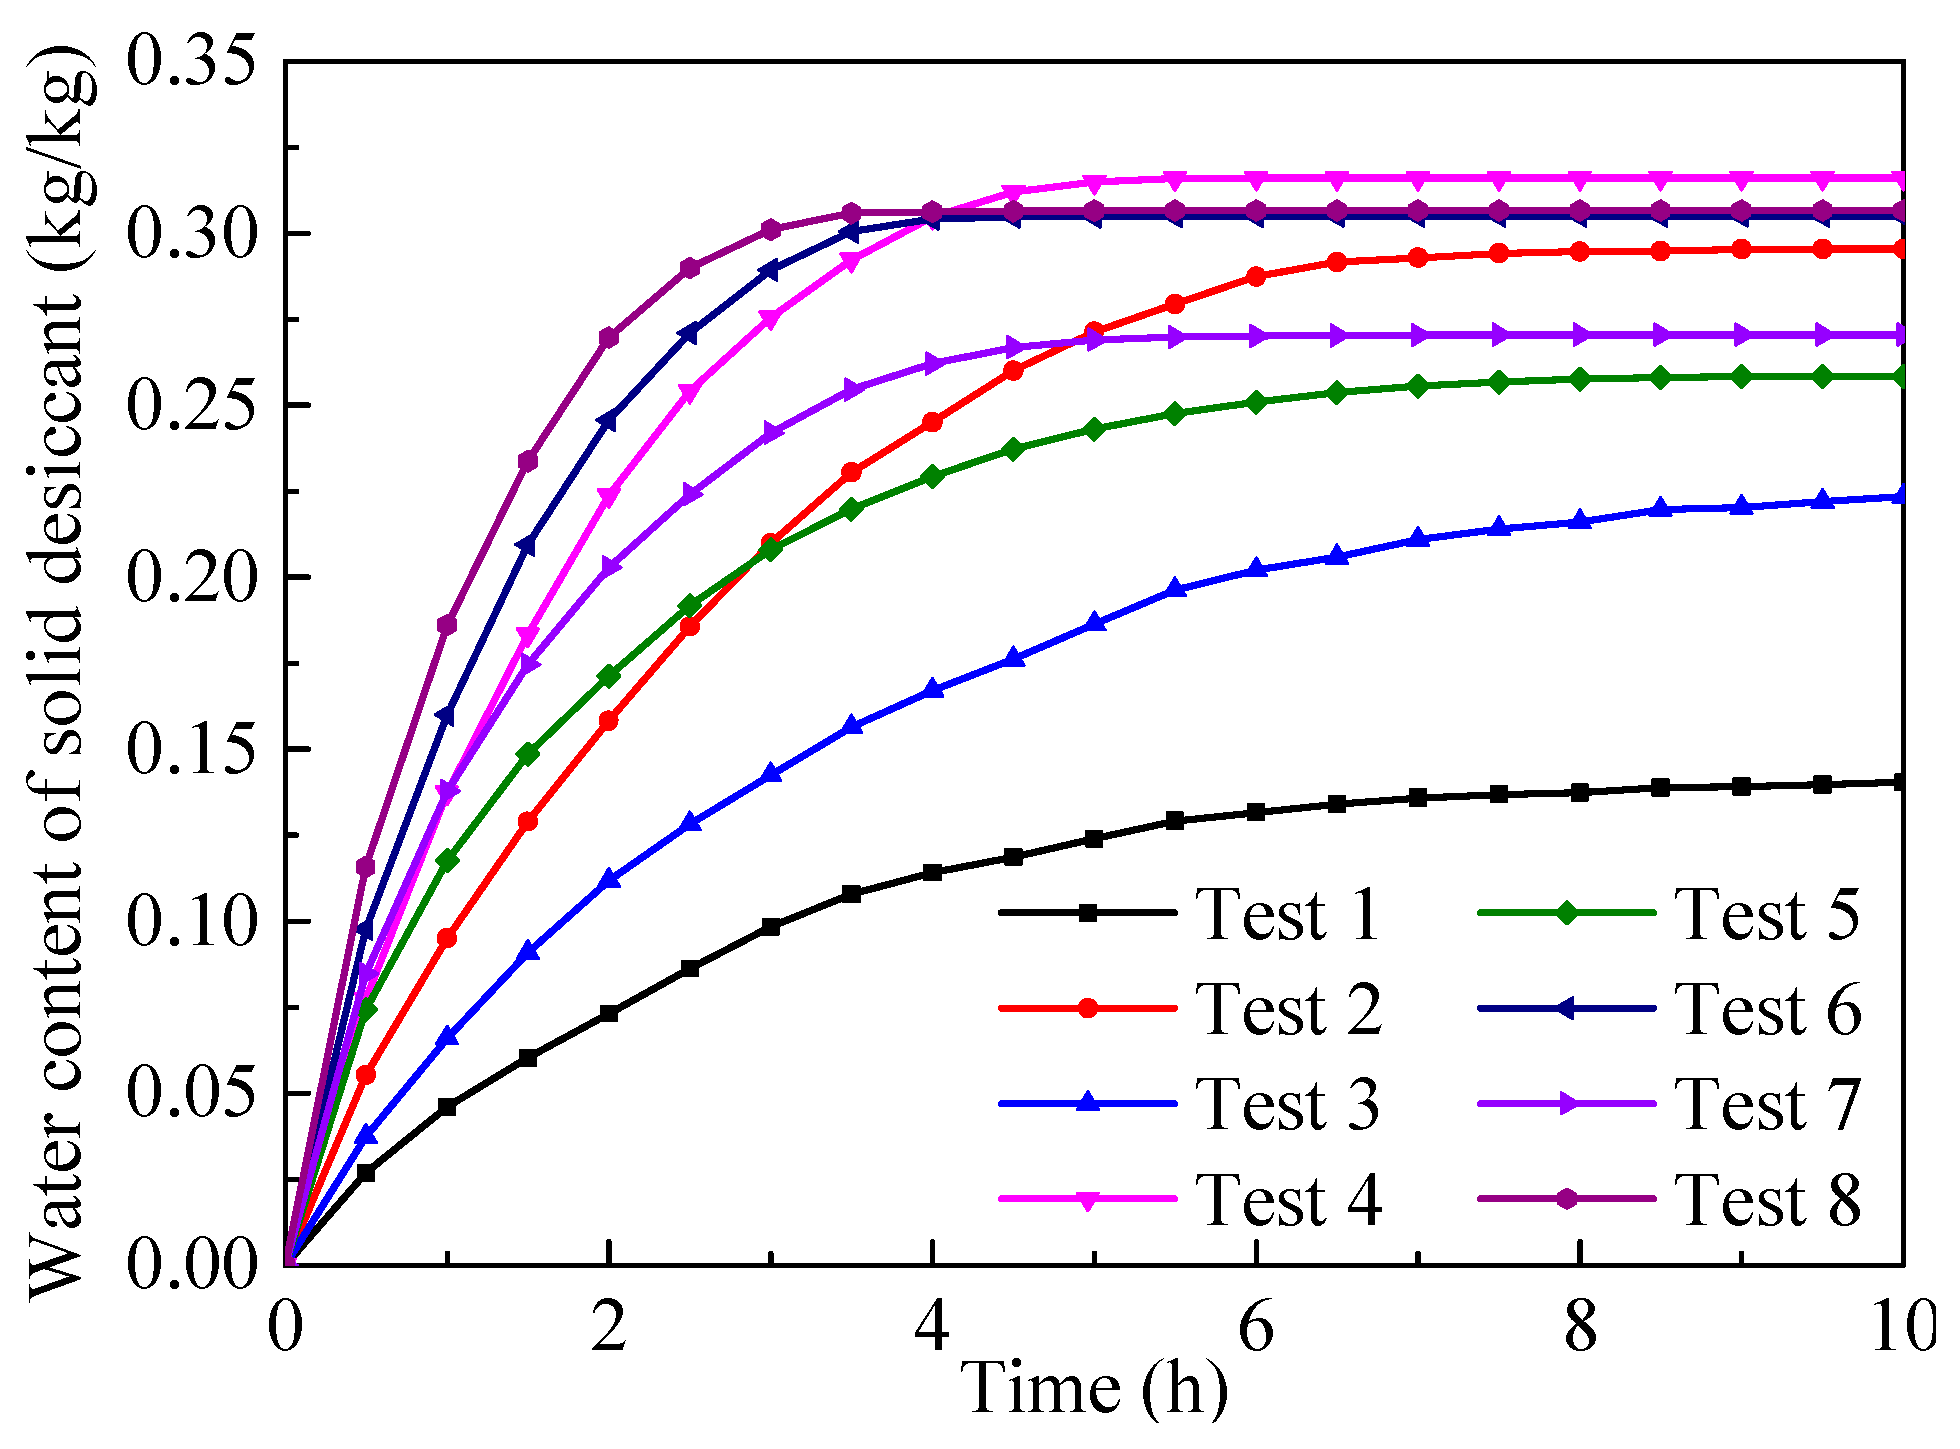
Figure 10.
Variation of water content of each stage with time: (a) without internal cooling; (b) with internal cooling.
Figure 10.
Variation of water content of each stage with time: (a) without internal cooling; (b) with internal cooling.
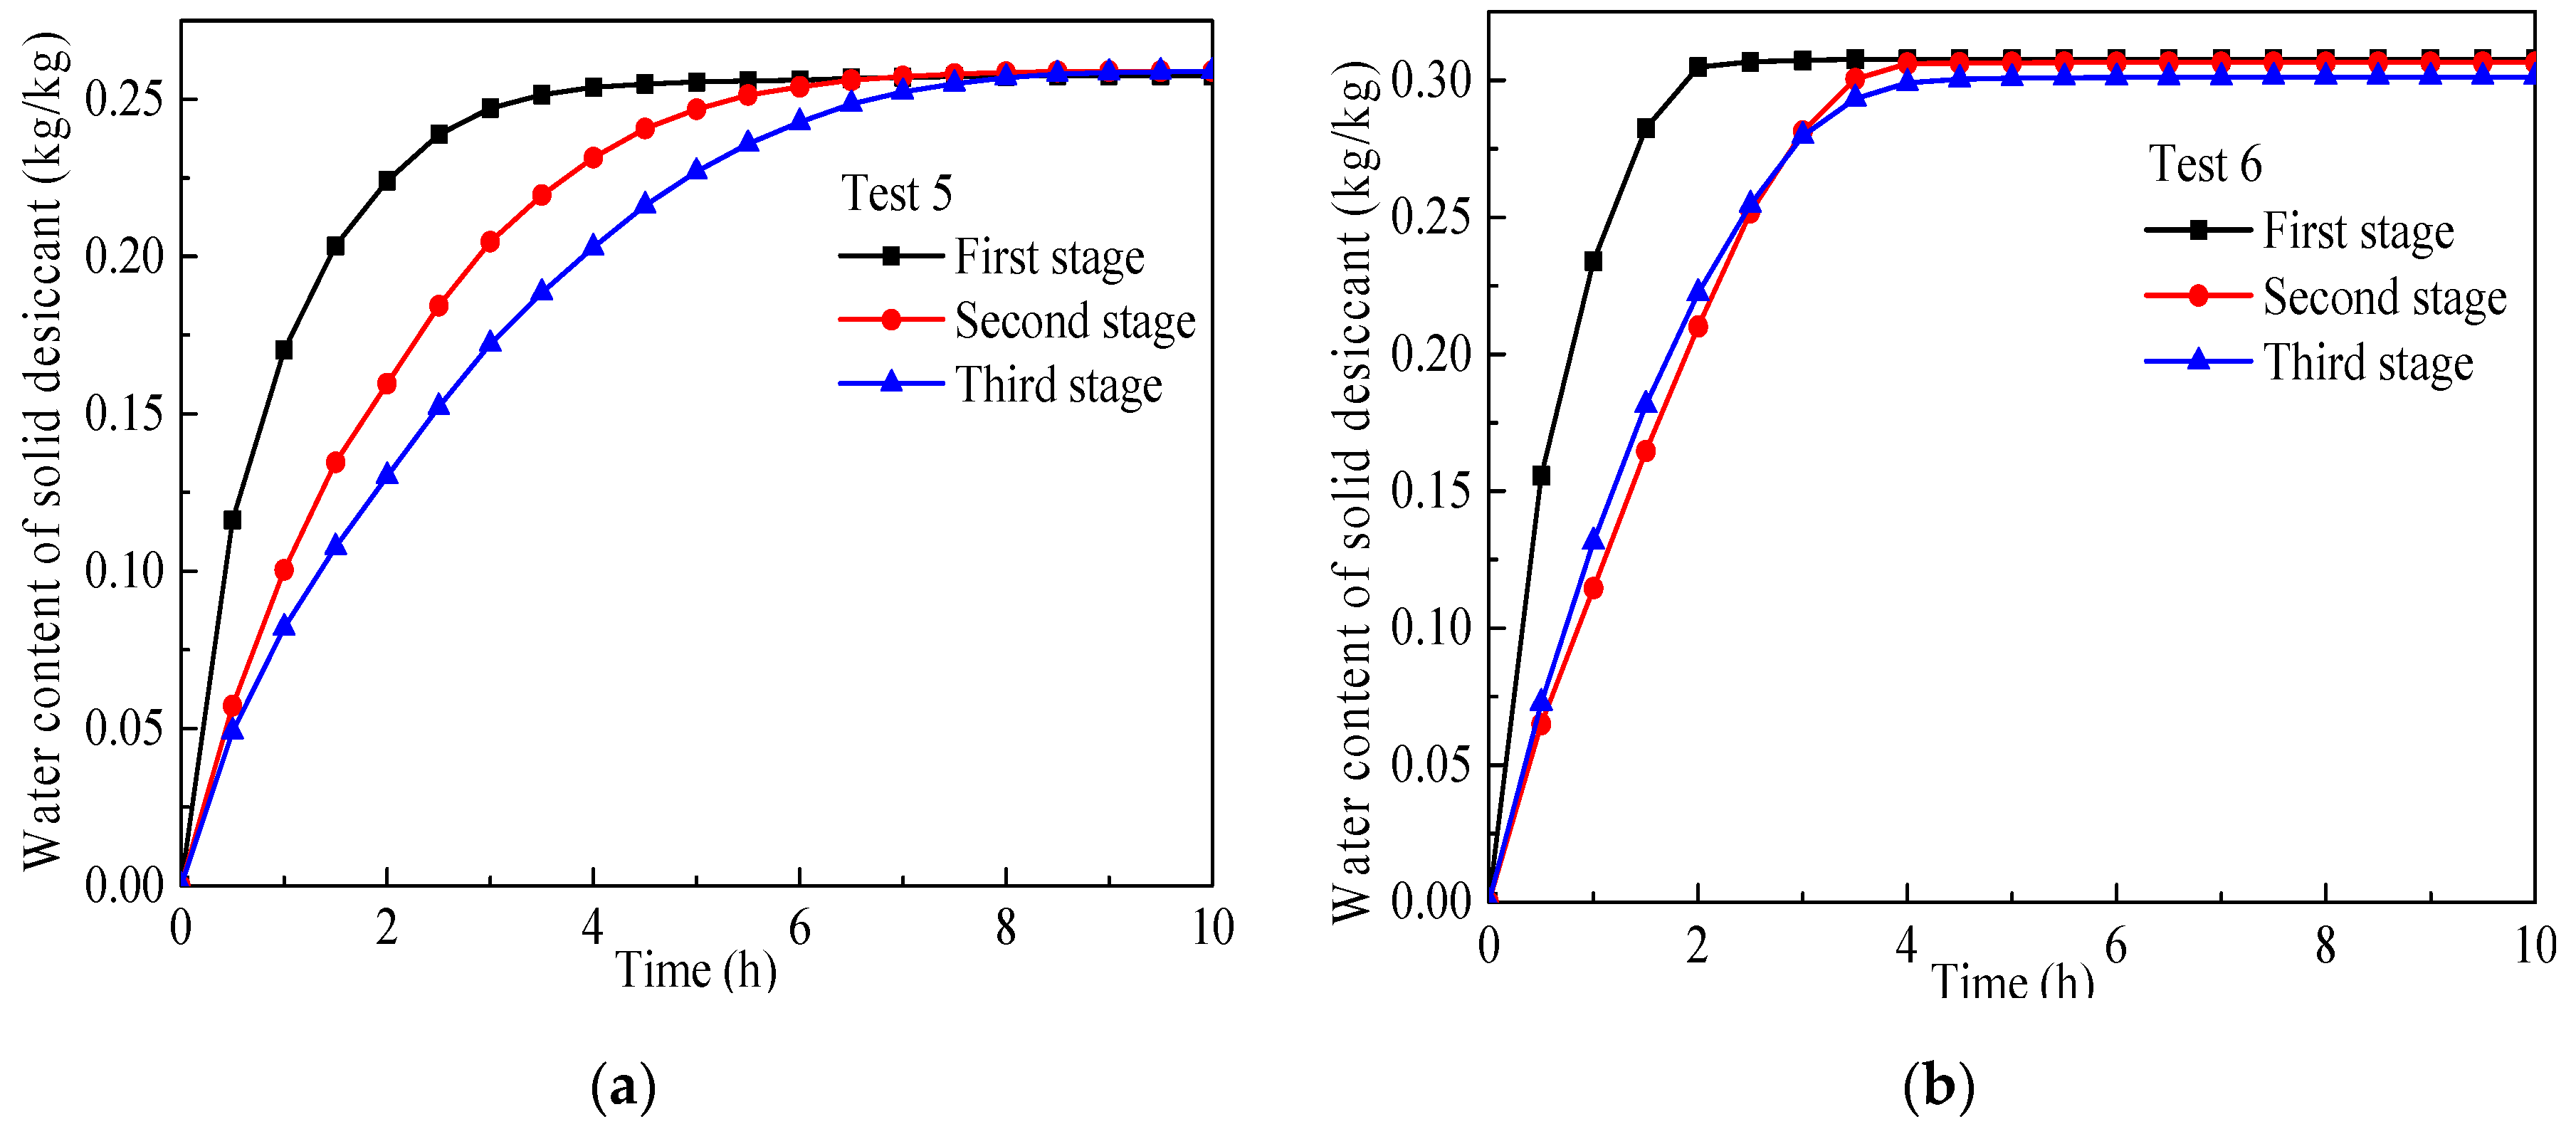
Figure 11.
Variation of the total moisture ratio of solid desiccant with time.

Figure 12.
Moisture ratio of each stage within the effective dehumidification time: (a) without internal cooling; (b) with internal cooling.
Figure 12.
Moisture ratio of each stage within the effective dehumidification time: (a) without internal cooling; (b) with internal cooling.
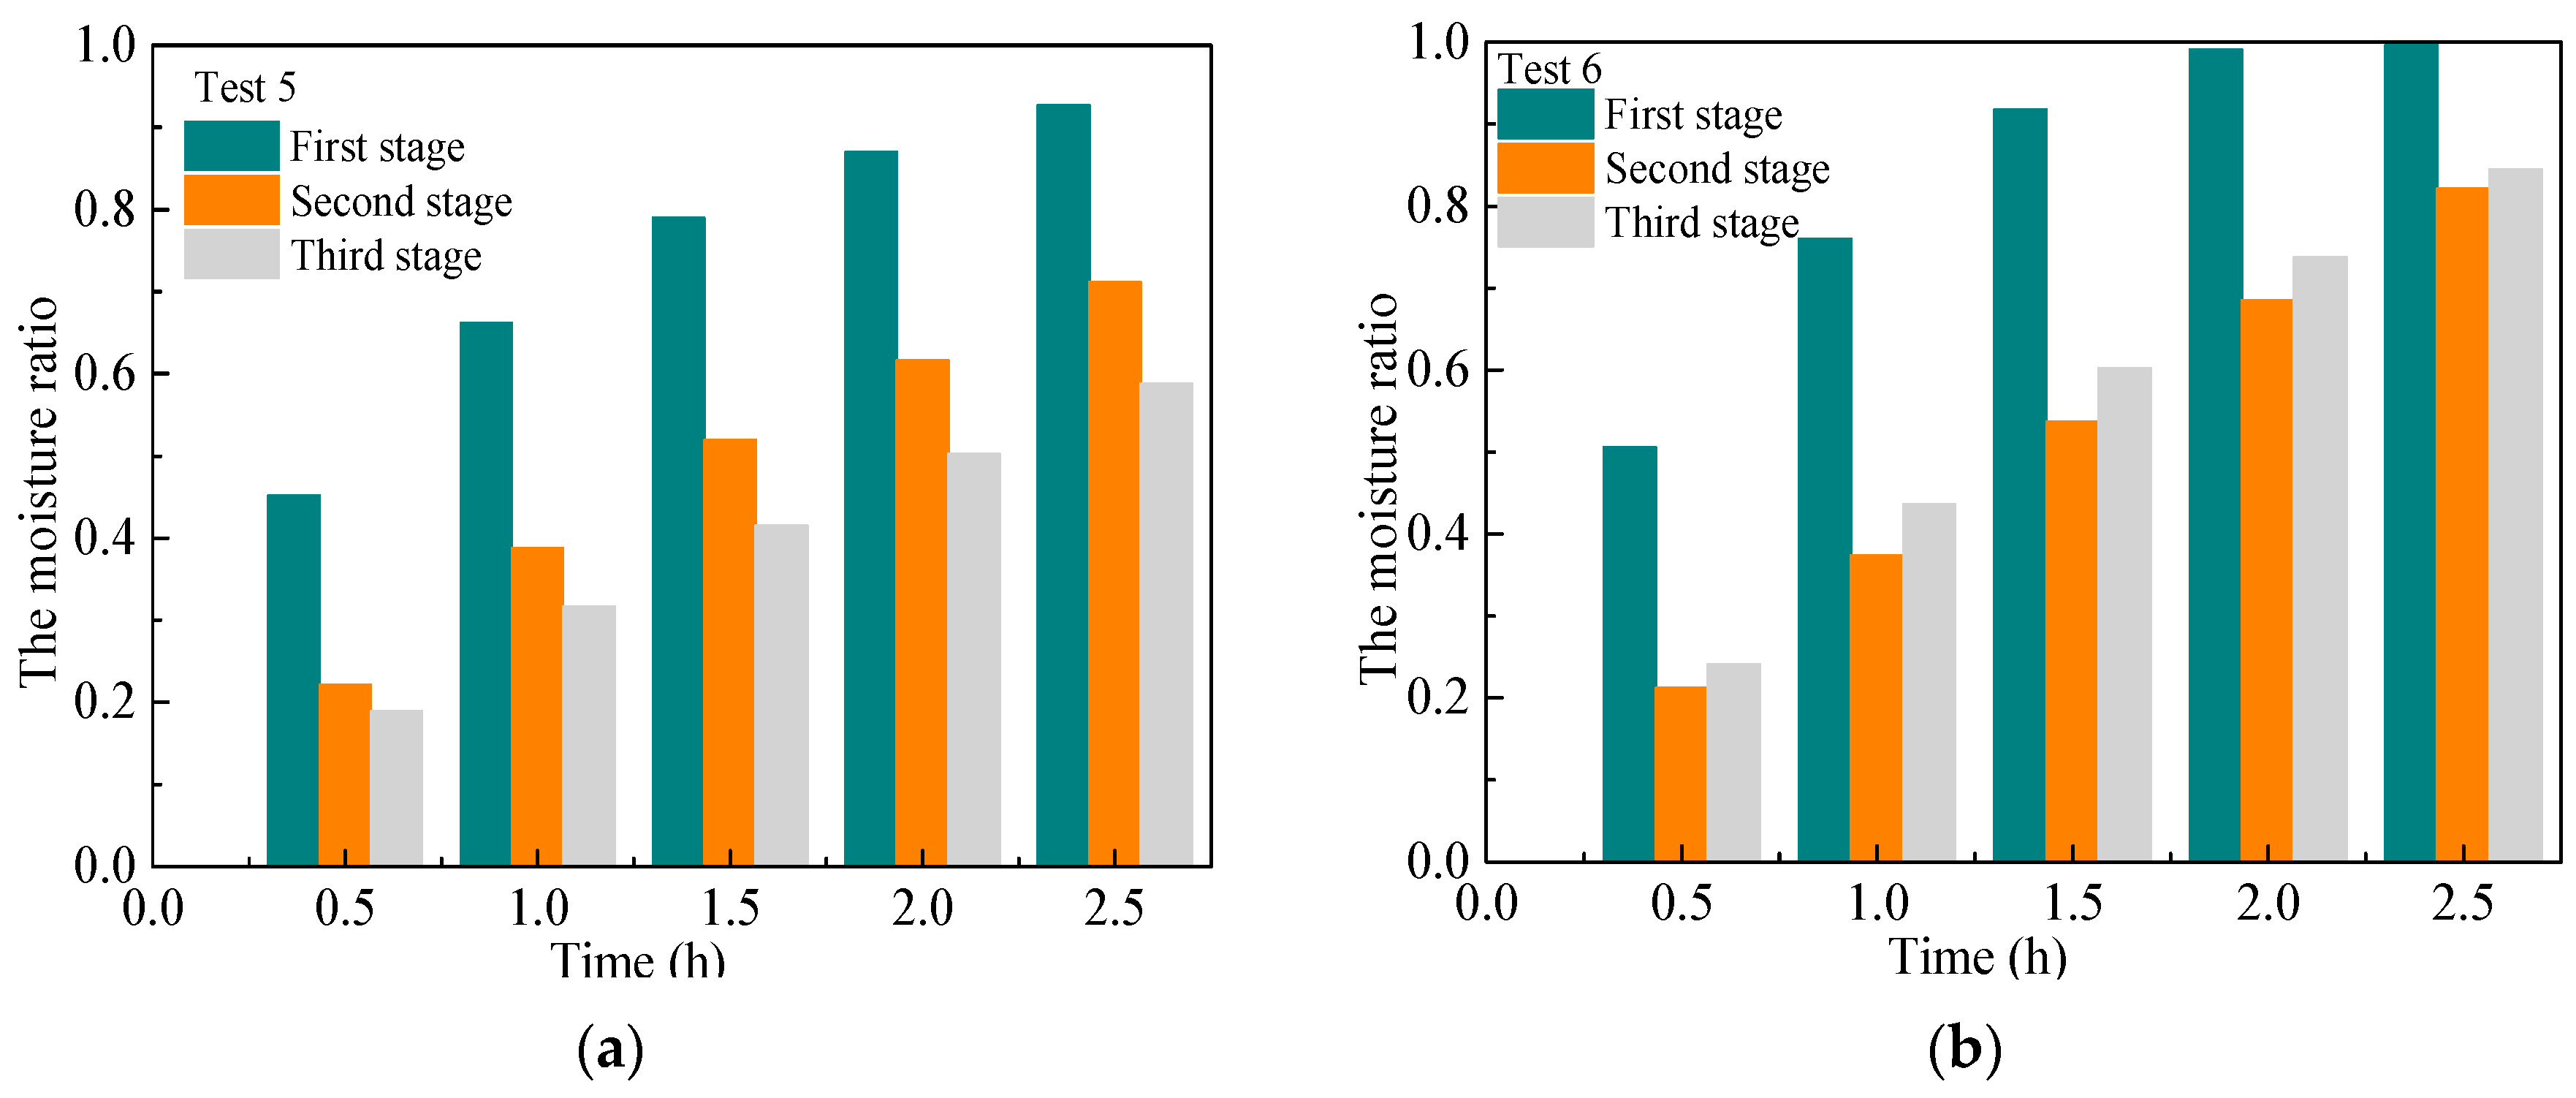
Figure 13.
Variation of the average temperature of solid desiccant of the whole dehumidification device.
Figure 13.
Variation of the average temperature of solid desiccant of the whole dehumidification device.
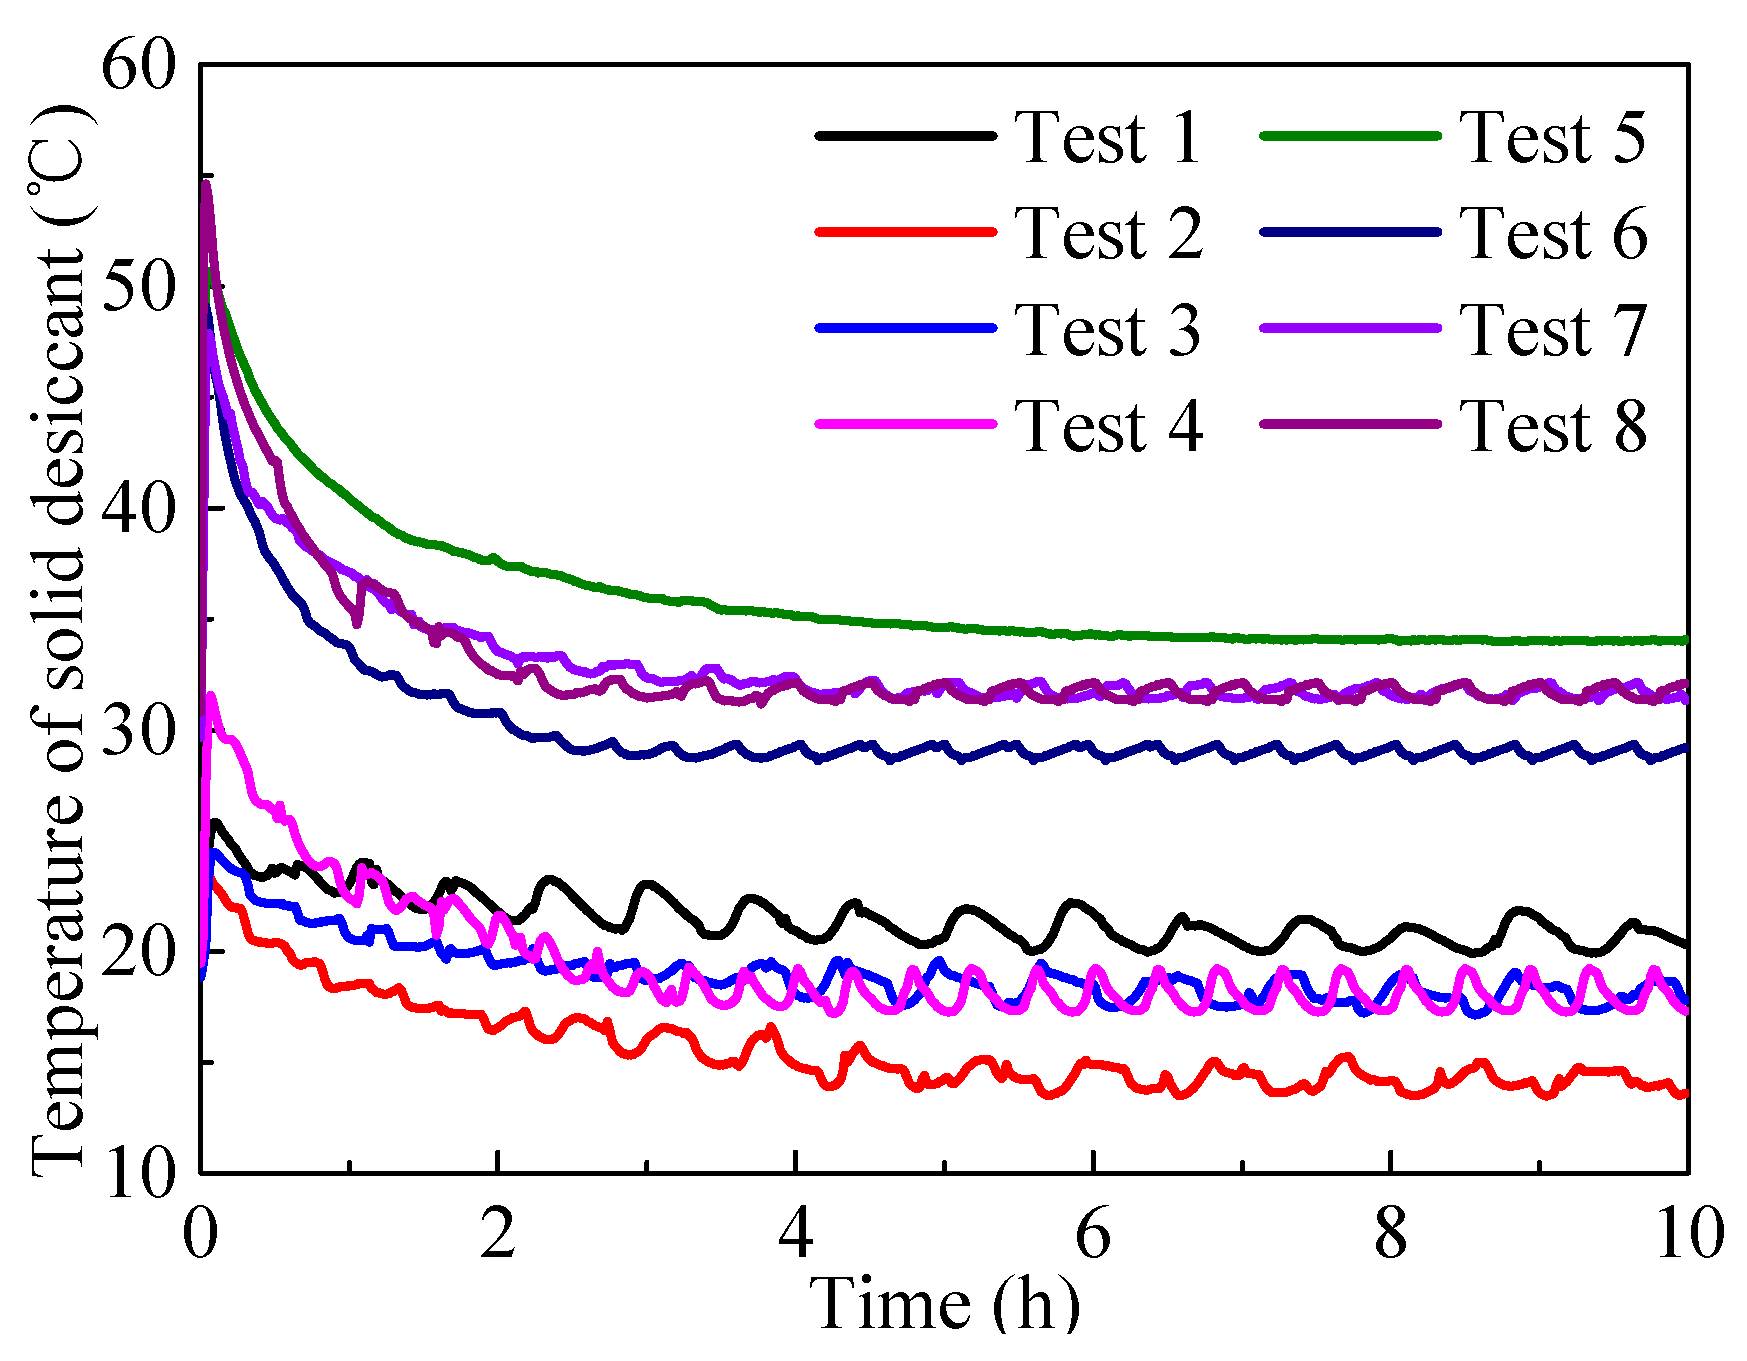
Figure 14.
Variation of the average temperature of solid desiccant of each stage: (a) without internal cooling; (b) with internal cooling.
Figure 14.
Variation of the average temperature of solid desiccant of each stage: (a) without internal cooling; (b) with internal cooling.

Figure 15.
The trend of the air temperature along the air flow.

Figure 16.
Variation of the temperature difference between inlet and outlet air with time.
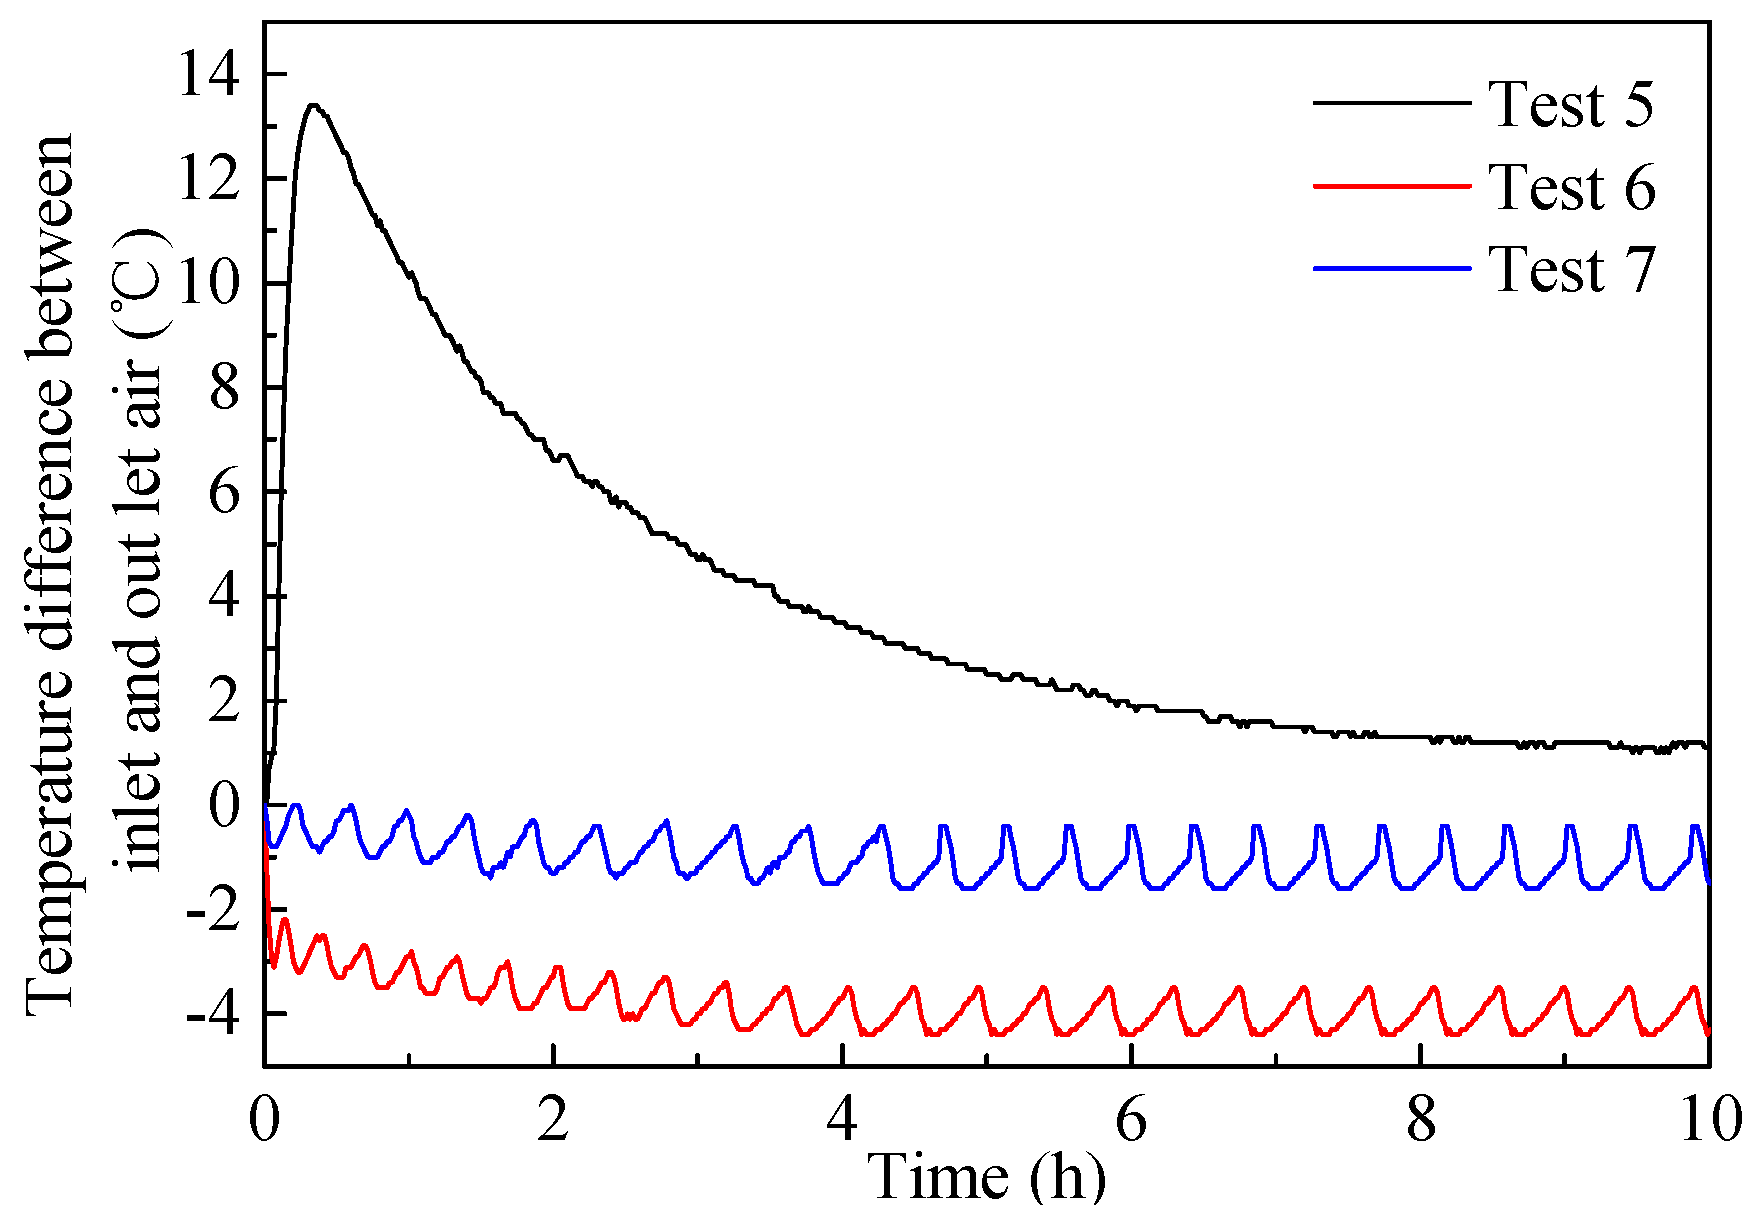
Figure 17.
Heat and mass transfer model of dehumidification process.
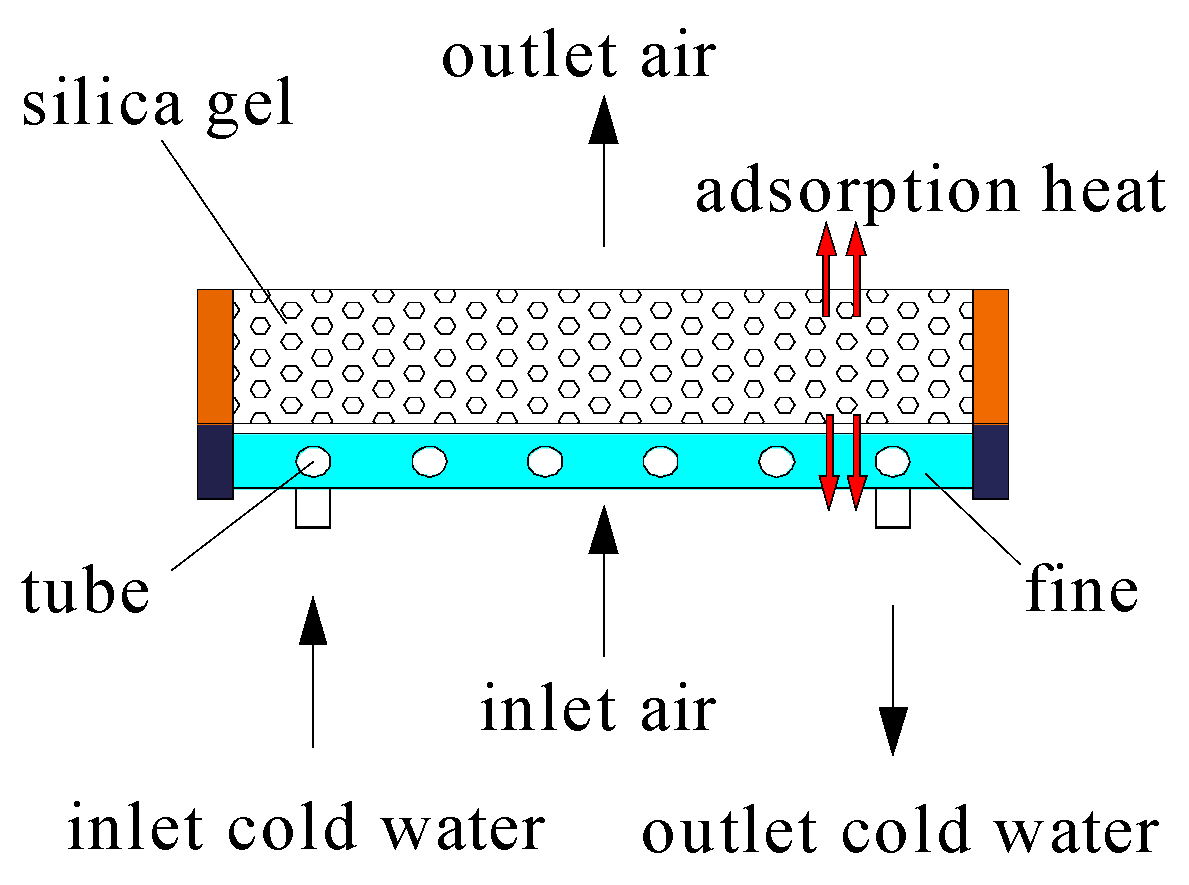
Figure 18.
Comparison of the results from testing and calculated models on water content of solid desiccant: (a) without internal cooling; (b) with internal cooling
Figure 18.
Comparison of the results from testing and calculated models on water content of solid desiccant: (a) without internal cooling; (b) with internal cooling
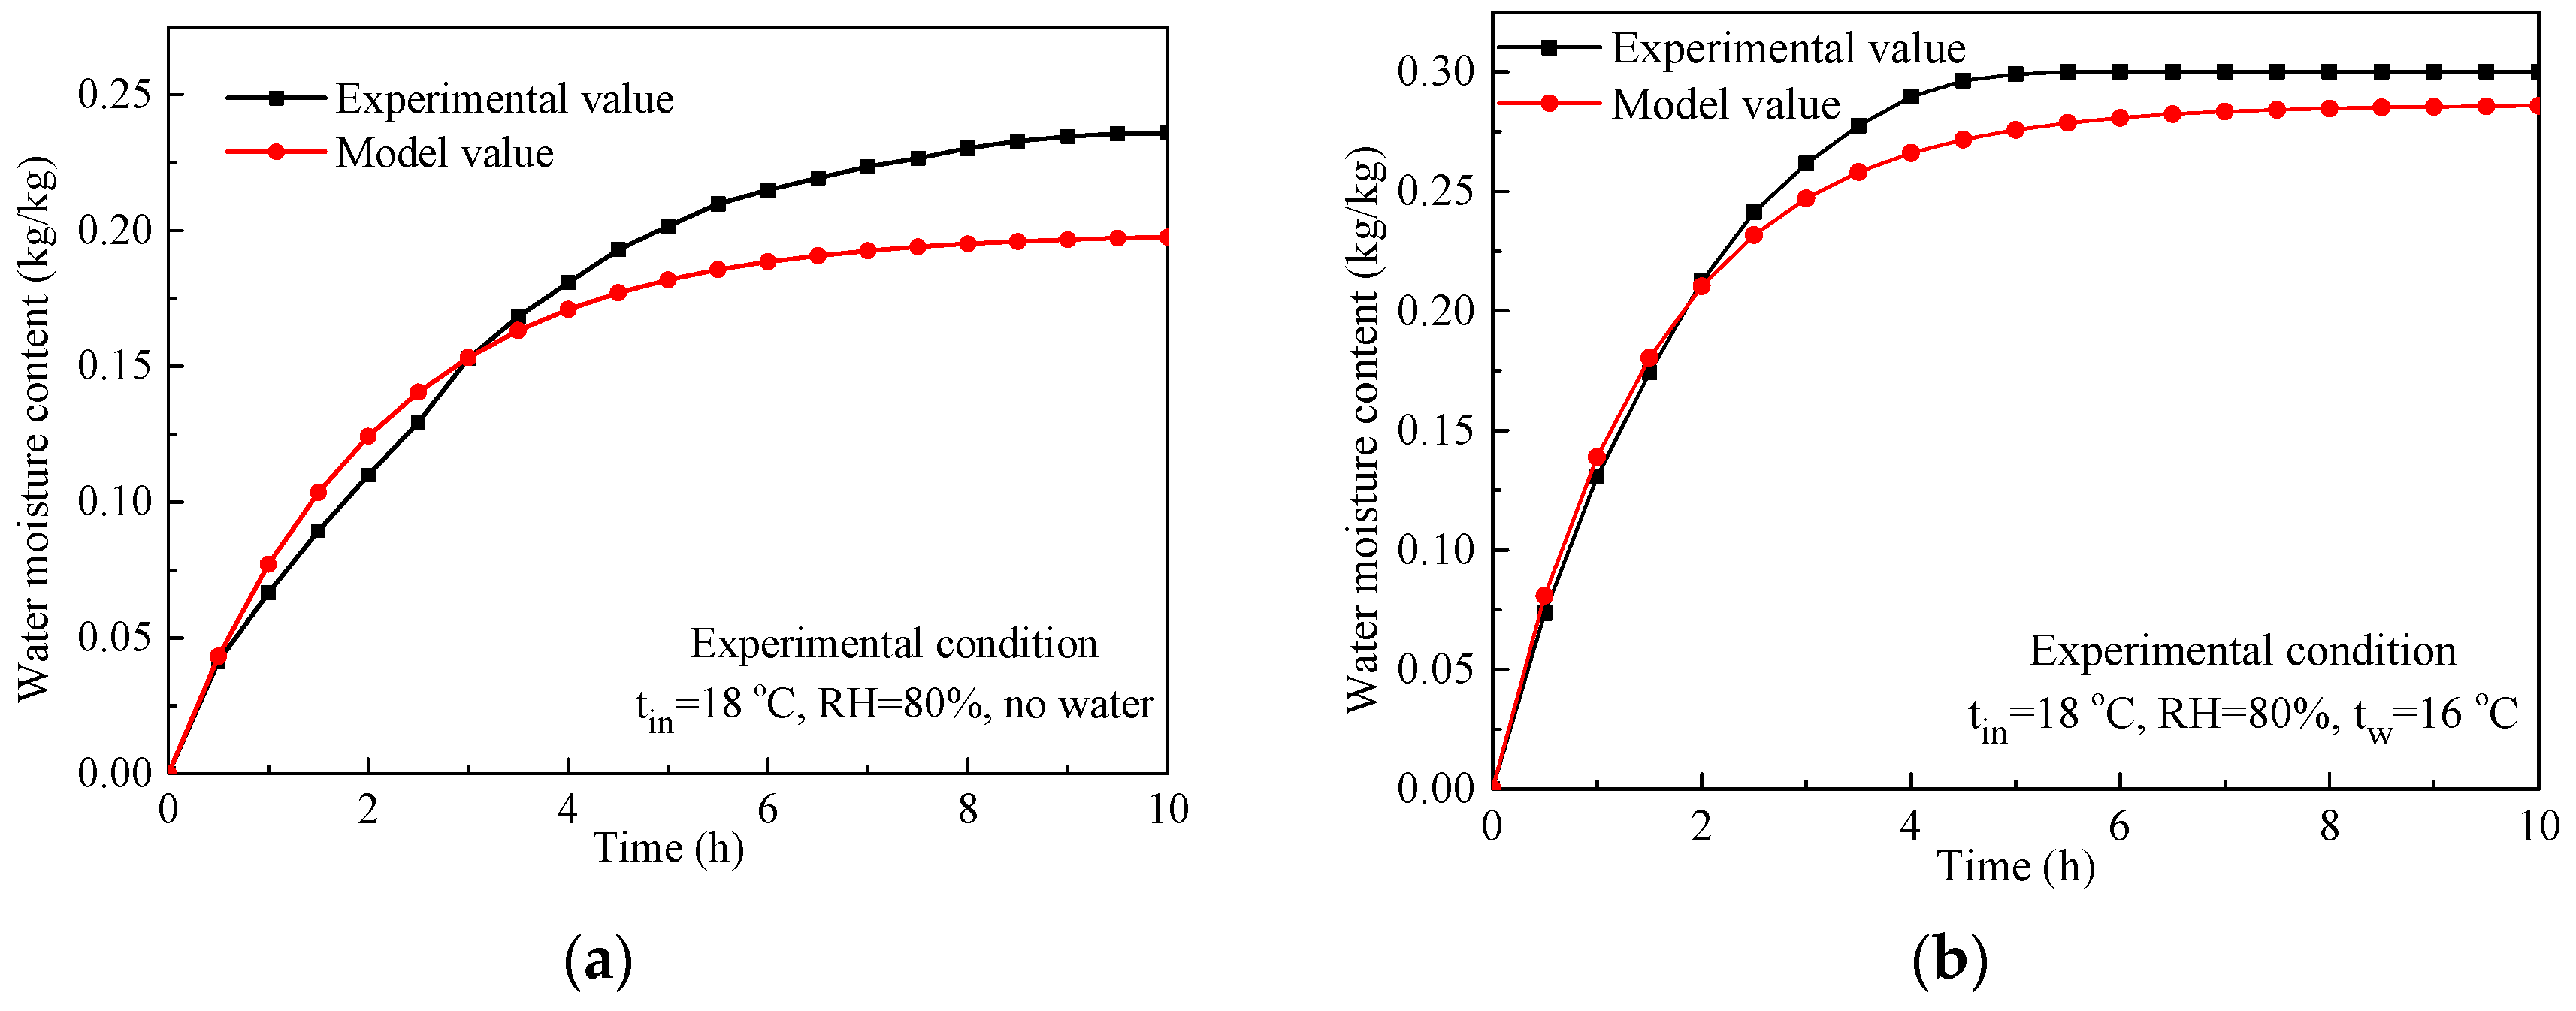
Figure 19.
Comparison of results from testing and calculated model on the temperature of solid desiccant: (a) without internal cooling; (b) with internal cooling.
Figure 19.
Comparison of results from testing and calculated model on the temperature of solid desiccant: (a) without internal cooling; (b) with internal cooling.

Table 1.
The parameters of main components.
| Name | Type | Main Parameters |
|---|---|---|
| Environmental cabinet | TEMI1000 | Temperature range: −20–90 °C; accuracy: ±0.01 °C; relative humidity range: 0–85%; accuracy: ±0.1% |
| Multi-channel temperature and humidity monitor | PC-2WS | Accuracy: ±2% in humidity, ±0.2 °C in temperature |
| Multi-channel temperature logger | AT4364 | Sensor: K-type; accuracy: ± (value × 0.5% + 1) °C |
| Water chiller | - | Refrigerating capacity: 3 HP; power: 2250 W; accuracy: ±2 °C |
| Rotameter | LZS-15 | Range: 100 to 1000 L/h; accuracy: ±5% |
| Booster pump | CRS25-10 | Volume Flowrate: 80 L/h; lift: 10 m; power: 200 W |
| Self-priming pump | 1.5ZDK-20 | Volume Flowrate: 15 m3/h; lift: 20 m; suction: 8 m; power: 750 W |
| Fan | ASB20-4-1M | Mass flow rate: 486 m3/h; power: 190 W |
| Anemometer | TESTO 405-V1 | Range: 0 to 10 m/s; accuracy: 0.01 m/s |
| Electronic balance | JCS-A/C | Range: 0 to 3 kg; accuracy: 0.01 g |
| Electronic scale | TCS-01 | Range: 75 kg; accuracy: 2 g |
| Drying oven | DHG-9145A | Temperature range: 10–300 °C; accuracy: ±1.0 °C |
Table 2.
Experimental conditions.
| Test No. | Water Temperature (°C) | Inlet Air Temperature (°C) | Inlet Air Humidity (%) | Humidity Capacity (g/kg) | Volume Flow of the Cold Water (L/h) | Wind Speed (m/s) |
|---|---|---|---|---|---|---|
| 1 | no water | 20 | 55 | 8.00 | — | 0.35 |
| 2 | 14 | 20 | 55 | 8.00 | 800 | 0.35 |
| 3 | 18 | 20 | 55 | 8.00 | 800 | 0.35 |
| 4 | 18 | 20 | 80 | 11.70 | 800 | 0.35 |
| 5 | no water | 34 | 68 | 23.04 | — | 0.35 |
| 6 | 28 | 34 | 68 | 23.04 | 800 | 0.35 |
| 7 | 32 | 34 | 68 | 23.04 | 800 | 0.35 |
| 8 | 32 | 34 | 80 | 27.28 | 800 | 0.35 |
Table 3.
The test results of the water content of the saturated solid desiccant.
| Test No. | 1 | 2 | 3 | 4 | 5 | 6 | 7 | 8 |
|---|---|---|---|---|---|---|---|---|
| Water content ratio (kg/kg) | 0.140 | 0.295 | 0.224 | 0.316 | 0.258 | 0.305 | 0.270 | 0.307 |
© 2018 by the authors. Licensee MDPI, Basel, Switzerland. This article is an open access article distributed under the terms and conditions of the Creative Commons Attribution (CC BY) license (http://creativecommons.org/licenses/by/4.0/).
Share and Cite
MDPI and ACS Style
Yang, W.; Ren, J.; Lin, Z.; Wang, Z.; Zhao, X. Study on Dehumidification Performance of a Multi-Stage Internal Cooling Solid Desiccant Adsorption Packed Bed. Energies 2018, 11, 3038. https://doi.org/10.3390/en11113038
AMA Style
Yang W, Ren J, Lin Z, Wang Z, Zhao X. Study on Dehumidification Performance of a Multi-Stage Internal Cooling Solid Desiccant Adsorption Packed Bed. Energies. 2018; 11(11):3038. https://doi.org/10.3390/en11113038
Chicago/Turabian StyleYang, Wansheng, Jiayun Ren, Zhongqi Lin, Zhangyuan Wang, and Xudong Zhao. 2018. "Study on Dehumidification Performance of a Multi-Stage Internal Cooling Solid Desiccant Adsorption Packed Bed" Energies 11, no. 11: 3038. https://doi.org/10.3390/en11113038
Note that from the first issue of 2016, this journal uses article numbers instead of page numbers. See further details here.