Article

Characterization of Narrowband Noise and Channel Capacity for Powerline Communication in France

1
Research Group on Materials, Microelectronics, Acoustics, and Nanotechnology, University of Tours, 37000 Tours, France
2
Laboratoire des Applications Numériques (LAN), Node Park Touraine, 165 rue Yves Chauvin, 37310 Tauxigny, France
*
Author to whom correspondence should be addressed.
Energies 2018, 11(11), 3022; https://doi.org/10.3390/en11113022
Submission received: 10 October 2018 / Revised: 25 October 2018 / Accepted: 31 October 2018 / Published: 2 November 2018

Abstract

:
Narrowband powerline communication (NB-PLC) systems represent a key step for the real development of smart grids’ applications in the medium voltage (MV) and low voltage (LV) networks. This article sums up the results of a complete experimental measurement campaign aimed at investigating the low voltage NB-PLC channel in the frequency range from 9 to 500 kHz in various sites (i.e., rural, urban etc.) located in France. The noise features in time-frequency representation are studied at five different sites between the transformer substation and the smart electricity meter. The main contribution of this study consists in estimating the theoretical channel capacity which constitutes a major interest for the users and actors of the electrical system. The channel capacity calculation shows reliable results in the US Federal Communications Commission (FCC) band (a few Mbits/s). The quality of the communication in the FCC band enables to integrate new smart grids’ applications and services based on the existing NB-PLC communication for advanced metering infrastructure (AMI).

1. Introduction

Nowadays, the integration of smart grids’ applications is based on grid-integrated near-real-time communications between various elements. The smart grid concept has been particularly promoted as a solution to evolve the traditional power grids by the adoption of the “Internet of Things” (IoT) technology. This one provides interactive real-time network communication between the users and the smart devices deployed and/or connected to the network through various technologies [1,2,3]. Regarding the smart grid platform, as can be seen in Figure 1, many applications of the IoT are already deployed. Examples include smart metering which aimed at performing a remote reading and monitoring of key information to manage electricity consumption [1].
Additional smart grid applications, that integrate renewable energy sources (e.g., solar and wind energies), are currently in development [4]. Another original application, that involves the electrical vehicle (EV) in vehicle-to-grid (V2G) applications, consists in managing the state of the network by analyzing its response to the peak demand [5]. The industrial sector is particularly attractive to control machines, controllers and sensors. In this context, communication technologies can offer connections between simple industrial devices (i.e., sensors, actuators and motors) and high-level devices (i.e., computers, programmable controllers, distributed control systems etc.) [4].
Smart home is also an attractive application, because it is based on the connectivity of many devices inside a home. The aim is to establish a continuous monitoring and control of the smart equipment connected to the indoor network [1,6].
Numerous articles highlight that hybrid communication architectures are typically used to include the IoT in most of smart grids’ applications. These kinds of architectures combine wired (e.g., serial bus, Ethernet, power line communication (PLC)) and wireless (e.g., Bluetooth, Wi-Fi) infrastructures. For instance, Salvadori et al. have evaluated a hybrid network architecture, which is composed of a wired infrastructure, a wireless sensor network, a PLC, and a controller area network, implemented in an underground electric substation power distribution [7]. This digital system has been particularly proposed for condition monitoring, diagnosis, and supervisory control applied to smart grids. Oliveira et al. have proposed a statistical modeling of the hybrid PLC-wireless channels’ characteristics in in-home facilities in the frequency range between 1.7 and 100 MHz [8]. Zhang et al. have recently modeled the hybrid communication architectures between several inverters, smart meters, a data concentrator, and a control center router used in distributed solar photovoltaic applications [9]. In that case, several types of communication technologies have been evaluated (i.e., LoWPAN, wireless LAN, NSP broadband wireless, PLC, and Ethernet).
From a literature review, most of hybrid architectures use the PLC technology. Regarding the smart metering applications, narrowband (i.e., frequency range between 9 and 500 kHz) powerline communication (NB-PLC) technologies are deployed to optimize, monitor, and protect the MV and LV electrical networks. That is the reason why this study focuses on the characterization of the outdoor NB-PLC communication.
The NB-PLC is currently framed by many standards that include the European Committee for Electro-technical Standardization (CENELEC) band (i.e., from 9 to 148.5 kHz), the US Federal Communications Commission (FCC) band (i.e., from 10 to 490 kHz), and the Japanese Association of Radio Industries and Businesses (ARIB) band (i.e., from 10 to 450 kHz) [10,11,12,13]. According to these standards, many communication protocols have been developed. The G1-PLC protocol deployed in France is based on a single carrier modulation technique [14]. Other protocols, such as IEEE 1901.2, ITU-T G.henm, powerline intelligent metering evolution (PRIME) and G3-PLC, are based on the multicarrier technologies with data rate less than 1 Mbps [15,16,17].
As can be seen in Figure 2, the quality of the NB-PLC in the MV and LV networks depends on three main characteristics: impedance discontinuities, attenuation of the communication channel that can be modeled using a transfer function, and noise levels generated by distribution cables.
Regarding the MV network, many technical issues are described in the literature. Some authors have modeled and characterized the MV cables [18,19]. In particular, the key features (attenuation and impedance) of the MV cables show considerable variations both depending on how the signal is injected into the cable, and the type of cable. The injected signal in the MV network need the use of a coupling system to connect the NB-PLC transceiver to the MV cables in safety conditions. Artale et al. have proposed such a coupling system [20]. Xie et al. have studied the impact of the transformer on the NB-PLC channel, and the noise interferences in the MV cables [21].
The LV network is still much more interesting to study, because many advanced smart metering interfaces (AMI) are currently widely deployed. Examples include the PRIME standard developed by Iberdrola in Spain for advanced metering, grid control and asset monitoring applications [15]. In France, the G3-PLC has been implemented by Enedis to efficiently manage the AC grid [16,17]. In that case, the AMI interface is based on the communication between a concentrator installed in the transformer substation and many smart electricity meters installed at the customers’ side. It is important to note that the number of smart meters per medium voltage/low voltage (MV/LV) transformer depends on the topology of the network (i.e., rural, urban, residential, or industrial) [5]. In that case, the NB-PLC noise features seriously affect the reliability of power line communication can be analyzed through a time-frequency representation. These NB-PLC parameters have recently been characterized in the many countries and the results have been discussed in the literature [4,22,23,24,25,26,27,28,29,30,31,32]. For example, Pereira et al. have pointed out the impact of the attenuation and the impulsive noise generated by the inverters on the NB-PLC [4]. In that case, many real experiments using a G3-PLC modem were conducted in Brazil in an industrial environment. Chu et al. have analyzed the main characterization results of NB-PLC such as access impedances, interferences, and attenuations in the frequency band between 30 and 500 kHz [33]. In this study, the measurements were performed in China in a typical urban underground network. Kaiser et al. have highlighted the cyclo-stationary properties of the NB-PLC noise [23]. Niemany et al. have discussed the cyclic structure of G3-PLC noise system operating in the CENELEC 3–148.5 kHz band [24]. This study was performed in the USA in several urban usage environments. Finally, Bai et al. have proposed a comprehensive comparison and analysis of noise in time-frequency domain [34]. This analysis is based on measurements performed in China and in Italy. Even if many studies are available in the literature, a few works have been performed on the French LV network, while France has inspired smart metering, and standards such as the G3-PLC. The manuscript proposes the following two main contributions:
(1)
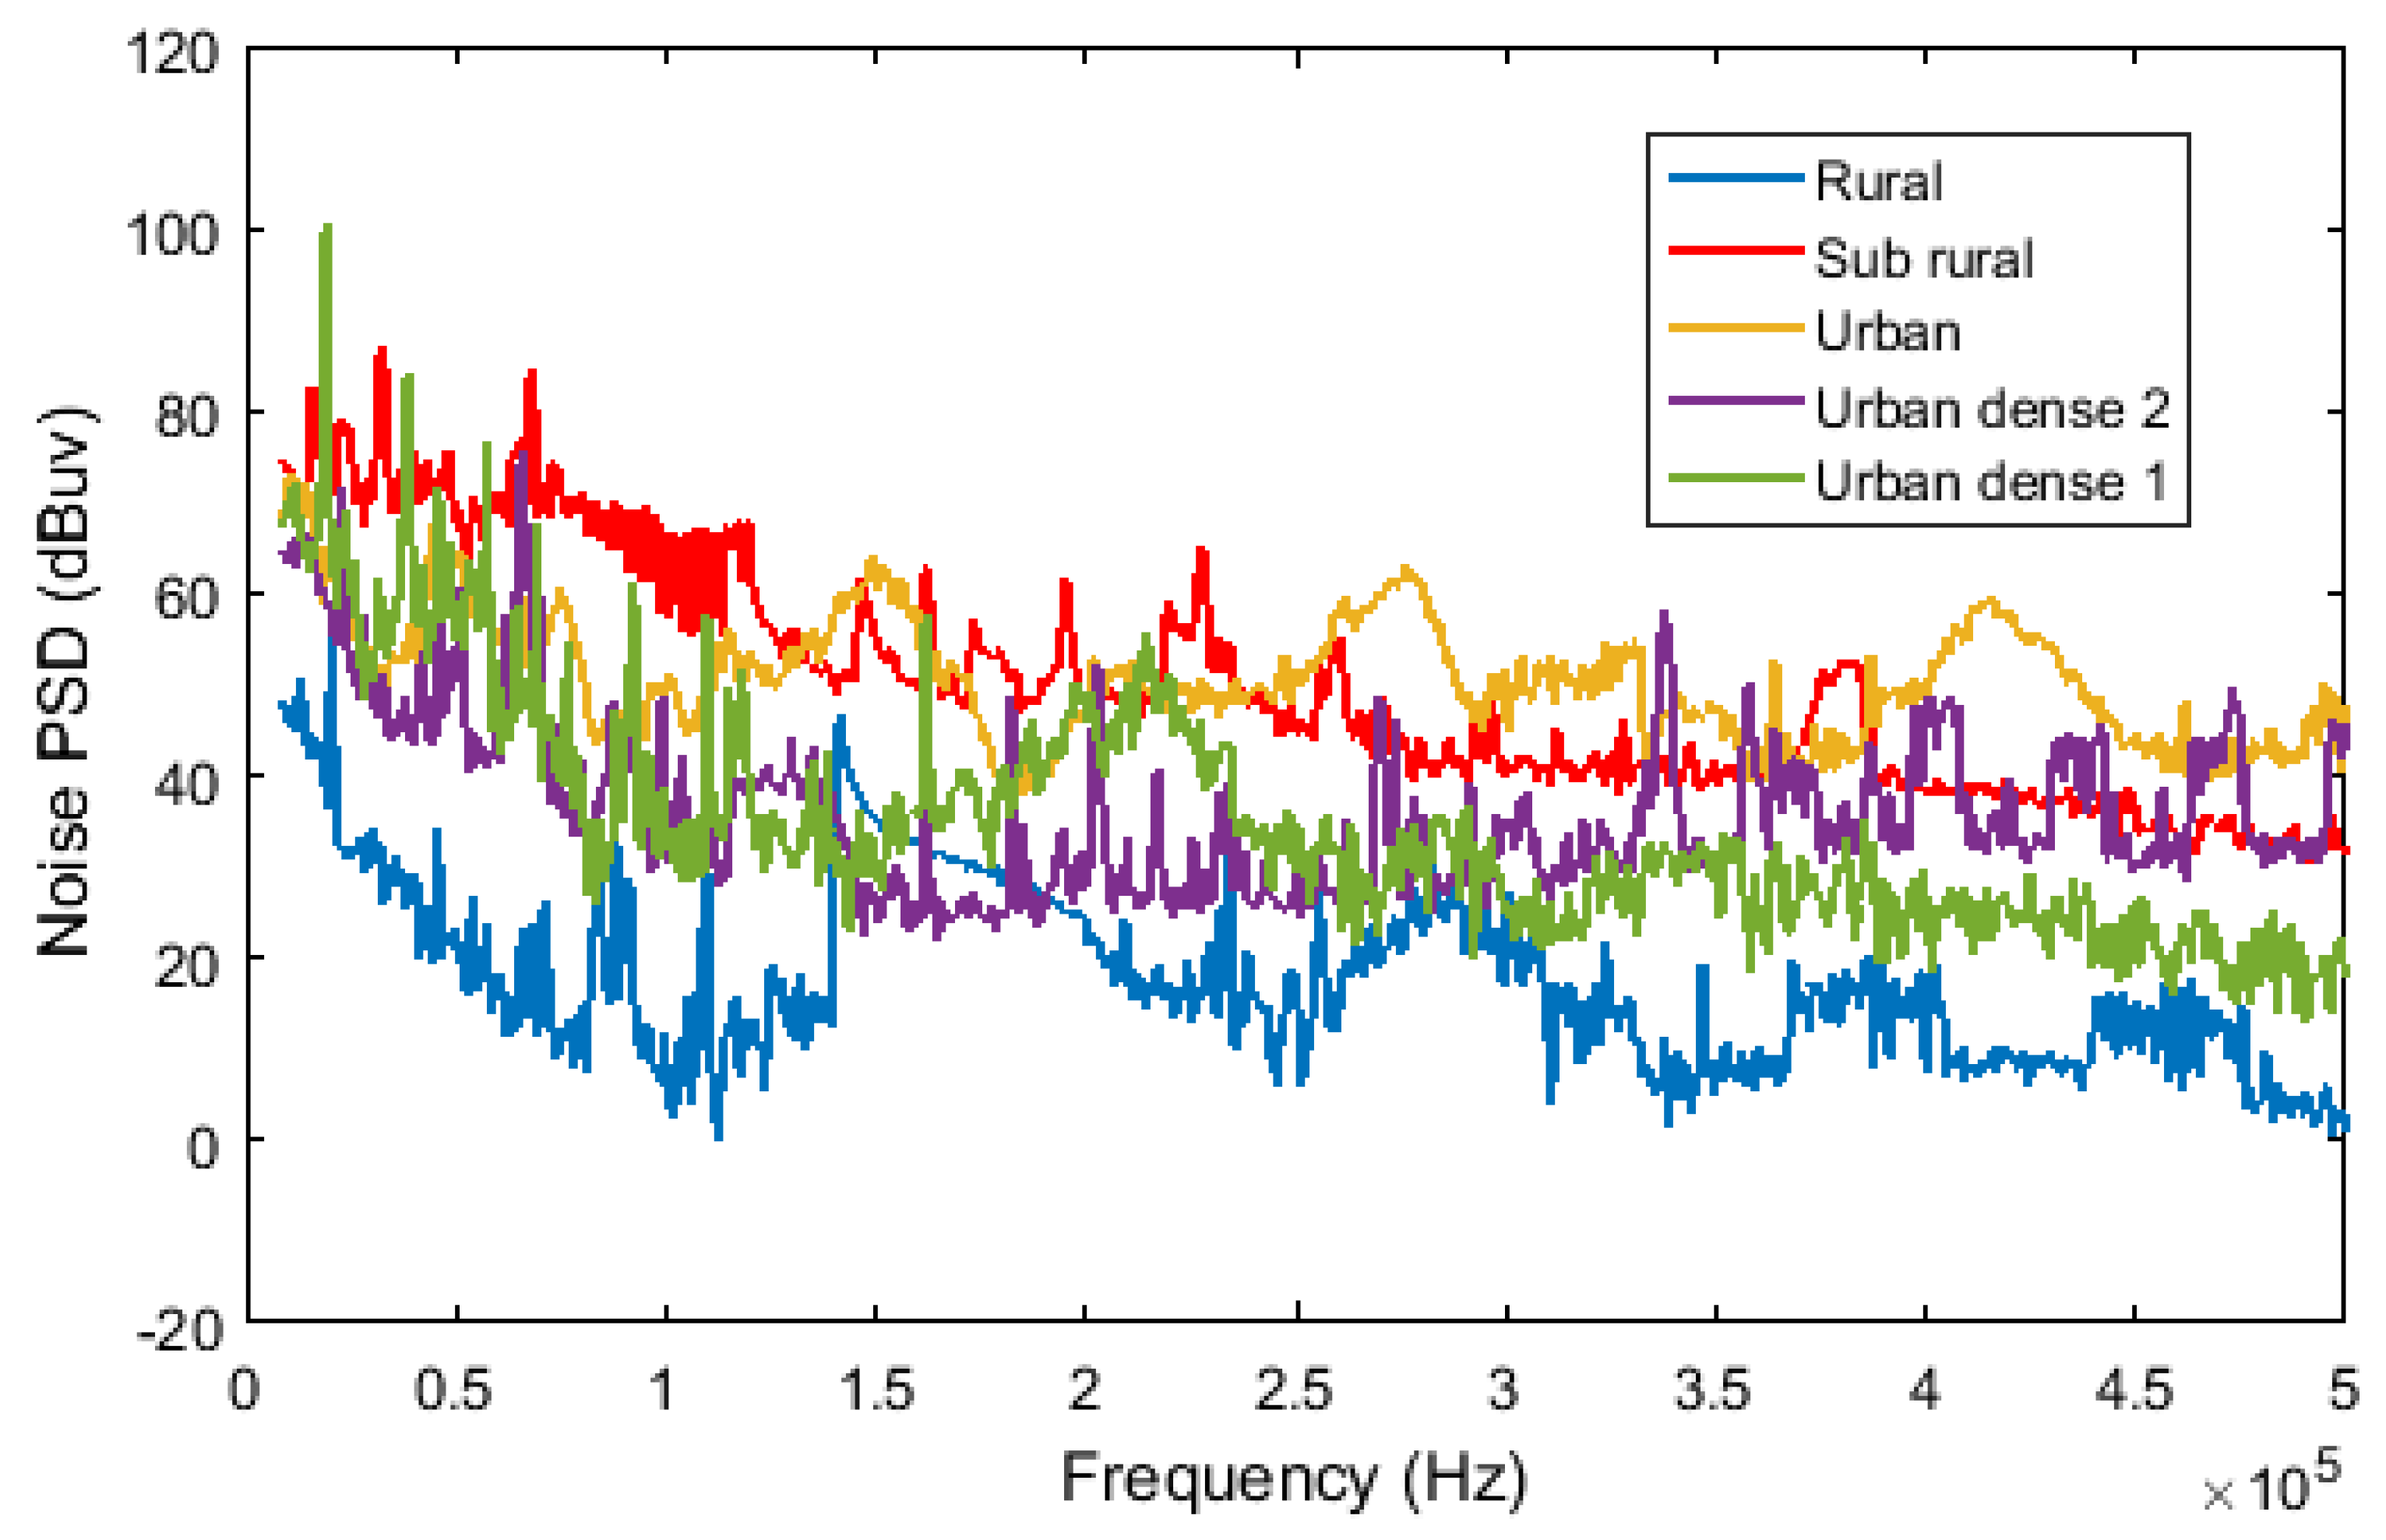
The first one consists in analyzing the noise characteristics in time-frequency representation, the transfer functions measured in five different sites (i.e., urban, rural, sub rural, urban dense 1, and urban dense 2) in several LV networks in France. This activity is conducted in partnership with Enedis. The analysis of the noise profiles is of utmost importance to develop robust techniques to improve the communication between the smart meter and the data concentrator, and the data rate, latency, reliability and security.
(2)
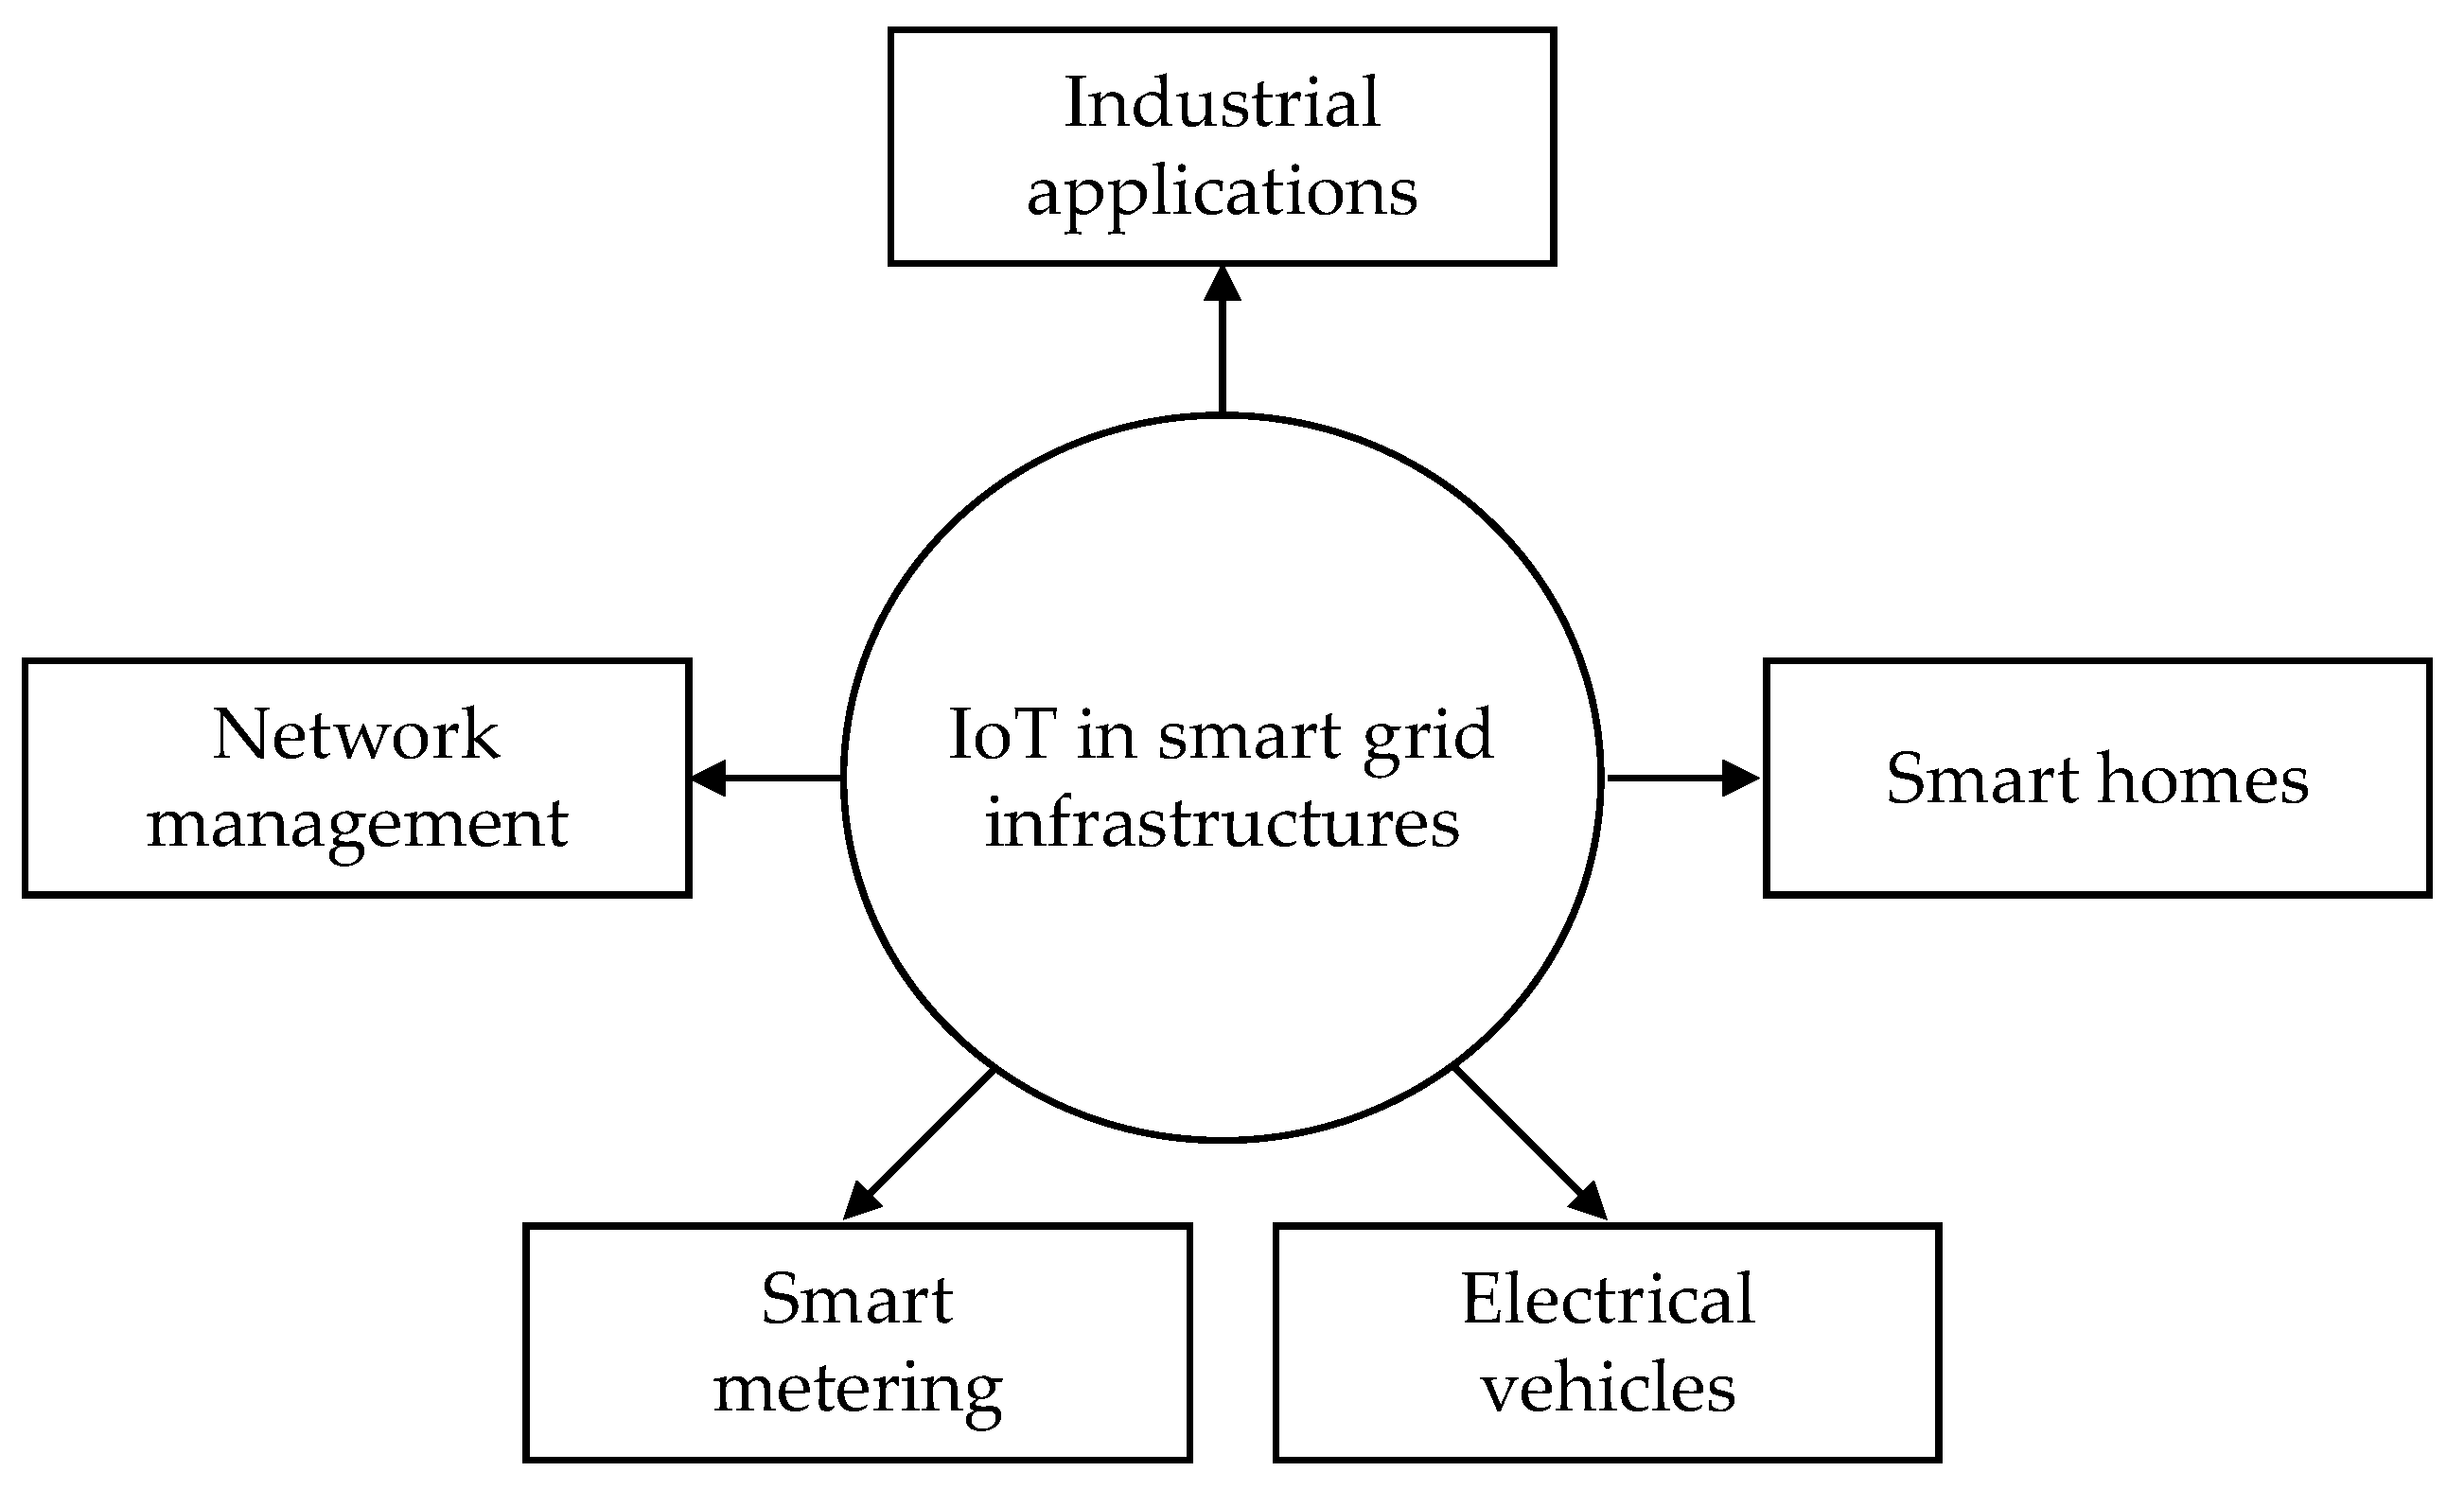
The second one consists in estimating the channel capacity in various LV sites. This study has a major interest, particularly to support new IoT dedicated to smart grids’ applications and services.
In this manuscript, the methodological aspects of this study are described in Section 2. In particular, the measurement sites located in France are presented. Moreover, the experimental measurements’ setup and scenarios in time-frequency representation are explained. Section 3 discusses the main results: the spectral analysis of the NB-PLC noise in the various locations, the analysis of the long-time variation of the power spectral density of noises using time–frequency algorithms, the cyclo-stationary behavior of noise, the measurement of the transfer function and the signal-to-noise ratio (SNR), and the estimation of the channel capacity in the CENELEC A and FCC bands. Finally, a discussion is presented in Section 4 to compare our results with existing ones recently described in the literature.

2. Experimental Measurement Setup and Methods

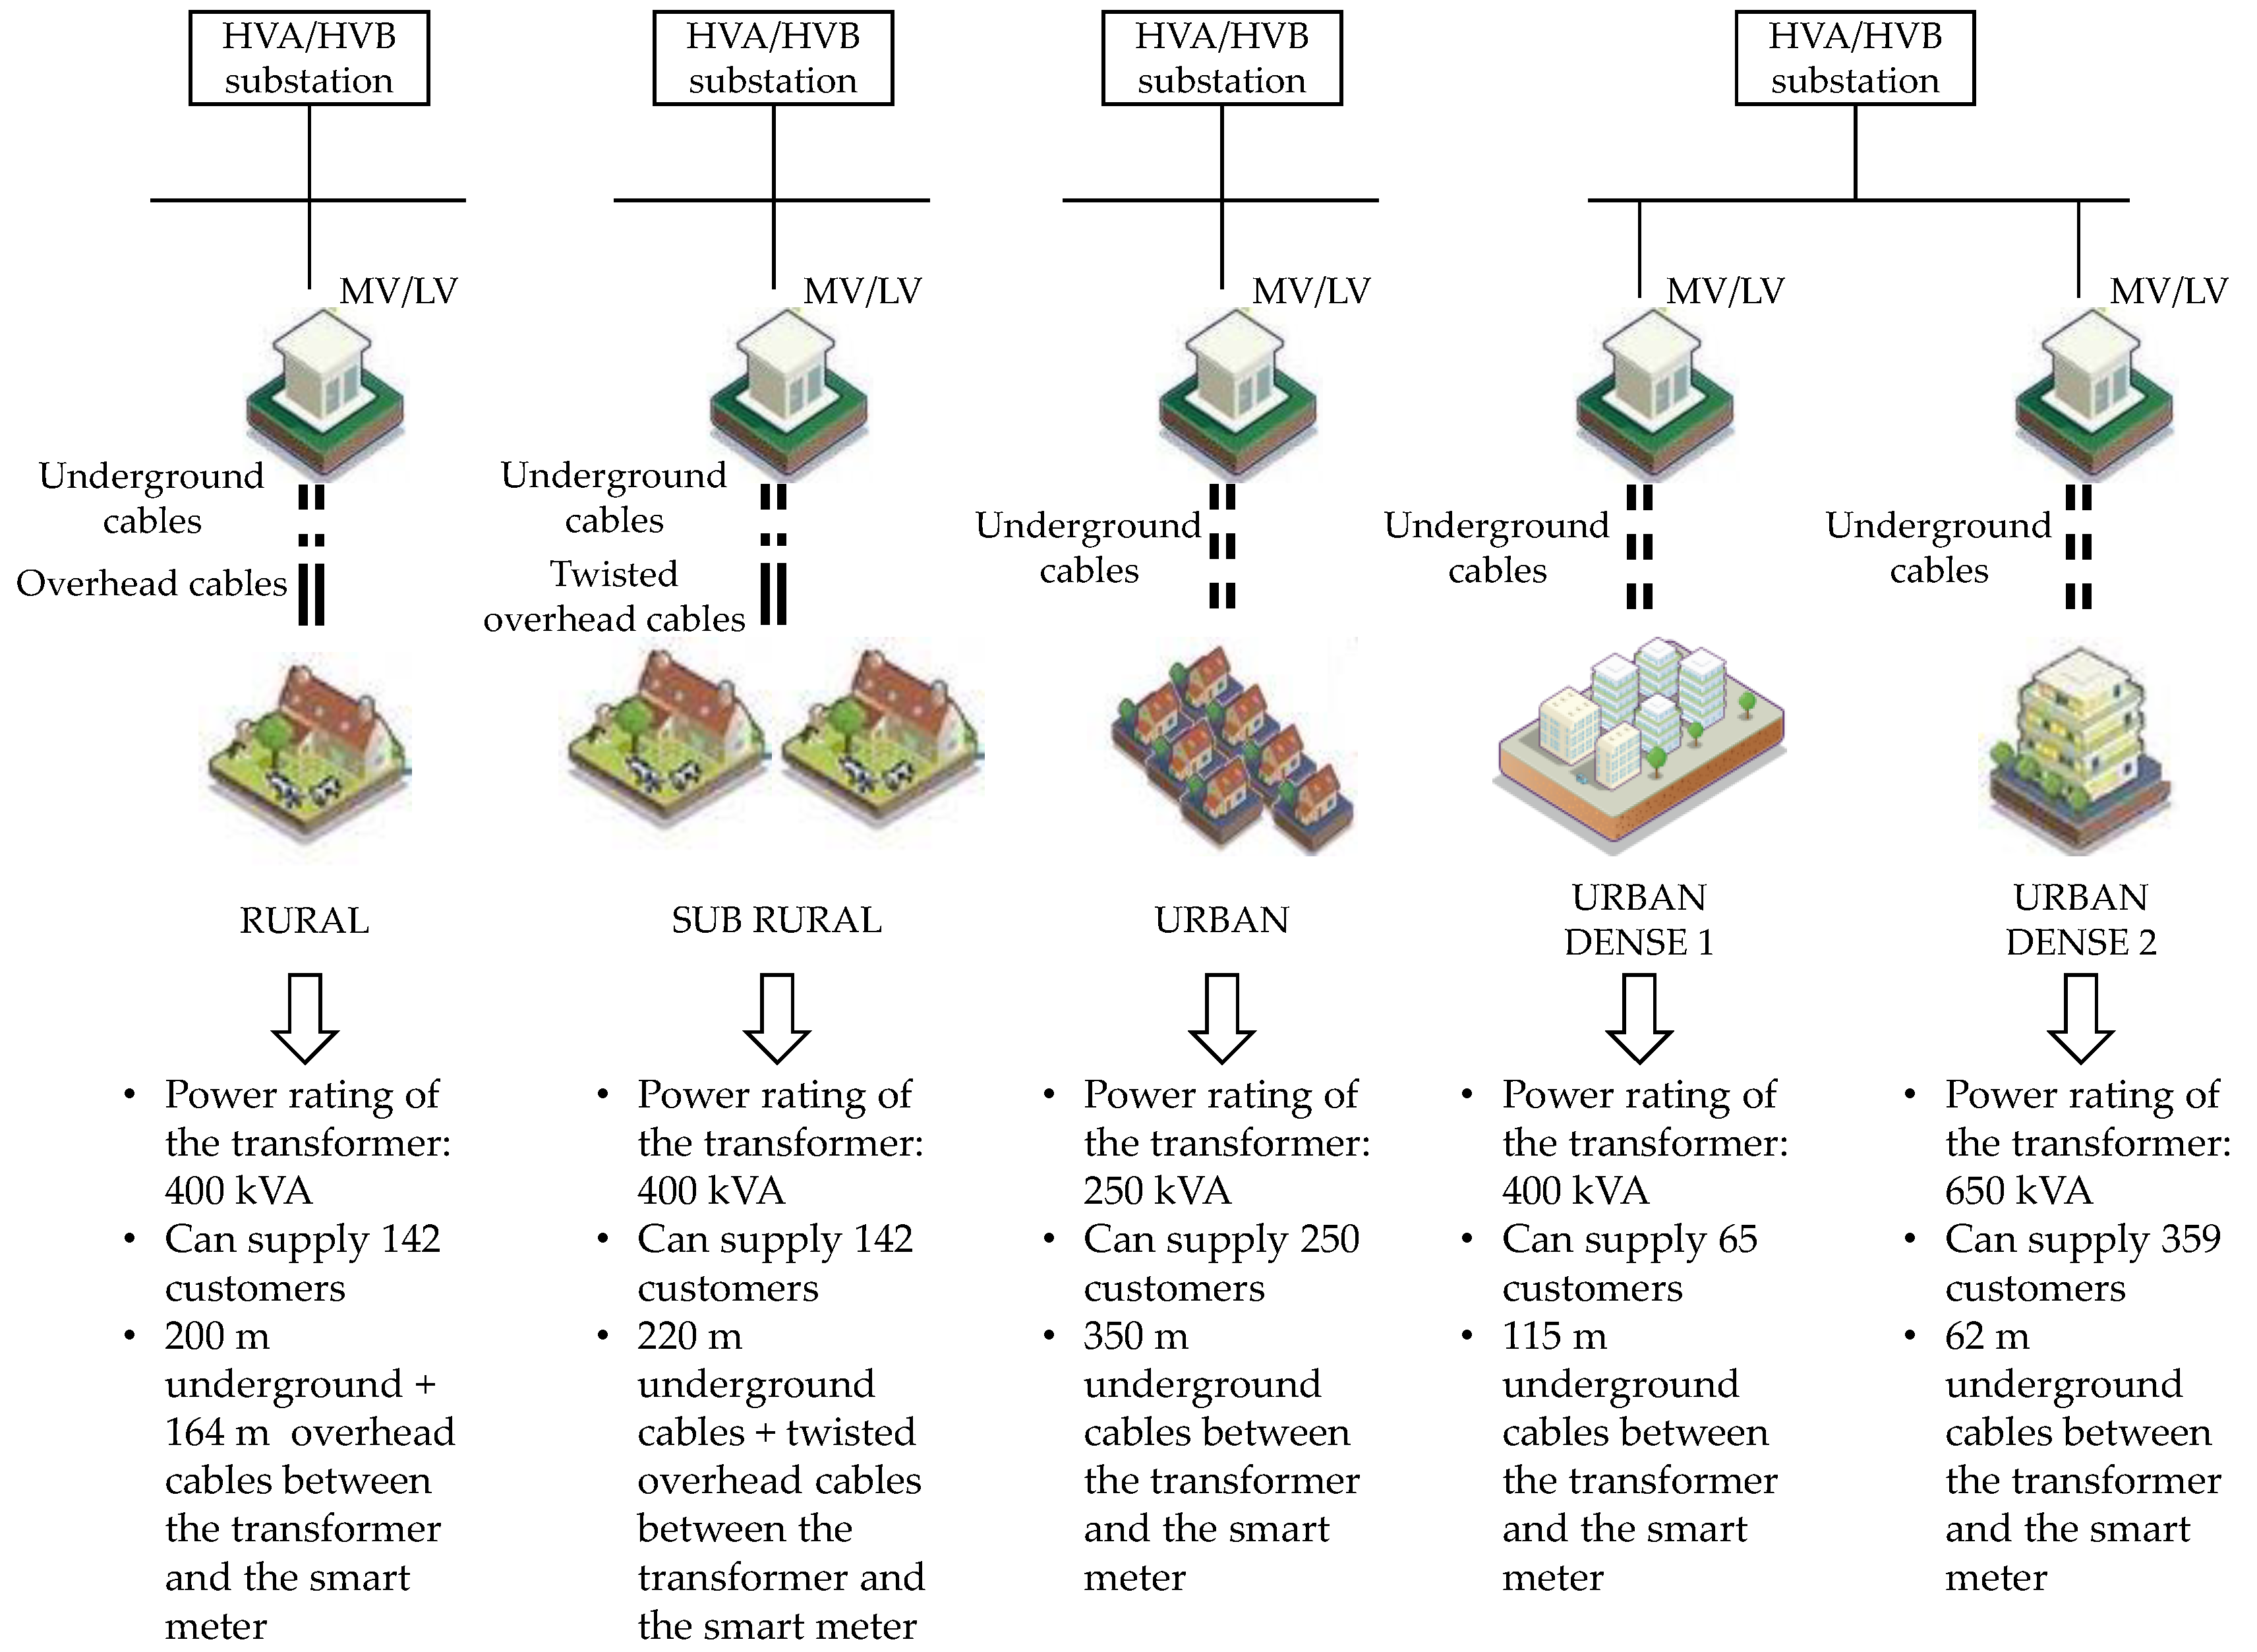
2.1. Identification of Measurement Sites

Noise level depends on loads’ profiles, density of interconnections, quality of connections and the distance between communication nodes. Noise profile is important in areas with a high connection density, lighting loads and non-linear loads, as well as the types of distribution [27,33,35]. In this manuscript, five sites in different locations around the city of Tours in France were chosen to study the noise profiles. Several topologies with various electrical features were also chosen to get a better understanding of the dynamic behavior of the network, such as information about the traffic inside the NB-PLC and especially, at two different points of the network: in the transformer substation, and on the customer side in parallel to the smart electricity meter. In rural networks, the overhead cable length may typically extend up to 1 km, when the number of loads is very low. However, the residential and industrial networks are characterized by a high density of loads connected to a short length of underground cables [33].
As can be seen in Figure 3, the sites can be classified into five categories: rural, sub rural, urban, urban dense 1, and urban dense 2. For each kind of site, a transformer supplies a variety of installations for several customers. The main characteristics and details of the LV distribution cables, and the number of customers within the same branches of each site, are described below:
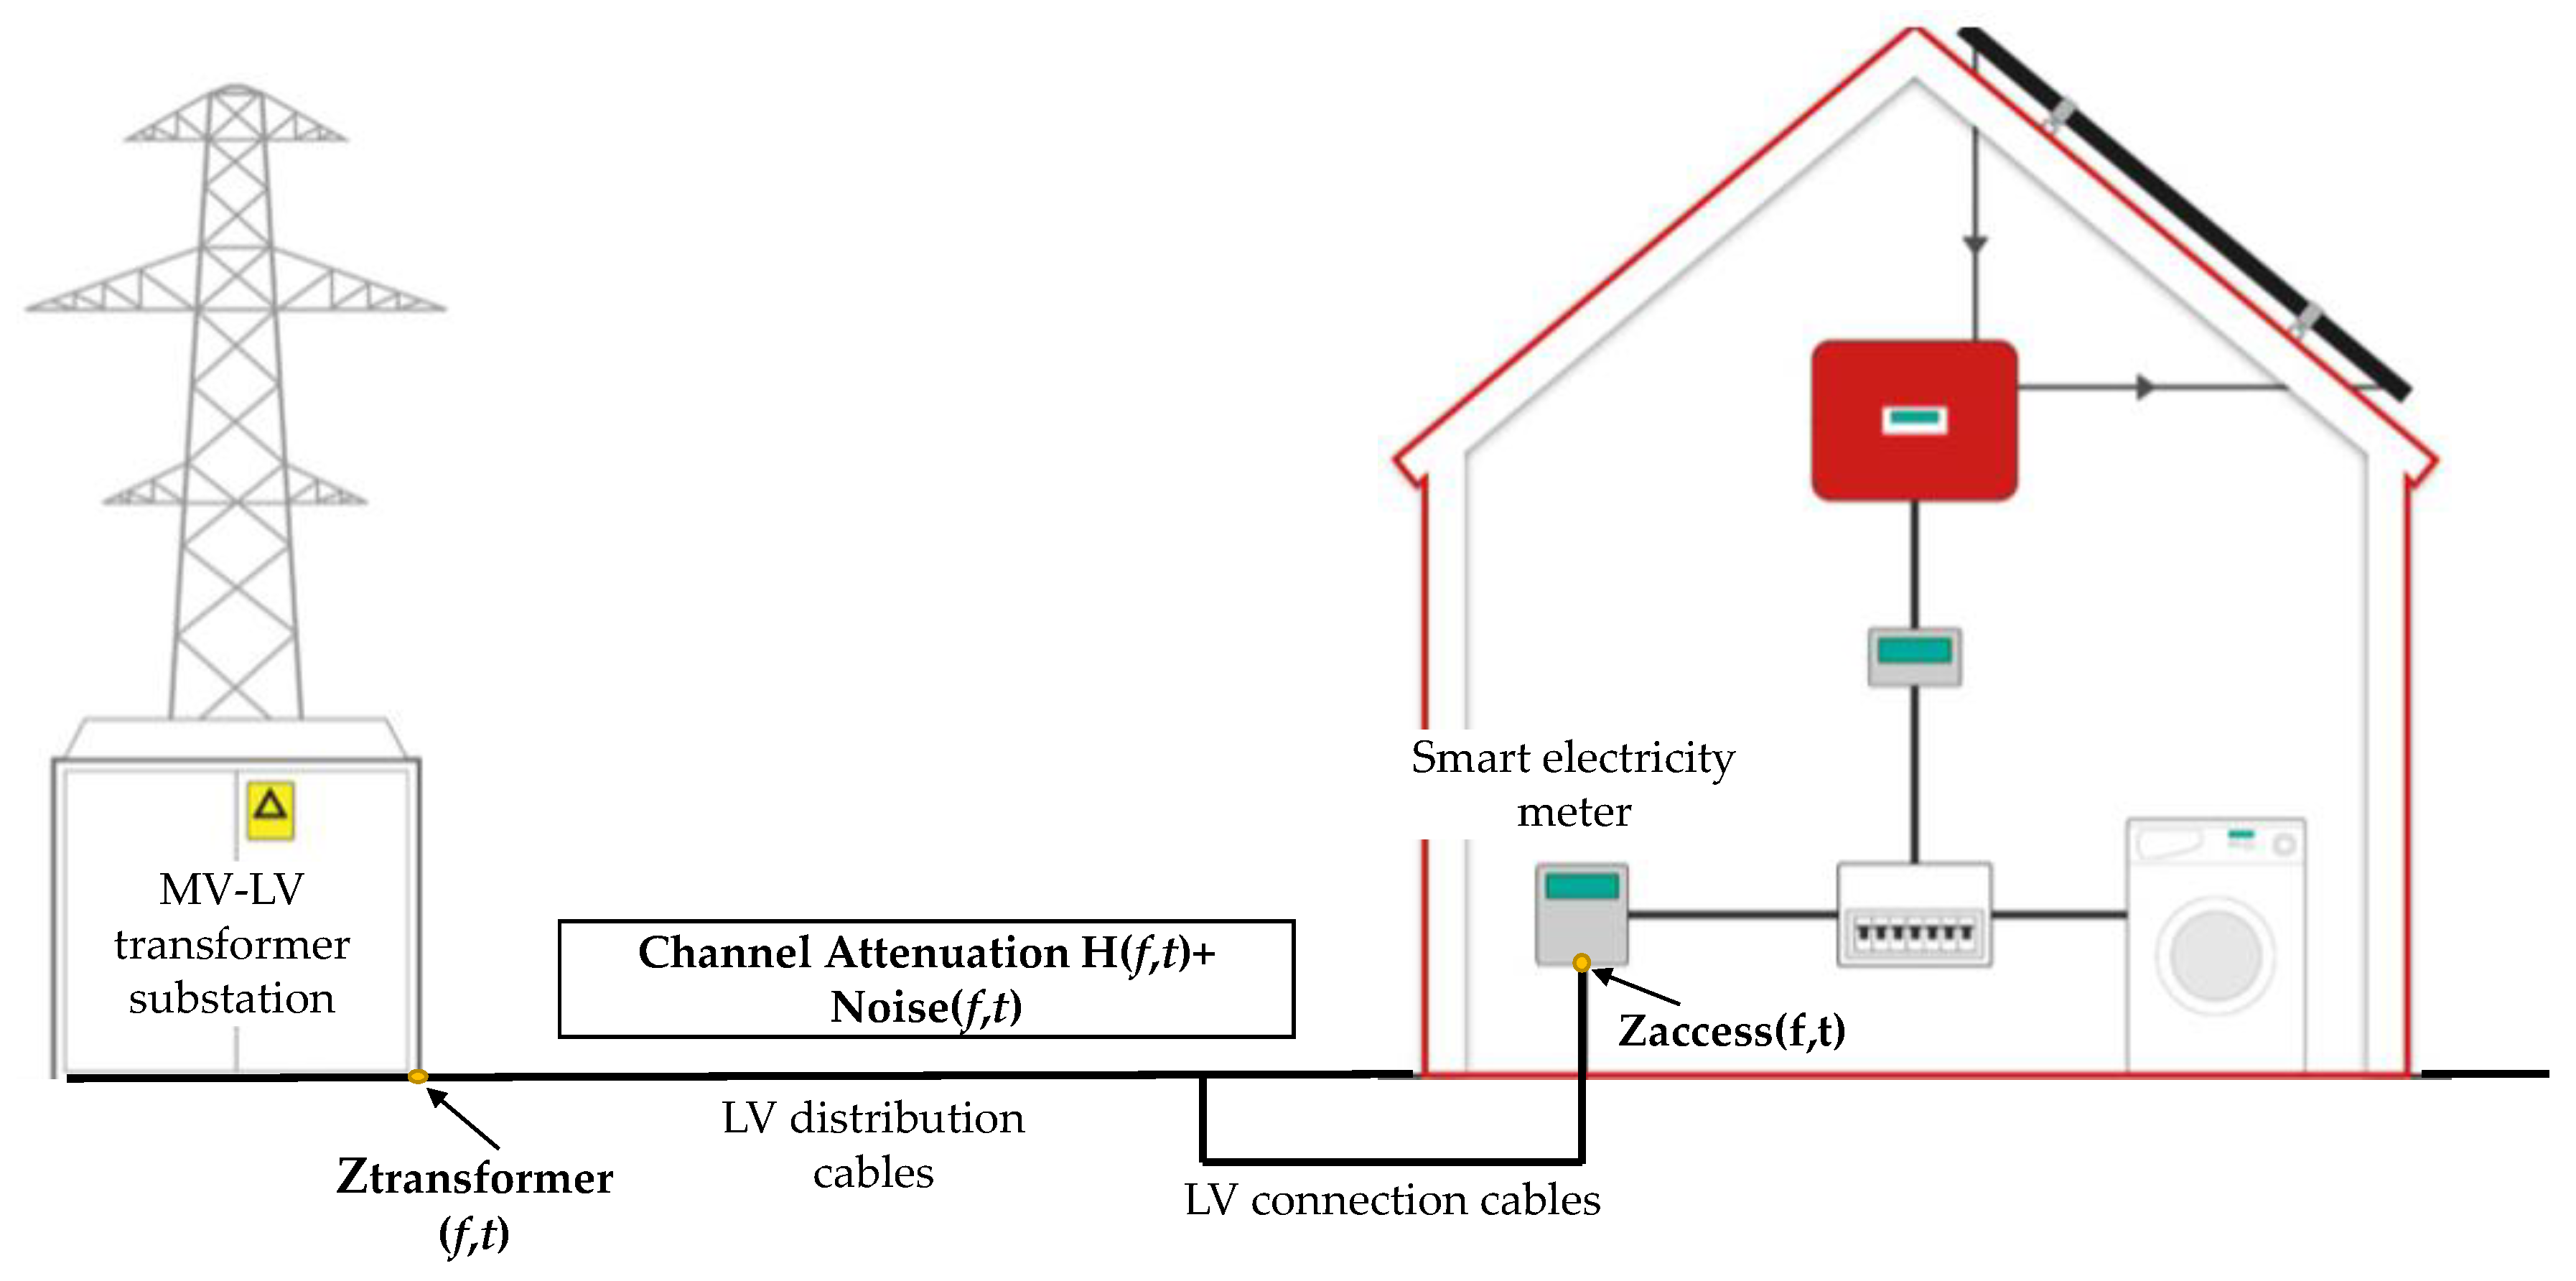
  • Rural site: the rated power of the transformer equals 250 kVA can supply 89 customer installations. The transformer and the smart electricity meter are connected using a 200-m long underground cable and a 164 m twisted overhead connection cable. One producer is connected to the network.
  • Sub rural site: the rated power of the transformer equals 400 kVA. It supplies 142 customers. The transformer and the smart electricity meter are connected through a 220-m long underground cable. No producer is connected to the network.
  • Urban site: it represents a residential site. The rated power of the transformer equals 250 kVA. It supplies 250 customers. The transformer and the smart electricity meter are connected using a 335 m of 150 mm2 aluminum underground cable, and a 10 m twisted overhead connection cable with a 4 × 35 mm2 section. No producer is connected to the network.
  • Urban dense 1 site: the transformer is directly integrated in a building. Its rated power equals 400 kVA. It can supply 65 customers. The transformer and the smart electricity meter are connected through a 115 m aluminum underground cable. No producer is connected to the network.
  • Urban dense 2 site: It does not have the same features as the urban dense 1. The transformer is also implemented in a building, but its rated power equals 650 kVA. It can supply 359 customers. The transformer and the smart electricity meter are connected through a 62-m long aluminum underground cable. No producer is connected to the network.

2.2. Experimental Procedure

As described in the literature, noise can be classified into five categories that affect NB-PLC signals [28,29]. In particular, the perturbations depend on their duration, spectral occupation and amplitude. These five categories are named: colored background noise, narrowband noise, periodic impulsive noise asynchronous periodic impulsive noise synchronous, and aperiodic impulse noise. The first three categories have stationary characteristics, while the two last ones are impulse noises with a short duration, randomness, and high power spectral density (PSD). Their main features are given below:
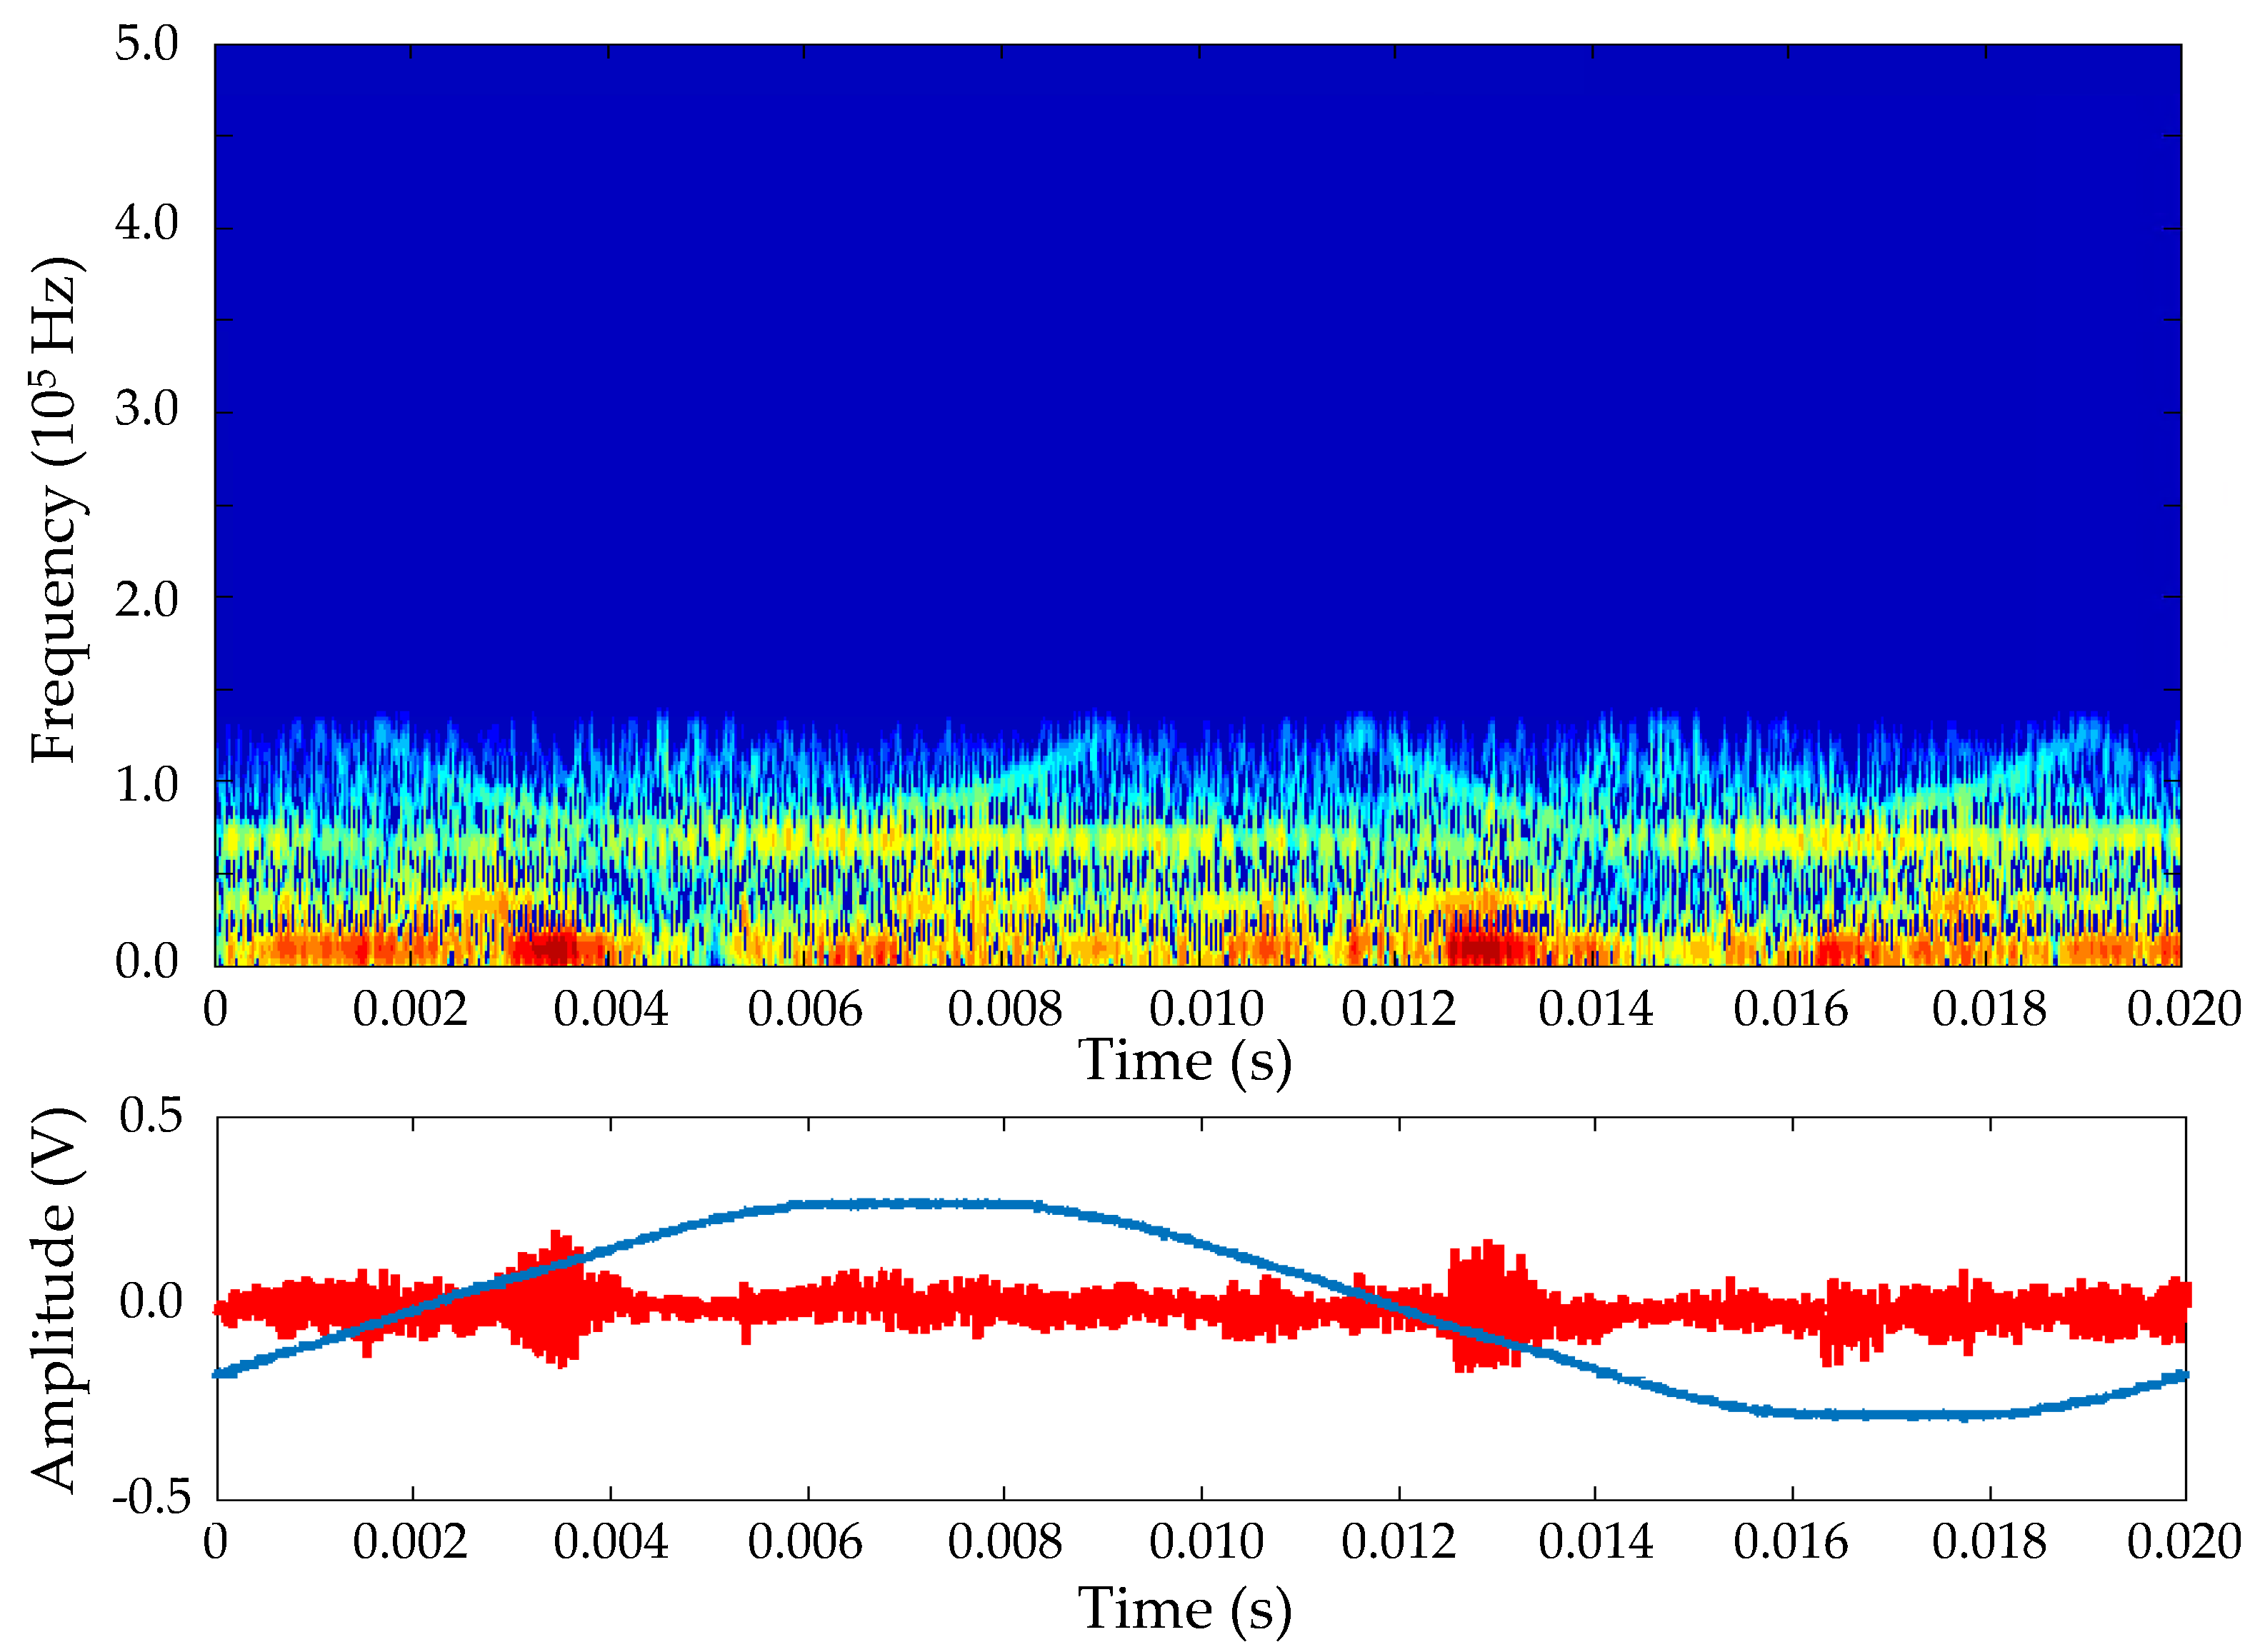
  • Colored background noise corresponds to the superposition of several low signals that are present in the channel. This type of noise has a low decreasing PSD in the frequency domain. The dependence of the frequency-colored noise is very clear at low frequency, and its PSD is practically constant at high frequency.
  • Narrowband noise is composed of sinusoids coupled with the grid by either broadcast signals or electrical devices. Broadcast signals are typically amplitude-modulated sinusoids.
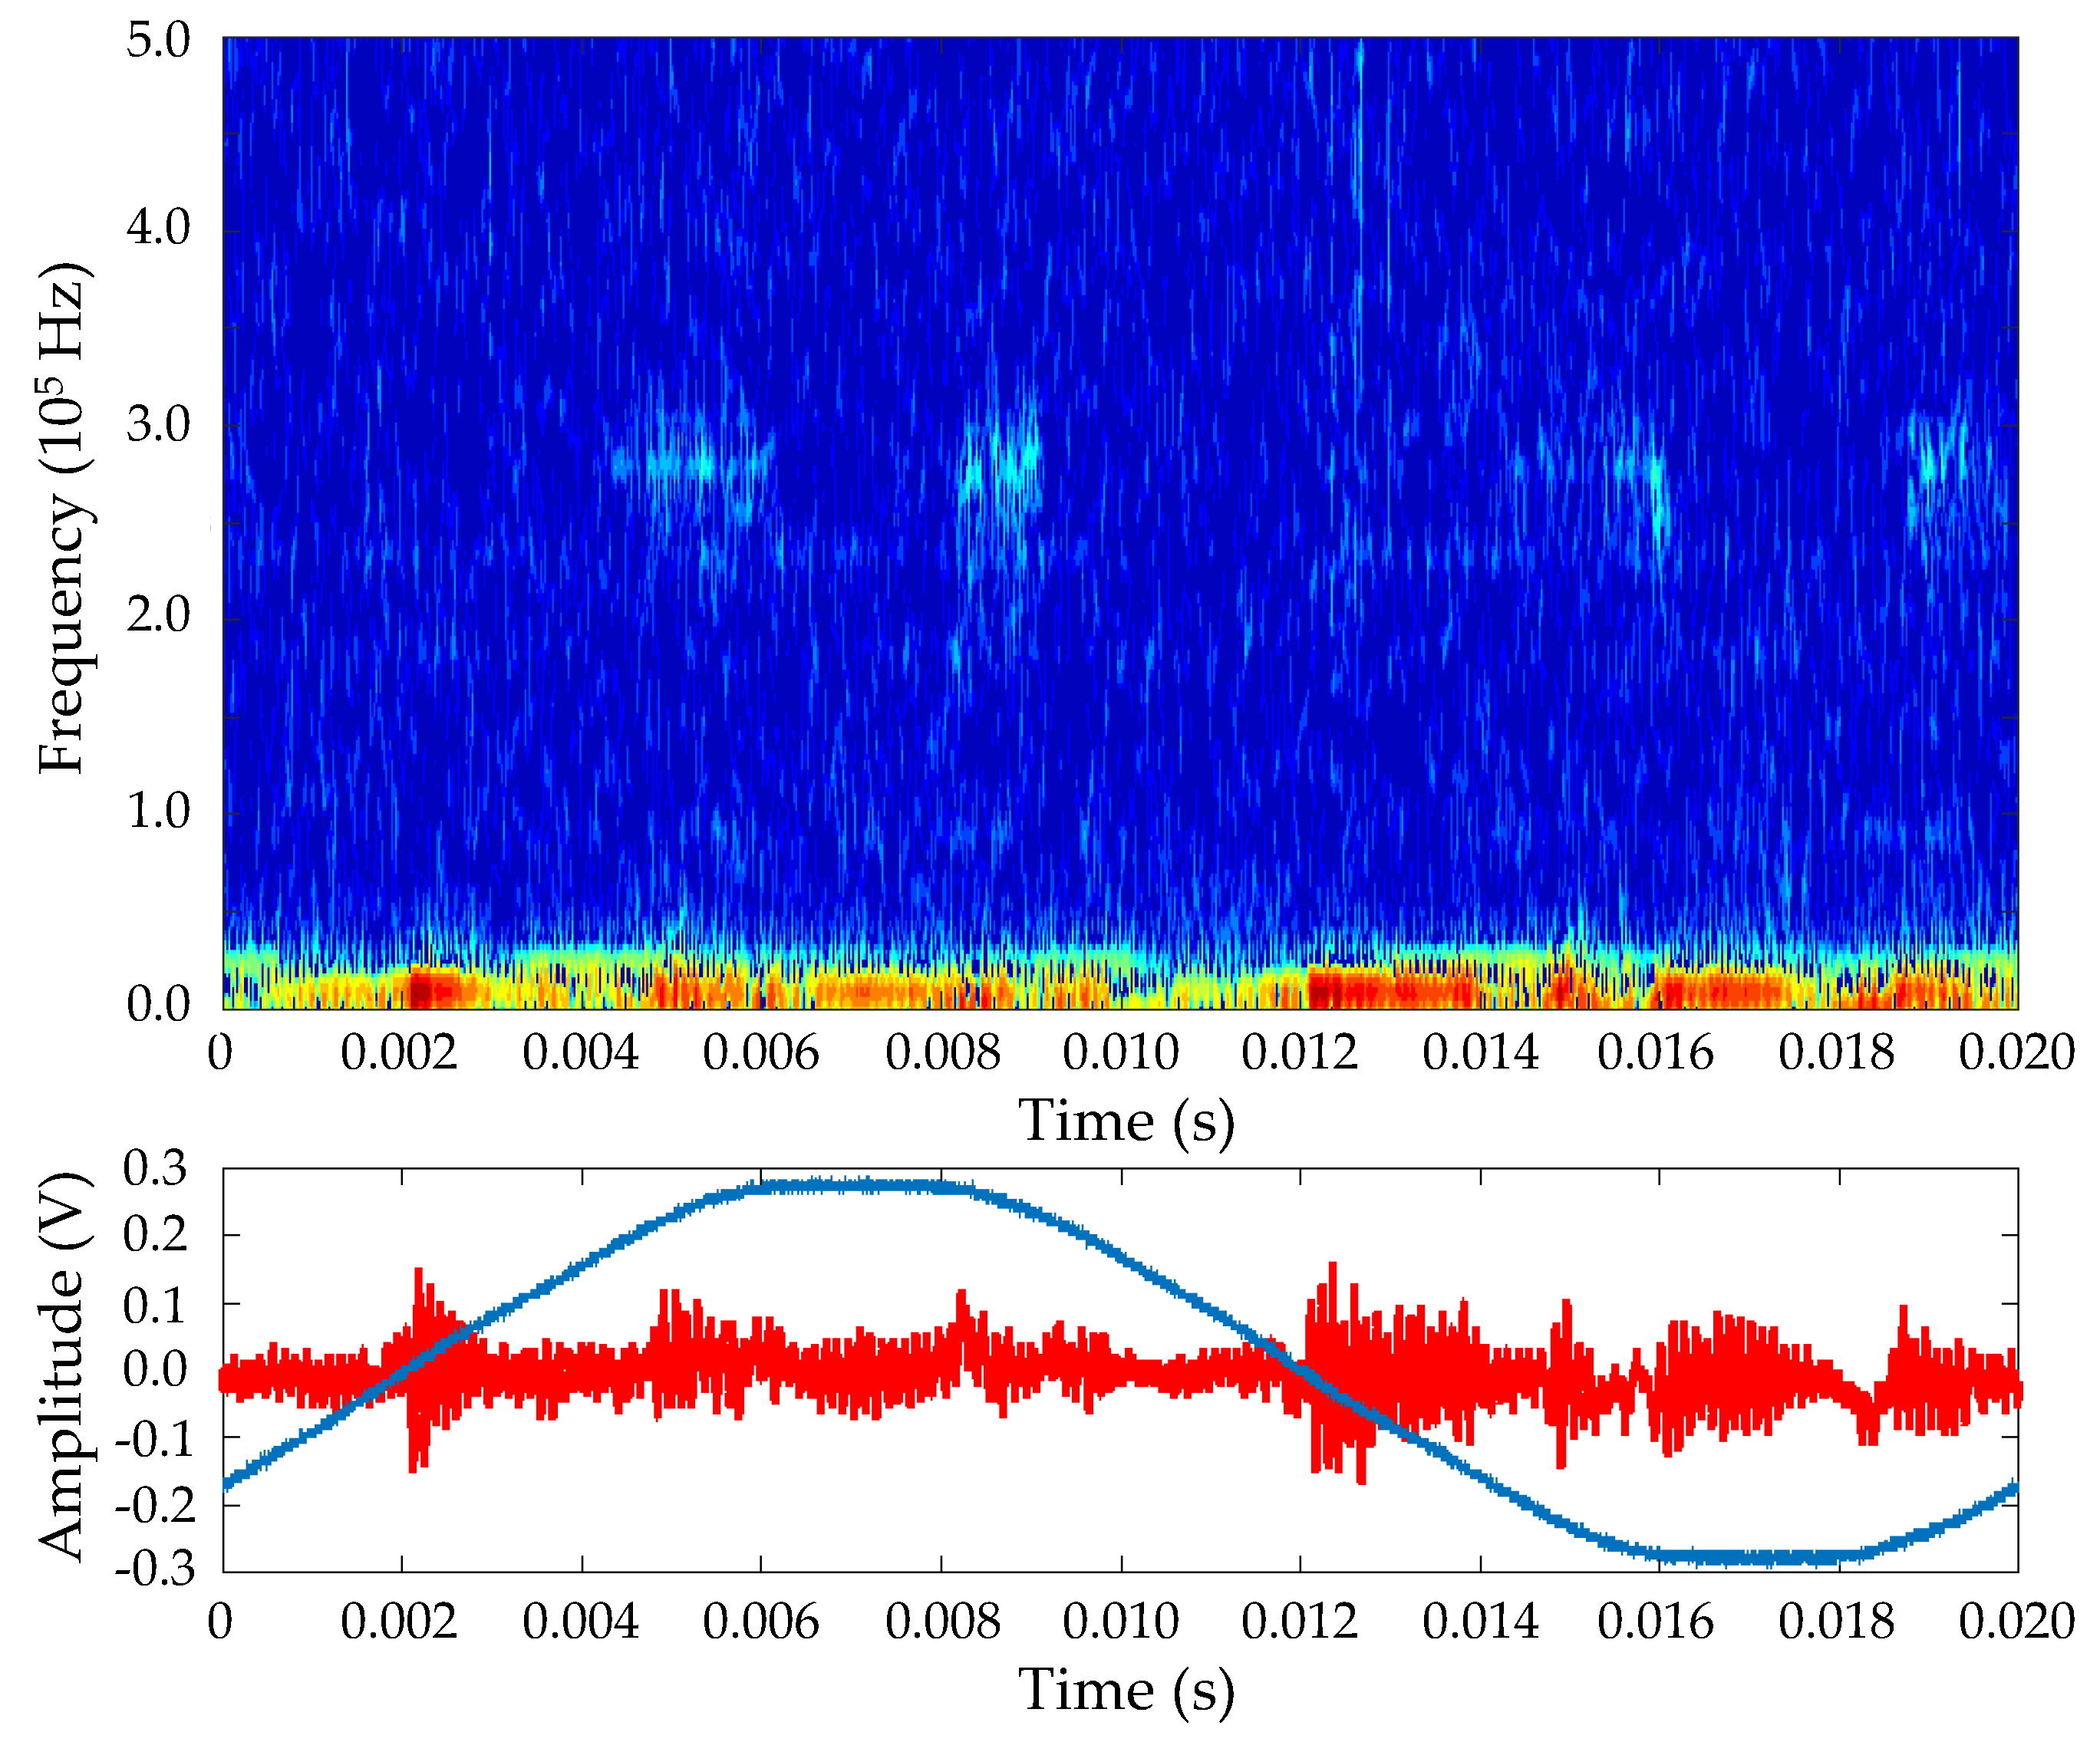
  • Periodic impulsive noise asynchronous to the mains is identified as an impulse train in the frequency band from 50 to 200 kHz. It is generated by the switched-mode power supplies.
  • Periodic impulsive noise synchronous to the mains is caused by high power switching of semiconductor devices.
  • Aperiodic impulsive noise is composed of impulses of short duration and high amplitude caused by switching transients.
Noise characteristics, such as PSD, amplitude, inter-arrival time, in time-frequency representation require the use of two specific measurement protocols.

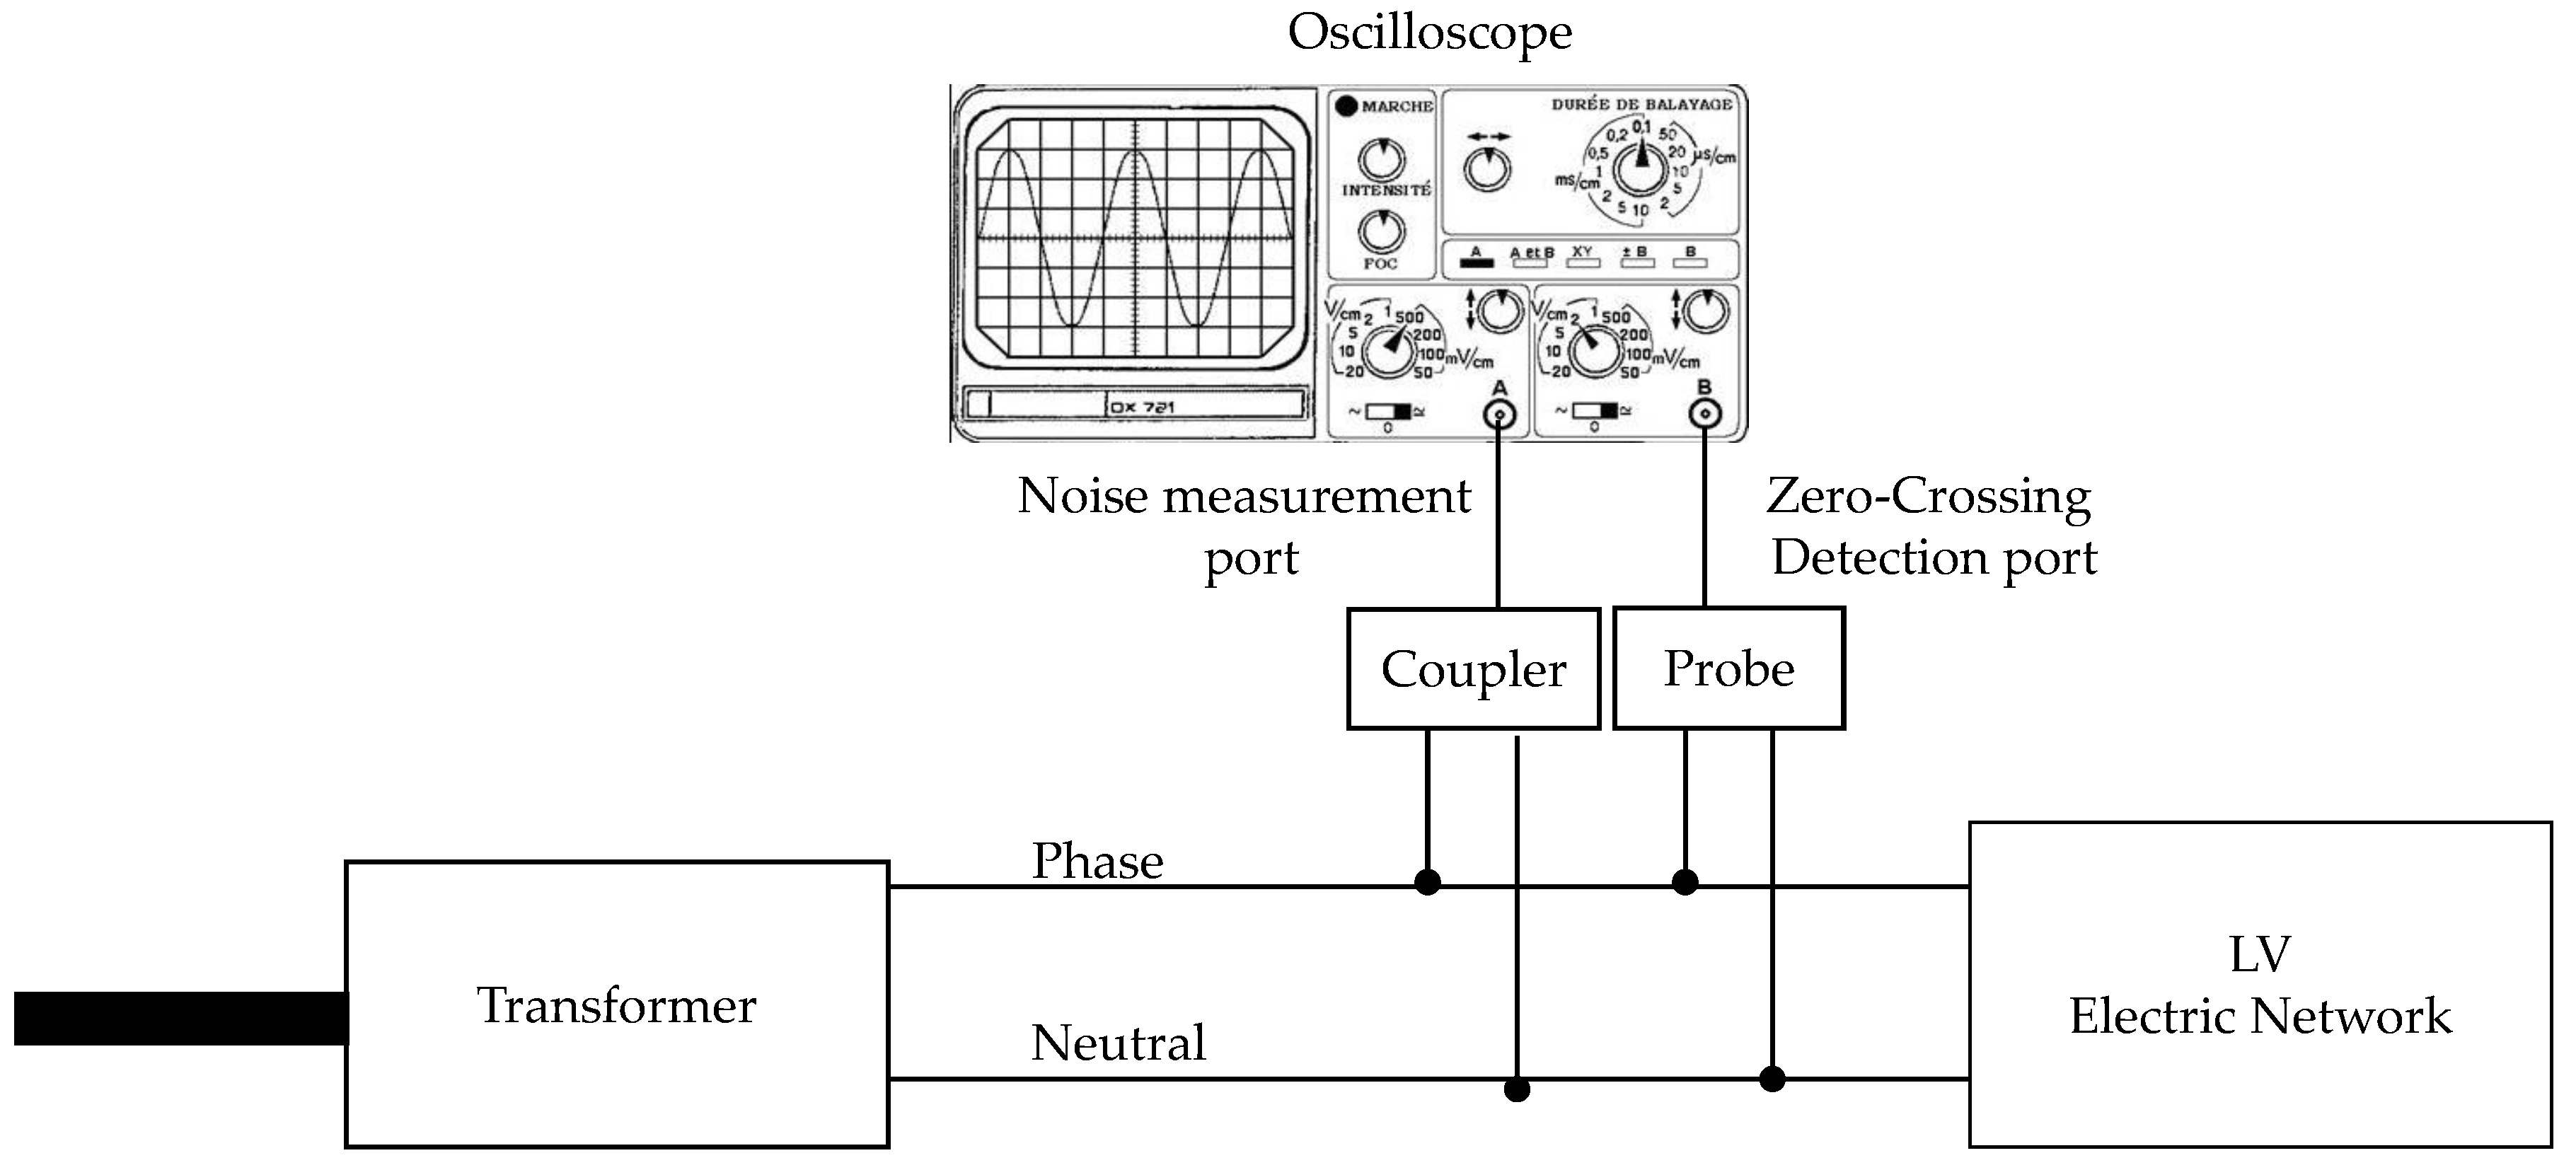
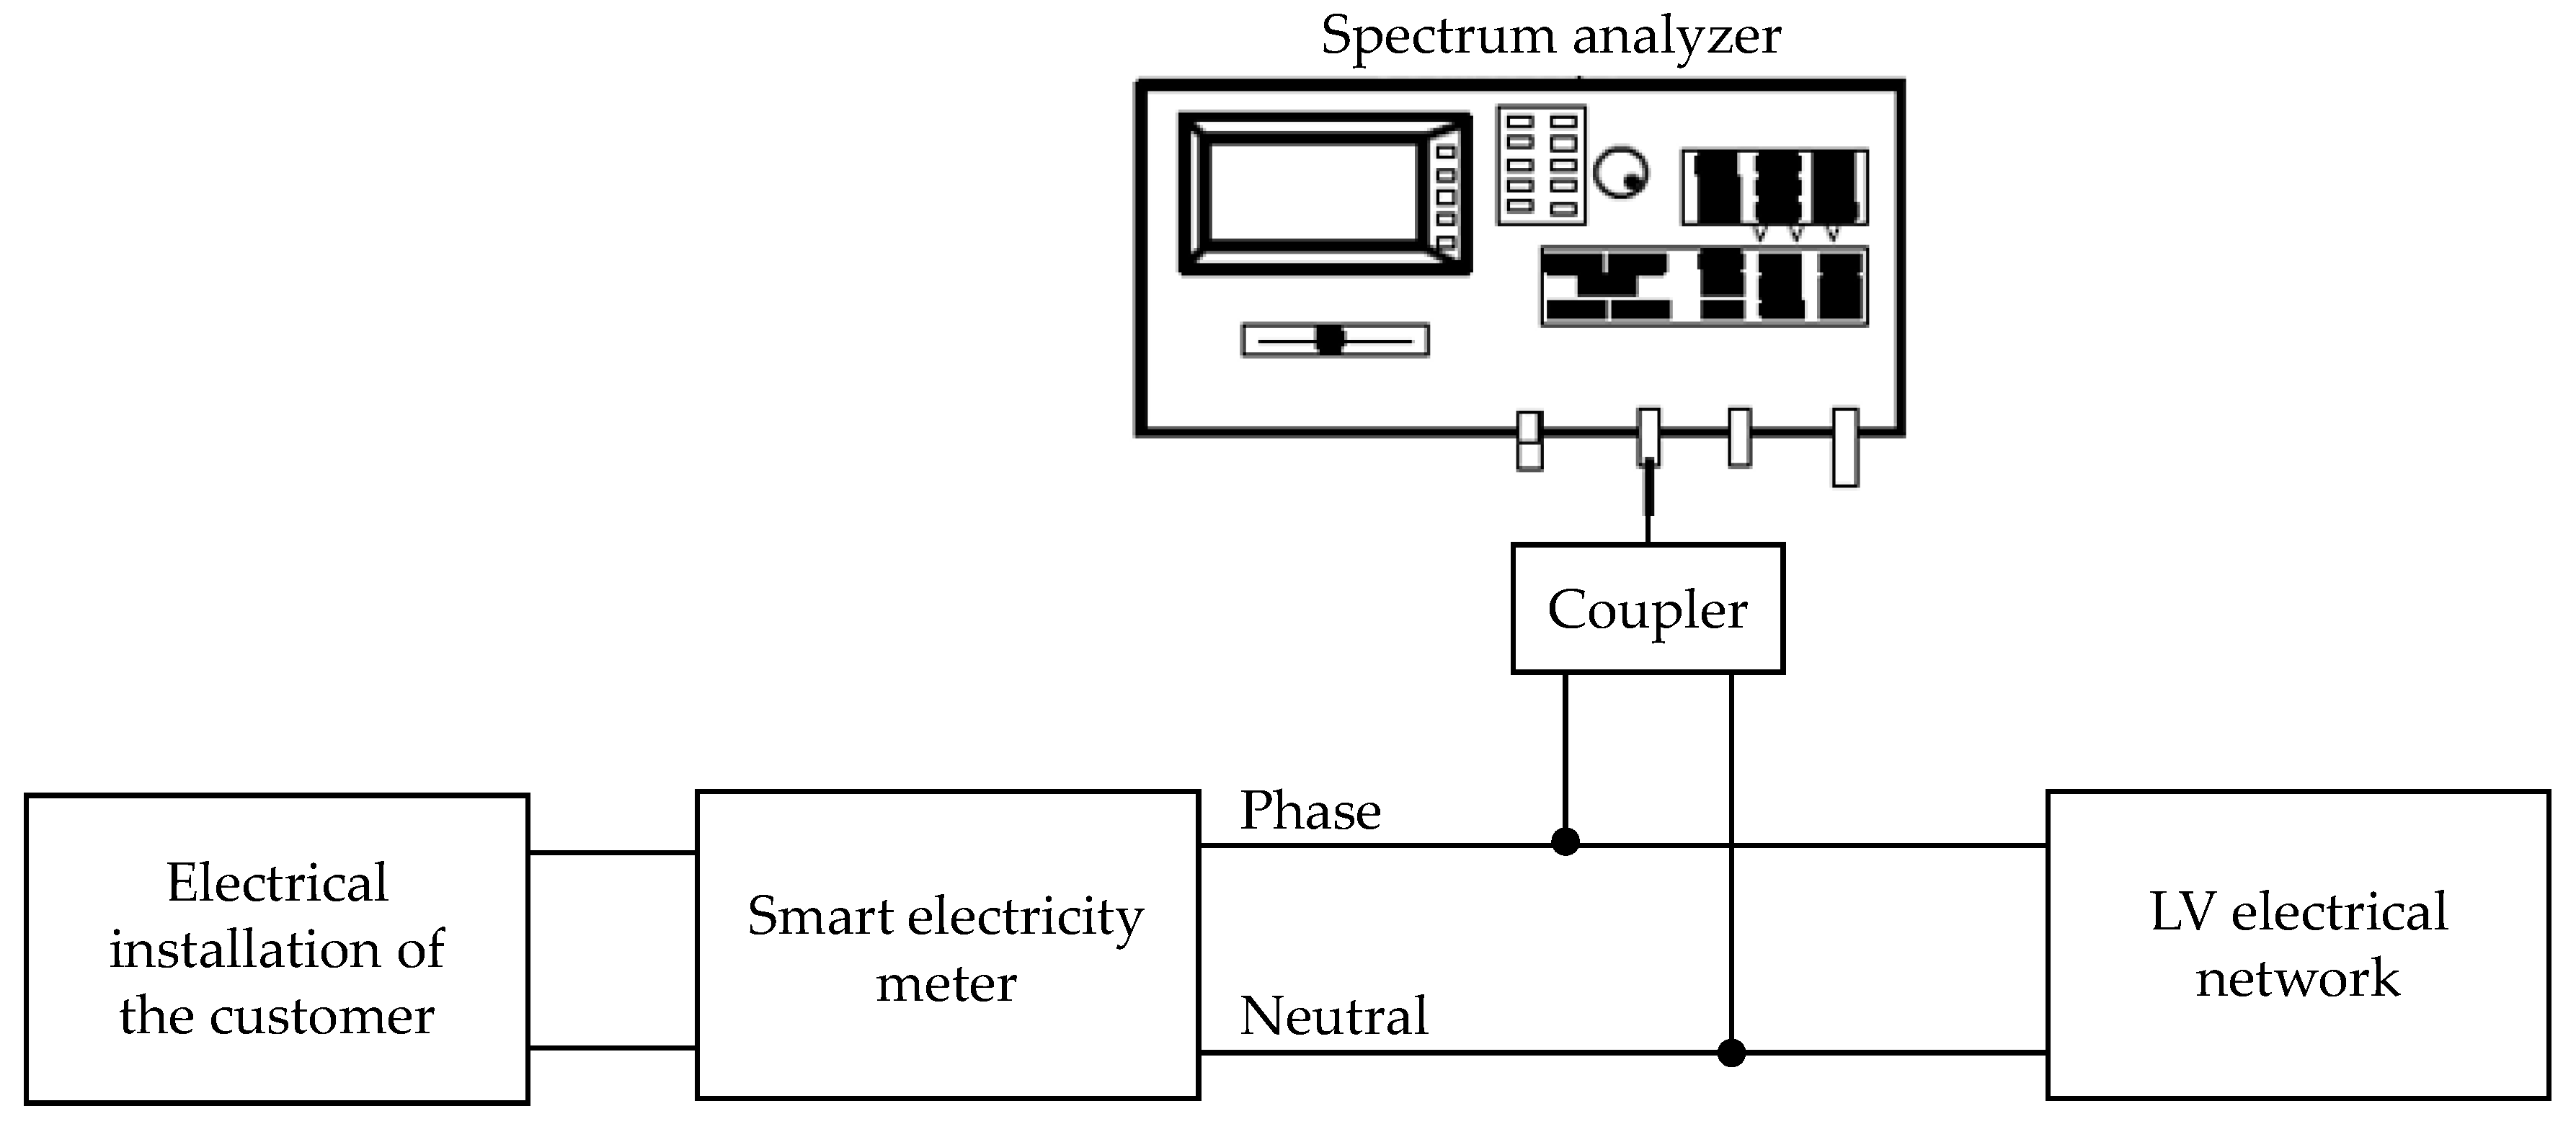
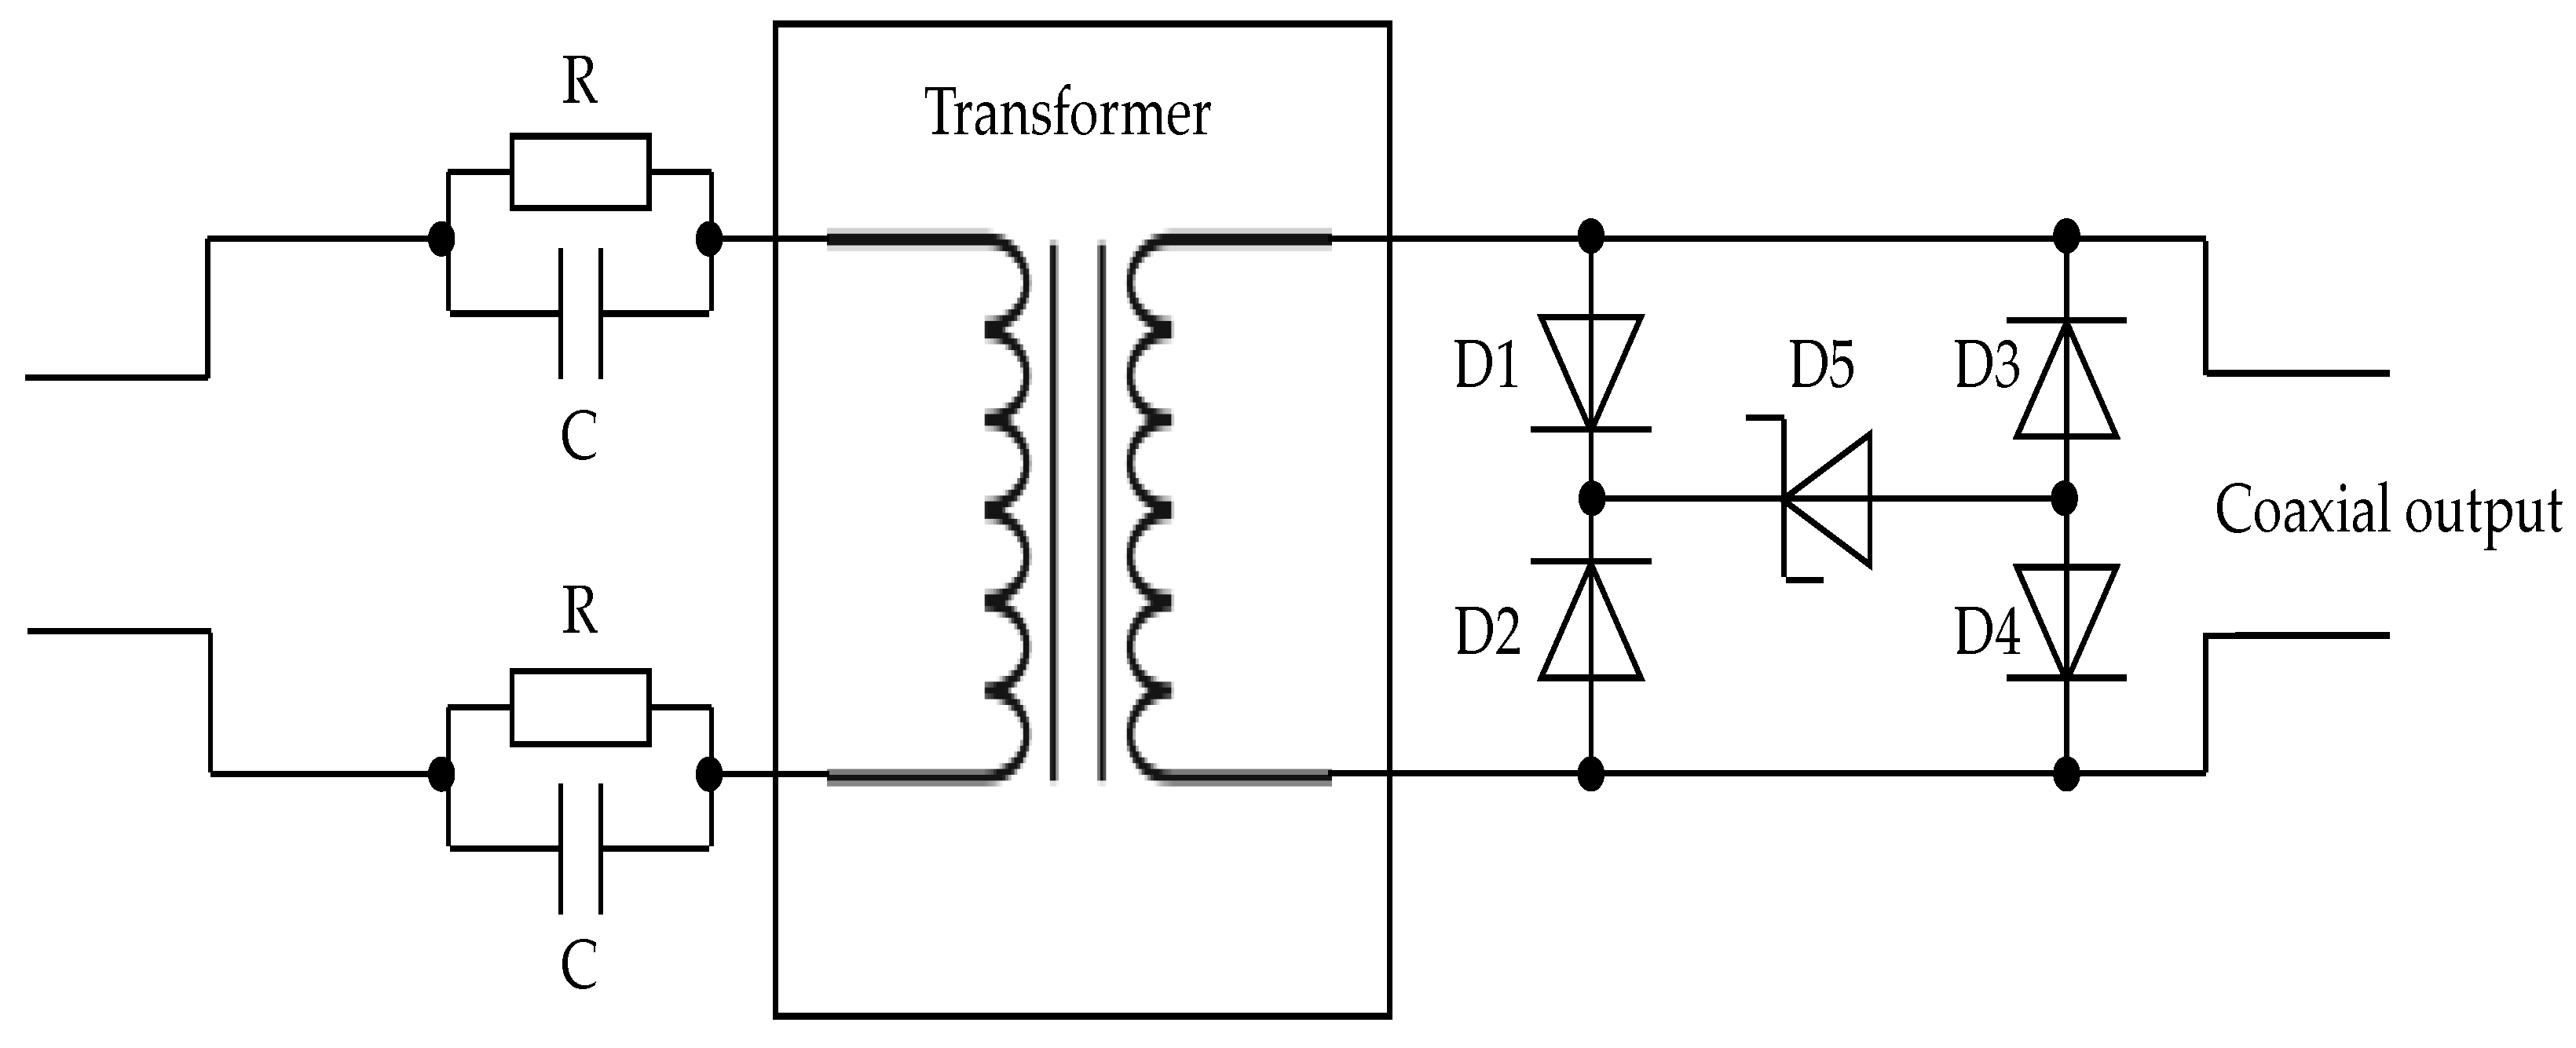
2.2.1. Measurement of Noise Power Spectrum in the Transformer Substation

As can be seen in Figure 4, noise power spectrum is captured with a spectrum analyzer (reference: PXA N9030A, Agilent Technologies, Santa Clara, CA, USA) both with linear video signal averaging and RMS detection. The sweep time is set to 412.4 ms, which corresponds to twenty periods of the network. During this sweep time, the frequency is sampled at 801 frequencies in the band from 9 to 500 kHz. The bandwidth resolution (IFBW) has a constant value (i.e., 200 Hz). It is important to note that all measurements are carried out in the same configuration.
Noise power spectrum is carried out in the transformer substation and at the customer side in parallel to the smart electricity meter with single phase coupling. As can be seen in Figure 5, a capacitive coupler is used. It is equivalent to a bandpass filter from 1 kHz to 1 MHz.

2.2.2. Temporal Measurement Setup

As can be seen in Figure 6, the measurement system designed to capture the time variations includes a Tektronix 5054 oscilloscope. This kind of equipment is characterized by a high real-time measurement accuracy with a sample rate of 20 Giga samples/s, and a resolution of 8 bits per caliber. A sampling frequency equal to 2.5 Ms/s is adopted. The oscilloscope is connected to the LV-network through the capacitive coupler described in Figure 5. A high impedance voltage probe (reference: P5200A, Tektronix, Beaverton, OR, USA) is used to synchronize the temporal noise measurement with the 50 Hz mains frequency. For each measurement, the acquisition of the set of data lasts 20 ms to analyze the noise amplitude in greater detail.

2.2.3. Measurement Scenarios

The noise temporal and frequency characteristics can be extracted from specific scenarios. The first scenario consists in measuring the noise PSD at the same time of the day in all sites. The aim is to get a better understanding of the noise profile variations at a specific time (i.e., 10 a.m.) depending on the various locations. At that time, the number of loads connected to the network is low.
Many measurements are carried out at 2 p.m. to study the long-time variation of the noise PSD. The choice of this specific time is due to the increase of the number of loads connected to the electrical network. The measurements are carried out both in the transformer substation and the customer installation. The aim is to compare the noise PSD measurement at 2 p.m. with the measurement at 10 a.m. The results will be discussed in the next sections of the manuscript. All measurements are performed during the day, because it is impossible to measure the noise PSD at night.
The last scenario focuses on the cyclo-stationary behavior of NB-PLC noise in time-frequency representation. The duration of one orthogonal frequency division multiplexing (OFDM) does not exceed one mains period. Regarding the G3-PLC protocol, the duration of one OFDM frame is between 20 and 190 ms. The duration of one PRIME OFDM frame varies between 145.65 and 581.63 ms. The short time variation in the meter side was presented in a previous work [35]. The results will be analyzed in the next sections of the manuscript.

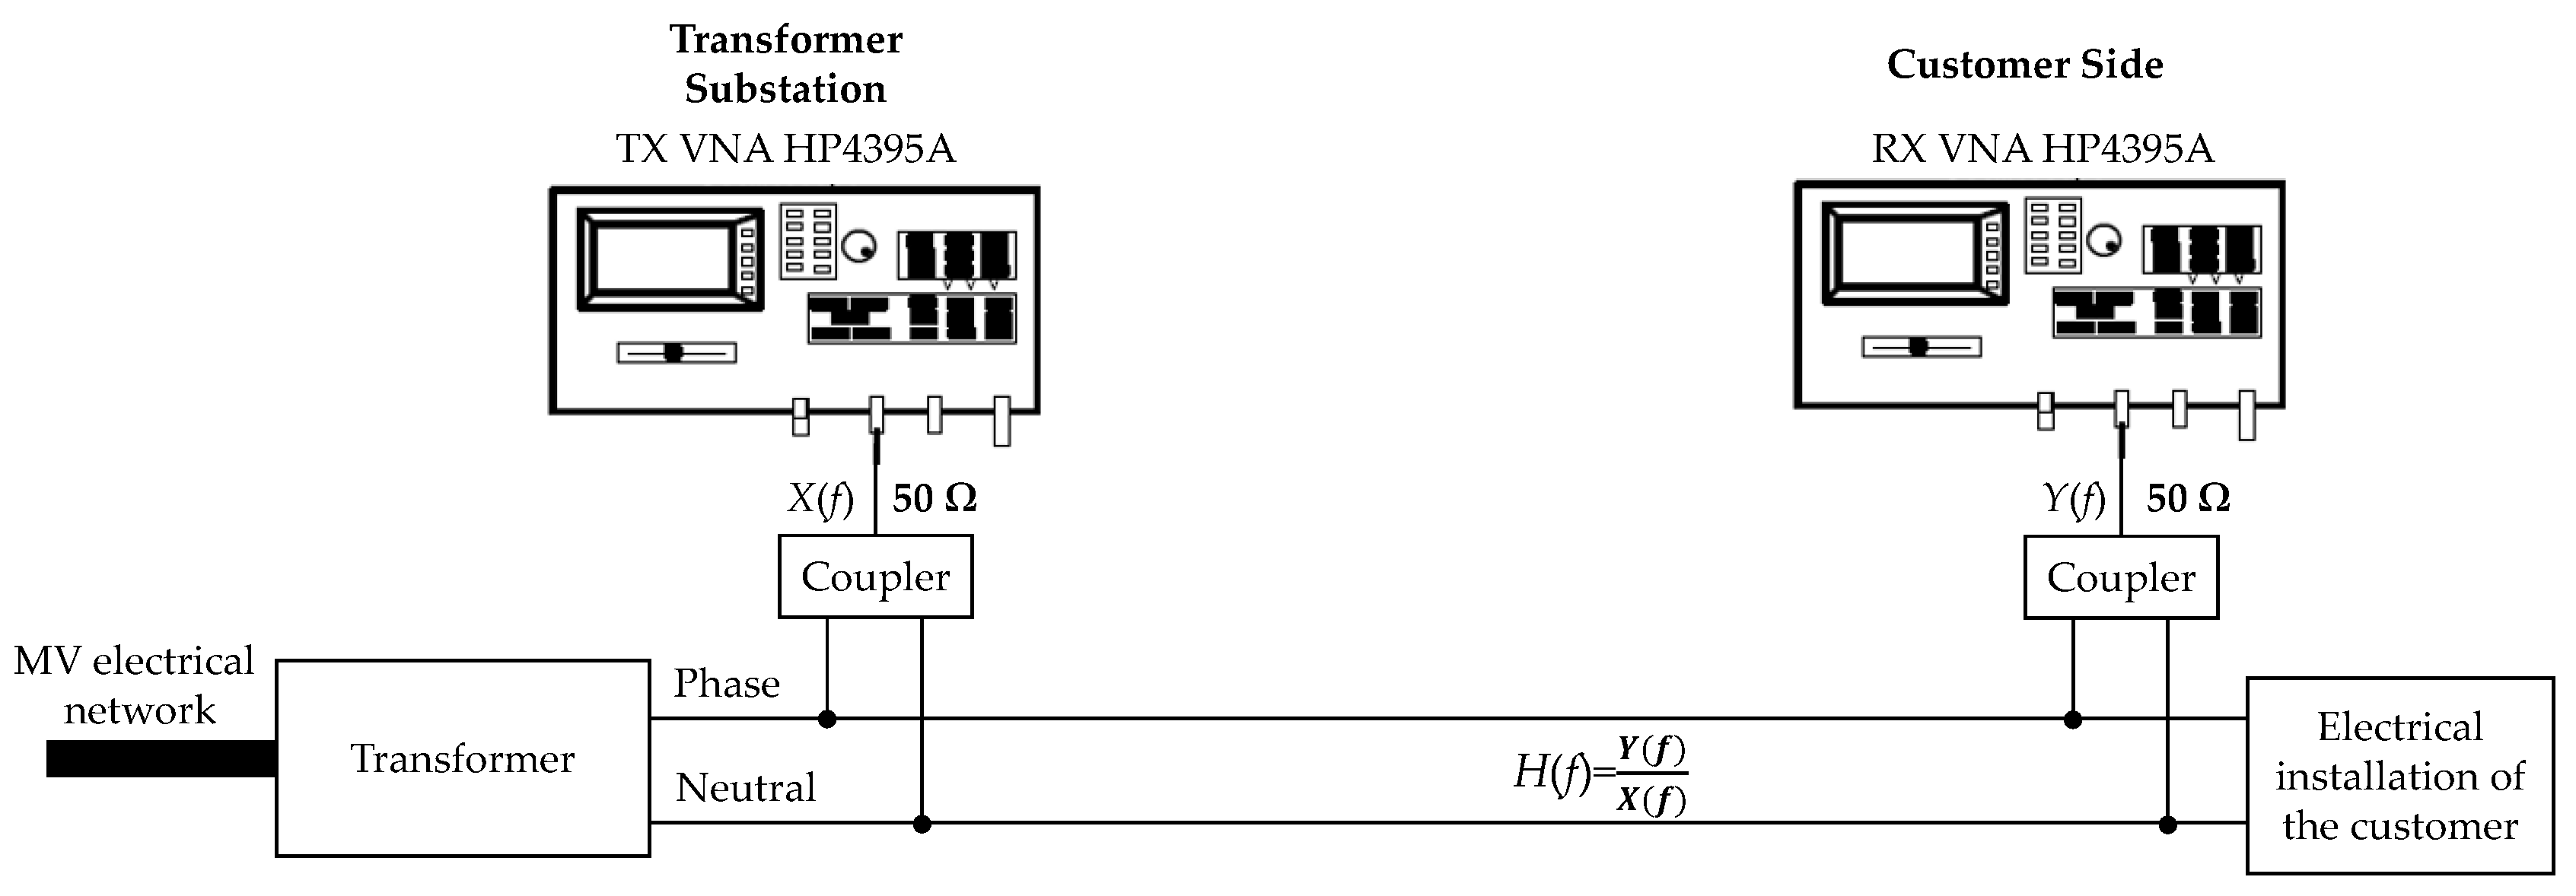
2.2.4. Measurement Protocol of the Transfer Function

The measurement of the transfer function is performed between the transformer substation and the customer’s electrical installation. In some cases, these two points of the grid may be composed of several hundreds of independent electricity meters. Thus, it is difficult to use the same vector network analyzer (VNA) both for transmission and reception.
Equation (1) gives the expression of the transfer function (H(f)) which corresponds to the ratio between the received signal (Y(f)) and the injected signal (X(f)).
As can be seen in Figure 7, in this study, two VNAs are used. The first one acts as a signal generator (VNA-TX). The second one is used as a receiver (VNA-RX). Two NB-PLC single phase couplers enable to couple the signal with the power line, and to decouple it from the power line on the receiver side. The access impedance of each VNA is equal to 50 Ω. For all measurements, the number of points was set to 201 in the frequency band ranging from 9 to 500 kHz. The resolution bandwidth (RBW) is equal to 300 Hz, and the sweep time is set to 5 s per measurement.
H ( f ) = Y ( f ) V N A - R X X ( f ) V N A - T X
  • Y(f)VNA-RX is the received signal.
  • X(f)VNA-TX is the injected signal.

3. Main Experimental Results and Discussion

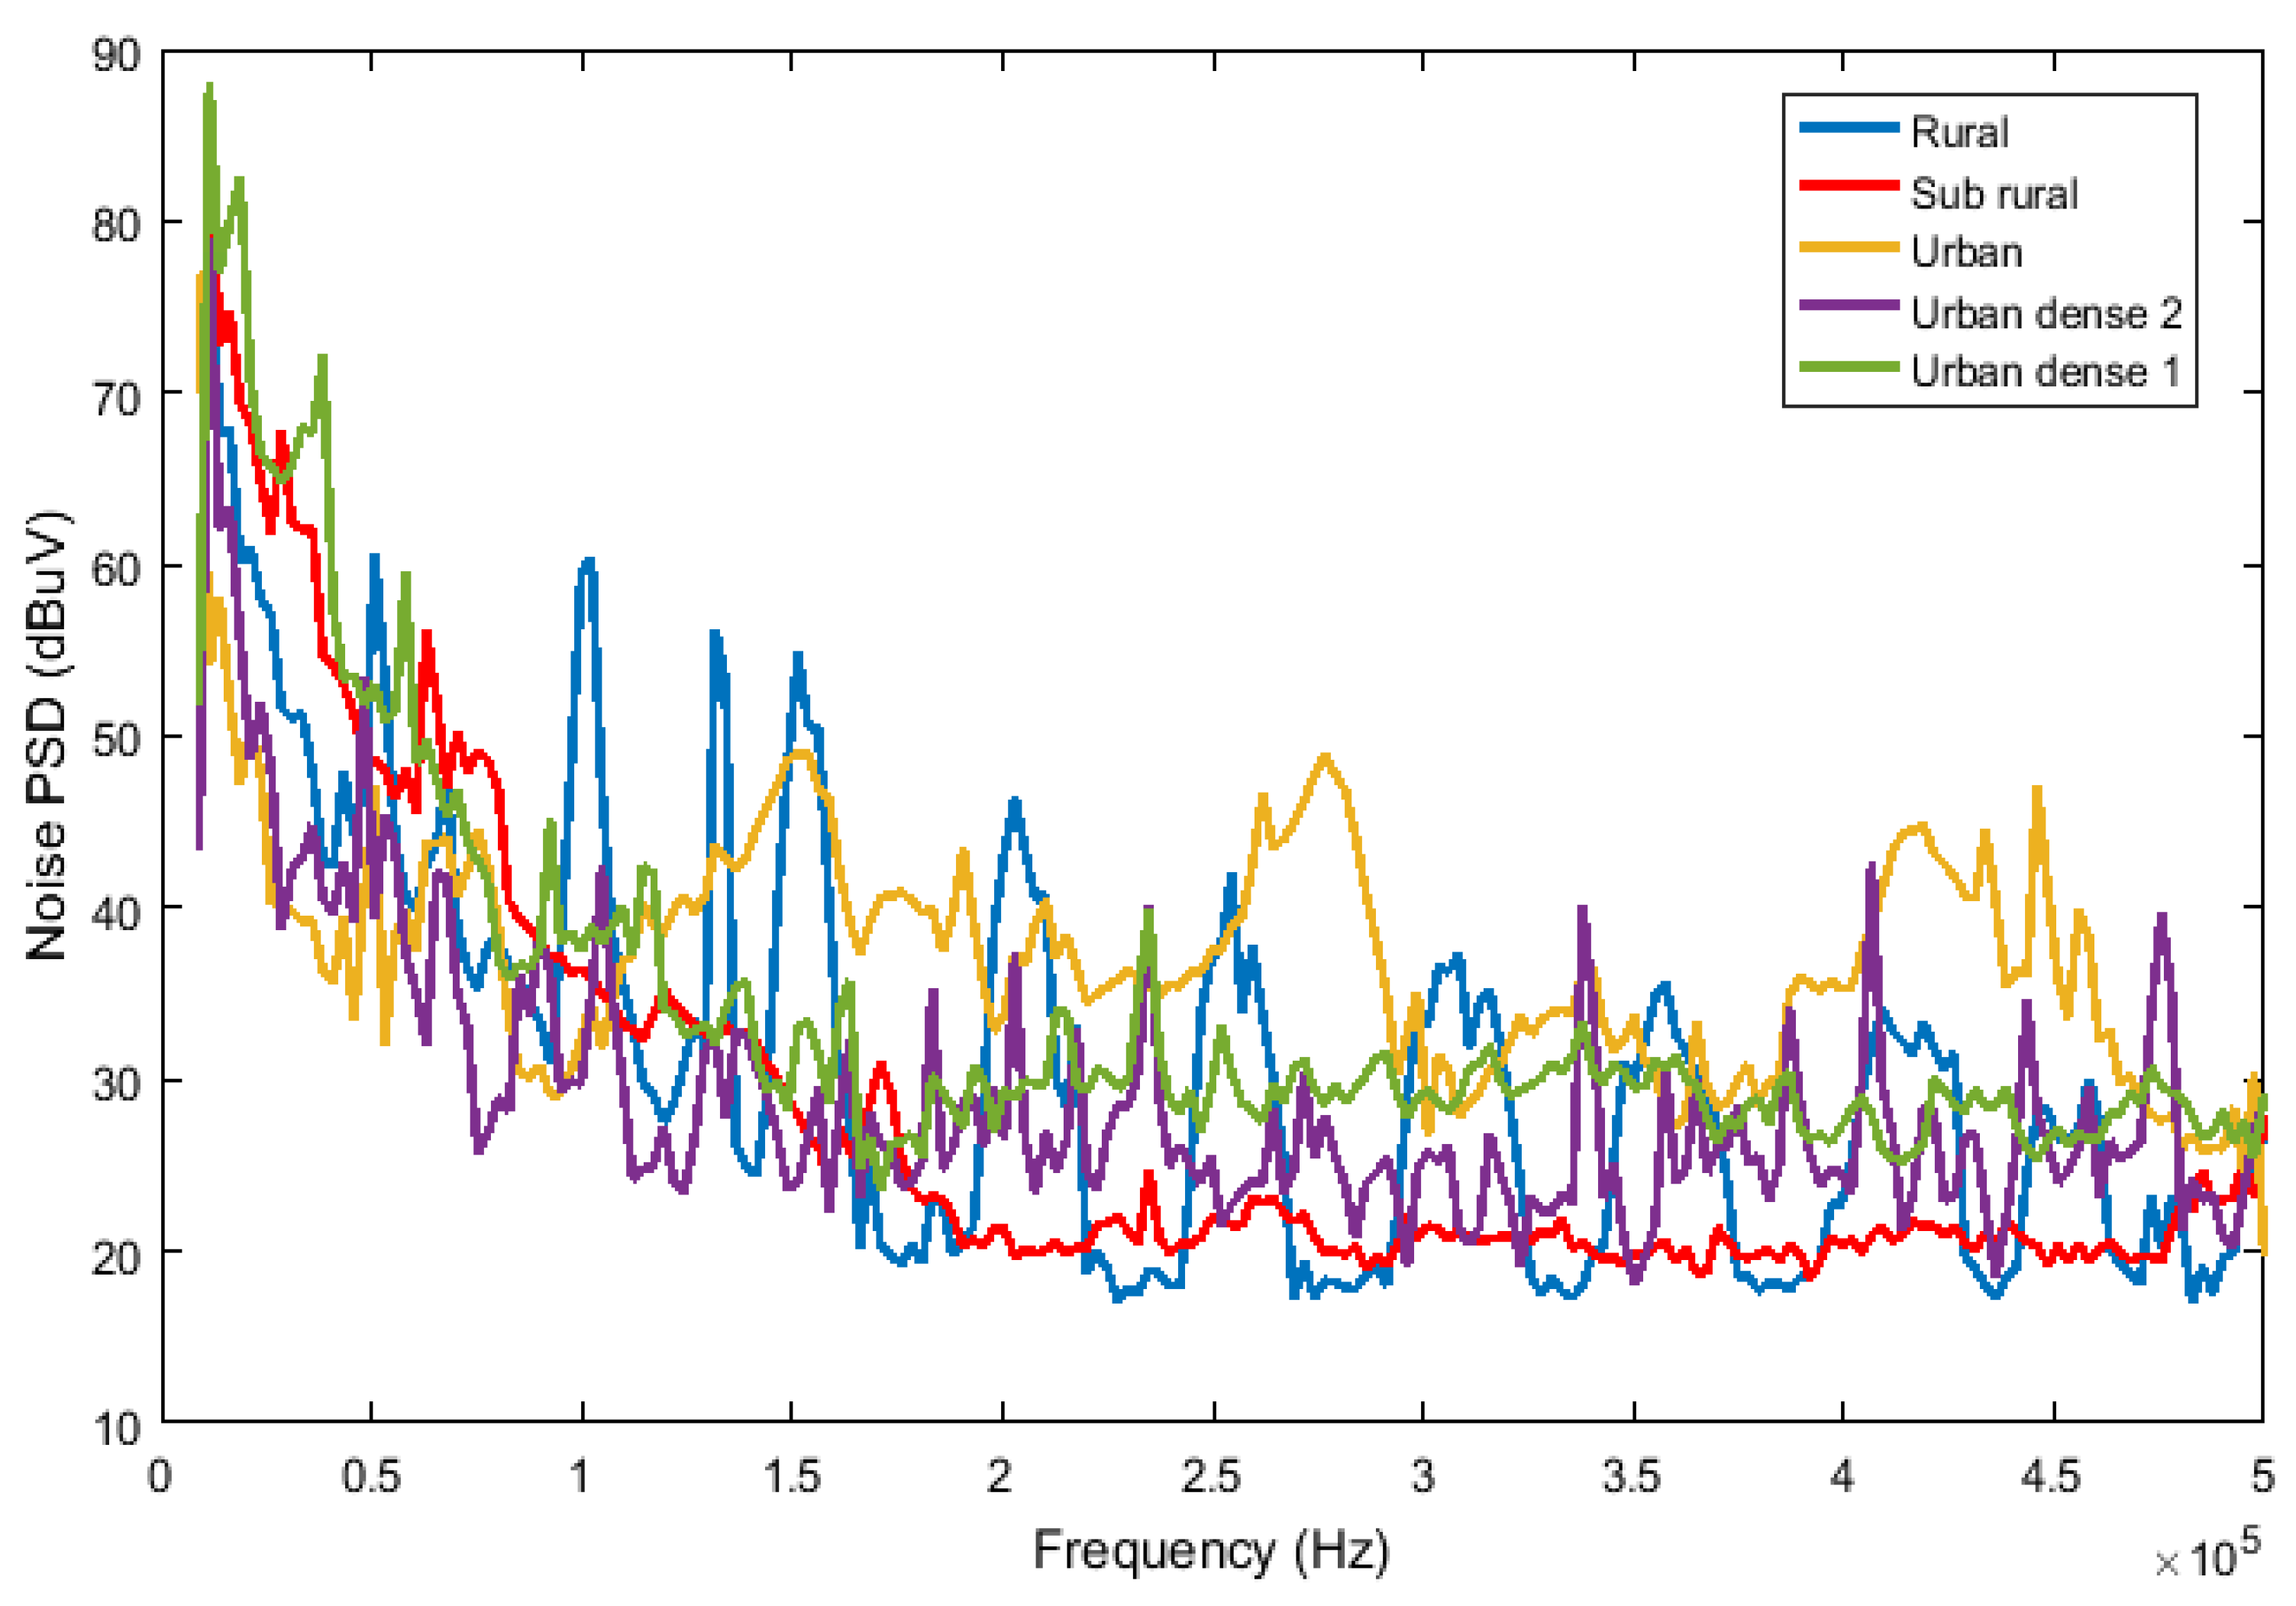
3.1. Noise Power Spectral Density Analysis at a Specific Time

During one week, many measurements were performed at 10 a.m. in the five sites described in the previous sections of the manuscript. For each site, the aim is to measure the noise power spectrum in two specific locations: in the transformer substation, and at the smart electricity meter (i.e., at the customer side). The noise PSD is carried out during a sweep time equal to 412 ms. This duration is very close to the OFDM frame time in the PRIME and G3-PLC protocols.
Figure 8 gives the evolution of the noise PSD in the transformer substation. Regarding the customer side, the experimental results are summed up in Figure 9.
Firstly, all sites have the same trend line in terms of background noise level. For instance, regarding the site named “Urban dense 1”, this level decreases from 80 dB μV at 50 kHz to 40 dB μV at 500 kHz. It corresponds to a reduction of more than 40 dB. It is important to note that the rural site exhibits the lowest values of noise.
Secondly, for each site, the narrowband noise can be characterized both on the transformer and the customer sides. Interferences due to the radio broadcasting with the PLC transmission are the source of this narrowband noise Therefore, many peaks can be measured; each one corresponds to a frequency of a station (e.g., Europe 1 with a frequency equal to 183 kHz, Radio Monte-Carlo (RMC) with a frequency of 216 kHz, or Radio Tele Luxembourg (RTL) with a frequency of 234 kHz).
Thirdly, frequency impulsive harmonics, such as at the frequency equal to 100 kHz, may originate from the switching of electrical devices that are connected to the same PLC network (e.g., TVs and phone chargers). These harmonics have a strong impact at the customer side. At the transformer side, their impact is much more moderate.
Finally, in comparison with the transformer side, the noise level at the customer side is low, because the number of loads connected to the customer’s electrical installation is not important at 10 a.m. In that case, the transformer plays a key role. It is important to note that this one is connected to all installations within a site. However, noise measured in the transformer substation is the sum of noise generated by all domestics loads connected to the same branch.

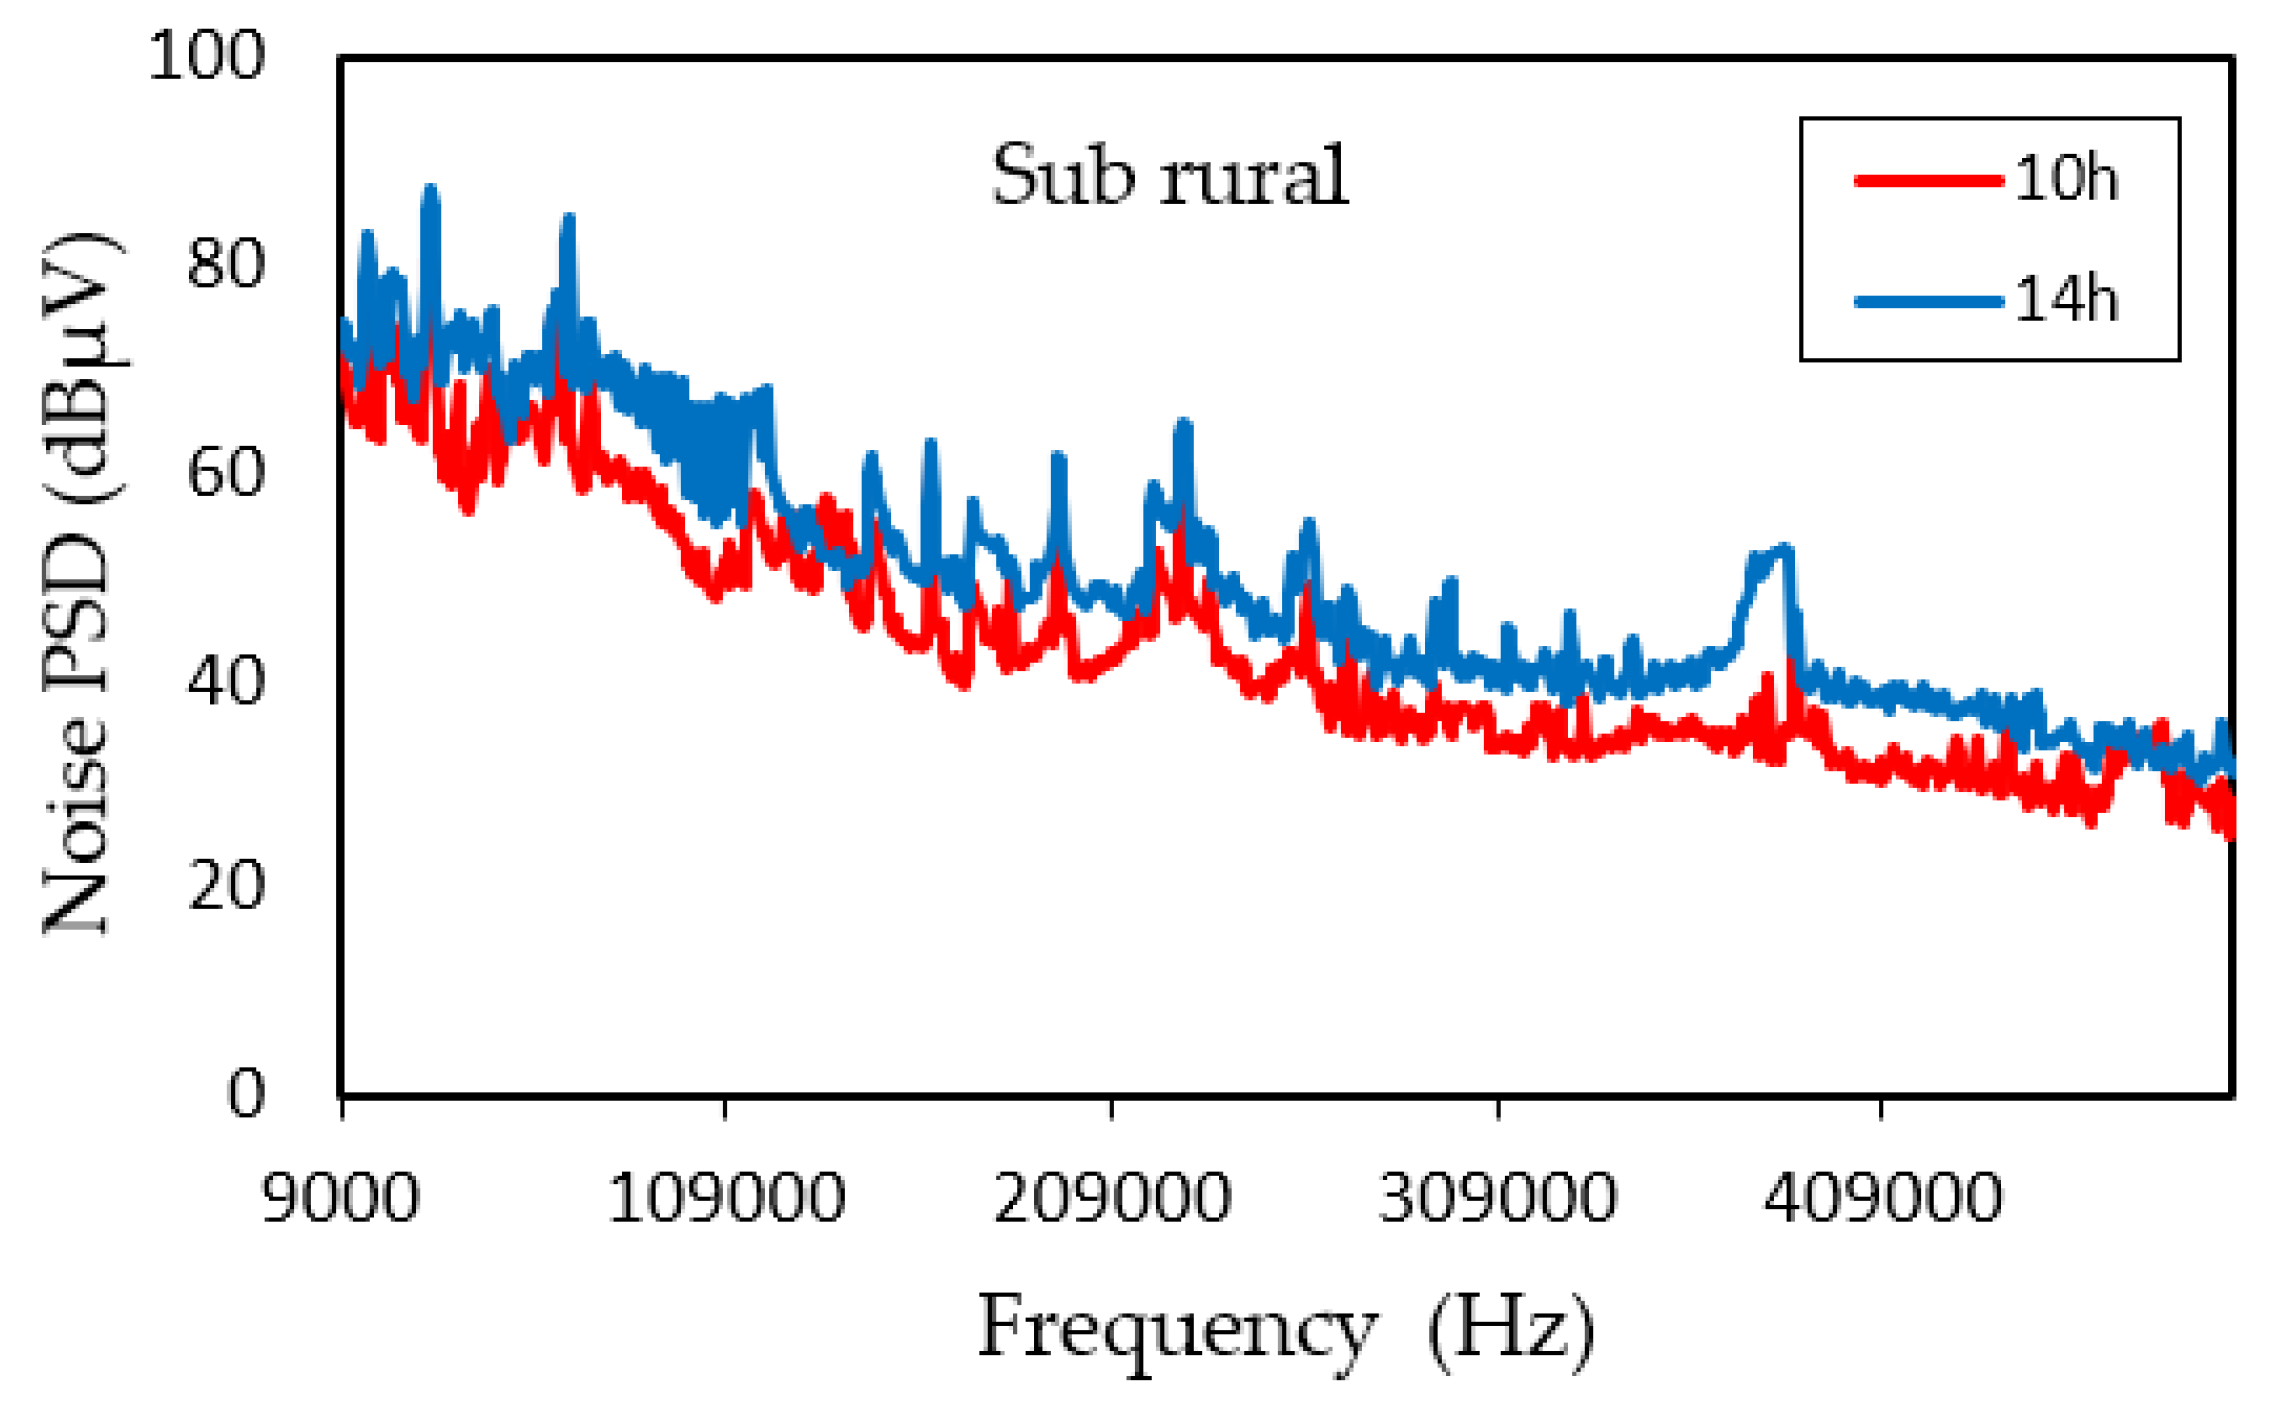
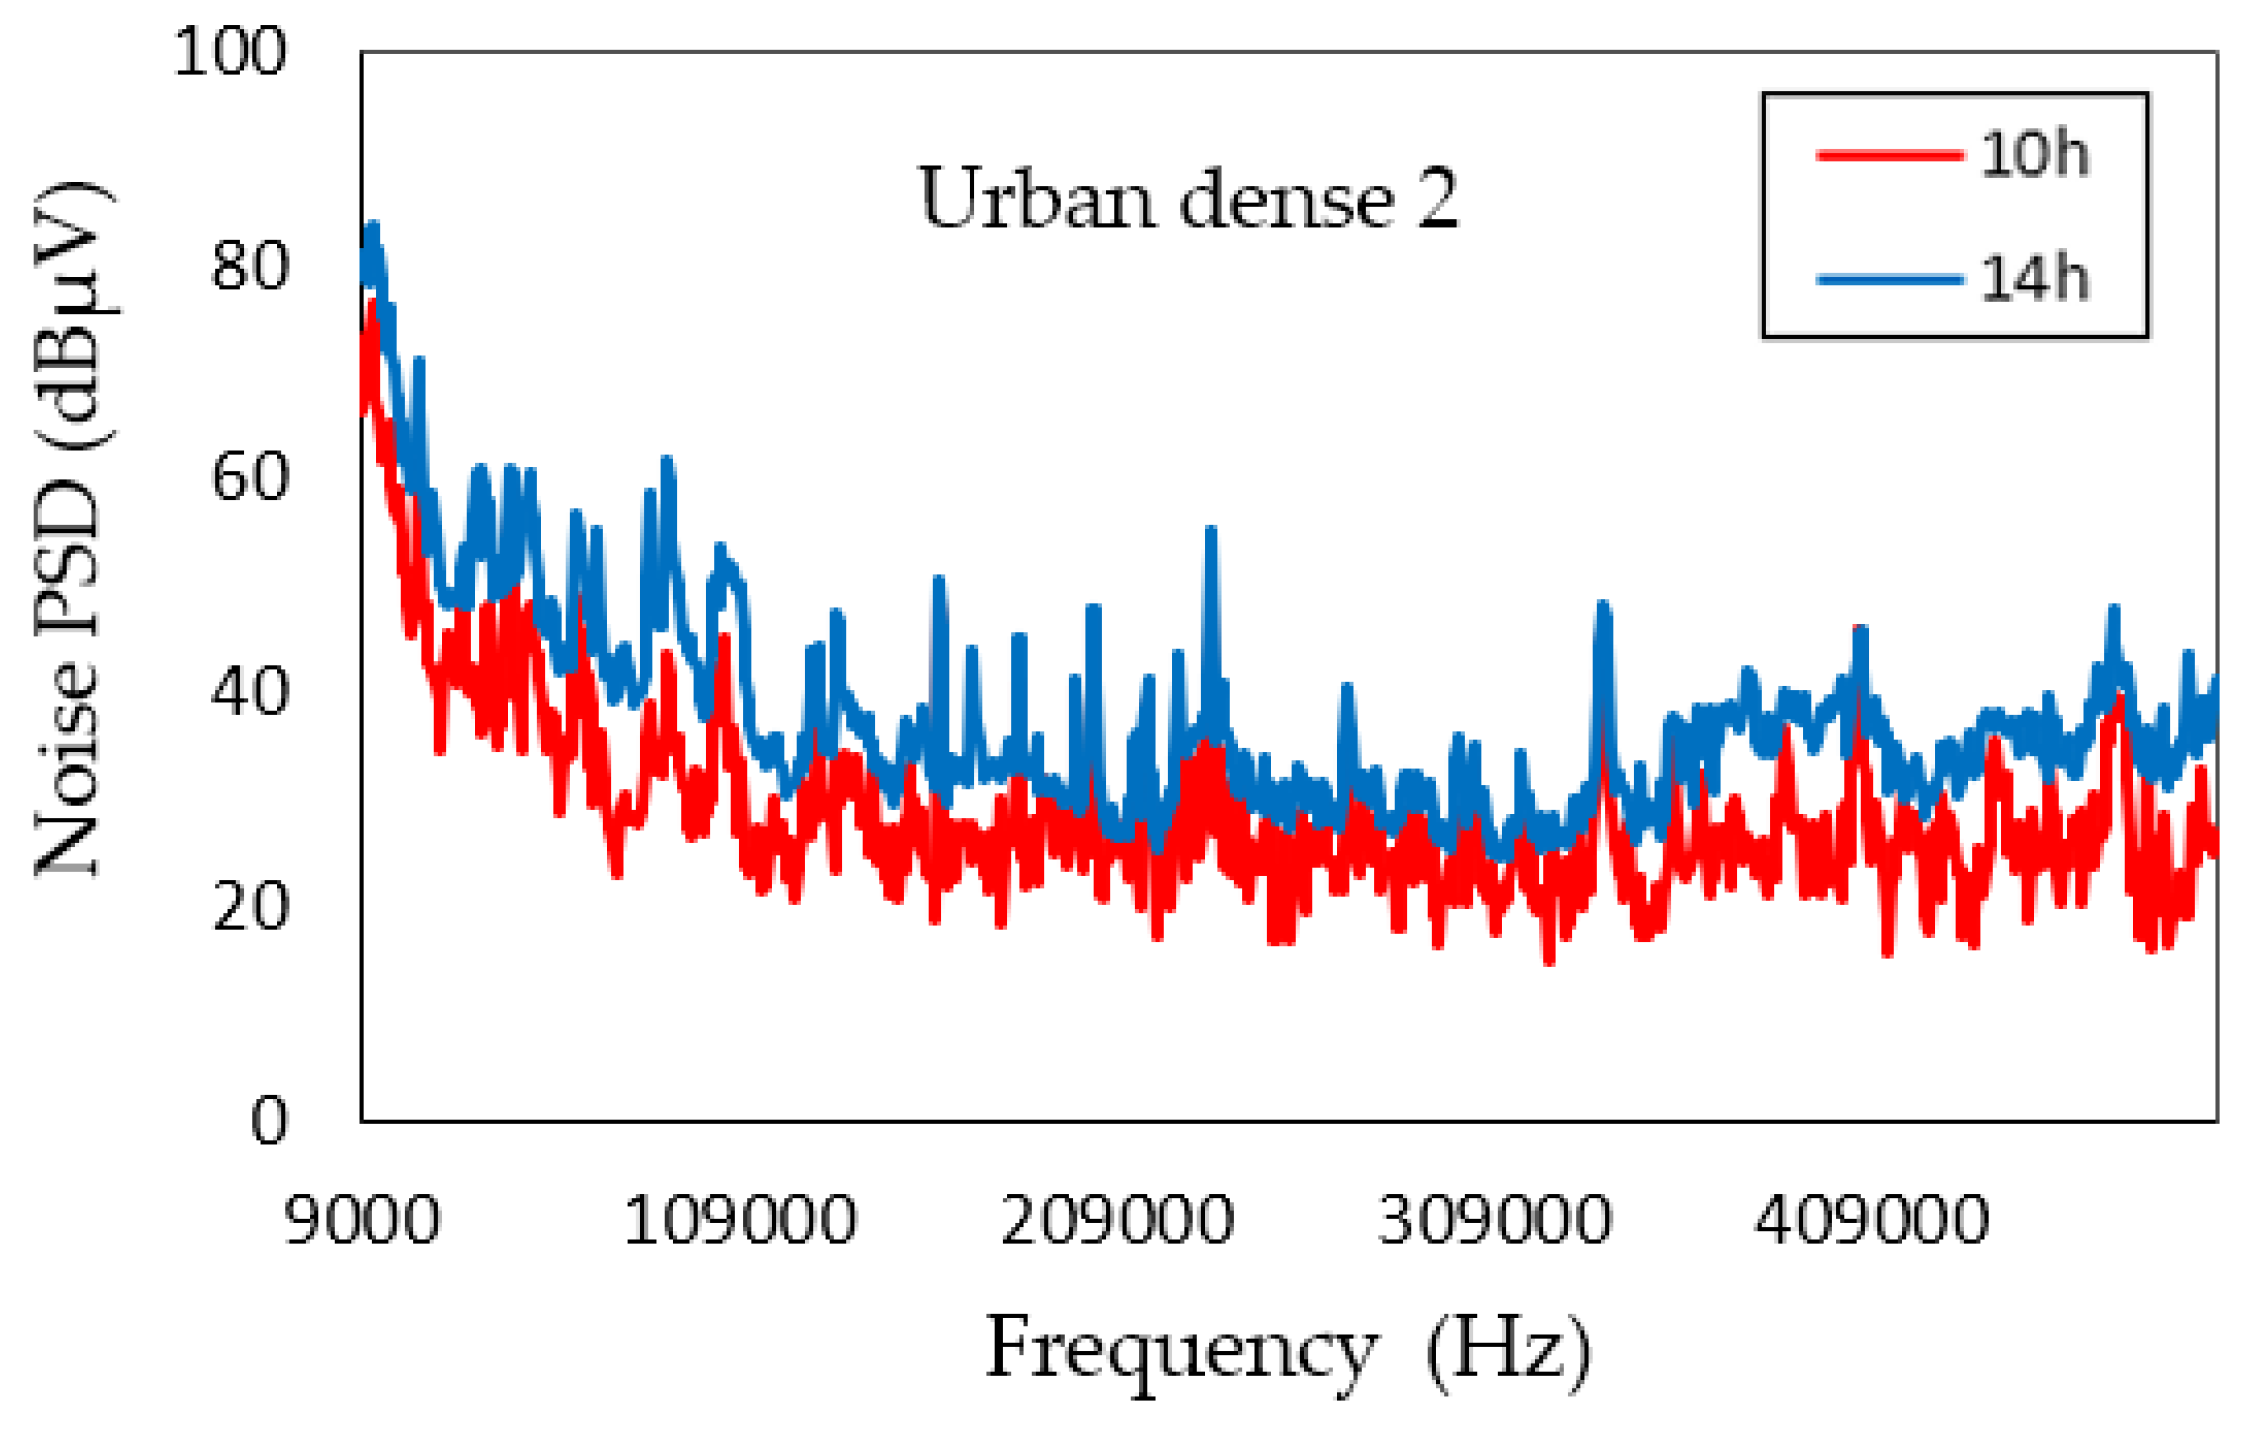
3.2. Noise Power Spectral Density Evolution at Different Times of the Day

Figure 10 and Figure 11 show the evolution of the noise PSD depending on the frequency in the transformer substation and the customer’s electrical installation respectively. The aim is to compare the experimental measurements performed at 10 a.m. and 2 p.m. To simplify the analysis, the measurements from the sub rural and urban dense 2 sites are discussed.
The background noise is mostly constant over the period of a few hours. Even if a few variations can be occasionally measured, the trend line of the background noise is low. It may be explained by the increasing usage of the electrical appliances at the customer side. The narrowband noise and the impulsive noise are still present at the same frequencies. They remain in the range from 40 to 60 dB μV, except at the lower part of the spectrum, where it can rise to 80 dB μV.

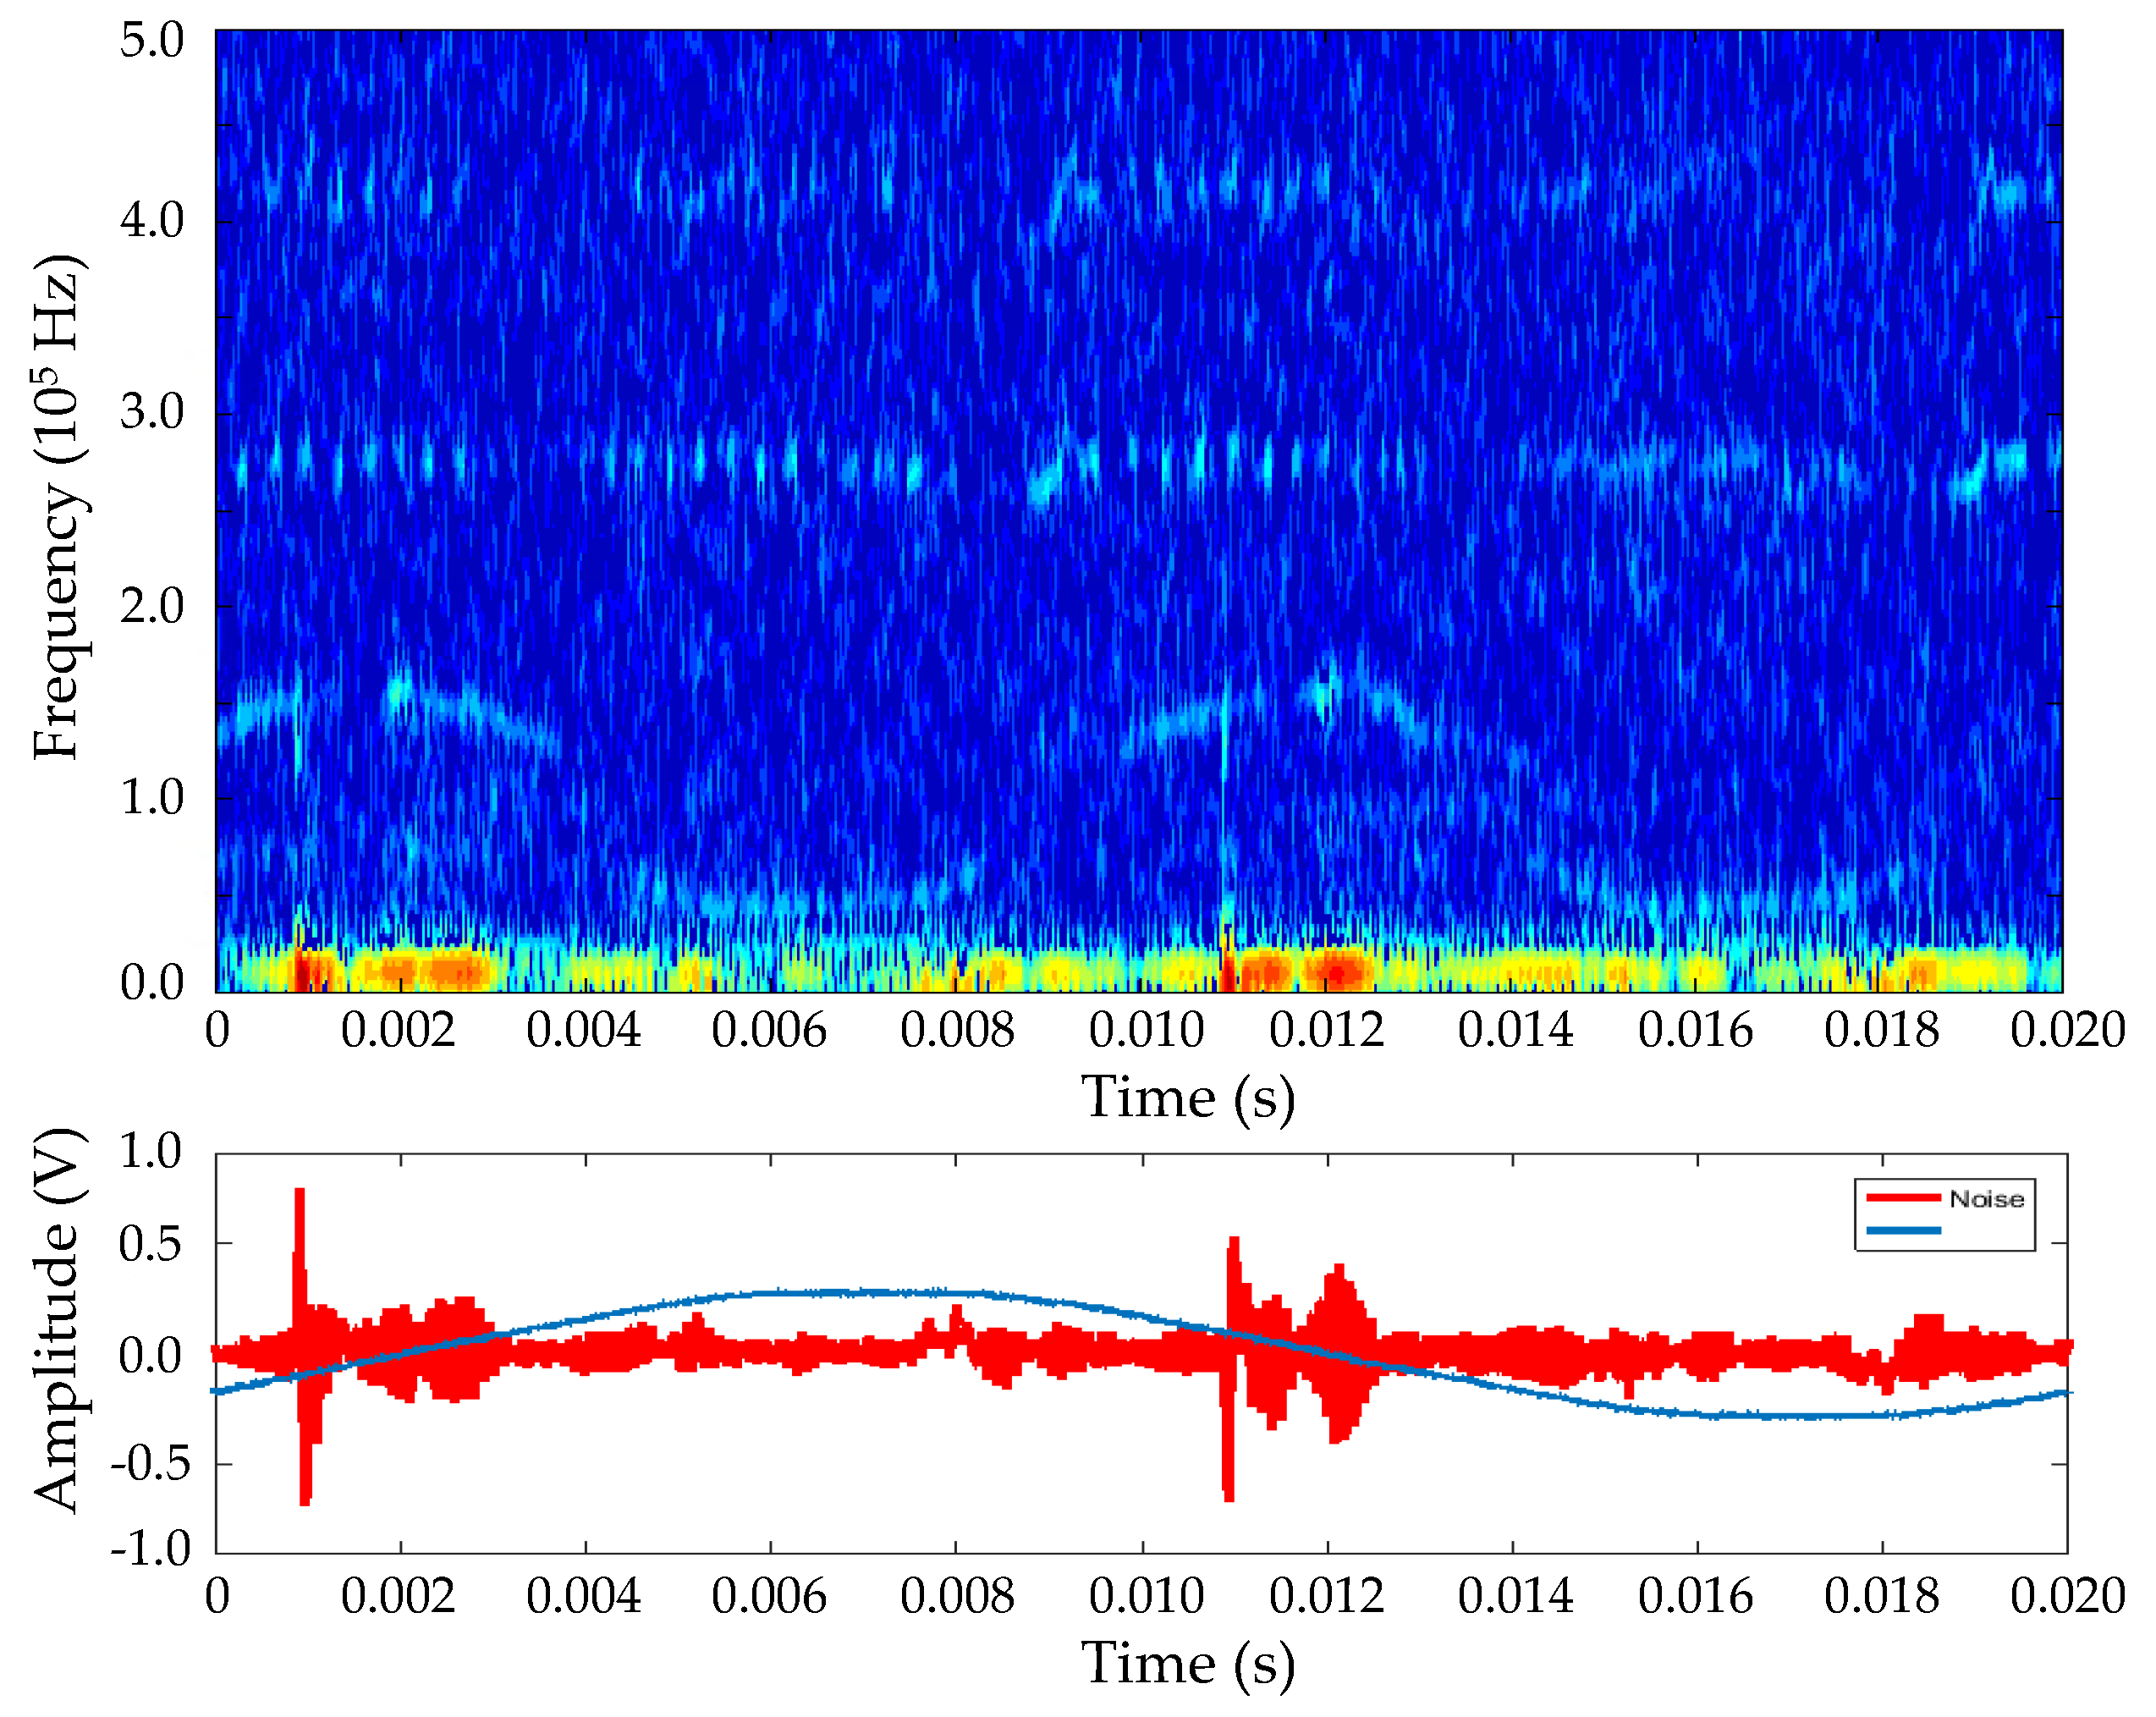
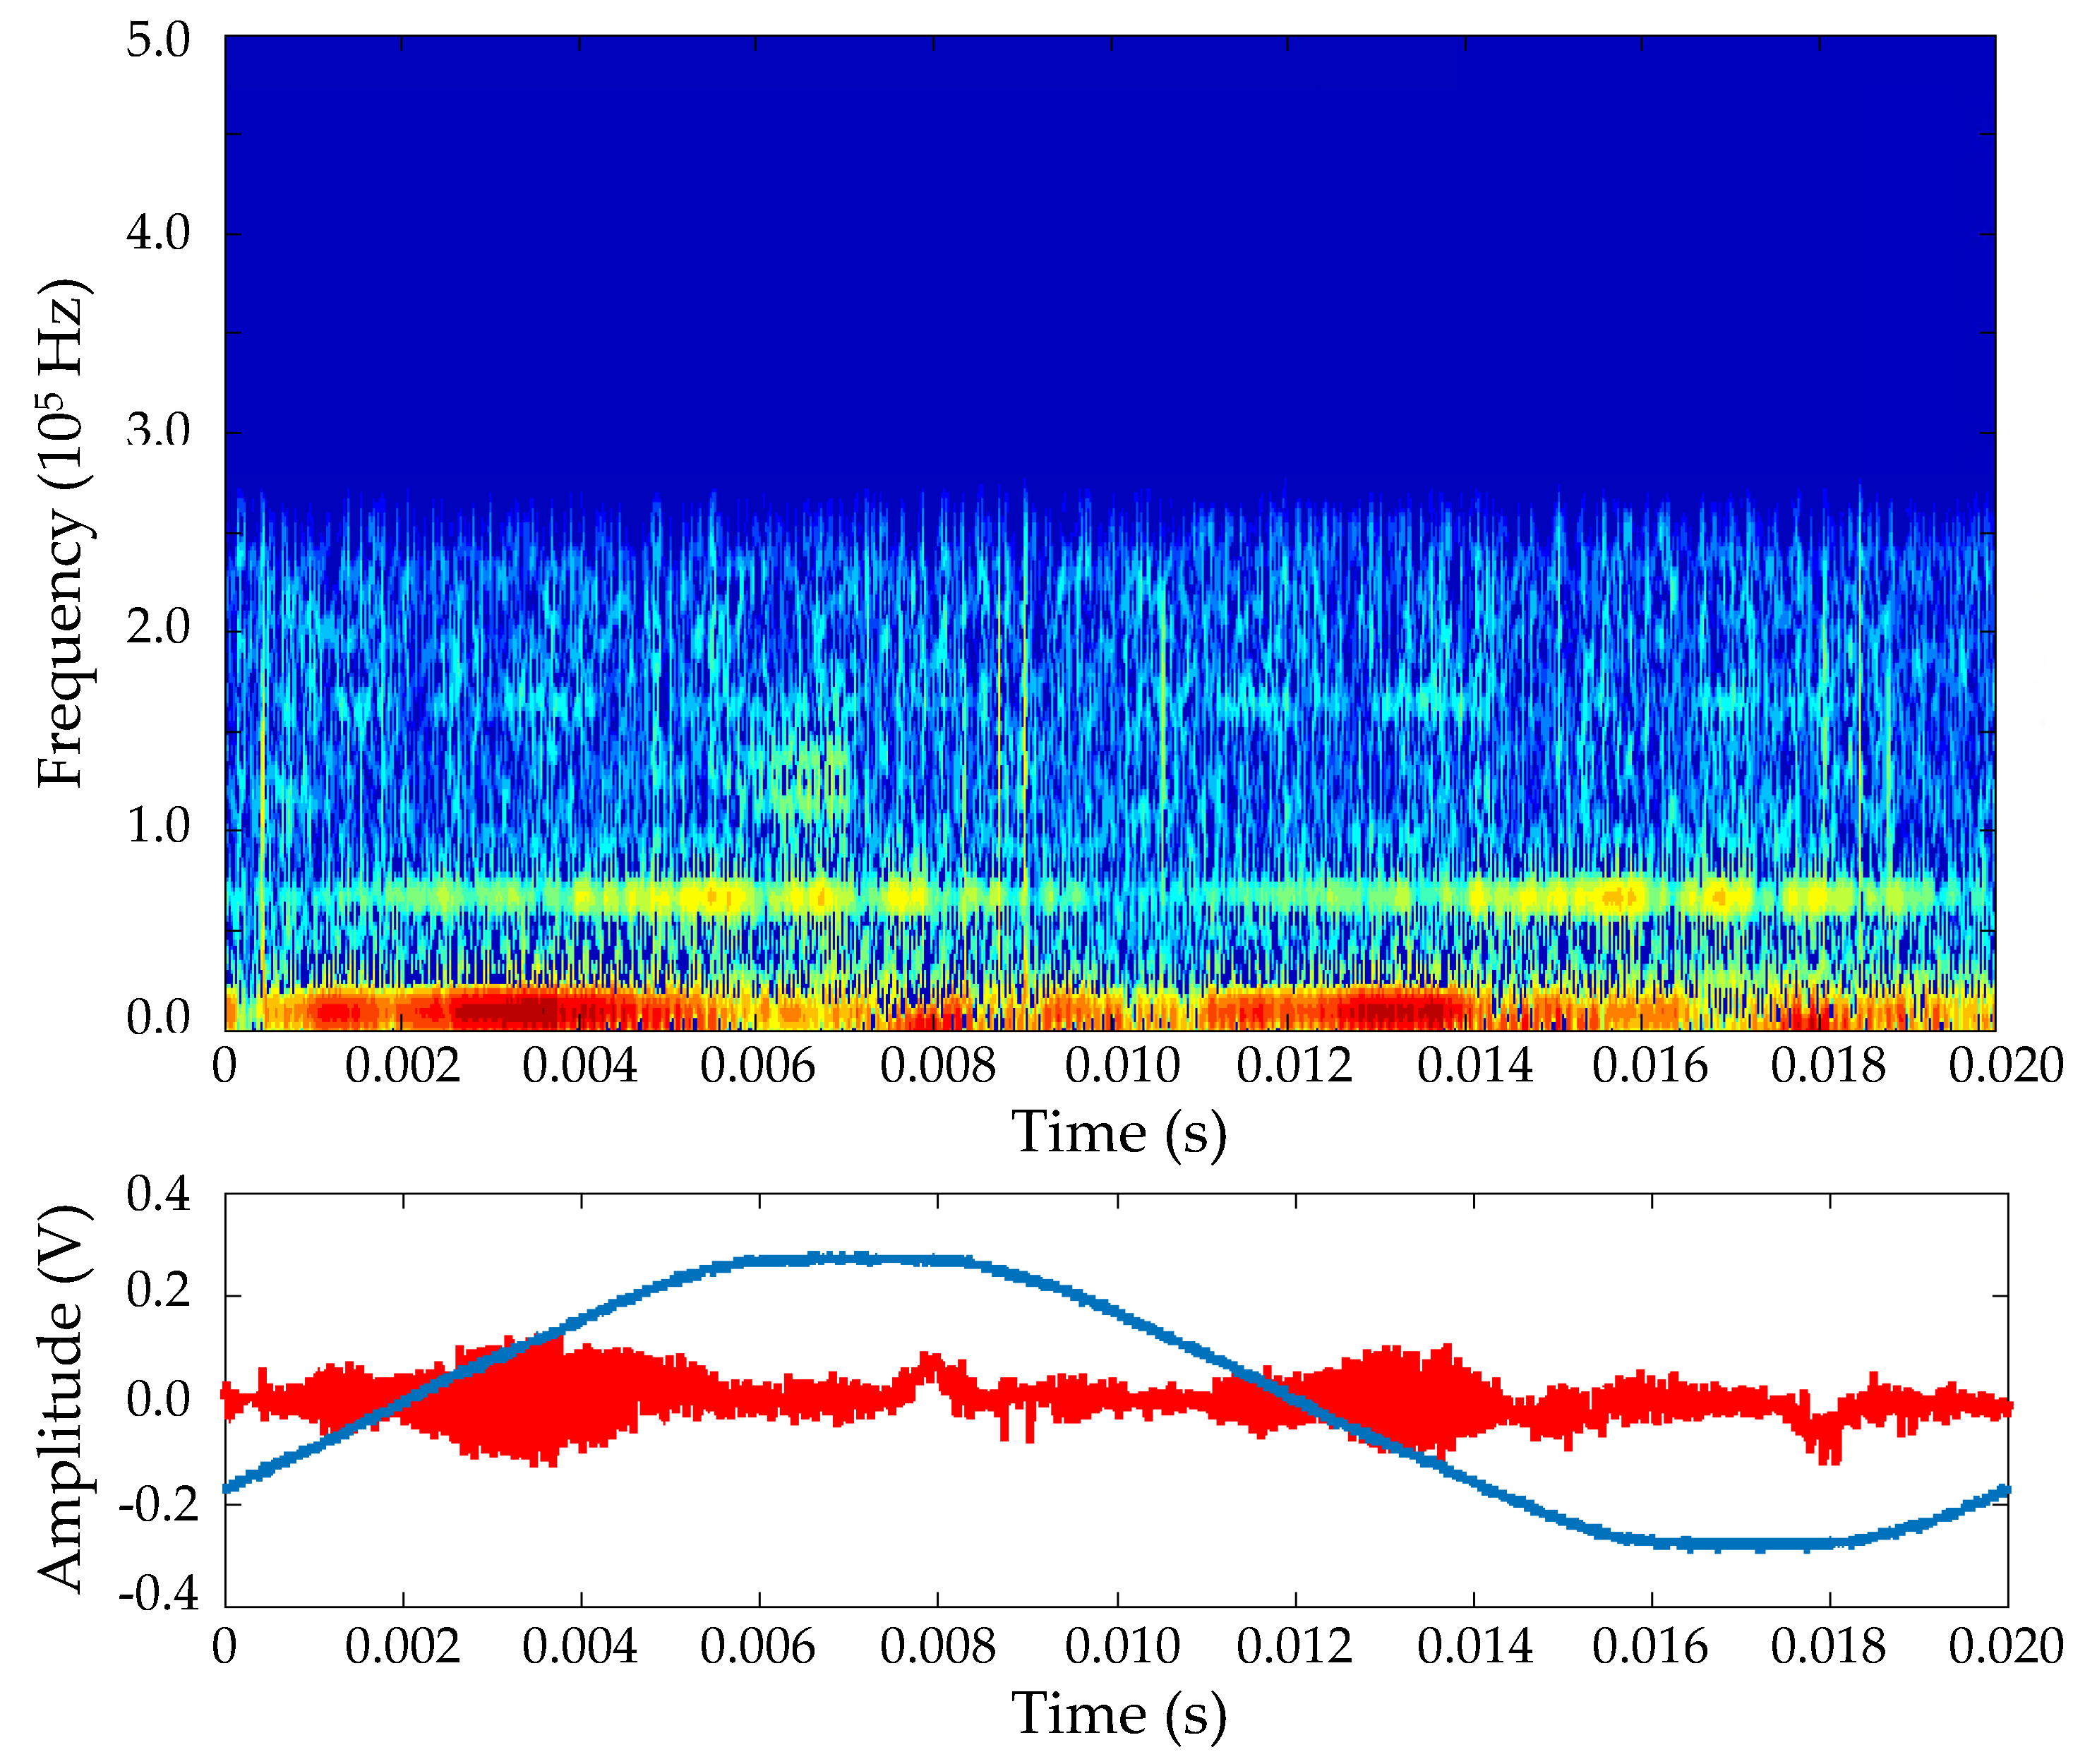
3.3. Noise Cyclostationary Behavior

The PLC channel may vary abruptly when the network topology changes, particularly when the devices are plugged in or out, and when they are on or off. The objective of this section is to study this short-time variation of the impulsive noise. The measurement results in each transformer substation of four different sites (i.e., sub rural, rural, urban, and urban dense 1 sites) are discussed.
The discussion is based on the evolution of the noise PSD in the time-frequency domain. So, the Wigner-Ville transform can be used (see Equation (2)). This kind of transformation enables to identify exactly the components of the signals both in the time and frequency domains. From the Wigner-Ville transform, it is also possible to define the distribution of energy in the time-frequency domain (see Equation (3)):
W x ( t , f ) = + x ( t + τ 2 ) x ( t τ 2 ) e i e π f τ d τ
+ w x ( t , f ) d t d f = E x
The use of an analysis and smoothing window is used to limit the interferences. Thus, it warrants a good accuracy of the results. To achieve this, an algorithm was developed with the MATLAB software tool. This algorithm uses the pseudo Wigner-Ville transform smoothed with an analysis window both to fix the frequency and temporal resolution. The magnitude of each signal in the time domain was captured during one period of the mains (i.e., 20 ms). The measurements were also synchronized with the mains. Figure 12, Figure 13, Figure 14 and Figure 15 sum up the main results.

3.3.1. Summary of the Results for the Sub Rural Site

Figure 12 gives the pseudo Wigner-Ville transform analysis for the sub rural site in the time-frequency domain. The results exhibit several forms of noise.
A periodic time-variant noise can be identified. This one is synchronized to half of the mains’ frequency (i.e., 10 ms). This, it represents the components of the cyclo-stationary noise.
The spectrograms also show that periodic noises are typically generated at frequencies lower than 50 kHz.
Finally, periodic interferences can be identified at frequencies higher than 50 kHz, but the PSD of these disturbances remains at a low level in comparison with the low-frequency disturbances.

3.3.2. Summary of the Results for the Rural Site

Figure 13 gives the pseudo Wigner-Ville transform analysis for the rural site in the time-frequency domain. In that case, the channel exhibits a periodic time-varying response. Moreover, it is composed of a cyclo-stationary noise component. This periodic impulsive noise appears in the form of bursts every 10 ms. It represents the periodic impulsive noise which is synchronized with the mains’ frequency.
The spectrograms of the measured signals show that periodic noises are typically generated at frequencies lower than 30 kHz. Periodic impulsive noise can also be observed at frequencies higher than 300 kHz. However, the PSD of these disturbances remains at a low level in comparison with the low-frequency disturbances.

3.3.3. Summary of the Results for the Urban Site

Figure 14 gives the pseudo Wigner-Ville transform analysis for the urban site in the time-frequency domain. From the time variation, several forms of noise can be observed.
A high impulsive noise is generated periodically every 10 ms. It appears for very short durations, and with a high PSD in the frequency range lower than 20 kHz. The amplitude of the pulses is about 1 V in the time domain.

3.3.4. Summary of the Results for the Urban Dense 1 Site

Figure 15 gives the pseudo Wigner-Ville transform analysis for the urban dense 1 site in the time-frequency domain. The periodic impulsive noise is generated in the form of bursts. The time-frequency representation shows an important PSD in the frequency range lower than 20 kHz.

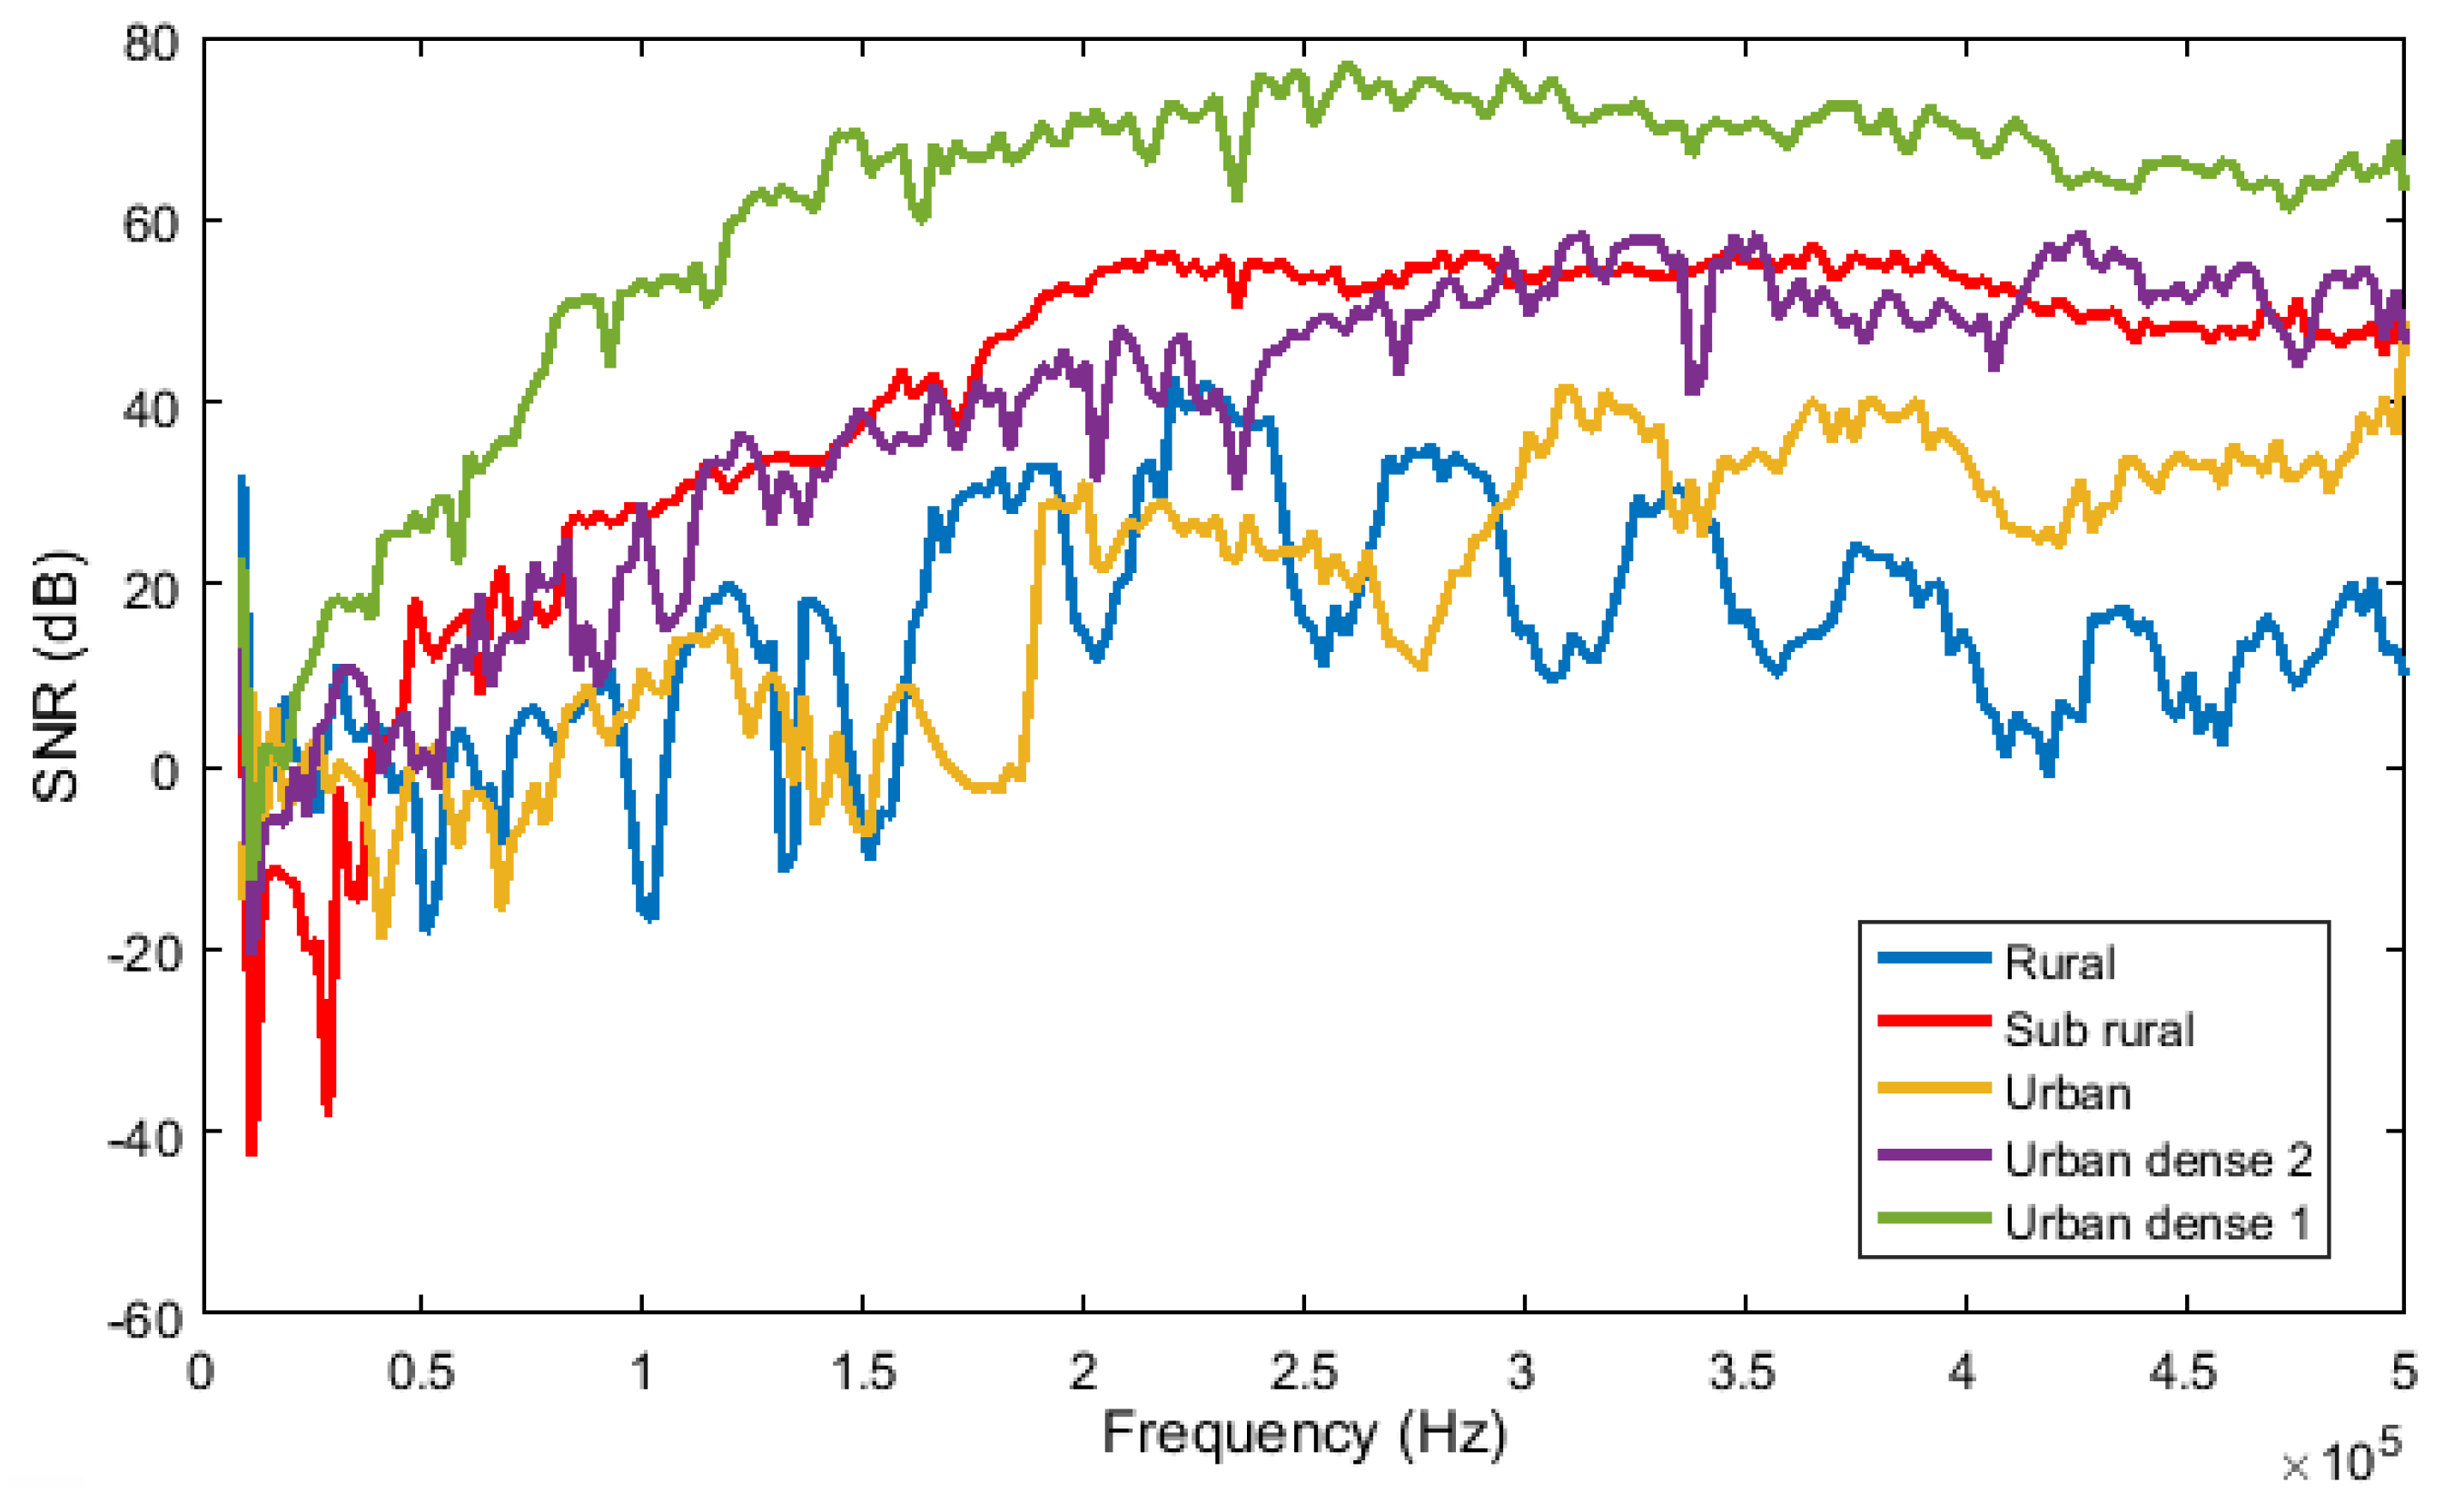
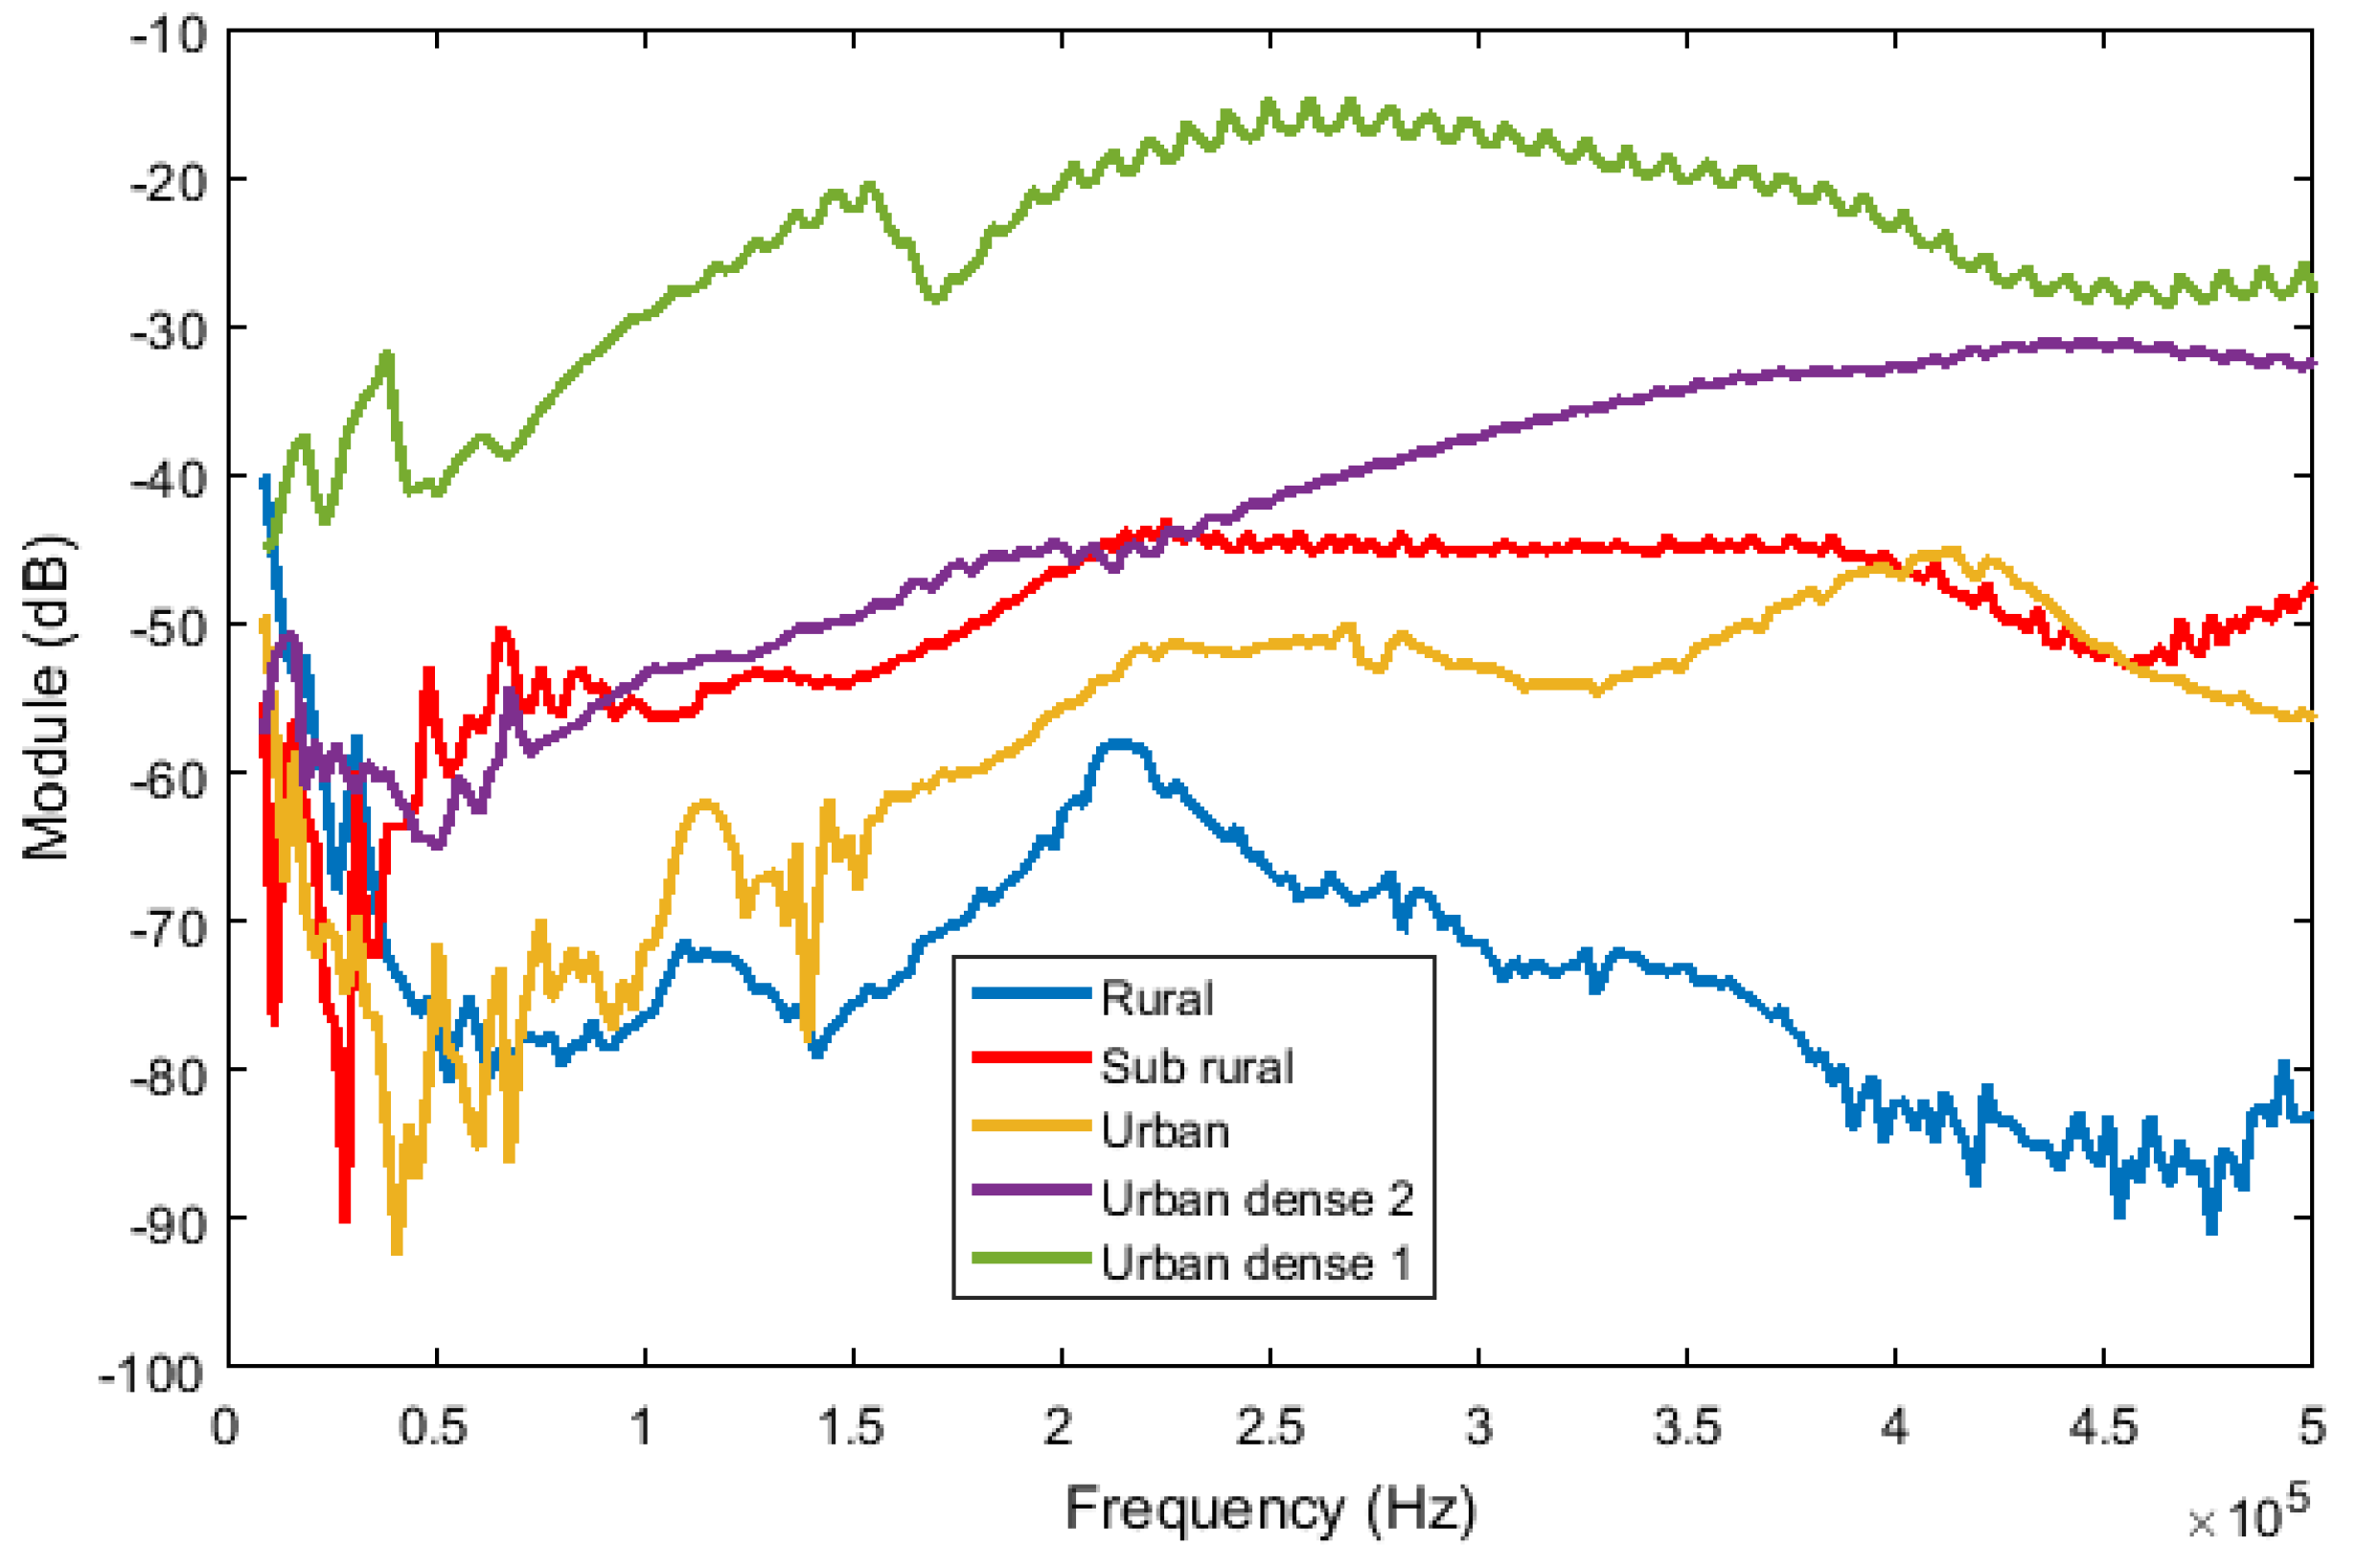
3.4. Transfer Function Analysis and Signal-to-Noise Ratio

Figure 16 gives the results of the transfer function analysis for each site. Regarding the urban and urban dense sites, the attenuation is less than the rural and the sub rural site one. The strong attenuation in the rural site is mainly caused by the line attenuation of the overhead cables.
The signal-to-noise ratio (SNR) is an indicator of the quality of the PLC transmission. From a literature review, the reliability of NB-PLC technologies such as the G1-PLC and G3-PLC can be summed up in Figure 17. It represents the bit error rate (BER) for each kind of modulation depending on the quality of the transmission in terms of SNR-values.
As can be seen in Figure 17, the G3 Alliance fixed the minimum accepted BER level (i.e., 10−4). So, it enables to evaluate the performances of the G3-PLC technology. Table 1 gives the SNR threshold that allows communication with a maximum BER equal to 10−4.
As can be seen in Equation (4), in this study, is the SNR-parameter corresponds to the ratio between the power of the received signal in the receiver side and the power of the noise measured at the same point of the electrical network [36,37]. In this study, the received signal and the noise are measured simultaneously at noon.
S N R d B = 10 log ( P e | H ( f ) 2 | P n )
  • Pe: emitted power of the signal. This parameter is set to 120 dBµV.
  • f: frequency.
  • |H(f)|: transfer function modulus.
  • Pn: noise power measured at 10 a.m.
As can be seen in Figure 18, the evolution of the SNR shows negative values in the low frequencies for all sites and especially, in the sub rural site. When the SNR tends to zero, the white noise and the PLC signal have an equivalent power. When the SNR is lower than zero, the noise has a higher power than the PLC signal. When the SNR is higher than zero, the noise has a lower value than the PLC signal.
The quality of the network in the urban dense 1 and urban dense 2 sites enables to use less complex transmission techniques. Moreover, it offers higher transmission rates. Many technologies, such as the PRIME and G3-PLC communication protocols, are based on the OFDM modulation. It can operate in two modes of transmission: a normal mode and a robust mode. The G3-PLC communication protocol uses either the differential binary phase shift keying (DBPSK), differential quadrature phase shift keying (DQPSK) or differential 8-Phase Shift Keying (D8PSK) modulation for each of its 36 subcarriers. It incorporates error correction by convolutional coding and Reed Solomon coding. The robust mode works identically except that it also applies a repetition of the bit to be transmitted which must be equal to four times. The aim is to increase the transmission reliability, but it strongly limits the useful rate.

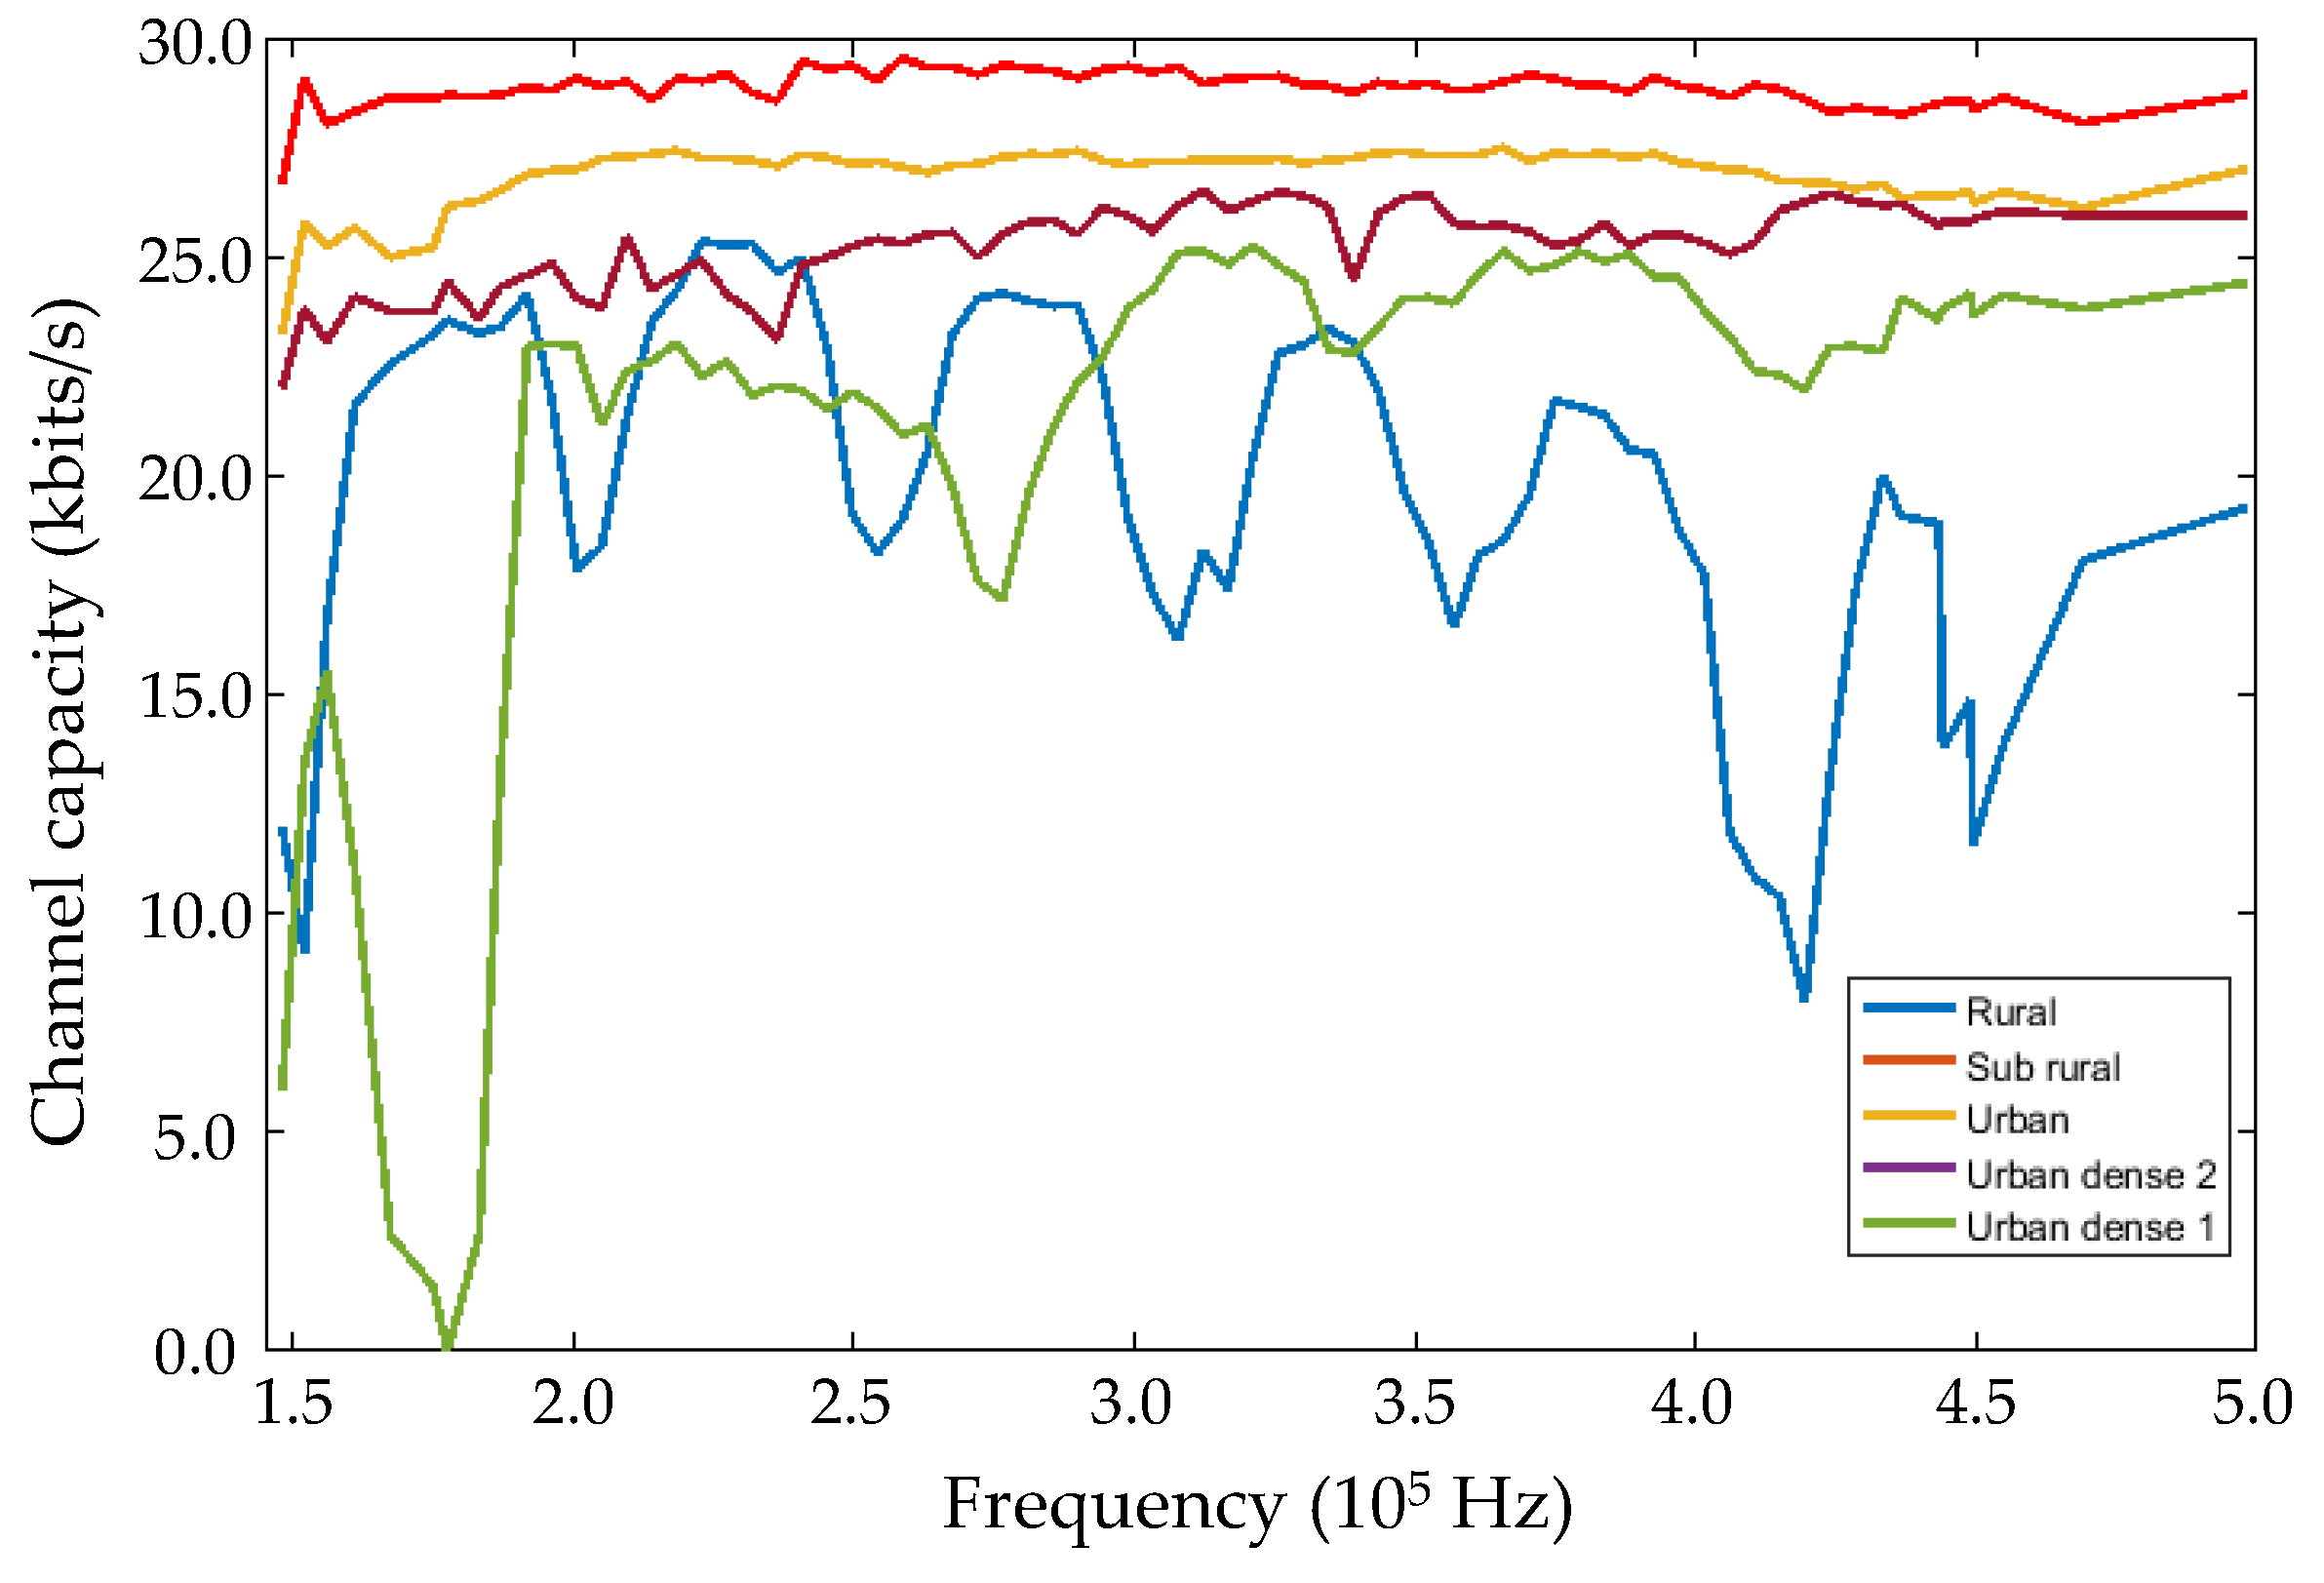
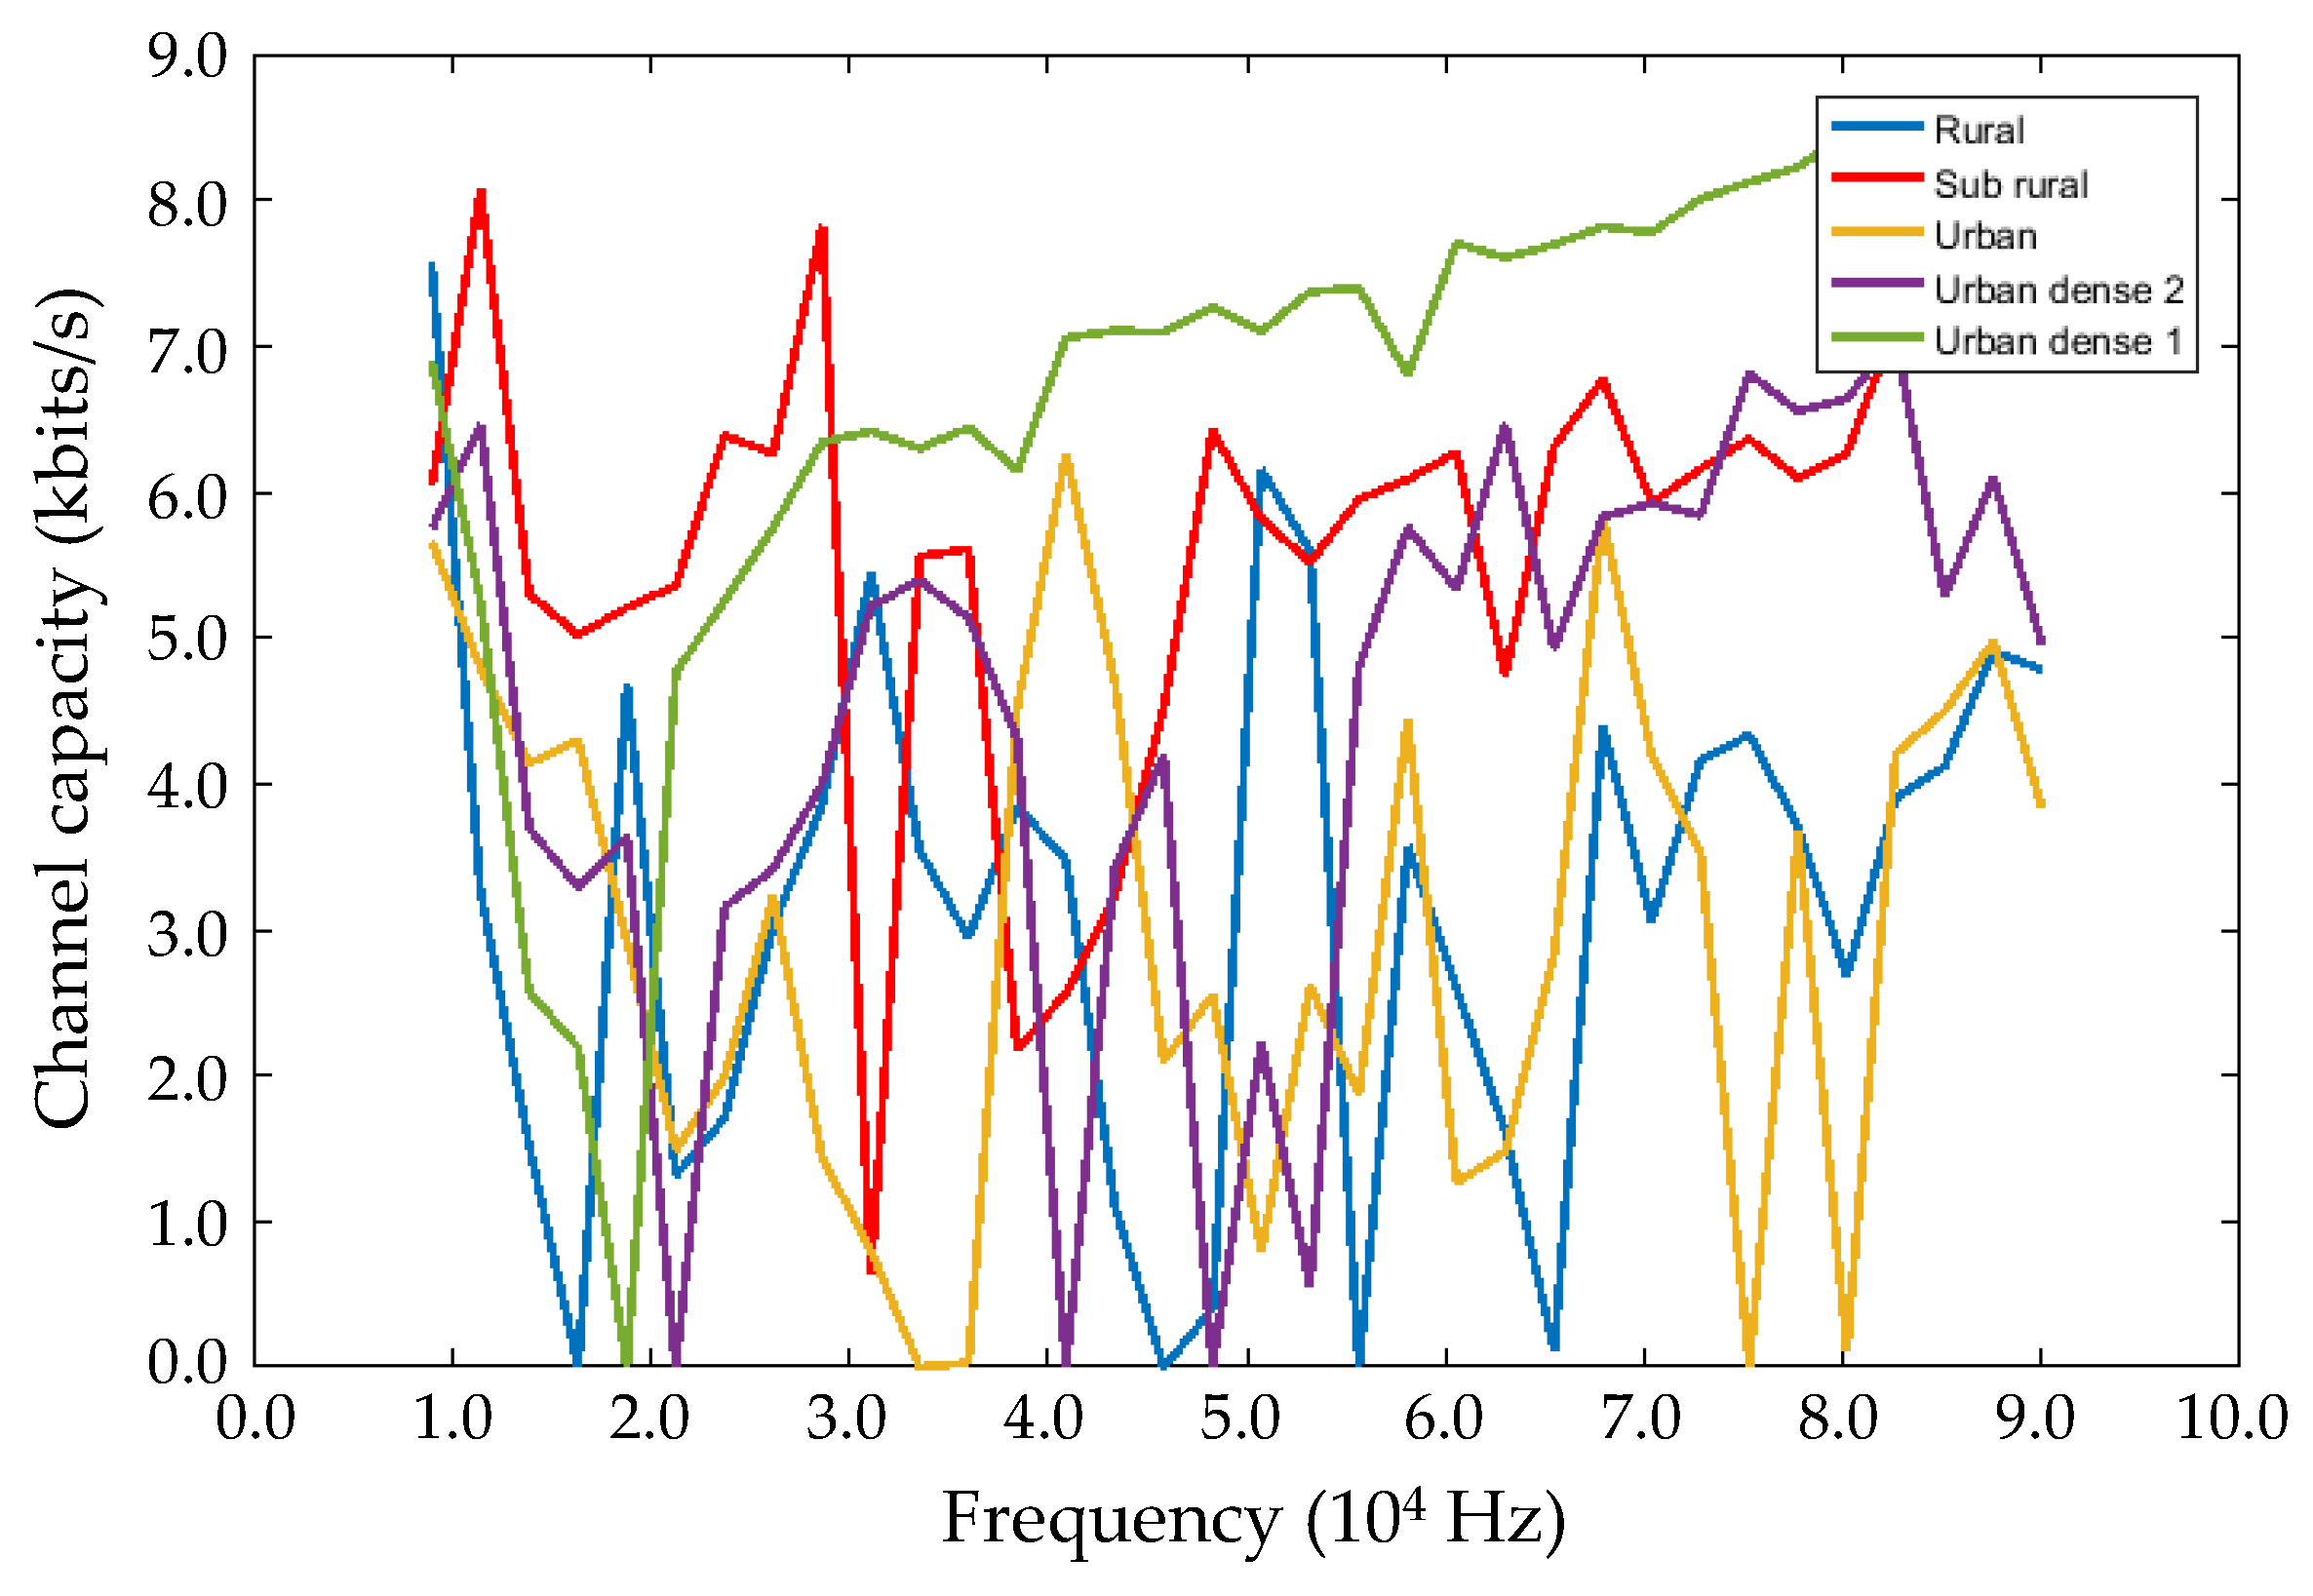
3.5. Estimation of the Channel Capacity

The capacity of a channel is the maximum theoretical bit rate that it can support. It is important to note that the bit rate on a noisy channel is limited. Its limit both depends on the bandwidth of the transmission channel and its SNR [38,39,40]. The spectral capacity per dimension of the sub channel is given by (5):
C = Δ f i = 1 N l o g 2 ( 1 + S N R i )
  • SNR: signal-to-noise ratio.
  • N: number of carriers.
  • Δ f : frequency band of one carrier.
The next sections of the manuscript describe the estimation of the channel capacity for two specific bands: the CENELEC A and the FCC bands.

3.5.1. Estimation of the Channel Capacity in the CENELEC A Band

Figure 19 shows the results of the estimation of the channel capacity in the CENELEC A band i.e., from 35.9 to 90 kHz. The noise power, denoted as Pn in Equation (4), can be extracted from the average noise measurements of each site. In that case, it is important to fix the power of the transmitted signal (see the Pe-parameter in Equation (4)) according to the G3-standard. Finally, the number of subcarriers is constant (N = 36) with the ∆f-parameter (see Equation (4)) equal to 1.5 kHz.

3.5.2. Estimation of the Channel Capacity in the FCC Band

Figure 20 shows the results of the estimation of the channel capacity in the FCC band i.e., from 150 to 487 kHz. The noise power can also be extracted from the measurements of each site. In that case, the signal power of the transmitter is equal to 66 µV. The number of subcarriers is fixed (N = 72) with the ∆f-parameter equal to 4.7 kHz.

3.5.3. Summary of the Results

The mean values per site are depicted in the CENELEC A and FCC band (see Table 2).
These theoretical capacity values per subcarrier both in the CENELEC A and FCC bands are very sufficient for the AMI application which requires 2.4 kbits/s in the G3-PLC communication.
Regarding the urban dense 1 site, the channel capacity depends on the location. The high capacity is particularly obtained in the FCC band.
The capacity in the FCC band is much more interesting, because it varies from 1.3 Mbits/s in the rural site to 2.2 Mbits/s in the sub rural site. In conclusion, the FCC band represents an attractive band for the integration of IoT in new smart grids’ applications.

4. Discussion

From all measurement results described in the previous sections of the manuscript, the PLC channel reveals different classes of noise. The background noise and the narrowband noise are measured in the transformer substation and at the customer side in the frequency domain. Such results can be found in the literature for other countries [23,33,34]. However, in these articles, the narrowband noise is not characterized at the same frequency due to frequency variation of the broadcast station in each country.
In this article, the temporal characteristics of the noise of the PLC channel are also presented at the transformer side. Table 3 sums up the noise characteristics in various sites (i.e., urban dense 1, sub rural, rural, and urban).
Comparing to the noise characterization, the temporal characteristics depend on the locations. For example, the same kind of information can be detected in the LV network in Italy, in Germany, in the USA and in China [32,33,34].
Borovina et al. have studied the channel transfer function in a rural distribution grid characterized by overhead lines between the transformer substation and the smart electricity meter [41]. The authors have particularly pointed out a strong attenuation between 65 dB and 25 dB. As can be seen in Figure 16, the results described in this manuscript present many similarities in terms of frequency selectivity and attenuation values. Chu et al. have characterized the transfer function in a typical urban underground network [32]. The results exhibit a variation of the transfer function between −30 dB and −50 dB which is close to the measurement results described in this manuscript, and especially in the frequency range from 200 to 500 kHz. The NB-PLC transmission in the residential and urban dense sites is more interesting in comparison with the rural sites. The PLC communication strongly depends on the cables’ length and types. From a complete literature review, the LV networks have similar topologies (e.g., type and length of cables, customers per phase) in the world, which may explain the similar results.
The performance objectives of the physical layer (i.e., PHY layer) may not seem trivial for specific equipment, such as the smart electricity meter, and the data concentrator because of the noise characteristics and especially, its temporal and frequency variations. At the medium access control layer (i.e., MAC layer), different technologies are developed to offer stability through different methods to code the transmitted signal and the non-synchronization of the system with the mains’ frequency.
In this article, the signal-to-noise ratio, and the channel capacity estimated between two points of the network are of utmost importance in the FCC band despite the harsh grid conditions in terms of noise and distance. Thus, the behavior of the communication layers affects directly the application level results which explains the success of the French smart metering interface named Linky based on the G3-PLC technology. This theoretical NB-PLC channel capacity enables to add some smart grids’ applications which also require a low data rate using the existing AMI infrastructure.

5. Conclusions

This manuscript highlights the results of a complete experimental measurement campaign aimed at investigating the LV NB-PLC channel in the frequency range from 9 to 500 kHz in various sites (i.e., rural, urban etc.) located in France. In particular, the aim is to fully characterize the noise characteristics of the PLC channel in time-frequency representation.
The time-frequency analysis shows the dominance of the cyclo-stationary noise. The short-time variation analysis shows impulsive noise due to a high number of loads connected to the network. Even if these loads may be switched on and off, the background noise is mostly constant over the period of a few hours. At the customer side, the noise variation is more important in comparison with the noise profile measured in the transformer substation.
The performances of the NB-PLC transmission can be calculated from the measurement results of the transfer function, and the noise PSD. The analysis of the SNR-values shows a good transmission capacity in the PLC channel. The channel capacity corresponds to the maximum theoretical bit rate, which this channel can support in the five topologies chosen in this study, based on the measured noise profiles. The results point out that the channel capacity is better in the FCC band.

Author Contributions

I.E. and T.D. performed the measurement on the low-voltage network. I.E., S.J. and I.A. analyzed the data. I.E. and S.J. wrote the paper. J.-C.L.B. and Y.R. supervised the research work.

Funding

This research was funded by the digital applications laboratory of the HF COMPANY group and the “ANRT” grant number [2015/1262].

Acknowledgments

This study was carried out in partnership with the French distributor of energy “ENEDIS” represented by Anouar Achouri (PLC expert, ENEDIS, France) and Cédric Chauvenet (PLC team manager, ENEDIS, France). The authors would like to thank the team from ENEDIS both for their assistance during the measurements and their support at the experimental sites located in the city of Ottmarsheim, and in the city of Tours in France. Many thanks to Cédric Lavenu (PLC expert, EDF R&D, France).

Conflicts of Interest

The authors declare no conflict of interest.

References

  1. Saleem, Y.; Member, S.; Crespi, N.; Member, S.; Husain Rehmani, M.; Copeland, R. Internet of Things-Aided Smart Grid: Technologies, Architectures, Applications, Prototypes, and Future Research Directions. arXiv, 2017; arXiv:1704.08977. [Google Scholar]
  2. Karnouskos, S. The cooperative Internet of Things enabled Smart Grid. In Proceedings of the 14th IEEE International Symposium on Consumer Electronics (ISCE2010), Braunschweig, Germany, 7–10 June 2010. [Google Scholar]
  3. O’Neill, S. Generalized Hyperalgesia in Chronic Low-Back Pain; River Publishers: Gistrup, Denmark, 2013; ISBN 8792329675. [Google Scholar]
  4. Pereira, S.C.; Caporali, A.S.; Casella, I.R.S. Power line communication technology in industrial networks. In Proceedings of the 2015 IEEE International Symposium on Power Line Communications and Its Applications (ISPLC), Austin, TX, USA, 29 March–1 April 2015; pp. 216–221. [Google Scholar]
  5. IEEE 802.11p Performance for Vehicle-To-Anything Connectivity in Urban Interference Channels. Available online: https://www.researchgate.net/publication/324729630_IEEE_80211p_Performance_for_Vehicle-to-Anything_Connectivity_in_Urban_Interference_Channels (accessed on 5 October 2018).
  6. Oliveira, R.M.; Vieira, A.B.; Latchman, H.A.; Ribeiro, M.V. Medium Access Control Protocols for Power Line Communication: A Survey. IEEE Commun. Surv. Tutor. 2018. [Google Scholar] [CrossRef]
  7. Salvadori, F.; Gehrke, C.S.; de Oliveira, A.C.; de Campos, M.; Sausen, P.S. Smart Grid Infrastructure Using a Hybrid Network Architecture. IEEE Trans. Smart Grid 2013, 4, 1630–1639. [Google Scholar] [CrossRef]
  8. Oliveira, T.R.; Picorone, A.A.M.; Zeller, C.B.; Netto, S.L.; Ribeiro, M.V. On the statistical characterization of hybrid PLC-wireless channels. Electr. Power Syst. Res. 2018, 163, 329–337. [Google Scholar] [CrossRef]
  9. Zhang, J.; Hasandka, A.; Wei, J.; Alam, S.; Elgindy, T.; Florita, A.; Hodge, B.-M.; Zhang, J.; Hasandka, A.; Wei, J.; et al. Hybrid Communication Architectures for Distributed Smart Grid Applications. Energies 2018, 11, 871. [Google Scholar] [CrossRef]
  10. Usman, A.; Shami, S.H. Evolution of Communication Technologies for Smart Grid applications. Renew. Sustain. Energy Rev. 2013, 19, 191–199. [Google Scholar] [CrossRef]
  11. Razazian, K.; Umari, M.; Kamalizad, A.; Loginov, V.; Navid, M. G3-PLC specification for powerline communication: Overview, system simulation and field trial results. In Proceedings of the ISPLC2010, Rio de Janeiro, Brazil, 28–31 March 2010; pp. 313–318. [Google Scholar]
  12. Signalling on Low-Voltage Electrical Installations in the Frequency Range 3 kHz to 148.5 kHz. General Requirements, Frequency Bands and Electromagnetic Disturbances—BSI British Standards. Available online: https://shop.bsigroup.com/ProductDetail/?pid=000000000030202784 (accessed on 5 October 2018).
  13. Lin, J.; Nassar, M.; Evans, B.L. Impulsive Noise Mitigation in Powerline Communications Using Sparse Bayesian Learning. arXiv, 2013; arXiv:1303.1217. [Google Scholar] [CrossRef]
  14. Nassar, M.; Lin, J.; Mortazavi, Y.; Dabak, A.; Kim, H.I.; Evans, B.L. Local Utility Powerline Communications in the 3–500 kHz Band: Channel Impairments, Noise, and Standards. IEEE Signal Proc. Mag. 2012, 29, 116–127. [Google Scholar] [CrossRef]
  15. Sendin, A.; Simon, J.; Urrutia, I.; Berganza, I. PLC deployment and architecture for Smart Grid applications in Iberdrola. In Proceedings of the 18th IEEE International Symposium on Power Line Communications and Its Applications, Glasgow, UK, 30 March–2 April 2014; pp. 173–178. [Google Scholar]
  16. G3-PLC Alliance Home. Available online: http://www.g3-plc.com/home/ (accessed on 05 October 2018).
  17. Oksman, V.; Zhang, J.G. HNEM: The new ITU-T standard on narrowband PLC technology. IEEE Commun. Mag. 2011, 49, 36–44. [Google Scholar] [CrossRef]
  18. Cataliotti, A.; Daidone, A.; Tine, G. Power Line Communication in Medium Voltage Systems: Characterization of MV Cables. IEEE Trans. Power Deliv. 2008, 23, 1896–1902. [Google Scholar] [CrossRef]
  19. Papadopoulos, T.A.; Chrysochos, A.I.; Papagiannis, G.K. Narrowband power line communication: Medium voltage cable modeling and laboratory experimental results. Electr. Power Syst. Res. 2013, 102, 50–60. [Google Scholar] [CrossRef]
  20. Artale, G.; Cataliotti, A.; Cosentino, V.; Di Cara, D.; Fiorelli, R.; Guaiana, S.; Tine, G. A New Low Cost Coupling System for Power Line Communication on Medium Voltage Smart Grids. IEEE Trans. Smart Grid 2018, 9, 3321–3329. [Google Scholar] [CrossRef]
  21. Xie, Z.; Dong, F.; Luo, L.; Deng, S.; Cao, W. Research on channel noise of the MV power line considering the LV feedback noise. In Proceedings of the 4th International Conference on Power Engineering, Energy and Electrical Drives, Istanbul, Turkey, 13–17 May 2013; pp. 1648–1651. [Google Scholar]
  22. Elfeki, I.; Doligez, T.; Aouichak, I.; Le Bunetel, J.-C.; Raingeaud, Y. Estimation of PLC transmission line and crosstalk for LV outdoor electrical cables. In Proceedings of the 2017 International Symposium on Electromagnetic Compatibility—EMC EUROPE, Angers, France, 4–7 September 2017; pp. 1–6. [Google Scholar]
  23. Kaiser, C.; Otterbach, N.; Dostert, K. Spectral correlation analysis of narrowband power line noise. In Proceedings of the 2017 IEEE International Symposium on Power Line Communications and its Applications (ISPLC), Madrid, Spain, 3–5 April 2017; pp. 1–6. [Google Scholar]
  24. Nieman, K.F.; Lin, J.; Nassar, M.; Waheed, K.; Evans, B.L. Cyclic spectral analysis of power line noise in the 3–200 kHz band. In Proceedings of the 2013 IEEE 17th International Symposium on Power Line Communications and Its Applications, Johannesburg, South Africa, 24–27 March 2013; pp. 315–320. [Google Scholar]
  25. Milioudis, A.N.; Syranidis, K.N.; Andreou, G.T.; Labridis, D.P. Modeling of Medium-Voltage Power-Line Communication Systems Noise Levels. IEEE Trans. Power Deliv. 2013, 28, 2004–2013. [Google Scholar] [CrossRef]
  26. Zajc, M.; Suljanovic, N.; Mujcic, A.; Tasic, J. Frequency Characteristics Measurement of Overhead High-Voltage Power-Line in Low Radio-Frequency Range. IEEE Trans. Power Deliv. 2007, 22, 2142–2149. [Google Scholar] [CrossRef]
  27. Sheikh, A.A.; Idrees, Q.; Ahmad, M.; Arshad, M.A.; Mahmood, I.; Fayyaz, U.U.; Rana, I.E.; Zaffar, N.A. Feasibility of NB-PLC in LT power distribution network of electric utility in Pakistan. In Proceedings of the 2016 Clemson University Power Systems Conference (PSC), Clemson, SC, USA, 8–11 March 2016; pp. 1–7. [Google Scholar]
  28. Zimmermann, M.; Dostert, K. A multipath model for the powerline channel. IEEE Trans. Commun. 2002, 50, 553–559. [Google Scholar] [CrossRef]
  29. Zimmermann, M.; Dostert, K. Analysis and modeling of impulsive noise in broad-band powerline communications. IEEE Trans. Electromagn. Compat. 2002, 44, 249–258. [Google Scholar] [CrossRef]
  30. Hallak, G.; Bumiller, G. Throughput optimization based on access impedance of PLC modems with limited power consumption. In Proceedings of the 2014 IEEE Global Communications Conference, Austin, TX, USA, 8–12 December 2014; pp. 2960–2965. [Google Scholar]
  31. Kruizinga, B.; Wouters, P.A.A.F.; Steennis, E.F. The effects of branches on condition related signals in Low Voltage underground power systems. In Proceedings of the 2014 IEEE Conference on Electrical Insulation and Dielectric Phenomena (CEIDP), Des Moines, IA, USA, 19–22 October 2014; pp. 578–581. [Google Scholar]
  32. Chu, G.; Li, J.; Liu, W. Narrow band power line channel characteristics for low voltage access network in China. In Proceedings of the 2013 IEEE 17th International Symposium on Power Line Communications and Its Applications, Johannesburg, South Africa, 24–27 March 2013; pp. 297–302. [Google Scholar]
  33. Liu, W.; Sigle, M.; Dostert, K. Channel characterization and system verification for narrowband power line communication in smart grid applications. IEEE Commun. Mag. 2011, 49, 28–35. [Google Scholar] [CrossRef]
  34. Bai, L.; Tucci, M.; Barmada, S.; Raugi, M.; Zheng, T.; Bai, L.; Tucci, M.; Barmada, S.; Raugi, M.; Zheng, T. Impulsive Noise Characterization in Narrowband Power Line Communication. Energies 2018, 11, 863. [Google Scholar] [CrossRef]
  35. Galli, S.; Scaglione, A.; Wang, Z. For the Grid and Through the Grid: The Role of Power Line Communications in the Smart Grid. Proc. IEEE 2011, 99, 998–1027. [Google Scholar] [CrossRef]
  36. Kim, I.H.; Kim, W.; Park, B.; Yoo, H. Channel measurements and field tests of narrowband power line communication over Korean underground LV power lines. In Proceedings of the 18th IEEE International Symposium on Power Line Communications and Its Applications, Glasgow, UK, 30 March–2 April 2014; pp. 132–137. [Google Scholar]
  37. Teixeira, E.A.; Marques, F.S.; de Araujo, S.G.; de Souza, E.M.; Johnson, T.M.; Ribeiro, M.V. Modeling and performance analysis of PLC channels with external interference in outdoor and indoor environments. In Proceedings of the 2008 IEEE International Symposium on Power Line Communications and Its Applications, Jeju City, Korea, 2–4 April 2008; pp. 222–227. [Google Scholar]
  38. Hooijen, O.G. On the channel capacity of the residential power circuit used as a digital communications medium. IEEE Commun. Lett. 1998, 2, 267–268. [Google Scholar] [CrossRef]
  39. Versolatto, F.; Tonello, A.M.; Tornelli, C.; Giustina, D. Della Statistical analysis of broadband underground medium voltage channels for PLC applications. In Proceedings of the 2014 IEEE International Conference on Smart Grid Communications (SmartGridComm), Venice, Italy, 3–6 November 2014; pp. 493–498. [Google Scholar]
  40. Rengaraju, P.; Lung, C.-H.; Srinivasan, A. Communication requirements and analysis of distribution networks using WiMAX technology for smart grids. In Proceedings of the 2012 8th International Wireless Communications and Mobile Computing Conference (IWCMC), Limassol, Cyprus, 27–31 August 2012; pp. 666–670. [Google Scholar]
  41. Borovina, D.; Mujcic, A.; Zajc, M.; Suljanovic, N. Investigation of Narrow-Band Power-Line Carrier Communication System Performance in Rural Distribution Grids. Elektronika Ir Elektrotechnika 2018, 24, 61–67. [Google Scholar] [CrossRef]
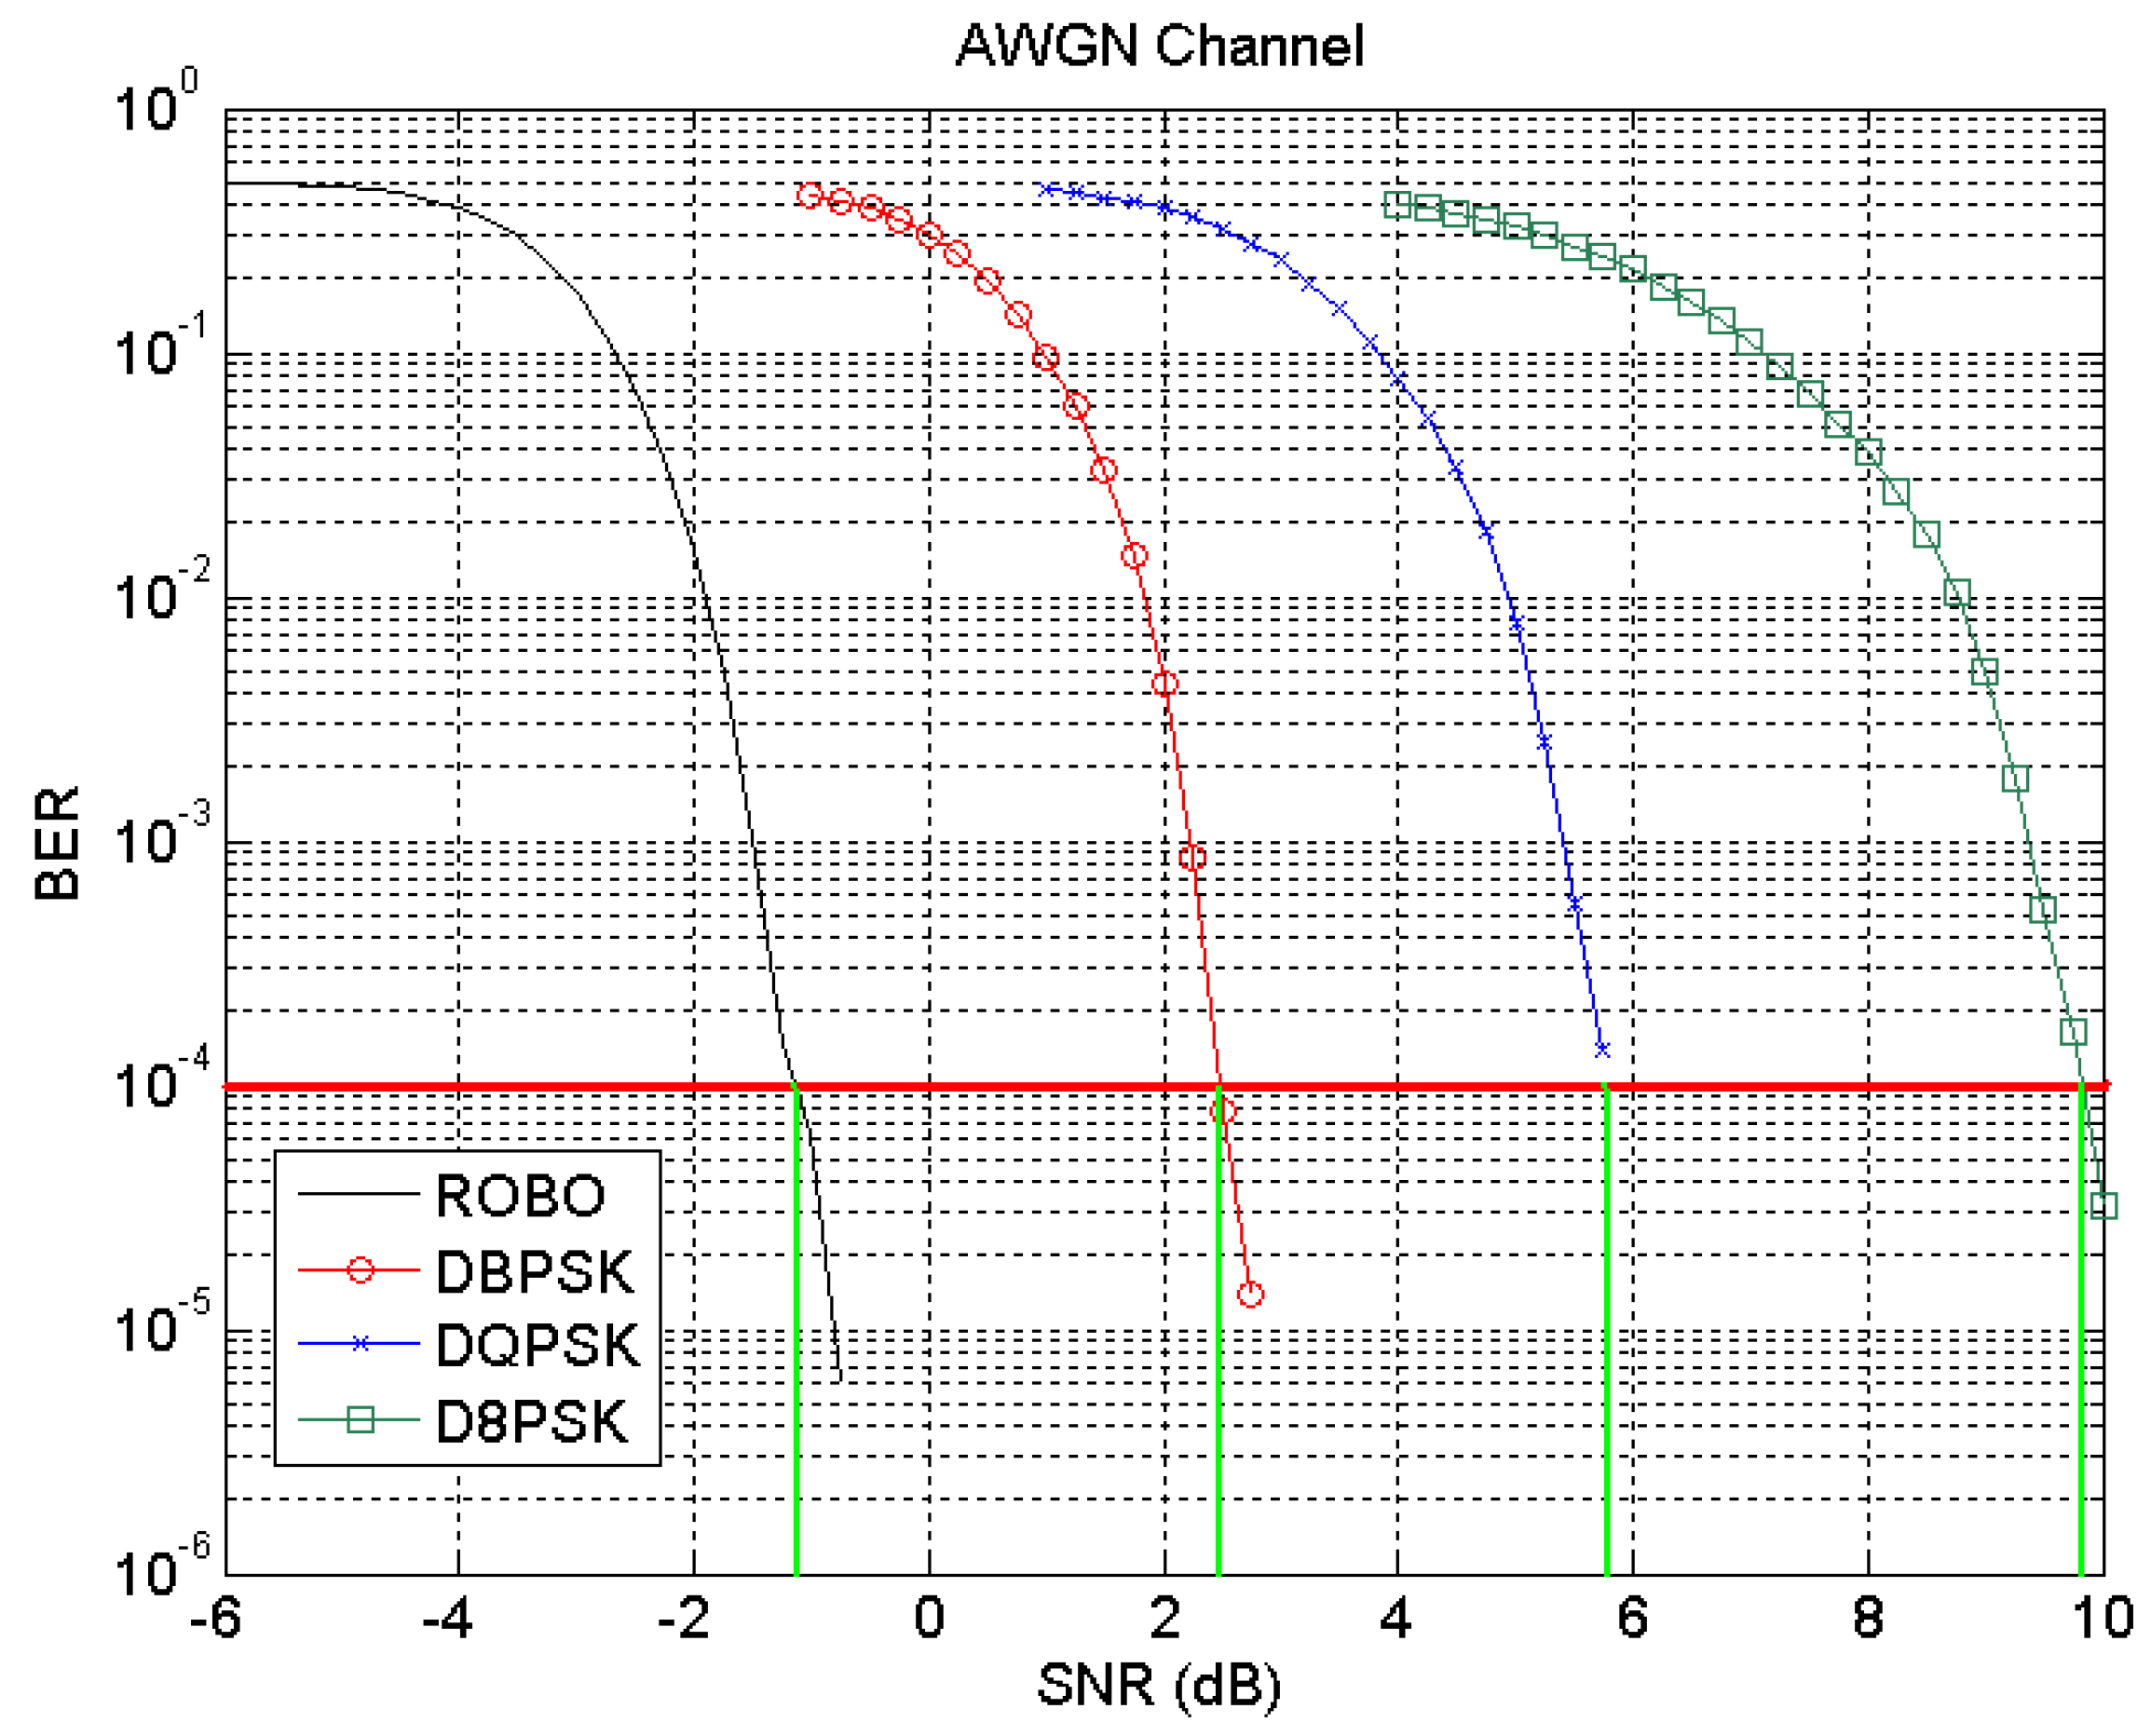
Figure 1. Examples of smart grids’ applications based on the Internet of Things (IoT) technology.
Energies 11 03022 g001
Figure 2. Example of narrowband powerline communication (NB-PLC) channel representation in the low voltage (LV) network.
Energies 11 03022 g002
Figure 3. Five measurement sites in various locations of the city of Tours in France.
Energies 11 03022 g003
Figure 4. Spectral setup measurement protocol.
Energies 11 03022 g004
Figure 5. Electrical schematic of the NB-PLC capacitive coupler.
Energies 11 03022 g005
Figure 6. Temporal measurement setup in the transformer substation.
Energies 11 03022 g006
Figure 7. Transfer function measurement setup.
Energies 11 03022 g007
Figure 8. Noise power spectral density (PSD) in the transformer substation.
Energies 11 03022 g008
Figure 9. Noise PSD at the customer side at the smart electricity meter.
Energies 11 03022 g009
Figure 10. Noise power spectrum in the transformer substation. Measurements performed at 10 a.m. and 2 p.m.
Energies 11 03022 g010
Figure 11. Noise power spectrum in the smart electricity meter. Measurements performed at 10 a.m. and 2 p.m.
Energies 11 03022 g011
Figure 12. Pseudo Wigner-Ville transform analysis for the sub rural site in the time-frequency domain.
Energies 11 03022 g012
Figure 13. Pseudo Wigner-Ville transform analysis for the rural site in the time-frequency domain.
Energies 11 03022 g013
Figure 14. Pseudo Wigner-Ville transform analysis for the urban site in the time-frequency domain.
Energies 11 03022 g014
Figure 15. Noise at the urban dense 1 site.
Energies 11 03022 g015
Figure 16. Results of transfer function analysis for each site.
Energies 11 03022 g016
Figure 17. Reliability of the G1-PLC and the G3-PLC technologies: source G3-PLCTM Alliance [38].
Energies 11 03022 g017
Figure 18. Calculated signal-to-noise (SNR) evolution depending on the frequency in the transformer substation.
Energies 11 03022 g018
Figure 19. Estimation of the channel capacity in the CENELEC A band.
Energies 11 03022 g019
Figure 20. Estimation of the channel capacity in the FCC band.
Energies 11 03022 g020
Table 1. SNR maximum value for the G1-PLC and G3-PLC technologies.
ModulationsG1 (S-FSK)G3 (D8PSK)G3 (DQPSQ)G3 (DBPSK)G3 (Robo)
SNR (TEB: 10 4 )12 dB9.6 dB5.6 dB2.5 dB−1.2 dB
Table 2. Mean channel capacity value per site.
Mean Channel CapacityUrban Dense 1Urban Dense 2Sub RuralRuralUrban
CENELEC A (kbits/s)238170216102136
FCC (Mbits/s)1.581.732.211.311.92
Table 3. Summary of the noise temporal features in various sites.
Type of NoiseMain CharacteristicsUrban Dense 1Sub RuralRuralUrban
StationaryMagnitude50 mV50 mV50 mV100 mV
Periodic impulsiveMagnitude100 mV50 mV200 mV700 mV
Cycle time10 ms10 ms10 ms10 ms
Duration3 ms2 ms2 ms1 ms
Aperiodic impulsiveMagnitude>1 V>500 mV>2 V>400 mV
Duration1 ms2 ms2 ms2 ms

