Research on Battery Energy Storage as Backup Power in the Operation Optimization of a Regional Integrated Energy System


Abstract
:1. Introduction
2. System Modeling and Strategy
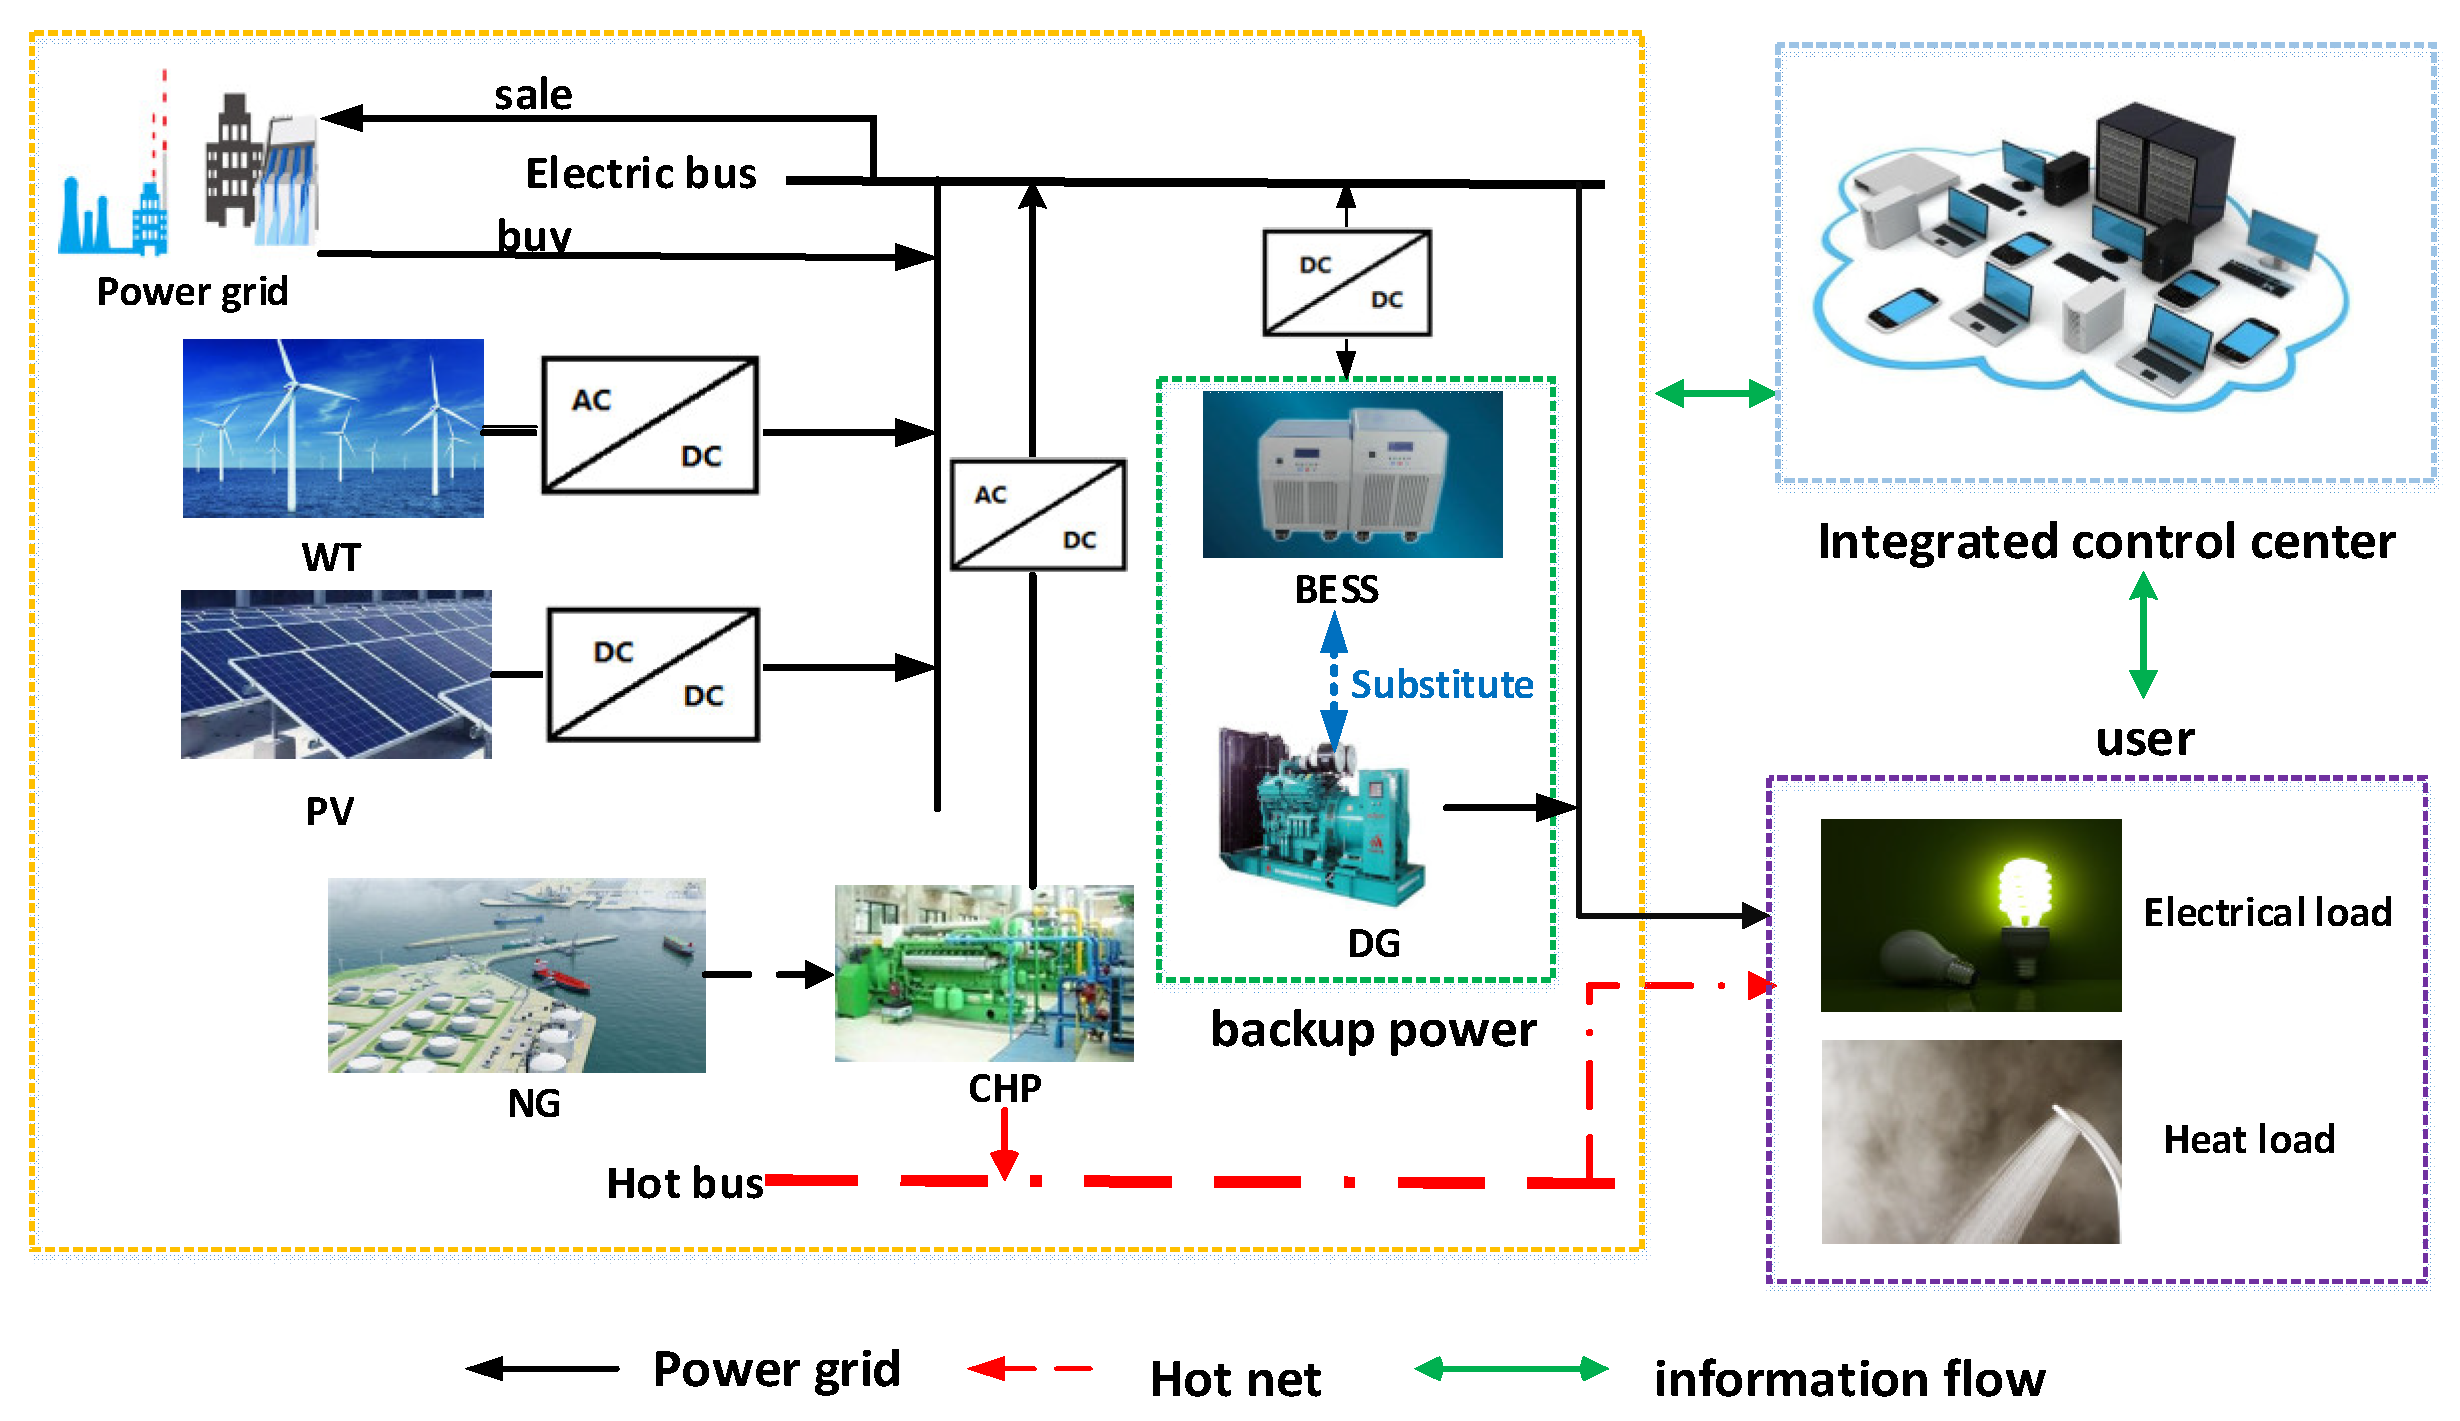
2.1. System Structure
2.2. System Output Model
- (1)
- Model of wind power output:The power of the WT is determined by the wind speed. In this paper, the Weibull wind speed model is obeyed. The probability density of the fan is expressed as Equation (1):where k is the shape parameter and c is the scale parameter of the Weibull distribution.When the wind velocity is less than the cut-in wind velocity () or more than the cut-out wind velocity (), the power of the generator fan is 0. When the wind velocity is more than the cut-in wind velocity and less than the rated wind velocity (), the power output can be expressed as a function of wind velocity as an independent variable. When the wind velocity reaches the specified wind velocity, and it is less than the cut-out wind velocity, the fan runs at rated power. The output power is shown as Equation (2):
- (2)
- Model of photovoltaic output:The PV module temperature and photovoltaic radiation intensity determine the output of the PV system:where is the photovoltaic output energy conversion efficiency and takes 0.9; is the rated power of PV; is the actual radiation intensity of PV; is the rated light intensity; is the power temperature coefficient and takes 0.0047 °C−1 [22]; is the actual temperature of the PV module; and is the rated temperature of PV module.
- (3)
- Model of energy storage output:In this paper, a lithium-ion battery with a two-state reliability mathematical model is used as an energy storage device. is the power of the battery exchanged with the outside at t time.When , the external system lacks power, and the battery is in a discharged state. The battery discharge power is calculated as follows:where is the maximum discharge power constraint of the battery; is the minimum charge state constraint of the battery; is the charge rate of the battery at t − 1 time; is the minimum battery charge rate; is the discharge efficiency of the battery; is the total capacity of the battery; and is a simulation time interval.When , the external system has sufficient power to recharge the battery. The charging power is calculated as follows:where is the maximum charge power constraint of the battery; is the maximum charge state constraint of the battery; is the discharging efficiency of the battery; and is the minimum battery charge rate.
- (4)
- Model of CHP output:The gas turbine (GT) is a rotary impeller type power device which converts the thermal energy generated by combustion gas into mechanical energy. It is mainly comprised of a control system, an air compressor, a turbine, a gas combustion chamber and related auxiliary equipment. In general, the GT determines the type and capacity of these, and many of its parameters are known. Therefore, when the fuel is supplied, the thermoelectric supply also has a certain value. The rated thermoelectric ratio is calculated as follows:where is the rated thermoelectric ratio; and are the heat supply and power generation.The generating efficiency of a gas turbine has a relationship to the output power. The amount of natural gas and the heat generated are calculated as follows:where is the waste heat of the exhaust at time t; is the generator efficiency; is the GT output at time t; is the heat loss coefficient of GT; is the low calorific value of natural gas; and is the natural gas consumption per unit time.The CHP system costs include the initial investment and operating costs. Generally, the initial investment of the system is large and the operating cost is lower. The labor costs in operation are not considered. The operating costs can be expressed as follows:where is the gas price, is the consumption of the total heat; and is the net calorific power of the natural gas.
3. Problem Formulation
3.1. Objective Function
3.2. Constraints
- (1)
- Active power balance constraints:where is the number of generating units that can be dispatched by microgrids; is the dispatching power generation power output at time t; is distributed photovoltaic power output at time t; is the total active load in the system at time t; is distributed wind power output at time t; and is tie line power output at time t.
- (2)
- Capacity of equipment and ramp rate operation constraints:where and are the upper and lower limits of the active output of the adjustable power generation unit; and and are the upper and lower limits of the active output of the unscheduled power generation unit.The schedulable generation units follow (16) and (17) when increasing load and reducing load, respectively.The non-scheduled power generation units follow (18) and (19) when increasing load and reducing load, respectively.
- (3)
- Energy storage strategy constraints:where is state of charge at time t.
- (4)
- CHP balance constraints:
- (1)
- Electrical bus balance constraints:where is the exchange power of RIES and the grid; is the power generation of the gas turbine; is the power output of the photovoltaic; is the power output of the WT; is the discharge power of the storage device; is the electrical load; is the power of the electric refrigerator; is the power of the electric boiler; and is the charging power of the storage device.
- (2)
- Flue gas bus balance constraints:where is the thermal efficiency of the gas turbine; and is the power output of the waste heat boiler.
- (3)
- Steam bus balance constraints:where is the thermal efficiency of the waste heat boiler; is the heat flux of the gas boiler; is the power of the thermal storage device; is the output of heat exchange; and is the exothermic power of the thermal storage device.
- (4)
- Hot water bus balance constraints:where is the efficiency of heat exchange, and is the heat load.
- (5)
- Air bus balance constraints:where is the cooling efficiency of the electric refrigerator; is the cooling power of the electric refrigerator; and is the cold load.
- (6)
- Environmental constraint:where is the maximum allowable emission in accordance with the environmental policy provision.
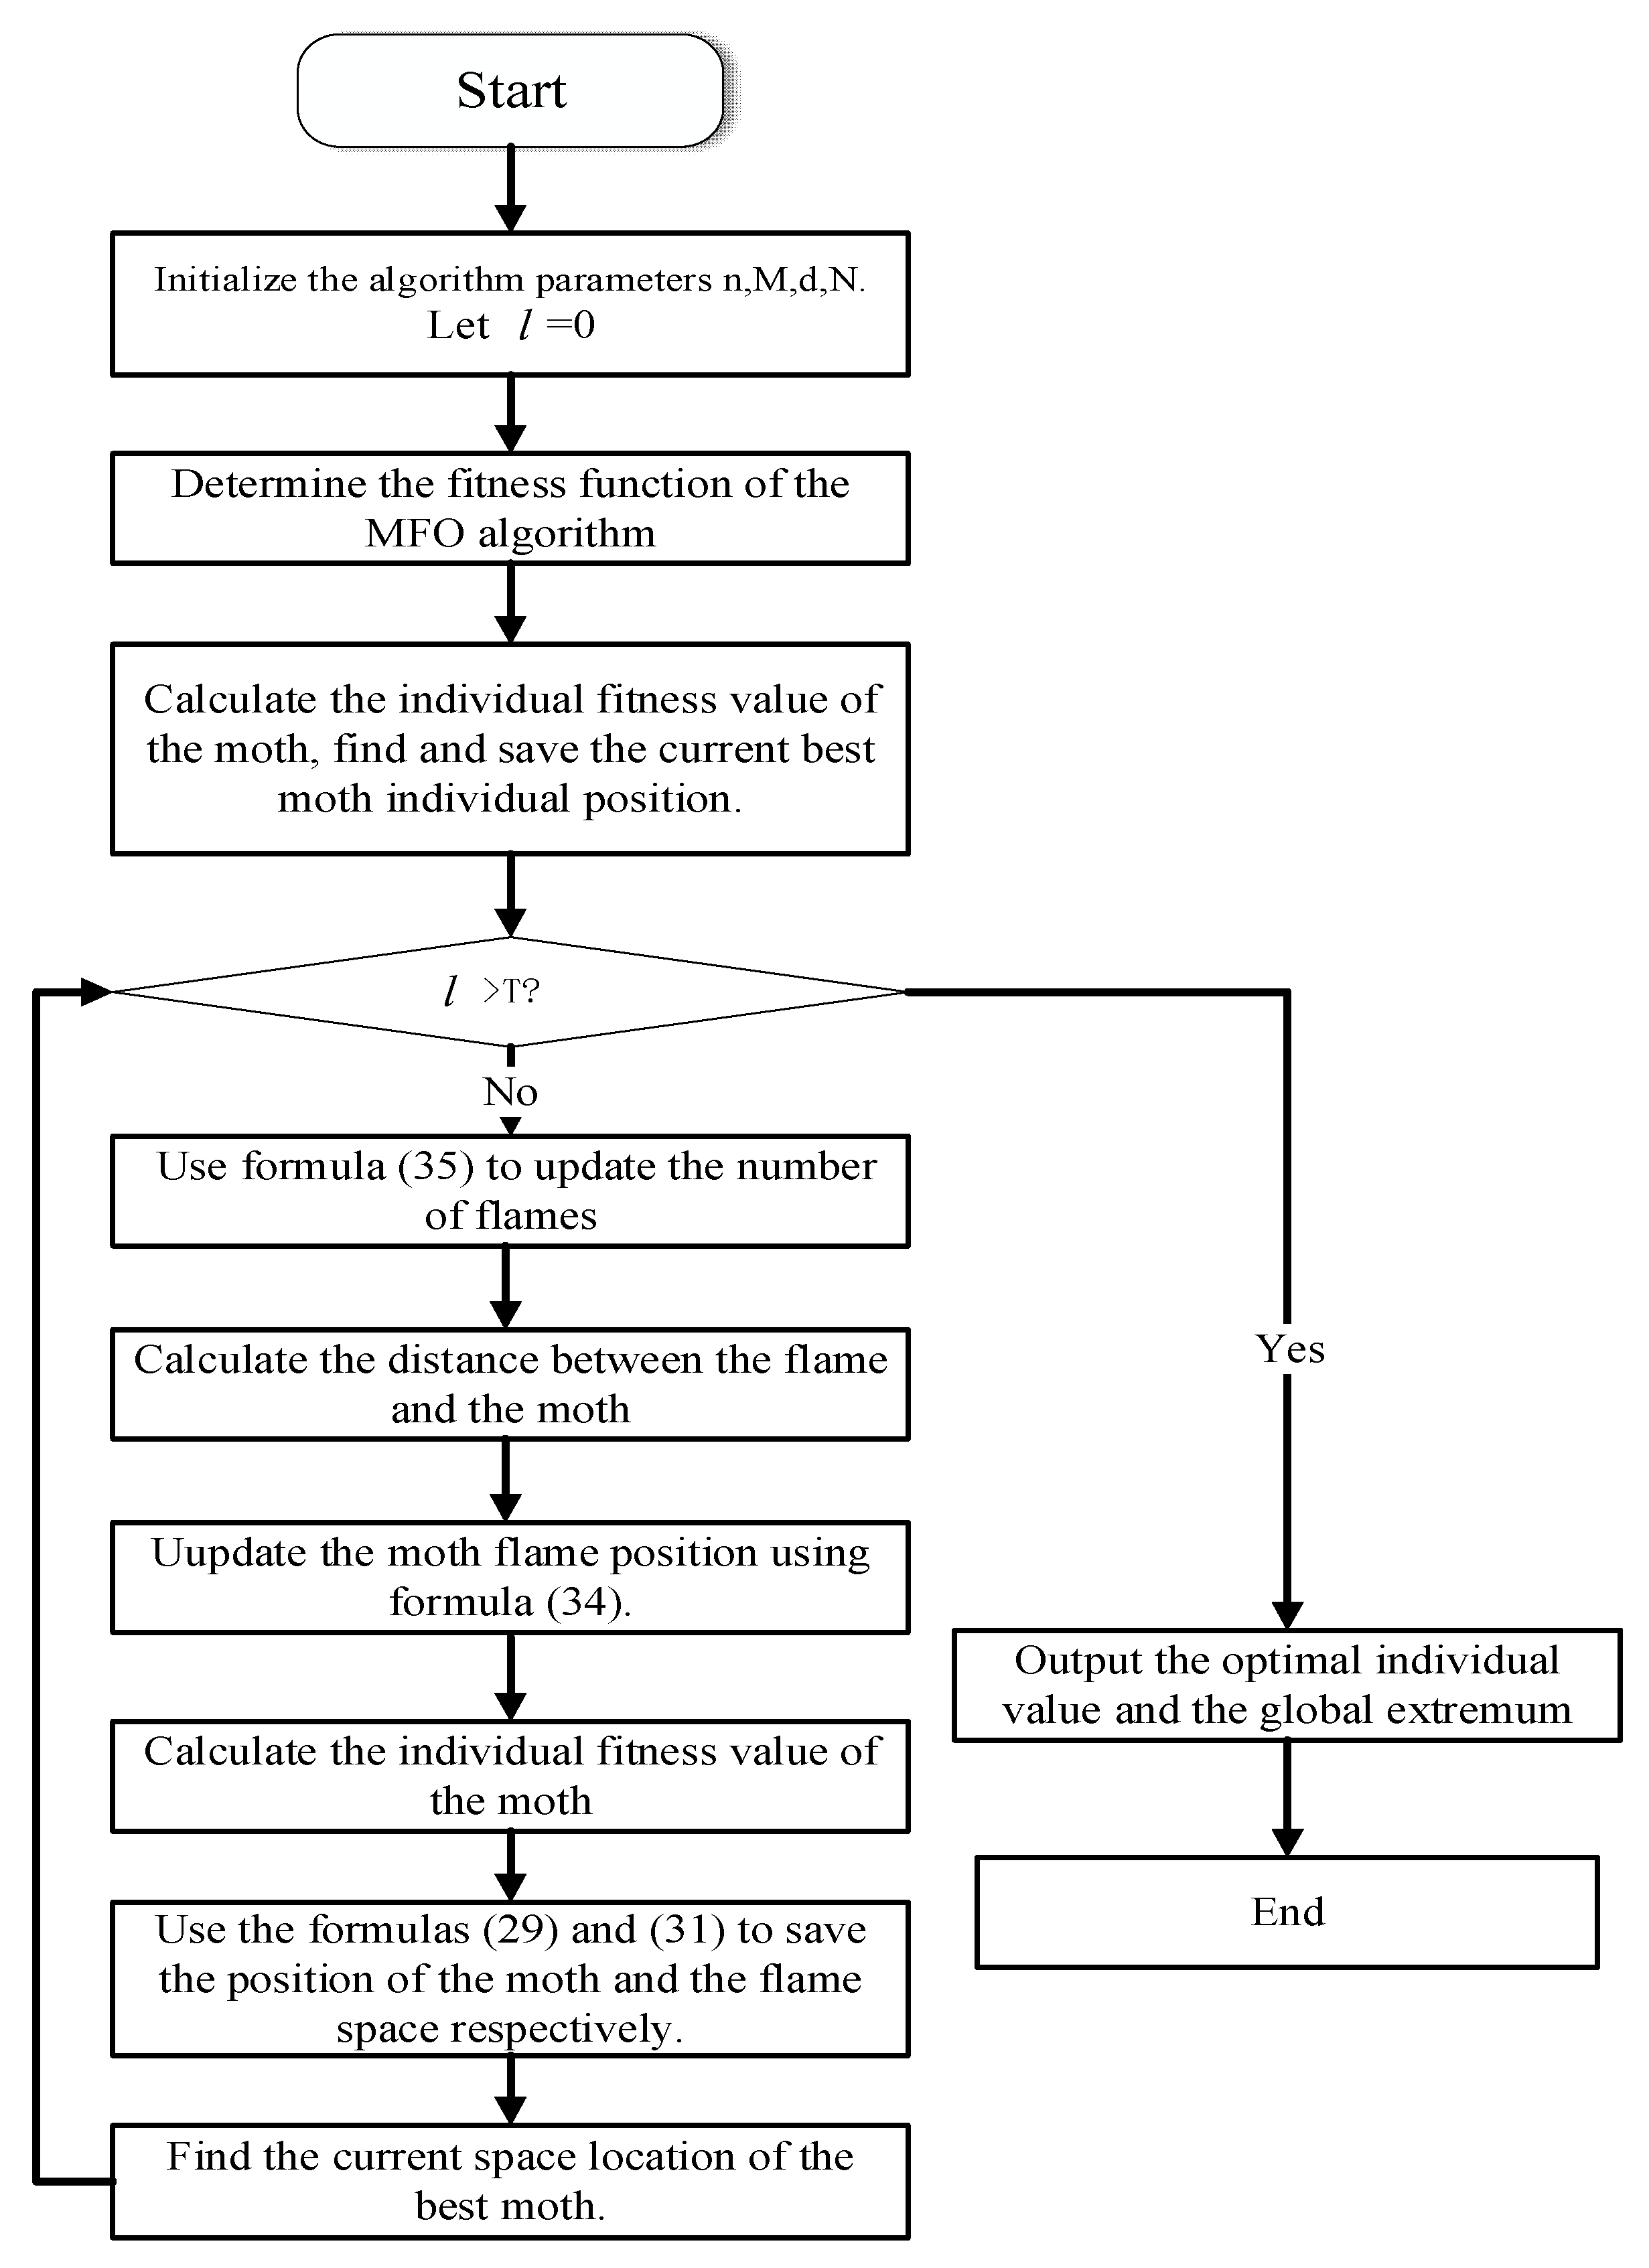
4. Methodology of the Moth Flame Optimization Algorithm
5. Case Study
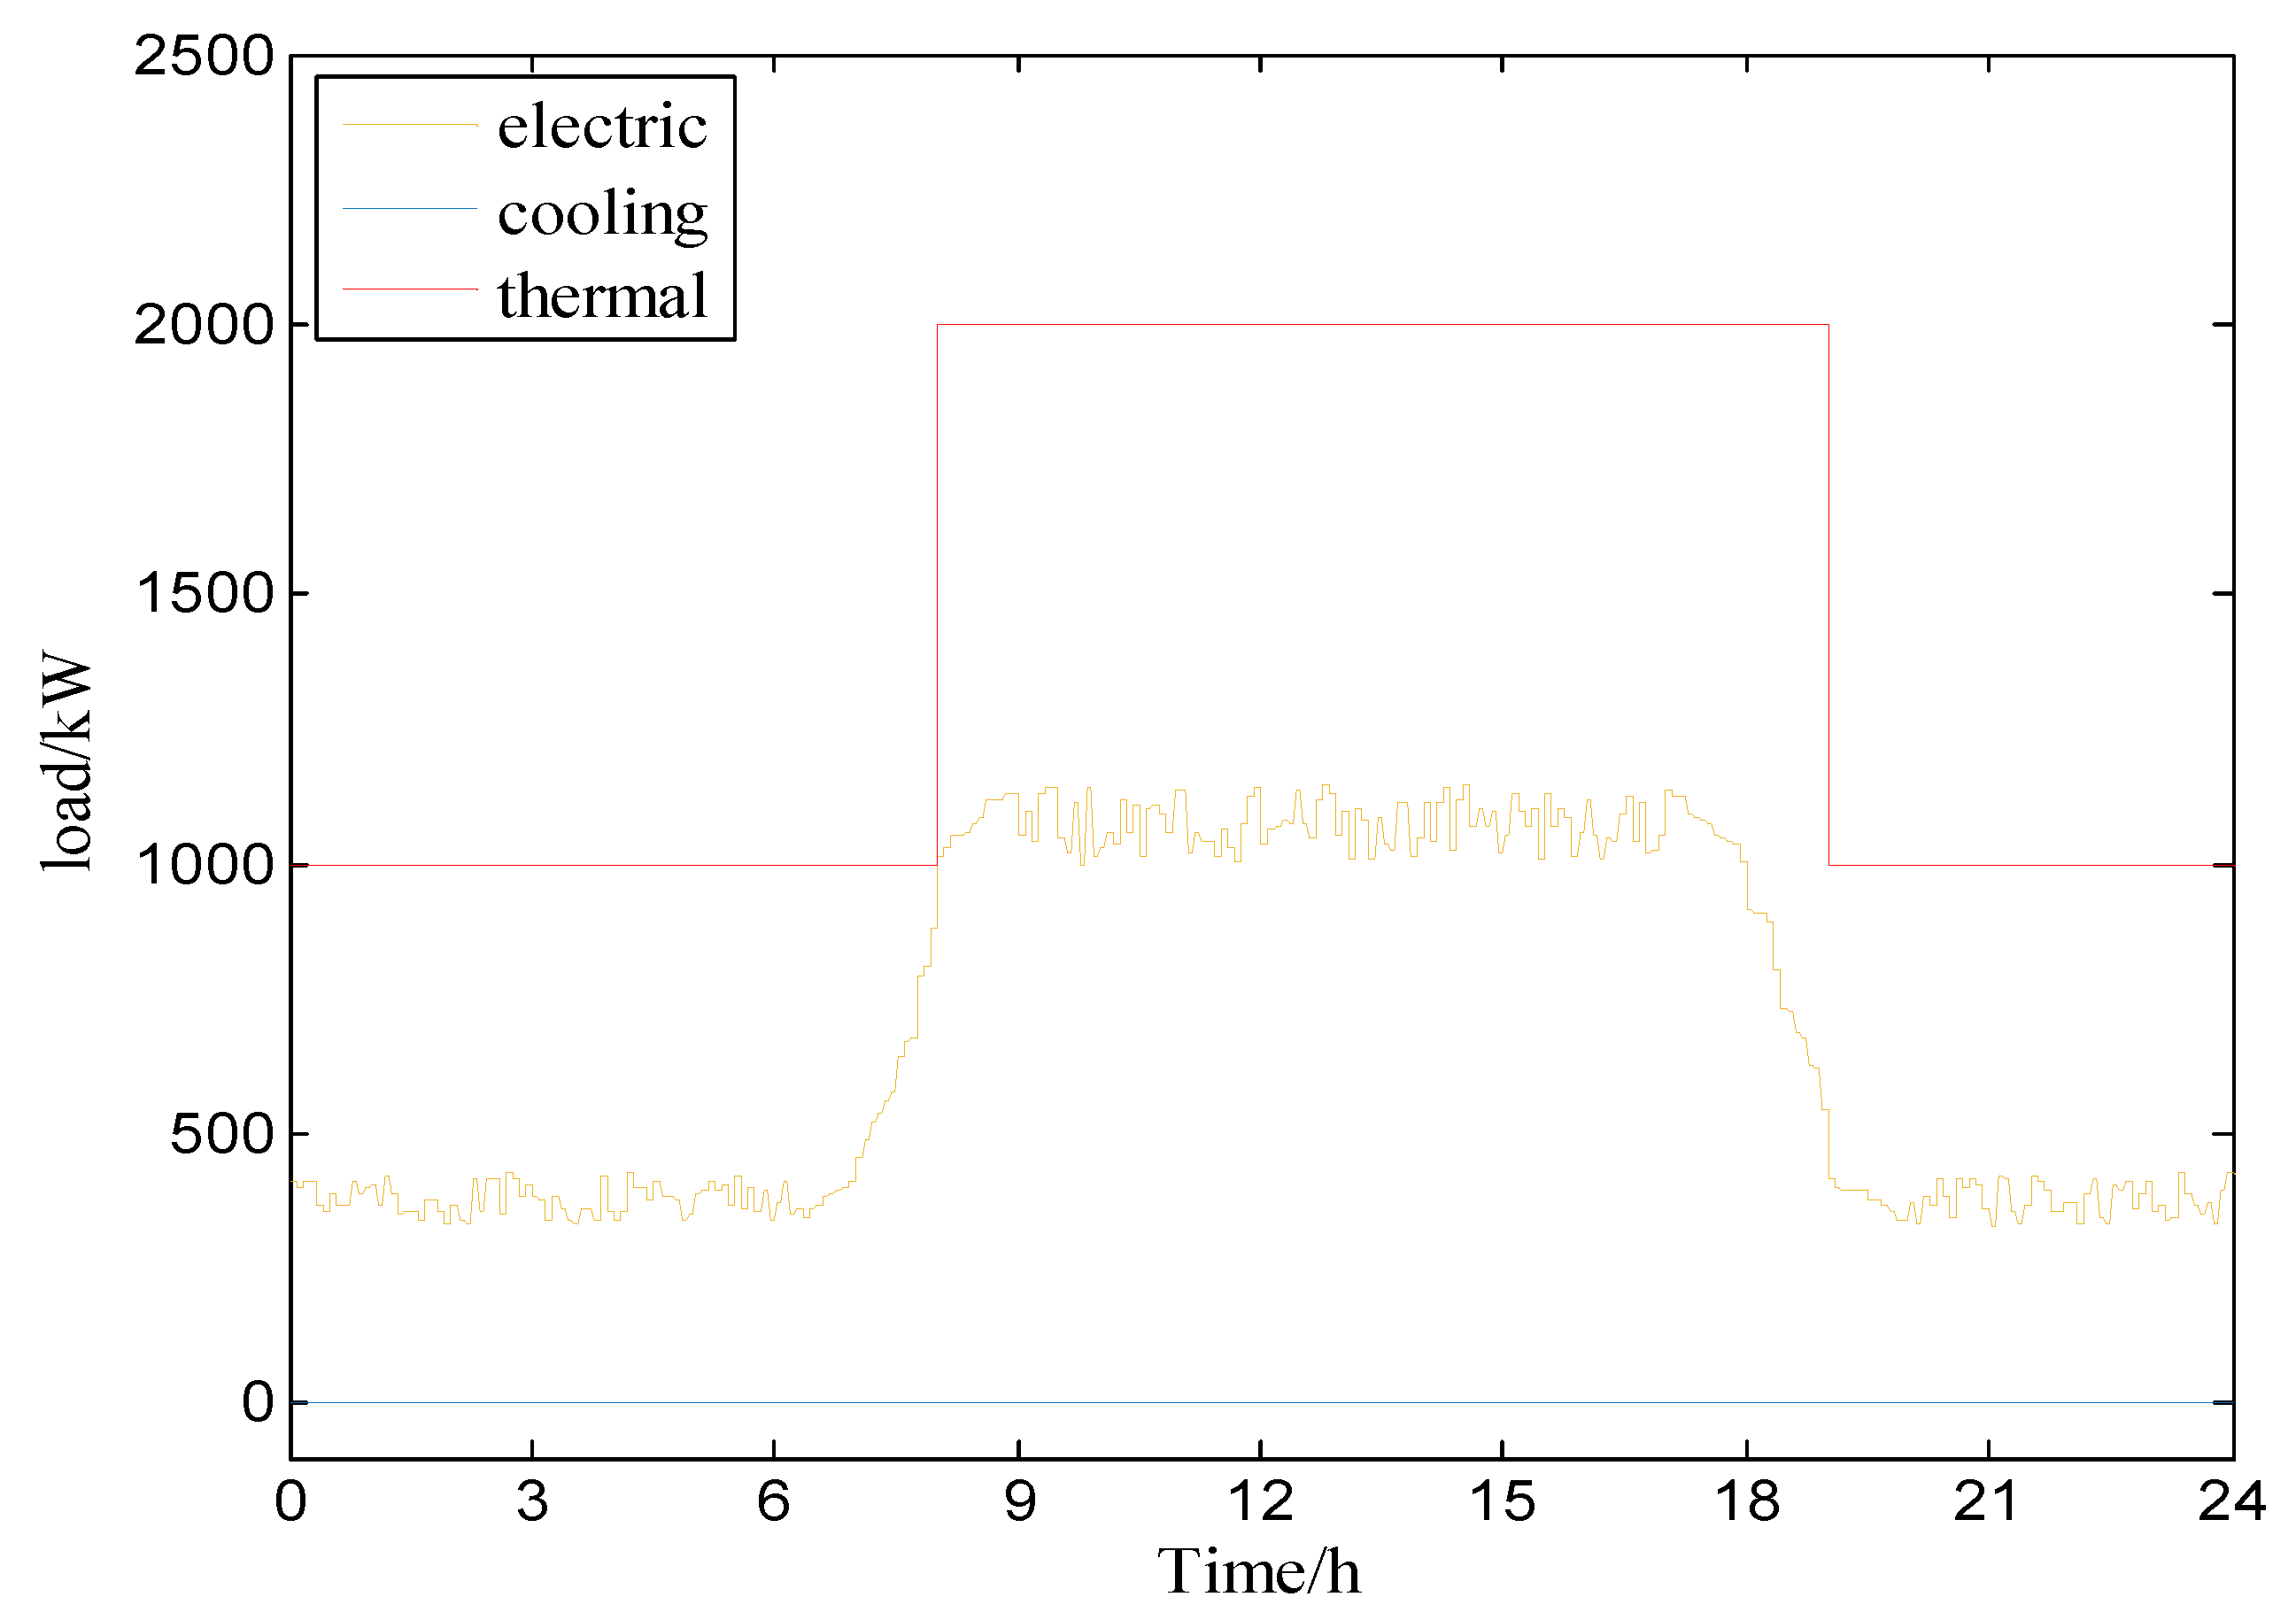
5.1. Data and Parameters Setting
5.2. Operation Optimization
5.2.1. Scenario Analysis
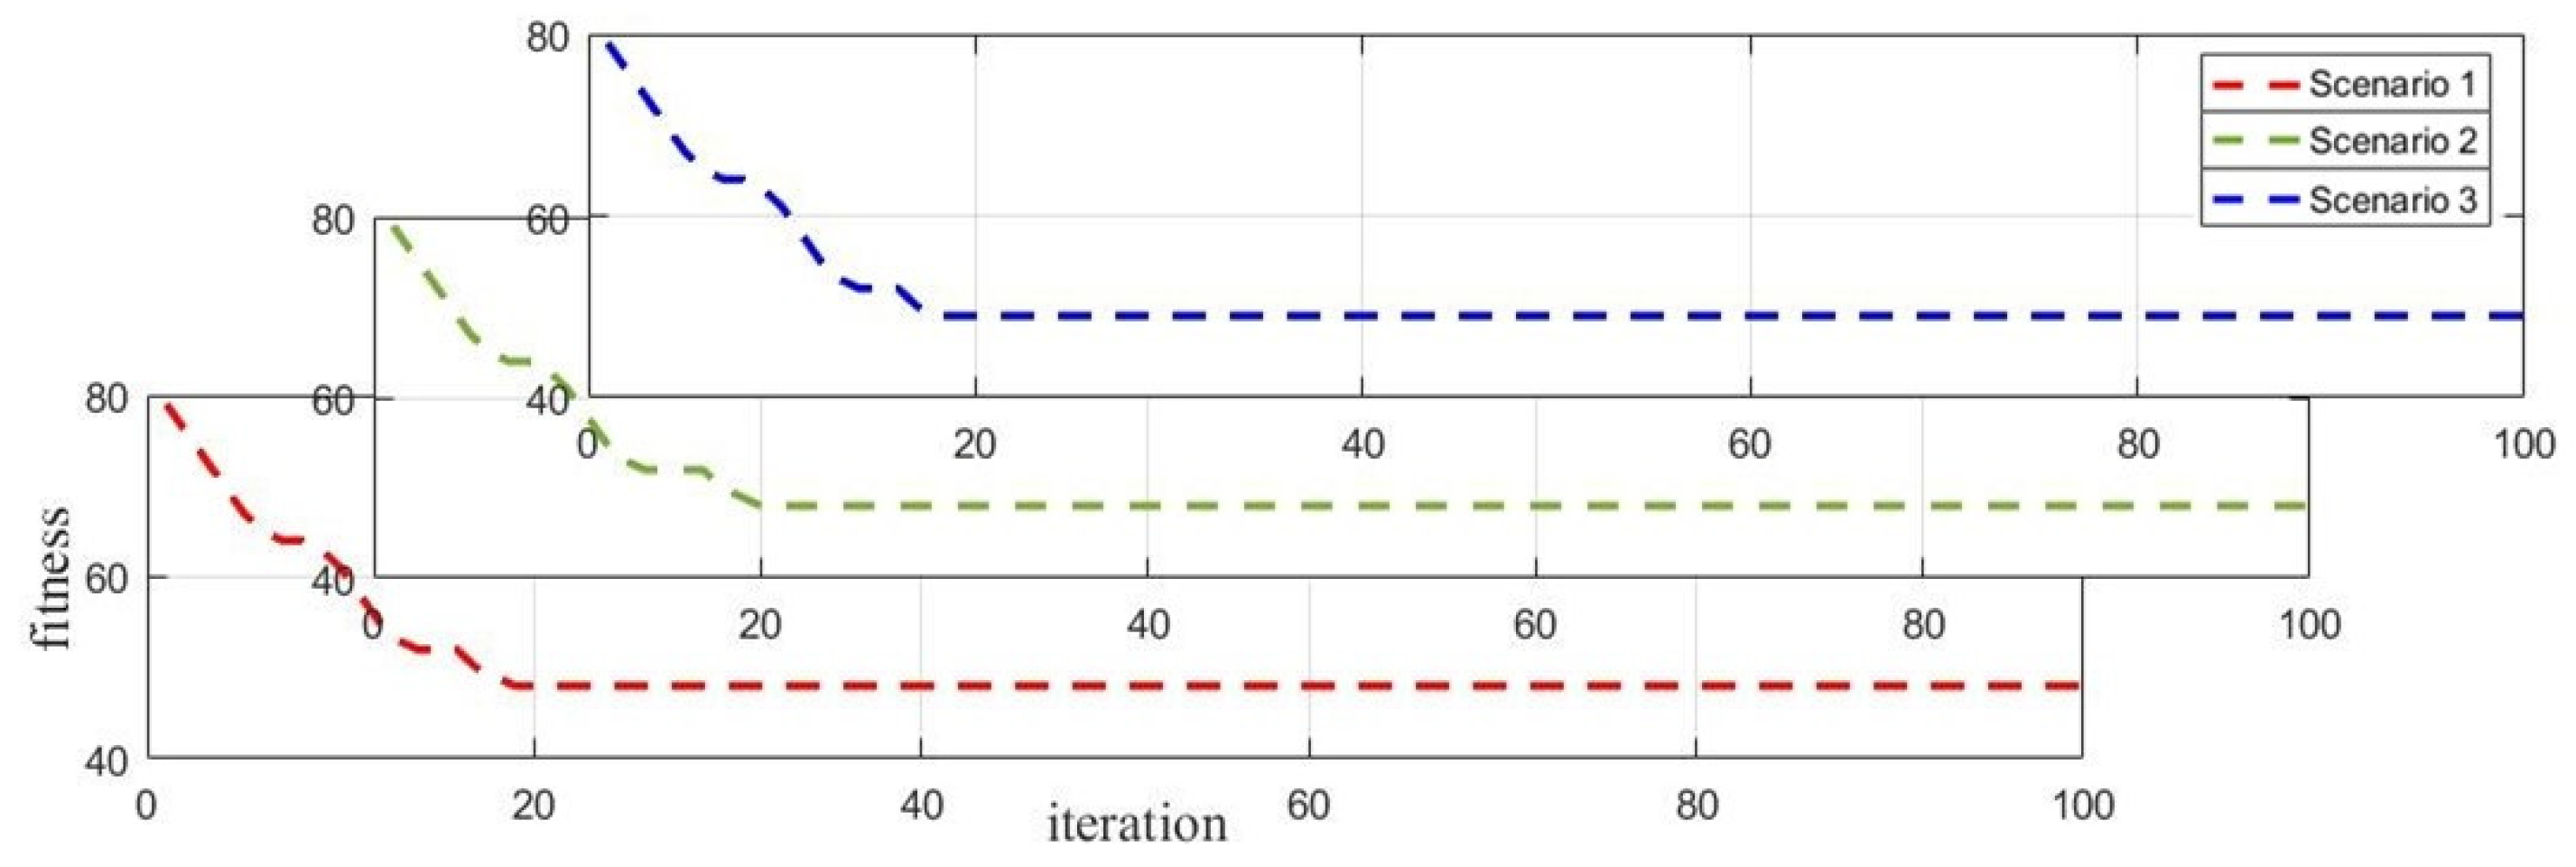
5.2.2. Algorithm Optimization Result
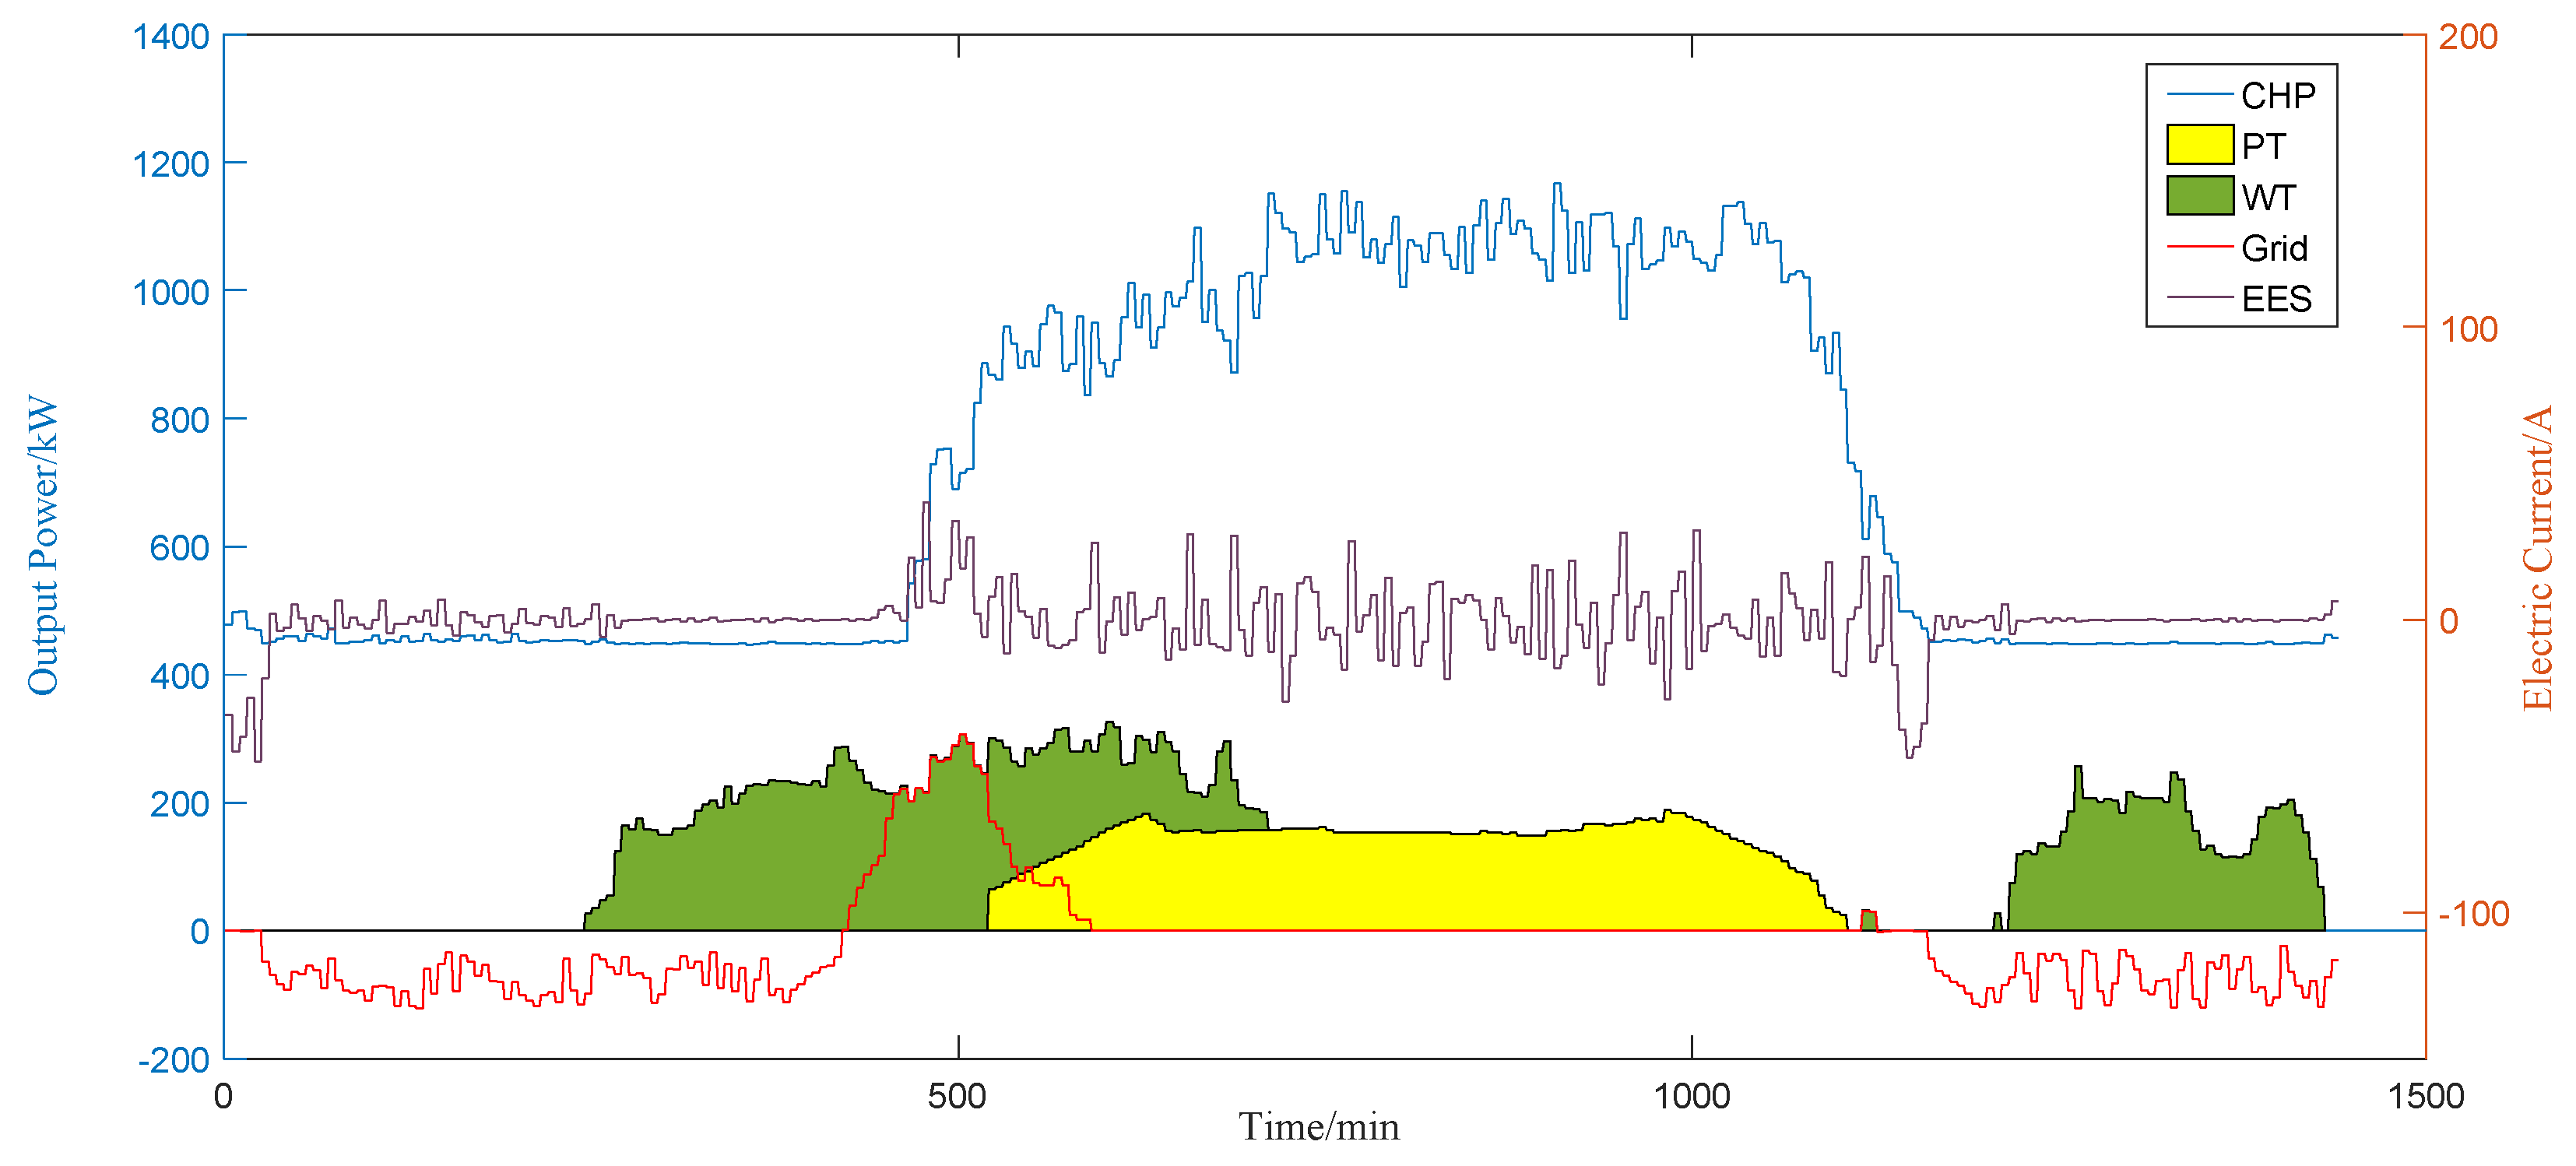
5.2.3. The Results of Optimization
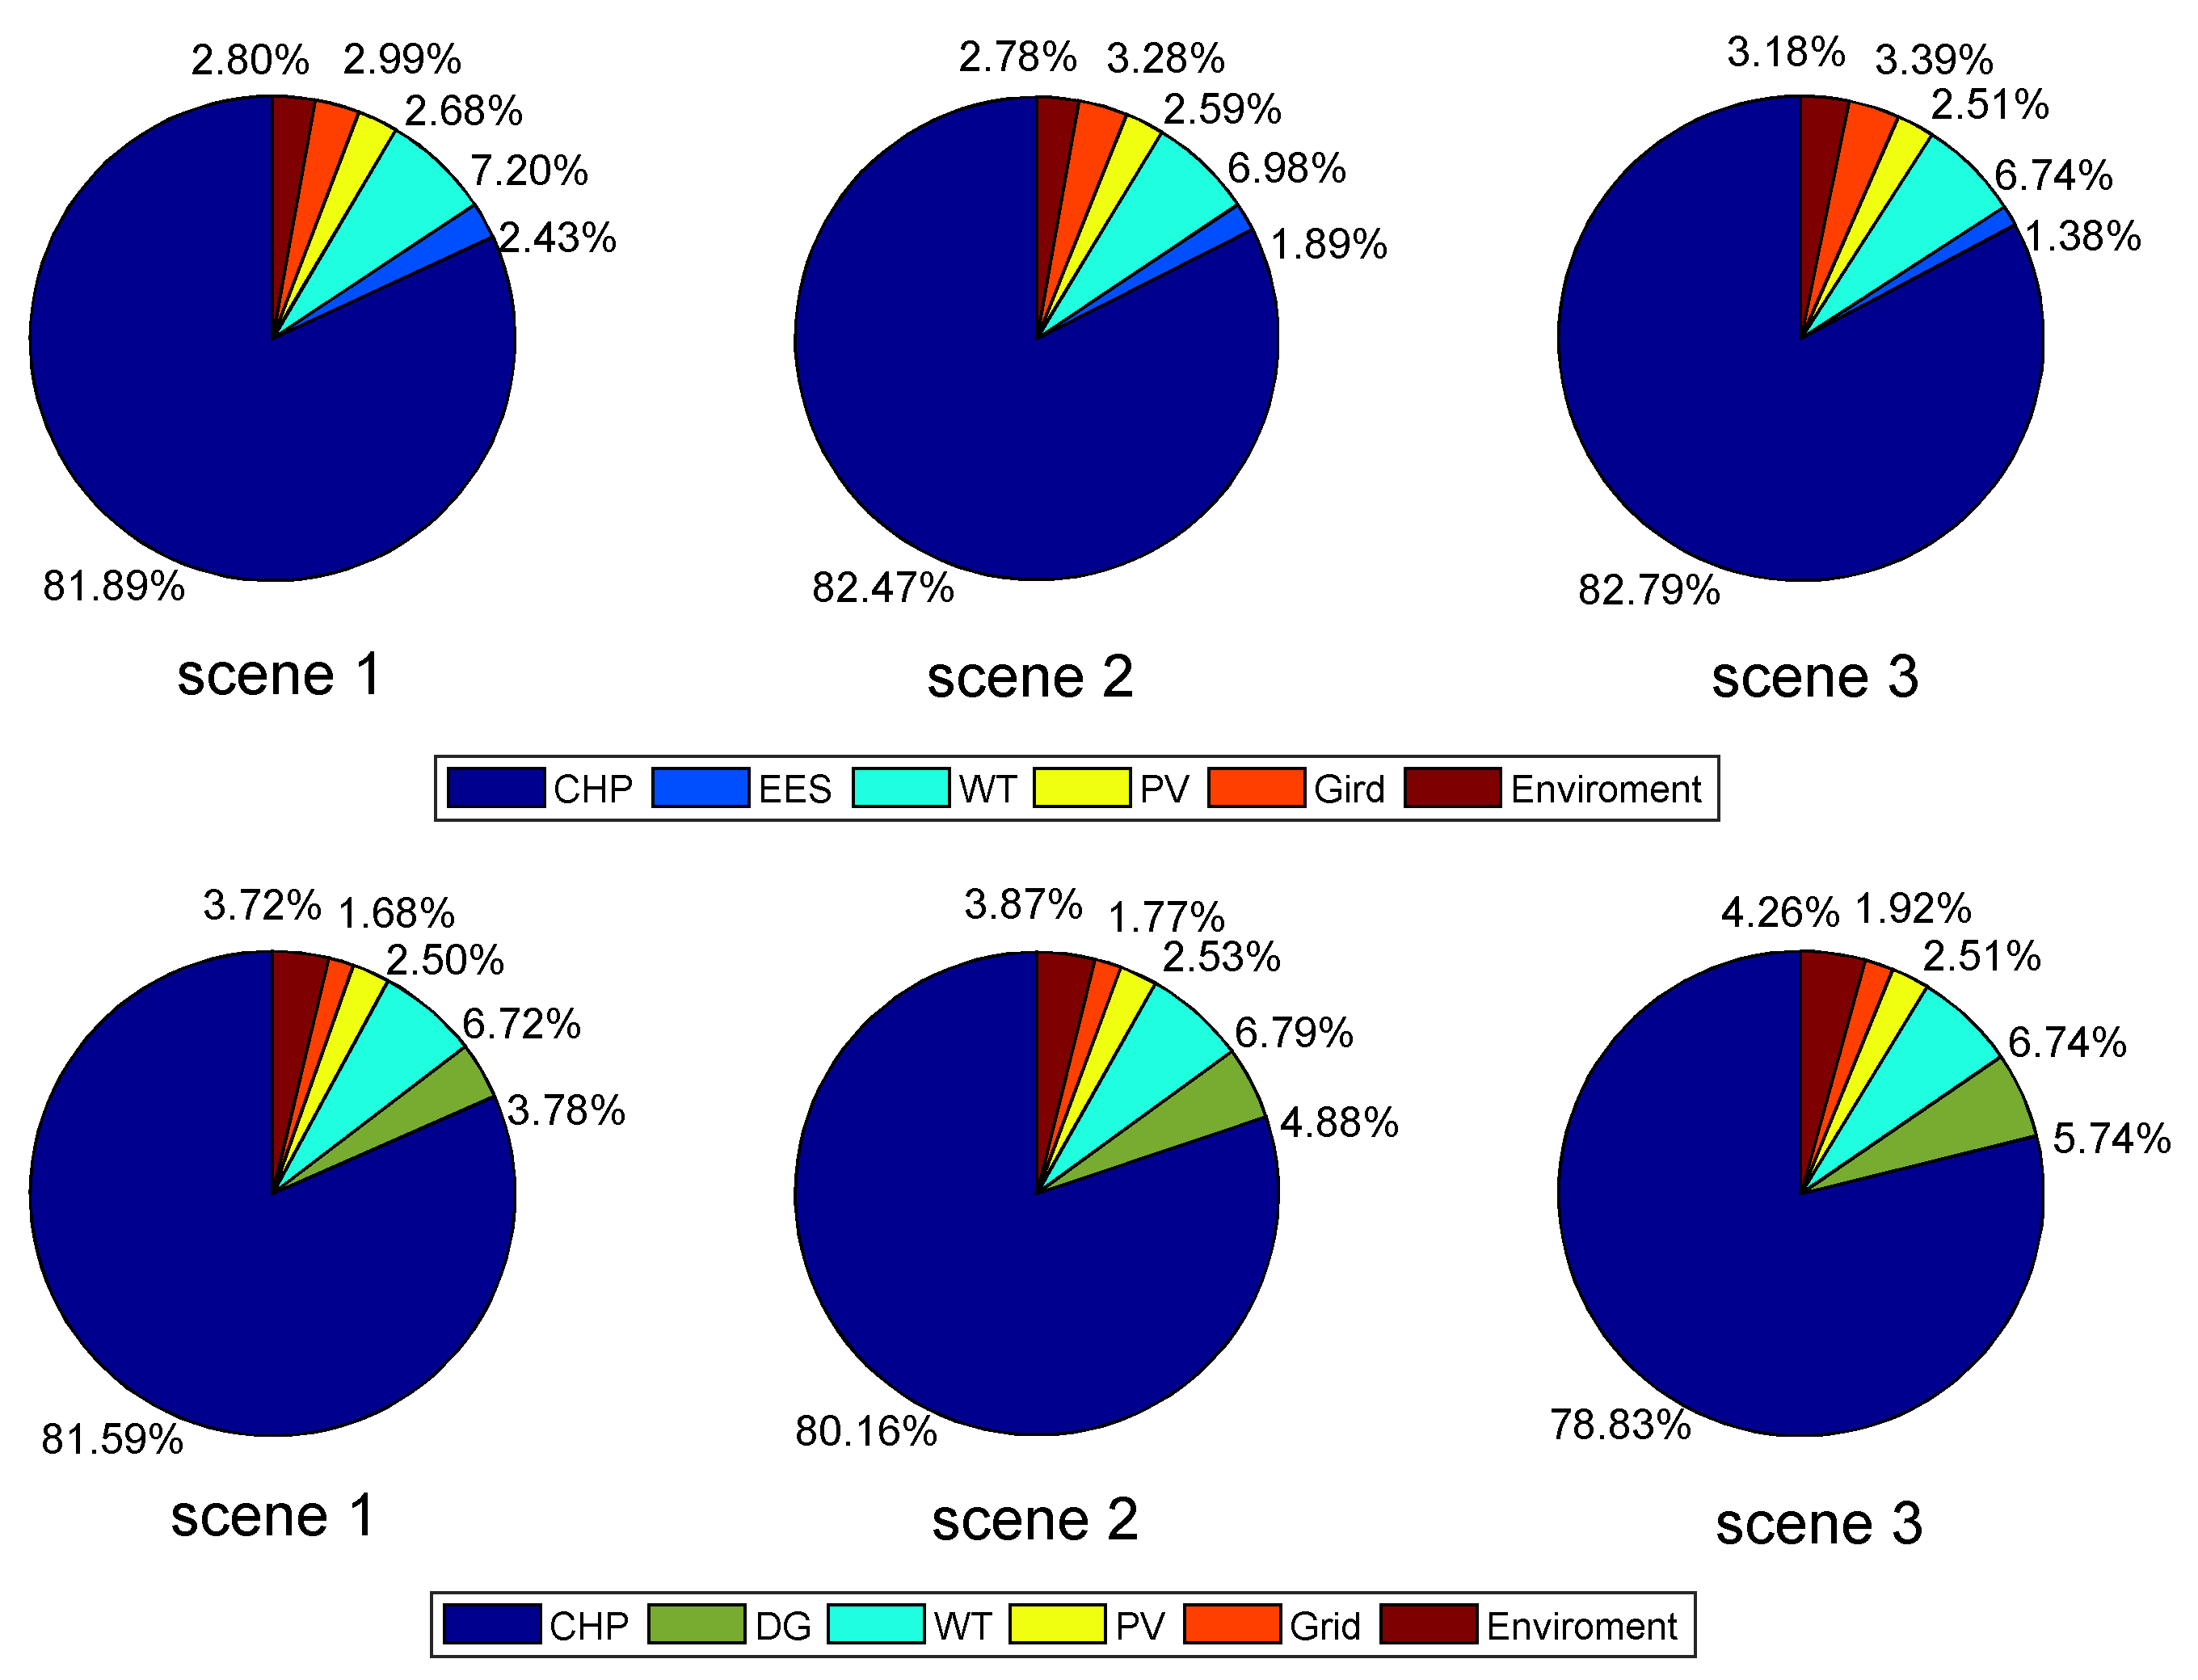
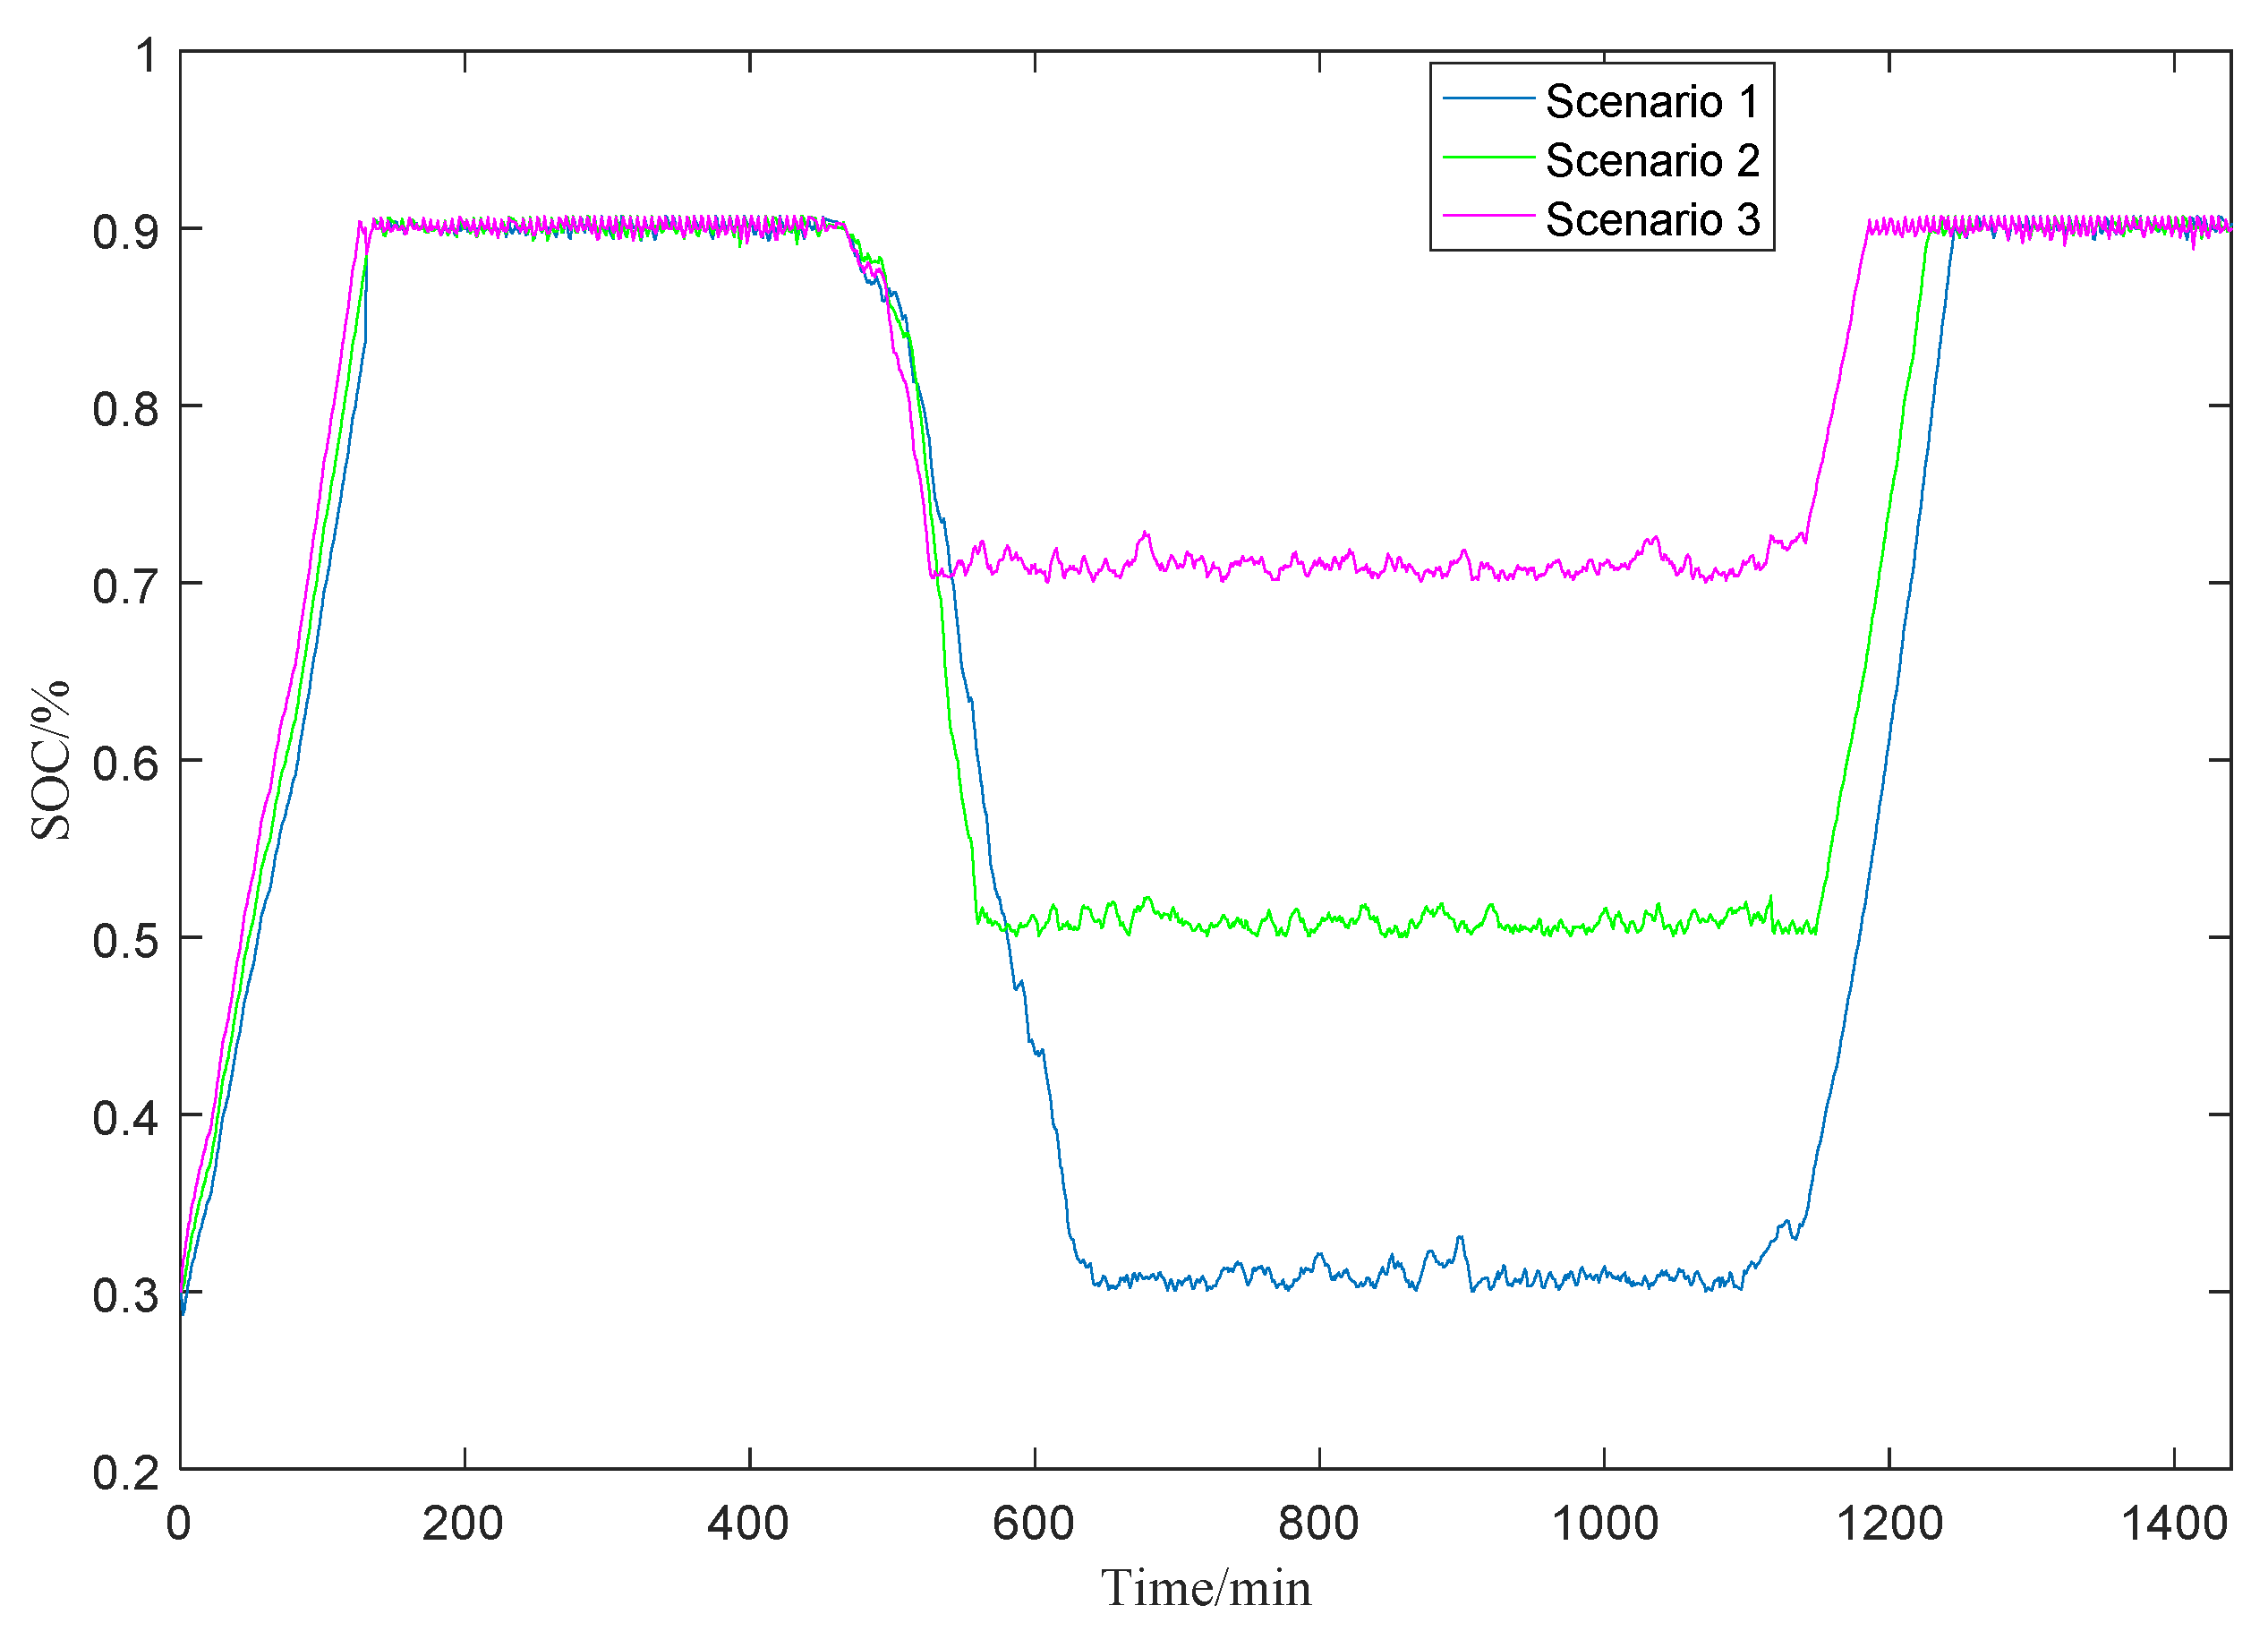
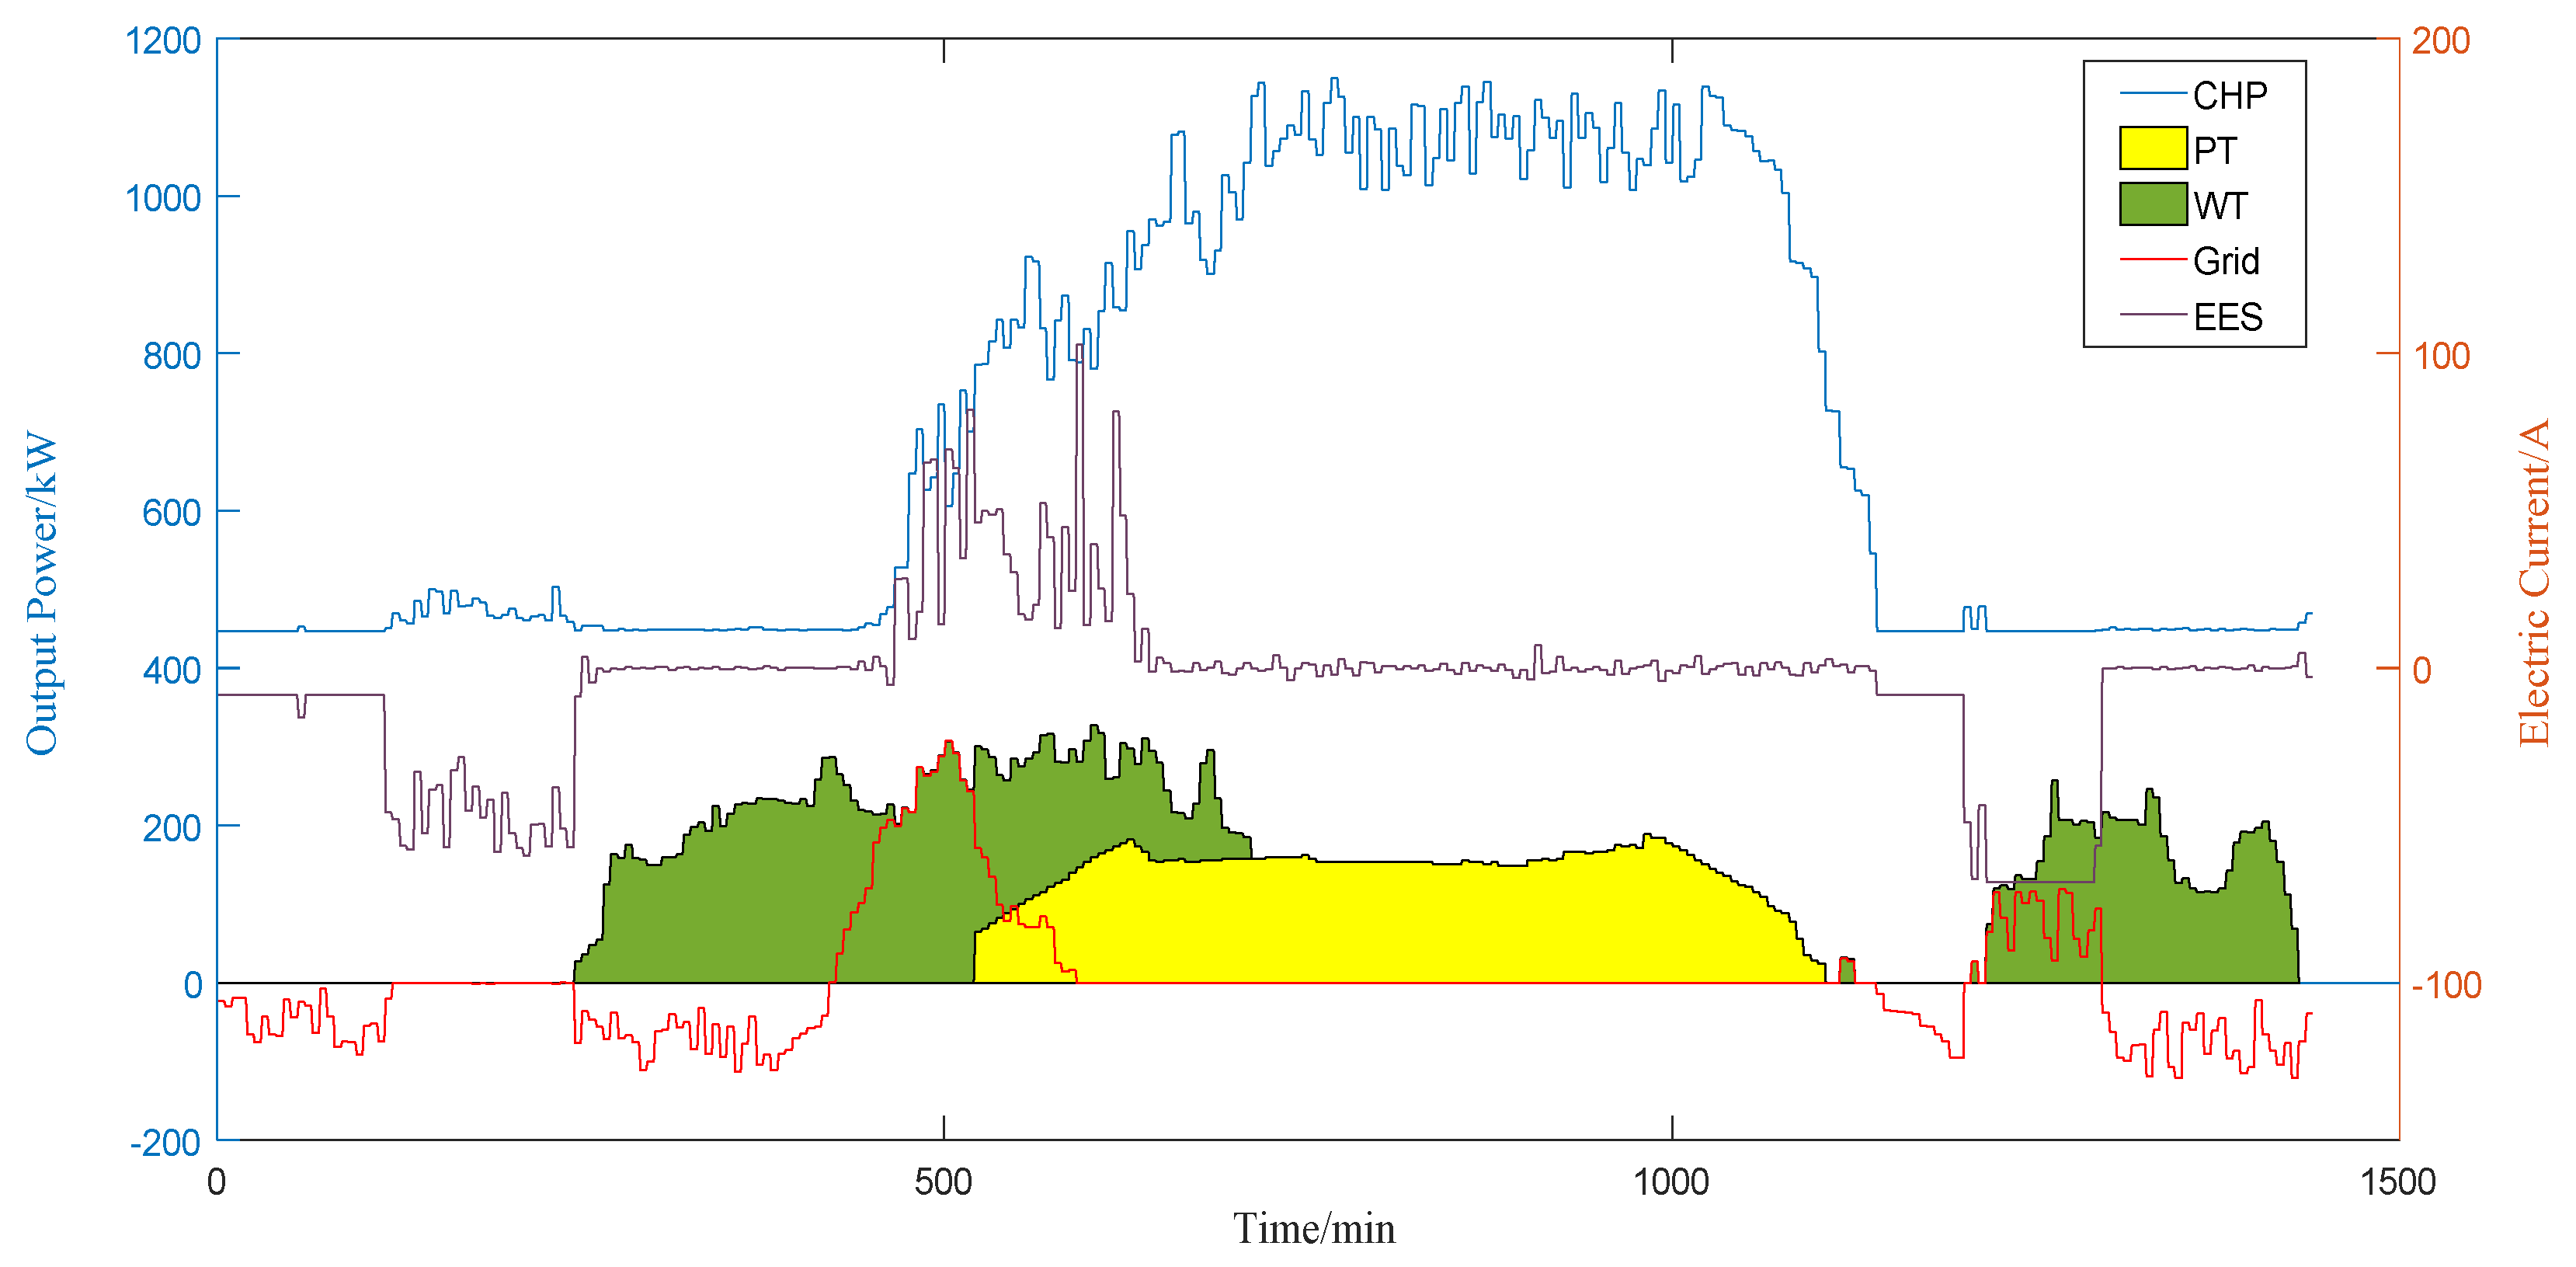
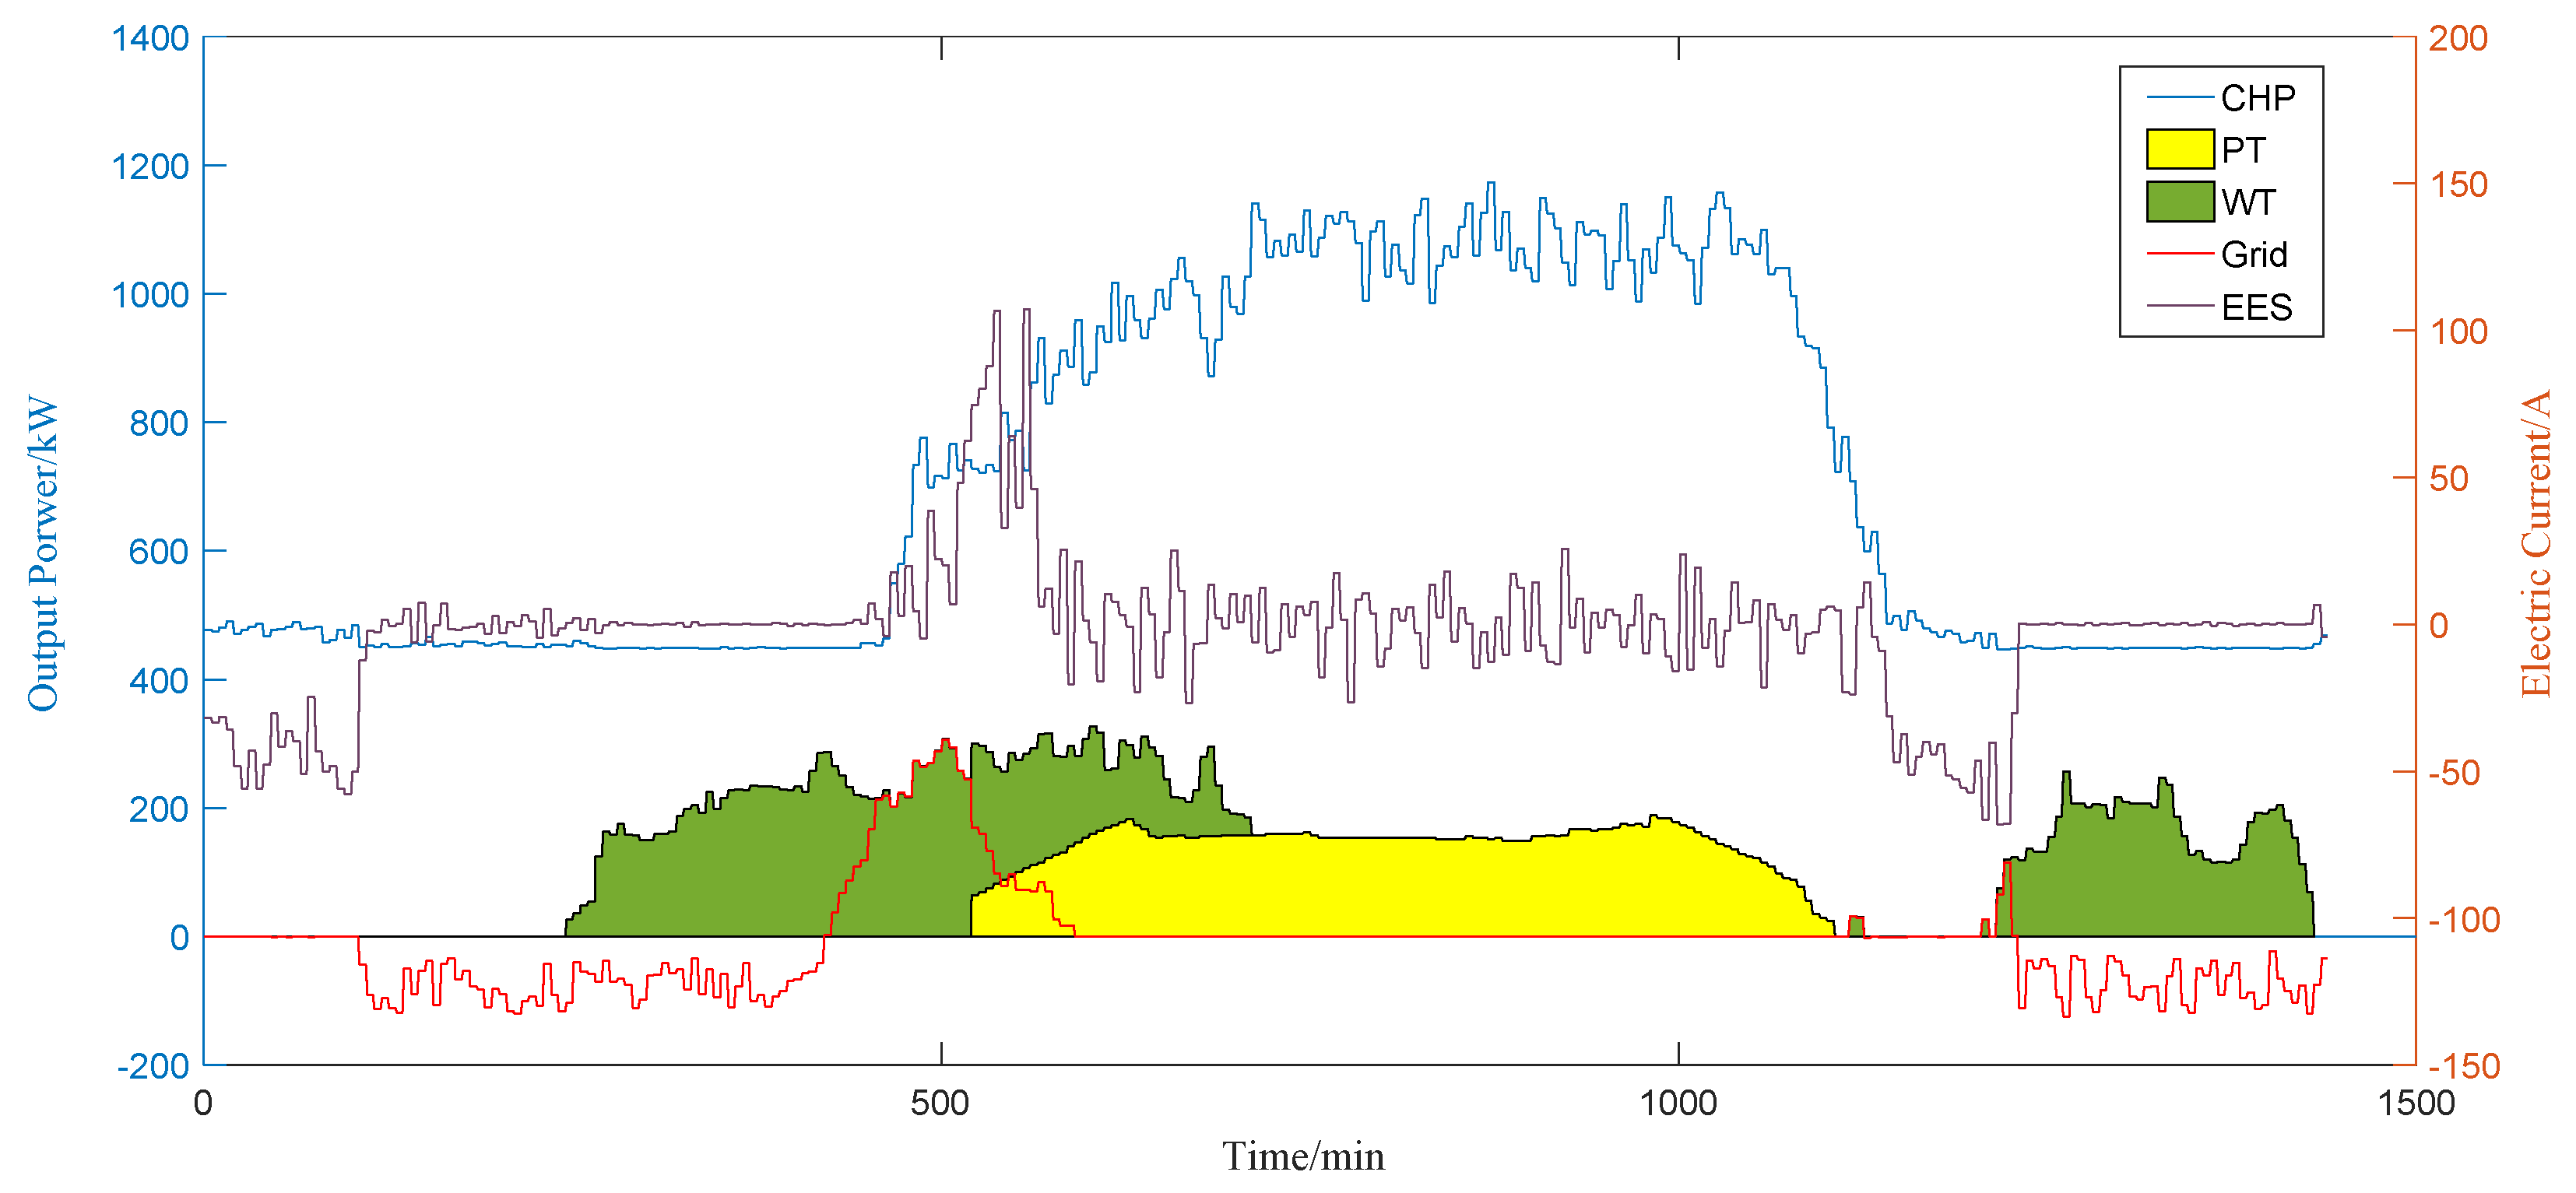
5.2.4. Optimization Result Analysis
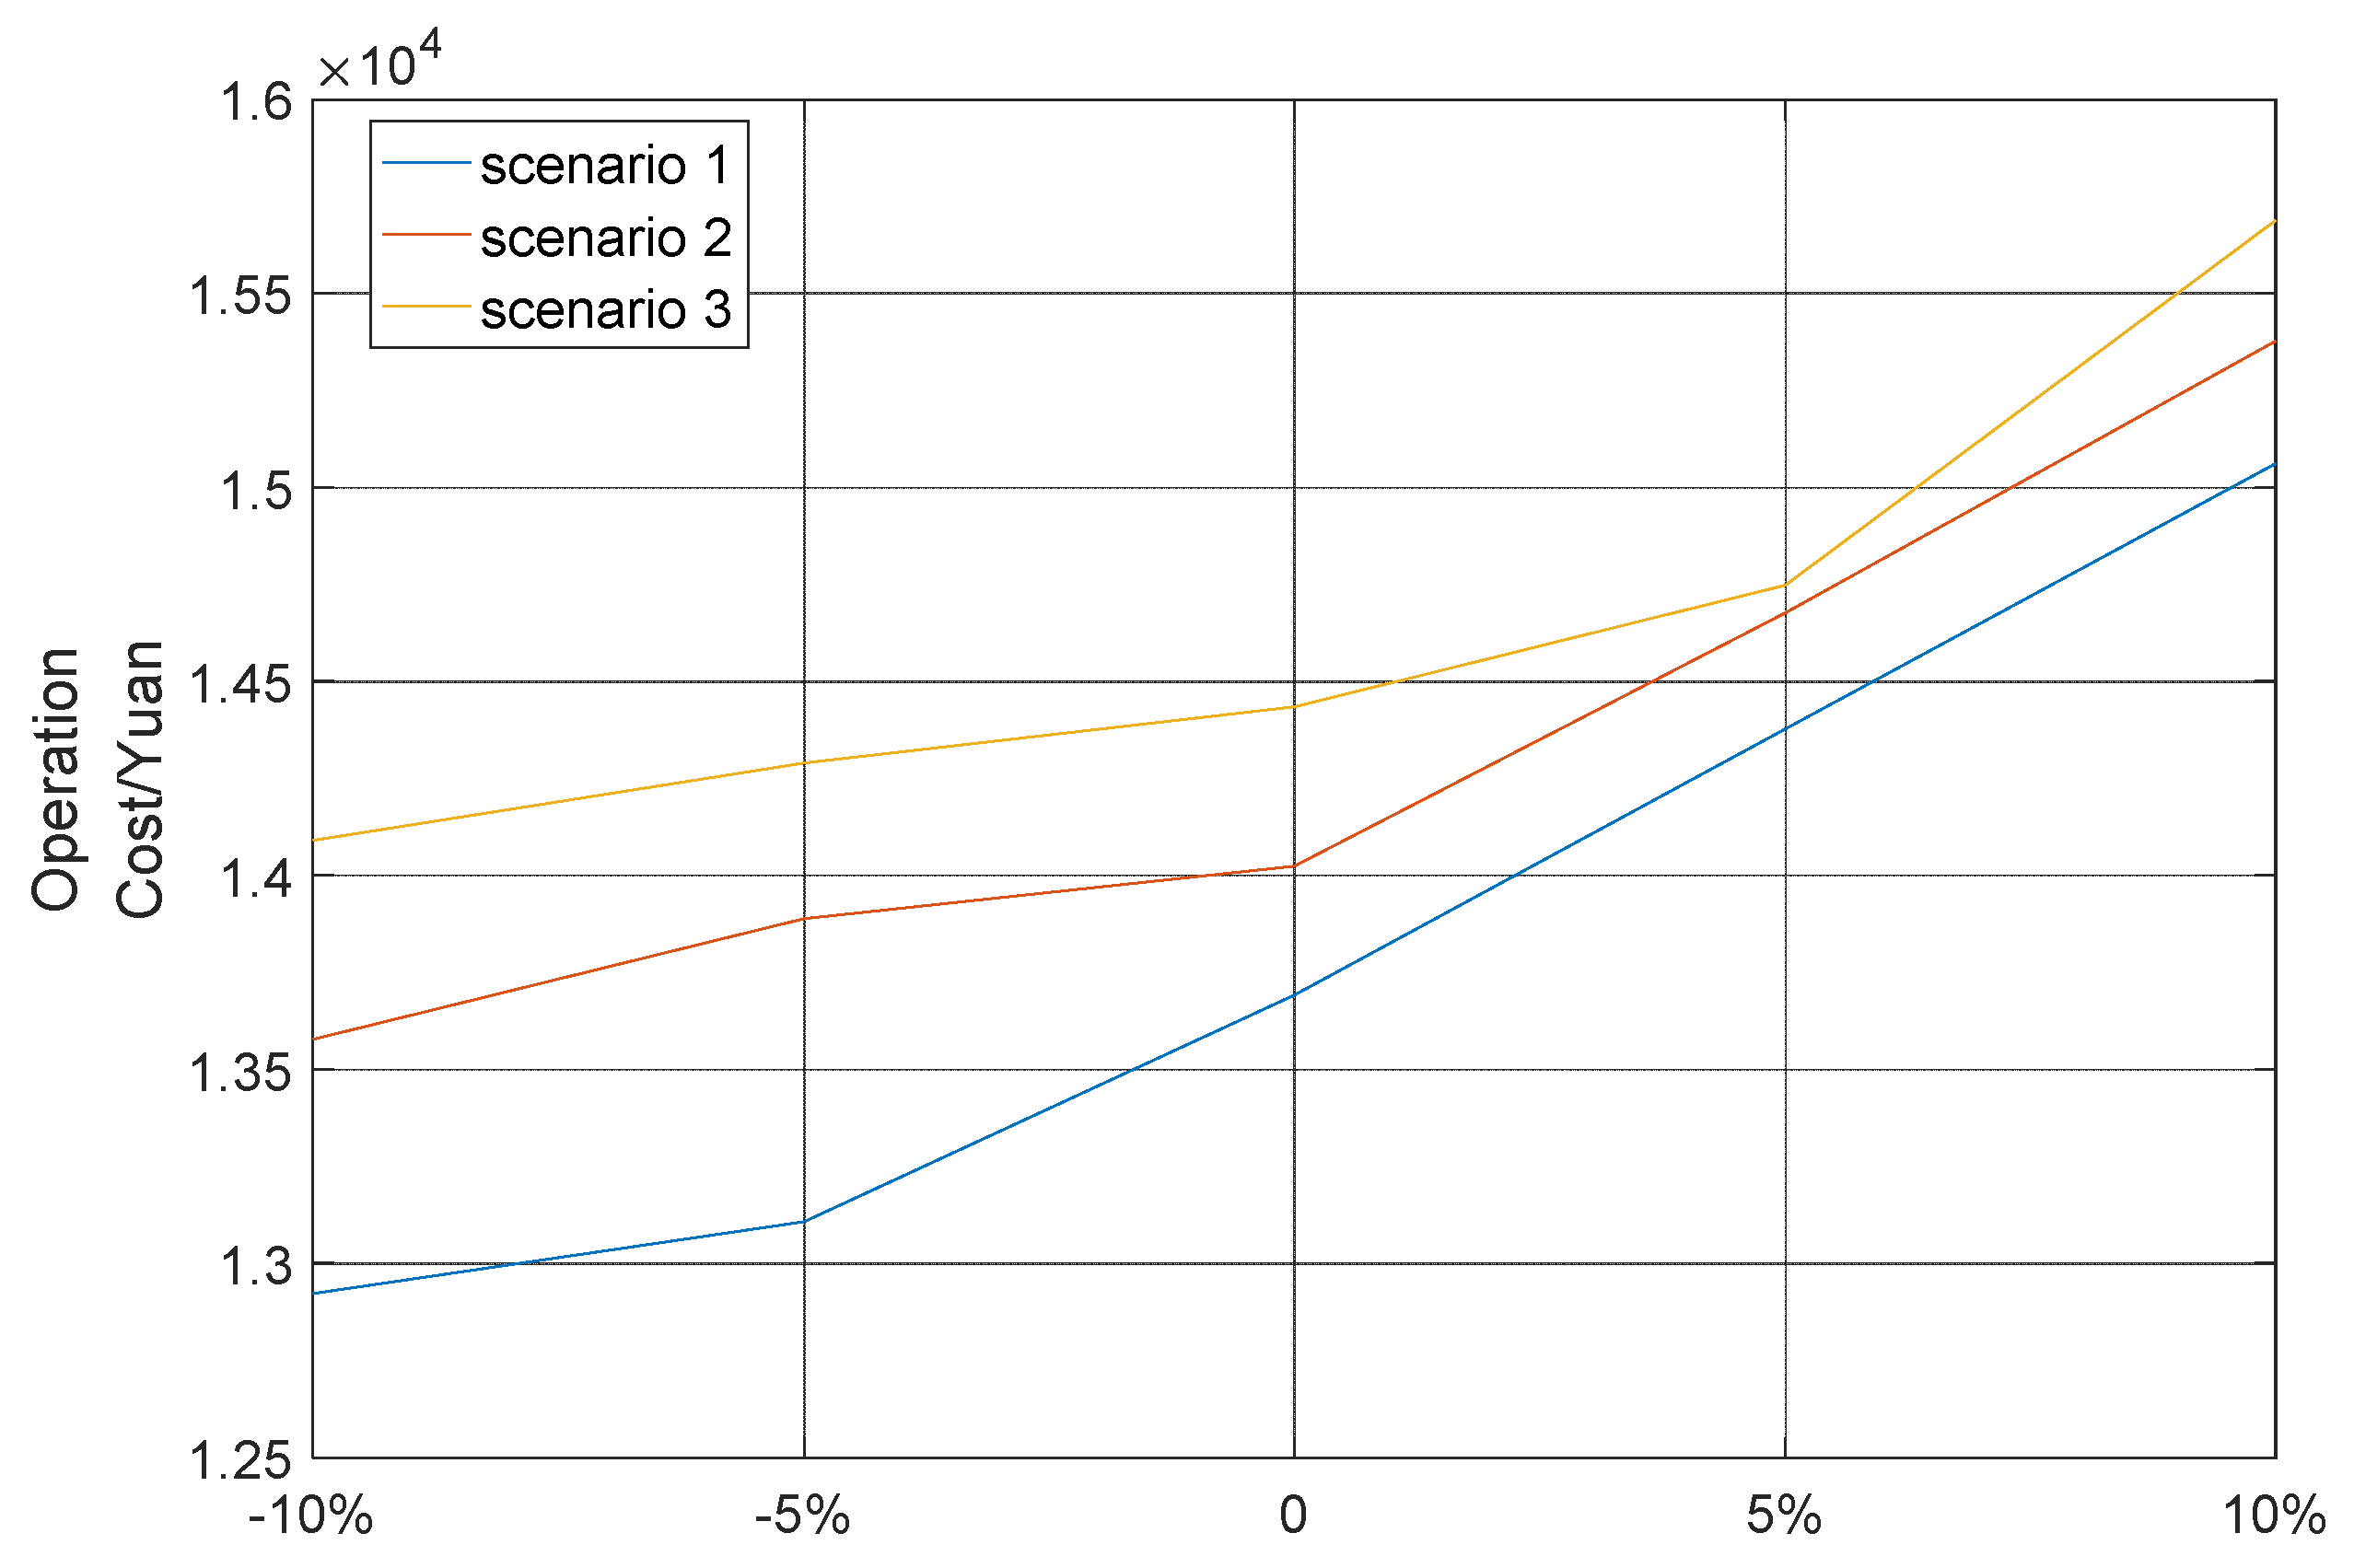
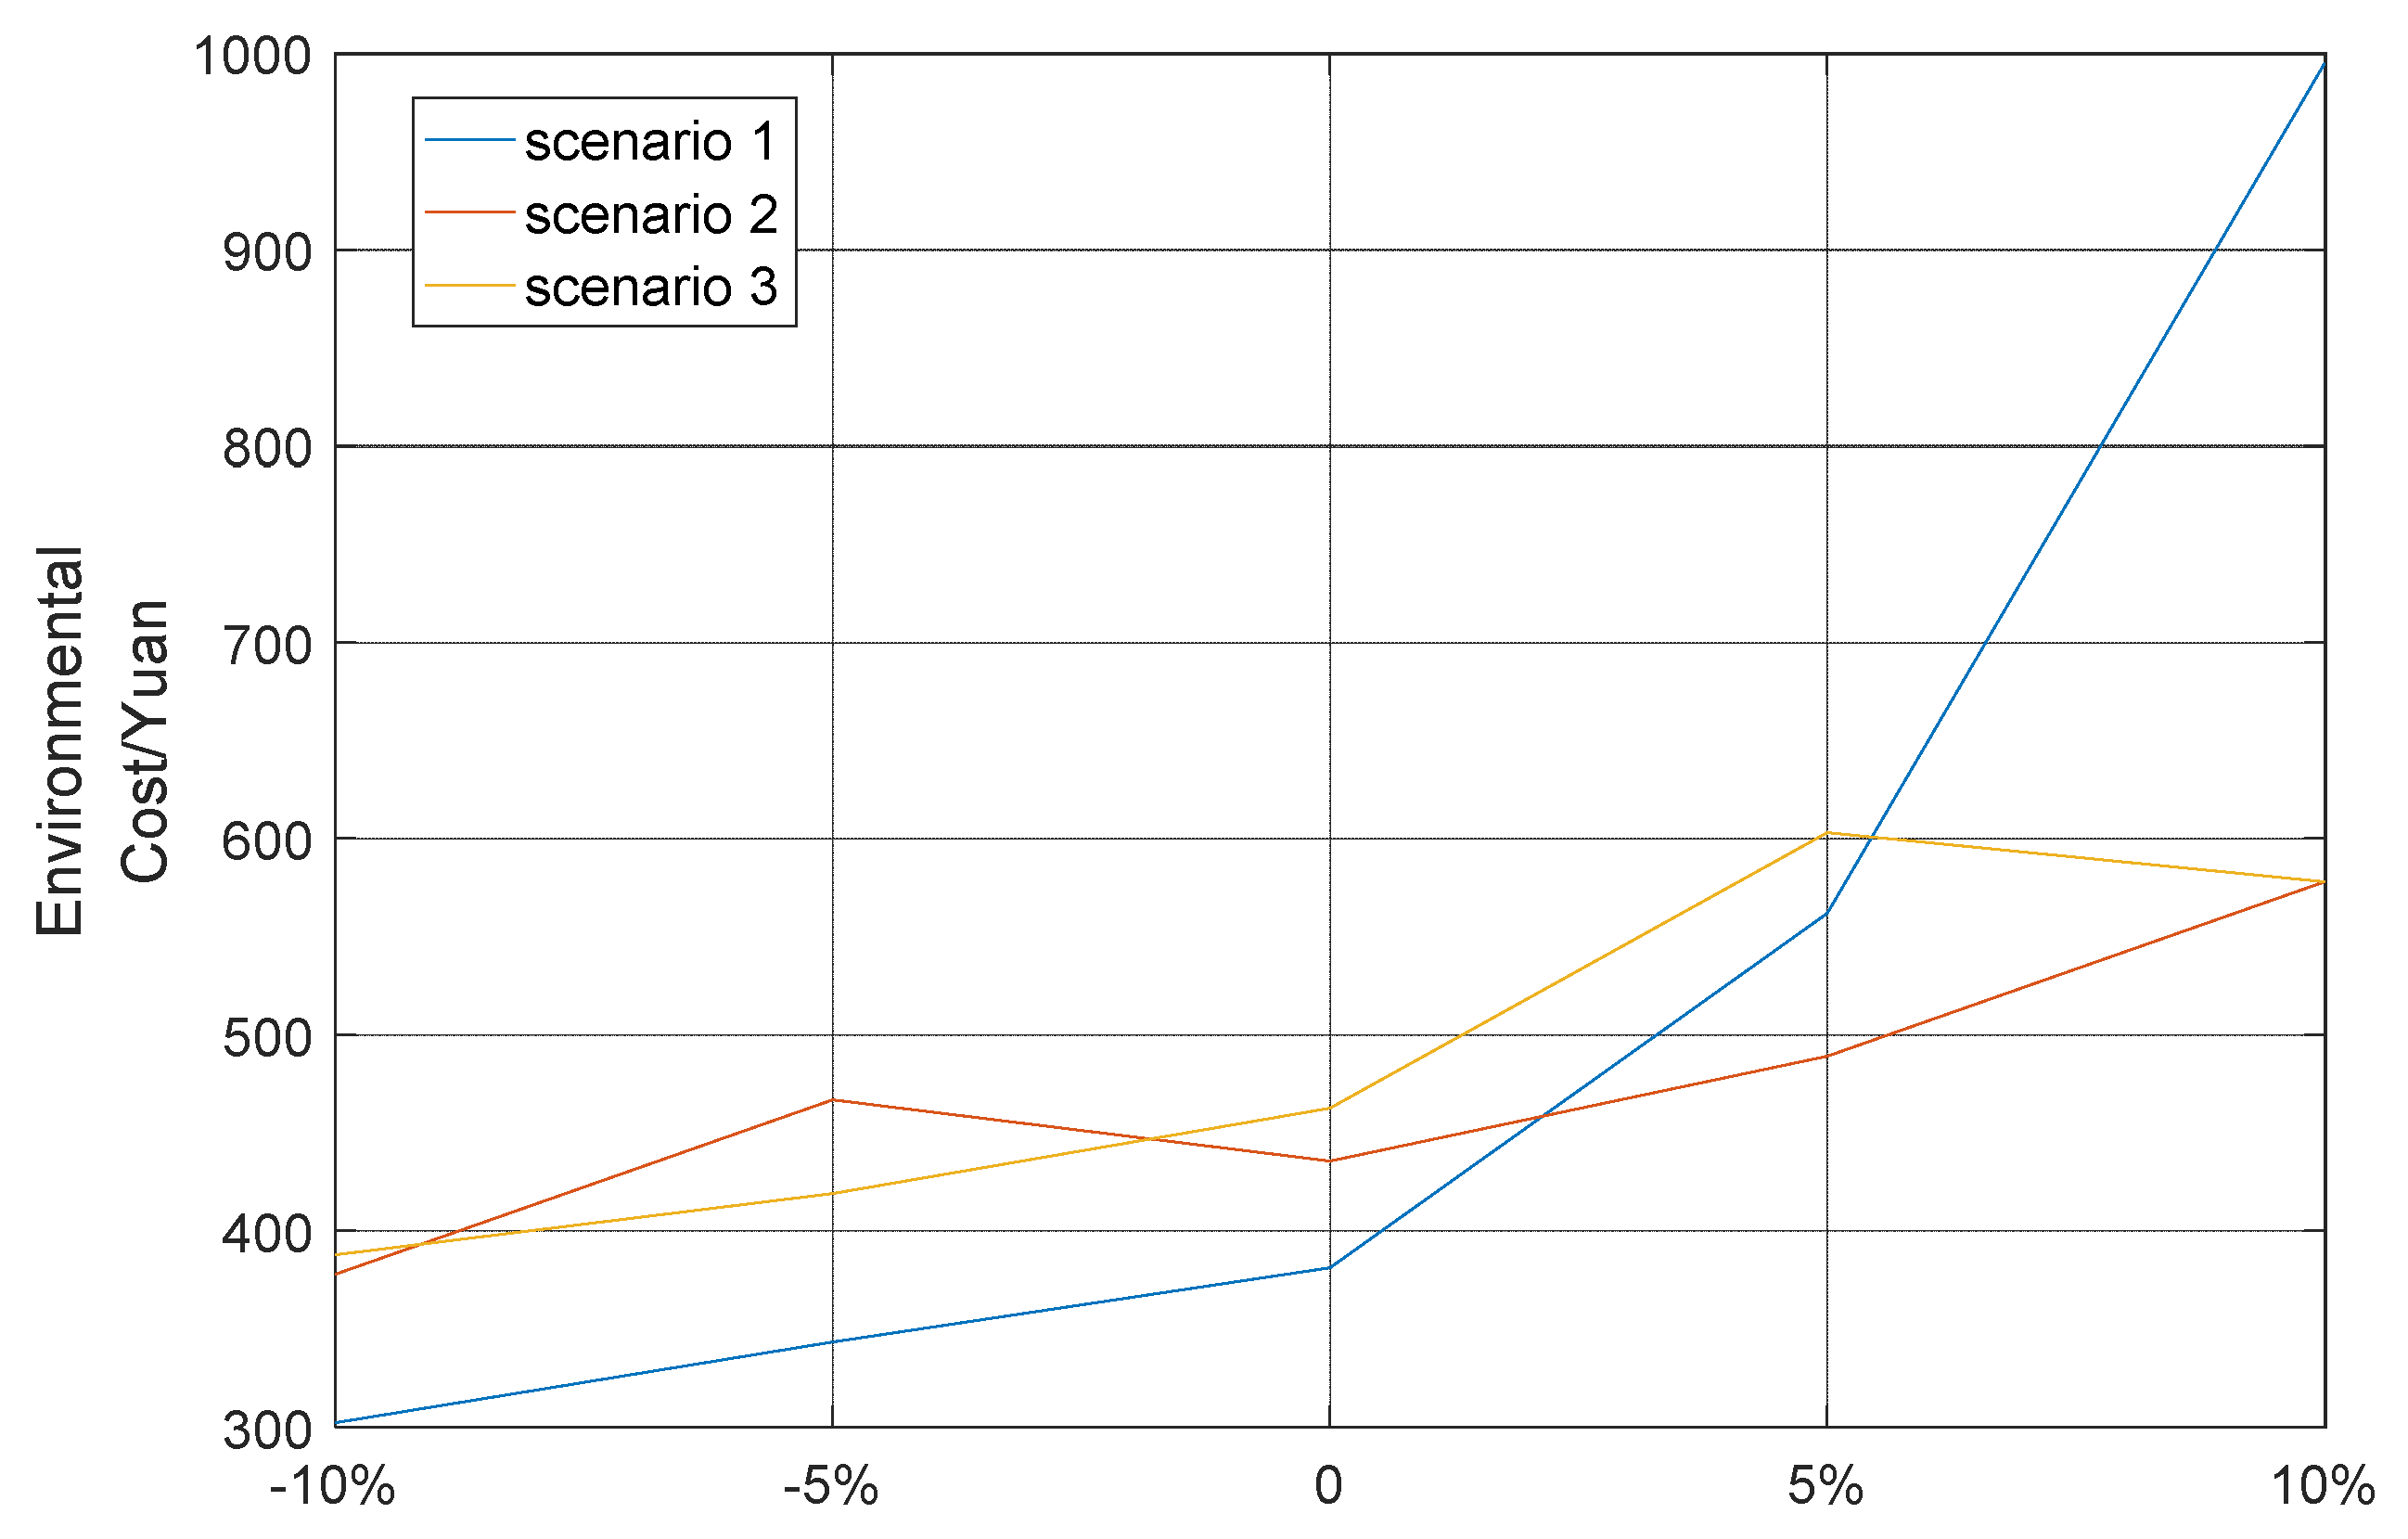
5.2.5. Sensitivity Analysis of Energy Prices
6. Conclusions
- (1)
- In order to solve the problem of system optimization scheduling, an RIES including WT, PV, GT and BESS was introduced. In order to obtain the minimum operation cost, an operation optimization model was built. It is proved that the model proposed in this paper has a certain guiding role for the economical dispatch of RIES;
- (2)
- The MFO algorithm used in this paper has the characteristics of fast solution speed and high precision. It can solve the RIES’s run optimization problem and run optimization issues. The optimal solution is obtained for the 19th time after 100 iterations, and the solution speed is fast, realizing the economic distribution of each micro-source output;
- (3)
- For the results analysis, the operation cost of the GT accounts for a high proportion of the total operating cost of the system, and plays an important part in the solution of the RIES operation optimization model. When BESS is used as a backup power source, the operating cost of the system and the amount of pollutant emissions generated are less than those of DG. Therefore, the use of BESS instead of DG as a backup power source in the RIES is a worthwhile option.
Author Contributions
Funding
Conflicts of Interest
Parameters
| Output power of wind turbine | kW | |
| f(ν) | Probability density of wind power | -- |
| k | Shape parameter in the Weibull distribution | -- |
| c | Scale parameter in the Weibull distribution | -- |
| Cut-in wind speed of wind turbine | m/s | |
| Cut-out wind speed of wind turbine | m/s | |
| Rated wind speed of wind turbine | m/s | |
| Ppν | Output power of PV system | kW |
| Photovoltaic output energy conversion efficiency | 0.9 | |
| Rated power of PV | kW | |
| Power temperature coefficient of PV | 0.0047 °C−1 | |
| Rated module temperature of PV | °C | |
| Actual temperature of PV | °C | |
| Maximum discharge power constraint of battery | kW | |
| Minimum charge state constraint of battery | kW | |
| Charge rate of battery | % | |
| Discharge efficiency of battery | -- | |
| Total capacity of battery | kW·h | |
| Simulation time interval | 5 min | |
| Maximum charge power constraint of battery | -- | |
| Maximum charge state constraint of battery | -- | |
| Total effective throughput of battery | Ah | |
| Number of cycles of battery | time | |
| Rated discharge depth | % | |
| Rated discharge current capacity | Ah | |
| Actual depth of discharge | % | |
| Ampere hours in equivalent discharge current per unit time | Ah | |
| Actual capacity | Ah | |
| Cbat,dep | Depreciation costs in unit of charging and discharging | ¥/kWh |
| Energy storage initial investment cost | ¥ | |
| Total charge | minute | |
| Residual heat of exhaust at t | kJ | |
| Gas turbine output | kJ | |
| Generator efficiency at t | kW | |
| Heat loss coefficient | -- | |
| Consumption per unit time | -- | |
| Low calorific value | Nm3/h | |
| Operating costs of CCHP system | -- | |
| Consumption of the total heat | ¥ | |
| Net calorific power of the natural gas | kJ | |
| Bus tie line exchange power | kJ/Nm3 | |
| Purchase/surplus feed-in tariff | kW | |
| Gas price | ¥ | |
| Gas consumption at t | ¥/m3 | |
| Energy storage depreciation costs | Nm3/h | |
| Number of power generation units | ¥/kWh | |
| Power output of schedulable power generation unit | time | |
| Photovoltaic output power at t | kW | |
| Distributed wind power output at t | kW | |
| Tie-line output at t | kW | |
| Total active load | kW | |
| State of charge | kW | |
| Heat load | kW | |
| Cold load | kW | |
| Scaling factor | kW | |
| Population adaptive variance | -- | |
| Number of population | -- | |
| Mutation operator | -- | |
| Range of the base vectors | -- | |
| Population variation scaling factor | -- | |
| Maximum variation generations | -- | |
| Rated thermoelectric ratio of gas turbine | % |
References
- Wang, Y. The analysis of the impacts of energy consumption on environment and public health in China. Energy 2010, 35, 4473–4479. [Google Scholar] [CrossRef]
- Yüksel, I. Energy production and sustainable energy policies in Turkey. Renew. Energy 2010, 35, 1469–1476. [Google Scholar] [CrossRef]
- Yu, X.; Xu, X.; Chen, S. A brier review to integrated energy system and energy internet. Trans. China Electrotech. Soc. 2016, 31, 1–13. [Google Scholar]
- Dawoud, S.M.; Lin, X.; Okba, M.I. Optimal placement of different types of RDGs based on maximization of microgrid loadability. J. Clean. Prod. 2017, 168, 63–73. [Google Scholar] [CrossRef]
- Li, G.; Wang, R.; Zhang, T.; Ming, M.; Sciubba, E. Multi-Objective Optimal Design of Renewable Energy Integrated CCHP System Using PICEA-g. Energies 2018, 11, 743. [Google Scholar] [CrossRef]
- Liu, Y.; Gao, S.; Zhao, X.; Zhang, C.; Zhang, N. Coordinated Operation and Control of Combined Electricity and Natural Gas Systems with Thermal Storage. Energies 2017, 10, 917. [Google Scholar] [CrossRef]
- Han, L.; Wang, F.; Tian, C. Economic Evaluation of Actively Consuming Wind Power for an Integrated Energy System Based on Game Theory. Energies 2018, 11, 1476. [Google Scholar] [CrossRef]
- Ahmad, A.; Khan, A.; Javaid, N.; Hussain, H.M.; Abdul, W.; Almogren, A.; Alamri, A.; Niaz, I.A. An Optimized Home Energy Management System with Integrated Renewable Energy and Storage Resources. Energies 2017, 10, 549. [Google Scholar] [CrossRef]
- Green Left Weekly. Turnbull, Carr to Launch 100% Renewables Plan for Australia; Green Left Weekly: Melbourne, VIC, Australia, 2010. [Google Scholar]
- Lynas, M. New IPCC Error: Renewables Report Conclusion Was Dictated by Greenpeace; Mark Lynas: Oxford, UK, 2011. [Google Scholar]
- Jacobson, M.Z.; Delucchi, M.A. A Plan to Power 100 Percent of the Planet with Renewables; Scientific American: New York, NY, USA, 2009. [Google Scholar]
- Mago, P.J.; Fumo, N.; Chamra, L.M. Performance analysis of CCHP and CHP systems operating following the thermal and electric load. Int. J. Energy Res. 2009, 33, 852–864. [Google Scholar] [CrossRef]
- Wang, L.; Li, Q.; Ding, R.; Sun, M.; Wang, G. Integrated scheduling of energy supply and demand in microgrids under uncertainty: A robust multi-objective optimization approach. Energy 2017, 130, 1–14. [Google Scholar] [CrossRef]
- Zerrahn, A.; Schill, W.P.; Kemfert, C. On the economics of electrical storage for variable renewable energy sources. arXiv 2018, arXiv:1802.07885. [Google Scholar] [CrossRef]
- Liu, D.; Ma, H.; Wang, B.; Gao, W.; Wang, J.; Yan, B. Operation Optimization of Regional Integrated Energy System with CCHP and Energy Storage System. Autom. Electr. Power Syst. 2017, 41, 33–40. [Google Scholar]
- Grantham, A.; Pudney, P.; Ward, L.A.; Whaley, D.; Boland, J. The viability of electrical energy storage for low-energy households. Sol. Energy 2017, 155, 1216–1224. [Google Scholar] [CrossRef]
- Hu, Y.; Li, Y.; Xu, M.; Zhou, L.; Cui, M. A Chance-Constrained Economic Dispatch Model in Wind-Thermal-Energy Storage System. Energies 2017, 10, 326. [Google Scholar] [CrossRef]
- Ma, H.; Wang, B.; Gao, W.; Liu, D.; Sun, Y.; Liu, Z. Optimal Scheduling of an Regional Integrated Energy System with Energy Storage Systems for Service Regulation. Energies 2018, 11, 195. [Google Scholar] [CrossRef]
- Denholm, P.; Hand, M. Grid flexibility and storage required to achieve very high penetration of variable renewable electricity. Energy Policy 2011, 39, 1817–1830. [Google Scholar] [CrossRef]
- Choudhury, S.; Bhowmik, P.; Rout, P.K. Economic Load Sharing in a D-STATCOM Integrated Islanded Microgrid based on Fuzzy Logic and Seeker Optimization Approach. Sustain. Cities Soc. 2017, 37, 57–69. [Google Scholar] [CrossRef]
- Lorestani, A.; Ardehali, M.M. Optimization of autonomous combined heat and power system including PVT, WT, storages, and electric heat utilizing novel evolutionary particle swarm optimization algorithm. Renew. Energy 2018, 119, 490–503. [Google Scholar] [CrossRef]
- Mirjalili, S. Moth-Flame Optimization Algorithm: A Novel Nature-inspired Heuristic Paradigm. Knowl.-Based Syst. 2015, 89, 228–249. [Google Scholar] [CrossRef]


| WT | PV | CHP | BESS | Electric Load | |
|---|---|---|---|---|---|
| Capacity | 300 kW | 400 kW | 1.5 MW | 300 kWh | 667 kW |
| Type | Price (¥/kWh‚ ¥/m3) | ||
|---|---|---|---|
| Trough Period 0:00~6:00 18:00~24:00 | Stationary 6:00~10:00 15:00~18:00 | Peak Period 10:00~15:00 | |
| Buying electricity price | 0.5522 | 0.8185 | 1.2035 |
| Selling electricity price | 0.65 | 0.65 | 0.65 |
| Buying gas price | 3.16 | ||
| Parameter | Figure |
|---|---|
| Rated capacity/(kW·h) | 300 |
| Maximum charge discharge power /kW | 65 |
| State of charge (SOC) operating range | 0.25~0.95 |
| SOC overcharge protection threshold | 0.9 |
| Charge discharge conversion efficiency/% | 90% |
| Self-discharge rate/(%·s−1) | 0.001 |
| Lifetime | 5~15 |
| Cycle index | 3000 (90%DOD) |
| Parameter | Value Under Different Operating Conditions | ||
|---|---|---|---|
| Load factor/% | 100 | 75 | 50 |
| Electric power/kW | 1490 | 1118 | 742 |
| Output power/kW | 1528 | 1146 | 765 |
| Power factor | 1 | 1 | 1 |
| Voltage/V | 400 | 399 | 403 |
| Current/A | 2146 | 1613 | 1064 |
| Frequency/Hz | 50 | 50 | 50 |
| Pollutants | SO2 | NOx | CO2 | CO | |
|---|---|---|---|---|---|
| Emission | Coal (kg/t) | 18 | 8 | 1731 | 0.26 |
| Gas (kg/106m3) | 11.6 | 0.0062 | 2.01 | 0 | |
| Environmental value (yuan/kg) | 6.00 | 8.00 | 0.023 | 1.00 | |
| Cost/Yuan | Generation Cost/Yuan | Environmental Cost/Yuan | Operation Cost/Yuan | |||||
|---|---|---|---|---|---|---|---|---|
| CHP | ESS | WT | PV | Electricity Exchange | ||||
| Purchase | Sell | |||||||
| Scenario 1 | 12,690.6 | 331.04 | 979.68 | 364.38 | 491.89 | −1546.4 | 381.42 | 13,692.61 |
| Scenario 2 | 12,882 | 264.88 | 979.68 | 364.38 | 459.54 | −1315.8 | 390.09 | 14,024.77 |
| Scenario 3 | 13,037 | 200.75 | 979.68 | 364.38 | 407.48 | −1016.2 | 462.38 | 14,435.47 |
| Cost/Yuan | Generation Cost/Yuan | Environmental Cost/Yuan | Operation Cost/Yuan | |||||
|---|---|---|---|---|---|---|---|---|
| CHP | DG | WT | PV | Electricity Exchange | ||||
| Purchase | Sell | |||||||
| Scenario 1 | 12,760 | 550.65 | 979.68 | 364.38 | 245 | −870 | 541.6164 | 14,571.3 |
| Scenario 2 | 12,559 | 704.58 | 979.68 | 364.38 | 256 | −993 | 557.8287 | 14,428.47 |
| Scenario 3 | 12,648 | 834.221 | 979.68 | 364.38 | 279 | −1190 | 619.5892 | 14,534.87 |
© 2018 by the authors. Licensee MDPI, Basel, Switzerland. This article is an open access article distributed under the terms and conditions of the Creative Commons Attribution (CC BY) license (http://creativecommons.org/licenses/by/4.0/).
Share and Cite
Li, J.; Niu, D.; Wu, M.; Wang, Y.; Li, F.; Dong, H. Research on Battery Energy Storage as Backup Power in the Operation Optimization of a Regional Integrated Energy System. Energies 2018, 11, 2990. https://doi.org/10.3390/en11112990
Li J, Niu D, Wu M, Wang Y, Li F, Dong H. Research on Battery Energy Storage as Backup Power in the Operation Optimization of a Regional Integrated Energy System. Energies. 2018; 11(11):2990. https://doi.org/10.3390/en11112990
Chicago/Turabian StyleLi, Jianfeng, Dongxiao Niu, Ming Wu, Yongli Wang, Fang Li, and Huanran Dong. 2018. "Research on Battery Energy Storage as Backup Power in the Operation Optimization of a Regional Integrated Energy System" Energies 11, no. 11: 2990. https://doi.org/10.3390/en11112990
APA StyleLi, J., Niu, D., Wu, M., Wang, Y., Li, F., & Dong, H. (2018). Research on Battery Energy Storage as Backup Power in the Operation Optimization of a Regional Integrated Energy System. Energies, 11(11), 2990. https://doi.org/10.3390/en11112990