Research on Control Technologies for a High-Precision Multi-Source Vibration Simulation System

Abstract
:1. Introduction
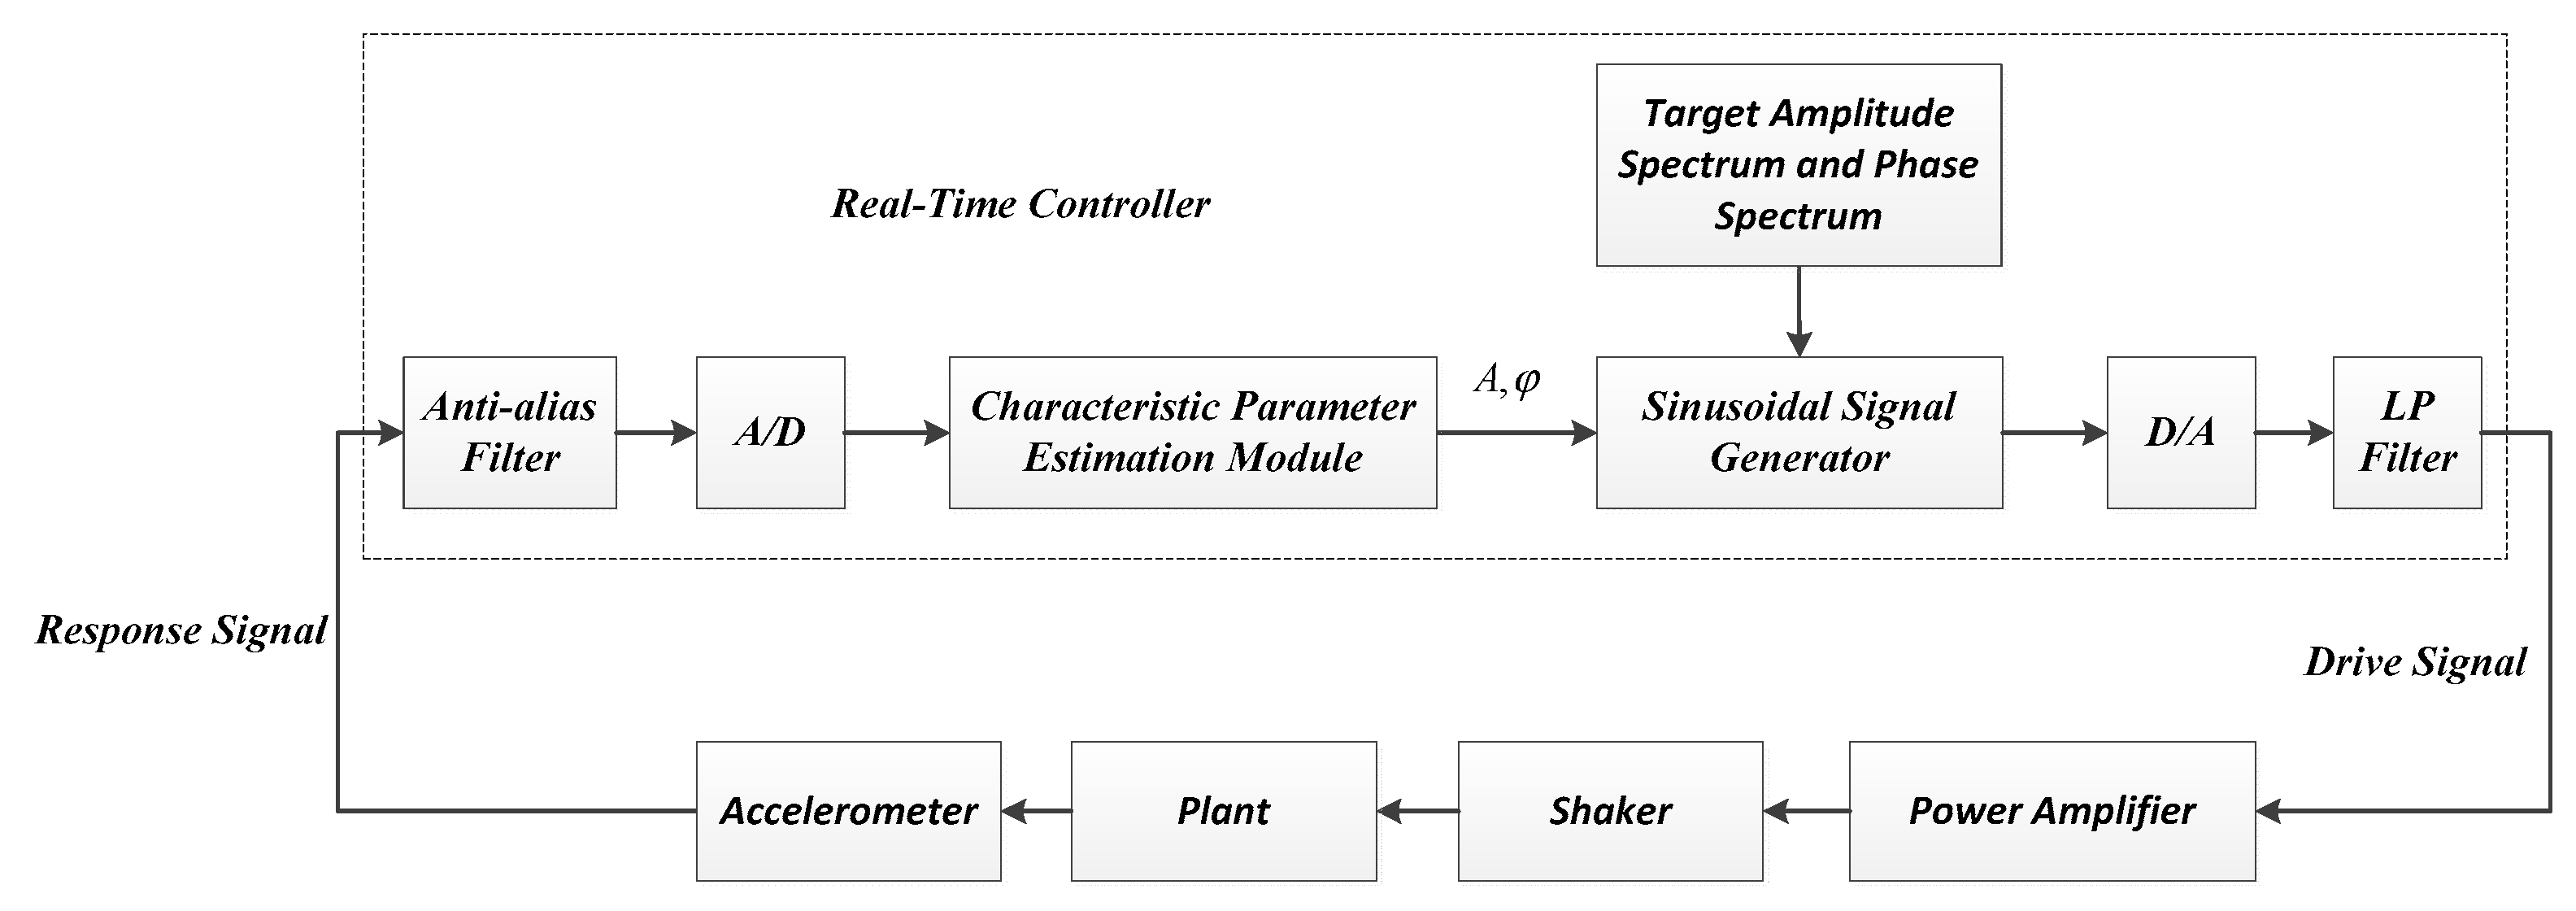
2. Drive Synthesis for Multi-Source Excitation
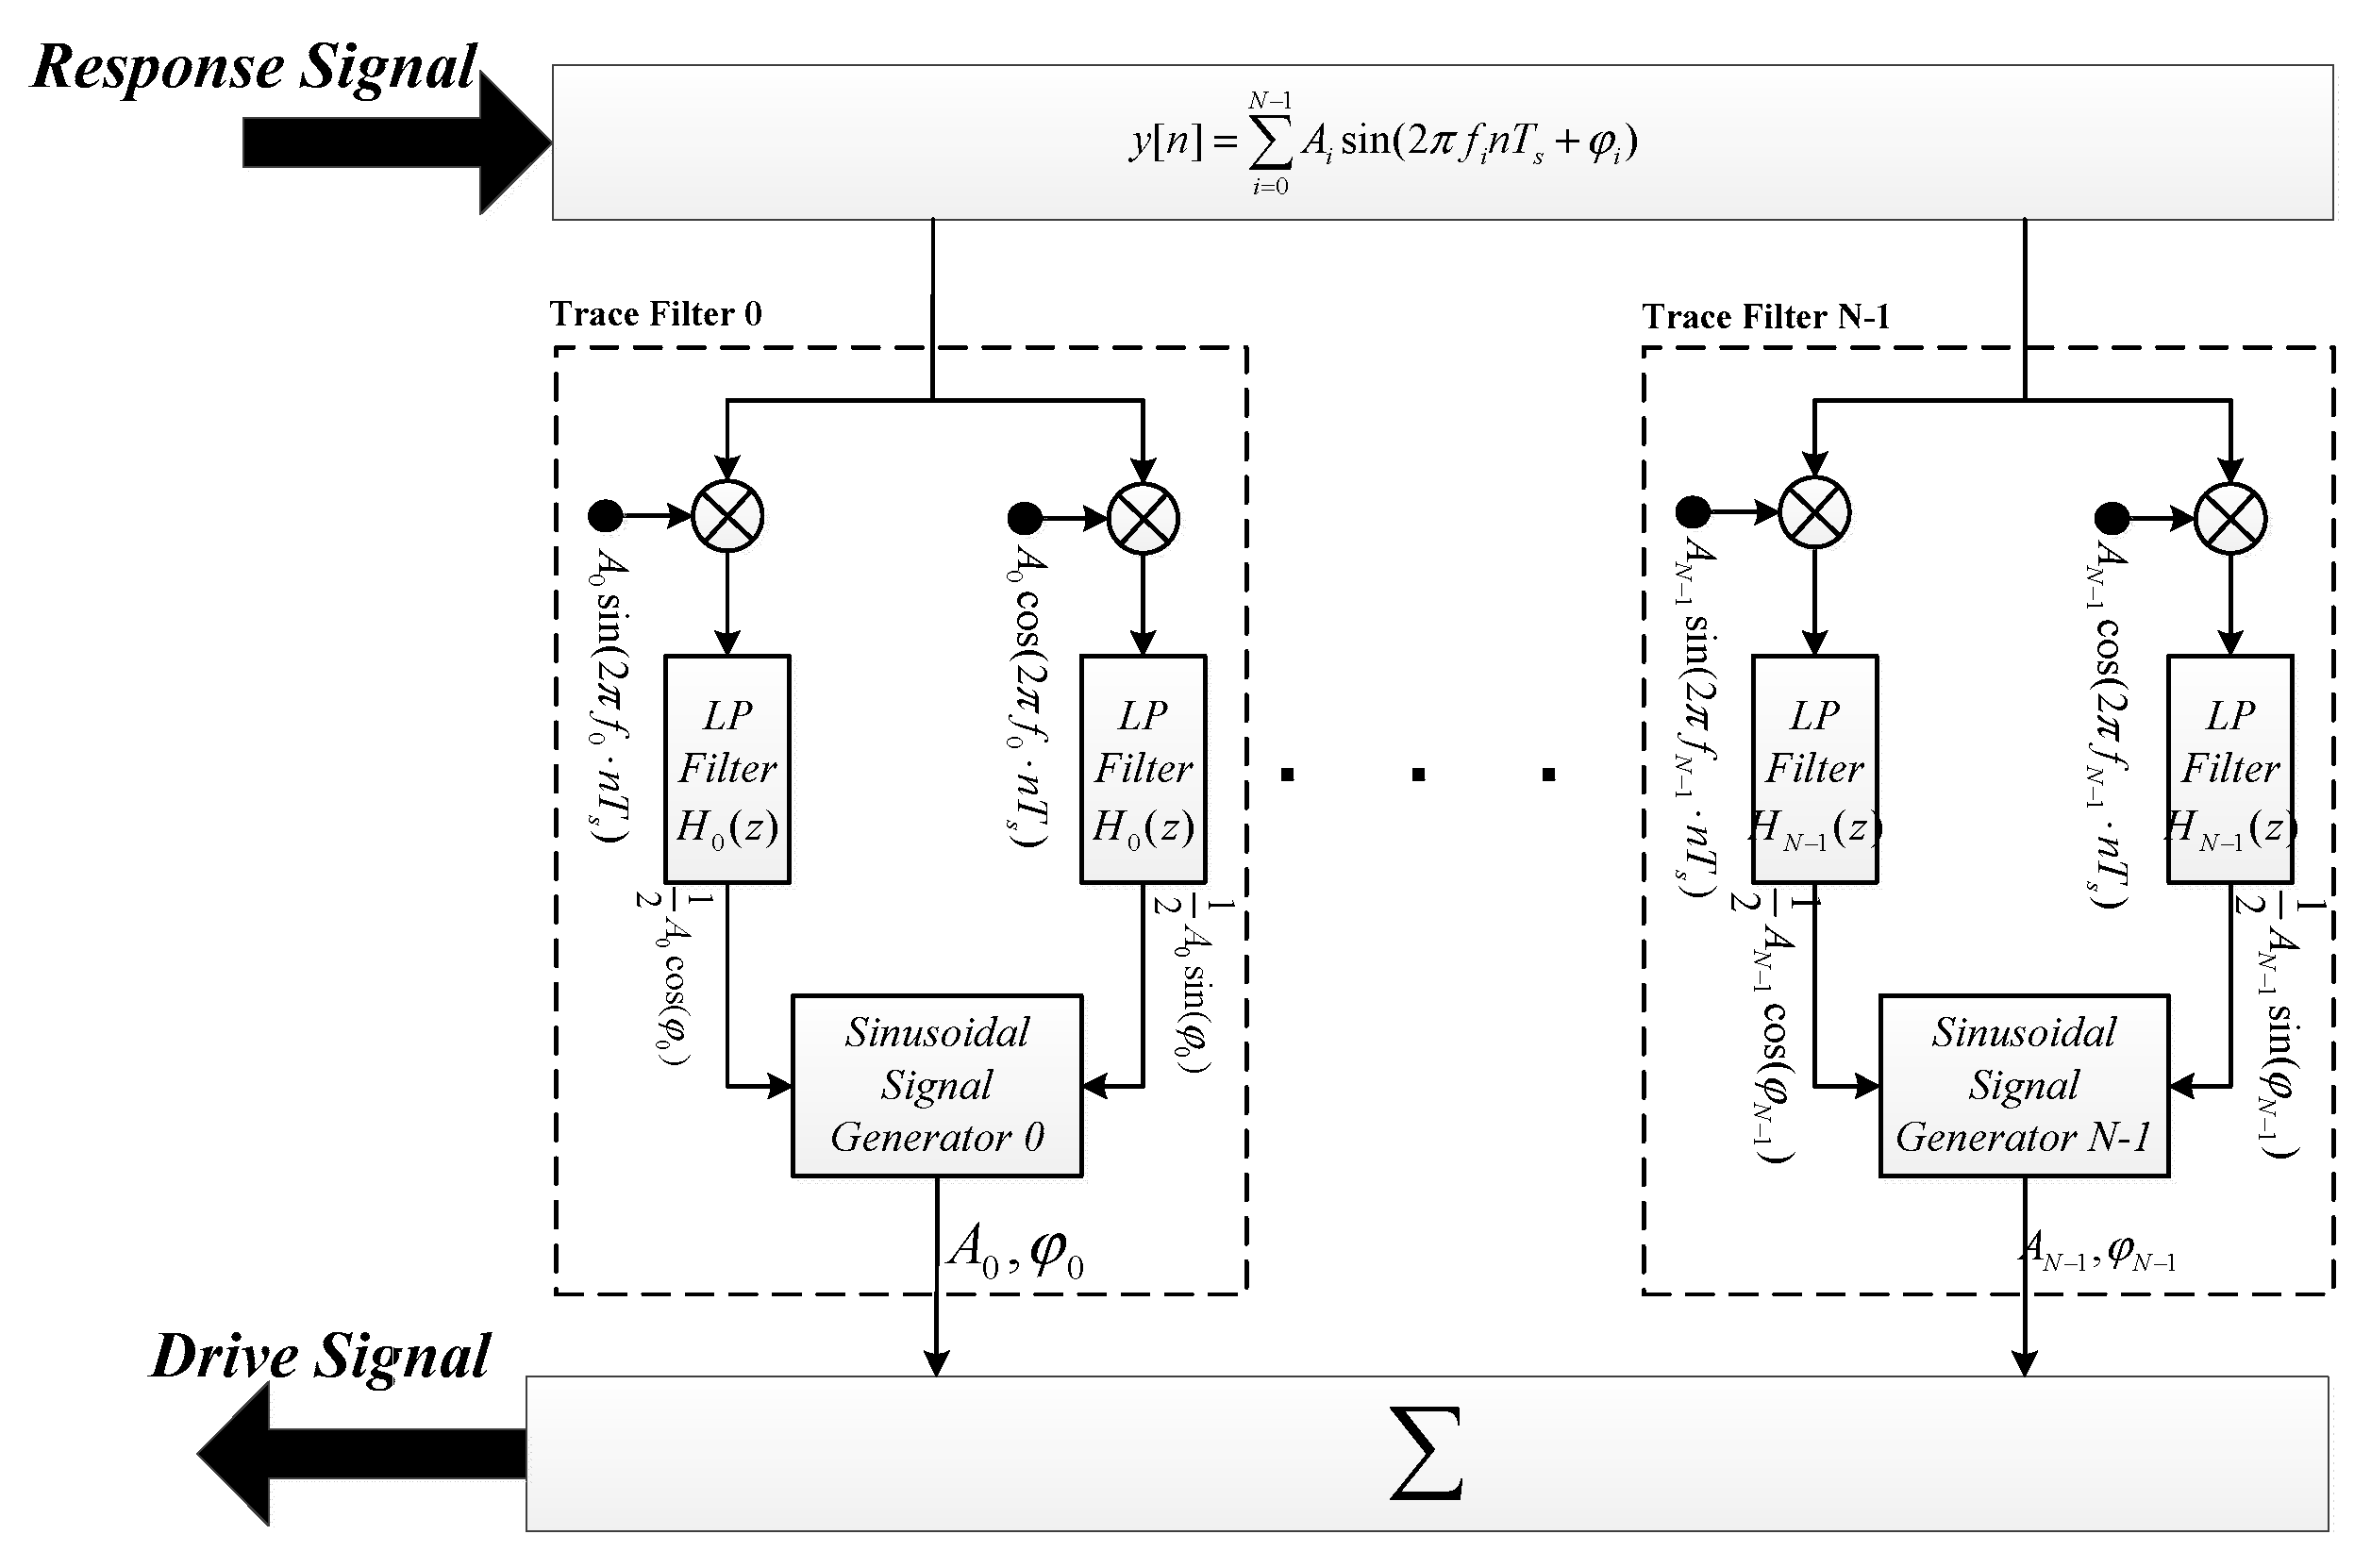
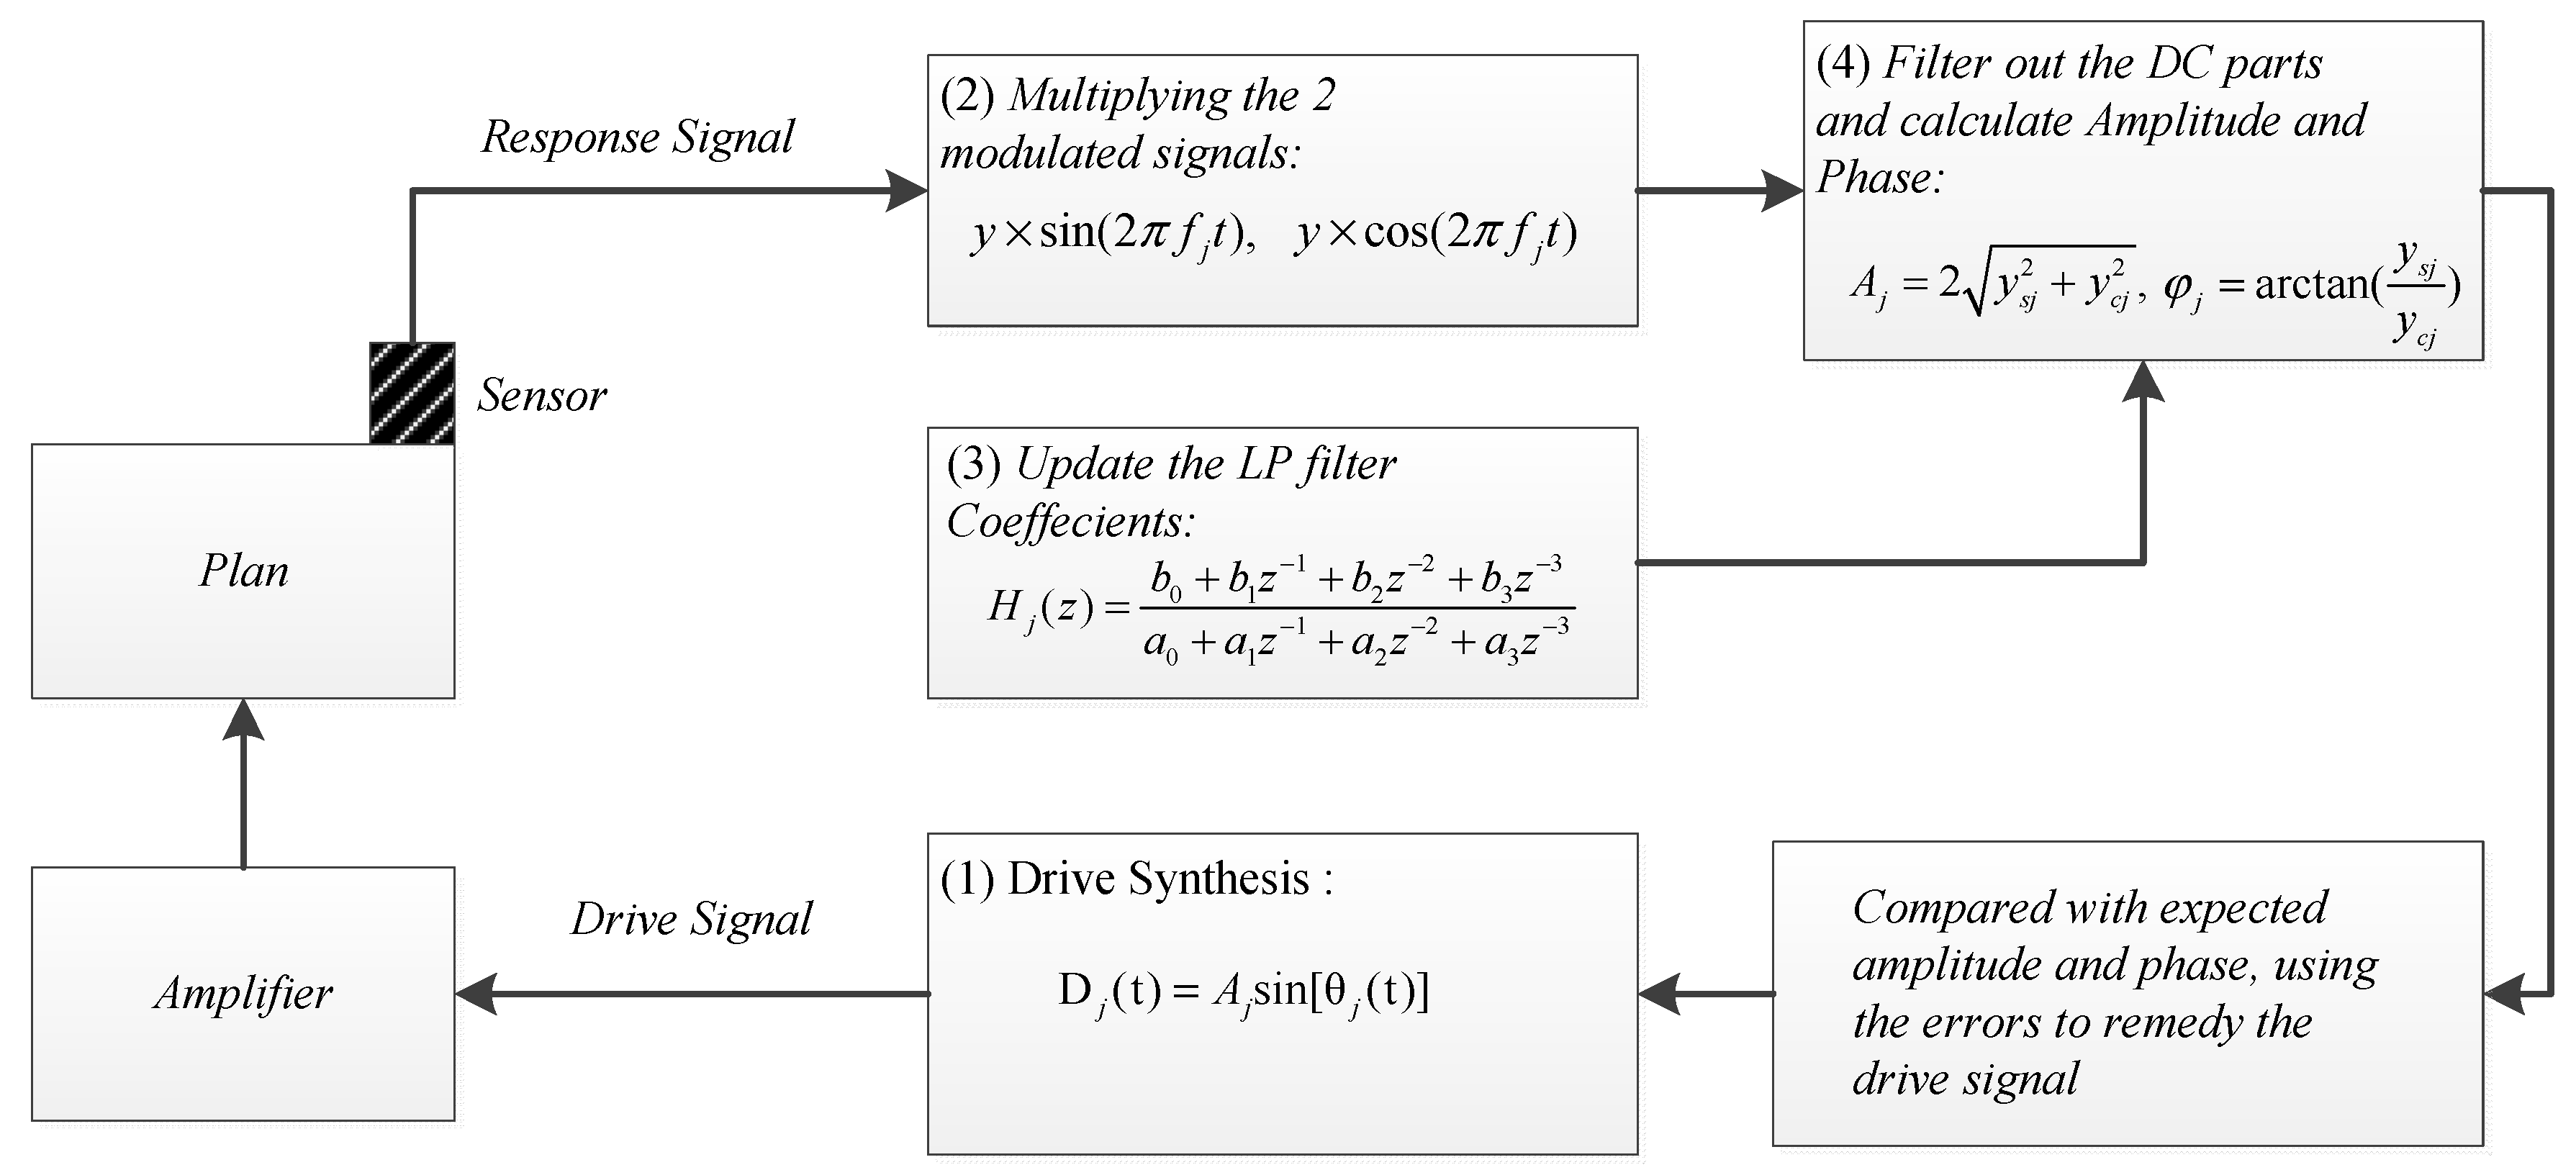
3. Estimation Algorithms for Amplitude and Phase
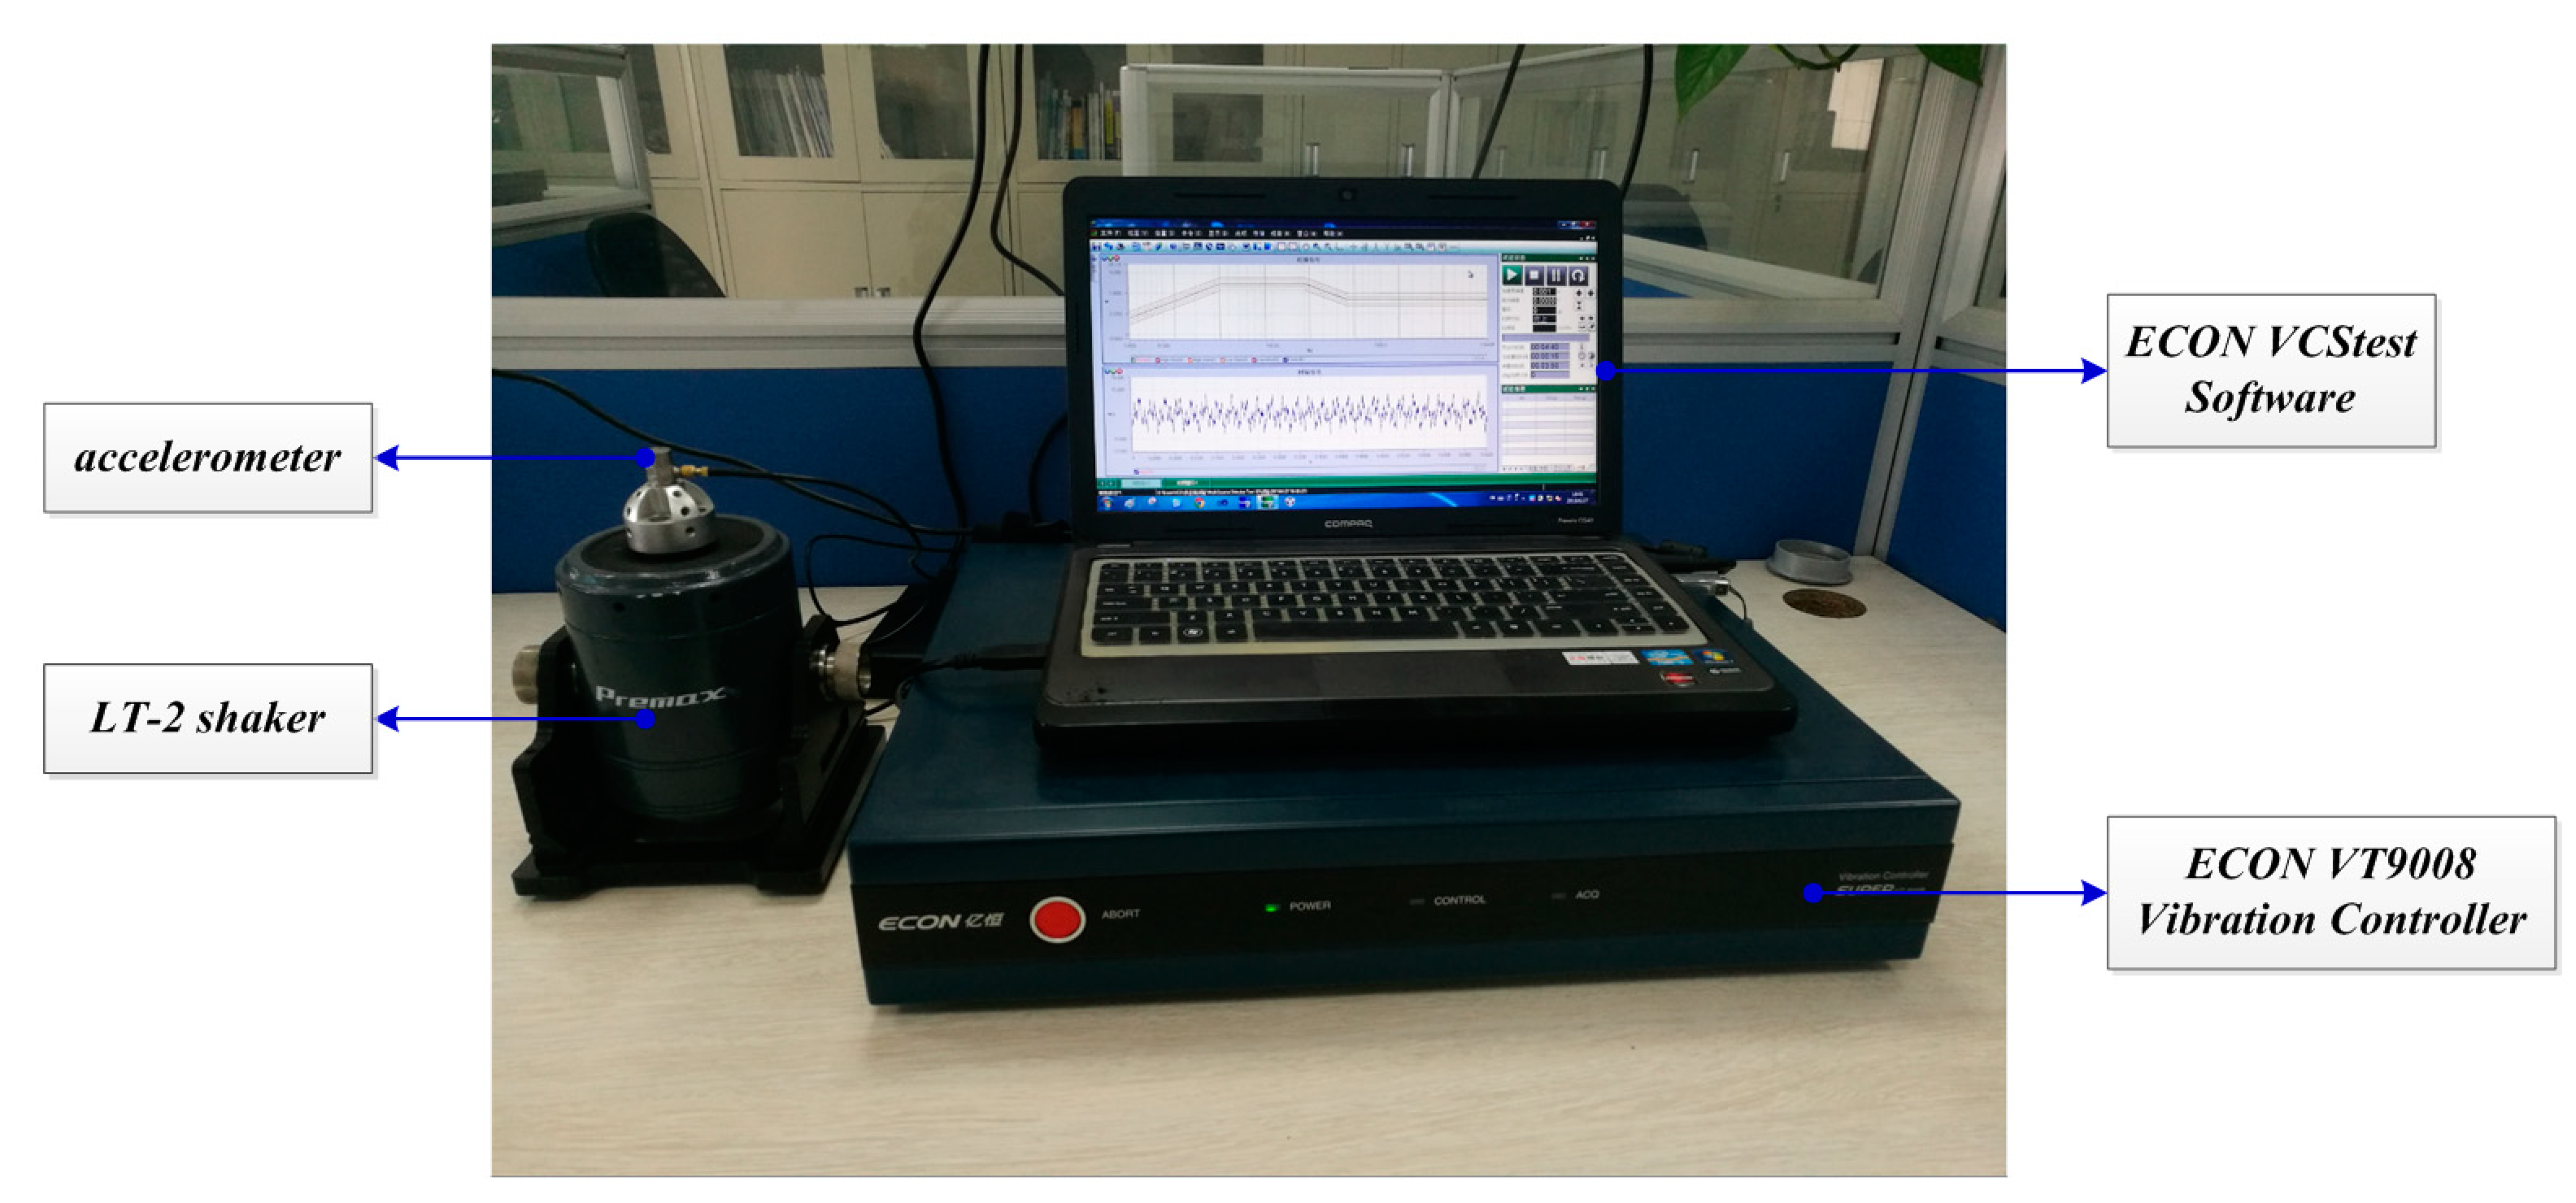
4. Experiments
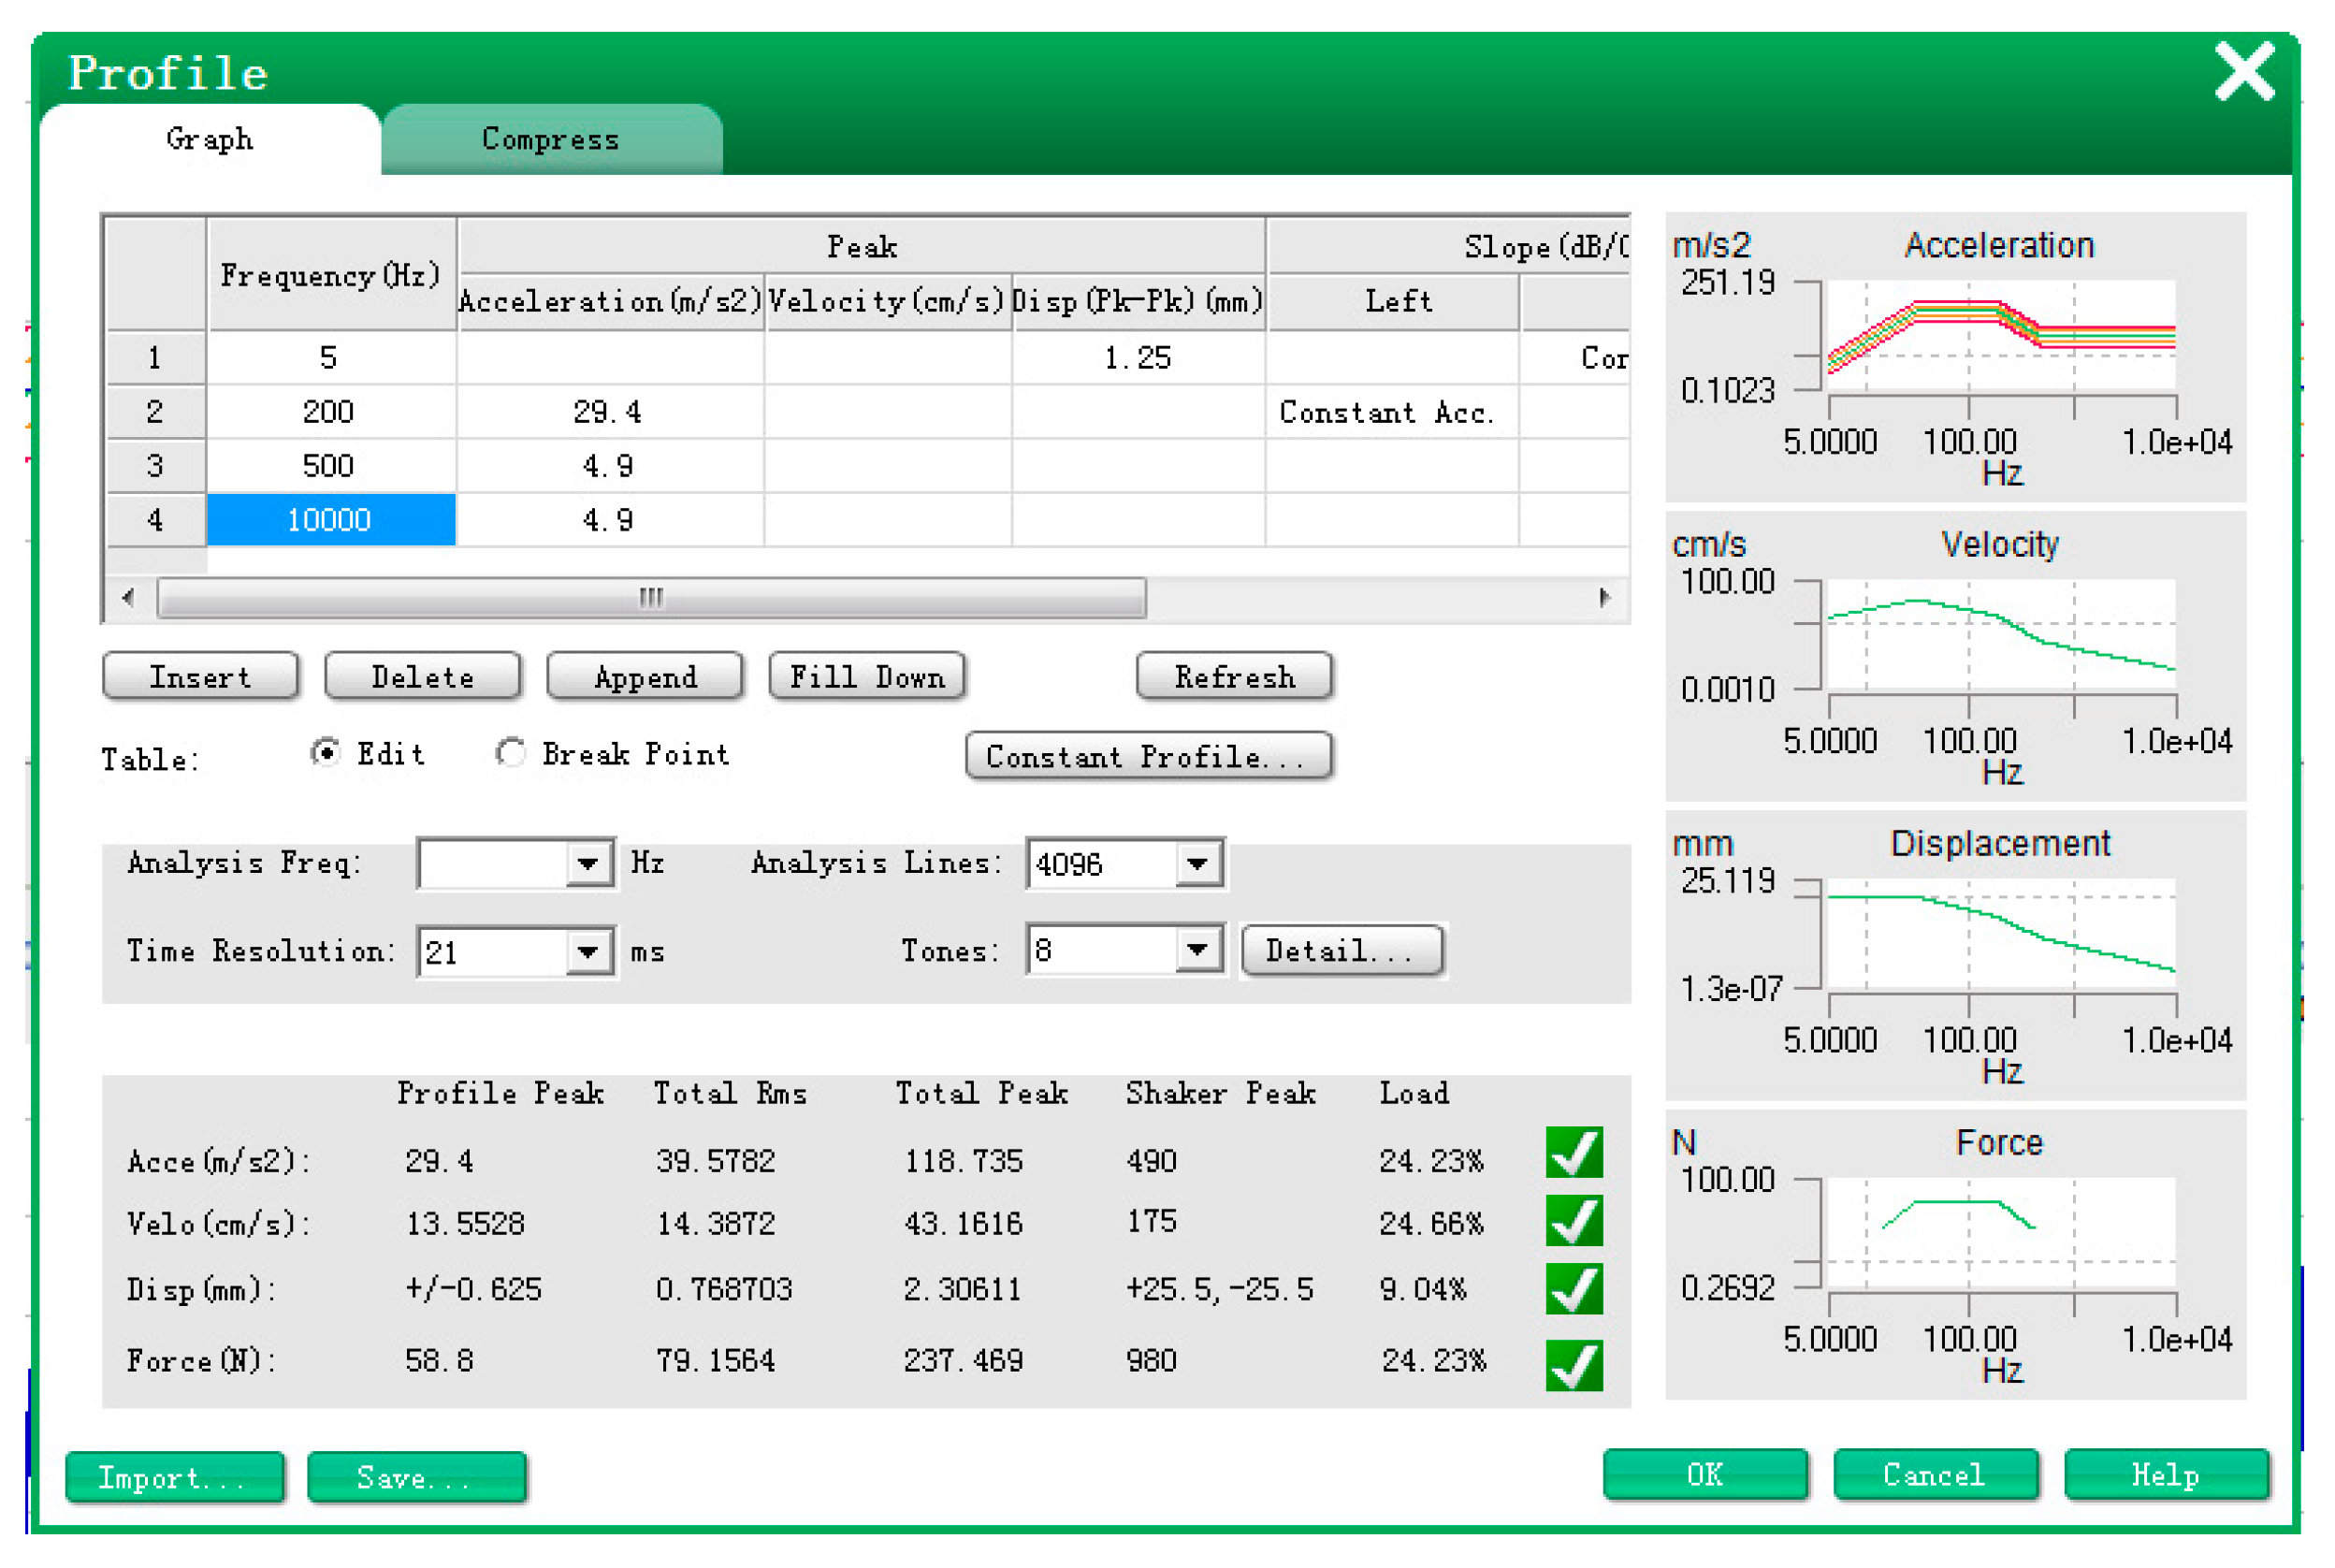
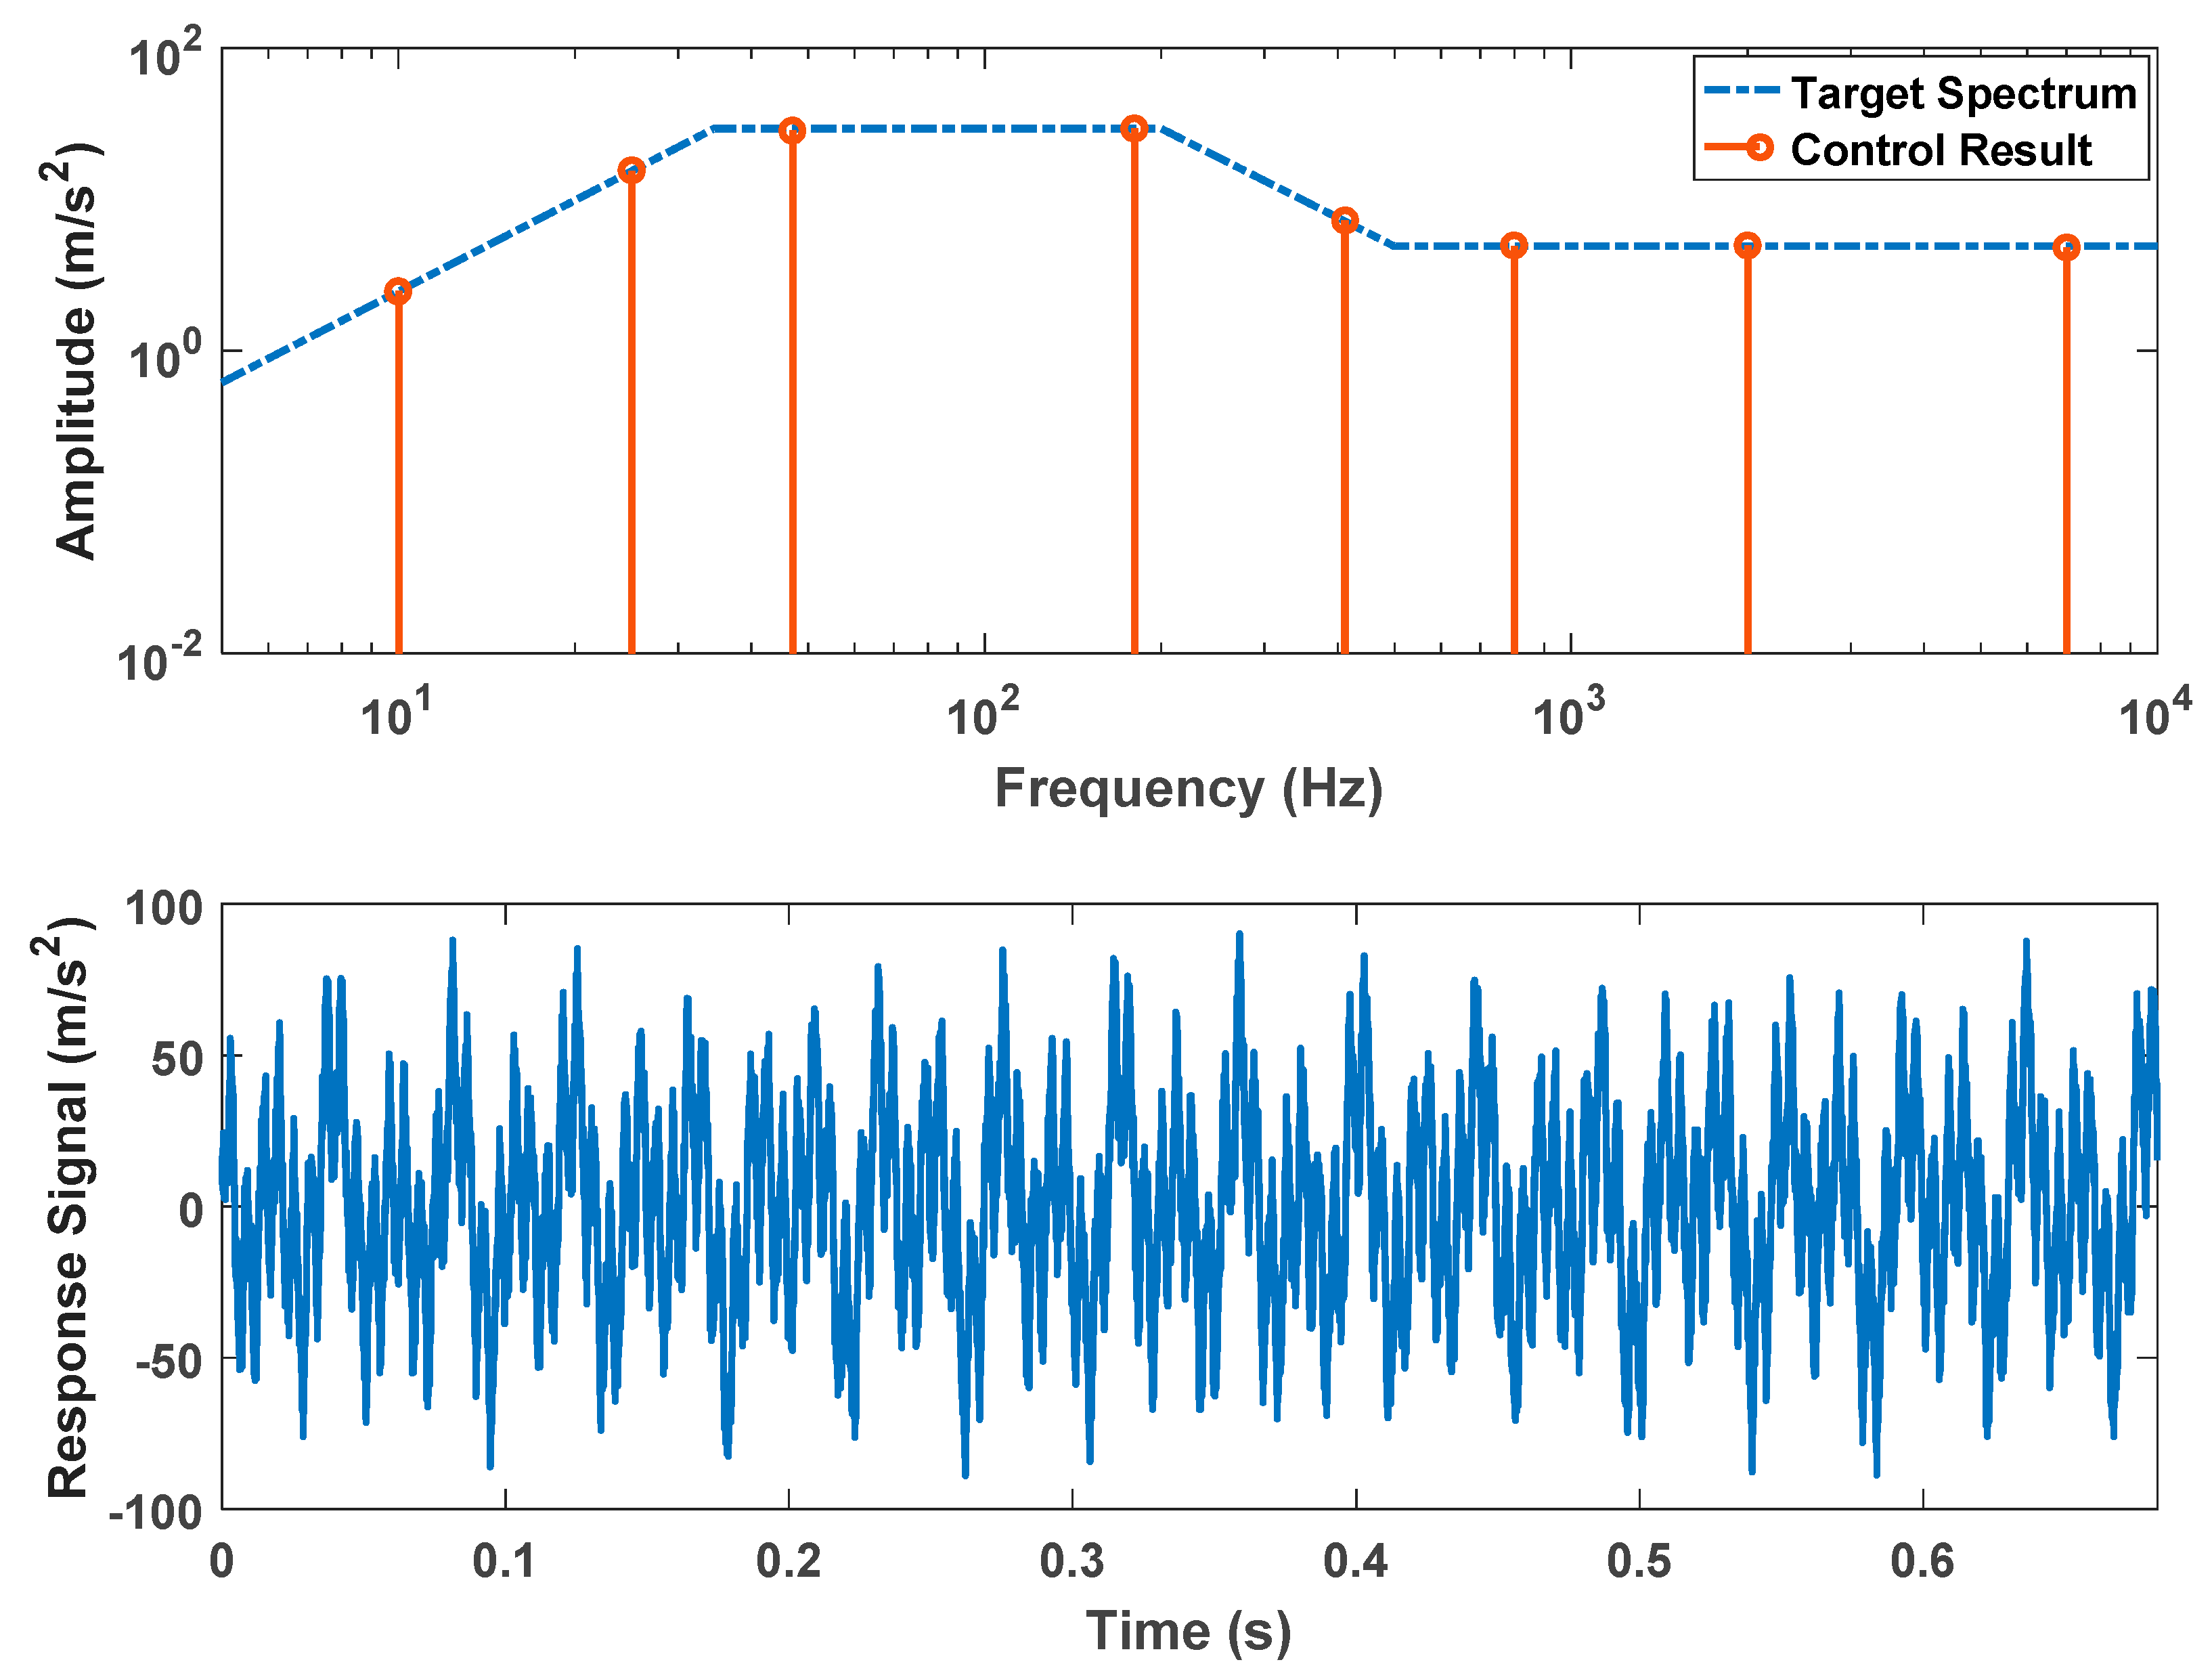
4.1. The Dwell Experiment of Composite Excitation
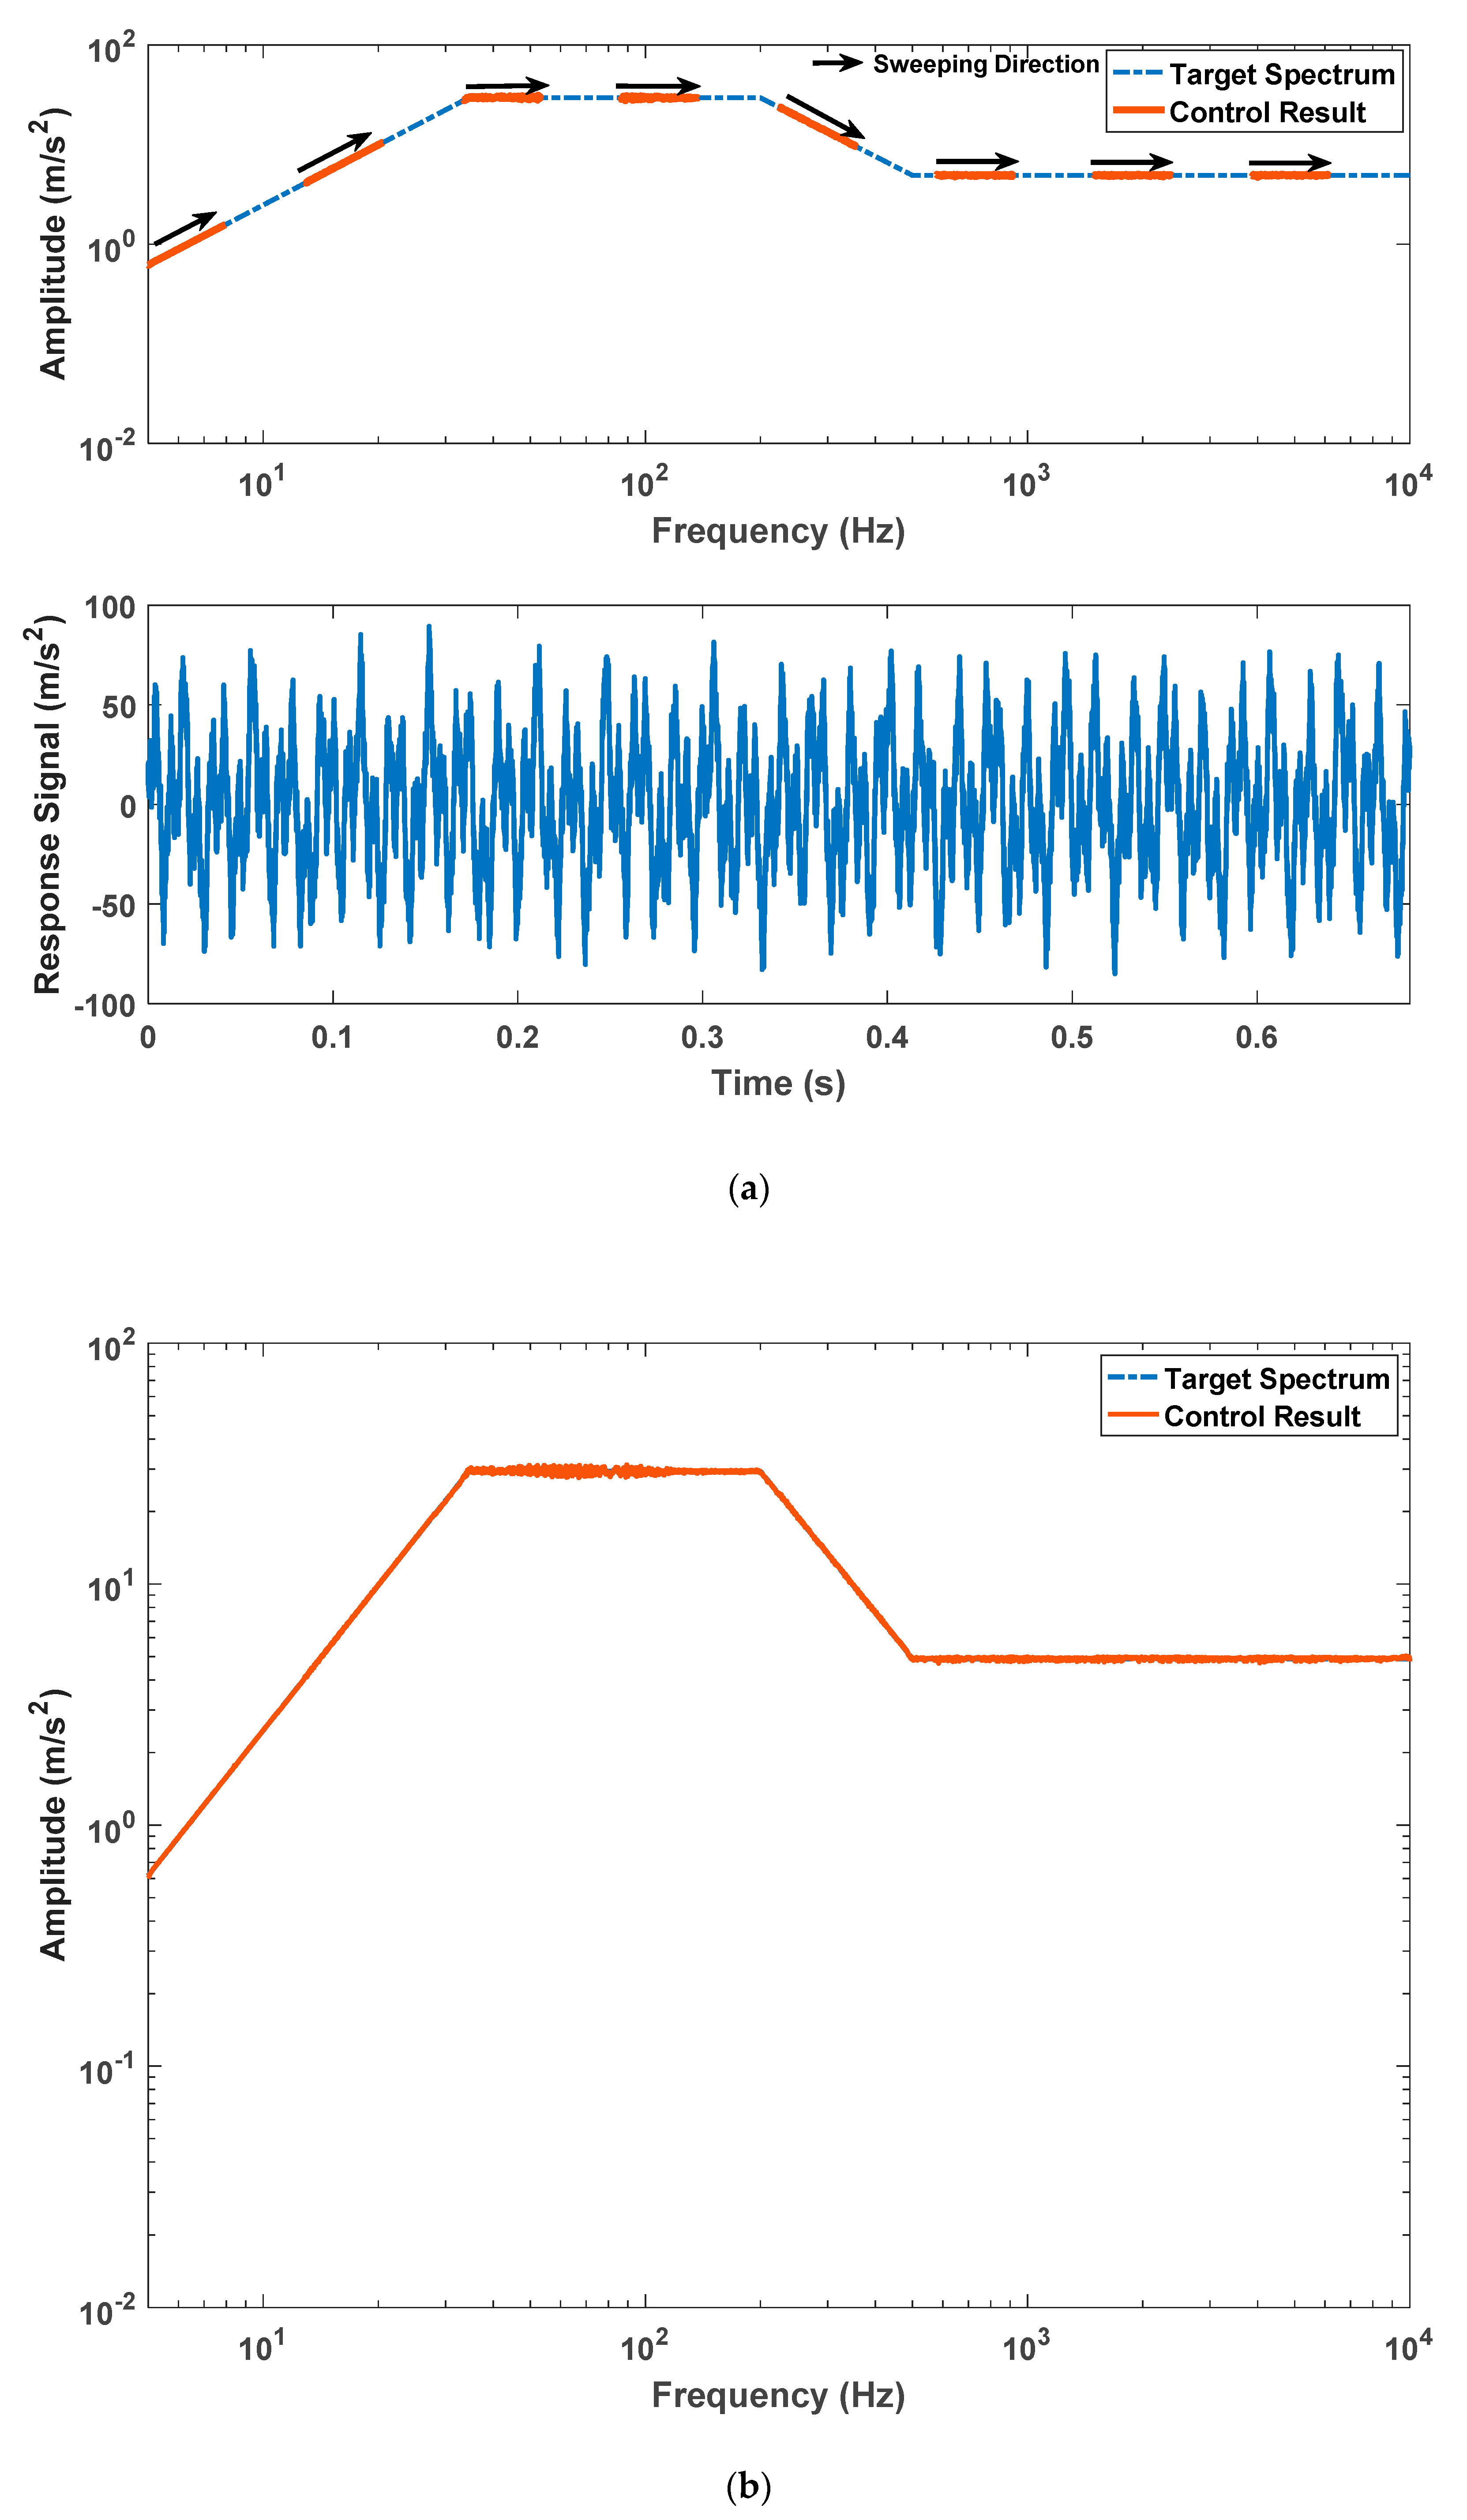
4.2. The Sweeping Experiment of Composite Excitation
5. Conclusions
Author Contributions
Conflicts of Interest
References
- Li, Z.X.; Jiang, Y.; Hu, C. Recent progress on decoupling diagnosis of hybrid failures in gear transmission systems using vibration sensor signal: A review. Measurement 2016, 90, 4–19. [Google Scholar] [CrossRef]
- Glowacz, A. Acoustic based fault diagnosis of three-phase induction motor. Appl. Acoust. 2018, 137, 82–89. [Google Scholar] [CrossRef]
- Glowacz, A. Fault diagnosis of single-phase induction motor based on acoustic signals. Mech. Syst. Signal Process. 2019, 117, 65–80. [Google Scholar] [CrossRef]
- Li, Z.X.; Jiang, Y.; Hu, C.Q.; Peng, Z.X. Difference equation based empirical mode decomposition with application to separation enhancement of multi-fault vibration signals. J. Differ. Equ. Appl. 2017, 23, 457–467. [Google Scholar] [CrossRef]
- Duan, Z.H.; Wu, T.H.; Guo, S.W.; Shao, T.; Malekian, R.; Li, Z.X. Development and trend of condition monitoring and fault diagnosis of multi-sensors information fusion for rolling bearings: A review. Int. J. Adv. Manuf. Technol. 2018, 96, 803–819. [Google Scholar] [CrossRef]
- Xia, W.K.; Li, Z.X.; Tian, Z.; Duan, Z.H. A feature extraction and visualization method for fault detection of marine diesel engines. Measurement 2018, 116, 429–437. [Google Scholar] [CrossRef]
- Saucedo-Dorantes, J.J.; Delgado-Prieto, M.; Ortega-Redondo, J.A.; Osornio-Rios, R.A.; Romero-Troncoso, R.d.J. Multiple-fault detection methodology based on vibration and current analysis applied to bearings in induction motors and gearboxes on the kinematic chain. Shock Vib. 2016. [Google Scholar] [CrossRef]
- Buzzoni, M.; Mucchi, E.; D’Elia, G.; Dalpiaz, G. Diagnosis of localized faults in multistage gearboxes: A vibrational approach by means of automatic emd-based algorithm. Shock Vib. 2017. [Google Scholar] [CrossRef]
- Wang, Z.Y.; Ma, M.X.; Piao, F.X.; Wang, Z.F. The separation of similar frequency sinusoidal signal based on the least square method. J. Electr. Inf. Technol. 2006, 28, 60–65. [Google Scholar]
- Yang, Z.D.; Cong, D.C.; Han, J.W.; Li, H.R. Signal synthesis and analysis for swept-sine vibration control. J. Vib. Eng. 2008, 21, 309–311. [Google Scholar]
- Yang, M. Study on Parameter Estimation Algorithm for Multiple Sinusoidal Signal under Noisy Background. Master’s Thesis, Harbin Engineering University, Harbin, China, 2016. [Google Scholar]
- Sangeetha, P.; Hemamalini, S. Dyadic wavelet transform-based acoustic signal analysis for torque prediction of a three-phase induction motor. IET Signal Process 2017, 11, 604–612. [Google Scholar] [CrossRef]
- Zhang, B.Y.; Chen, H.H.; He, X.D. New control method for MIMO swept-sin test. J. Vib. Shock 2015, 34, 199–200. [Google Scholar]
- Ning, D.H.; Sun, S.S.; Du, H.P.; Li, W.H.; Li, W.X. Control of a multiple-DOF vehicle seat suspension with roll and vertical vibration. J. Sound. Vib. 2018, 435, 170–191. [Google Scholar] [CrossRef]
- Wang, S.C. Research of Real-Time Control System for Vibration Test. Ph.D. Thesis, Zhejiang University, Zhejiang, China, 2006. [Google Scholar]
- Rana, K.P.S. Fuzzy control of an electrodynamic shaker for automotive and aerospace vibration testing. Expert. Syst. Appl. 2011, 38, 11335–11346. [Google Scholar] [CrossRef]
- Duda, K.; Barczentewicz, S. Interpolated DFT for sinα(x) Windows. IEEE Trans. Instrum. Meas. 2014, 63, 754–760. [Google Scholar] [CrossRef]
- Park, S.Y.; Park, J. A New Four Parameter Estimator of Sampled Sinusoidal Signals without Iteration. IEICE Trans. Fundam. Electr. Commun. Comput. Sci. 2014, E97A, 652–660. [Google Scholar] [CrossRef]
- Sun, H.J.; Wang, X.W. Modified rife algorithm for frequency estimation of sinusoid wave based on amplitude and phase criterion. J. Tianjin Univ. Sci. Technol. 2018, 51, 810–813. [Google Scholar] [CrossRef]
- Qian, F.Y.; Leung, S.H.; Zhu, Y.S.; Wong, W.; Pao, D.; Lau, W.H. Damped sinusoidal signals parameter estimation in frequency domain. Signal Processing. 2012, 92, 381–391. [Google Scholar] [CrossRef]
- Carní, D.L.; Fedele, G. Multi-sine fitting algorithm enhancement for sinusoidal signal characterization. Comput. Stand. Interfaces 2012, 34, 535–540. [Google Scholar] [CrossRef]
- Pedro, M.R.; Anónio, C.S. A new sine-fitting algorithm for accurate amplitude and phase measurements in two channel acquisition systems. Measurement 2008, 41, 135–143. [Google Scholar]
- Nelson, D. Special purpose correlation functions for improved signal detection and parameter estimation. IEEE Int. Confer. Acoust. 1993, 4, 73–76. [Google Scholar]
- Zhu, L.; Shen, J.H. Modified high-lag autocorrelation estimation method for frequency estimation of sinusoidal signal. J. Harbin Eng. Univ. 2016, 37, 579–584. [Google Scholar]
- Kuo, S.M.; Gupta, A.; Mallu, S. Development of adaptive algorithm for active sound quality control. J. Sound. Vib. 2007, 299, 12–21. [Google Scholar] [CrossRef]
- Liu, J.X.; Zhang, X.W.; Chen, X.F. Modeling and active vibration control of a coupling system of structure and actuators. J. Vib. Control 2016, 22, 382–395. [Google Scholar] [CrossRef]
- Liu, J.X. Research on Adaptive Spectral Reshaping Theory of Active Control and Applications. Ph.D. Thesis, Xi’an Jiaotong University, Xi’an, China, 2016. [Google Scholar]


| No. of Components | Frequency Value (Hz) | Target Amplitude Value (m/s2) | Control Result (m/s2) | Relative Error (%) |
|---|---|---|---|---|
| 1 | 10.0 | 2.4696 | 2.4794 | 0.40 |
| 2 | 25.0 | 15.4742 | 15.3566 | –0.76 |
| 3 | 47.0 | 29.4000 | 28.4229 | –0.332 |
| 4 | 180.0 | 29.4000 | 29.4686 | 0.23 |
| 5 | 411.0 | 7.1736 | 7.2324 | 0.82 |
| 6 | 800.0 | 4.9000 | 4.9196 | 0.40 |
| 7 | 2000.0 | 4.9000 | 4.9392 | 0.80 |
| 8 | 7000.0 | 4.9000 | 4.9294 | 0.60 |
| No. of Frequency Band | Frequency Interval (Hz) | Sweep Rate (Oct/min) | LP Filter Cutoff Frequency Factor (%) |
|---|---|---|---|
| 1 | 5~12.93 | 1 | 25 |
| 2 | 12.93~33.44 | 1 | 25 |
| 3 | 33.44~86.47 | 1 | 25 |
| 4 | 86.47~223.61 | 1 | 25 |
| 5 | 223.61~578.25 | 1 | 25 |
| 6 | 578.25~1495.35 | 1 | 25 |
| 7 | 1495.35~3866.97 | 1 | 25 |
| 8 | 3866.97~10,000 | 1 | 25 |
© 2018 by the authors. Licensee MDPI, Basel, Switzerland. This article is an open access article distributed under the terms and conditions of the Creative Commons Attribution (CC BY) license (http://creativecommons.org/licenses/by/4.0/).
Share and Cite
Ma, X.; Chen, Z.; He, H.; Zhao, Y. Research on Control Technologies for a High-Precision Multi-Source Vibration Simulation System. Energies 2018, 11, 2956. https://doi.org/10.3390/en11112956
Ma X, Chen Z, He H, Zhao Y. Research on Control Technologies for a High-Precision Multi-Source Vibration Simulation System. Energies. 2018; 11(11):2956. https://doi.org/10.3390/en11112956
Chicago/Turabian StyleMa, Xibin, Zhangwei Chen, Huinong He, and Yugang Zhao. 2018. "Research on Control Technologies for a High-Precision Multi-Source Vibration Simulation System" Energies 11, no. 11: 2956. https://doi.org/10.3390/en11112956
APA StyleMa, X., Chen, Z., He, H., & Zhao, Y. (2018). Research on Control Technologies for a High-Precision Multi-Source Vibration Simulation System. Energies, 11(11), 2956. https://doi.org/10.3390/en11112956