Article

Flashover Performance and Process of Suspension Insulator Strings Artificially Covered with Snow

1
College of Electrical and Electronic Engineering, Shandong University of Technology, Zhangdian District, Zibo 255000, China
2
State Grid Chongqing Electric Power Company Electric Power Research Institute, Chongqing 400015, China
3
State Key Laboratory of Power Transmission Equipment & System Security and New Technology, Chongqing University, Shapingba District, Chongqing 400044, China
4
State Grid Weifang Hanting Electric Power Company, Hanting District, Weifang 261100, China
*
Author to whom correspondence should be addressed.
Energies 2018, 11(11), 2916; https://doi.org/10.3390/en11112916
Submission received: 5 September 2018 / Revised: 10 October 2018 / Accepted: 22 October 2018 / Published: 26 October 2018

Abstract

:
Snow accumulates on the surface of insulator string, causing a decrease in its electrical performance, seriously threatening the reliable operation of the power grid. Most previous studies have focused on iced insulators; however, there is a lack of research on snow-covered insulators. In this paper, to reveal the influencing mechanism that snow has on the electrical characteristics of insulator string, based on an artificial snowing test in a chamber, the effects of equivalent salt deposit density, applied voltage type, and snow thickness on the flashover performance of snow-covered insulators are analyzed, and the flashover process is investigated. The results show that the relationship between the arc flashover gradient and the equivalent salt deposit density is a power function with a negative exponent, which is similar to that of polluted and ice-covered insulator strings. For the insulator strings with the same snow accretion, the direct current (DC) arc flashover gradient is lower than the alternating current (AC) arc flashover gradient. The relationship between arc flashover gradient and snow thickness is also a power function. The formation of a dry band during the flashover of snow-covered insulator string is similar to the flashover of the polluted insulator, and the arc propagation along the surface of the snow-covered insulator is similar to the flashover of the iced insulator.

1. Introduction

In recent decades, part of China’s long-distance and large-capacity EHV/UHV transmission lines have been compelled to pass through heavily iced, snowy and polluted districts in order to transmit the electric power generated in the western region to the eastern coastal cities [1]. Affected by micro-topography and micrometeorology along transmission line corridors, especially in mountainous areas, the insulation strength of transmission lines significantly decreases due to snow or ice superimposed by contamination accumulating on insulator strings. At the beginning of 2008 and 2018, China suffered two large-scale freezing rain and snow disasters [2,3,4,5,6]. The continuous rain and snow led to the depth of snowfall breaking through the historical extremes in some areas, which caused a series of accidents, such as break line, tower collapse, line trip, insulator string flashover, and communication failure. Consequently, a large blackout followed.
There are also many reports about the accidents on transmission lines caused by snow accretion in foreign countries such as Canada, Sweden, Japan, Norway, and others [7,8,9,10,11]. In 1988, 1995, and 2004, many snow flashover accidents occurred on post insulators and transformer bushing in Canada. In January 2005, a snowstorm hit southern Sweden, causing a long outage of the power system, and the power supply of more than 650 thousand people was interrupted. In December of the same year, Niigata Prefecture in Japan suffered a large-scale power outage. Although the faulty transmission lines were located 20~30 km away from the coast, a mixture of snow and sea salt carried by the strong wind accreted on insulator strings, resulting in the adjacent sheds bridging. As a result, multiple flashover accidents occurred.
Considering the damage that ice and snow pose to transmission lines, numerous researches have been carried out on ice-covered insulator strings at home and abroad. Many important achievements have been made, including the assessment of the contamination, the flashover voltage prediction model, the anti-icing and mitigation method, and others [12,13,14,15,16,17]. However, there are only a few studies focusing on the mechanism of snow accretion on insulator strings and its electrical characteristics. In previous research, key parameters such as snow amount, density, conductivity, and liquid water content that affect the electrical performance of snow-covered insulator strings have been studied [1,11,18]. By using the finite element simulation software, a two-dimensional axisymmetric model of a snow-covered insulator is established. The effects of snow layer area, height, and air gap position on the electric field of the snow-covered insulator are analyzed [19]. Based on the concept of the flashover model of the iced insulator, a model for predicting the flashover voltage of the snow-covered insulator is proposed. The results demonstrate that the maximum error between the flashover voltage obtained by the model and that obtained by the tests is less than 14.8% [11]. A series of flashover tests of insulator strings naturally covered with snow are conducted in the field. The results indicate that the flashover voltage of snow-covered insulator string is approximately linear with the length of the string under natural conditions [20].
The above research’s results have played a significant role in anti-snowing and mitigation of power grids. However, research on the influencing mechanism of snow on the electrical characteristics of insulator strings needs to be further studied. The influence of surface contamination on the flashover characteristics of snow-accreted insulator strings has rarely been investigated. There is a lack of comparison between the flashover voltage of snow-covered insulator strings for different voltage types and different snow thicknesses. Moreover, analysis of the discharge process of snow-covered insulators is scarce. In order to resolve these problems, in this paper, three types of insulators are used to research the effects of voltage type, equivalent salt deposit density (ESDD), and snow thickness on the electrical characteristics of insulator strings artificially covered with snow in an artificial climate chamber. In addition, the flashover mechanism is analyzed.

2. Test Equipment, Specimen, and Procedures
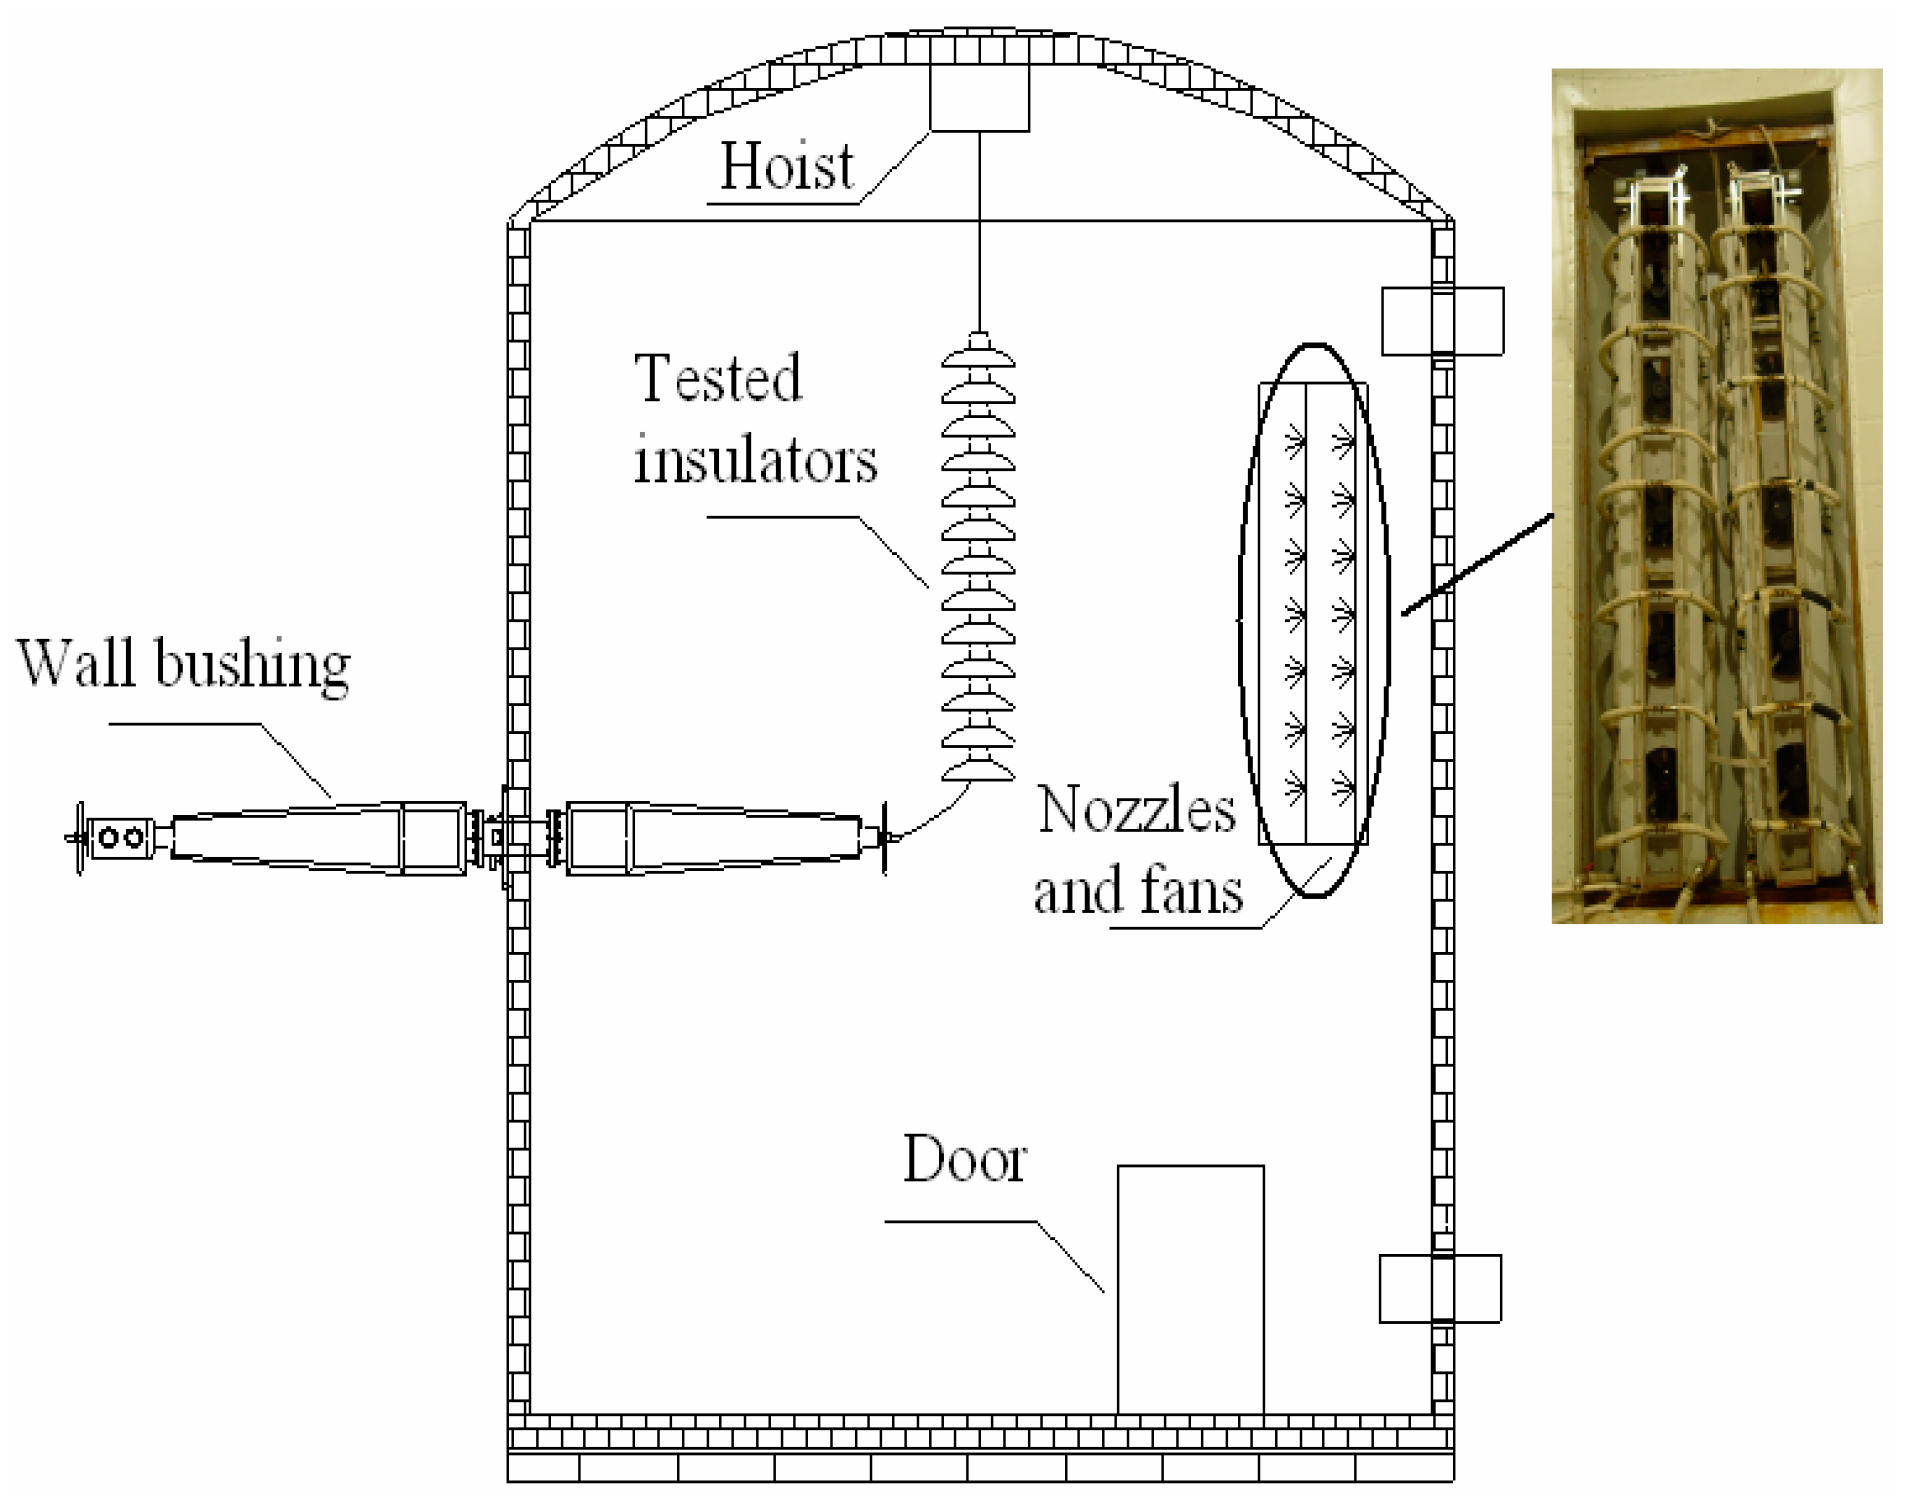
2.1. Test Equipment

Snow accretion on insulator strings and its flashover tests are performed in a multi-functional artificial climate chamber with a diameter of 7.8 m and a height of 11.6 m, as shown in Figure 1. The chamber is mainly composed of four parts, namely, vacuum system, refrigeration system, wind speed regulation system and spray system. Temperature can be as low as −45 °C in the chamber. Wind speed is in the range from 0 to 12 m/s. The spray system is customized according to International Electrotechnical Commission (IEC) standards and is divided into two rows [21]. Each row consists of seven standard nozzles. The water droplet diameter is controllable. The power is introduced by a 330 kV wall bushing installed on the side of the chamber.

2.2. Specimen

In this paper, the porcelain and glass insulator string of three units and an FXBW-35/70 composite insulator are used as the specimen. Figure 2 shows the structure diagram of the specimen. The main structural parameters are shown in Table 1.

2.3. Test Procedures

The experiment consists of the following three parts.
(1)
Insulator contamination: The solid layer method recommended by the IEC standard was used to pollute insulators to simulate the contamination level before snow accretion [22,23]. Sodium chloride simulates conductive components and is characterized by equivalent salt deposit density (ESDD). Kaolin simulates inert components and is characterized by non-soluble deposit density (NSDD). ESDD is 0.05, 0.10, 0.15 mg/cm2 and 0.20 mg/cm2, respectively. The ratio of ESDD to NSDD is 1:4. The amount of sodium chloride and kaolin applied to the surface of the insulator was calculated according to ESDD, NSDD and the surface area of the specimen. The weighted sodium chloride and kaolin was added into deionized water with conductivity less than 10μS/cm. After fully stirring, the dirty liquid was evenly applied to the surface of the cleaned insulator for use. During the application process, special attention was given to applying the liquid evenly, avoiding spraying the contaminants on the steel foot and cap, and avoiding dirty liquid falling.
(2)
Snow accretion: As there are no relevant standards for snow accretion on insulator strings, reference [10] provides an experimental method for artificial snow accretion. The difference is that snow produced by nozzles directly accumulates on the insulator surface in this paper. Before icing, water conductivity was adjusted to 80 μS/cm and the water temperature dropped to 4 °C. Then the cooling system was turned on and the system was sprayed until the chamber temperature was between −9 and −13 °C, and the humidity was maintained between 89% and 95%, then the snow accretion test begun. The spraying system was not turned off until the snow thickness on the surface of the insulator met the requirement. The appearance of the snow-covered insulators was photographed and the snow density and thickness were measured.
Because the porous structure of snow is easily destroyed and its density is affected, the drainage method applied to ice density measurement cannot accurately measure the density of snow. The following method was used to measure density in this paper. In the process of snow accretion, a flat plate with the surface area S and the weight m1 was placed in the chamber. After the snow accretion was over, the weight and thickness of the flat plate were measured, marked as m2 and h, respectively. Then, the density ρ was obtained by the following formula:
ρ = ( m 2 m 1 ) / ( S h )
(3)
Flashover tests: In this paper, the U-type method is used to obtain the flashover voltage of the snow-covered insulator [24]. The procedure was as follows. The sealing door was opened to increase the temperature to about −2 °C in the climate chamber. Then, the temperature rise rate was controlled at 0.5 °C/5 min. The flashover tests were conducted on the snow-covered insulator by using the voltage boosting method. In order to prevent the influence of the snow layer melting on the results, the interval between adjacent flashover tests was 1~2 min. When multiple flashover voltage values Ufi were obtained, the relationship between Ufi and flashover time showed a U-shaped curve, and the lowest point was the lowest flashover voltage Umin:
U m i n = M i n ( U f 1 , U f 2 , U f 3 , , U f n )
According to the experimental results, 50% flashover voltage U50% and its standard deviation σ for each string of the snow-covered insulator can be obtained by the following equation:
{ U 50 % = i = 1 N U f ( i ) N σ = i = 1 N ( U f ( i ) U 50 % ) 2 N
where Uf(i) is the ith minimum flashover voltage; N is the total valid time.
The alternating current (AC) power supply used in the flashover tests is a non-corona contamination test transformer. Its nominal capacity, rated voltage and rated current are 2000 kVA, 500 kV, 4 A, respectively. The power supply with rated voltage ±600 kV and rated current 0.5 A was used to carry out direct current (DC) flashover tests. Other technical parameters are shown in Reference [24].

3. Results and Analysis

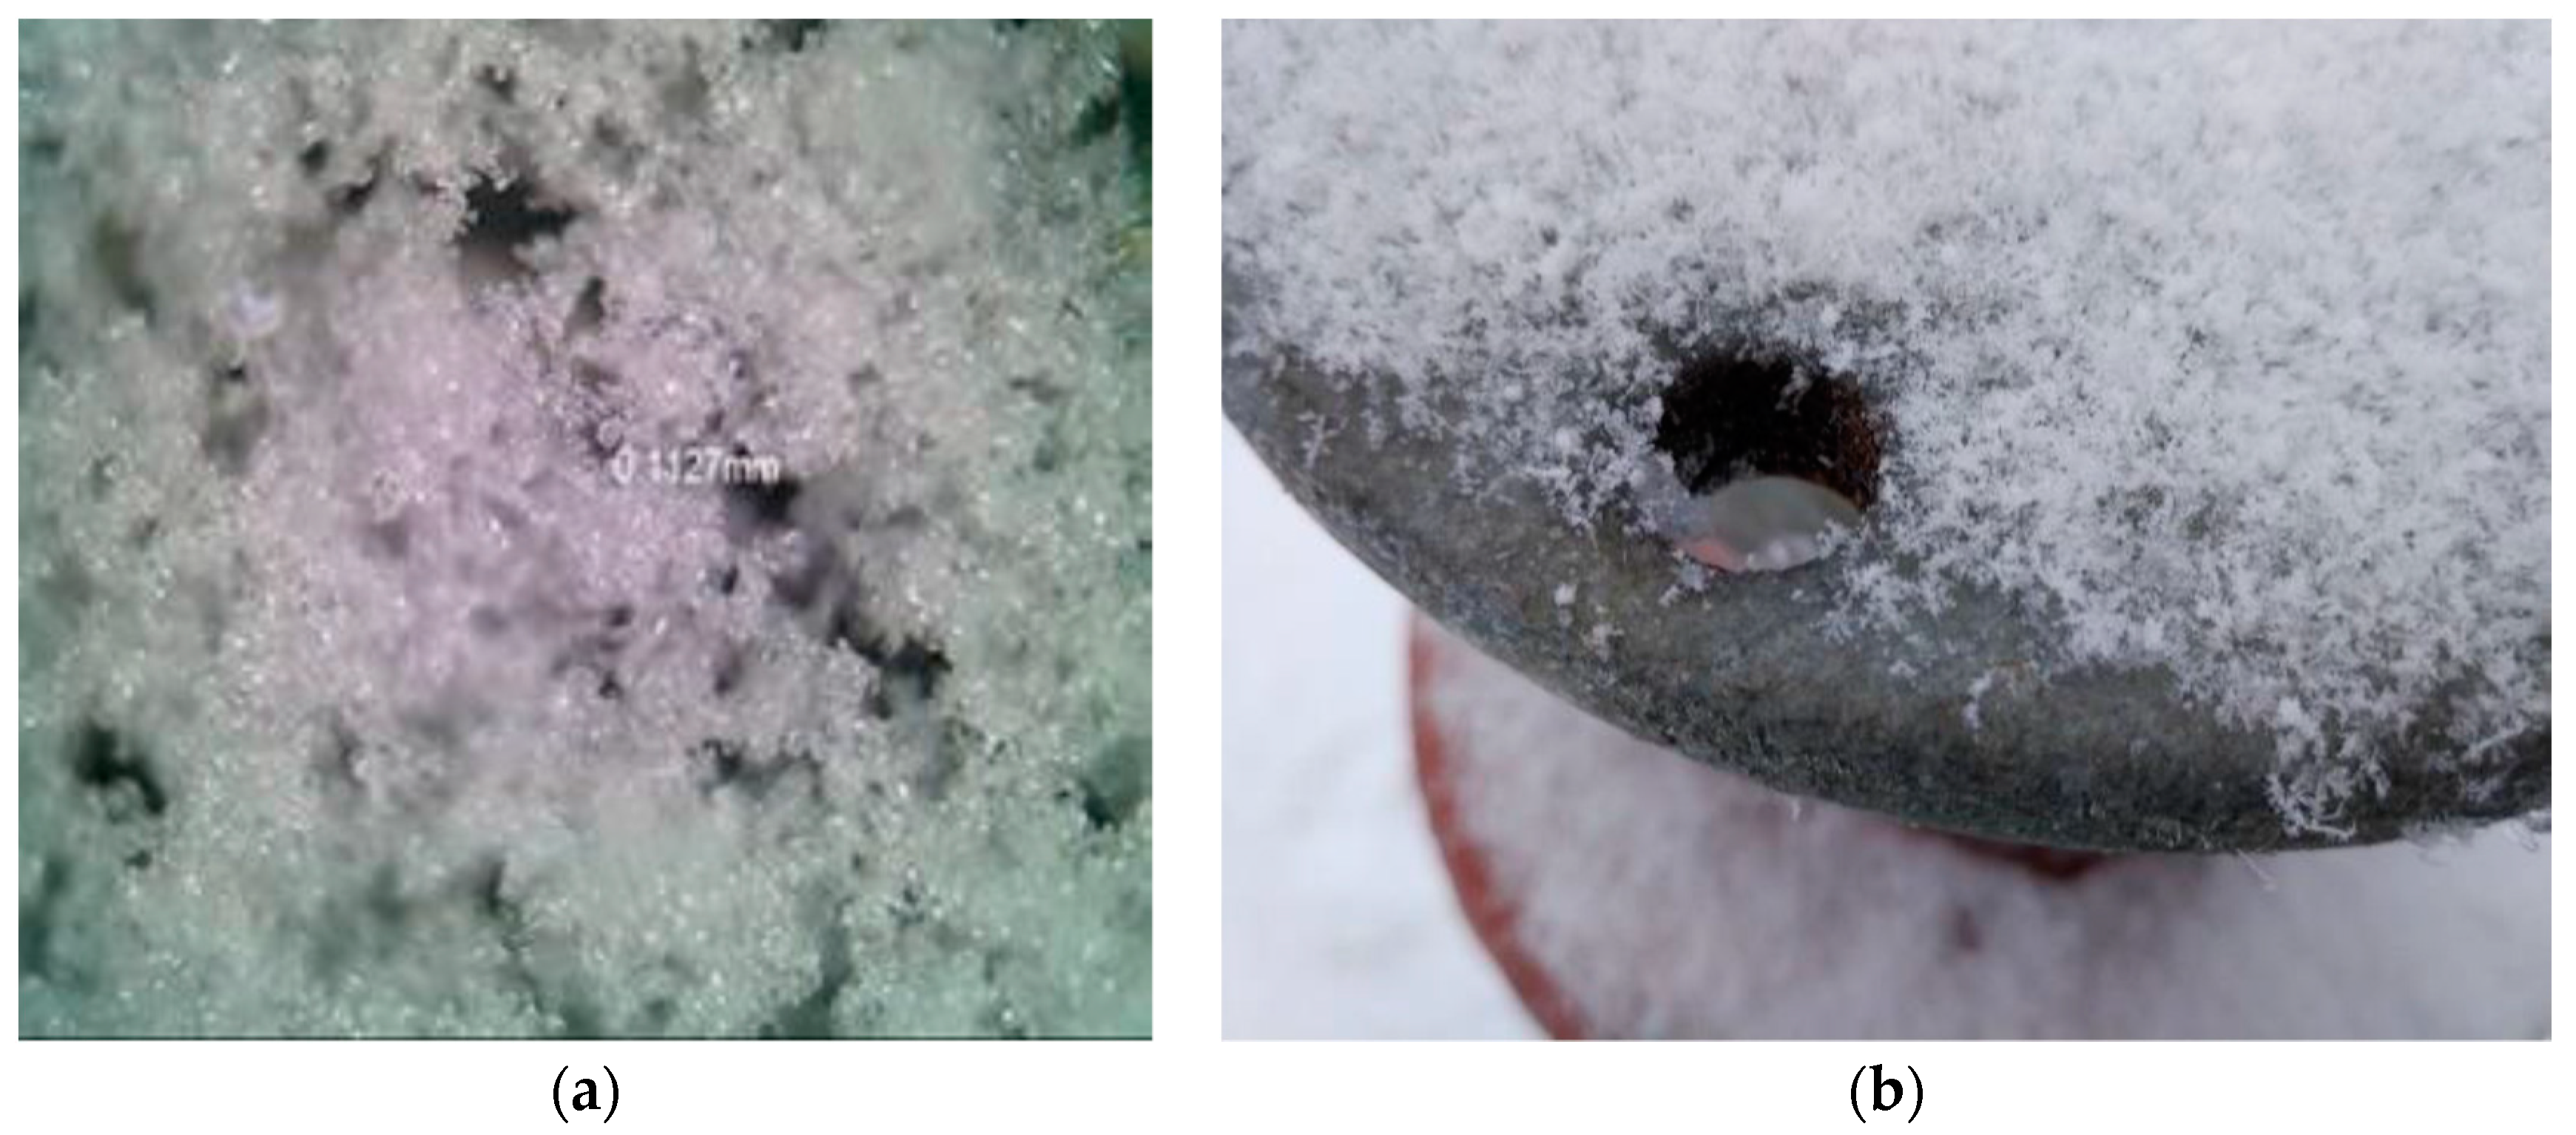
3.1. Comparison between Artificial Snow and Natural Snow

The snowflake of the artificial snow that was photographed in the laboratory using an electron microscope is shown in Figure 3a, Figure 3b shows the snowflake of natural snowfall.
The density of natural snow is 0.05~0.10 g/cm3. The density of wet snow is 0.3~0.8 g/cm3, and that of soft fog is 0.15~0.30 g/cm3 [25]. According to the measurement method described in Section 2.3, eight measurements were carried out on the density of artificial snow and natural snowfall, respectively. Their average value was taken as the result of the measurement. The results show that the density of artificial snow is 0.12 g/cm3 and that of natural snowfall is 0.11 g/cm3. It can be seen that the density of artificial snow is between natural snowfall and soft rime. The physical structure of artificial snow is similar to that of natural snow, and is composed of an ice crystal particle and an air gap. As a consequence, it is feasible to conduct the snow accretion tests of insulator strings with artificial snow instead of natural snowfall.

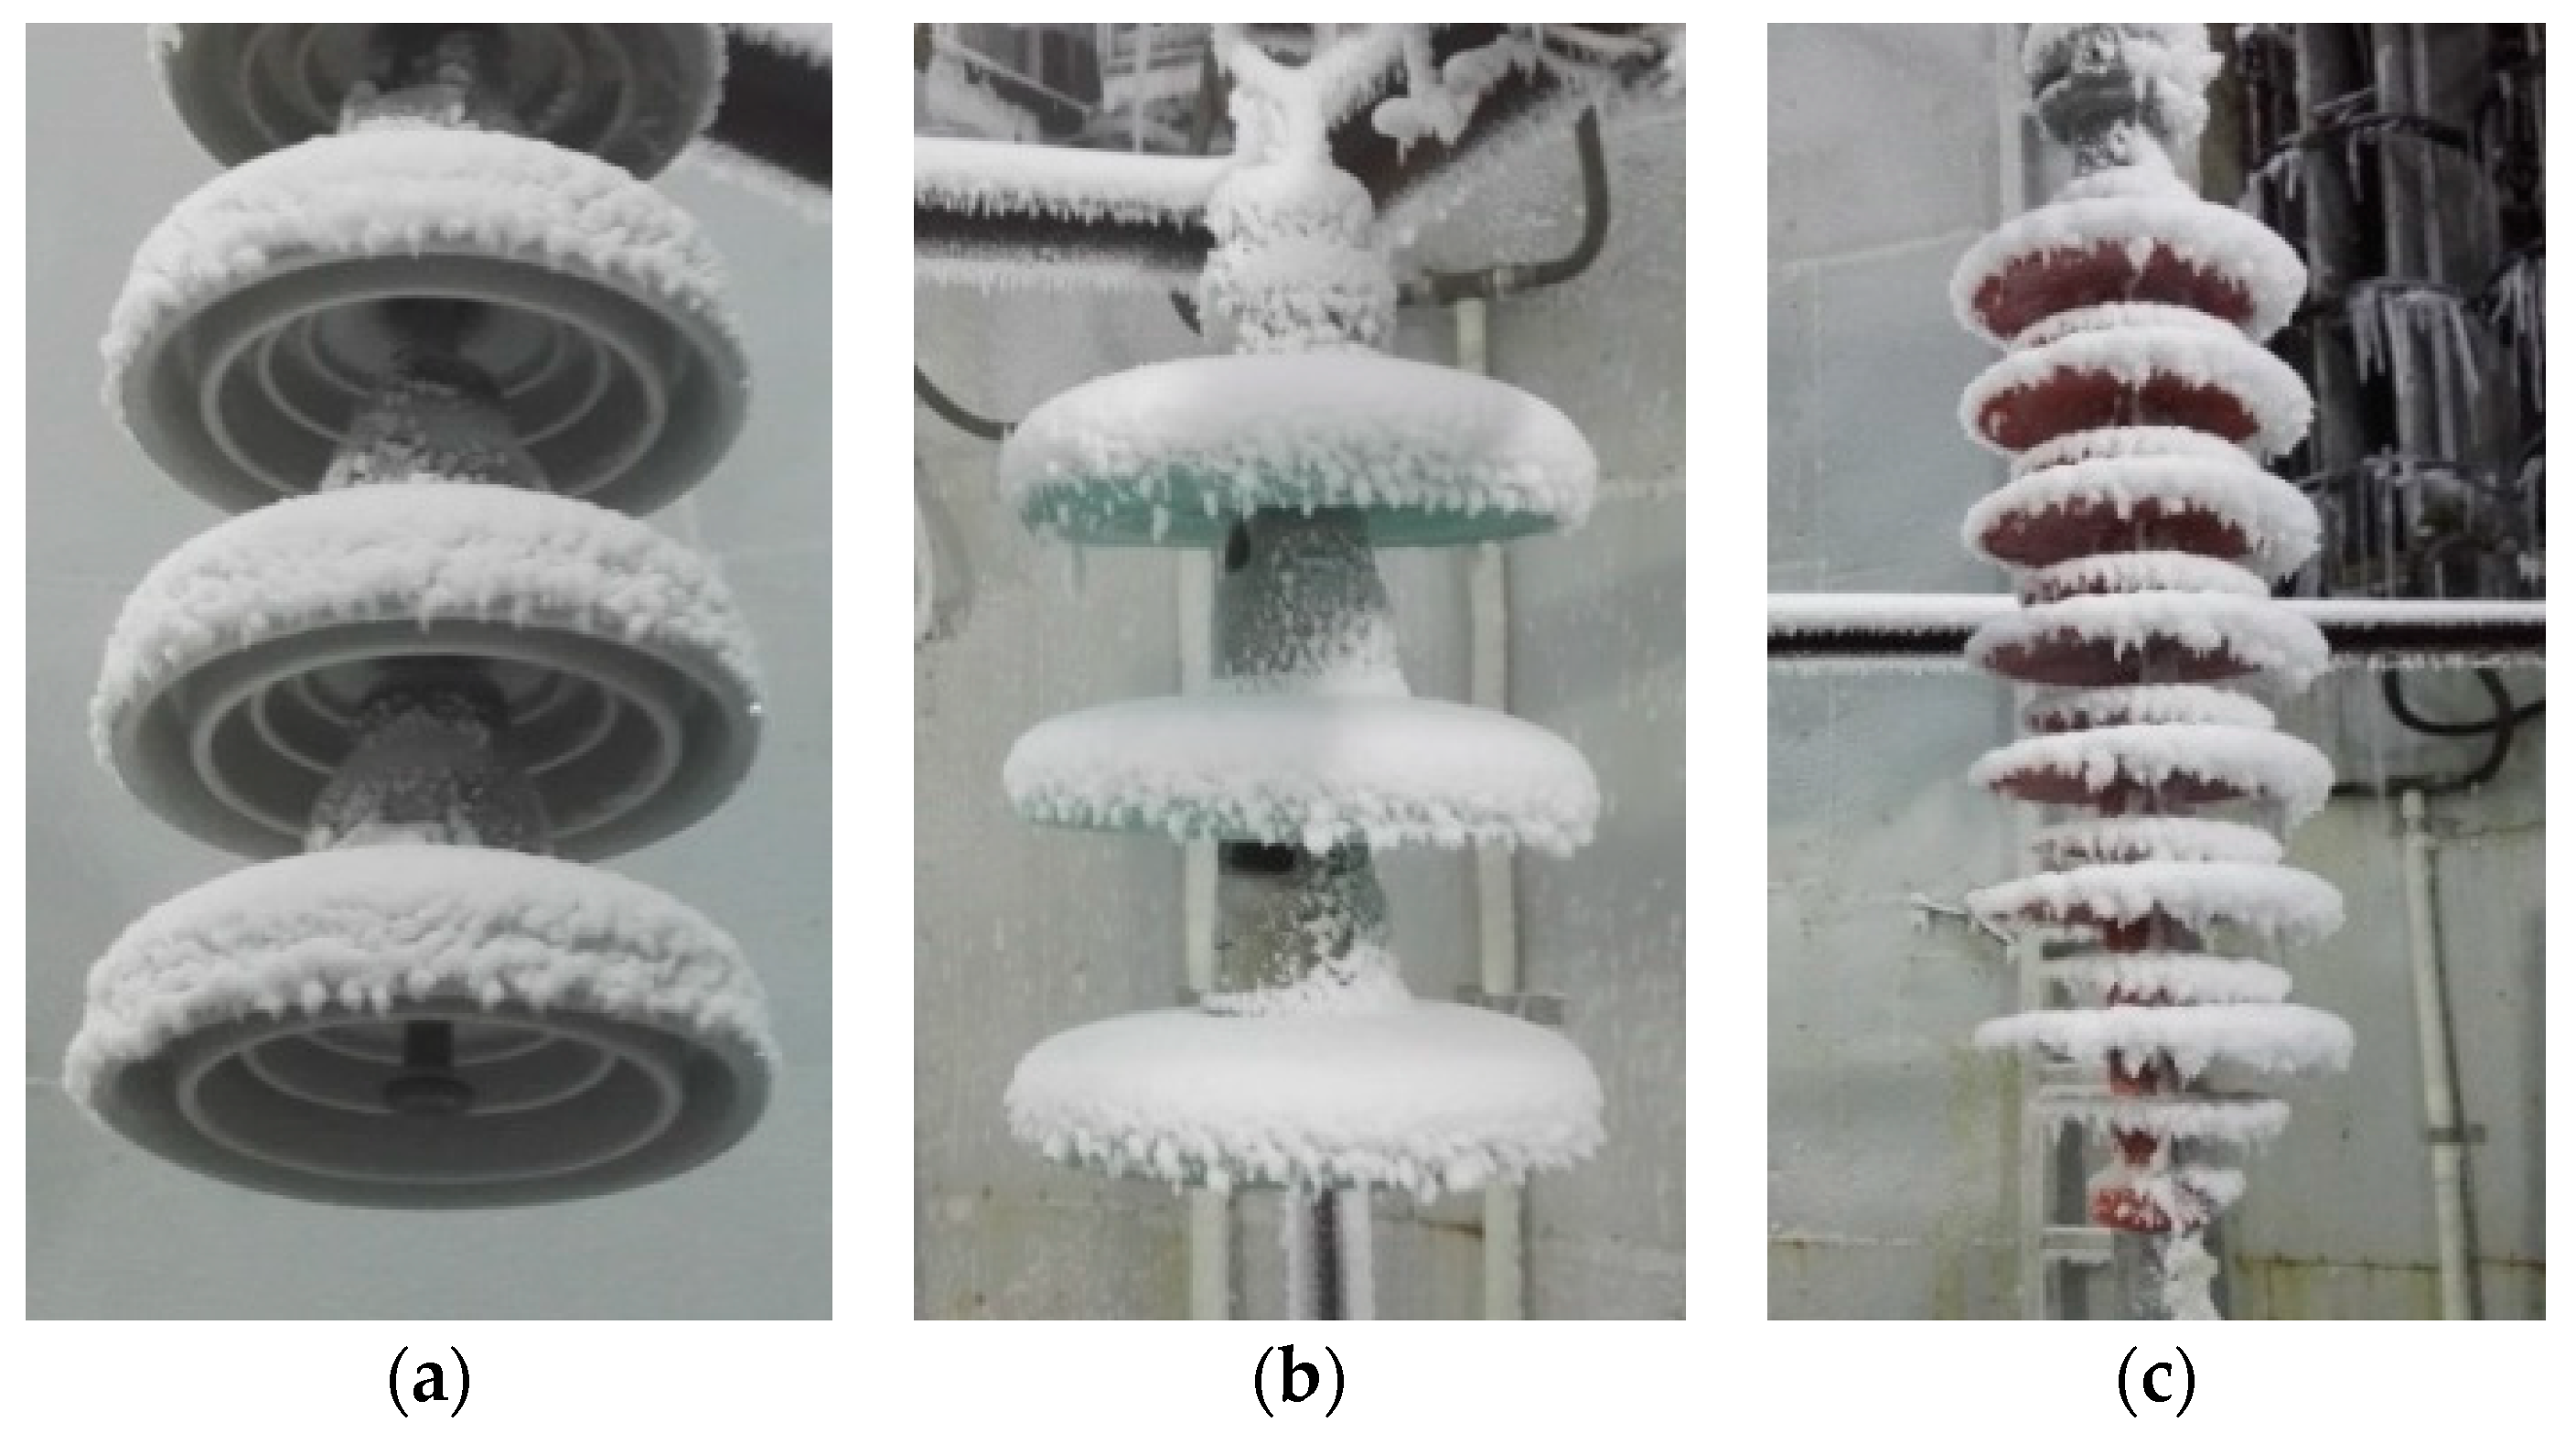
3.2. Appearance of Snow-Covered Insulator Strings

When the snow thickness (d) reaches 10 mm, the appearance of three kinds of insulator stings is shown in Figure 4.
Subject to the effects of wind and gravity, snowflakes accumulate on the surface of the insulator and gradually form a snow layer. Due to differences in shed diameter and structure, there are differences in the appearance of snow-covered insulator strings under the same environment, as shown in Figure 4. It is known from the reference that the shed diameter of porcelain and glass insulators is larger than that of composite insulators, which leads to its influence on the flow field of the leeward side of porcelain and glass insulators being less than that of a composite insulator [26]. Therefore, snow accretion on the windward side of a composite insulator is significantly more severe than that on the leeward side, and snow accretion on porcelain and glass insulators is relatively uniform.
Figure 5 presents the appearance of snow-covered composite insulators for different snow thicknesses. The snow thickness is 5 mm, 10 mm, and 20 mm, respectively.
The snow thickness on the windward side is greater than that on the leeward side because of the fixed wind speed and direction in the artificial climate chamber. Furthermore, the amount of snow on large sheds is much larger than that on small sheds. As time increases, the snow accretion on the large and small sheds gradually increases until the sheds of the snow-covered composite insulator are bridged, which seriously affects the electrical characteristics of the insulators.

3.3. Effect of ESDD on EL

When d is 10 mm, AC flashover voltage (Umin) and arc flashover gradient (EL) under different ESDD are given in Table 2. The standard deviation of the results obtained by Equation (3) is less than 5.6%.
Previous studies indicate that the relationship between the AC arc flashover gradient of polluted and ice-covered insulators and ESDD can be expressed as [7,24]:
E L = A s × ESDD n
where As is the coefficient related to the material and structure of the insulator. n is the characteristic exponent that characterizes the effect of ESDD on EL.
Snow accretion on the insulator is similar to ice that has accumulated on an insulator. Therefore, the results in Table 2 could be fitted according to Equation (4). As, n and R2 are shown in Table 3. R2 is the square of the correlation coefficient. The fitting curves are shown in Figure 6.
The following conclusions can be drawn from Table 3 and Figure 6.
(1)
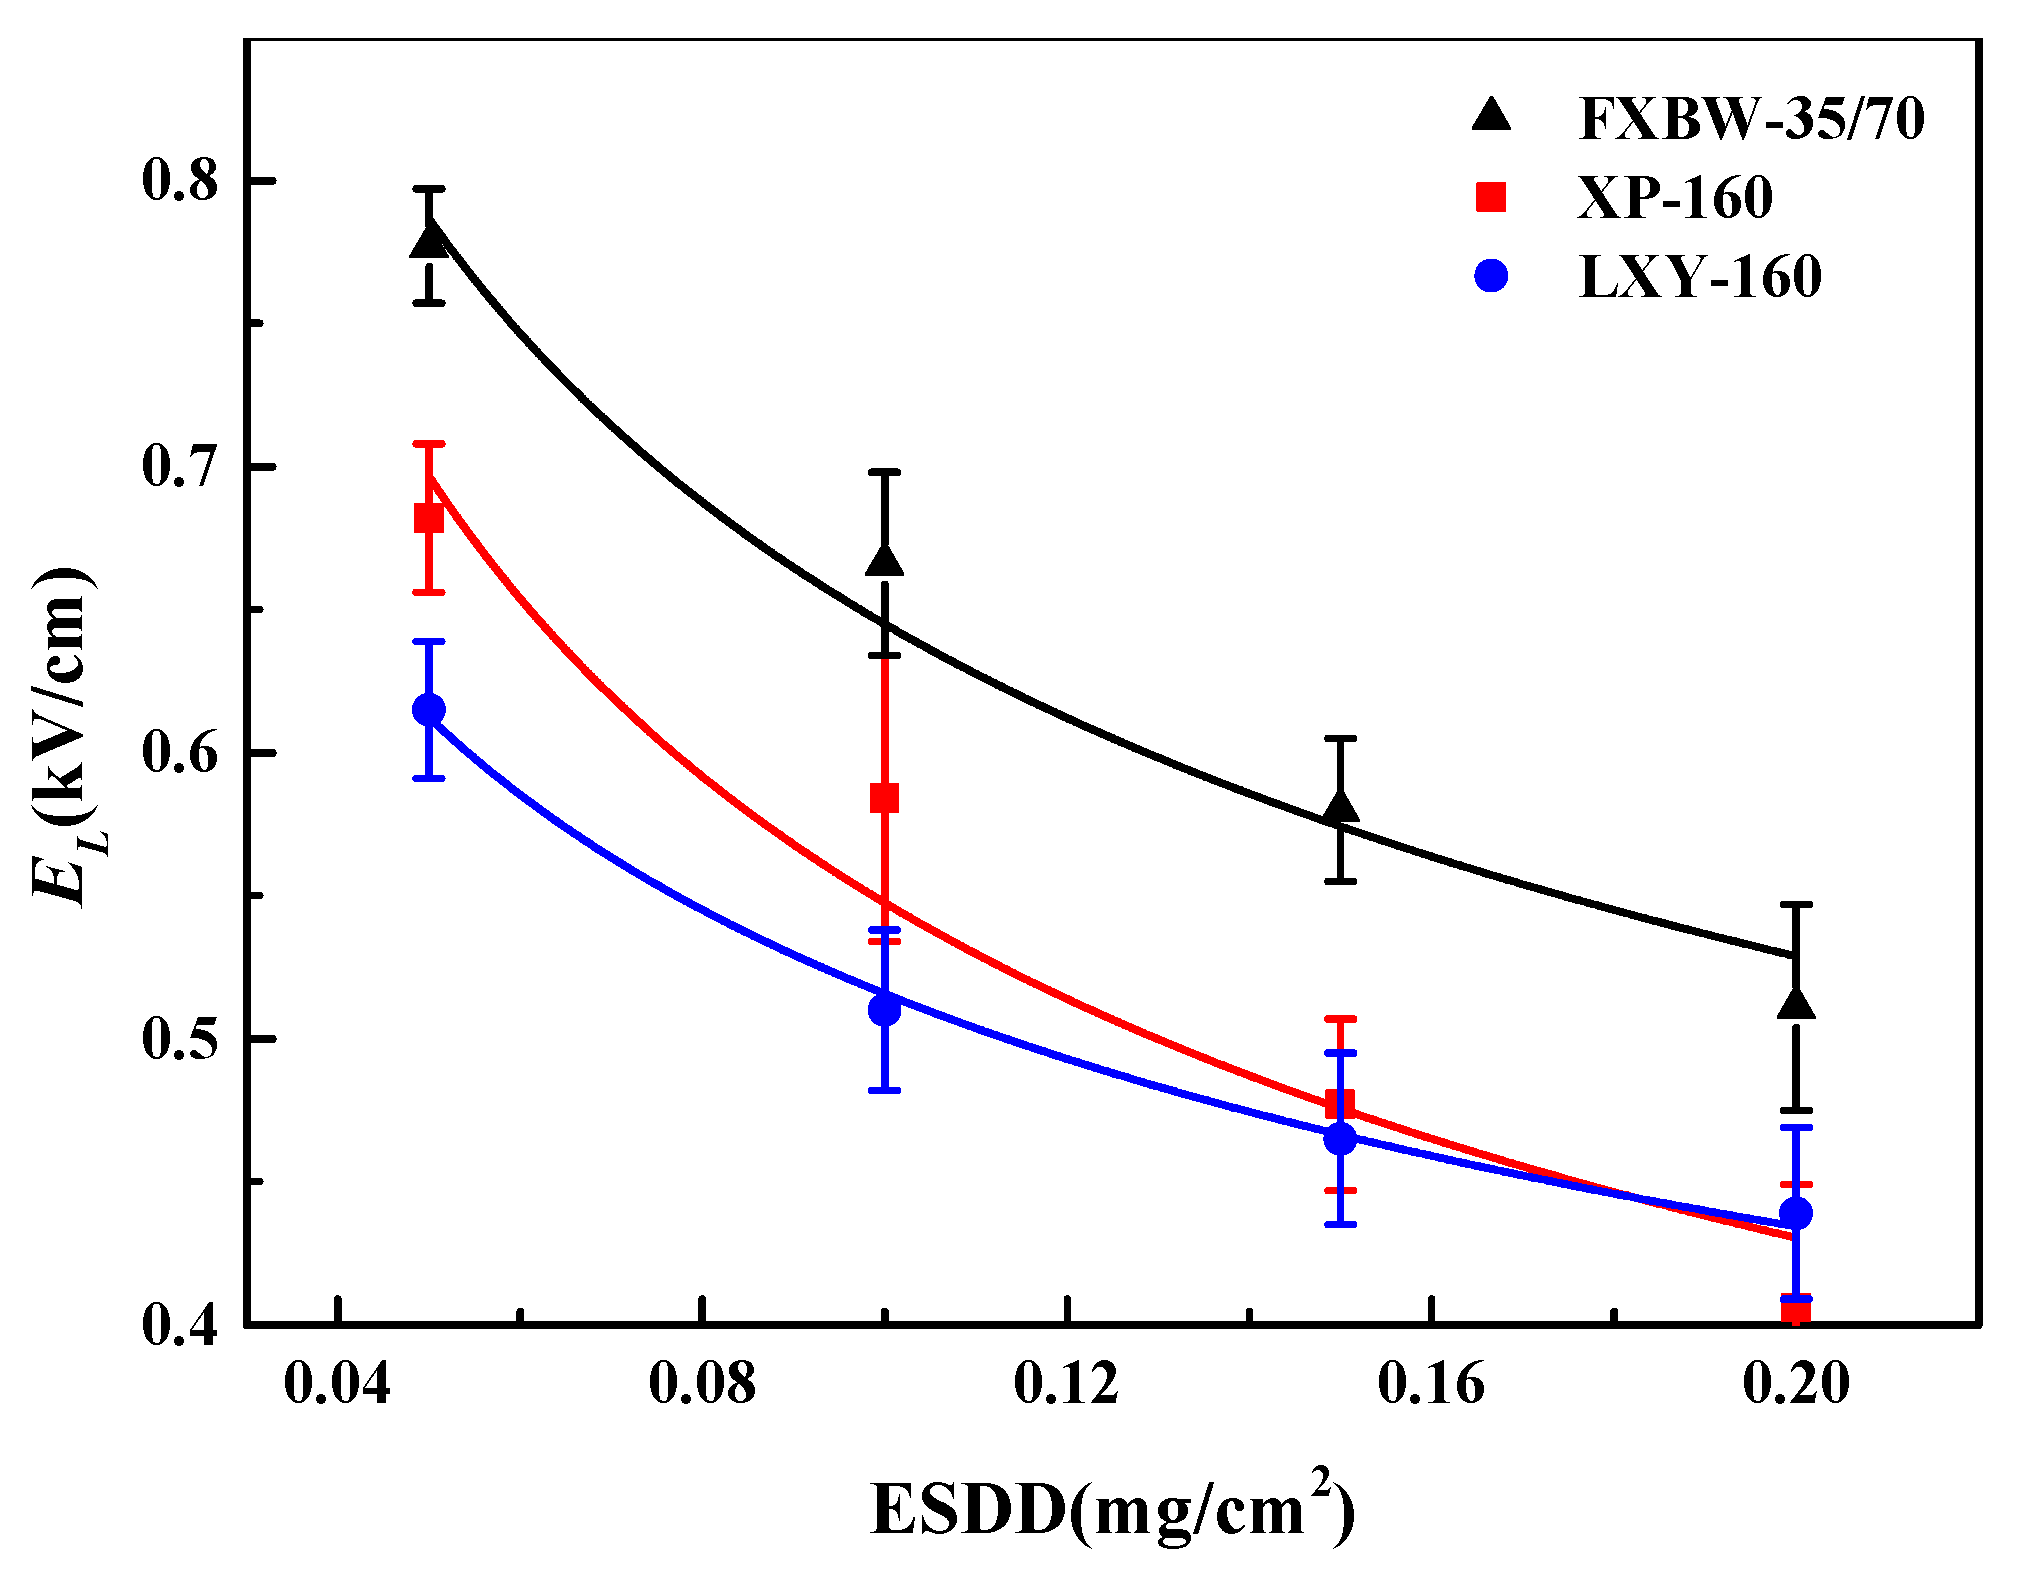
The relationship between Umin, EL and ESDD is a power function with a negative exponent. The values of n for the three insulators are 0.368, 0.244, and 0.296, respectively. Among them, the porcelain insulator has the largest n, which indicates that the snow flashover voltage is affected more by ESDD than that of the glass and composite insulators.
(2)
For the same contamination level, the inequality is established as follows: EL (FXBW-35/70) > EL (XP-160) > EL (LXY-160). That is, the insulation performance of FXBW-35/70 among three kinds of snow-covered insulators is the best, and that of LXY-160 is the worst. This phenomenon is related to the creepage distance. According to Figure 4, when snow thickness reaches 10 mm, the three types of insulators are not bridged by accumulated snow, and the creepage distance can still be effectively utilized.

3.4. Effect of Voltage Type on EL

Research results have shown that the polarity effect occurs in DC flashover voltages of both the polluted insulator and the ice-covered insulator [24]. For short insulator strings, the negative flashover voltage is lower than the positive flashover voltage. The specimen in this paper is also a short insulator string. Therefore, in order to consider the worst condition, the voltage type applied to the snow-covered insulators is DC negative polarity.
When d is 10 mm, the DC flashover voltage (Umin) and arc flashover gradient (EL) of the snow-covered insulators for different ESDD are shown in Table 4. The standard deviation of the results obtained by Equation (3) is less than 7.8%.
The relationship between the DC arc flashover gradient of snow-covered insulators and ESDD can also be expressed by Equation (4). The results in Table 4 are fitted according to Equation (4). As, n and R2 are shown in Table 5. The fitting curves of the AC and DC flashover voltage are shown in Figure 7.
According to Table 5 and Figure 7, the following conclusions can be given:
(1)
The relationship between Umin, EL and ESDD meets the power function with a negative exponent. n is 0.263~0.390. The value of n for the composite insulator is the largest. It is indicated that ESDD has a larger impact on the snow flashover voltage of the composite insulator than that of the porcelain and glass insulators.
(2)
The DC flashover voltage is lower than AC flashover voltage for the same type of snow-covered insulator. For example, when ESDD is 0.10 mg/cm2, the AC arc flashover gradient of porcelain, glass, and composite insulators are 0.584 kV/cm, 0.510 kV/cm and 0.666 kV/cm, respectively, and the DC arc flashover gradients are 0.521 kV/cm, 0.488 kV/cm and 0.517 kV/cm, respectively, which decrease by 10.8%, 4.31% and 22.4%, respectively.

3.5. Effect of d on EL

An FXBW-35/70 composite insulator is used as the specimen to investigate the relationship between the snow thickness of the insulator and the flashover voltage. The flashover voltage of the snow-covered insulators is shown in Table 6, where ESDD is 0.02 mg/cm2, and d is 5 mm, 10 mm and 20 mm, respectively. The standard deviation of the experimental results obtained by Equation (3) is less than 8.4%.
The previous studies show that the relationship between arc flashover gradient EL and ice thickness can be expressed as [7,24]:
E L = A d × d m
where Ad is a constant and its value is related to the contamination level, structure and material of the insulator. m is the characteristic exponent, indicating the effect of ice thickness on the arc flashover gradient.
Similarly, the relationship between the arc flashover gradient of the snow-covered insulators and snow thickness can also be expressed by Equation (5). The results in Table 6 are fitted by using Equation (5). The values of Ad, m and R2 are shown in Table 7. The fitting curves are shown in Figure 8.
As shown in Table 7 and Figure 8, the following conclusions can be drawn:
(1)
With the increase of snow thickness d, the flashover voltage Umin and arc flashover gradient EL decline. Furthermore, the relationship between EL and d is a power function with a negative exponent.
(2)
The AC arc flashover gradient of the composite insulators is greater than the DC arc flashover gradient, and the gap between them increases with the increase of snow thickness. For example, when ESDD is 0.02 mg/cm2 and d is 5 mm,10 mm and 20 mm, the AC arc flashover gradients are 1.120 kV/cm, 1.037 kV/cm and 0.917 kV/cm, respectively. The DC arc flashover gradients are 0.946 kV/cm, 0.868 kV/cm and 0.730 kV/cm, which decreased by 15.5%, 16.3% and 20.4%, respectively.

4. Arc Discharge Development Process of the Snow-Covered Insulator

In order to investigate arc propagation and the flashover process of the snow-covered insulator, flashover tests were conducted. When ESDD is 0.05 mg/cm2, the water conductivity is 80 μS/cm and the snow thickness is 10 mm, the typical flashover process photographs taken by a high-speed camera are shown in Figure 9.
The discharge development process of insulator string artificially covered with snow when energized with the voltage is described below. The leakage current is minimal at the initial phase of voltage application. Subsequently, the current gradually increases to tens of milliamps as the applied voltage increases. The accumulated snow layer on the upper surface of the insulator is almost not melted due to a lack of sufficient heat. While there is a very small amount of snow on the lower surface because of the shading of the shed, a dry band forms in this area; this can be attributed to the thermal effect of the leakage current. Then, the arcs occur on the leeward side (t = 3.88 s), as shown in Figure 9b. This process is similar to the ignited arcs of the polluted insulator. Thereafter, arcs are extinguished owing to the insufficient power supply to maintain combustion, as shown in Figure 9c. As the applied voltage continues to rise, the arcs on the lower surface are reignited (t = 6.10 s) and then the adjacent sheds are bridged. Following this, the arcs extinguish, as shown in Figure 9d–f. It can be observed that the bridged arcs occur between the lower surface of the large shed and the upper surface of the small shed, showing that the snow layer on the small shed quickly melts. Following this, the arcs reignite as the applied voltage increases (t = 8.32 s). Its diameter and brightness increase. Arcs develop from the leeward side to the windward side, which is attributed to the leakage current melting the snow layer on the windward side of the insulator during the reignition and extinguishing of the arcs. This results in the snow gaps on the windward side almost bearing the applied voltage. Arcs appear in each gap between the adjacent sheds when the voltage increases to some extent, as shown in Figure 9j. The discharge does not bridge the entire insulator string until the arcs are extinguished three times. Flashover occurs immediately following it (t = 10.18 s). This process is similar to the flashover of air gap arcs propagating along the high-conductivity water film, bridging the iced-covered insulator. Figure 9l shows the path at the time of the flashover.

5. Discussion

As stated in Section 4, the flashover process of snow-covered insulator string is a combination of the flashover of the polluted insulator and ice-covered insulator. However, the influence of snow accumulation on the electrical characteristics of insulator is different from that of polluted insulator and iced insulator.
Comparing the test results in Section 3 with the data in [24] shows that arc flashover gradient of snow-covered insulator is higher than that of the polluted insulator under same contamination degree. The reason can be explained as follows. On one hand, the melting of the snow layer consumes a portion of power energy. Therefore, power supply needs to provide more energy to maintain the arc propagation in the flashover process of snow-covered insulator. On the other hand, according to the observation of the experimental phenomenon during the flashover, it is found that a part of snow falls off and the contamination on the surface of the insulator is taken away.
Comparing the above experimental results with the data in [24], it is known that arc flashover gradient of ice-covered insulator is lower than that of insulator artificially covered with snow under same contamination degree and same thickness of ice and snow accumulation on the surface of insulator. The reasons can be summarized as follows. Firstly, for ice-covered insulator, due to the presence of icicle, the distortion of the electrical field is far greater than that of snow-covered insulator. Secondly, icicle bridges the adjacent sheds, resulting in the effective creepage distance reduction. Lastly, compared with snow-covered insulator, there is obvious crystallization effect during icing. A higher conductivity water film is formed on the surface of iced insulator during the melting, resulting in ice flashover voltage lower than snow flashover voltage.

6. Conclusions

According to the aforementioned research, the following conclusions can be given:
Snowflake of artificial snow is similar to that of natural snowfall. Snow accretion on the windward side of the insulator is more severe than the leeward side. Furthermore, snow accretion on the windward side of the composite insulator is significantly more severe than that of the porcelain and glass insulators.
The AC arc flashover gradient decreases with the equivalent salt deposit density increasing. When the sheds are not bridged by snow accretion, arc flashover gradient is determined by the creepage distance. Therefore, for the same contamination level, the inequality is established as follows: EL (FXBW-35/70) > EL (XP-160) > EL (LXY-160).
The DC arc flashover gradient declines with the increase of equivalent salt deposit density. Under the two types of applied voltages, the thicker the snow thickness, the lower the arc flashover gradient is. Moreover, the AC arc flashover gradient is higher than the DC arc flashover gradient.
The discharge process of snow-covered insulators is gradually extended and the discharge does not bridge the entire insulator string until the arcs are extinguished three times. The formation of the dry band during the flashover of the snow-covered insulator is similar to the flashover of the pulled insulator, and the arc propagation after the snow layer melted is similar to the flashover of the iced insulator.

Author Contributions

The experiments were carried out by Y.H., X.H. and Z.Y. Data analysis and interpretation were done by Y.H. and S.G. Manuscript editing was performed by Y.H. and Y.W. The language and article format were checked by R.X.

Funding

This work was funded by the State Grid Shandong Electric Power Company grant number [SGTYHT/17-JS-199].

Acknowledgments

The authors gratefully acknowledge the contribution of all members of the external insulation research group in Chongqing University for their work on this paper.

Conflicts of Interest

The authors declare no conflict of interest.

References

  1. Liu, Z. Ultra-High Voltage AC and DC Grid; China Electric Power Press: Beijing, China, 2002. [Google Scholar]
  2. Jiang, X.; Zhang, Z.; Hu, Q.; Hu, J.; Shu, L. Thinkings on the restrike of ice and snow disaster to the power grid. High Volt. Eng. 2018, 44, 463–469. [Google Scholar]
  3. Lu, J.; Xie, P.; Jiang, Z.; Fang, Z.; Wu, W. Voltage distribution and flashover performance of 220kV composite insulators under different icing conditions. Energies 2018, 11, 632. [Google Scholar] [CrossRef]
  4. Jiang, X.; Hu, Y.; Shu, L.; Zhang, Z.; Hu, J.; Hu, Q.; Wang, Q. Crystallisation effect of conductive ions in freezing water during phase transition and its effect on ice flashover voltage. IET Gener. Transm. Distrib. 2016, 10, 2147–2154. [Google Scholar] [CrossRef]
  5. Jiang, X.; Wang, Q.; Zhang, Z.; Hu, J.; Hu, Q.; Zhu, C. Ion migration in the process of water freezing under alternating electric field and its impact on insulator flashover. Energies 2017, 10, 61. [Google Scholar] [CrossRef]
  6. Hu, Y.; Jiang, X.; Shu, L.; Zhang, Z.; Hu, Q.; Hu, J. DC flashover performance of ice-covered insulators under complex ambient conditions. IET Gener. Transm. Distrib. 2016, 10, 2504–2511. [Google Scholar] [CrossRef]
  7. Farzaneh, M.; Chisholm, W. Insulators for Icing and Polluted Environments; John Wiley & Sons Inc.: New York, NY, USA, 2009. [Google Scholar]
  8. Yaji, K.; Homma, H.; Sakata, G.; Watanabe, M. Evaluation on flashover voltage property of snow accreted insulators for overhead transmission lines, Part I—Field observation and laboratory tests to evaluate snow accretion properties. IEEE Trans. Dielectr. Electr. Insul. 2014, 21, 2549–2558. [Google Scholar] [CrossRef]
  9. Yaji, K.; Homma, H.; Aso, T.; Watanabe, M. Evaluation on flashover voltage property of snow accreted insulators for overhead transimission lines. Part II—Flashover characteristics under salt contaminated snowstorm. IEEE Trans. Dielectr. Electr. Insul. 2014, 21, 2559–2567. [Google Scholar]
  10. Homma, H.; Yaji, K.; Aso, T.; Watanabe, M.; Sakata, G.; Demfalk, A. Evaluation on flashover voltage property of snow accreted insulators for overhead transimission lines, Part III—154kV full-scale flashover voltage test of snow accreted insulators. IEEE Trans. Dielectr. Electr. Insul. 2014, 21, 2568–2575. [Google Scholar] [CrossRef]
  11. Hemmatjou, H.; Farzaneh, M.; Fofana, I. Modeling of the AC arc discharge on snow-covered insulators. IEEE Trans. Dielectr. Electr. Insul. 2007, 14, 1390–1400. [Google Scholar] [CrossRef]
  12. Pappas, S.S.; Ekonomou, L. Comparison of adaptive techniques for the prediction of the equivalent salt deposit density of medium voltage insulators. WSEAS Trans. Power. Syst. 2017, 12, 220–224. [Google Scholar]
  13. Liu, Y.; Farzaneh, M.; Du, B. Investigation on shed icicle characteristeics and induced surface discharges along a suspension insulator string during ice accretion. IET Gener. Transm. Distrib. 2017, 11, 1265–1269. [Google Scholar] [CrossRef]
  14. Ale-Emran, S.M.; Farzaneh, M. Flashover performance of ice-covered post insulator with booster sheds using experiments and partial arc modeling. IEEE Trans. Dielectr. Electr. Insul. 2016, 23, 979–986. [Google Scholar] [CrossRef]
  15. Jiang, X.; Han, X.; Hu, Y.; Yang, Z. Model for ice wet growth on composite insulator and its experimental validation. IET Gener. Transm. Distrib. 2018, 12, 556–563. [Google Scholar] [CrossRef]
  16. Vita, V.; Ekomomou, L.; Chatzarakis, G.E. Design of artificial neural network models for the estimation of distribution system voltage insulators’ contamination. In Proceedings of the 12th WSEAS International Conference on Mathematical Methods, Computational Techniques and Intelligent Systems, Kantaoui, Sousse, Tunisia, 3–6 May 2010; pp. 227–231. [Google Scholar]
  17. Oikonomou, D.S.; Maris, T.I.; Ekonomou, L. Artificial intelligence assessment of sea salt contamination of medium voltage insulators. In Proceedings of the 8th WSEAS International Conference on Systems Theory and Scientific Computation, Rhodes, Greece, 26–28 October 2008; pp. 319–323. [Google Scholar]
  18. Yasui, M.; Naito, K.; Hasegawa, Y. AC withstand voltage characteristics of insulator string covered with snow. IEEE Trans. Power Deliv. 1988, 3, 828–838. [Google Scholar] [CrossRef]
  19. Wang, Y.; Ouyang, B.; Lian, S.; Pan, B. Study on electric field distribution along the surface of snowed composite insulator in high altitude area. High Volt. Apprais. 2016, 52, 115–123. [Google Scholar]
  20. Xiang, Z.; Jiang, X.; Zhang, Z.; Hu, J.; Jin, X.; Guo, Y. AC flashover performance of glass insulators covered with ice or snow at natural station. High Volt. Eng. 2014, 40, 1345–1350. [Google Scholar]
  21. Farzaneh, M.; Baker, T.; Bernstorf, A.; Brown, K. Insulator icing test methods and procedures: A position paper prepared by the IEEE task force on insulator icing test methods. IEEE Trans. Power Deliv. 2003, 18, 1503–1515. [Google Scholar] [CrossRef]
  22. IEC Std. 61245-2015, Artificial Pollution Tests on High-Voltage Insulators to Be Used on DC Systems; International Electrotechnical Commission: Geneva, Switzerland, 2015.
  23. IEC Std. 60507-2013, Artificial Pollution Tests on High-Voltage Insulators to Be Used on AC Systems; International Electrotechnical Commission: Geneva, Switzerland, 2013.
  24. Jiang, X.; Shu, L.; Sun, C. Insulation of Electric Power System under Pollution and Icing Conditions; China Electric Power Press: Beijing, China, 2009. [Google Scholar]
  25. Jiang, X.; Yi, H. Ice Accretion on Transmission Lines and Protection; China Electric Power Press: Beijing, China, 2002. [Google Scholar]
  26. Zhang, Z.; Huang, H.; Jiang, X.; Hu, J.; Sun, C. Analysis of ice growth on different type insulators based on fluid dynamics. Trans. China Electr. Soc. 2012, 27, 35–43. [Google Scholar]
Figure 1. Multi-functional artificial climate chamber.
Energies 11 02916 g001
Figure 2. Structural diagram of the specimen. (a) XP-160; (b) LXY-160; (c) FXBW-35/70.
Energies 11 02916 g002
Figure 3. Appearance of a snowflake under different environmental conditions. (a) Snowflake of artificial snow; (b) snowflake of natural snowfall.
Energies 11 02916 g003
Figure 4. Appearance of snow-covered insulator strings in the artificial climate chamber. (a) XP-160; (b) LXY-160; (c) FXBW-35/70.
Energies 11 02916 g004
Figure 5. Appearance of snow-covered insulators in the artificial climate chamber. (a) d = 5 mm; (b) d = 10 mm; (c) d = 20 mm.
Energies 11 02916 g005
Figure 6. Relationship between EL and ESDD.
Energies 11 02916 g006
Figure 7. Relationship between EL and ESDD.
Energies 11 02916 g007
Figure 8. Relationship between EL and d.
Energies 11 02916 g008
Figure 9. Flashover process of snow-covered FXBW-35/70. (a) t = 0; (b) t = 3.88 s; (c) t = 4.42 s; (d) t = 6.10 s; (e) t = 6.74 s; (f) t = 7.54 s; (g) t = 8.32 s; (h) t = 9.16 s; (i) t = 9.72 s; (j) t = 10.14 s; (k) t = 10.18 s.
Energies 11 02916 g009
Table 1. Main structural parameters of the specimen.
InsulatorD/mmH/mmL/mm
XP-160291162420
LXY-160280170410
FXBW-35/70110/806151375
Table 2. Alternating current (AC) arc flashover gradient of snow-covered insulator strings under different equivalent salt deposit density (ESDD).
ESDD
(mg/cm2)
XP-160LXY-160FXBW-35/70
Umin
(kV)
EL
(kV/cm)
Umin
(kV)
EL
(kV/cm)
Umin
(kV)
EL
(kV/cm)
0.0585.90.68275.60.615106.80.777
0.1073.60.58462.70.51091.60.666
0.1560.10.47757.20.46579.80.580
0.2051.20.40654.00.43970.30.511
Table 3. Fitting values of As, n and R2 according to the test results in Table 2 with Equation (4).
ParametersXP-160LXY-160FXBW-35/70
AS0.2340.2940.327
n0.3680.2440.296
R20.9520.9960.976
Table 4. Direct current (DC) arc flashover gradient of snow-covered insulators under different ESDD.
ESDD
(mg/cm2)
XP-160LXY-160FXBW-35/70
Umin
(kV)
EL
(kV/cm)
Umin
(kV)
EL
(kV/cm)
Umin
(kV)
EL
(kV/cm)
0.0576.00.60374.20.60388.00.640
0.1065.70.52160.00.48871.10.517
0.1558.80.46755.70.45357.90.421
0.2050.20.39851.20.41651.50.375
Table 5. Fitting values of As, n and R2 according to the test results in Table 4 with Equation (4).
ParametersXP-160LXY-160FXBW-35/70
AS0.2630.2720.203
n0.2850.2630.390
R20.9530.9910.988
Table 6. AC and DC arc flashover gradients of snow-covered insulators under different d.
d (mm)ACDC
Umin (kV)EL (kV/cm)Umin (kV)EL (kV/cm)
5154.01.120130.10.946
10142.61.037119.40.868
20126.10.917100.70.730
Table 7. Fitting values of Ad, m and R2 according to the test results in Table 6 with Equation (5).
FXBW-35/70AdmR2
AC1.4170.1420.965
DC1.2820.1820.925

