1. Introduction
Low-carbon electricity production using photovoltaic (PV) panels or building-integrated PVs on rooftops contributes to an increased use of renewable energies [
1,
2]. Among the various sources of renewable energy, the utilization of solar energy represents one of the most effective methods for combating climate change, and thus solar energy is supported by governments and policy makers worldwide [
3]. Accordingly, the use of solar energy has generated the need to assess the solar potential of cities throughout developing countries [
4].
Many solar potential models have been developed [
5,
6]. However, the amount of solar energy that reaches the terrestrial surface depends on the local weather conditions, atmospheric effects, surveying, orientation, and the slope and solar incident angle in the study area [
7]. Additionally, the insolation of the terrestrial surface is influenced by the rotation and translation of the Earth around the Sun and fluctuates with the cloud cover [
8]. Nevertheless, several works have concluded that the abovementioned models can be adjusted to accommodate small study zones [
9,
10]; thus, greatly increasing the number of potential studies for investigating the solar potential of cities in developed countries [
11,
12].
For many years, solar potential models of rooftops in urban areas have typically been generated by geographical information systems (GIS) data [
7]. Recently, to improve the precision of these models, light detection and ranging (LiDAR) data have been included for urban areas that take into account the horizontal surfaces (rooftops) only, excluding the walls, and discard the three-dimensional analysis, thereby enabling a study with other variables such as shading, orientation, and inclination [
13]. As a result, several algorithms have been developed to estimate the footprint area and shadows of buildings [
14,
15,
16]. At the same time, another technique known as rooftop digitization has been implemented by cartography or ortho mapping to evaluate solar models, as in [
17]. Additionally, some studies have developed a methodology to estimate the shadow factor in urban terrain considering the different conditions of the sky [
18]. Currently, the most accurate solar potential model in urban areas is obtained using a digital surface model (DSM) determined from LiDAR data and local meteorological time series [
19,
20,
21]. The high density of LiDAR data allows the solar potential model to consider the characteristics of the surroundings, such as the presence of vegetation, urban furniture, and shadows [
21,
22,
23].
However, estimating the solar potential in urban areas can vary depending on the urban morphology [
24]. Several works have demonstrated the relationship between the urban morphology and solar energy potential and its influence on the availability of solar energy [
25]. Therefore, several aspects, such as the orientation, height, urban compactness, and the shapes of buildings, should be considered within the concept of the urban geometry. All of these aspects influence the shadows of the surrounding urban furniture [
26,
27].
If a further evaluation of the solar radiation is performed, the orientation and the slope of the rooftop, which constitute crucial issues, can be calculated from LiDAR data. Some studies have confirmed that the main factors determining the relationship between the insolation level and the building shape are the width–length ratio and the building orientation [
28]. Additionally, other works have demonstrated that the solar energy potential of a rooftop depends on both its shape and its orientation [
24]. Consequently, these parameters are directly associated with the urban morphology. As a result, many investigations have been performed, all around the world, on the importance of the optimal orientation of PV panels [
29,
30,
31]. To perform an evaluation, vectors are defined for the azimuth, rooftop orientation, solar module, and received radiation, but the slope of the roof of a building constitutes another important factor that should be taken into account. The study of this vector set can enhance the study of the distribution of the solar potential in a city.
Circular statistics or directional statistics address angular data, axes, or vectors and enable an analysis of orientations in two dimensions. Circular statistics are applied in a variety of disciplines, such as biology [
32], meteorology (wind analysis) [
33], geography [
34], remote sensing [
35] and cartography [
36], to name a few. The analysis of angular data requires special methods because directional data are different from linear data. For example, the origin of circular data is an arbitrary direction (e.g., the X axis or north), and operations on circular data are performed within the interval of 0°–360°. Moreover, the relationships among circular data are not the same as those among linear data. For example, a value of 30 is greater than a value of 10, but 30° is not greater than 10° when considering that it represents cyclical information [
37]. Comprehensive works have addressed circular data [
38,
39,
40].
Several studies such as [
13,
25,
41] have employed circular graphics to represent the orientations of buildings with regard to the solar potential. Furthermore, reference [
41] studied the slopes of roofs and their contribution to the PV efficiency, but the experiment employed parametrically modelled buildings. Additionally, reference [
42] analyzed circular histograms, representing the orientation and its corresponding solar potential, and concluded that the orientation is a crucial factor for the yearly solar irradiation. In this way, reference [
13] assessed the orientation distribution of roofs as a function of the roof orientation in 538 identified buildings. However, the general tendency of the abovementioned works was to evaluate the solar potential from an annual point of view, and to model the buildings parametrically in most cases. In addition, no significant metrics dealing with directional statistics have been performed. The purpose of this paper is to perform a directional statistical analysis of the distribution of the monthly solar potential of rooftops in the city of Cáceres in relation to the orientations and slopes of the rooftops in three different neighborhoods. The added value of the present work is the higher precision of the data achieved as a consequence of the roofs having a greater level of detail (i.e., photogrammetrically restituted gables) and the monthly disaggregation of the results. In addition, three variables, namely the solar orientation, the roof slope, and the monthly solar radiation, in each building within the study areas are used to perform the statistical analysis, thereby enabling an analysis of how different urban structures affect the solar potential values. To carry out this analysis, different neighborhoods have been selected in terms of their street structure, building typology, and use (i.e., a central neighborhood in a downtown area, a residential area, and an industrial zone) in the study area.
Accordingly, the orientation and slope values will be treated as circular data, and the radiation values will be treated as linear data. Both the circular and the linear analyses will be performed and complemented with a study of the correlations between both variables to analyze the distribution of radiation in relation to the different urban morphologies within the city. The monthly potential solar energy reaching the rooftops will be calculated using the methodology described in [
21].
2. Study Case
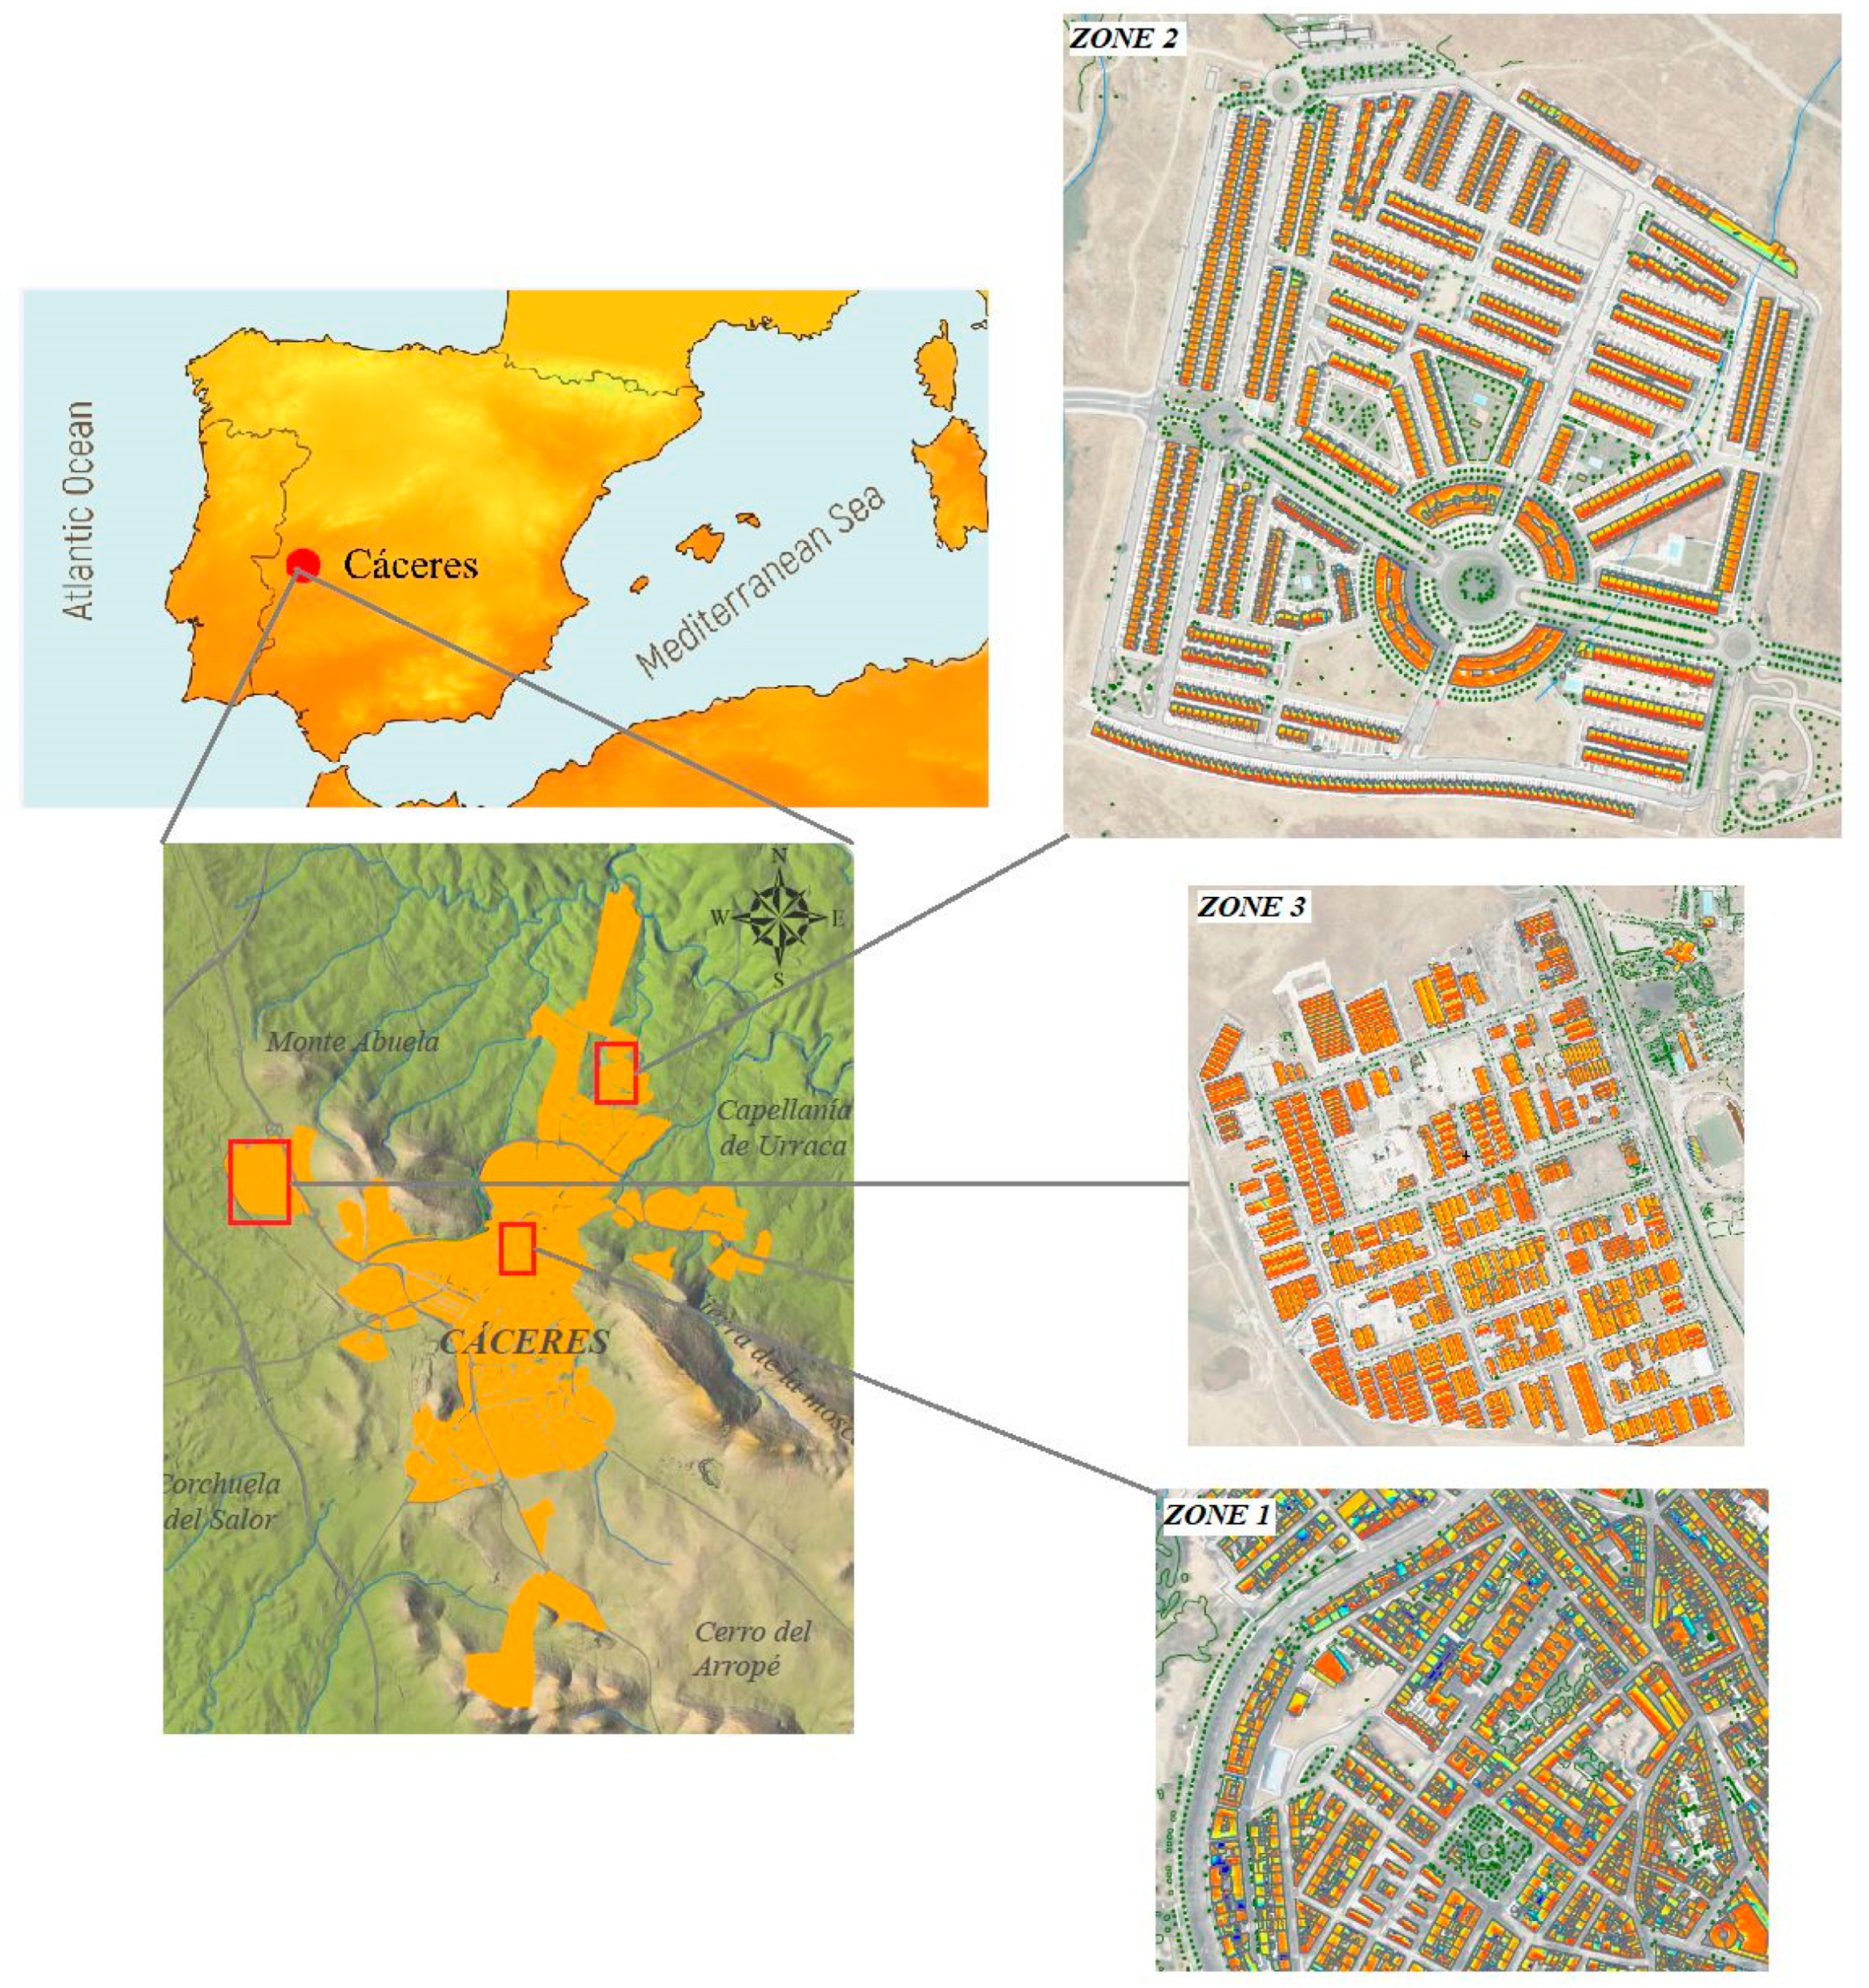
The working area is Cáceres, Spain, a medium-sized city with a mixed urban distribution and a population of approximately 100,000 (
Figure 1). This city, which spans an area of 23 km
2, was declared a World Heritage City by UNESCO in 1986.
Throughout its history, Cáceres has developed as a radio-concentric city, while favoring gradual growth and peripheral crowns based on residential polygons of unequal relationships and connections with each other. Currently, numerous different urban morphologies can be distinguished in the city:
- -
The Central Zone, whose origin is the historic center, which is predominated by a combination of low- to medium-density residential buildings.
- -
The East and West Residential Zones, which are predominated intensively by residential buildings.
- -
The West Single-Family Residential Zone, which is almost exclusively dominated by isolated detached and semi-detached buildings.
- -
The Northern Zone, which was constructed as much from urban development as from administrative reclassifications. Single-family residences coexist with a collection of medium-density residences in this area.
- -
The University Zone to the east, which is mainly institutional.
- -
The Industrial Zone, which is mainly located to the southeast and the northwest.
According to [
21], Cáceres is a city with a substantial renewable energy potential due to the monthly solar potential that, in some of the buildings, exceeds 7 kWh/m
2 during the summer months, namely May, June, and July.
Three neighborhoods were selected according to their different urban characteristics (
Table 1): A portion of the city center that had irregular streets and different types of buildings (zone 1), a new residential area on the outskirts of the city that had more regular and wider streets and similar types of buildings (zone 2), and an industrial area (zone 3) that had wide streets and similar types of industrial warehouse buildings.
The rooftop delineations were provided by the local council administration, and their gables were detailed in most of the buildings (
Figure 2). This cartographic information had an accuracy of 10 cm and represented all elements, such as the edges of rooftops, yards, cantilevers, and balconies, which can be appreciated at a scale of 1/500. In addition, other significant elements, such as chimneys and antennas, which could be crucial for the estimation of solar shadows, were also included in the delineation.
The variables to be analyzed in these three cases were as follows:
The orientation value of the rooftops, measured as the compass direction (north) of the descending slope of the gables, measured clockwise, and given in degrees.
The slope of the gables given in degrees and measured from the horizontal plane.
The radiation values obtained from GIS data and a DSM of the city from airborne LiDAR data [
21]. Radiation data are given in units of kWh/m
2. The computed solar potential model by GIS considers the orientations and tilts of the rooftops and the shadows from the surroundings, due mainly to vegetation and urban furniture, contrasting with most solar radiation recording stations which measure only the total horizontal solar intensity [
9].
As an example, the rooftop distribution of zone 1, which exhibited irregular streets and different types of buildings, is shown in
Figure 2.
Four applications, namely Oriana, VecStatGraphs2D, IBM SPSS, and Excel, were used to perform the statistical analysis. Oriana [
43] is a commercial application written for Microsoft Windows that calculates statistics and graphics for circular data, angles or directions measured in degrees, time of day, month of year, etc. VecStatGraphs2D [
33] is an R package [
44], designed for the statistical analysis of 2D vectors, that generates a set of statistics for both linear data (e.g., the arithmetic mean, standard deviation, variance, and skewness coefficient) and circular data (e.g., the mean azimuth, mean module, and circular variance), and it also generates graphics to address circular data. IBM SPSS [
45] is a platform that offers advanced statistical analyses, and it is especially used in the social sciences field.
3. Methods
All GIS data and DSM data derived from airborne LiDAR data could be analyzed to study the solar radiation potential of the rooftops in this study. The rooftop delineation was provided by the local council administration of Cáceres for the three selected study zones. As a result, a large quantity of data, namely 97,424, 83,064, and 363,898 gables for zones 1, 2, and 3, respectively (see
Table 1), were obtained for the three study areas. Every gable contained one orientation value, one slope value, and twelve radiation values (one for each month of the year). The orientation value was measured as the compass direction (clockwise from north) in the direction of the descending slope of the gables and was given in degrees. The slope of the gables was measured from the horizontal plane in degrees. All of the information was analyzed from different perspectives, considering that sets of vectors are created with both radiation values (the module of the vector) and orientation values (the azimuth of the vector).
The modules of the vectors (radiation values expressed in kWh/m
2) were analyzed by linear statistics. The usual analysis approach comprises descriptive statistics, such as the maximum and minimum values, arithmetic mean, median, standard deviation, skewness, kurtosis, and tests of normality for each month and zone. The arithmetic mean, minimum, and maximum values are displayed in
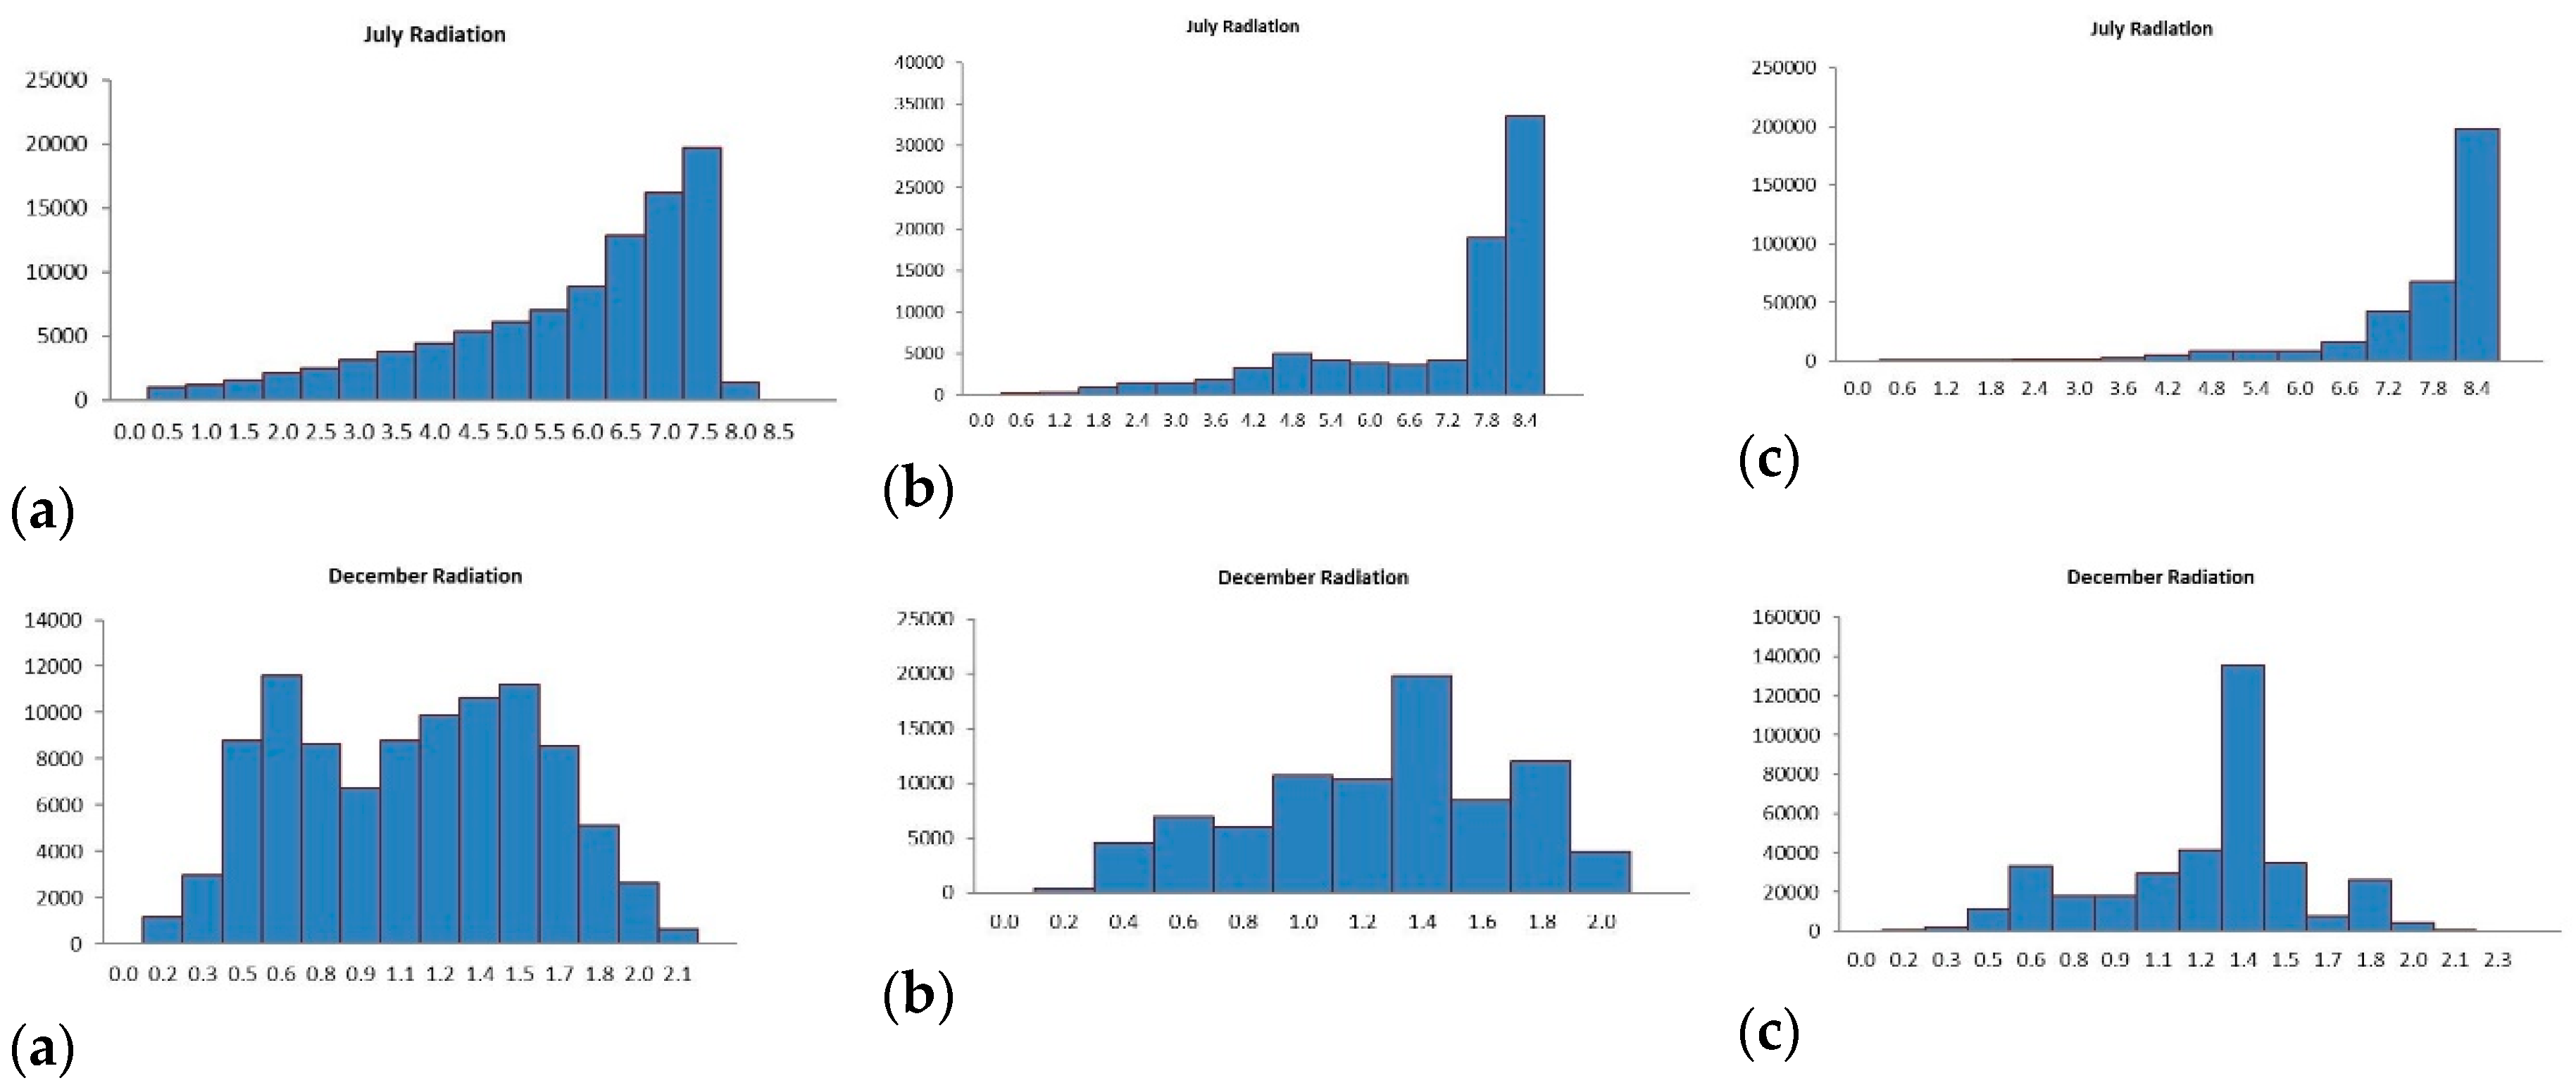
Table 2. The numerical statistics were complemented with histograms that represented the radiation values along the X axis, grouped in intervals, and the absolute frequencies of the radiation falling in each interval along the Y axis. One histogram was made for each month and area (36 in total) to compare the radiation distribution throughout the year in the three studied zones. The histograms of July and December for the three areas are shown in Figure 3.
The azimuths of the vectors (orientation values expressed in degrees) were analyzed by circular statistics. As circular or directional statistics address angular data, the slopes of the gables were also analyzed with the same procedure. In this case, the statistics chosen to define the distribution of the data were the mean azimuth, the circular standard deviation, the circular variance, and the concentration parameter.
The mean azimuth (
) was the azimuth of the vector sum (R) of the data, and it was analogous to the arithmetic mean in linear data; it was computed from the sines (S) and cosines (C) of the
n individual angular data.
The circular variance and the circular standard deviation were calculated as a measure of the dispersion of the data. The circular variance (
V) was calculated from the vector sum (
R) and the mean module (
) according to the following:
The circular standard deviation (
) is similar to the standard deviation for linear data, and its expression is as follows:
The concentration parameter, also known as the von Mises parameter, is a measure of the concentration of the data around a preferred direction within the circle in the von Mises distribution, which is a symmetric unimodal distribution similar to a Gaussian distribution in linear data [
37]. This parameter is 0 in a uniform distribution and is considered significant when greater than 2. In a uniform distribution, all directions from 0° to 360° are equally probable, and the distribution is spread uniformly around the circle.
The radiation values (Figure 4) and the slope values (Figure 5) were plotted to analyze their distributions. It should be noted that these graphics consider the orientation and the slope values as unit vectors, and thus it will be necessary to obtain more comprehensive information.
One limitation of using circular statistics is that they are designed to address vector units, whereas it is usually necessary to work with non-unitary modules. It is possible to analyze angles and modules in an independent way, but a more complete study requires employing both the module and the azimuth of each vector.
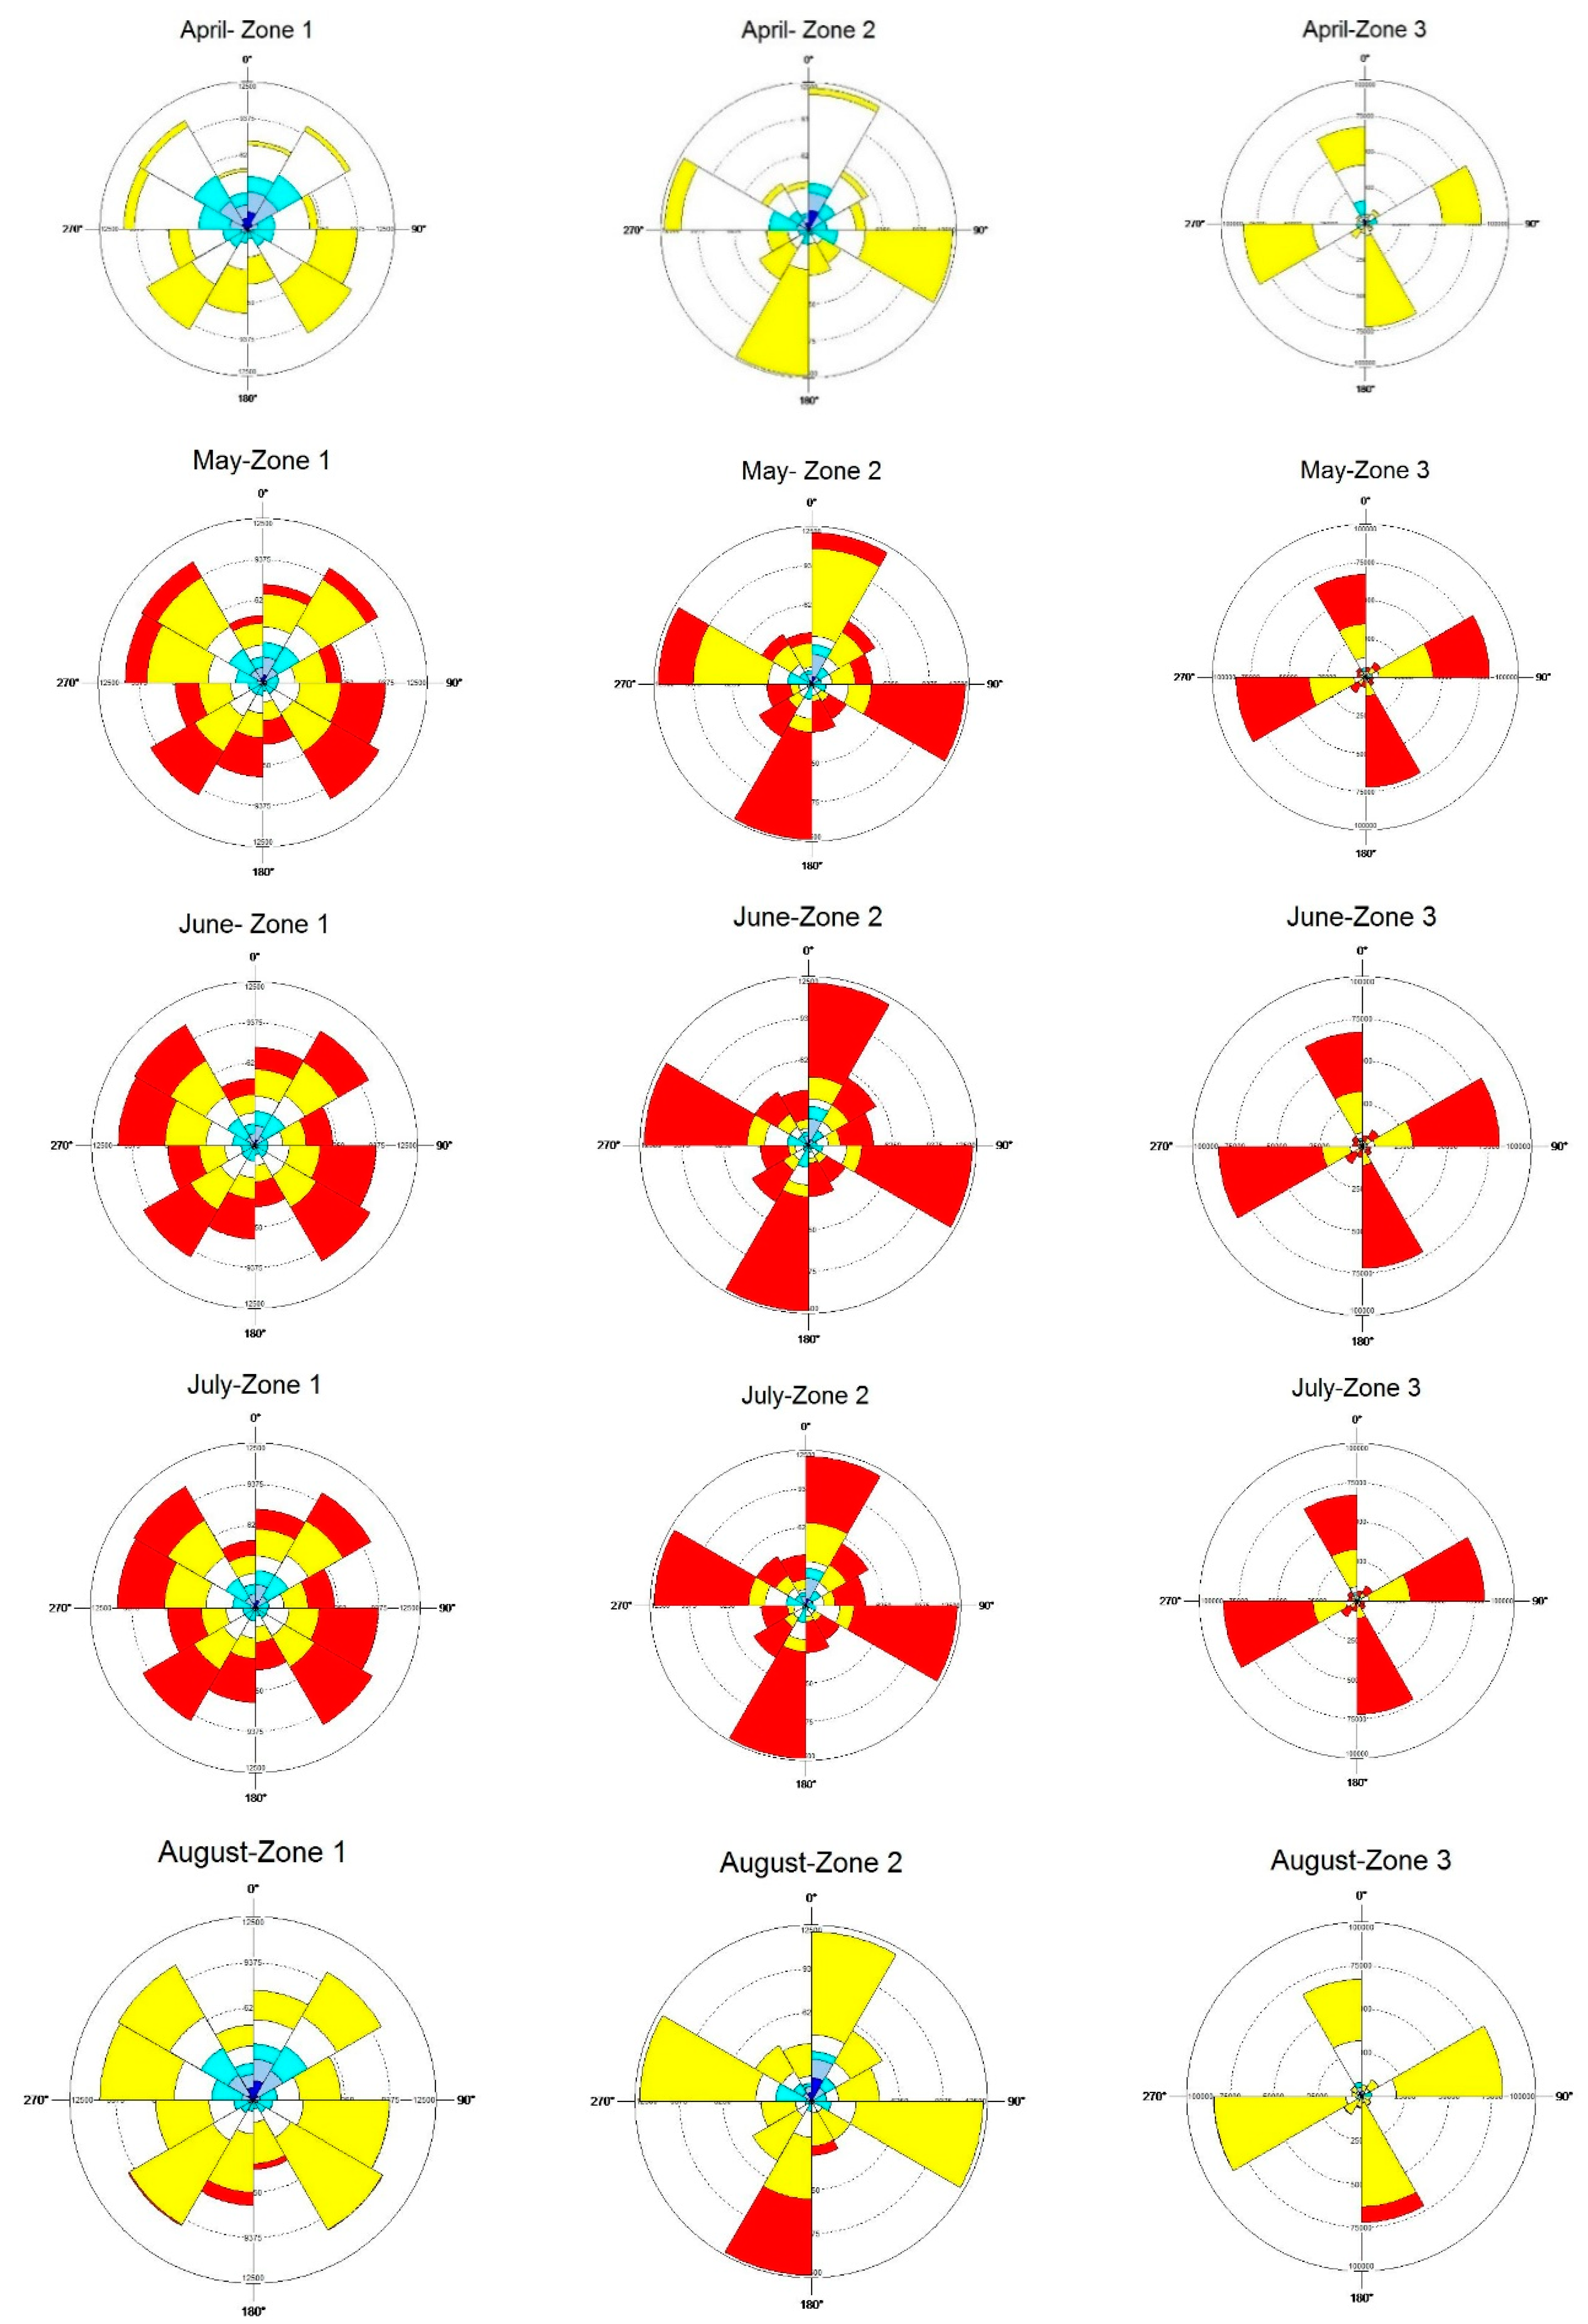
The joint distribution of the circular and linear data is provided in a two-variable circular histogram graphic. This graphic consists of a histogram wrapped around a circle, in which each wedge-shaped section of the histogram depicts the number of observations (radiation values) falling within that portion of the range. In this graph, each wedge spans 30° (a customized parameter) of the total circular range, and the length of each wedge represents the number of observations falling within that range. Every wedge divides the radiation variable into frequency classes represented by a color ramp. Blue colors represent low radiation values, whereas red colors imply a higher level of received radiation. Figure 6 shows 36 two-variable circular histogram graphics corresponding to a graph for each month and area. These graphs enabled a comparison of not only the differences in the orientations of the gables according to each area but also the distributions of the radiation and the variations of this parameter throughout the year.
Finally, the circular-linear correlation coefficient was calculated to assess the correlations among the circular variable, the orientation, the linear variable, and the radiation [
40]. The correlation coefficient ranges from 0 to 1, and it works under the assumption of a Gaussian distribution of linear data.
4. Results
The directional statistical analysis of the distribution of the monthly solar potential of rooftops in the city of Cáceres, in this study, was based on the vector distribution. Since vectors have a module and an azimuth, analyses from different perspectives could be performed. In this study, the module of the vector corresponds to the radiation value.
Table 2 provides some descriptive statistics for the radiation values (expressed in units of kWh/m
2) of the three zones: The arithmetic mean, the minimum radiation, and the maximum radiation values received.
The values of the arithmetic means in zones 1, 2, and 3 were 3.77, 4.06, and 4.46 kWh/m2, respectively. The minimum value of the received radiation (0.003 kWh/m2) was found in zone 1. A higher value was reached for zone 2 (0.03 kWh/m2), and a mean value of 0.01 kWh/m2 was found in zone 3. These three cases show little variation among all of the months. Therefore, zone 1, in the city center, received less radiation than the other two zones, and the differences in the average solar potential between the three studied zones reached 9% between zones 1 and 2, and between zones 2 and 3, and 16% between zones 1 and 3.
The maximum values of the arithmetic means and the maximum values of the radiation were obtained in July for zones 1 and 2, and in June for zone 3. The maximum values of the arithmetic means in zones 1, 2, and 3 were 6.28, 6.75, and 7.44 kWh/m2, respectively, and the maximum values of the radiation were 8.33, 8.27, and 8.31 kWh/m2, respectively, with the same criteria. The minimum values of the arithmetic mean were obtained in December for zones 2 (1.16 kWh/m2) and 3 (1.13 kWh/m2), and in January for zone 1 (1.08 kWh/m2).
Other descriptive statistics revealed that all of the skewness coefficients were negative. Thus, the tail of the left side of the distribution was longer than that of the right side, especially in the month of July, as seen in
Figure 3.
Figure 3 shows the histograms corresponding to July and December for the three studied areas. The same histograms were wrapped around for each year, thereby giving the values for the orientations in the two-variable circular histogram graphics (Figure 6).
In the directional statistical analysis of the distribution of the monthly solar potential of rooftops in the city of Cáceres, in this study, the azimuth of the vector corresponded to the orientation value.
Table 3 shows some of the circular statistics for the orientations in the three studied zones. The circular statistics employed herein were the mean azimuth, which represented the mean direction of the orientations, the circular variance, and the circular standard deviation, all of which were measurements of the dispersion. In contrast, the concentration parameter was a measure of the concentration of the data around a preferred orientation.
The mean azimuth was not a significant parameter because of the distribution of the data. The high values of the circular standard deviation revealed a large dispersion within the data. In addition, the circular variance ranged from 0 to 1, where smaller values of the circular variance indicated that the data were more concentrated. The concentration parameter was very low in all cases (0.05, 0.05, and 0.03 in zones 1, 2, and 3, respectively); therefore, there was no preferred orientation in any case. The concentration parameter was 0 in a uniform distribution and was considered significant when greater than 2. In any case, the data did not follow a uniform distribution according to the test of uniformity.
Figure 4 presents the values of the radiation as blue symbols measured clockwise from 0° (north). In all cases, due to the large number of observations, each symbol represented multiple observations, but the proportionality of the figure was maintained.
The circular graphics representing the orientation data show the distribution of the houses in relation to the urban framework.
Zone 1 in the city center presented a more dispersed urban framework, as was reflected in the variation in the orientation. In zone 2, a new residential area on the outskirts of the city with a more regular framework, had a greater number of orientations in the two main directions. In zone 3, an industrial area, practically all buildings were located along two perpendicular directions.
Similar to the orientation, the slopes of the gables were also analyzed.
Table 4 shows the same circular statistics used to explain the gable orientations.
Logically, all of the slopes ranged from 0 to 90°. The lowest mean azimuth was 58.25° in the city center (zone 1), and the highest mean azimuth (73.07°) corresponded to the lower slope values in the industrial area (zone 3). Unlike the case of the orientations, the circular standard deviation values presented smaller results, while higher values were observed for the concentration parameter, thereby indicating the existence of a preferred orientation. The data were more concentrated around the mean azimuth, especially in zone 3, which exhibited a very high concentration parameter (12.30). The low values of the circular variance were in accordance with this hypothesis.
Figure 5 presents the values of the slope as blue symbols measured from the horizontal plane. In all of these cases, due to the large number of observations, each symbol represented multiple observations, but the proportionality of the figure was maintained.
The circular graphics representing the slope data of the rooftops were related to the typologies of the buildings. Zone 1, which contained older and heterogeneous types of buildings, presented a greater variety of slopes, whereas the industrial area (zone 3) had more concentrated and horizontal slope values, and zone 2 presented an intermediate situation between zones 1 and 3.
The following discusses the joint analysis of the linear (radiation) and circular (orientation) data. The circular–linear correlation coefficient represented the correlation between both the orientation variable and the radiation variable, and ranged from 0 to 1. Therefore, there was no negative correlation. Due to the low p-values in all cases, the null hypothesis of correlation between the two variables was rejected.
The two-variable circular histogram graphic (
Figure 6) displays a histogram wrapped around the circle, where each section of the histogram is a 30° wedge that depicts the number of observations (radiation values) falling within that portion of the range. Blue colors represent low radiation values, while red colors imply a higher level of received radiation.
According to the two-variable circular histogram graphics in
Figure 6, the roofs oriented towards the north received less radiation than those oriented towards the south, especially from September to March. In those months, the highest contrasts were located in zone 1, where the difference between the north and south orientations was approximately 52%. In contrast, from May to July, the Sun was higher and the radiation values for the two orientations were relatively equal. In this way, the smallest differences were located in zone 3, with only a 10% variation in the potential radiation between the north- and south-facing rooftops.
5. Discussions
The numerical and graphical results presented above allow a comparison of the radiation values, over an entire year, for different types of buildings in a medium-sized city in Spain. Using this type of statistical analysis could enable this methodology to be extrapolated to other cities with different urban frameworks and solar radiation potentials. This approach is; therefore, a useful tool to handle the challenges associated with climate change.
The circular graphics representing the slope data of the rooftops are related to the typologies of the buildings in the three different zones. According to the two-variable circular histogram graphics, the roofs oriented towards the north received less radiation than those oriented towards the south, especially from September to March. In contrast, from May to July, the Sun was higher, and the radiation received by the rooftops oriented in both directions were relatively similar. These results confirm those obtained by [
46], who determined that the solar radiation varies with the geographic latitude, that the shortest period faces the direct sunshine, and that the solar radiation falling on the north-facing vertical plane is the lowest. More specifically, other studies conducted at similar geographic latitudes, such as [
47], confirmed that the optimal building rooftop and façade orientation for the installation of a PV system faces the south when implementing solar urban planning.
In light of our results, a 10% variation in the potential radiation between north- and south-facing rooftops was found in zone 3 for the summer months. This result is in accordance with the findings of [
13], who obtained a 15% higher annual solar potential for south- and southwest-facing roofs in working areas at approximately the same latitude. In contrast, zone 1 exhibited differences of approximately 52% between the north and south orientations, from the autumn to the spring seasons. These variations confirm the achievements of [
42], who concluded that the morphology of each district is crucial for determining the solar potential.
Nevertheless, other works such as [
25] found a direct relation between the orientation and the annual solar irradiation in 16 studied neighborhoods, due to the high dispersion of orientations for the studied buildings. They concluded that the building density has a larger impact on the solar radiation than the building orientation. Ref. [
42] also confirmed a difference of 15% in the annual solar potential between two different neighborhoods. All of these findings support the differences reached in the average solar potential between the three studied zones, from 9% between zones 1 and 2 and between zones 2 and 3, to 16% between zones 1 and 3. In addition, the precision of the monthly evaluation in each zone can be extended to detect the months with the highest differences (November and December), and those with only slight differences in the radiation values among the different zones (June and July).
Circular graphics representing orientation data suitably represented the distribution of buildings within an urban framework. In this way, ref. [
48] established that the impact of the geometry of a city on the solar energy potential was significant (up to twice as much as the impacts of other factors). Regarding the urban characteristics, the differences in the solar radiation found in the three different neighborhoods are also in accordance with the findings of studies such as [
42], in which the organizations of streets, buildings, and other urban elements had high impacts on the obtained results. However, none of the abovementioned studies considered the monthly radiation and instead focused only on the annual solar irradiation.
Finally, regarding the slope analysis, the inclusion of the real inclinations of rooftops improved upon the results obtained by works such as [
41] that were limited by the use of parametric models and by the consideration of horizontal roofs.


