Article

Optimal Design of Rated Wind Speed and Rotor Radius to Minimizing the Cost of Energy for Offshore Wind Turbines

1
College of Electrical and Information Engineering, Hunan University, Changsha 410082, China
2
School of Information Science and Engineering, Central South University, Changsha 410083, China
*
Authors to whom correspondence should be addressed.
Energies 2018, 11(10), 2728; https://doi.org/10.3390/en11102728
Submission received: 18 September 2018 / Revised: 29 September 2018 / Accepted: 1 October 2018 / Published: 11 October 2018
(This article belongs to the Special Issue Offshore Renewable Energy: Ocean Waves, Tides and Offshore Wind)

Abstract

:
As onshore wind energy has depleted, the utilization of offshore wind energy has gradually played an important role in globally meeting growing green energy demands. However, the cost of energy (COE) for offshore wind energy is very high compared to the onshore one. To minimize the COE, implementing optimal design of offshore turbines is an effective way, but the relevant studies are lacking. This study proposes a method to minimize the COE of offshore wind turbines, in which two design parameters, including the rated wind speed and rotor radius are optimally designed. Through this study, the relation among the COE and the two design parameters is explored. To this end, based on the power-coefficient power curve model, the annual energy production (AEP) model is designed as a function of the rated wind speed and the Weibull distribution parameters. On the other hand, the detailed cost model of offshore turbines developed by the National Renewable Energy Laboratory is formulated as a function of the rated wind speed and the rotor radius. Then, the COE is formulated as the ratio of the total cost and the AEP. Following that, an iterative method is proposed to search the minimal COE which corresponds to the optimal rated wind speed and rotor radius. Finally, the proposed method has been applied to the wind classes of USA, and some useful findings have been obtained.

1. Introduction

Renewable energy has been very attractive since the end of last century, as there have been ever-growing concerns over limited fossil-fuel resources, serious environmental regulations, and heavy energy demand. Among various types of renewable energy, wind energy is one of the most economical sources. The wind energy development has been rapidly developed in recent years. In 2017, the global cumulative installed wind turbine capacity has reached a new peak value of 539.58 GW [1]. On the other side, there is a new trend for the development of wind energy, that is, the installation of wind turbines has gone from onshore sites to offshore sites [2]. Despite the rapid growth of wind energy utilization, the challenge still exists, especially for the offshore-site turbines. The high cost of energy (COE) for offshore wind power (compared to the onshore wind power and traditional sources) has hindered the utilization of offshore wind energy across the world.
As the turbine COE is relevant to the total annual cost and the annual energy production (AEP) [3], optimizing COE reduces the production cost and increases the production efficiency. Considering the overall procedure of the wind turbine development, the potential approaches for minimizing COE can be accordingly categorized into three types: design optimization, manufacturing process optimization, and on-site optimization. Since the manufacturing procedure depends on the manufacture technology which is normally scheduled during a certain period, its optimization is hard to employ in practice. By comparison, the on-site optimization is utilized as a common practice in the wind energy industry [4]. The on-site optimization is to optimize the turbine controller and its parameters matching the wind characteristics, so the AEP is enhanced by optimizing the energy capture efficiency below rated wind speeds. Two types of approaches are available for the on-site optimization. One approach is to control the rotor speed to follow the changing wind speed, so that the known principle of the optimal tip speed ratio tracking can be fulfilled [5]. To do this, the advanced wind estimator-based torque controller has been utilized by industrial turbines [6,7,8], and the Lidar-based previewer controllers have gradually been payed attention to [9]. Meanwhile, some researchers have proposed to optimize the performance by adjusting the controller parameter according to the wind condition [10], as it has been revealed that the controller performance is significantly affected by the wind conditions [11,12]. Furthermore, the energy production efficiency can be improved by considering a hybrid wind-hydro power plant for the isolated power system [13,14]. The other approach of improving the energy capture efficiency is to control the yaw system to track the wind direction, so that the yaw error can be minimized. In some recent studies, the previewed yaw controller and its parameter optimizations have been proposed, which have been proven to be efficient in enhancing the energy capture efficiency [15,16]. Despite these on-site optimizations being cost-effective and convenient to carry out, the achieved profit is quite limited as the energy capture efficiency is only improved in some control regions.
Many efforts have been made towards improving the performance of the wind turbines through design optimization. A comprehensive review of wind turbine optimization technologies is given in [17], in which a few of works have been referred for wind turbines towards minimizing the COE by optimizing the aerodynamics shape of airfoils. As a key wind turbine component, the blade is a determining factor for energy harvesting efficiency and its aerodynamic shape optimization is very momentous. The aerodynamic shape optimization involves many objectives, such as the AEP, the air loads of the blades and rotors, and the blade mass. Improving one objective inevitably deteriorates the others, and thus the aerodynamic shape optimization widely uses multi-objective functions. A numerical optimization method for the design of horizontal axis wind turbines is presented in [18], in which the fatigue and extreme loads and the AEP are considered. A multi-objective optimization method is proposed for the turbine blade using the lifting surface method as the performance prediction model [19]. The first study on the external axis wind turbines is conducted to optimize blade count and operating point to simultaneously maximize power, while minimizing power fluctuating and the peak point reaching time [20]. When these researches optimize the aerodynamic shape, most of them only concerned with the open-loop static aerodynamic performance, that is, the AEP is calculated under the implicit assumption that the turbines can keep operating at the optimal TSR. But in practice, the large-scale wind turbines cannot instantly respond to the wind fluctuation and the performance is influenced by the wind conditions [21]. In this regard, the closed-loop optimal design should be considered, which has been presented in a recent study [22]. Nevertheless, the blade aerodynamic optimization is a small portion of the turbine design, and the optimal design involving the most important parameters of the overall design may achieve a low COE in an effective way.
As the first step of design process of wind turbines, the conception design defines the most important parameters, of which the optimizations have been proven to be highly efficient in minimizing the COE [23,24,25,26,27]. The dominant ingredient of designing a satisfactory turbine with low COE includes the suitable physical and operational parameters, which are determined by the wind conditions on the erected site of the turbines, but there have been very few studies conducted. An optimization method is presented for the concept design of a grid-connected onshore wind turbine, in which the blade number, rotor diameter, tower height, rotor rotational speed, the rated wind speed, and the rated power have been optimized to match the wind condition described by the Weibull parameters [28]. Based on the case study results, it has been shown that some of the existing onshore turbines appear to be well designed, and others do not. An iterative approach is presented to optimize the turbine design based on a simple COE model, which is a function of rotor diameter, tower height, rated power, and the TSR. In their results, it is revealed that the onshore turbines about 1–2 MW can achieve minimum COE for considered cases [29]. Another design study is conducted on onshore turbines, in which the COE model is described relevant to rotor diameter, hub height, capacity factor, rated power, and rotor diameter [30]. Recently, a mathematical approach is proposed to minimize the COE of onshore turbines, in which the COE model is expressed as a function of rated power and rated wind speed [31]. When compared with the referenced turbines, a noticeable profitability has been gained by the optimized turbines. The above references have shown that the site-specific turbine design can achieve a low COE for onshore turbines, but the studies for the offshore wind turbines are lacking.
Currently, the offshore wind turbines are designed towards the large-size trend, but whether the offshore turbines with large capacity and long blades will have a low COE remains unclear. This paper aims at clarifying this issue. For this purpose, the relation among the COE, the rated wind speed, and the rotor radius is established, a method to achieving optimal COE of the offshore turbines is proposed, and the optimal results are obtained and analyzed. Since the cost model is important to determine the COE results, the detail cost model of the bottom-fixed offshore wind turbines developed by NREL is employed in this study [32]. By comparison to the literature, the contribution of this study is twofold: on one hand, a method to minimizing the COE of offshore turbines through optimizing the rated wind speed and rotor radius is proposed, which can be extended to other types of wind turbines; on the other hand, the optimal design parameters achieving the minimal COE of offshore wind turbines are obtained and explored under different wind conditions, which can be used as references for offshore wind turbine designers. The remaining sections are organized as follows: the design process of wind turbines is summarized in Section 2. The COE model of onshore turbines is discussed in Section 3, and Section 4 presents the method of optimizing COE by selecting the optimal rated wind speed and rotor radius, and the optimal results through the case studies. Finally, Section 5 concludes the study.

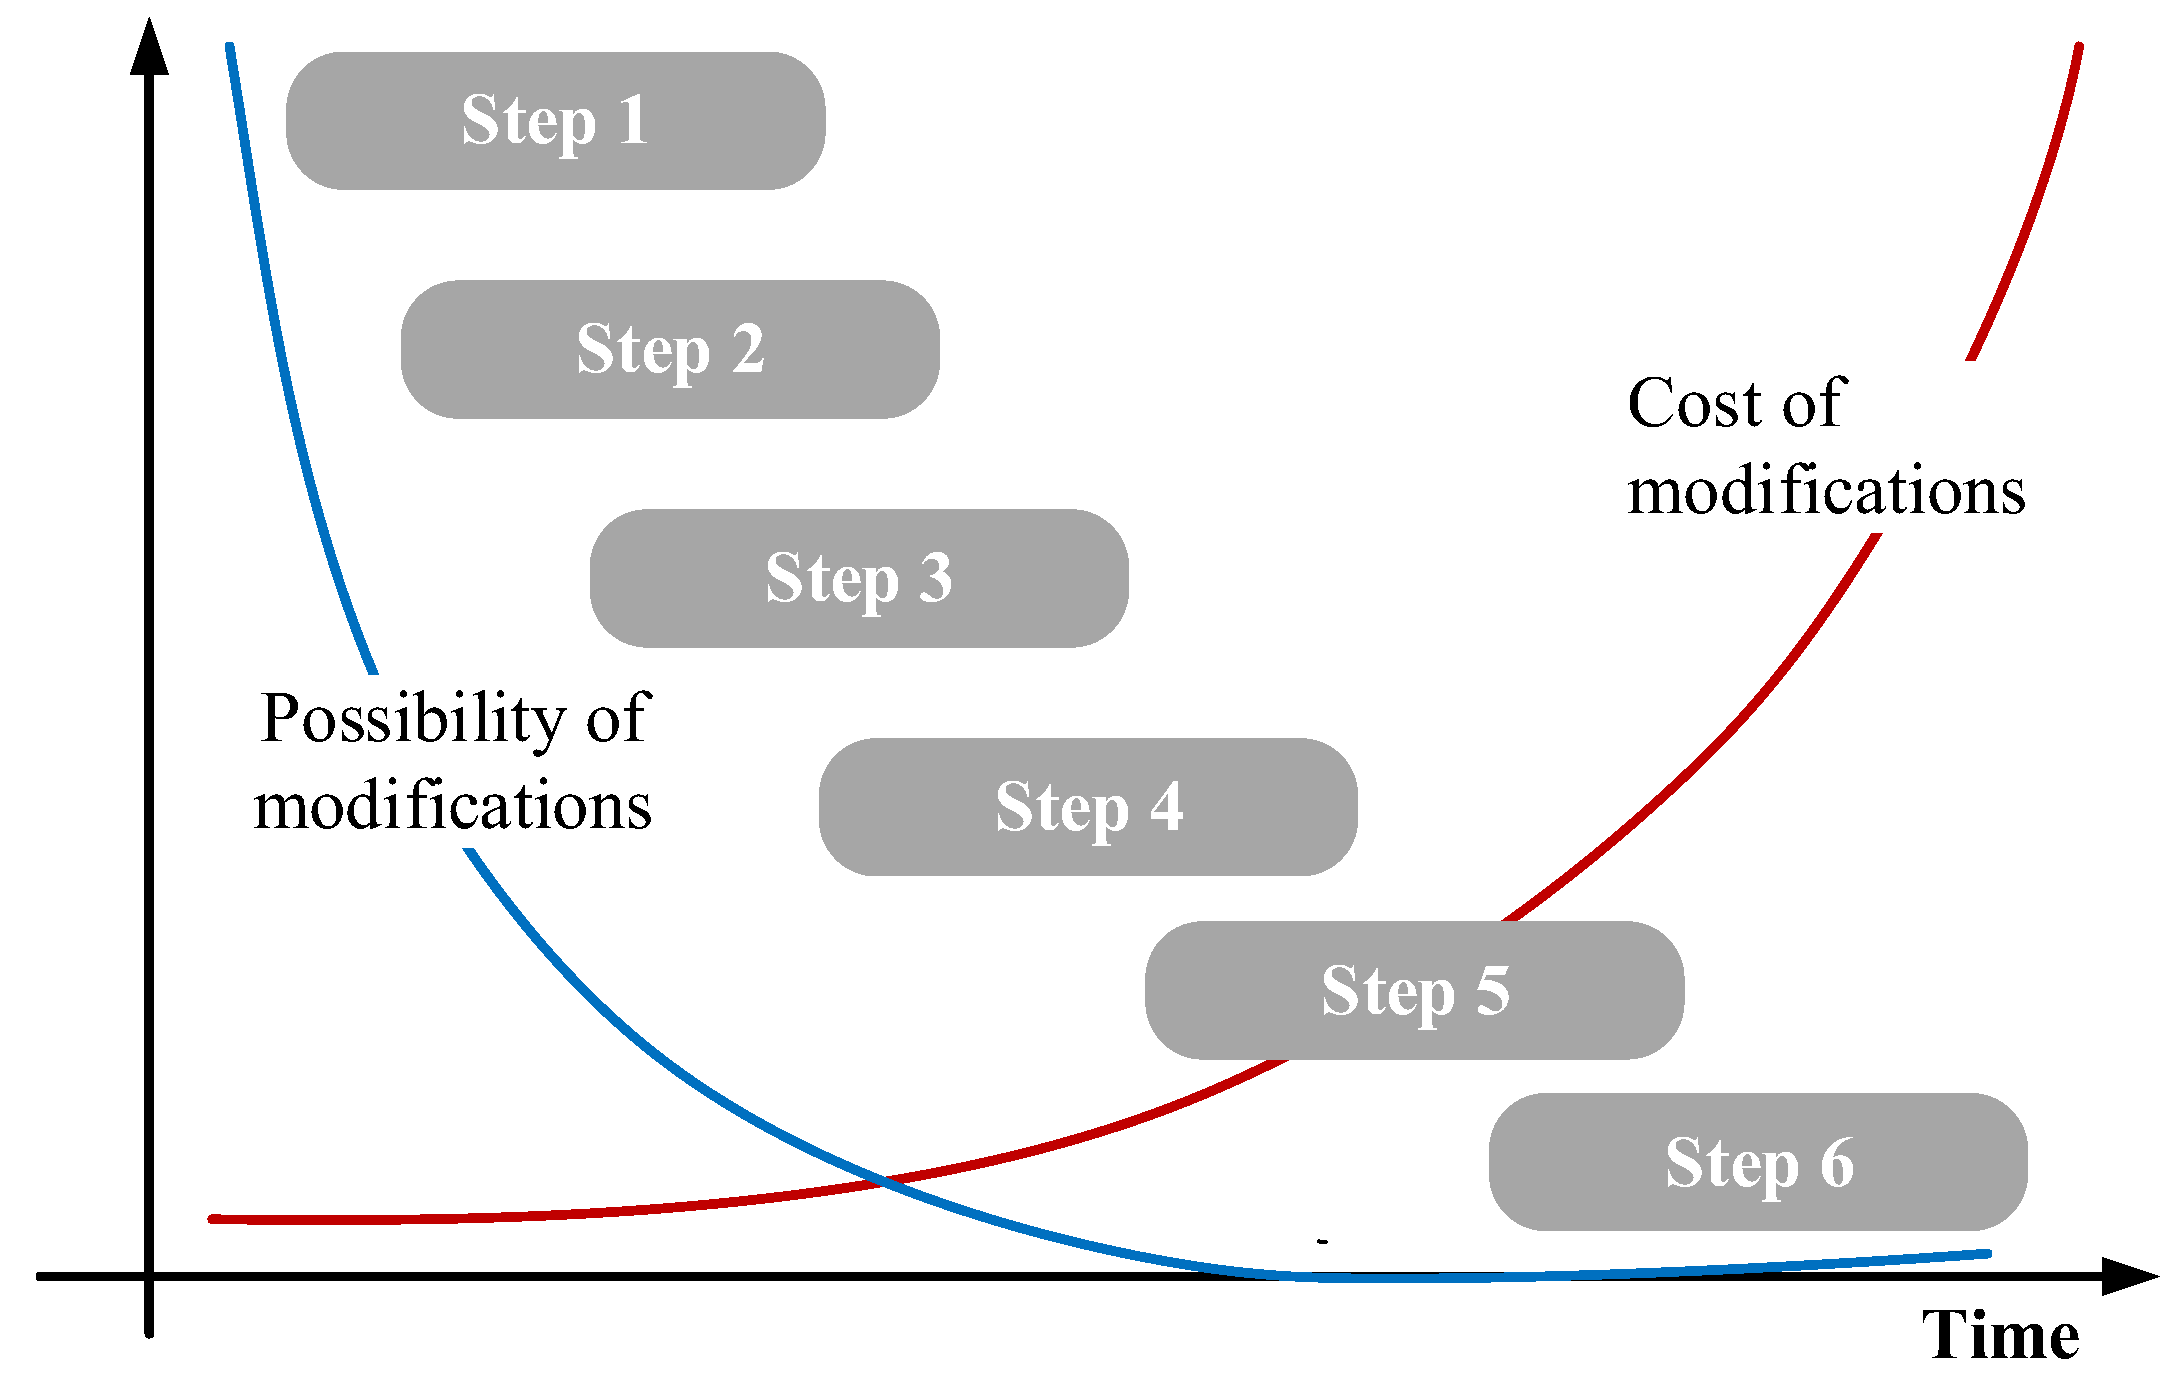
2. Design Process of Wind Turbines

For a wind turbine, its design process can be divided into six steps [33]:
  • Step 1: Conception stage. As the first stage of a turbine design, the conception design involves the definitions of the nominal parameters of the wind turbine, such as the nominal power output, rotor diameter, electrical energy conversion system and so on.
  • Step 2: Blade design. The blade design step defines the aerodynamics and structural concepts of the blades, which are determined by the overall conception in the step 1 and the controller development in the step 3, respectively.
  • Step 3: Control development and preliminary design models. During this step, the preliminary design models, which are typically based on multibody models, are employed to estimate the loads acting on major components of the turbine during its life cycle. When the loads are beyond limitations, the controller and blade structural designs will be required to be redesigned. Thus, steps 2 and 3 depend on each other, and the final design of blades and controller will be finished after several iterations.
  • Step 4: Design engineering and strength calculation. During this step, a strength calculation of the major components is carried out, so that it can be verified that the designed components are able to withstand the loads calculated during the life cycle.
  • Step 5: Construction and erection of the prototype. During this step, the prototype of the wind turbine is manufactured and erected on the wind farm site.
  • Step 6: Measurements on the prototype. As a final step, it aims at proving the predicted property of the designed turbine within a measurement campaign.
From the above explanation, it is evident that the conception design has a crucial impact on the COE of the designed wind turbine due to its placement at the first stage of the design process. To further illustrate its importance, the time line of the wind turbine’s design process in terms of the cost and the possibility of modifications during the development is shown in Figure 1.
It is obvious that it is the best chance to modify the design at the conception stage rather than other stages to obtain the least cost and the most possibility. This conclusion specially fits the application occasion of the offshore turbines, as the overall COE is very high compared to the onshore turbines. Therefore, minimizing the COE of offshore wind turbines is indispensable and it is the objective of this study.

3. COE Model of Offshore Turbines

The COE of the offshore wind turbine is determined by two parts: the annual energy production (AEP) and the total annual cost, and these two parts are elaborated in the following sections.

3.1. AEP Model of the Offshore Turbines

The AEP model of the offshore turbines is similar to the one of the onshore turbines, which is normally estimated based on the Weibull probability distributions of the wind statistics, a standardized power curve, a physical description of the turbine and physical constants. The difference between the AEP models of offshore and onshore turbines consists in the wind statistics. Specifically, the roughness of the sea surface is different from the one of land-based surface, and thus the wind statistics may be different. The AEP output of turbines can be calculated by using the mean power production P m during one hour and the total hours of one year:
AEP = 8760 ( 1 ς ) P m
where ς is the total power generation loss, which includes the power converter loss, electrical grid loss, availability loss and so on. In this study, ς is assumed to be a constant of 0.17 [34].
When determined by the power curve of the concerned turbine and the wind characteristics on the erected site, which is expressed as a Weibull distribution, the mean power production P m is calculated by
P m = 0 P ( v ) f ( v ) d v
where v is the wind speed, P ( v ) and f ( v ) denote the power curve model and the Weibull distribution as functions of the wind speed, respectively.

3.1.1. Power Curve Modeling of the Offshore Turbines

Wind turbines have different power curves, even the same turbine may produce different power determined by the control curves. At an offshore site, the typical type of wind turbines is the large-scale variable-speed horizontal-axis machine, and its power curve mainly relies on the important characteristics of the wind speed, in which the cut-in wind speed v c , rated wind speed v r , cut-out wind speed v f are involved. At cut-in v c , the turbines is able to start generating power; at the rated wind speed v r , the turbine produces the rated power P r ; and at the cut-out wind speed v f , the turbine stops producing power to avoid its component over-loads. Hence, the power curve model of the turbines can be formulated by
P ( v ) = { 0 ( v < v c ) P f ( v ) ( v c v v r ) P r ( v r v v f ) 0 ( v f < v )
where P f ( v ) is the power fitted to manufacturer power curve data by using mathematical formulation.
From Equation (3), it is seen that the power curve is mainly determined by P r and P f ( v ) , of which the theoretical model is expressed by
P f ( v ) = ρ π R 2 C p , max v 3 / 2
where ρ and R denote the air density and the rotor radius, respectively; C p , max is the maximum value of power coefficient of the concerned turbine.
Besides the theoretical model, there are some other models, which are predicted by sampling the turbine output power at various wind speed. In [35], nine power curves models have been presented and compared, including linear model, general model, quadratic model, cubic-I model, cubic-II model, exponential model, power-coefficient model, approximate power-coefficient model, and polynomial model. Through the comparison results, it is observed that the power-coefficient model has the most accurate results. Thus, this study employs this model, which is expressed by
P f ( v ) = ρ π R 2 C p , e q v 3 / 2
where C p , e q is the equivalent power coefficient, which is a constant for the variable-speed wind turbines operating in the range between the cut-in and rated wind speed [35,36]. In this study, it is assumed to be 0.42 [36]. It is noticed that, by setting v = v r , the turbine rated power P r can be calculated by
P r = ρ π R 2 C p , e q v r 3 / 2
By referring to Equations (1)–(6), the AEP model is determined by the rotor radius, rated wind speed, cut-in wind speed, and cut-out wind speed, and accordingly it is reformulated by
AEP = f AEP ( R , v r , v c , v f ) = 1454.16 ρ π R 2 ( v c v r v 3 f ( v ) d v + v r v f v r 3 f ( v ) d v )

3.1.2. Weibull Distribution of the Offshore Wind Statistics

In this study, the Weibull probability density function f ( v ) is employed to represent the offshore wind statistics, which depends on the parameters k and c that determine the shape and intensity of the wind during one year on a site [28]:
f ( v ) = ( k / c ) ( v / c ) k 1 e ( v / c ) k
where c and k denote the scale parameter and the shape parameter, respectively.
The wind speed becomes stronger along with the increasing altitude, and thus the wind experienced by the turbine reaches a high value at the hub. Accordingly, the parameters c and k are functions of the hub height H [37]. Based on the relationship between the wind speed and the hub height, the scale parameter c at the hub height is calculated by [38]
c = c 0 ( H / H 0 ) α
where c 0 is the value of c at reference altitude H 0 , and α is the Hellmann exponent, which depends on serval surface properties of the wind field. The typical value of α is 0.1 over water, and 0.14 over land [39,40].
In this study, the shape parameter k and the annual mean wind speed v m are considered as known parameters, and c 0 is calculated by [41]
c 0 = v m / Γ ( 1 + 1 / k )
where Γ ( ) is the gamma function.
The shape parameter k follows a law provided by [38]:
k = k 0 [ 1 0.088 l n ( H 0 / 10 ) ] / [ 1 0.088 l n ( H / 10 ) ]
where k 0 is the value of k at reference altitude H 0 .
In Equations (9)–(11), c and k depend on c 0 , k 0 , H 0 and H . According to the European Wind Energy Association, there is the relationship between the hub height and the turbine rotor radius, which is expressed by [42]
H = 2.7936 × ( 2 R ) 0.7633
Therefore, based on Equations (7)–(12), the AEP of the offshore turbines is expressed as a function of the wind statistics factors: c 0 , k 0 , α , and the turbine characteristics parameters: v c , v r , v f , R , formulated by
AEP = f AEP ( R , v r , v c , v f , c 0 , k 0 , α )

3.2. Cost Model of the Offshore Turbines

When erected at the sea, there have been two types of the support platform for the offshore turbines, namely, bottom-fixed platform and floating platform. Accordingly, the cost model may be constructed based on the platform type. However, there is no cost details of the floating offshore wind turbines, and thus the study considers the bottom-fixed offshore wind turbine, of which the cost model has been developed by NREL, and the cost data was converted to 2002 dollars. The bottom-fixed offshore turbines are widely erected at the shallow-water sea, of which the cost model detailed in the report of NREL is expressed as [32]
C o s t = F C R × I C C + A O E
where C o s t is the total turbine cost, I C C is the initial capital cost, and A O E is the annual operating expense. F C R is the fixed charge rate, defined as the annual amount per dollar of initial capital cost needed to cover the capital cost, a return on debt and equity, and various other fixed charges. In this study, it is set to 0.1158 per year.

3.2.1. The Initial Capital Cost

The initial capital cost I C C is the sum of the turbine system cost I C C t u r b and the balance of the platform station cost I C C B O P . The whole turbine system consists of four major subsystems, which are referred as to mechanical system (including blade, gearbox, low-speed shaft, main bearings, and mechanical brake), electrical system (including generator, power converter, and electrical connection), control system (including pitch control, yaw control, torque control, and safety systems), and the auxiliary system (including hydraulic cooling equipment, hub, nose cone, mainframe, nacelle cover, and tower). The detailed mathematical functions of these eighteen components are summarized in Table 1, in which it is obtained that I C C t u r b is determined by the rated power, rotor radius, and hub height.
The balance of the platform station cost involves the cost of infrastructure (including marinization, support structure, transportation, electrical interface connections, engineering permits, assembly and installation) and offshore engineering (including scour protection, personal access equipment, surety bond, port and staging equipment, and Offshore warranty premium). The detailed mathematical functions of these eleven components are summarized in Table 2, in which it is obtained that I C C B O P is only determined by the rated power.

3.2.2. The Annual Operating Expense

The annual operating expense A O E consists of the land lease, levelized operation and maintenance (O&M), and the levelized replacement costs. The detailed mathematical functions of these three components are summarized in Table 3, in which it is obtained that A O E is only determined by the rated power and the annual energy production.

3.3. COE Model of the Offshore Turbines

In Table 1 and Table 2, I C C is determined by P r , R , and H , while in Table 3, A O E is determined by P r and AEP . Meanwhile, by referring to Equations (6) and (12), P r is a function of R and H , and H is a function of R . Thus, the cost model of the offshore wind turbines can be formulated as a function relevant to rated wind speed, rotor radius, and the annual energy production:
C o s t = 0.1158 f I C C ( v r , R ) + f A O E 1 ( v r , R ) + 0.02108 AEP
Based on Equations (13) and (15), the final COE model of the offshore wind turbines is calculated and formulated by
COE = C o s t AEP = f cost ( R , v r ) f AEP ( R , v r , v c , v f , c 0 , k 0 , α ) + 0.02108
In Equation (16), the COE model of offshore wind turbines has been formulated as a nonlinear function, in which the rated wind speed and the rotor radius are the turbine design parameters, the cut-in and cut-out wind speeds are typically known constant parameters, and the wind statistics of the offshore windfarm are the scale factor, the shape factor, and the Hellmann exponent.

4. COE Optimization for Offshore Turbines

Based on Equation (16), it is obtained that minimizing COE of the offshore wind turbines can be fulfilled by optimizing the two important design parameters, the rated wind speed and the rotor radius. The objective is to minimize the COE when considering the practical constraints. The objective function and the constraint is expressed by
COE min ( R , v r ) = min ( COE ( R , v r ) )
s . t . { R min R R max , v r min v r v r max }
where R min and R max are the minimum and maximum values of rotor radius, and v r min and v r max are the minimum and maximum values of the rated wind speed, respectively.

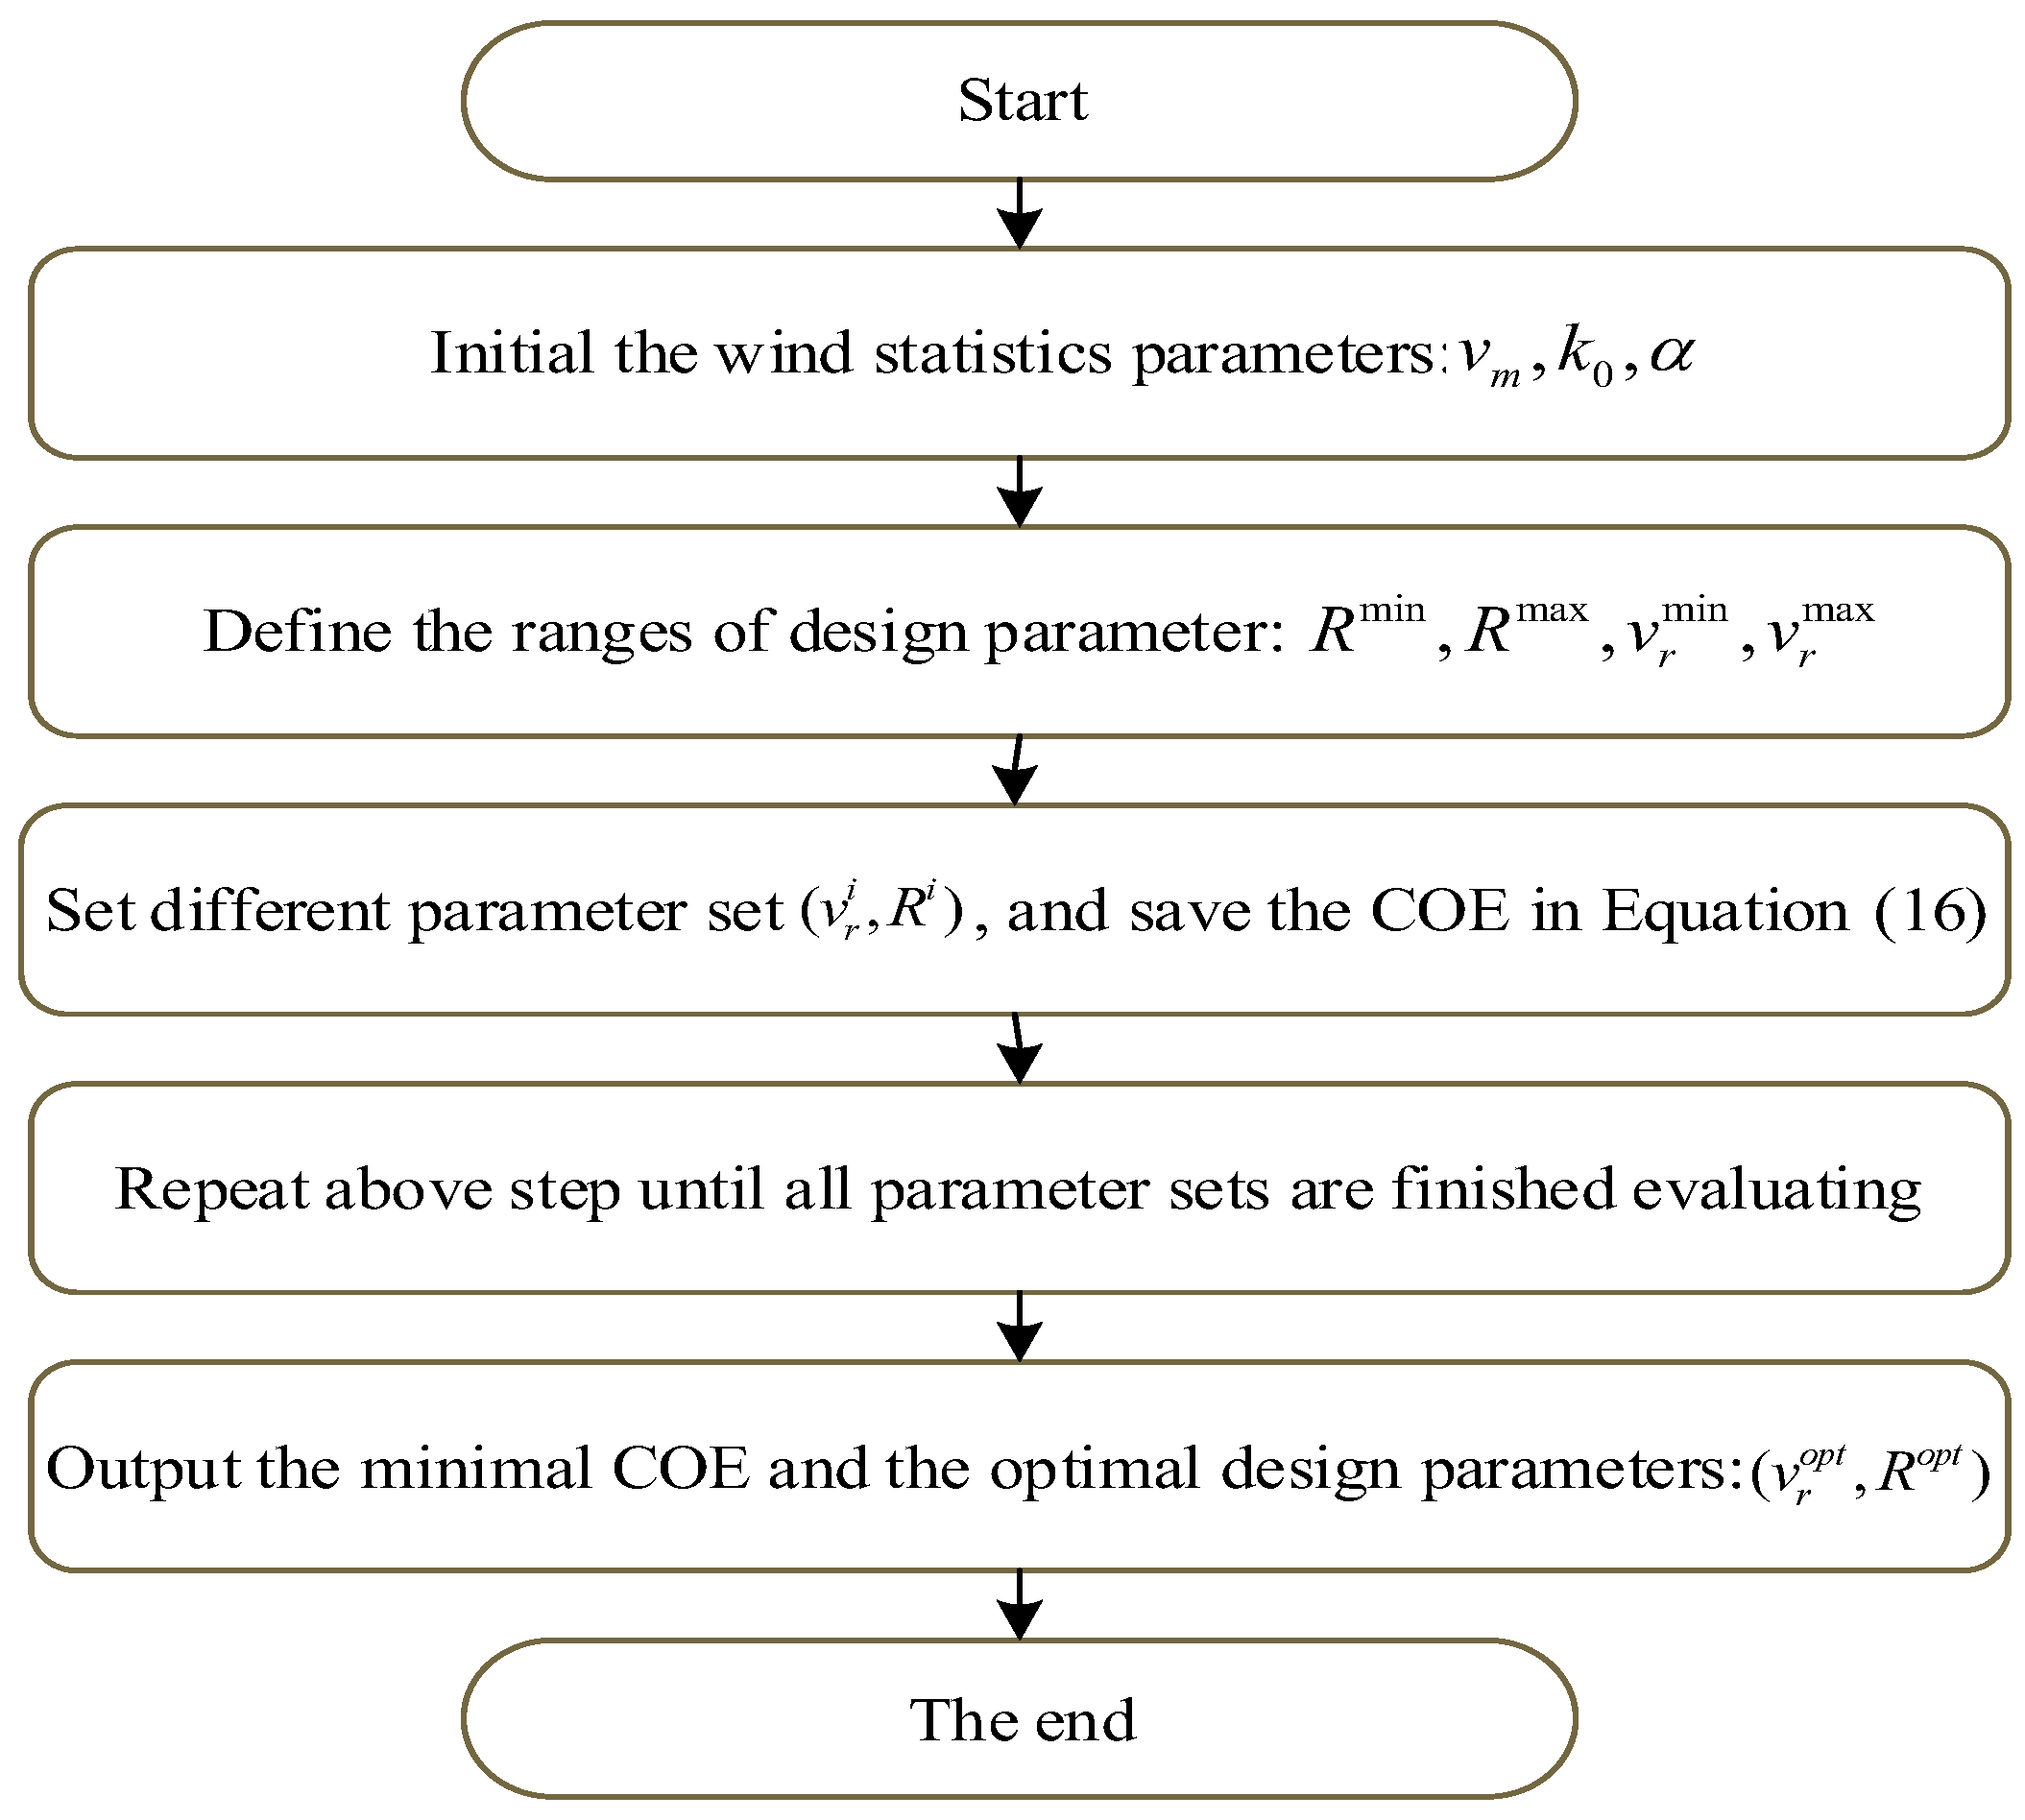
4.1. Optimizaiton Method

After preparing the COE model, the optimization algorithm should be designed. Since the COE model described by Equation (17) is highly nonlinear under constraints, the iterative method is employed in this study to solve the optimization problem. The flow chart of the developed iterative approach is presented in Figure 2, comprising the following steps:
  • Step 1: Initialize the wind statistics of the offshore site: v m , k 0 , α ;
  • Step 2: Define the ranges of the design parameters: v r , R ;
  • Step 3: Evaluate the COE using different v r and R , and save the smallest value of COE and its corresponding v r and R ;
  • Step 4: Repeat step 3 until all design parameters sets of v r and R have been evaluated;
  • Step 5: Output minimal COE and the corresponding design parameters.

4.2. Parameter Settings

As shown in Equations (13) and (16), the wind statistics has an important influence on the obtained AEP and COE. This study concerns the wind statistics in USA, in which seven wind classes are introduced from class I as the lowest wind power class to class VII as the highest one [43]. The annual mean wind speeds and power densities of these seven classes at reference height of 10 m are given in Table 4. Based on the wind statistics of USA, the parameters settings are summarized in Table 5, in which the rated wind speed ranges in 6–16 m/s with a step of 0.2 m/s, and the rotor radius ranges in 10–70 m with a step of 2 m. Accordingly, the minimum and maximum values of the rated power are 17.45 kW and 16.22 MW, which correspond to the designed wind turbines with v r = 6 m / s and R = 10 m , and the one with v r = 16 m / s and R = 70 m , respectively. Thus, the optimal results can be obtained from by searching this big range of turbine capacity.

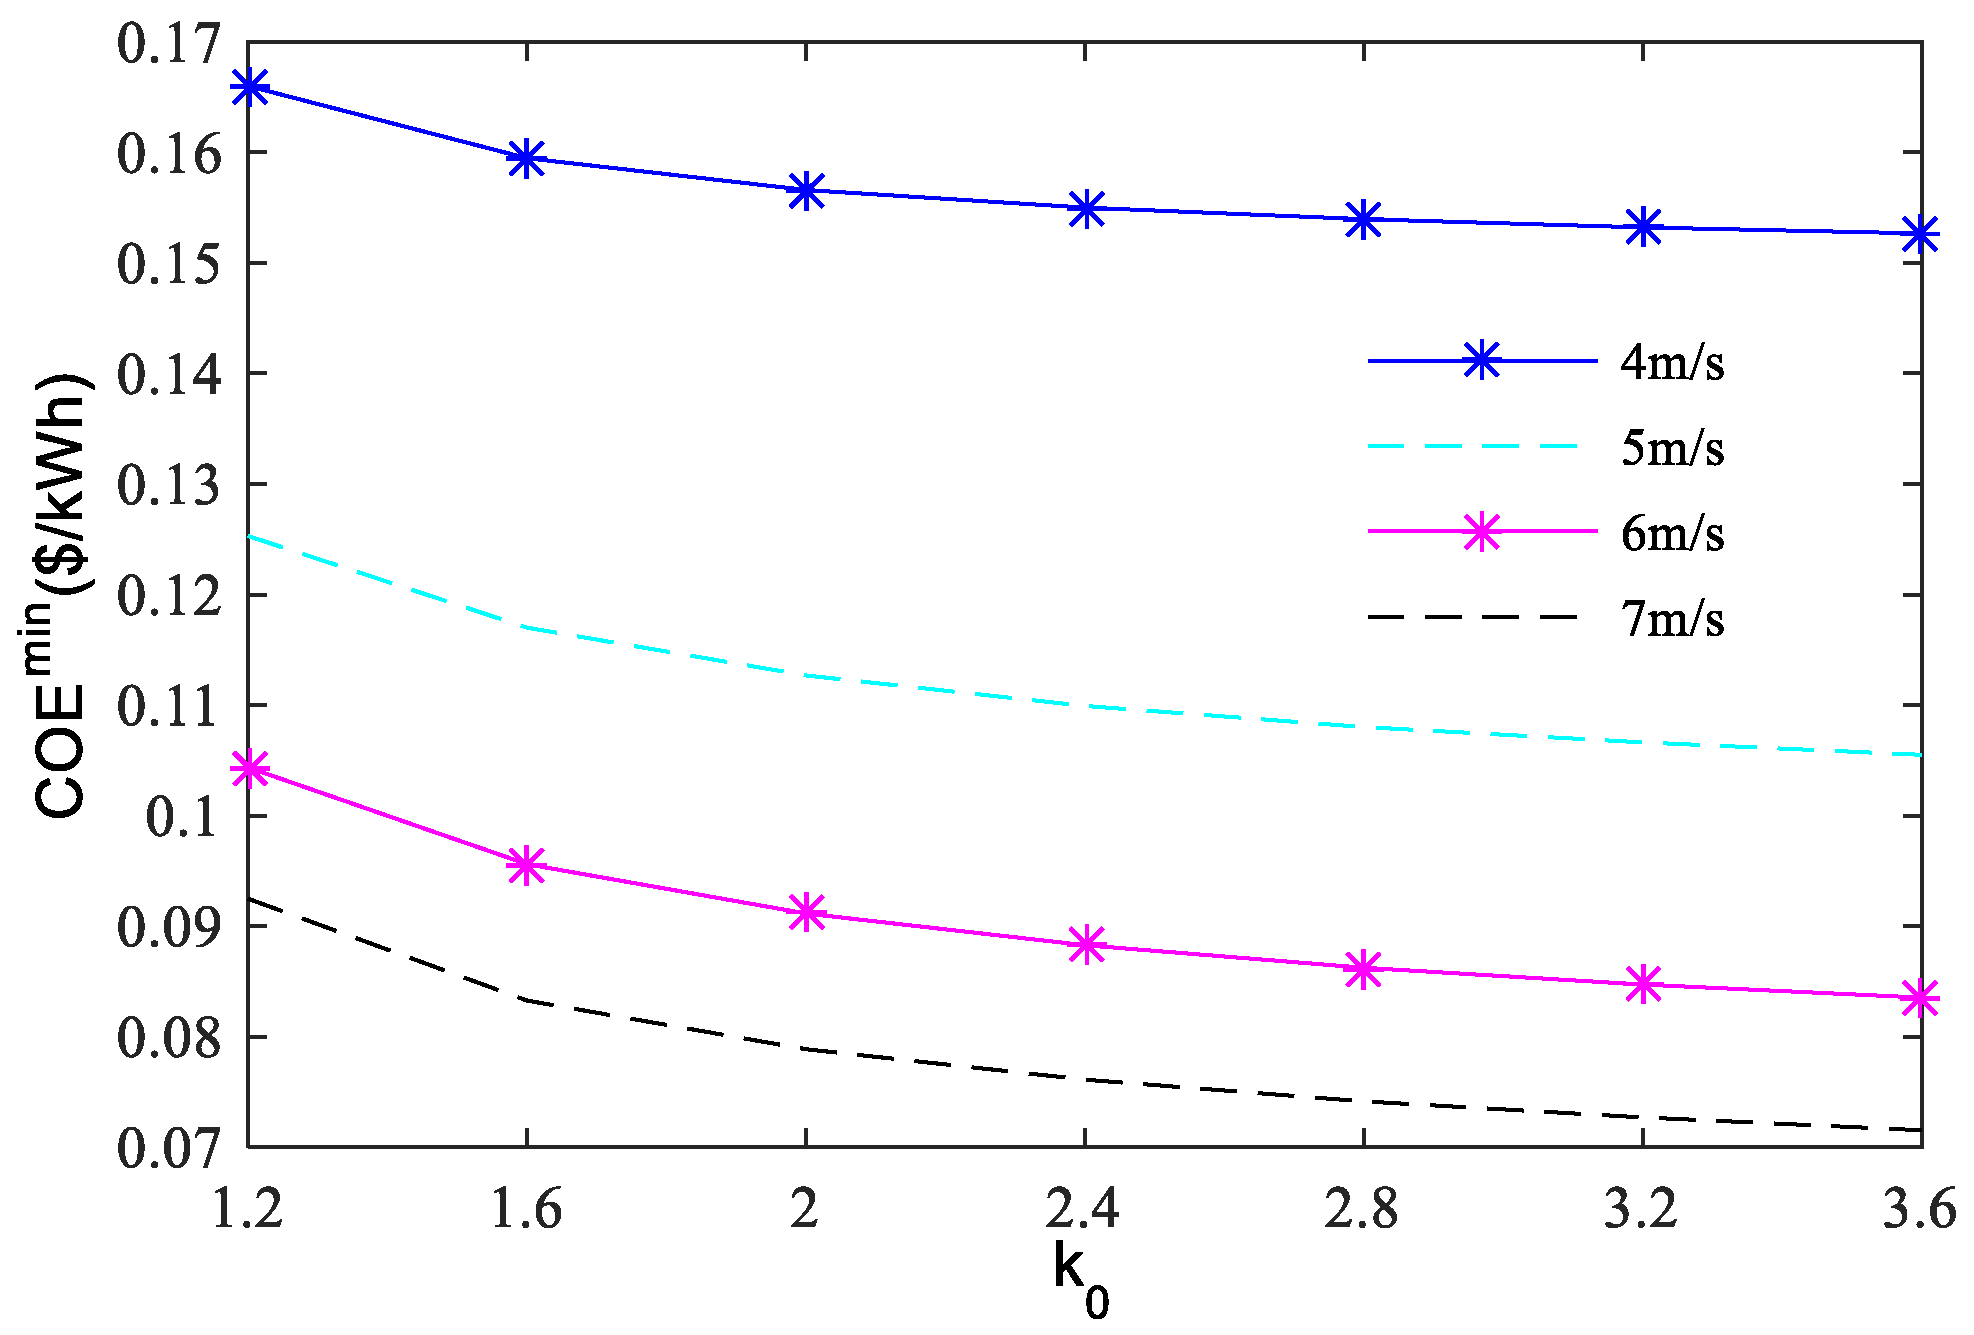
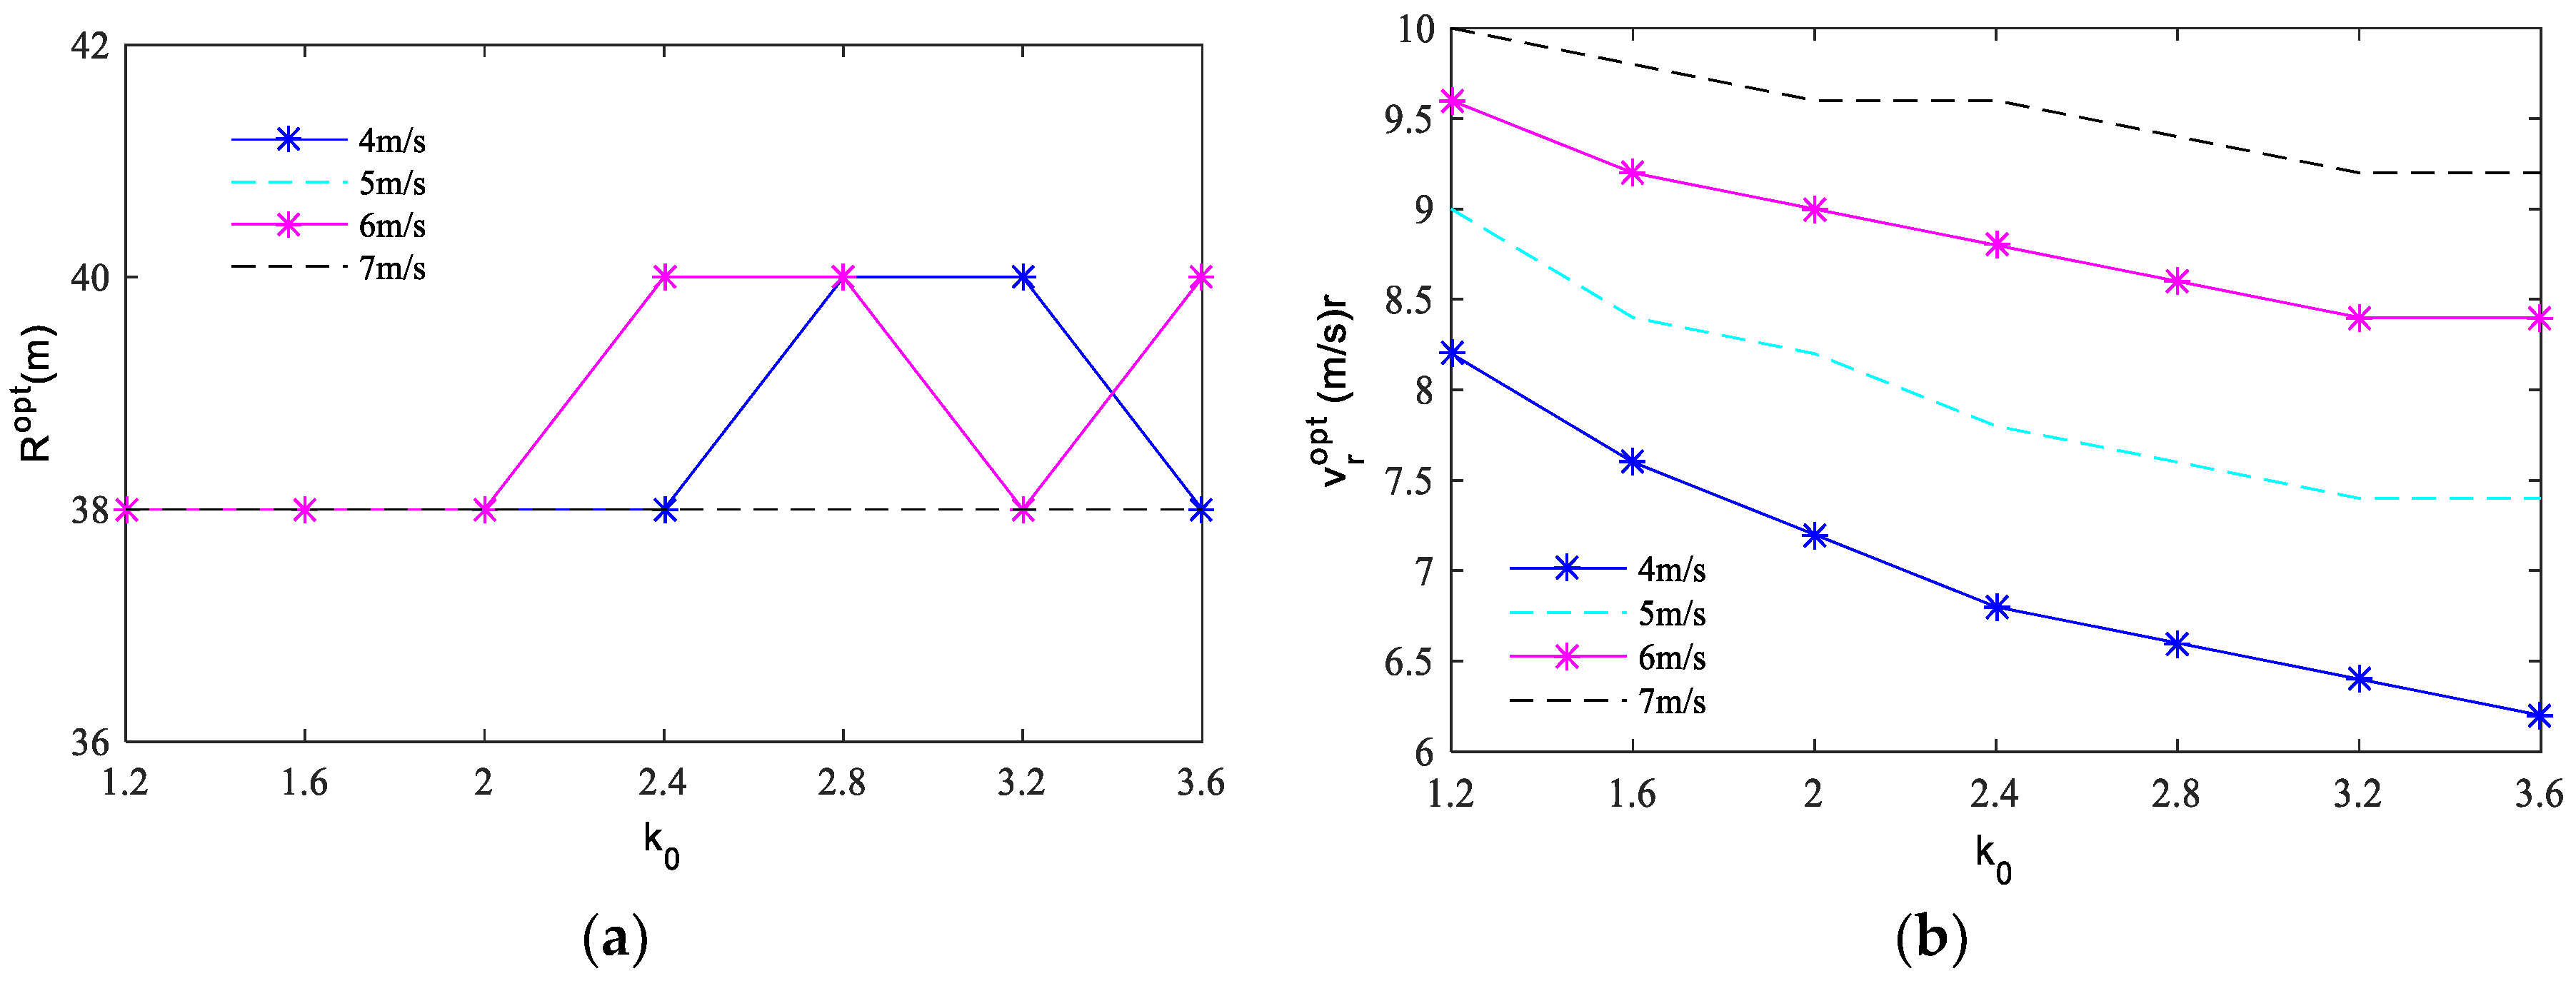
4.3. Optimizaiton Results and Discussions

The results of the minimum COE are obtained by using the proposed iterative search method and presented for different wind classes of USA according to Table 4. The minimum values of COE versus the annual mean wind speed values and the shape factors, k 0 , are presented in Figure 3. As observed from Figure 3, the minimum COE decreases following the increment of the annual mean wind speed and the increase of the shape factor, and the minimum COEs are influenced more obviously by the annual mean wind speed than by the shape factor. To be specific, for the wind classes of the annual wind speeds being 4 m / s , 5 m / s , 6 m / s , and 7 m / s , the minimum COEs range in 0.15 0.17 , 0.13 0.1 , 0.11 0.08 , and 0.1 0.07 $ / kWh , respectively. From the results, it is seen that the minimum COE of installing offshore wind turbines at the site with a low wind power class almost doubles the one at the site of a high wind power class, which fits the known concept that installing the wind turbines at the rich wind site is more profitable than at the poor wind site. When considering 0.1 $ / kWh is an acceptable COE value to exploit the wind energy, the offshore wind turbines should be installed at the sea with the wind class III or above.
To check the optimal design parameters achieving the minimum COEs, the obtained optimal rotor radius and rated wind speed versus the annual mean wind speed values and the shape factors, k 0 , are presented in Figure 4a,b. As seen from Figure 4, the optimal rotor radius is surprisingly kept in a certain range of 38 40 m , while the optimal rated wind speed shows the relevance to the wind statistics. Specifically, for the annual wind speeds being 4 m / s , 5 m / s , 6 m / s , and 7 m / s , the optimal rated wind speed ranges in 6 8.5 m / s , 7.5 9 m / s , 8.5 9.5 m / s , and 9 10 m / s , respectively. Thus, it is obtained that the optimal rated wind speed of the offshore wind turbines should be designed around 1.5 times more than the annual mean wind speed, and the optimal rotor radius may be designed around a certain value regardless of the wind statistics.
Since the turbine capacity is determined by the rated wind speed and the rotor radius, the optimal rated power of the offshore turbines having the minimum COE are calculated and presented in Figure 5. It is clearly seen from Figure 5 that, when the annual mean wind speed is increasing or the shape factor is reducing, the optimal capacity of the turbines giving the minimum COEs takes ever-bigger value, from several hundreds of kilo-watt to one megawatt. In detail, for the wind classes of the annual wind speeds being 4 m / s , 5 m / s , 6 m / s , and 7 m / s , the optimal capacity of the turbines range in 0.3 0.7 MW , 0.5 0.9 MW , 0.7 1.1 MW , and 0.9 1.2 MW , respectively. From the results, it is concluded that the offshore wind turbines with a large capacity and long blades may not absolutely bring the COE down, and their capacity should be designed at a proper value depending on the wind conditions at the sea.
The numerical results in Figure 3, Figure 4 and Figure 5 are summarized in Table 6. Based on this data table, the suitable rated wind speed and rotor radius can be chosen to ensure the minimum energy cost of the offshore turbines for a specific wind region. For instance, the rated wind speed and the rotor radius for the shape factor of k 0 = 1.2 can be adopted 10 m / s and 38 m , respectively, for the annual mean wind speed around 7 m / s . With these two optimal design parameters, the COE of the offshore turbines is minimized to 0.0905 $ / kWh , which is an acceptable value for exploiting the offshore wind energy.

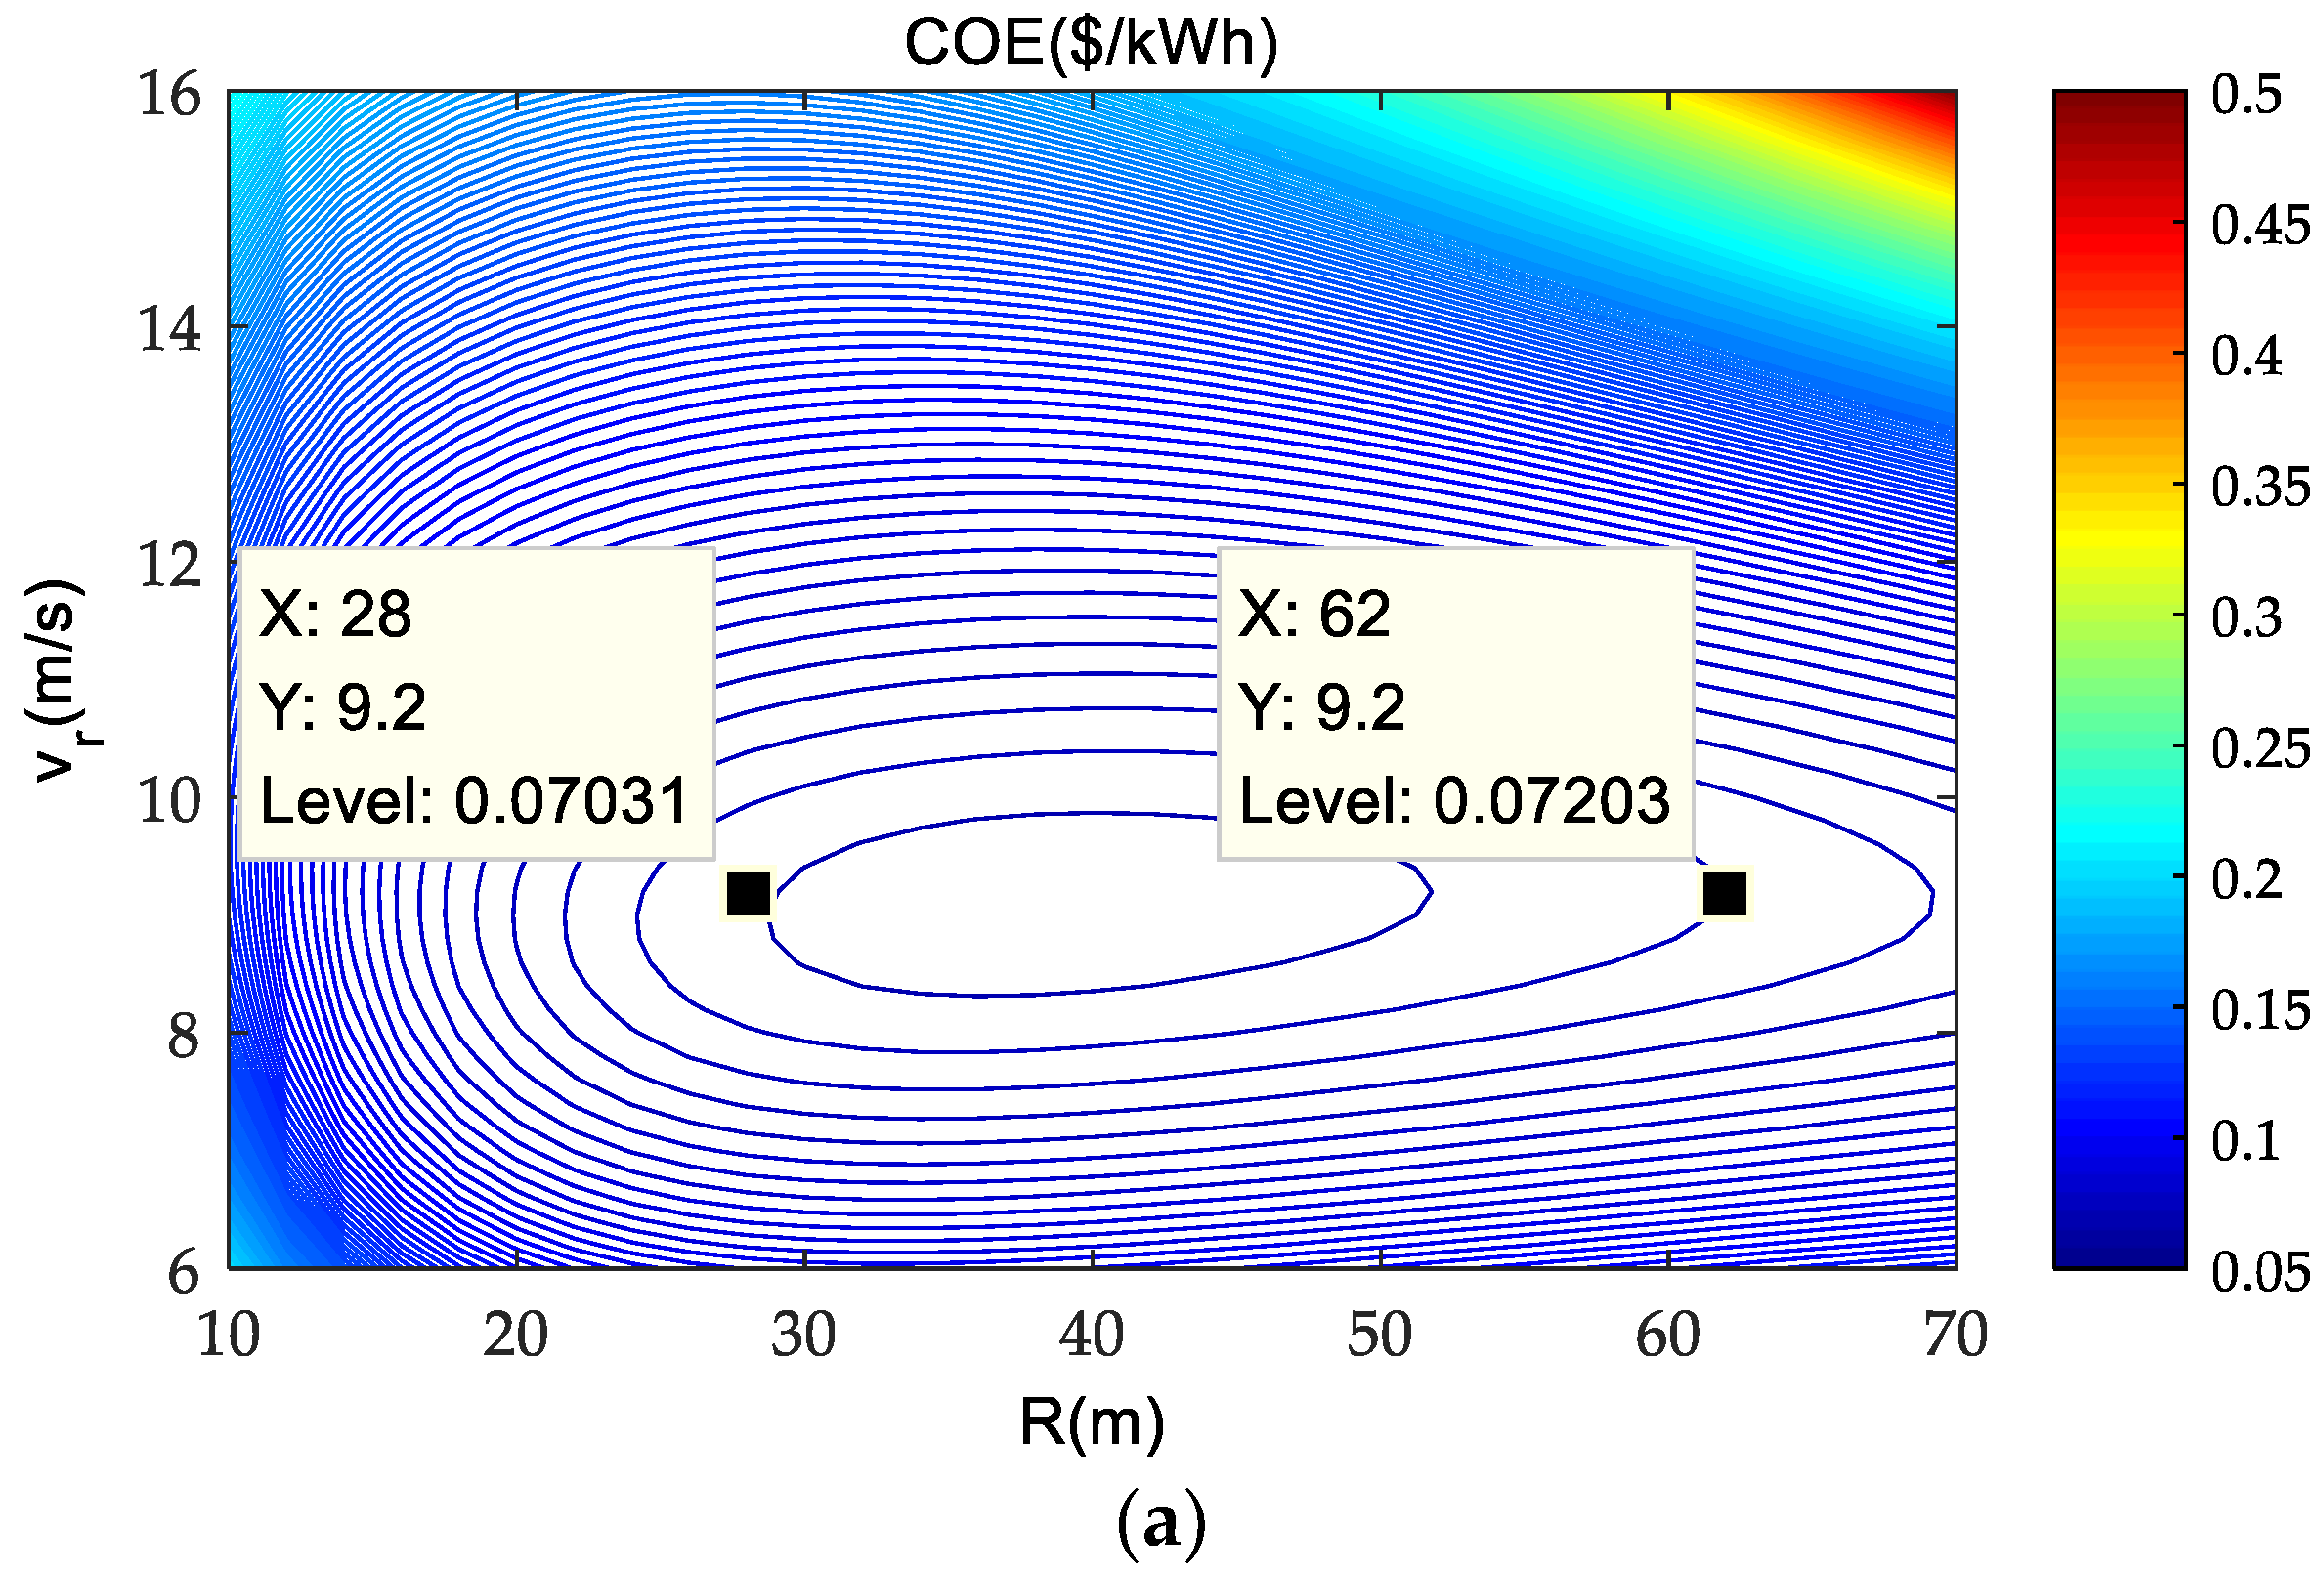
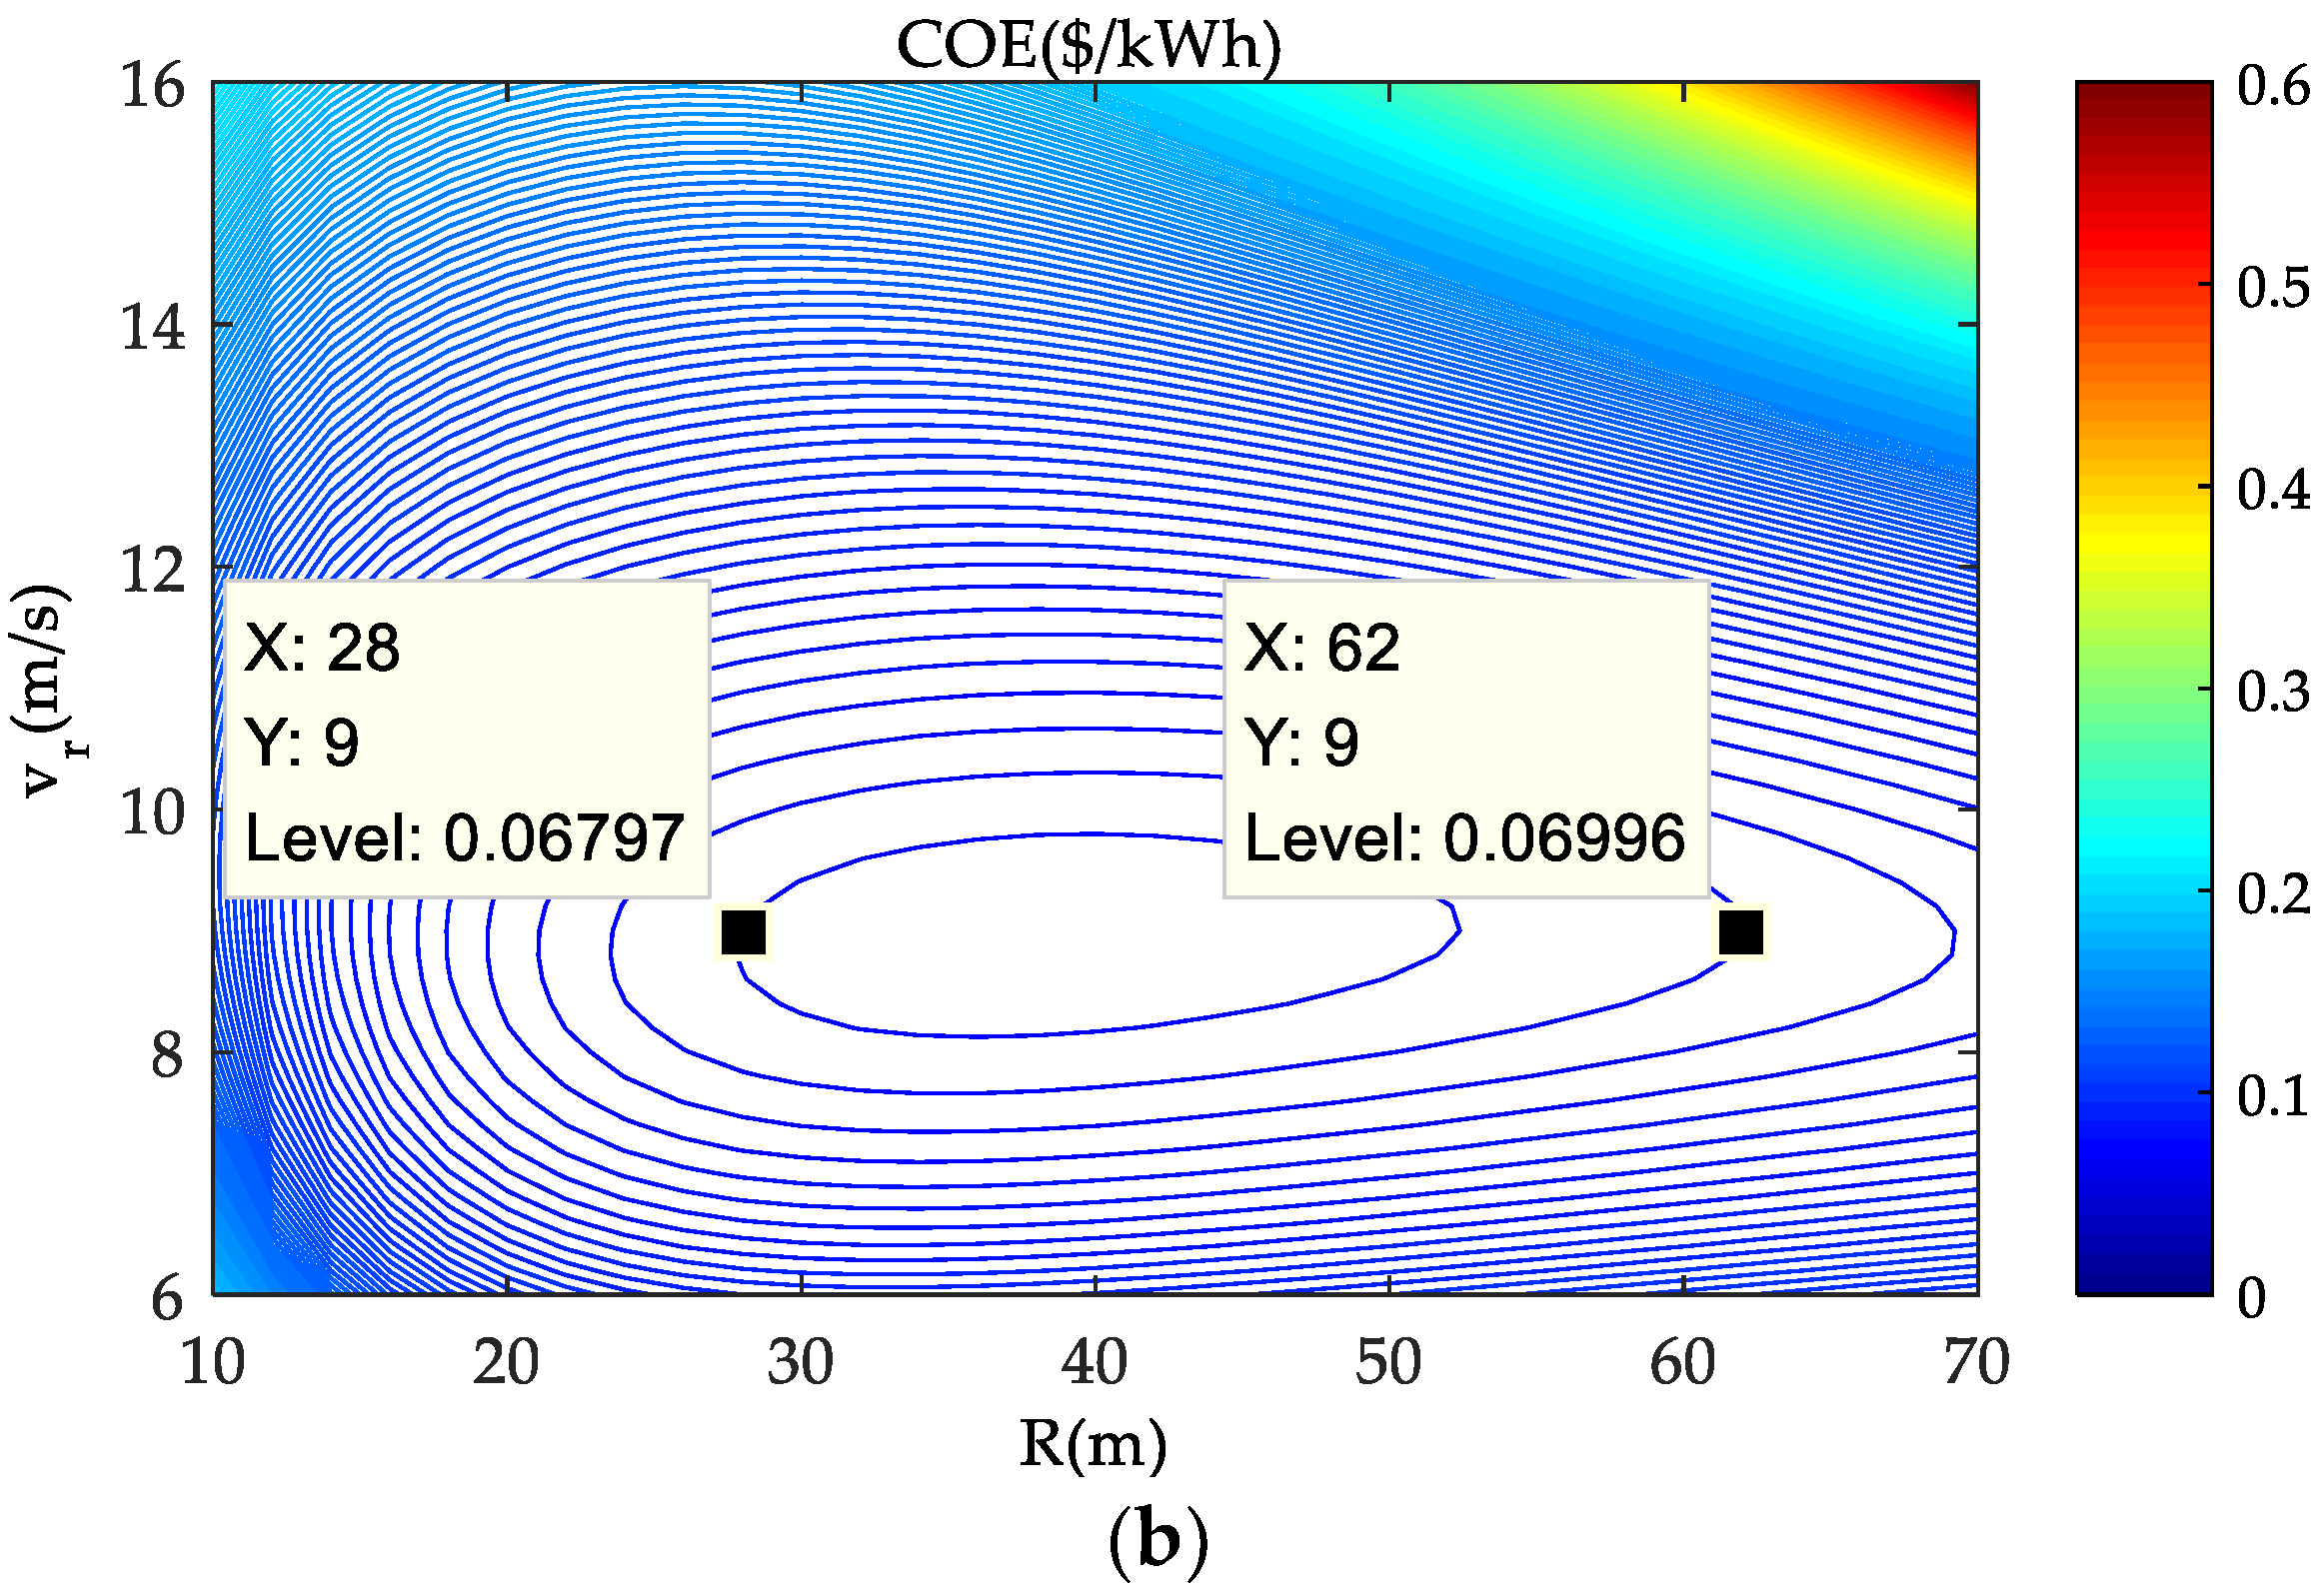
4.4. Result Analysis on a Typical Case

Above results of the minimum COEs and the corresponding optimal design parameters give some information about designing a satisfactory offshore turbine, but they cannot reveal the details. To further examine the relationship between the design parameters and the offshore turbine COE, the results from a specific wind class with v m = 7 m / s and k 0 = 3.6 are presented and analyzed.
The two major component costs of offshore turbines, the turbine system cost and the balance of the platform station cost are respectively presented in Figure 6a,b, in forms of cost per kilo-watt, calculated by I C C t u r b / P r and I C C B O P / P r . As seen from Figure 6, the high cost of the turbine system is more than 3000 $ / kW and up to 6000 $ / kW in the low rated wind speed region, while the normal cost is lower than 1000 $ / kW in the other part of the region. By comparison, the high cost of the station balance is less than 4500 $ / kW , which appears in the region of the lowest rated wind speed and smallest rotor radius, and in the region of the highest rated wind speed and biggest rotor radius. Thus, these results reveal that the turbines with a very big or with very small capacity are unfavorable for the offshore site, while the rated wind speed should be designed at more than 8 m / s for the wind field with the annual mean wind speed of 7 m / s .
The obtained annual energy production AEP versus the rotor radius and the rated wind speed is presented in Figure 7, from which it is seen that, the AEP is more sensitive to the rotor size than the rated wind speed. Nevertheless, selecting a suitable rated wind speed is important to obtain a high AEP. For instance, for a wind turbine with the rotor radius of 60 m , the AEP is 18,540 MWh with v r = 15 m / s , while it is decreased to 6771 MWh with v r = 7 m / s .
The obtained COE versus the rotor radius and rated wind speed are presented in Figure 8. As seen from Figure 8, the high COE appears in two regions, including one with the high rated wind speed and big rotor radius and the other with the small rotor radius. Thus, it is clear that the turbines with very big capacity or with short blades are unfavorable for the offshore site. Besides, it is worth noticing that the COE is sensitive to the variation of the rated wind speed rather than the rotor radius, which means that the designed turbine can have a big range of rotor radius. For instance, around the rated wind speed of v r = 9.2 m / s , when the values of COE vary in the range of 0.072 0.076 $ / kWh , the designed rotor radius changes from 30 m to 68 m . Therefore, the designed capacity of the favorable offshore turbines at the wind class is with the rated power from 566 kW to 2900 kW. In this regard, a robust optimal design for the offshore wind turbines can be with long blades and large capacity. Nevertheless, the rated wind speed of the designed wind turbines should be carefully selected to achieve a low COE.
Finally, to check the influence of equivalent power coefficient on the obtained COE, the obtained COE versus the rotor radius and rated wind speed using two different equivalent power coefficients, C p , e q = 0.48 and C p , e q = 0.54 are presented in Figure 9a,b, respectively. By comparing Figure 9 with Figure 8, similar results are obtained, including two aspects: on one side, the turbines with very big capacity or with short blades are unfavorable for the offshore site; on the other side, the favorable turbines having the minimal COE are designed with the rated wind speed ranging in 8 10 m / s and the rotor radius ranging in 25 66 m . These similar results reveal that the optimal design of turbines are less sensitive to the variations of the equivalent power coefficient, which well justify that the outstanding significance of the conception design optimization over the blade design optimization. Nevertheless, it is worth noticing that the COE minimum is slightly decreasing with the increase of the equivalent power coefficient. In this regard, it is also economically beneficial to optimize the blade airfoil, as the power coefficient of wind turbines largely relies on the design of the blade airfoil [17,21].

5. Conclusions

This paper has proposed a method to minimize the COE of offshore wind turbines, through optimally designing the rated wind speed and the rotor radius. To do this, both of the annual energy production (AEP) and the offshore turbine cost have been expressed as functions of the wind statistics factors and the two design parameters of offshore turbines, the rated wind speed and the rotor radius. Then, the COE minimization problem has been formulated, and an iterative method has been proposed. After that, the optimal results have been obtained by applying the proposed method to the wind fields of USA, from which the useful findings are concluded as follows:
  • Considering 0.1 $ / kWh is an acceptable COE value to exploit the wind energy, the offshore wind turbines should be installed at the sea with the wind class III or above.
  • The offshore wind turbines with a large capacity and long blades may not absolutely bring the COE down, as their optimal capacities depend on the offshore wind conditions.
  • The COE is more sensitive to the rated wind speed than the rotor size, so it is critical to bring the COE down by selecting the suitable rated wind speed.
  • The COE of offshore turbines is less sensitive to the power coefficient than to the rated wind speed and the rotor size, which justify the significance of the conception design optimization.
  • The optimal rated wind speed of the offshore wind turbines should be designed around 1.5 times more than the annual mean wind speed, while the optimal rotor can be designed towards big-size, as the offshore wind turbines having a low COE appear with long blades and a large capacity.

Author Contributions

All the authors contributed to this work. X.Z. designed the methodology and wrote the original draft of the paper under the supervision of L.L. (Longfu Luo), D.S. and J.Y. provided the resources and revised the draft. W.T. helped with the writing and reviewing the draft. X.T., W.W. and L.L. (Li Li) contributed to algorithm design, data collection, and visualization.

Funding

This research and The APC were funded by the National Natural Science Foundation of China under Grant 61803393 and 51777217, and by China Postdoctoral Science Foundation under Grant 2017M622605.

Conflicts of Interest

The authors declare no conflict of interest.

References

  1. Global Wind Report. 2017. Available online: http://www.gwec.net/global-figures/graphs/ (accessed on 3 September 2018).
  2. Dai, J.C.; Yang, X.; Wen, L. Development of wind power industry in China: A comprehensive assessment. Renew. Sustain. Energy Rev. 2018, 97, 156–164. [Google Scholar] [CrossRef]
  3. Willis, D.J.; Niezrecki, C.; Kuchma, D. Wind energy research: State-of-the-art and future research directions. Renew. Energy 2018, 125, 133–154. [Google Scholar] [CrossRef]
  4. Burton, T.; Jenkins, N.; Sharpe, D.; Bossanyi, E. Wind Energy Handbook; John Wiley & Sons: West Sussex, UK, 2011. [Google Scholar]
  5. Zhu, Y.; Cheng, M.; Hua, W.; Wang, W. A novel maximum power point tracking control for permanent magnet direct drive wind energy conversion systems. Energies 2012, 5, 1398–1412. [Google Scholar] [CrossRef]
  6. Song, D.; Yang, J.; Cai, Z.L.; Dong, M.; Su, M.; Wang, Y.H. Wind estimation with a non-standard extended Kalman filter and its application on maximum power extraction for variable speed wind turbines. Appl. Energy 2017, 190, 670–685. [Google Scholar] [CrossRef]
  7. Song, D.; Yang, J.; Su, M.; Liu, A.; Liu, Y.; Joo, Y. A comparison study between two MPPT control methods for a large variable-speed wind turbine under different wind speed characteristics. Energies 2017, 10, 613. [Google Scholar] [CrossRef]
  8. Song, D.; Yang, J.; Cai, Z.; Dong, M.; Joo, Y.H. Model predictive control with finite control set for variable-speed wind turbines. Energy 2017, 126, 564–572. [Google Scholar] [CrossRef]
  9. Scholbrock, A.; Fleming, P.; Schlipf, D. Lidar-enhanced wind turbine control: Past, present, and future. In Proceedings of the 2016 American Control Conference (ACC), Boston, MA, USA, 6–8 July 2016; pp. 1399–1406. [Google Scholar]
  10. Zhang, X.L.; Huang, C.; Hao, S.P.; Chen, F.; Zhai, J.J. An Improved Adaptive-Torque-Gain MPPT Control for Direct-Driven PMSG Wind Turbines Considering Wind Farm Turbulences. Energies 2016, 9, 977. [Google Scholar] [CrossRef]
  11. Huang, C.; Li, F.; Jin, Z. Maximum power point tracking strategy for large-scale wind generation systems considering wind turbine dynamics. IEEE Trans. Ind. Electron. 2015, 62, 2530–2539. [Google Scholar] [CrossRef]
  12. Yin, M.H.; Li, W.J.; Chung, C.Y.; Chen, Z.Y.; Z, Y. Inertia Compensation Scheme of WTS Considering Time Delay for Emulating Large-Inertia Turbines. IET Renew. Power Gener. 2017, 11, 529–538. [Google Scholar] [CrossRef]
  13. Martínez-Lucas, G.; Sarasúa, J.I.; Sánchez-Fernández, J.Á. Frequency Regulation of a Hybrid Wind–Hydro Power Plant in an Isolated Power System. Energies 2018, 11, 239. [Google Scholar] [CrossRef]
  14. Martínez-Lucas, G.; Sarasúa, J.I.; Sánchez-Fernández, J.Á. Eigen analysis of wind–hydro joint frequency regulation in an isolated power system. Int. J. Electr. Power Energy Syst. 2018, 103, 511–524. [Google Scholar] [CrossRef]
  15. Song, D.; Yang, J.; Fan, X.; Liu, Y.; Liu, A.; Chen, G.; Joo, Y. Maximum power extraction for wind turbines through a novel yaw control solution using predicted wind directions. Energy Convers. Manag. 2018, 157, 589–599. [Google Scholar] [CrossRef]
  16. Song, D.; Fan, X.; Yang, J.; Liu, A.; Chen, S.; Joo, Y. Power extraction efficiency optimization of horizontal-axis wind turbines through optimizing control parameters of yaw control systems using an intelligent method. Appl. Energy 2018, 224, 267–279. [Google Scholar] [CrossRef]
  17. Chehouri, A.; Younes, R.; Ilinca, A.; Jean, P. Review of performance optimization techniques applied to wind turbines. Appl. Energy 2015, 142, 361–388. [Google Scholar] [CrossRef]
  18. Fuglsang, P.; Madsen, H.A. Optimization method for wind turbine rotors. J. Wind Eng. Ind. Aerodyn. 1999, 80, 191–206. [Google Scholar] [CrossRef]
  19. Shen, X.; Chen, J.G.; Zhu, X.C. Multi-objective optimization of wind turbine blades using lifting surface method. Energy 2015, 90, 1111–1121. [Google Scholar] [CrossRef] [Green Version]
  20. Ferdoues, M.S.; Ebrahimi, S.; Vijayaraghavan, K. Multi-objective optimization of the design and operating point of a new external axis wind turbine. Energy 2017, 125, 643–653. [Google Scholar] [CrossRef]
  21. Tang, C.; Soong, W.L.; Freere, P.; Pathmanathan, M.; Ertugrul, N. Dynamic wind turbine output power reduction under varying wind speed conditions due to inertia. Wind Energy 2013, 16, 561–573. [Google Scholar] [CrossRef]
  22. Yin, M.H.; Yang, Z.Q.; Xu, Y.; Liu, J.K.; Zhou, L.J.; Zou, Y. Aerodynamic optimization for variable-speed wind turbines based on wind energy capture efficiency. Appl. Energy 2018, 221, 508–521. [Google Scholar] [CrossRef]
  23. Bortolotti, P.; Bottasso, C.L.; Croce, A. Combined preliminary–detailed design of wind turbines. Wind Energy Sci. 2016, 1, 71–88. [Google Scholar] [CrossRef] [Green Version]
  24. Arias-Rosales, A.; Osorio-Gómez, G. Wind turbine selection method based on the statistical analysis of nominal specifications for estimating the cost of energy. Appl. Energy 2018, 228, 980–998. [Google Scholar] [CrossRef]
  25. Villena-Ruiz, R.; Ramirez, F.J.; Honrubia-Escribano, A.; Gomez-Lazaro, E. A techno-economic analysis of a real wind farm repowering experience: The Malpica case. Energy Conver. Manag. 2018, 172, 182–199. [Google Scholar] [CrossRef]
  26. Gualtieri, G. Improving investigation of wind turbine optimal site matching through the self-organizing maps. Energy Conver. Manag. 2017, 143, 295–311. [Google Scholar] [CrossRef] [Green Version]
  27. Yang, H.; Chen, J.; Pang, X. Wind Turbine Optimization for Minimum Cost of Energy in Low Wind Speed Areas Considering Blade Length and Hub Height. Appl. Sci. 2018, 8, 1202. [Google Scholar] [CrossRef]
  28. Diveux, T.; Sebastian, P.; Bernard, D. Horizontal axis wind turbine systems: Optimization using genetic algorithms. Wind Energy Int. J. Prog. Appl. Wind Power Conver. Technol. 2001, 4, 151–171. [Google Scholar] [CrossRef]
  29. Mirghaed, M.R.; Roshandel, R. Site specific optimization of wind turbines energy cost: Iterative approach. Energy Conver. Manag. 2013, 73, 167–175. [Google Scholar] [CrossRef]
  30. Eminoglu, U.; Ayasun, S. Modeling and design optimization of variable-speed wind turbine systems. Energies 2014, 7, 402–419. [Google Scholar] [CrossRef]
  31. Chen, J.; Wang, F.; Stelson, K.A. A mathematical approach to minimizing the cost of energy for large utility wind turbines. Appl. Energy 2018, 228, 1413–1422. [Google Scholar] [CrossRef]
  32. Fingersh, L.J.; Hand, M.M.; Laxson, A. Wind Turbine Design Cost and Scaling Model; Technical Report NREL/TP-500-40566; National Renewable Energy Laboratory (NREL): Gold, CO, USA, 2006. [Google Scholar]
  33. Zierath, J.; Jassmann, U.; Abel, D.; Weber, F. Introduction of model predictive control for load reduction on a 3,0 mw wind turbine. In Proceedings of the Brazil Windpower 2015, Rio de Janeiro, Brazil, 1–3 September 2015. [Google Scholar]
  34. Moné, C.; Hand, M.; Bolinger, M. 2015 Cost of Wind Energy Review; Technical Report NREL/TP-500-40566; National Renewable Energy Laboratory (NREL): Gold, CO, USA, 2017. [Google Scholar]
  35. Teyabeen, A.A.; Akkari, F.R.; Jwaid, A.E. Power Curve Modelling for Wind Turbines. In Proceedings of the 2017 UKSim-AMSS 19th International Conference on Computer Modelling & Simulation (UKSim), Cambridge, UK, 5–7 April 2017. [Google Scholar]
  36. Goudarzi, A.; Davidson, I.E.; Ahmadi, A. Intelligent analysis of wind turbine power curve models. In Proceedings of the 2014 IEEE Symposium on Computational Intelligence Applications in Smart Grid (CIASG), Orlando, FL, USA, 9–12 December 2014; pp. 1–7. [Google Scholar]
  37. Justus, C.G.; Hargraves, W.R.; Mikhail, A. Methods for estimating wind speed frequency distributions. J. Appl. Meteorol. 1978, 17, 350–353. [Google Scholar] [CrossRef]
  38. Tar, K. Some statistical characteristics of monthly average wind speed at various heights. Renew. Sustain. Energy Rev. 2008, 12, 1712–1724. [Google Scholar] [CrossRef]
  39. Liu, Y.; Chen, D.; Yi, Q. Wind Profiles and Wave Spectra for Potential Wind Farms in South China Sea. Part I: Wind Speed Profile Model. Energies 2017, 10, 125. [Google Scholar] [CrossRef]
  40. Hsu, S.A.; Meindl, E.A.; Gilhousen, D.B. Determining the power-law wind-profile exponent under near-neutral stability conditions at sea. J. Appl. Meteorol. 1994, 33, 757–765. [Google Scholar] [CrossRef]
  41. Seguro, J.V.; Lambert, T.W. Modern estimation of the parameters of the Weibull wind speed distribution for wind energy analysis. J. Wind Eng. Ind. Aerodyn. 2000, 85, 75–84. [Google Scholar] [CrossRef]
  42. European Wind Energy Association. Wind Energy-The Facts: A Guide to the Technology, Economics and Future of Wind Power; Routledge: Landon, UK, 2012. [Google Scholar]
  43. Sedaghat, A.; Hassanzadeh, A.; Jamali, J.; Mostafaeipour, A. Determination of rated wind speed for maximum annual energy production of variable speed wind turbines. Appl. Energy 2017, 205, 781–789. [Google Scholar] [CrossRef]
Figure 1. Cost and possibility of modifications during the design process of a wind turbines.
Energies 11 02728 g001
Figure 2. Flow chart of the proposed cost of energy (COE) minimization approach.
Energies 11 02728 g002
Figure 3. The minimum COEs versus the annual mean wind speeds and the shape factors.
Energies 11 02728 g003
Figure 4. The optimal design parameters of offshore turbines versus the annual mean wind speeds and the shape factors: (a) the rated rator radius; (b) the rated wind speed.
Energies 11 02728 g004
Figure 5. The optimal capacity of offshore turbines versus v m and k 0 .
Energies 11 02728 g005
Figure 6. The two major component costs of offshore turbines versus the annual mean wind speeds and the shape factors: (a) the turbine system cost; (b) the station balance cost.
Energies 11 02728 g006
Figure 7. The obtained annual energy production versus the rotor radius and the rated wind speed.
Energies 11 02728 g007
Figure 8. The offshore turbines COE versus the rotor radius and rated wind speed at a specific class with v m = 7 m / s , k 0 = 3.6 and C p , e q = 0.42 .
Energies 11 02728 g008
Figure 9. The offshore turbines COE versus the rotor radius and rated wind speed at a specific wind climate with v m = 7 m / s , k 0 = 3.6 under different power coefficient: (a) C p , e q = 0.48 ; (b) C p , e q = 0.54 .
Energies 11 02728 g009aEnergies 11 02728 g009b
Table 1. The turbine system cost from the tower up.
TypeCost Model (Unit: $)
Mechanical System
Blade ( 0.4019 R 3 + 2.7445 R 2.5025 955.24 ) / 0.72
Gearbox 16.45 P r 1.249
low speed shaft 0.1 × ( 2 R ) 2.887
Main bearings ( 0.64768 R / 75 0.0107 ) × ( 2 R ) 2.5
Mechanical brake 1.9894 P r 0.1141
Electrical System
Generator 65 P r
Power converter 79 P r
Electrical connection 40 P r
Control System
Pitch system 0.48 × ( 2 R ) 2.6578
Yaw system 0.0678 × ( 2 R ) 2.964
Control safety system55,000
Auxiliary System
Hydraulic cooling system 12 P r
Hub 2.0 × ( 2 R ) 2.53 + 24141.275
Nose cone 206.69 R 2899.185
Mainframe 11.917 × ( 2 R ) 1.953
Nacelle cover 11.537 P r + 3849.7
Tower 0.59595 π R 2 H 2121
Table 2. The balance of the platform station cost.
TypeCost Model (Unit: $)
Marinization 0.135 × I C C t u r b
Offshore support structure 300 P r
Offshore transportation P r ( 1.581 × 10 5 × P r 2 0.0375 P r + 54.7 )
Offshore turbine installation 100 P r
Offshore electrical interface and connection 260 P r
Offshore engineering permits 37 P r
Port and staging equipment 20 P r
Personnel access equipment60,000
Scour protection 55 P r
Surety bond 0.03 × ( I C C 0.15 I C C t u r b )
Offshore warranty premium 0.15 × I C C t u r b
Table 3. Wind turbine annual operation cost.
TypeCost Model (Unit: $)
Offshore Levelized replacement cost 17 P r
Offshore bottom lease cost 0.00108 AEP
Offshore O&M 0.02 AEP
Table 4. Wind classification defined in USA [43].
Wind Power ClassMean Annual Wind Speed (m/s)Power Density (W/m2)
I0–4.40–100
II4.4–5.1100–150
III5.1–5.6150–200
IV5.6–6.0200–250
V6.0–6.4250–300
VI6.4–7.0300–400
VII7.0–9.4400–1000
Table 5. Parameters used in the proposed COE minimization method.
ParameterValues or Ranges
v m [4, 7] with a step of 1 m / s
k 0 [1.2, 3.6] with a step of 0.4
H 0 10 m
α 0.1
ρ 1.225 kg / m 3
R [10, 70] with a step of 2 m
v r [6, 16] with a step of 0.2 m / s
v c 3 m / s
v f 25 m / s
μ 0.17
C p , e q 0.42
Table 6. Minimal COEs and optimal design parameters at different wind classes and wind statistics.
Wind Class v m ( m / s ) k 0 C O E min ( $ / kWh ) v r o p t ( m / s ) R o p t ( m ) P r o p t ( k W )
I, II4.01.20.16608.238643.45
1.60.15957.638512.29
2.00.15667.238435.58
2.40.15506.838366.94
2.80.15406.640371.76
3.20.15326.440338.97
3.60.15276.238278.13
II, III, IV5.01.20.1253938850.75
1.60.11708.438691.69
2.00.11278.238643.45
2.40.10997.838553.80
2.80.10807.638512.29
3.20.10667.438472.90
3.60.10557.440523.99
IV, V, IV6.01.20.10449.6381032.49
1.60.09569.238908.73
2.00.0911938850.75
2.40.08838.840881.20
2.80.08628.640822.47
3.20.08478.438691.69
3.60.08358.440766.41
VI, VII7.01.20.092510381167.00
1.60.08339.8381098.38
2.00.07899.6381032.49
2.40.07619.6381032.49
2.80.07419.438969.30
3.20.07279.238908.73
3.60.07159.238908.73

