Article

Electrochemical Hydrogenation of Acetone to Produce Isopropanol Using a Polymer Electrolyte Membrane Reactor

1
Department of Civil & Environmental Engineering, Old Dominion University, Norfolk, VA 23529, USA
2
Department of Chemistry, Hampton University, Hampton, VA 23668, USA
3
Department of Mechanical & Aerospace Engineering, Old Dominion University, Norfolk, VA 23529, USA
*
Authors to whom correspondence should be addressed.
Energies 2018, 11(10), 2691; https://doi.org/10.3390/en11102691
Submission received: 17 August 2018 / Revised: 1 October 2018 / Accepted: 2 October 2018 / Published: 10 October 2018
(This article belongs to the Special Issue Biofuel and Bioenergy Technology)

Abstract

:
Electrochemical hydrogenation (ECH) of acetone is a relatively new method to produce isopropanol. It provides an alternative way of upgrading bio-fuels with less energy consumption and chemical waste as compared to conventional methods. In this paper, Polymer Electrolyte Membrane Fuel Cell (PEMFC) hardware was used as an electrochemical reactor to hydrogenate acetone to produce isopropanol and diisopropyl ether as a byproduct. High current efficiency (59.7%) and selectivity (>90%) were achieved, while ECH was carried out in mild conditions (65 °C and atmospheric pressure). Various operating parameters were evaluated to determine their effects on the yield of acetone and the overall efficiency of ECH. The results show that an increase in humidity increased the yield of propanol and the efficiency of ECH. The operating temperature and power supply, however, have less effect. The degradation of membranes due to contamination of PEMFC and the mitigation methods were also investigated.

1. Introduction

Propanol is an important organic raw material in chemical production, two isomers 1-propanol and isopropanol are widely used in the paint, medicine and pesticide industries [1]. Compared to 1-propanol, isopropanol has more extensive and important applications. Along with ethanol, n-butanol, and methanol, isopropanol belongs to the group of alcohol solvents, about 6.4 million tons of which were utilized worldwide in 2011 [2]. Isopropanol is primarily produced by combining water and propene in a hydration reaction, through either an indirect or direct process. In an indirect process, propene reacts with sulfuric acid and forms a mixture of sulfate esters. Subsequent hydrolysis of those esters by steam produces isopropanol. In a direct hydration process, propene reacts with water or steam at high pressure (200–300 atm) and high temperatures (230–270 °C), in the presence of solid or supported acidic catalysts [3,4]. Isopropanol is produced by a direct combination of propene and water. Both processes require intensive energy input and use of corrosive chemicals.
Thermal hydrogenation of acetone is a relatively new and more advanced method to produce isopropanol, where acetone is hydrogenated either in the liquid or gas phase over a Raney nickel or copper and chromium oxide mixture [5]. Compared to the aforementioned conventional methods, thermal hydrogenation can be carried out at a lower temperature (75 °C) with up to 35% yield rate. However, an elevated temperature (350–400 °C) is still required to enable fully activated catalysts. In addition, handling corrosive chemicals remains a problem [6].
Electrochemical hydrogenation (ECH) provides a more energy efficient and environment-friendly method of upgrading organics, by integrating both the electrochemical and catalytic methods [7]. The overall reaction mechanism of ECH of an unsaturated organic molecule is suggested as the following Equations (1)–(5) [8,9,10,11,12,13].
Anode side: H2 → 2(H+) + 2e; H2O → 1/2O2 + 2(H+) + 2e
Cathode side:
(1) Protons react with electrons and generate M(H)ads (M is an adsorption site):
(H+) + e + M → M(H)ads + H2O
(2) An organic molecule Y = Z is adsorbed by an adsorption site M:
Y = Z + M → M(Y = Z)ads
(3) M(H)ads reacts with the adsorbed organic molecule:
M(Y = Z) ads + 2M(H)abs → M(YH-ZH)abs + 2M
(4) A hydrogenated product is generated:
M(YH-ZH)abs → YH-ZH + M
(5) H2 gas is also produced:
2M(H)ads → H2 (gas) +2M M(H)ads + (H+) + e → H2 (gas) +M
In the process, chemisorbed hydrogen M(H)ads is generated in situ on the electrocatalyst surface through either hydrogen pumping or water electrolysis and reacts with the adsorbed organics (Equation (1)). Note that hydrogenation also competes with hydrogen gas evolution (Equation (5)), which results in a decrease of the current efficiency. ECH allows the reactions (Equations (2)–(4)) to happen at lower temperatures and ambient pressure. Compared to conventional hydrogenation methods, ECH mainly uses electrical energy and all the reactions take place in a mild operating condition (i.e., low temperature and atmospheric pressure). Therefore, intense thermal energy input is not required in ECH. ECH also uses either water or H2 to supply protons, which eliminate the need for any reducing agent. ECH can be conducted onsite using fuel cell stacks and renewable power sources to produce hydrogen enriched compounds. This will avoid or minimize the storage and transportation of corrosive and hazardous chemicals.
ECH has been widely used to upgrade unsaturated compounds to corresponding saturated chemicals, such as furfural [14,15,16,17,18,19,20], aromatic compounds [7,13,21,22,23,24,25,26,27,28,29], soybean oil [30], edible oil [31,32], levulinic acid [33,34,35], lactic acid [36], acetaldehyde [37], ethanol [37], acetylene [38], bio-oil [39,40], cyclohexane [9], glucose [41], and lignin [42]. In all those cases, reactions take place under mild conditions with temperatures below 100 °C and atmospheric pressure. A maximum current efficiency up to 45%, which is defined as the efficiency of electrogenerated H2 addition to unsaturated bonds, was reported [30,31,32,38]. The yield of the electrocatalytic hydrogenation of organic molecules is directly related to the processes described in Equations (1)–(5), which are determined by the capabilities of catalysts. Compared to nickel (Ni), copper (Cu) and lead (Pb), activated carbon fibers supported platinum (Pt) demonstrated the best catalytic activities for upgrading various organics, such as furfural [20] and acetaldehyde [37]. The electrochemical conversion rate is also affected by the nature of electrodes [43], current density [44], temperature [26,38,40,45], solvent compositions [9,12,45], solution pH [9,14,21,40,46], and chemical potential [30,39,40]. The most commonly used ECH reactor is H-type cell [7,10,14,15,19,20,22,23,27,39,42,44,46]. A typical H-type cell consists of two electrode chambers, between which a cation exchange membrane is sandwiched. Compared to the traditional homogenous electrolyte method of the single chamber cell [14,24,33,34,36,37], the basic anolyte and the acidic/neutral catholyte method were applied in many H-type cells [7,14,40] to promote the proton transmission efficiency.
Hydrogenation of unsaturated compounds using polymer electrolyte membrane fuel cell (PEMFC) reactors was also reported [18,29,30,31,32]. PEMFC is a type of low-temperature fuel cell that takes its name from ion conductive polymer membrane used as the electrolyte [47]. A typical PEMFC assembly consists of an ion exchange membrane, two electrodes made of carbon layer loaded with Pt, and two gas diffusion media. The reactor provides gas distribution, current collection, temperature control, and mechanical support of the PEMFC assembly [47]. Alfonso et al. electrocatalytically hydrogenated acetophenone by H2 using a PEMFC reactor. They reported the selectivity of produced 1-phenylethanol around 90% with only methylbenzene and hydrogen as by-products [29]. Green et al. reported that the main products from ECH of furfural were furfural alcohol (54–100% selectivity) and tetrahydrofurfuryl alcohol (0–26% selectivity). A higher production rate was achieved by feeding pure hydrogen gas than that from electrolysis of water [18]. Pintauro et al. and An et al. both studied ECH of soybean oil in a PEMFC reactor at 60–90 °C and atmospheric pressure [30,31,32]. Pintauro et al. proved that a bimetallic cathode (Pd/Co or Pd/Fe) could increase the yield rate of the ECH process [30]. An et al. proved Pd-black cathode worked significantly better than Pt and the best current efficiency could reach 41% [31,32]. There are many advantages of using a PEMFC reactor for ECH [48]: First, compared to H-Cell and one chamber cell reactor, the PEMFC reactor has a smaller internal resistance, due to its highly conductive and thin membrane electrolyte assembly (MEA), resulting in significantly less electric energy loss. In addition, the energy consumption can be further reduced if protons are supplied from hydrogen oxidation, rather than electrolysis. Second, since PEMFCs can be easily scaled up by simply stacking them, the space-time yield of ECH using PEMFC reactors is superior to the other methods. PEMFC can be easily applied in space limited area such as transportation, stationary, and portable/micro power generation sectors [49].
In this paper, ECH of acetone to produce isopropanol was demonstrated using a PEMFC reactor at ambient pressure. Various factors that impact the yield of propanol were investigated, including current density, temperature, relative humidity (RH), and membrane degradation. The main objective of this work was to evaluate the appropriate pathways of ECH of bio-oil components using a PEMFC reactor.

2. Materials and Method

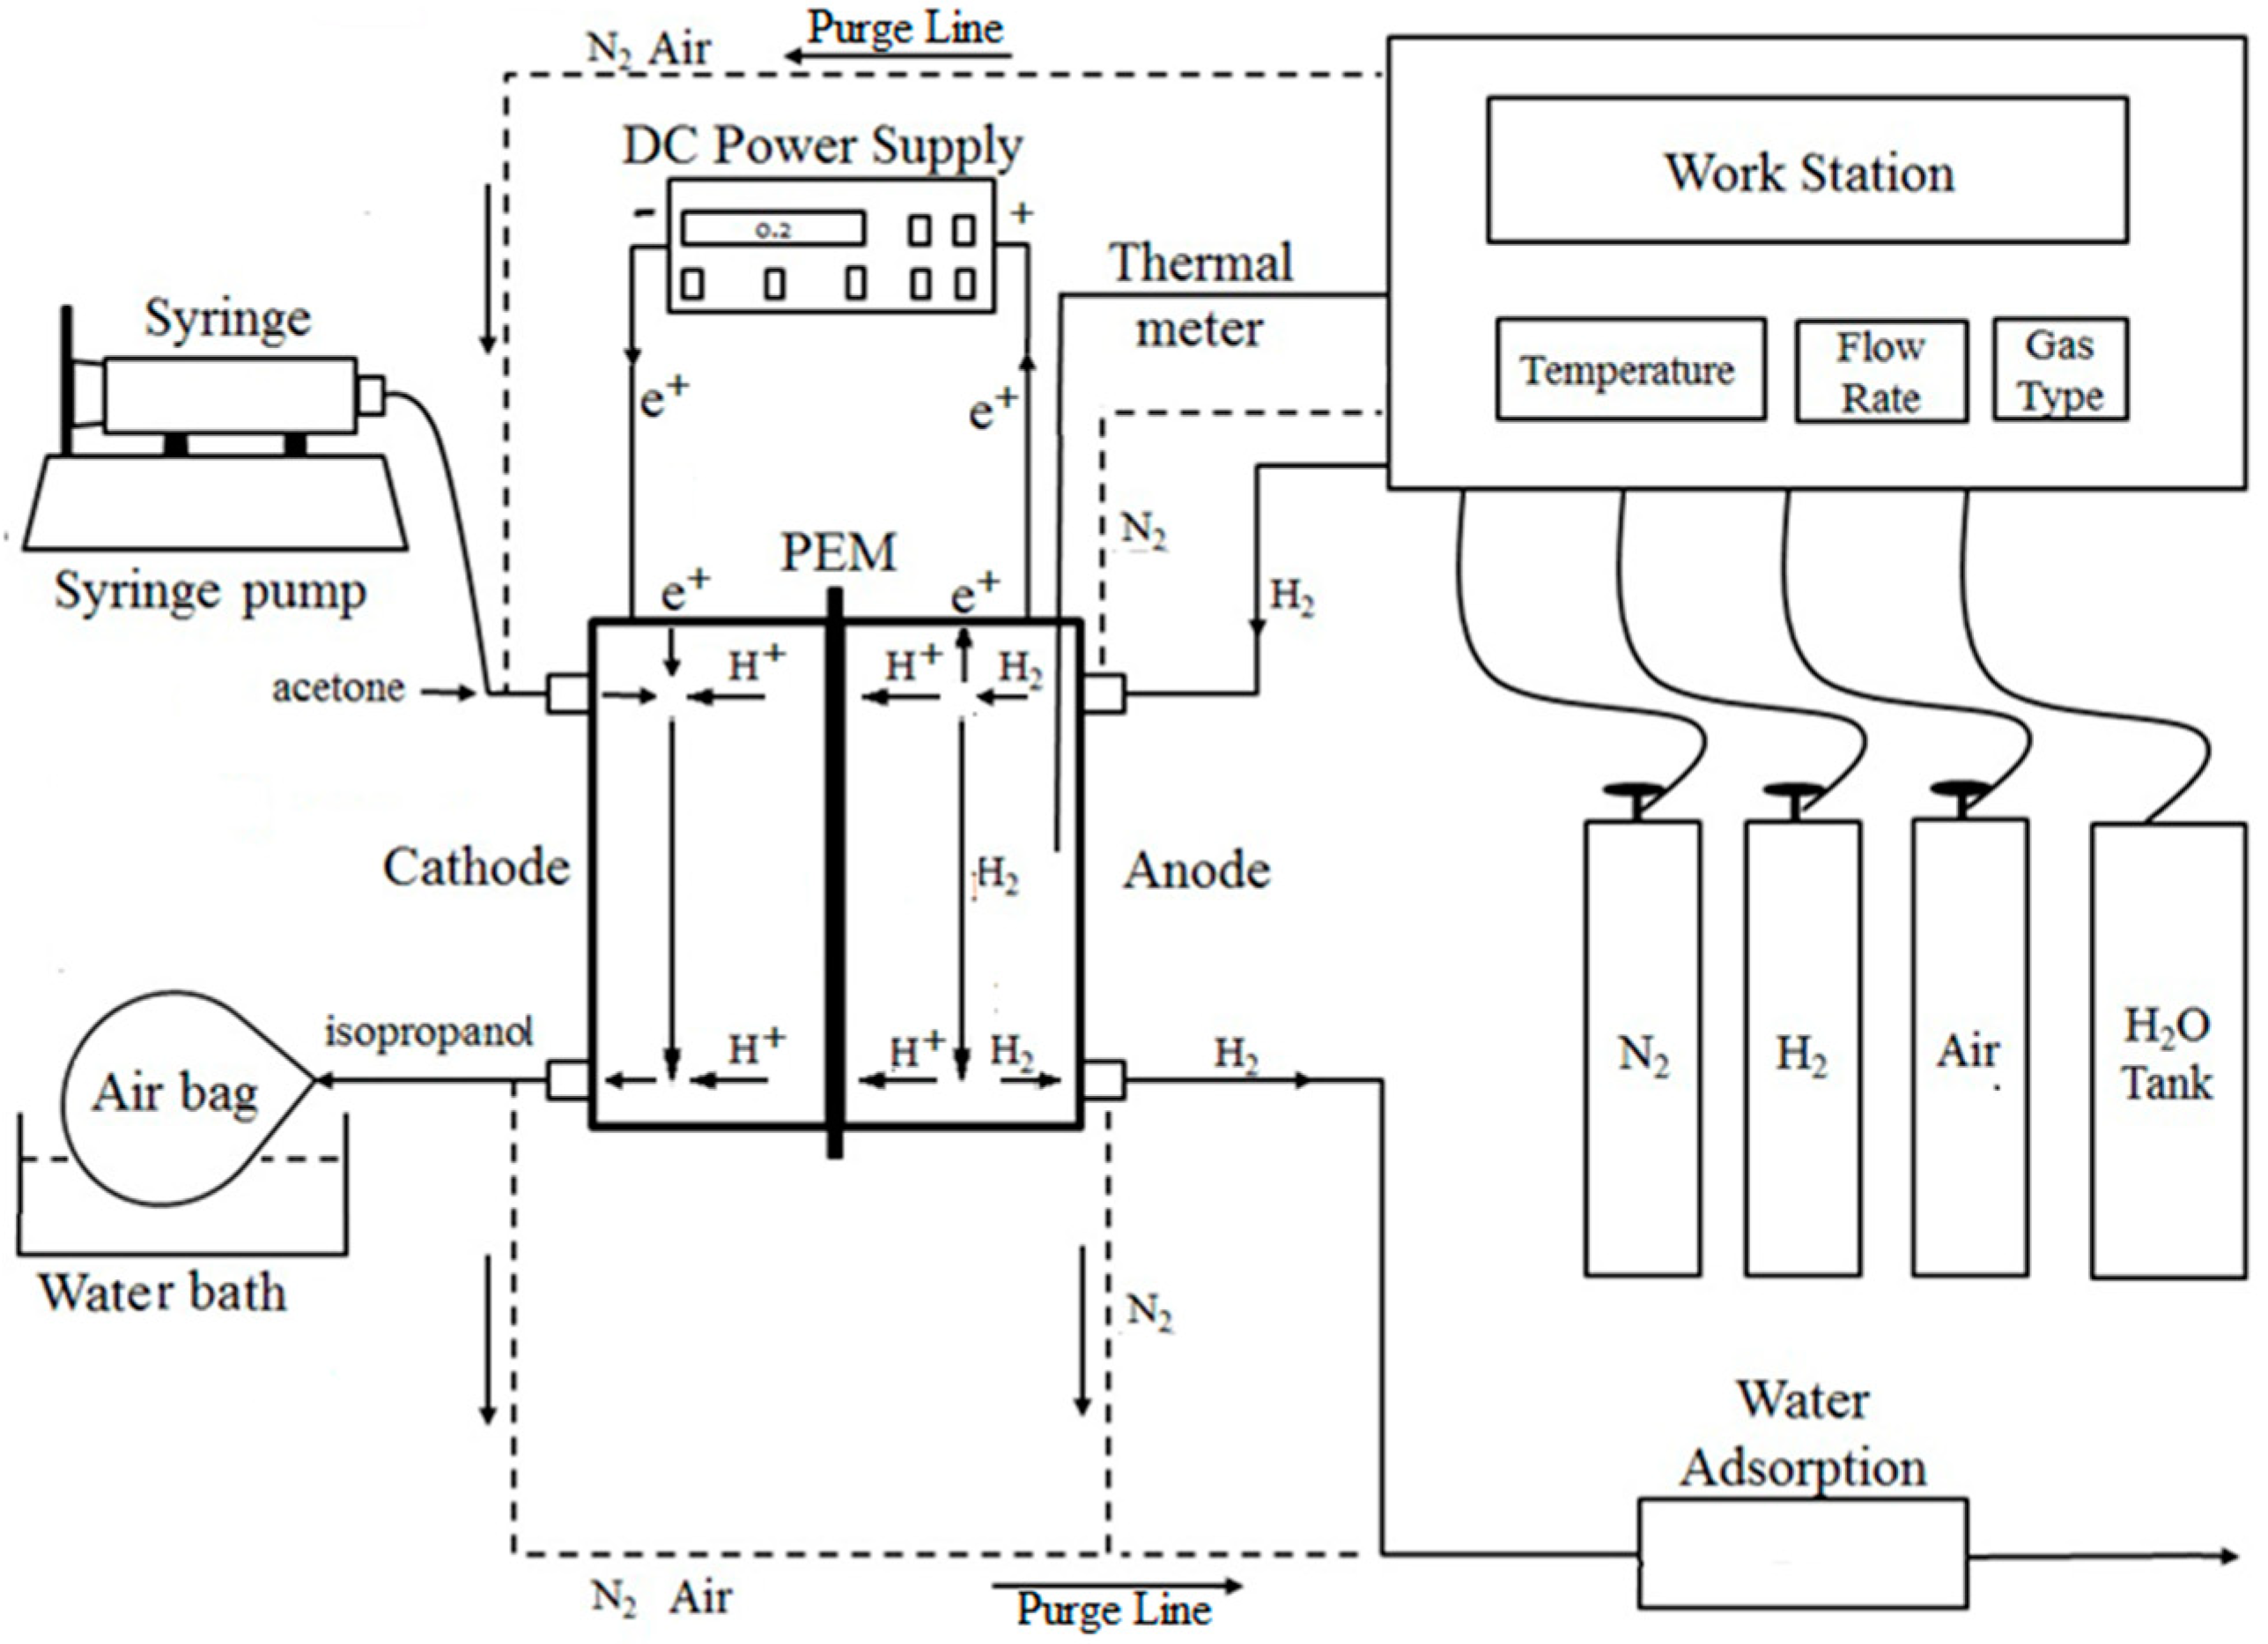
2.1. Material and Experimental Setup

The experiments were performed using a standard PEMFC hardware (Scribner Associates Inc., USA) with an active area of 25 cm2. Such standard PEMFC hardware has been widely used for PEMFC evaluation tests [29,50]. Commercially available MEAs were purchased from Ion Power Inc., New Castle, DE, USA. The MEAs consist of Nafion® 117 membranes sandwiched with porous carbon-based electrodes, each of which has a Pt loading of 0.3 mg/cm2. Micro-porous carbon papers (SIGRACET® 10BC) were trimmed and used as gas diffusion layers (GDLs) for both electrodes. Teflon gaskets were used to seal around the assembly. A pair of graphite bipolar plates with flow patterns were used to distribute flows and enclose the assembly. All temperatures were acquired via K-type thermocouples (OMEGA, USA). A fuel cell test station (850e, Scribner Associates Inc., Southern Pines, NC, USA) was used to control temperatures, flow rates, and humidity. It was also used for data acquisition.
Ultra-high purity (99.999%) N2 (Airgas, Radnor, PA, USA), and filtered shop air were connected to the fuel cell test station and supplied to the PEMFC through the purge line. They were used for purging system and making current and voltage curve, respectively, and were cut off while ECH experiment was running. Ultra-high purity (99.999%) H2 (Airgas, USA) and Deionized (DI) water tank were purged through the anode side of the reactor, using the fuel cell test station. H2 was the electrons donator and deionized (DI) water tank was used for adding humidity to H2. Acetone (Fisher Scientific, Hampton, NH, USA, Certified ACS Reagent Grade) was injected into the cathode side of the reactor by a syringe pump (MTI Corporation, Richmond, CA, USA, EQ-300sp-LD). A direct current (DC) power supply (Tektronix, Beaverton, OR, USA, PWS 4205) was used to supply DC power for ECH. The positive probe was connected to the anode, while the negative probe was connected to the cathode. While ECH was running, electrons were deprived of H2 and transferred to the cathode trough the DC power supply. Acetone was the electron acceptor and reacted with the produced protons. The products from the cathode outlet were collected by airbags (Tedlar®), which were held by water bath. Room temperature water bath was used for condensing the unreacted acetone and products. The cell temperature was controlled by the fuel cell test station. The exhaust gases and byproducts from the anode were condensed in a knock-out bottle prior to venting out. The schematic diagram of the whole experimental setup is shown in Figure 1.

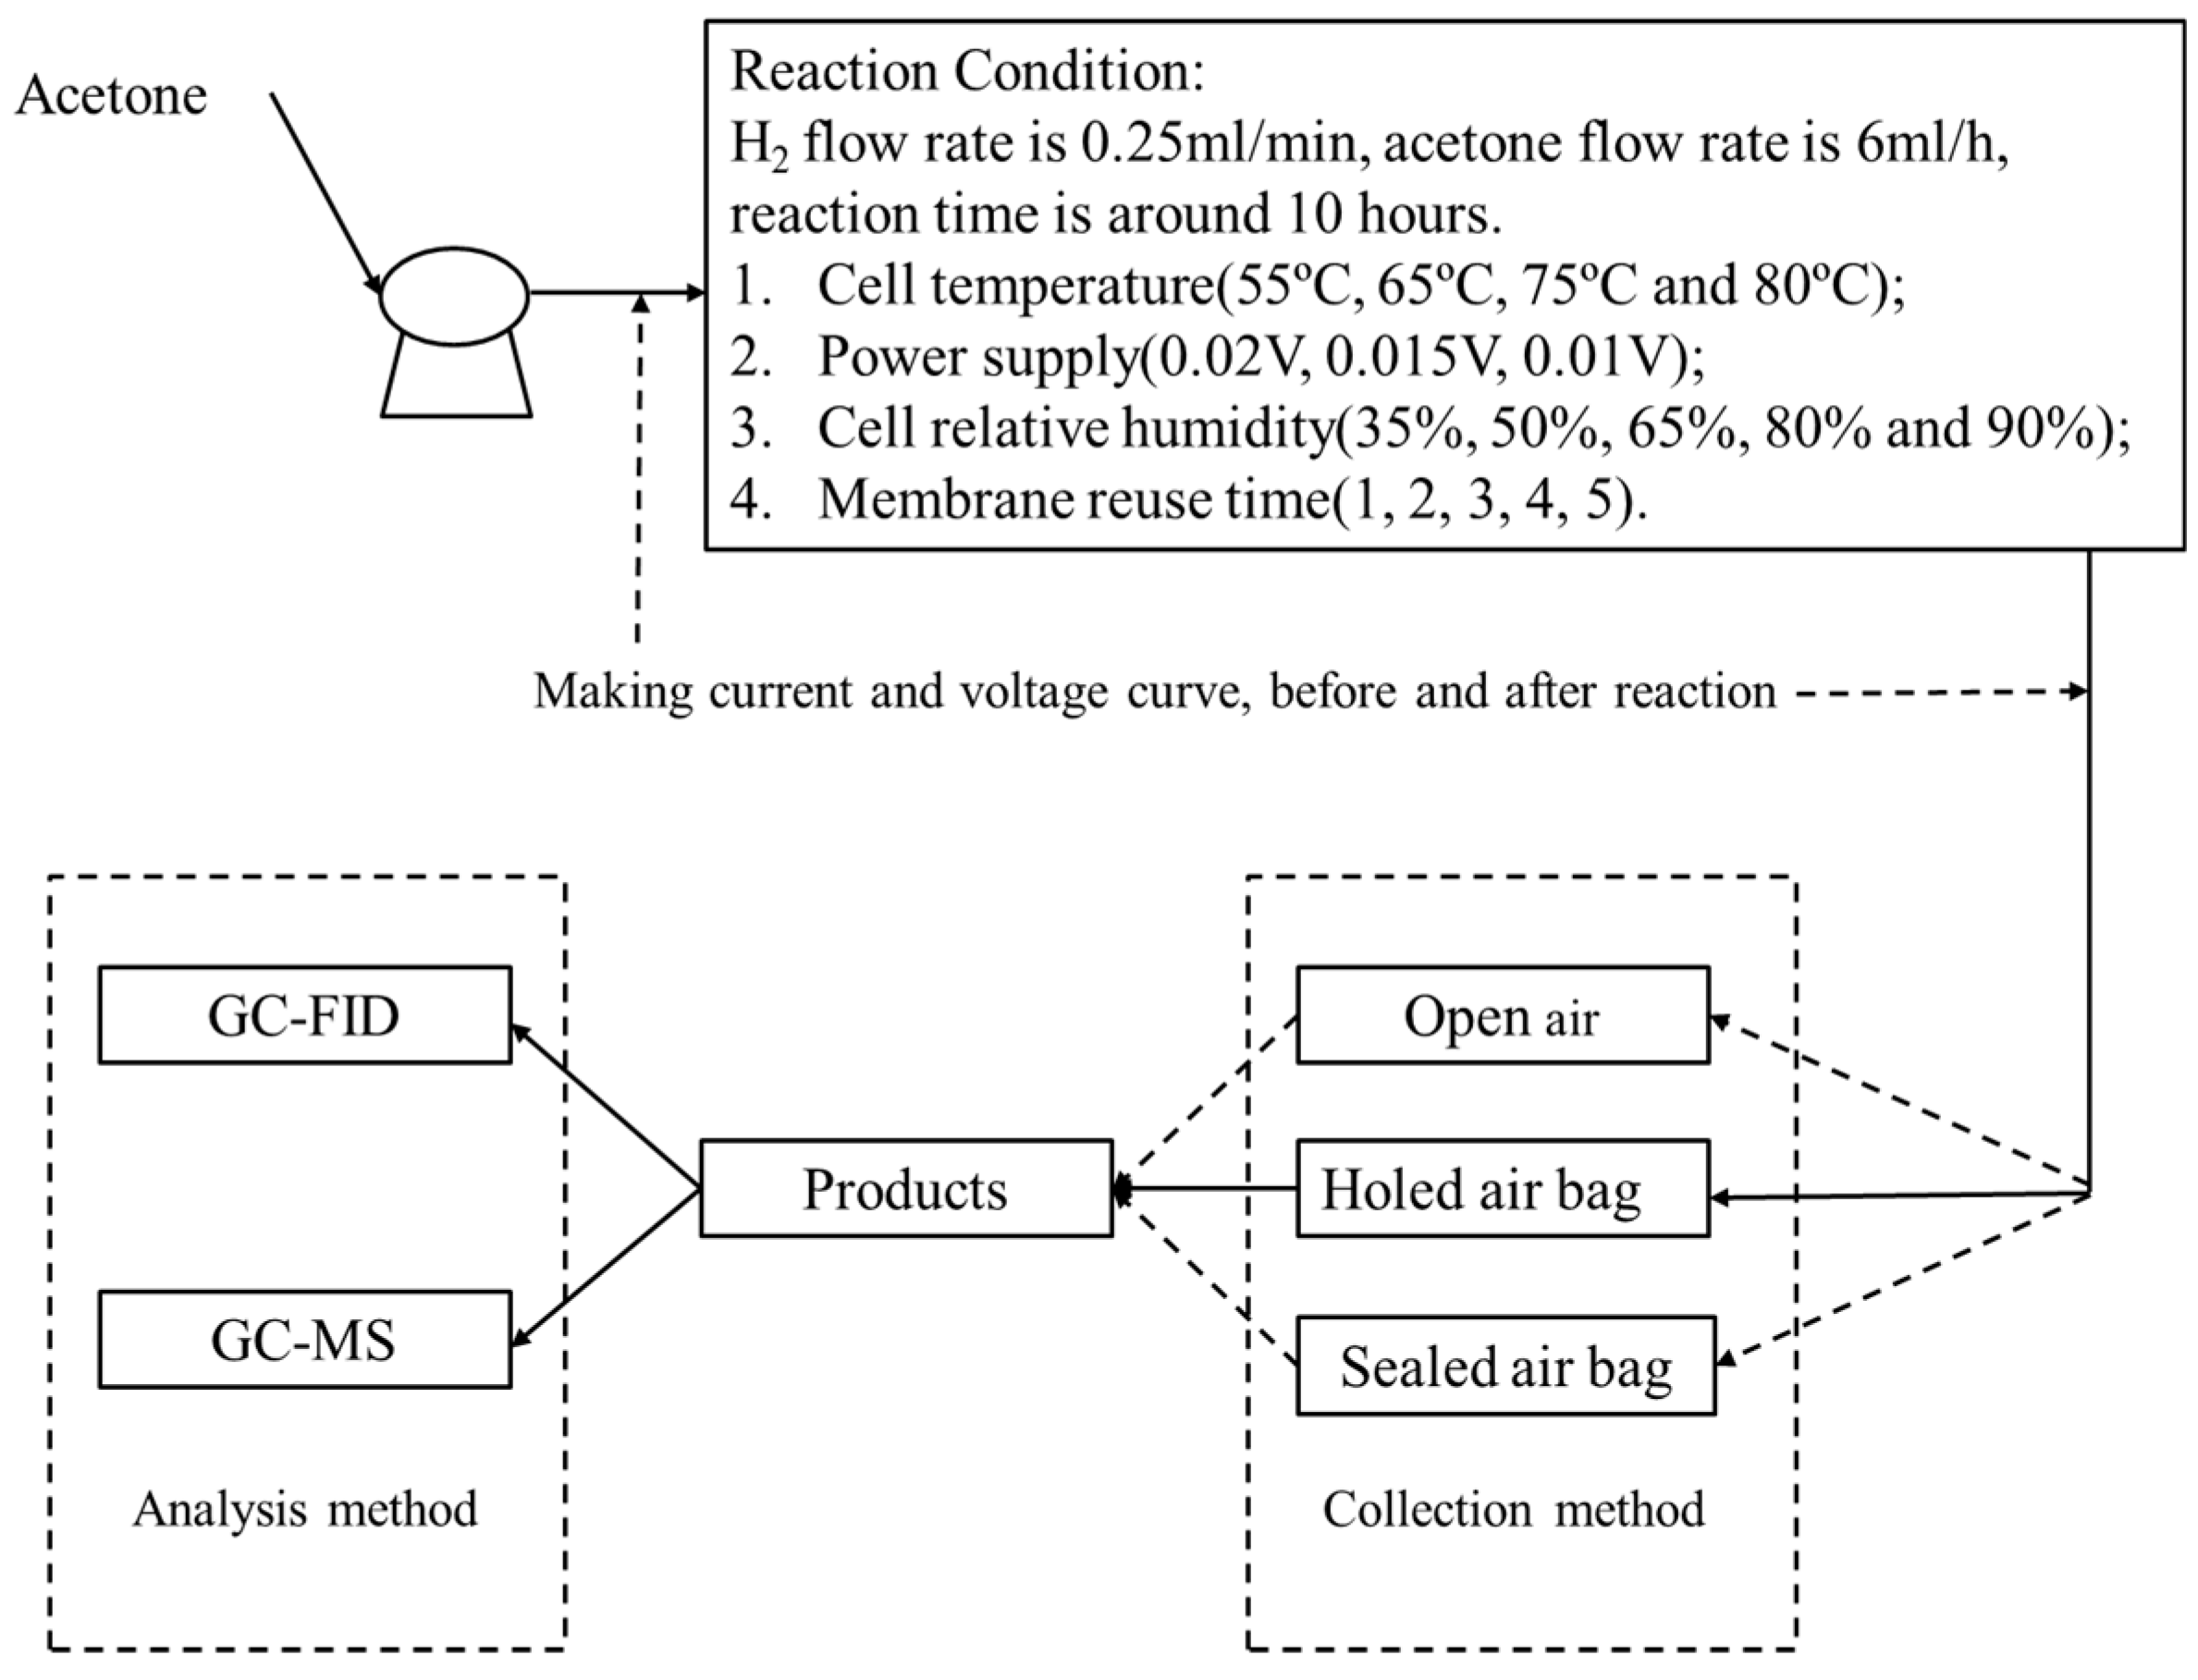
2.2. Electrochemical Hydrogenation and Characterization

All the PEMFCs were assembled in accordance with the standard assembly procedure of fuel cell hardware [51]. Prior to each ECH experiment, a new membrane was conditioned based on the standard protocol [51] for at least 24 h, until it reached a fully functional state. Current–voltage (I-V) sweeps were performed to establish the baseline data for the following ECH experiments.
In each ECH experiment, the acetone and H2 flow rates were controlled at 6 mL/h and 0.25 slpm, respectively. The voltage was consistent for each reaction; the current was recorded every 5 min. Four different factors, namely cell temperature, RH, supplied voltage, and membrane degradation, were investigated to identify the optimized operating conditions. The operating conditions were in the range of 55–80 °C, 35–90% and 0.01–0.02 V, respectively. I-V scans were conducted before and after ECH to characterize the membrane degradation.
The flow chart of the ECH experimental operation is shown in Figure 2. Initially, three collection methods, including the dead end, partially confined and an open end were evaluated to identify the best means for accurate collection of products. In the partially confined method, products were collected by airbags with pressure relief valves, which prevents pressure buildup while trapping the products. In the other two collection methods, although the products were condensed by room temperature water bath, dead end still resulted in too much back pressure accumulation, whereas open end failed to collect enough products for analysis. Therefore, partially confined airbags were used for all the experiments. The pressure differential of two electrodes can be controlled by airbags confined extent. Green et al. proved that a suitable pressure differential between the anode and cathode could decrease cross-over and increase conversion [52]. Dadda et al. believed that water transport in the membrane of a PEMFC is influenced by a convective force, resulting from a pressure gradient [53]. Many researchers also point out the importance of the flow pressure [54].
The collected samples were analyzed by gas chromatography–mass spectroscopy (Shimadzu, GC-MS-QP2010 SE), using a Shimadzu (SH-Rxi-5Sii) MS column (length: 30 m, inner diameter: 0.25 mm). Volume quantitative analysis was conducted by another gas chromatograph (SRI Instrument, 8610C), using a Restek (MXT-WAX) column (length: 30 m, inner diameter: 0.53 mm). Helium was used as a carrier gas for both gas chromatographs.

3. Results and Discussion

3.1. Product Characterization

Both the liquid and gaseous products were analyzed by GC-MS. Unreacted acetone (C3H6O), isopropanol (C3H8O), and diisopropyl ether (C6H14O) were detected in the liquid products. Unreacted acetone, diisopropyl ether, and isopropanol were found in the gaseous and liquid products.
The reactions on both electrodes are catalyzed by Pt. While applying a DC voltage, protons formed at the anode are electrochemically pumped to the cathode. The protons then react with acetone to produce isopropanol and diisopropyl ether. The most feasible reaction pathways at the cathode are shown below:
2 H + + 2 e P t 2 H a d s
Energies 11 02691 i001
Energies 11 02691 i002
Electrosorbed hydrogen is formed on Pt surface by reduction of H+ (Equation (6), where Hads is the electrosorbed hydrogen). Hydrogenation of the C=O bond then proceeds as in catalytic hydrogenation through the reaction of the acetone with the electrosorbed hydrogen (Equation (7)). As a result, isopropanol, which is the main product, is generated. Two isopropanol molecules may also combine and free one water, generating diisoproply ether as a byproduct is formed (Equation (8)). Note that hydrogen gas can also be regenerated, which is an unfavorable electrochemical reaction during ECH. Hydrogen regeneration reduces the efficiency by electrochemically pumping useless hydrogen through the MEA, resulting in a reduction of the yield rate of products.
Each MEA had undergone at least three ECH experiments before replacement. To minimize the impacts of MEA degradation on ECH experiments, the results of the I-V scans, which were carried out prior to the experiments, were compared to the baseline performance of each MEA. If the I-V curve demonstrated an obvious deflection from the baseline performance, then the MEA needed to be replaced. The components detected in the products were isopropanol, diisopropyl ether, acetone, and water, with their volumetric percentages ranging 12–16%, 1–2%, 69–75%, and 11–14%, respectively. Note that abundant acetone was supplied to the cathode to prevent fuel starvation. As a result, the maximum conversion rate of acetone to isopropanol was 23%. The selectivity of isopropanol was calculated more than 90%. Acetone was also detected in the anode due to crossover, which is discussed below. The produced isopropanol can be easily separated from the mixture using extraction and distillation, which are two widely adopted methods in the industry [55] and therefore not discussed in detail here.
Three different control parameters, including RH, operating temperature, and input voltage, were assessed to identify the optimized operating conditions for ECH of acetone. All operating parameters used in the experiments are shown in the Table S1 in the Supplementary Materials.
RH is a very important parameter that affects the performance of PEMFCs [54,56,57,58,59,60]. Figure 3a shows a typical impact of RH on the product yield during ECH of acetone. It was obviously evidenced that higher humidity promoted higher yield of isopropanol. The composition of isopropanol in the products increased from 4.9% to 16.1%, while RH climbed from 35% to 90%. The reason humidity had such a significant impact is that the MEA usually uses a perfluorosulfonic acid membrane (e.g., Nafion®) as the electrolyte. A high or nearly saturated humidity (RH > 80%) is usually required to obtain practical performance because the conductivity of perfluorosulfonic acid membranes depends on the water content. Higher humidity means higher conductivity, consequently resulting in better performance [61,62,63,64]. Water management is critical for PEMFC operation. Sufficient water must be absorbed into the membrane to ionize the acid groups, whereas excess water can cause flooding issues and thus diminishing the performance [52]. The inlet RH of the electrodes must be controlled to prevent both membranes from drying out and electrode flooding. Although better performance is usually obtained by increasing RH, excess moisture may result in water flooding that hinders gas transport [65]. In the present experiments, RH was maintained between 35% and 90% to prevent either water starvation or over saturation. In fact, many researchers have investigated the mechanism of humidity influence. It is generally believed that RH can impact electro-osmotic drag, water diffusion, membrane ionic conductivity, and water back diffusion flux in the MEAs, which consequently influence the performance [66,67]. Elevated RH can greatly improve the PEMFC performance, through increasing the membrane conductivity [68,69], the catalyst activities [68,70], the electrode kinetics [71,72], and the mass transfer rates [73,74].
Operating temperature is the second factor that was assessed in this study. Generally, the temperature was found to have a slightly positive impact on the product yield. As shown in Figure 3b, the isopropanol yield percentage of products varied between 9.3% and 14.3%, when the temperature increased from 55 °C to 80 °C. However, the temperature seemed to have minimal effect on the total efficiency. The results agreed with the findings from the literature. Singh et al. [25] investigated ECH of phenol by Pt accordance with increasing temperature. They believed that dehydrogenated phenol adsorbents easily block the active sites of Pt at higher temperatures. The ECH efficiency was claimed to be directly correlated with the adsorption properties of acetone, hydrogen, and propanol onto the Pt/C catalyst. Murillo and Chen [75] used temperature programmed desorption (TPD) to monitor the desorption and decomposition property of propanol in a wide temperature range on the Pt surface. According to their research, propanol decomposition peaked at 65 °C and 117 °C. In the present research, the operating temperature ranged from 55 °C to 80 °C, between which propanol decomposition could happen at a higher temperature (>80 °C). Decomposition of propanol was believed to cause the decrease of its yield. Therefore, increasing the operating temperature in the range does not necessarily result in an increase in the product yield.
Finally, the influence of applied voltage on the product yield was also investigated. Generally, the input voltage has no obvious impact on the product yield. In the experiments, the voltage ranged from 10 mV to 20 mV, with 5 mV increments. At 10 mV and 15 mV, the yield of isopropanol was 15.9% and 17.0%, respectively. Diisopropyl ether was not detected in either case. However, when the input voltage was increased to 0.02 V, the volumetric percentage of isopropanol produced was up to 16%, and about 1% diisopropyl ether was detected.

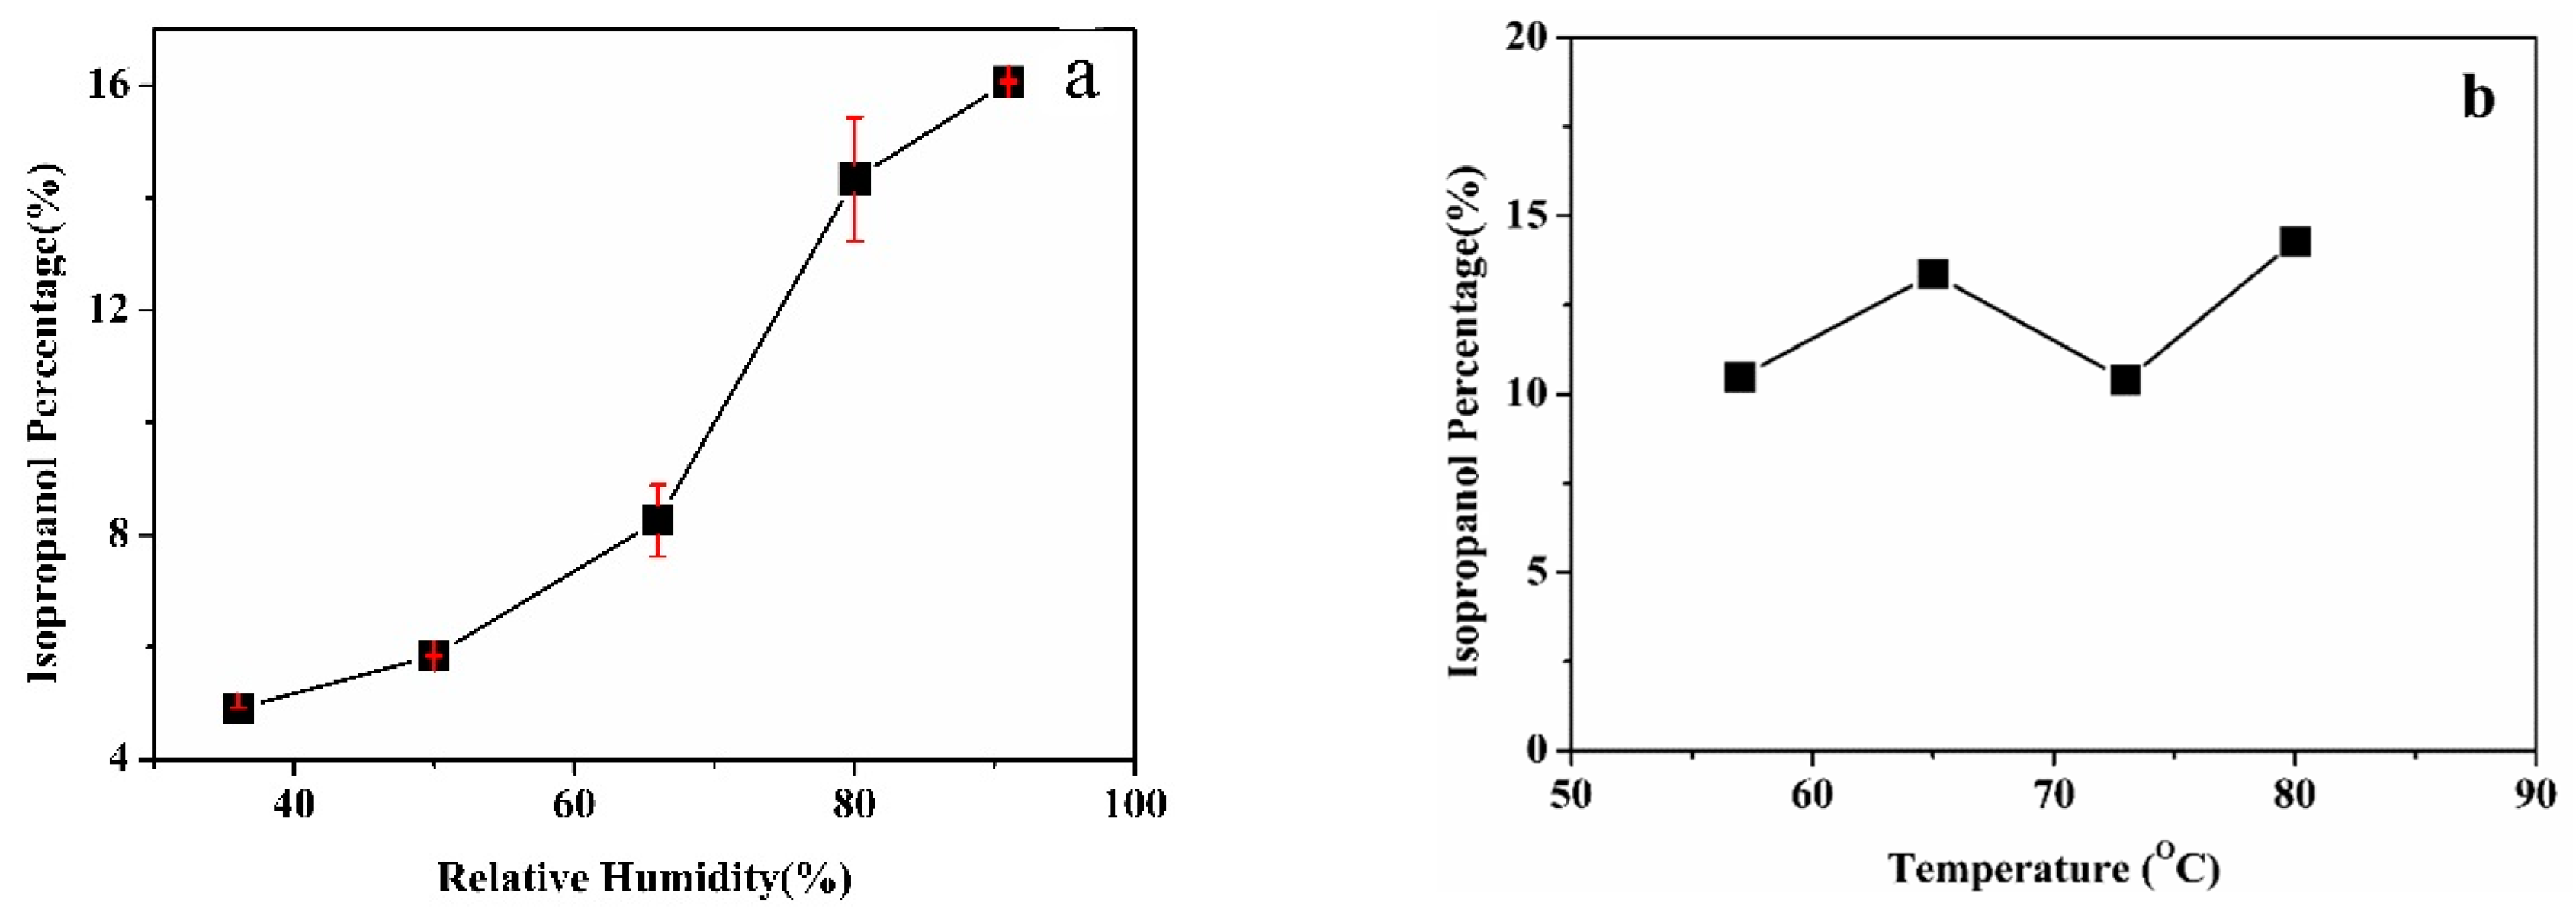
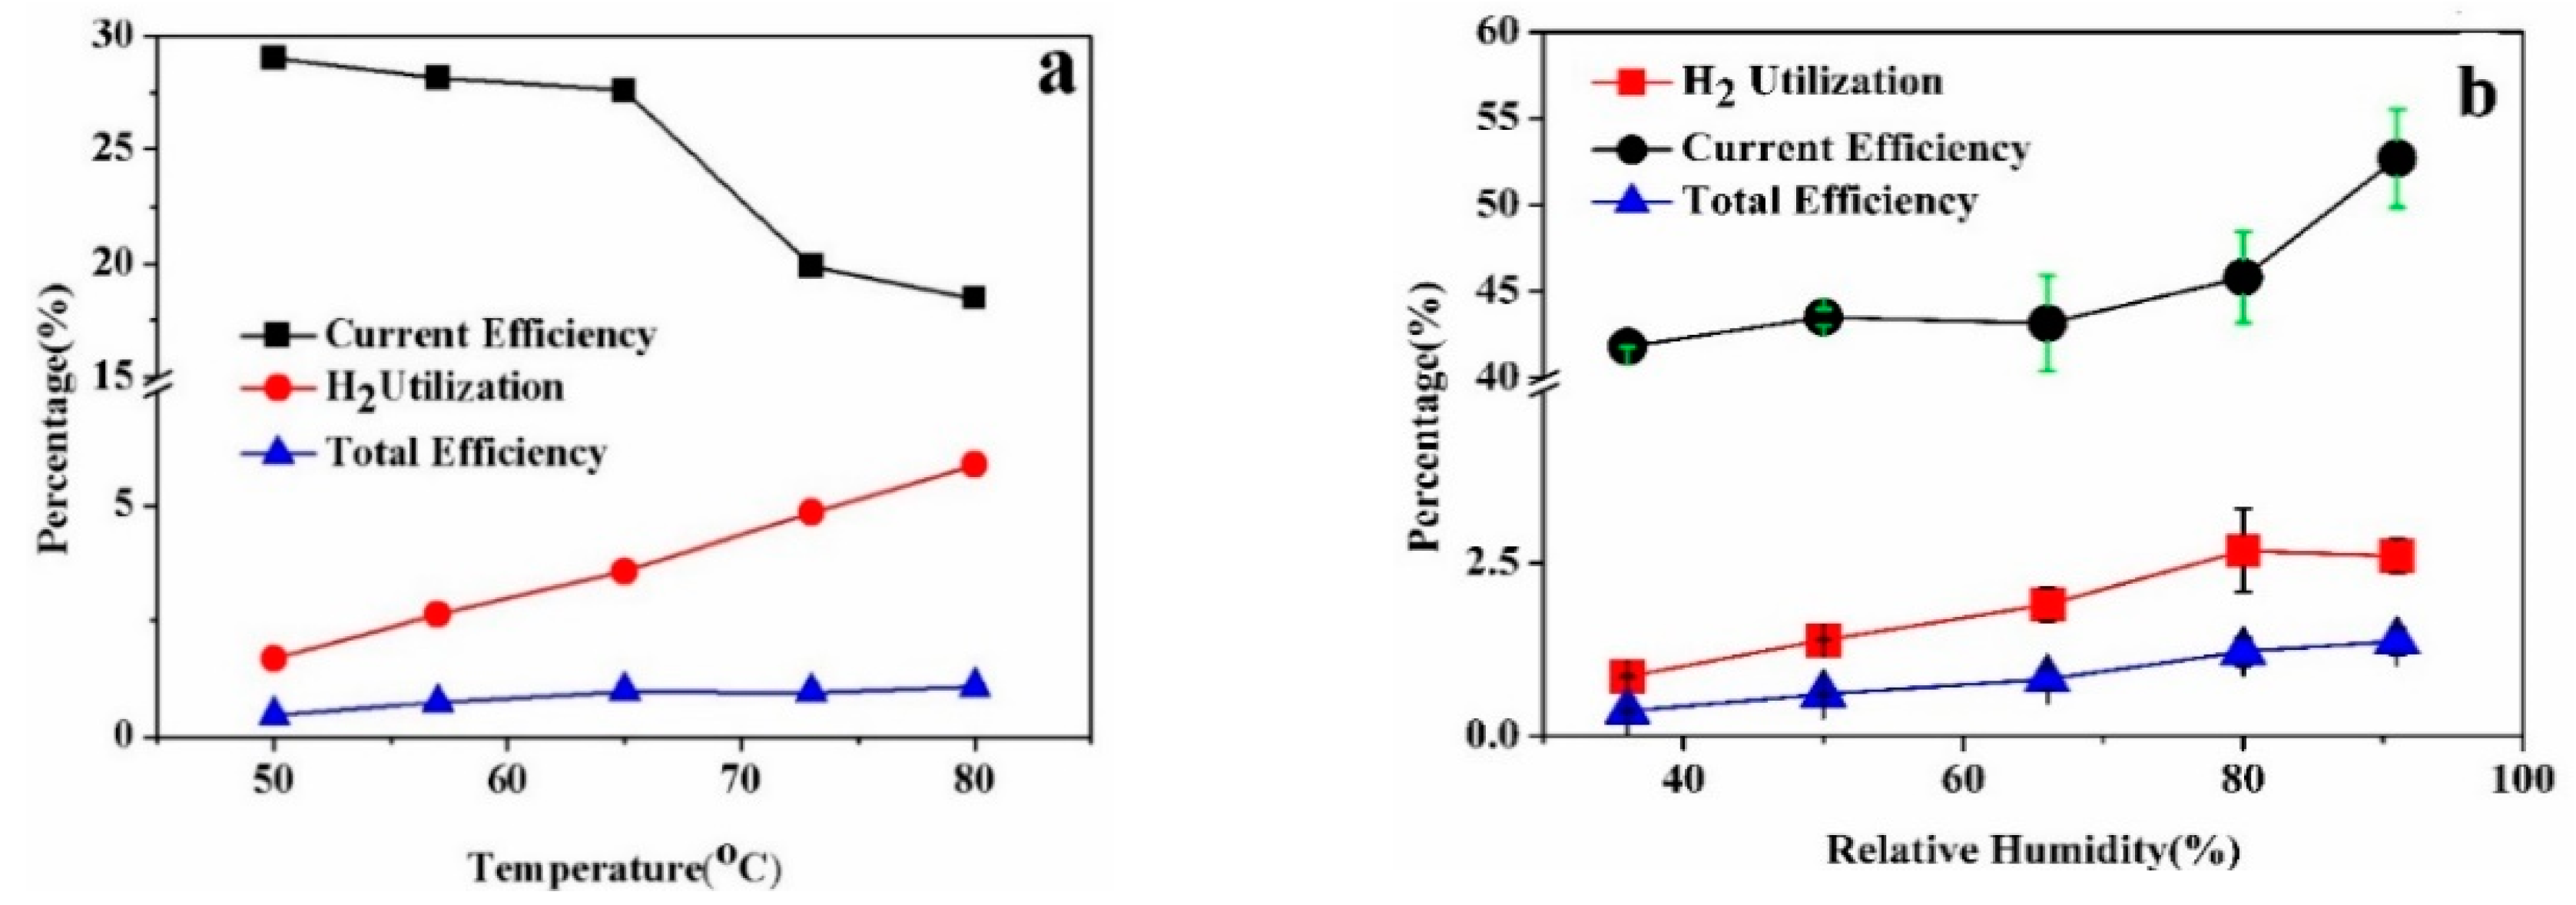
3.2. System Analysis

Selectivity, H2 utilization, and current efficiency were selected to evaluate the hydrogenation efficiency. Selectivity represents the yield of desirable products. As the major product, higher isopropanol selectivity was pursued. The selectivity is calculated based on the following equation [14,20], where acetone unreacted is excluded:
S e l e c t i v i t y = M o l e s   o f   D e s i r e d   P r o d u c t T o t a l   M o l e s   o f   P r o d u c t s × 100 %
In the present research, H2 was supplied to the anode to produce protons for ECH reactions on the cathode. Due to gas diffusion resistance, gas crossover, and hydrogen regeneration on the cathode, some H2 was wasted. The H2 utilization is directly related to the overall ECH efficiency. Higher H2 utilization percentage is desired since more hydrogen will be involved in the ECH process. The actual amount of H2 used to produce isopropanol can be derived from the amount of product. The H2 utilization is calculated by the following equation:
H 2   U t i l i z a t i o n = A t o m i c   H y d r o g e n   U s e d   f o r   F a r a d a y   C u r r e n t   T o t a l   A t o m i c   H y d r o g e n   S u p p l i e d × 100 %
During the ECH process, acetone reacts with M(H)ads to produce isopropanol and byproducts on the cathode. Concurrently, H2 regeneration happens and is an unfavorable process simply because it wastes energy. The H2 regeneration reaction is affected by supplied voltage, temperature, humidity, and catalyst. Hereby, current efficiency (shown below) is used as an important parameter to determine how efficient H2 is used for the ECH process [14,20].
C u r r e n t   E f f i c i e n c y = C u r r e n t   u s e d   f o r   t h e   E C H   p r o c e s s   T o t a l   F a r a d a y   c u r r e n t × 100 %
The total efficiency is defined by the H2 utilization multiplying the current efficiency, as shown in the following equation:
T o t a l   E f f i c i e n c y = H 2   U t i l i z a t i o n × C u r r e n t   E f f i c i e n c y
Figure 4a shows the impact of temperature on H+ utilization, current efficiency, and total efficiency in a typical set of experiments. As the operating temperature increased from 50 °C to 80 °C, H+ utilization increased from 1.5% to 6.0%, whereas current efficiency decreased from 28% to 18.5%. Temperature affects H+ utilization and current efficiency differently. Higher ionic mobility and catalytic activities are achieved with higher operating temperatures, resulting in higher H2 utilization. Consequently, the electrochemical conversion and reaction rates increase with elevated temperatures [52]. However, Figure 4a indicates that, although elevated operating temperature enabled more hydrogen being involved in reactions, the yield of products did not increase or even decreased. That resulted in a loss of current efficiency, which means most extra protons produced were somehow wasted. The conclusion can also be evidenced by the curve of the total efficiency, which remained almost flat. Note that the total efficiency was low because abundant H2 was supplied to the system to minimize the impact of fuel starvation and gas diffusion resistance. Practically, stoichiometric flow can be fed to the system based upon the actual current. In their experiments of ECH of acetone, Sara et al. observed that the current efficiency increased while the cell temperature increased from 25 °C to 50 °C, which seems to contradict our results [52]. However, in the present research, PEMFCs were operated in a recommended range between 50 °C and 80 °C to achieve the best performance. The reduction of current efficiency is believed mainly due to propanol decomposition, as mentioned in Section 3.1. Another minor reason was acetone vaporization, since the boiling point of acetone is 56 °C. Acetone gasification might have negative impact on the hydrogenation reactions on the cathode, due to increased pressure and thus higher diffusion resistance.
Figure 4b shows the impact of RH on H2 utilization, current efficiency, and total efficiency. The operating temperature was set at 65 °C, and the RH was controlled by setting the humidifier’s temperature. It is seen that higher RH resulted in better efficiencies. As the RH ranged from 35% to 90%, the H2 utilization increased from 0.9% to 2.8%, and the total efficiency increased from 0.4% to 1.5%. A sudden spike of the current efficiency was observed when ramping the RH from 80% to 91%. It can be concluded that higher RH is favorable for ECH of acetone and will result in a higher yield of products. It has been proved that higher ionic conductivity can be achieved when MEAs become more hydrated [68,69,70,76,77,78,79]. Practically, high RH is required to maintain the best fuel cell performance. The higher water content in the Nafion membrane will ease proton transport, i.e., reduce ionic resistance. As a result, more protons can be created and transported to the cathode for ECH. Typically, >80% RH is recommended [61,62,63,64], which explains why a spike in the current efficiency was observed when the RH surpassed 80%.
The present research shows that the performance of ECH of acetone is correlated with RH, input voltage, and temperature, in which RH has the most obvious effect. It is suggested that the optimized operating conditions are RH of 80% or more, the input voltage of 0.02 V or less, and temperature of between 50 °C and 55 °C. The obtained maximum H2 utilization and maximum current efficiency achieved in the present experiments were 5.9% and 59.7%, respectively. To further increase those efficiencies, stoichiometric flow control is strongly recommended.

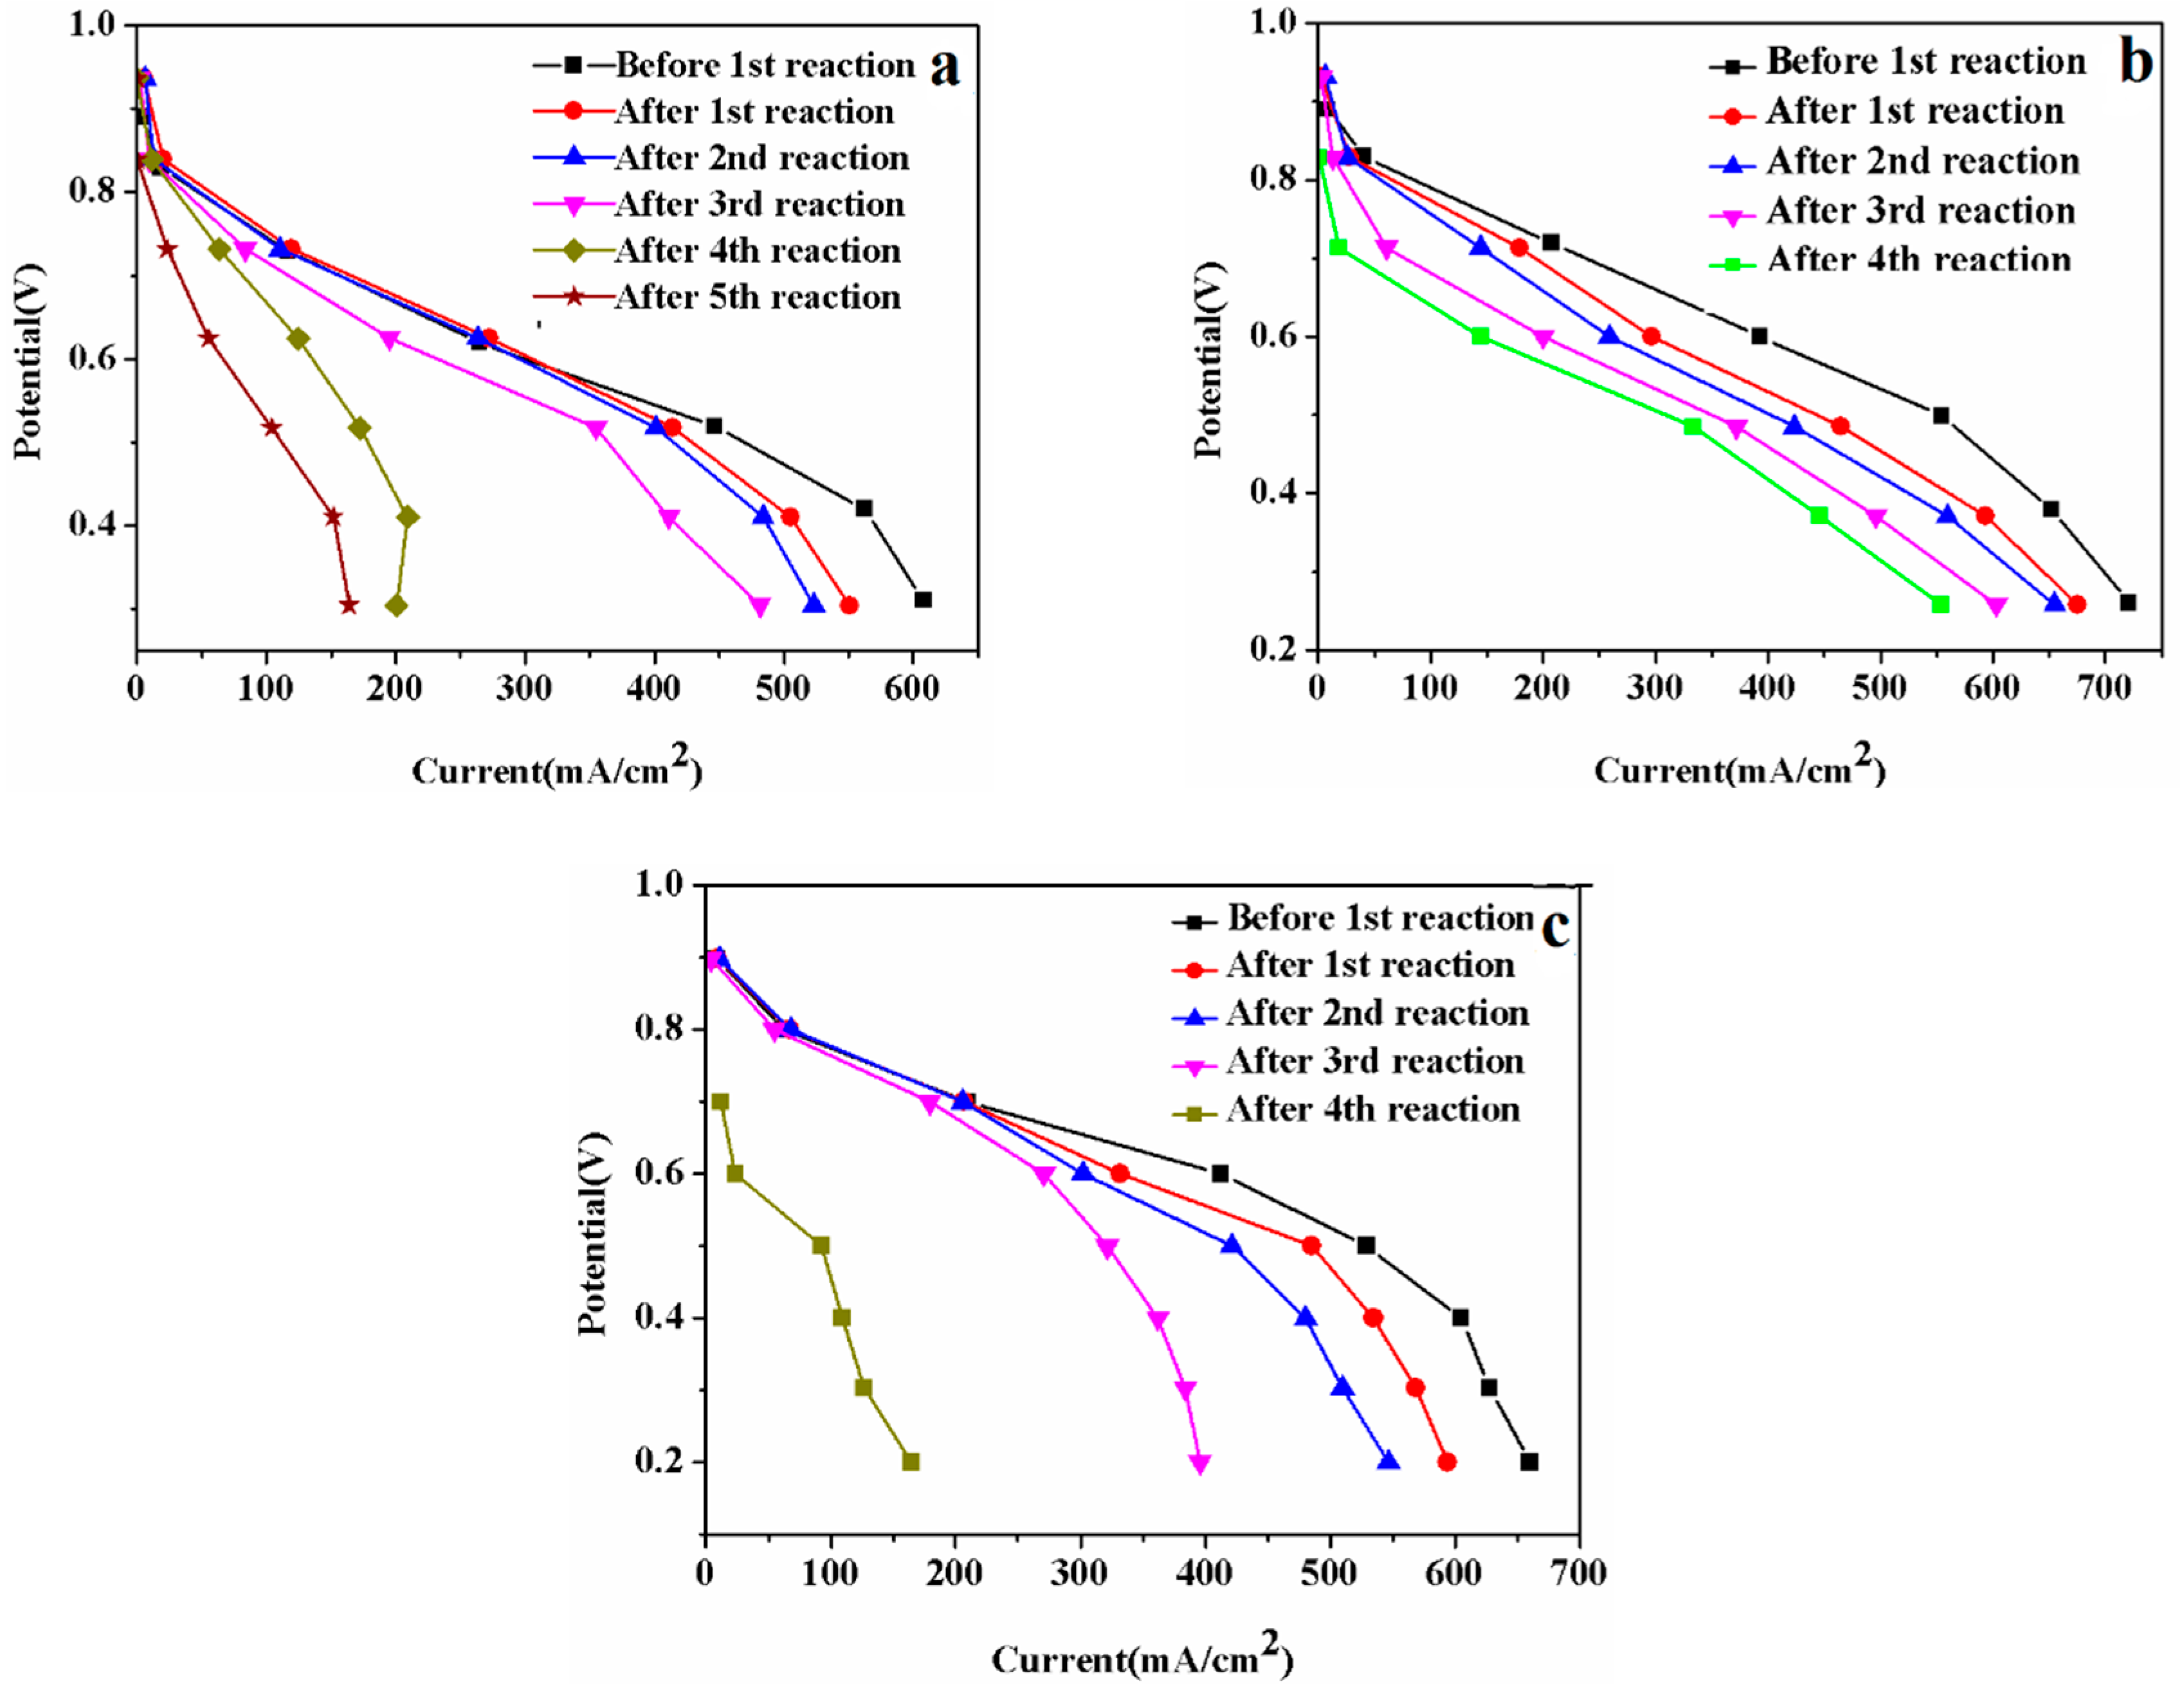
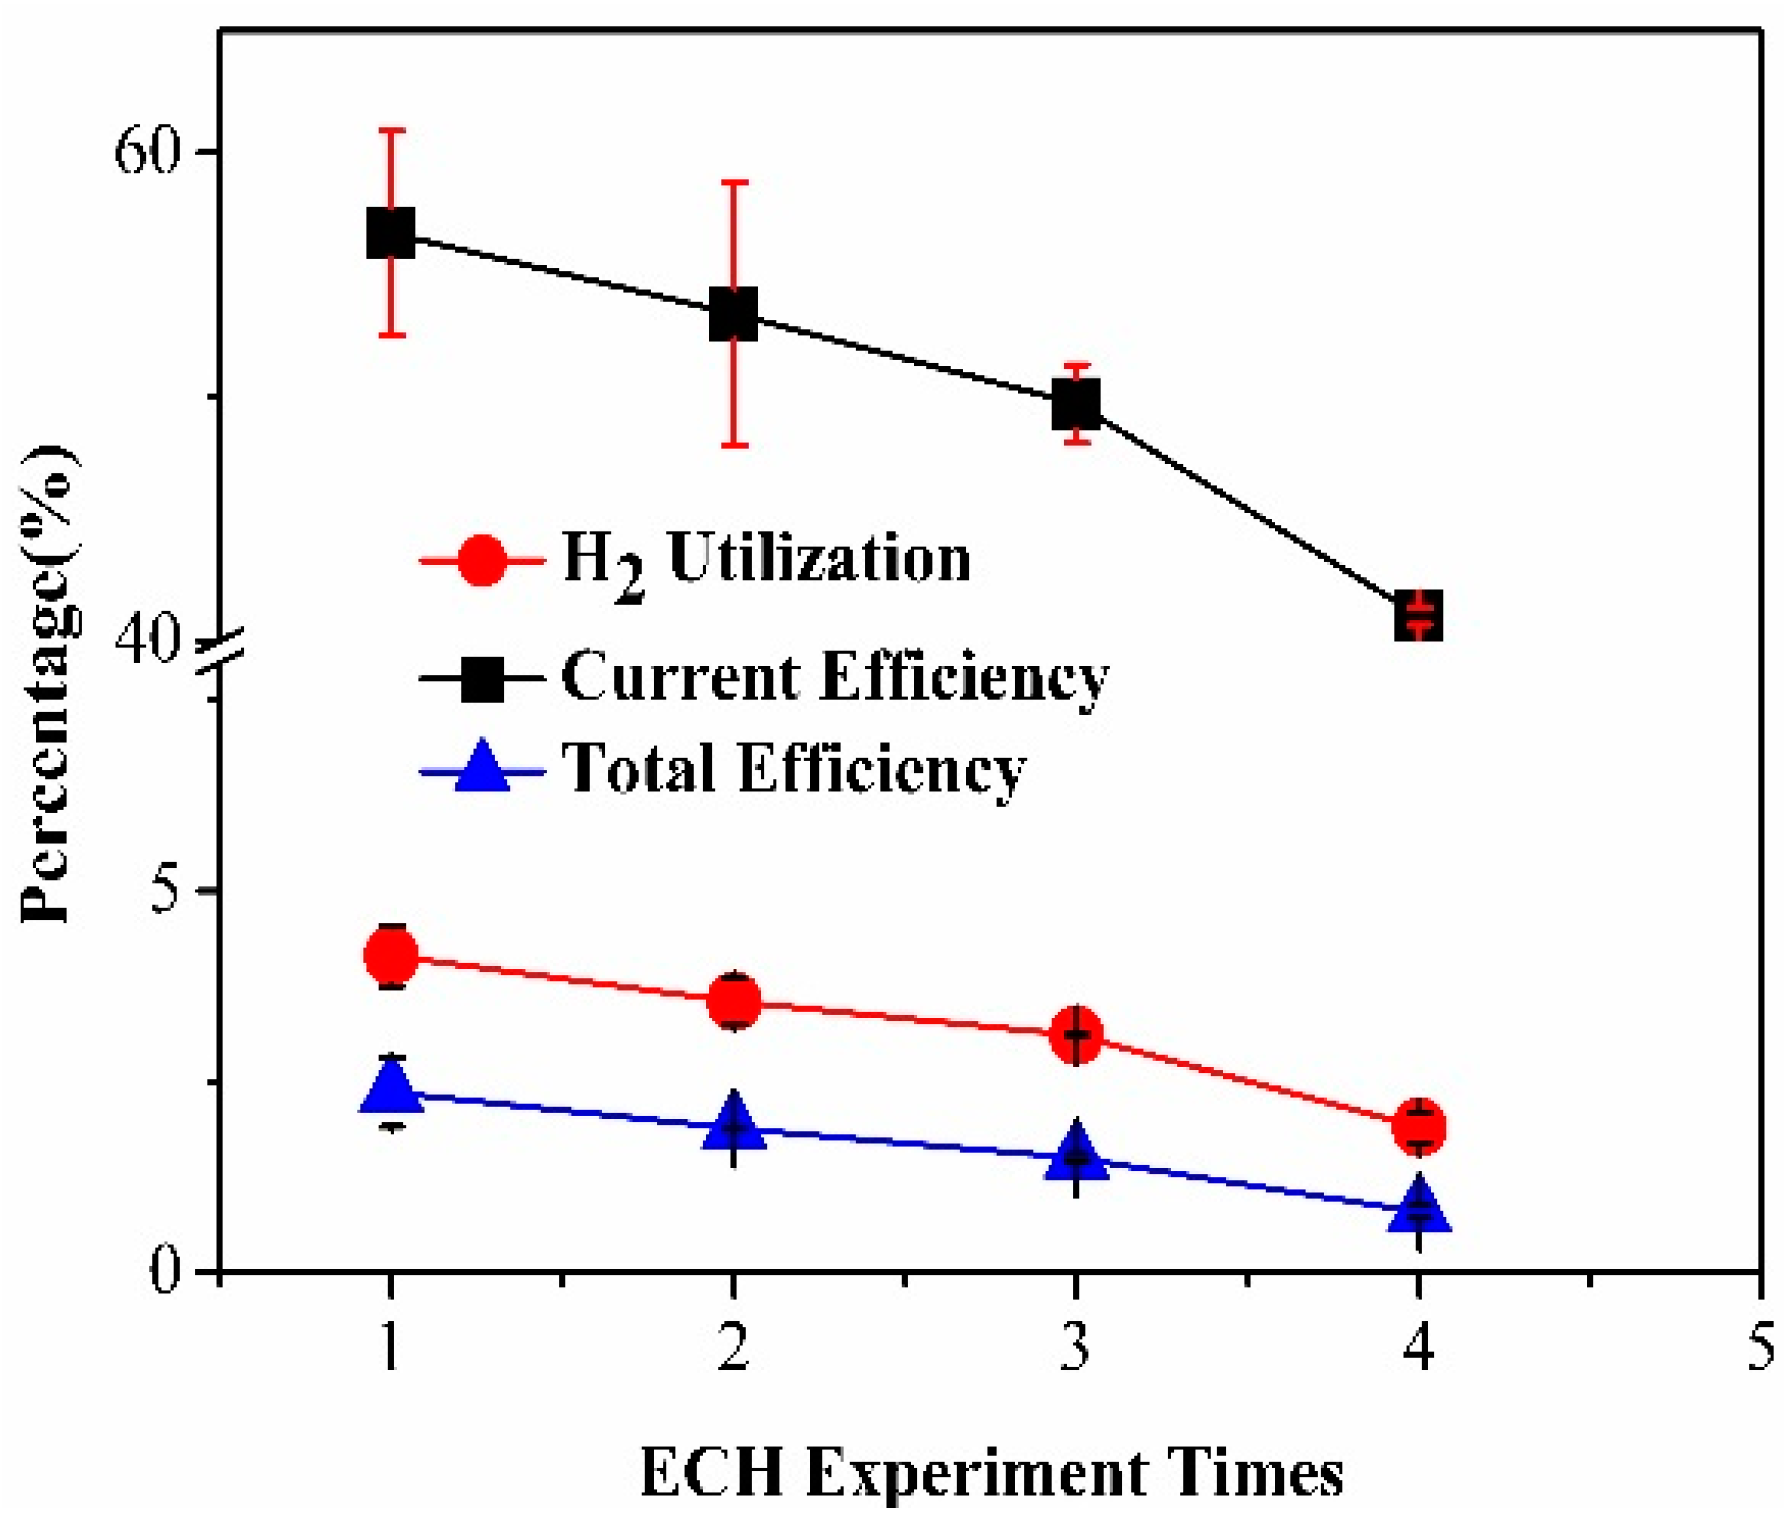
3.3. MEA Degradation

Long-term durability is one important factor that affects the practical applications of ECH using PEMFC reactors. Nowadays, commercial MEAs are fairly durable for their common roles as the power sources. The ECH process, however, involves organics that may contaminate MEAs and thus shorten their lifetime. To our best knowledge, very limited research has been conducted to evaluate the impacts of contaminants on the durability of ECH. In the past decade, extensive research has been carried out on mitigating contamination of PEMFCs from impurities, including CO, CO2, H2S, NOx, SOx, and hydrocarbons [80,81]. Impurities may contaminate one or more components of the MEA, resulting in performance degradation. Three major contamination effects were identified as the poisoning of the electrode catalysts, a decrease of the ionic conductivity, and an increase of the mass transfer resistance.
Additionally, the crossover is another factor that negatively impacts the PEMFC performance. Crossover of organic compounds during hydrogenation using PEMFCs has been reported [82,83]. One immediate drawback is the loss of fuel and/or products, which decreases the efficiency. Furthermore, contaminants not only poison just one electrode but also may crossover and further poison the catalyst on the other electrode [12].
To investigate the impacts of MEA degradation on the present hydrogenation tests, polarization scans (V-I sweeps) were performed after each test [51]. The black curves in Figure 5 are the baseline data recorded for the fresh MEAs prior to ECH tests. After each test, pure N2 was purged for at least 10 h to remove all the temporary contaminants. The effects of RH and temperature on the MEA degradation were also evaluated.
Figure 5a shows the results of five sets of V-I measurements performed on a PEMFC, which underwent five 10-h ECH experiments. Both the ECH experiments and V-I measurements shown in Figure 5a were conducted at 65 °C with 80% RH. It clearly shows that the MEA performance degraded as more ECH tests were conducted, especially after the third ECH experiment. The open circuit voltage (OCV) dropped a lot starting from the fourth V-I scan, which indicates that crossover became significant. It implied that pinholes might form due to degradation.
Figure 5b shows the effect of RH on the MEA degradation during ECH. For the ECH experiments conducted in Figure 5b, RH was reduced to 65% for the first and second tests and was further reduced to 50% for the third and fourth tests. To compare with the same baseline data (the black curve in Figure 5b), all V-I scans were performed using the same operating conditions that have been used for the baseline scan. The results illustrate that reducing RH was able to mitigate the degradation to some extent. It is believed that less RH resulted in less mass transport via the MEA, which eventually extended the lifetime of the catalysts. However, permanent damage to the MEA still existed, as seen from the general trend of V-I scans. Similar to the observations in Figure 5a, purging with pure N2 could not remove permanent contaminants.
Finally, the effect of operating temperature on the MEA degradation was investigated, as shown in Figure 5c. For the ECH experiments conducted in Figure 5c, the operating temperatures were 80 °C, 73 °C, 57 °C, and 50 °C, while maintaining the same RH. Again, all V-I scans were performed using the same operating conditions as those used for the baseline scan (black curve in Figure 5c). The results show that temperature variation has no observable impact on MEA degradation. In other words, changing the operating temperature did not mitigate degradation.
Figure 6 shows that the trends of current efficiency, H2 utilization, and total efficiency using the same MEA for several ECH experiments. Figure 6 shows that, as the MEA degraded, current efficiency, H2 utilization, and total efficiency all decreased. Until a method of contamination mitigation is found, it is acceptable to use one MEA three times.
Usually, the lifespan of a PEMFC under steady-state operation can be very long, up to thousands of hours [84,85,86,87,88,89]. However, catalyst contamination is the major factor that diminishes the PEMFC performance and very likely results in significant degradation [90,91,92]. In fact, many organic compounds can contaminate the MEA. Those compounds include acetaldehyde, toluene, propane, vinyl acetate, methyl methacrylate, acetonitrile, dichloromethane, acetylene, chlorobenzene, formic acid, methanol, ethanol, phenol, butane, acetone, and naphthalene [93,94,95], and the list is expanding. The main reason that so many contaminants were found is that the catalysts used in common MEAs are Pt-based. Pt is a premium catalyst, but also sensitive to so many contaminants. The MEAs used in the present research contain pure Pt as the catalyst. Although developing non-Pt catalyst is beyond the scope of the present research, to further conduct durable ECH experiments, MEAs with contamination tolerant catalysts need to be used.
Reactant and product crossing over is another possible reason that caused the MEA degradation. Liquids that contained mainly acetone were detected at the anode side during the ECH experiments. Those liquids not only decrease the fuel utilization but also further contaminate the anode catalyst. Feasible solutions to this issue include adopting thicker MEAs, feeding gaseous feedstock instead of liquid, and using non-Pt catalyst [96].
In summary, to minimize the MEA contamination using the current setup, keeping low RH is suggested. To solve the problem essentially, novel non-Pt catalysts need to be developed, such as Pd- and Ni-based catalysts [97,98]. Even though a wide range of metals can be used as electrocatalysts at the cathode, those with the strong hydrogen absorption capability are desired.

4. Conclusions

Electrochemical hydrogenation of acetone using a PEMFC reactor was successfully demonstrated in the present research. The results proved that ECH can be a feasible way of hydrogenating acetone to produce isopropanol in mild conditions. In the experiments, the main product obtained was isopropanol with a selectivity of approximately 90%. A small amount (about 1%) diisopropyl ether was also obtained as a byproduct. The mild operation conditions, including low temperature and ambient pressure, are the greatest advantages of the proposed ECH method. The present research suggests that the optimized conditions for ECH of acetone using a PEMFC reactor include an operating temperature around 65 °C and relatively high RH.
Contamination impact using the PEMFC reactor during ECH was also investigated. It was concluded that organic compounds can contaminate the MEAs, resulting in serious degradation. However, methods to mitigate contamination are limited. The present research only demonstrated that lower RH could help reduce contamination. Eventually, novel non-Pt catalysts need to be developed for durable ECH process.

Supplementary Materials

The following are available online at https://www.mdpi.com/1996-1073/11/10/2691/s1, Table S1: Operating Parameters of the Experiments.

Author Contributions

Conceptualization, C.L. and S.K.; Methodology, X.Z.; Software, C.L. and A.M.S.; Validation, C.L., X.Z. and S.K.; Formal Analysis, C.L.; Investigation, C.L. and A.M.S.; Resources, X.Z. and S.K.; Data Curation, C.L.; Writing—Original Draft Preparation, C.L.; Writing—Review and Editing, X.Z. and S.K.; Visualization, C.L.; Supervision, S.K.; Project Administration, X.Z.; and Funding Acquisition, X.Z.

Funding

This research was supported by the United States National Science Foundation (#1560194) and the Old Dominion University.

Acknowledgments

The authors would like to acknowledge the technical assistance from Can Zhou, Qiang Tang, and Yazdanshenas Elias who helped with the experiment set up. The authors are also grateful to Ali Teymouri, Caleb Talbot, Adams Kameron, Alexander Asiedu, and Samaratunga Ashani for technical discussion and sample analysis.

Conflicts of Interest

The authors declare no conflict of interest.

References

  1. World Health Organization. Guide to Local Production: WHO-Recommended Handrub Formulations. 2011, pp. 1123–1156. Available online: http://www.who.int/gpsc/1125may/Guide_to_Local_Production.pdf (accessed on 2 October 2018).
  2. Ceresana Inc. Market Study Solvents, 4th ed. 2012, p. 10. Available online: https://www.ceresana.com/en/market-studies/chemicals/solvents/ (accessed on 2 October 2018).
  3. Alt, C. Ullmann’s Encyclopedia of Industrial Chemistry, 1th ed.; Wiley-VCH: New York, NY, USA, 2006; pp. 2345–2351. [Google Scholar]
  4. Onoue, Y.; Mizutani, Y.; Akiyama, S.; Izumi, Y.; Ihara, H. Isopropyl alcohol by direct hydration of propylene. Bull. Jpn. Pet. Inst. 1973, 15, 50–55. [Google Scholar] [CrossRef]
  5. John, E.L.; Loke, R.A. Isopropyl Alcohol. In Kirk-Othmer Encyclopedia of Chemical Technology, 5th ed.; John, E., Logsdon, L.R.A., Eds.; Wiley-VCH: New York, NY, USA, 2000; Volume 6, pp. 98–100. ISBN 9780471238966. [Google Scholar]
  6. Yurieva, T.M.; Plyasova, L.M.; Makarova, O.V.; Krieger, T.A. Mechanisms for hydrogenation of acetone to isopropanol and of carbon oxides to methanol over copper-containing oxide catalysts. J. Mol. Catal. A Chem. 1996, 113, 455–468. [Google Scholar] [CrossRef]
  7. Cyr, A.; Chiltz, F.; Jeanson, P.; Martel, A.; Brossard, L.; Lessard, J.; Ménard, H. Electrocatalytic hydrogenation of lignin models at Raney nickel and palladium-based electrodes. Can. J. Chem. 2000, 78, 307–315. [Google Scholar] [CrossRef]
  8. Bockris, J. Electrochemical Processing. In Comprehensive Treatise of Electrochemistry, 1th ed.; Bockris, J., Brian, E.C., Yeager, E., White, R.E., Eds.; Springer Science & Business Media: New York, NY, USA, 2013; Volume 2, pp. 537–616. ISBN 1468437852. [Google Scholar]
  9. Cirtiu, C.M.; Brisach-Wittmeyer, A.; Ménard, H. Electrocatalysis over Pd catalysts: A very efficient alternative to catalytic hydrogenation of cyclohexanone. J. Catal. 2007, 245, 191–197. [Google Scholar] [CrossRef]
  10. Amouzegar, K.; Savadogo, O. Electrocatalytic hydrogenation of phenol on dispersed Pt: Reaction mechanism and support effect. Electrochim. Acta 1998, 43, 503–508. [Google Scholar] [CrossRef]
  11. St-Pierre, G.; Chagnes, A.; Bouchard, N.-A.; Harvey, P.D.; Brossard, L.; Ménard, H. Rational design of original materials for the electrocatalytic hydrogenation reactions: Concept, preparation, characterization, and theoretical analysis. Langmuir 2004, 20, 6365–6373. [Google Scholar] [CrossRef] [PubMed]
  12. Cirtiu, C.M.; Hassani, H.O.; Bouchard, N.-A.; Rowntree, P.A.; Ménard, H. Modification of the surface adsorption properties of alumina-supported Pd catalysts for the electrocatalytic hydrogenation of phenol. Langmuir 2006, 22, 6414–6421. [Google Scholar] [CrossRef] [PubMed]
  13. Song, Y.; Chia, S.H.; Sanyal, U.; Gutiérrez, O.Y.; Lercher, J.A. Integrated catalytic and electrocatalytic conversion of substituted phenols and diaryl ethers. J. Catal. 2016, 344, 263–272. [Google Scholar] [CrossRef]
  14. Li, Z.; Kelkar, S.; Lam, C.H.; Luczek, K.; Jackson, J.E.; Miller, D.J.; Saffron, C.M. Aqueous electrocatalytic hydrogenation of furfural using a sacrificial anode. Electrochim. Acta 2012, 64, 87–93. [Google Scholar] [CrossRef]
  15. Chu, D.; Hou, Y.; He, J.; Xu, M.; Wang, Y.; Wang, S.; Wang, J.; Zha, L. Nano TiO2 film electrode for electrocatalytic reduction of furfural in ionic liquids. J. Nanopart. Res. 2009, 11, 1805–1809. [Google Scholar] [CrossRef]
  16. Parpot, P.; Bettencourt, A.; Chamoulaud, G.; Kokoh, K.; Belgsir, E. Electrochemical investigations of the oxidation–reduction of furfural in aqueous medium: Application to electrosynthesis. Electrochim. Acta 2004, 49, 397–403. [Google Scholar] [CrossRef]
  17. Chamoulaud, G.; Floner, D.; Moinet, C.; Lamy, C.; Belgsir, E. Biomass conversion II: Simultaneous electrosyntheses of furoic acid and furfuryl alcohol on modified graphite felt electrodes. Electrochim. Acta 2001, 46, 2757–2760. [Google Scholar] [CrossRef]
  18. Green, S.K.; Lee, J.; Kim, H.J.; Tompsett, G.A.; Kim, W.B.; Huber, G.W. The electrocatalytic hydrogenation of furanic compounds in a continuous electrocatalytic membrane reactor. Green Chem. 2013, 15, 1869–1879. [Google Scholar] [CrossRef]
  19. Nilges, P.; Schroder, U. Electrochemistry for biofuel generation: Production of furans by electrocatalytic hydrogenation of furfurals. Energy Environ. Sci. 2013, 6, 2925–2931. [Google Scholar] [CrossRef]
  20. Zhao, B.; Chen, M.; Guo, Q.; Fu, Y. Electrocatalytic hydrogenation of furfural to furfuryl alcohol using platinum supported on activated carbon fibers. Electrochim. Acta 2014, 135, 139–146. [Google Scholar] [CrossRef]
  21. Ilikti, H.; Rekik, N.; Thomalla, M. Electrocatalytic hydrogenation of alkyl-substituted phenols in aqueous solutions at a Raney nickel electrode in the presence of a non-micelle-forming cationic surfactant. J. Appl. Electrochem. 2004, 34, 127–136. [Google Scholar] [CrossRef]
  22. Laplante, F.; Brossard, L.; Ménard, H. Considerations about phenol electrohydrogenation on electrodes made with reticulated vitreous carbon cathode. Can. J. Chem. 2003, 81, 258–264. [Google Scholar] [CrossRef]
  23. Song, Y.; Gutiérrez, O.Y.; Herranz, J.; Lercher, J.A. Aqueous phase electrocatalysis and thermal catalysis for the hydrogenation of phenol at mild conditions. Appl. Catal. B Environ. 2016, 182, 236–246. [Google Scholar] [CrossRef]
  24. Santana, D.S.; Lima, M.V.F.; Daniel, J.R.R.; Navarro, M. Electrocatalytic hydrogenation of organic compounds using current density gradient and sacrificial anode of nickel. Tetrahedron Lett. 2003, 44, 4725–4727. [Google Scholar] [CrossRef]
  25. Singh, N.; Song, Y.; Gutiérrez, O.Y.; Camaioni, D.M.; Campbell, C.T.; Lercher, J.A. Electrocatalytic Hydrogenation of Phenol over Platinum and Rhodium: Unexpected Temperature Effects Resolved. ACS Catal. 2016, 6, 7466–7470. [Google Scholar] [CrossRef]
  26. Tountian, D.; Brisach-Wittmeyer, A.; Nkeng, P.; Poillerat, G.; Ménard, H. Effect of support conductivity of catalytic powder on electrocatalytic hydrogenation of phenol. J. Appl. Electrochem. 2009, 39, 411–419. [Google Scholar] [CrossRef]
  27. Ilikti, H.; Rekik, N.; Thomalla, M. Electrocatalytic hydrogenation of phenol in aqueous solutions at a Raney nickel electrode in the presence of cationic surfactants. J. Appl. Electrochem. 2002, 32, 603–609. [Google Scholar] [CrossRef]
  28. Tsyganok, A.; Holt, C.M.; Murphy, S.; Mitlin, D.; Gray, M.R. Electrocatalytic hydrogenation of aromatic compounds in ionic liquid solutions over WS2-on-glassy carbon and Raney nickel cathodes. Fuel 2012, 93, 415–422. [Google Scholar] [CrossRef]
  29. Sáez, A.; García-García, V.; Solla-Gullón, J.; Aldaz, A.; Montiel, V. Electrocatalytic hydrogenation of acetophenone using a Polymer Electrolyte Membrane Electrochemical Reactor. Electrochim. Acta 2013, 91, 69–74. [Google Scholar] [CrossRef] [Green Version]
  30. Pintauro, P.N.; Gil, M.P.; Warner, K.; List, G.; Neff, W. Electrochemical Hydrogenation of Soybean Oil with Hydrogen Gas. Ind. Eng. Chem. Res. 2005, 44, 6188–6195. [Google Scholar] [CrossRef]
  31. An, W.; Hong, J.K.; Pintauro, P.N.; Warner, K.; Neff, W. The electrochemical hydrogenation of edible oils in a solid polymer electrolyte reactor. II. Hydrogenation selectivity studies. J. Am. Oil Chem. Soc. 1999, 76, 215–222. [Google Scholar] [CrossRef]
  32. An, W.; Hong, J.K.; Pintauro, P.N.; Warner, K.; Neff, W. The electrochemical hydrogenation of edible oils in a solid polymer electrolyte reactor. I. Reactor design and operation. J. Am. Oil Chem. Soc. 1998, 75, 917–925. [Google Scholar] [CrossRef]
  33. Xin, L.; Zhang, Z.; Qi, J.; Chadderdon, D.J.; Qiu, Y.; Warsko, K.M.; Li, W. Electricity Storage in Biofuels: Selective Electrocatalytic Reduction of Levulinic Acid to Valeric Acid or γ-Valerolactone. ChemSusChem 2013, 6, 674–686. [Google Scholar] [CrossRef] [PubMed]
  34. Qiu, Y.; Xin, L.; Chadderdon, D.J.; Qi, J.; Liang, C.; Li, W. Integrated electrocatalytic processing of levulinic acid and formic acid to produce biofuel intermediate valeric acid. Green Chem. 2014, 16, 1305–1315. [Google Scholar] [CrossRef]
  35. Nilges, P.; dos Santos, T.R.; Harnisch, F.; Schroder, U. Electrochemistry for biofuel generation: Electrochemical conversion of levulinic acid to octane. Energy Environ. Sci. 2012, 5, 5231–5235. [Google Scholar] [CrossRef]
  36. Dalavoy, T.S.; Jackson, J.E.; Swain, G.M.; Miller, D.J.; Li, J.; Lipkowski, J. Mild electrocatalytic hydrogenation of lactic acid to lactaldehyde and propylene glycol. J. Catal. 2007, 246, 15–28. [Google Scholar] [CrossRef]
  37. Lai, S.C.; Koper, M.T. Electro-oxidation of ethanol and acetaldehyde on platinum single-crystal electrodes. Faraday Discuss. 2009, 140, 399–416. [Google Scholar] [CrossRef]
  38. Huang, B.; Durante, C.; Isse, A.A.; Gennaro, A. Highly selective electrochemical hydrogenation of acetylene to ethylene at Ag and Cu cathodes. Electrochem. Commun. 2013, 34, 90–93. [Google Scholar] [CrossRef]
  39. Li, Z.; Kelkar, S.; Raycraft, L.; Garedew, M.; Jackson, J.E.; Miller, D.J.; Saffron, C.M. A mild approach for bio-oil stabilization and upgrading: Electrocatalytic hydrogenation using ruthenium supported on activated carbon cloth. Green Chem. 2014, 16, 844–852. [Google Scholar] [CrossRef]
  40. Li, Z.; Garedew, M.; Lam, C.H.; Jackson, J.E.; Miller, D.J.; Saffron, C.M. Mild electrocatalytic hydrogenation and hydrodeoxygenation of bio-oil derived phenolic compounds using ruthenium supported on activated carbon cloth. Green Chem. 2012, 14, 2540–2549. [Google Scholar] [CrossRef]
  41. Kwon, Y.; Koper, M. Electrocatalytic hydrogenation and deoxygenation of glucose on solid metal electrodes. ChemSusChem 2013, 6, 455–462. [Google Scholar] [CrossRef] [PubMed]
  42. Lam, C.H.; Lowe, C.B.; Li, Z.; Longe, K.N.; Rayburn, J.T.; Caldwell, M.A.; Houdek, C.E.; Maguire, J.B.; Saffron, C.M.; Miller, D.J. Electrocatalytic upgrading of model lignin monomers with earth abundant metal electrodes. Green Chem. 2015, 17, 601–609. [Google Scholar] [CrossRef]
  43. Moutet, J.-C. Electrocatalytic hydrogenation on hydrogen-active electrodes. A review. Org. Prep. Proced. Int. 1992, 24, 309–325. [Google Scholar] [CrossRef]
  44. Mahdavi, B.; Chapuzet, J.M.; Lessard, J. The electrocatalytic hydrogenation of phenanthrene at Raney nickel electrodes: The effect of periodic current control. Electrochim. Acta 1993, 38, 1377–1380. [Google Scholar] [CrossRef]
  45. Lipkowski, J.; Ross, P.N. Electrocatalysis, 1th ed.; John Wiley&Sons: New York, NY, USA, 1998; pp. 75–290. ISBN 0471246735. [Google Scholar]
  46. Robin, D.; Comtois, M.; Martel, A.; Lemieux, R.; Cheong, A.K.; Belot, G.; Lessard, J. The electrocatalytic hydrogenation of fused poly cyclic aromatic compounds at Raney nickel electrodes: The influence of catalyst activation and electrolysis conditions. Can. J. Chem. 1990, 68, 1218–1227. [Google Scholar] [CrossRef]
  47. Garraín, D.; Lechón, Y.; de la Rúa, C. Polymer electrolyte membrane fuel cells (PEMFC) in automotive applications: Environmental relevance of the manufacturing stage. Smart Grid Renew. Energy 2011, 2, 68. [Google Scholar] [CrossRef]
  48. Montiel, V.; Sáez, A.; Expósito, E.; García-García, V.; Aldaz, A. Use of MEA technology in the synthesis of pharmaceutical compounds: The electrosynthesis of N-acetyl-l-cysteine. Electrochem. Commun. 2010, 12, 118–121. [Google Scholar] [CrossRef]
  49. Wang, Y.; Chen, K.S.; Mishler, J.; Cho, S.C.; Adroher, X.C. A review of polymer electrolyte membrane fuel cells: Technology, applications, and needs on fundamental research. Appl. Energy 2011, 88, 981–1007. [Google Scholar] [CrossRef]
  50. Zhang, X.; Pasaogullari, U.; Molter, T. Influence of ammonia on membrane-electrode assemblies in polymer electrolyte fuel cells. Int. J. Hydrogen Energy 2009, 34, 9188–9194. [Google Scholar] [CrossRef]
  51. Florida Solar Energy Center, Test Protocol for Cell Performance Tests Performed Under DOE. 2009; pp. 19–20. Available online: https://www.energy.gov/sites/prod/files/2014/03/f10/htmwg_may09_pem_single_cell_testing.pdf (accessed on 8 October 2018).
  52. Green, S.K.; Tompsett, G.A.; Kim, H.J.; Kim, W.B.; Huber, G.W. Electrocatalytic Reduction of Acetone in a Proton-Exchange-Membrane Reactor: A Model Reaction for the Electrocatalytic Reduction of Biomass. ChemSusChem 2012, 5, 2410–2420. [Google Scholar] [CrossRef] [PubMed]
  53. Dadda, B.; Abboudi, S.; Zarrit, R.; Ghezal, A. Heat and mass transfer influence on potential variation in a PEMFC membrane. Int. J. Hydrogen Energy 2014, 39, 15238–15245. [Google Scholar] [CrossRef]
  54. Zong, Y.; Zhou, B.; Sobiesiak, A. Water and thermal management in a single PEM fuel cell with non-uniform stack temperature. J. Power Sources 2006, 161, 143–159. [Google Scholar] [CrossRef]
  55. Berg, L. Separation of Acetone from Isopropanol-Water Mixtures by Extractive Distillation. US 5897750, 1999. Available online: https://patents.justia.com/patent/5897750 (accessed on 8 October 2018).
  56. Jian, Q.; Ma, G.; Qiu, X. Influences of gas relative humidity on the temperature of membrane in PEMFC with interdigitated flow field. Renew. Energy 2014, 62, 129–136. [Google Scholar] [CrossRef]
  57. Anantaraman, A.; Gardner, C. Studies on ion-exchange membranes. Part 1. Effect of humidity on the conductivity of Nafion®. J. Electroanal. Chem. 1996, 414, 115–120. [Google Scholar] [CrossRef]
  58. Sumner, J.; Creager, S.; Ma, J.; DesMarteau, D. Proton conductivity in Nafion® 117 and in a novel bis [(perfluoroalkyl) sulfonyl] imide ionomer membrane. J. Electrochem. Soc. 1998, 145, 107–110. [Google Scholar] [CrossRef]
  59. Sone, Y.; Ekdunge, P.; Simonsson, D. Proton conductivity of Nafion 117 as measured by a four-electrode AC impedance method. J. Electrochem. Soc. 1996, 143, 1254–1259. [Google Scholar] [CrossRef]
  60. Yuan, W.; Tang, Y.; Pan, M.; Li, Z.; Tang, B. Model prediction of effects of operating parameters on proton exchange membrane fuel cell performance. Renew. Energy 2010, 35, 656–666. [Google Scholar] [CrossRef]
  61. Wong, K.; Loo, K.; Lai, Y.; Tan, S.-C.; Chi, K.T. A theoretical study of inlet relative humidity control in PEM fuel cell. Int. J. Hydrogen Energy 2011, 36, 11871–11885. [Google Scholar] [CrossRef]
  62. Lee, C.-I.; Chu, H.-S. Effects of cathode humidification on the gas–liquid interface location in a PEM fuel cell. J. Power Sources 2006, 161, 949–956. [Google Scholar] [CrossRef]
  63. Guvelioglu, G.H.; Stenger, H.G. Flow rate and humidification effects on a PEM fuel cell performance and operation. J. Power Sources 2007, 163, 882–891. [Google Scholar] [CrossRef]
  64. Zhang, J.; Tang, Y.; Song, C.; Xia, Z.; Li, H.; Wang, H.; Zhang, J. PEM fuel cell relative humidity (RH) and its effect on performance at high temperatures. Electrochim. Acta 2008, 53, 5315–5321. [Google Scholar] [CrossRef]
  65. Jeon, D.H.; Kim, K.N.; Baek, S.M.; Nam, J.H. The effect of relative humidity of the cathode on the performance and the uniformity of PEM fuel cells. Int. J. Hydrogen Energy 2011, 36, 12499–12511. [Google Scholar] [CrossRef]
  66. Ikeda, T.; Koido, T.; Tsushima, S.; Hirai, S. MRI investigation of water transport mechanism in a membrane under elevated temperature condition with relative humidity and current density variation. ECS Trans. 2008, 16, 1035–1040. [Google Scholar]
  67. Misran, E.; Hassan, N.S.M.; Daud, W.R.W.; Majlan, E.H.; Rosli, M.I. Water transport characteristics of a PEM fuel cell at various operating pressures and temperatures. Int. J. Hydrogen Energy 2013, 38, 9401–9408. [Google Scholar] [CrossRef]
  68. Knights, S.D.; Colbow, K.M.; St-Pierre, J.; Wilkinson, D.P. Aging mechanisms and lifetime of PEFC and DMFC. J. Power Sources 2004, 127, 127–134. [Google Scholar] [CrossRef]
  69. Abe, T.; Shima, H.; Watanabe, K.; Ito, Y. Study of PEFCs by AC Impedance, Current Interrupt, and Dew Point Measurements I. Effect of Humidity in Oxygen Gas. J. Electrochem. Soc. 2004, 151, A101–A105. [Google Scholar] [CrossRef]
  70. Saleh, M.M.; Okajima, T.; Hayase, M.; Kitamura, F.; Ohsaka, T. Exploring the effects of symmetrical and asymmetrical relative humidity on the performance of H2/air PEM fuel cell at different temperatures. J. Power Sources 2007, 164, 503–509. [Google Scholar] [CrossRef]
  71. Xu, H.; Song, Y.; Kunz, H.R.; Fenton, J.M. Effect of elevated temperature and reduced relative humidity on ORR kinetics for PEM fuel cells. J. Electrochem. Soc. 2005, 152, A1828–A1836. [Google Scholar] [CrossRef]
  72. Uribe, F.A.; Springer, T.E.; Gottesfeld, S. A microelectrode study of oxygen reduction at the platinum/recast—Nafion film interface. J. Electrochem. Soc. 1992, 139, 765–773. [Google Scholar] [CrossRef]
  73. Jang, J.-H.; Yan, W.-M.; Li, H.-Y.; Chou, Y.-C. Humidity of reactant fuel on the cell performance of PEM fuel cell with baffle-blocked flow field designs. J. Power Sources 2006, 159, 468–477. [Google Scholar] [CrossRef]
  74. Broka, K.; Ekdunge, P. Oxygen and hydrogen permeation properties and water uptake of Nafion® 117 membrane and recast film for PEM fuel cell. J. Appl. Electrochem. 1997, 27, 117–123. [Google Scholar] [CrossRef]
  75. Murillo, L.E.; Chen, J.G. Adsorption and reaction of propanal, 2-propenol and 1-propanol on Ni/Pt (111) bimetallic surfaces. Surf. Sci. 2008, 602, 2412–2420. [Google Scholar] [CrossRef]
  76. Takalloo, P.K.; Nia, E.S.; Ghazikhani, M. Numerical and experimental investigation on effects of inlet humidity and fuel flow rate and oxidant on the performance on polymer fuel cell. Energy Convers. Manag. 2016, 114, 290–302. [Google Scholar] [CrossRef]
  77. Jiang, R.; Kunz, H.R.; Fenton, J.M. Investigation of membrane property and fuel cell behavior with sulfonated poly(ether ether ketone) electrolyte: Temperature and relative humidity effects. J. Power Sources 2005, 150, 120–128. [Google Scholar] [CrossRef]
  78. Xu, H.; Kunz, H.R.; Fenton, J.M. Analysis of proton exchange membrane fuel cell polarization losses at elevated temperature 120 °C and reduced relative humidity. Electrochim. Acta 2007, 52, 3525–3533. [Google Scholar] [CrossRef]
  79. Jiang, R.; Kunz, H.R.; Fenton, J.M. Influence of temperature and relative humidity on performance and CO tolerance of PEM fuel cells with Nafion®–Teflon®–Zr (HPO4) 2 higher temperature composite membranes. Electrochim. Acta 2006, 51, 5596–5605. [Google Scholar] [CrossRef]
  80. Wang, X.; Baker, P.; Zhang, X.; Garces, H.F.; Bonville, L.J.; Pasaogullari, U.; Molter, T.M. An experimental overview of the effects of hydrogen impurities on polymer electrolyte membrane fuel cell performance. Int. J. Hydrogen Energy 2014, 39, 19701–19713. [Google Scholar] [CrossRef]
  81. Cheng, X.; Shi, Z.; Glass, N.; Zhang, L.; Zhang, J.; Song, D.; Liu, Z.-S.; Wang, H.; Shen, J. A review of PEM hydrogen fuel cell contamination: Impacts, mechanisms, and mitigation. J. Power Sources 2007, 165, 739–756. [Google Scholar] [CrossRef]
  82. Benziger, J.; Nehlsen, J. A polymer electrolyte hydrogen pump hydrogenation reactor. Ind. Eng. Chem. Res. 2010, 49, 11052–11060. [Google Scholar] [CrossRef]
  83. Lundin, M.D.; McCready, M.J. High pressure anode operation of direct methanol fuel cells for carbon dioxide management. J. Power Sources 2011, 196, 5583–5590. [Google Scholar] [CrossRef]
  84. Scholta, J.; Berg, N.; Wilde, P.; Jörissen, L.; Garche, J. Development and performance of a 10 kW PEMFC stack. J. Power Sources 2004, 127, 206–212. [Google Scholar] [CrossRef]
  85. Cleghorn, S.; Mayfield, D.; Moore, D.; Moore, J.; Rusch, G.; Sherman, T.; Sisofo, N.; Beuscher, U. A polymer electrolyte fuel cell life test: 3 years of continuous operation. J. Power Sources 2006, 158, 446–454. [Google Scholar] [CrossRef]
  86. St-Pierre, J.; Wilkinsor, D.; Knights, S.; Bos, M. Relationships between water management, contamination and lifetime degradation in PEFC. J. New Mater. Electrochem. Syst. 2000, 3, 99–106. [Google Scholar]
  87. Satyapal, S. Hydrogen & Fuel Cells Program Overview. In Proceedings of the Annual Merit Review and Peer Evaluation Meeting, Arlington, VA, USA, 7–11 June 2011. [Google Scholar]
  88. Wipke, K.; Sprik, S.; Kurtz, J.; Ramsden, T.; Ainscough, C.; Saur, G. VII. 1 Controlled Hydrogen Fleet and Infrastructure Analysis. In Proceedings of the DOE Annual Merit Review and Peer Evaluation Meeting, Washington, DC, USA, 13–17 May 2012. [Google Scholar]
  89. Wu, J.; Yuan, X.Z.; Martin, J.J.; Wang, H.; Zhang, J.; Shen, J.; Wu, S.; Merida, W. A review of PEM fuel cell durability: Degradation mechanisms and mitigation strategies. J. Power Sources 2008, 184, 104–119. [Google Scholar] [CrossRef]
  90. Ferreira, P.; Shao-Horn, Y.; Morgan, D.; Makharia, R.; Kocha, S.; Gasteiger, H. Instability of Pt/C electrocatalysts in proton exchange membrane fuel cells a mechanistic investigation. J. Electrochem. Soc. 2005, 152, A2256–A2271. [Google Scholar] [CrossRef]
  91. Xie, J.; Wood, D.L.; More, K.L.; Atanassov, P.; Borup, R.L. Microstructural changes of membrane electrode assemblies during PEFC durability testing at high humidity conditions. J. Electrochem. Soc. 2005, 152, A1011–A1020. [Google Scholar] [CrossRef]
  92. Antolini, E. Formation, microstructural characteristics and stability of carbon supported platinum catalysts for low temperature fuel cells. J. Mater. Sci. 2003, 38, 2995–3005. [Google Scholar] [CrossRef]
  93. Murugan, A.; Brown, A.S. Review of purity analysis methods for performing quality assurance of fuel cell hydrogen. Int. J. Hydrogen Energy 2015, 40, 4219–4233. [Google Scholar] [CrossRef]
  94. St-Pierre, J.; Angelo, M.; Zhai, Y. Focusing research by developing performance related selection criteria for PEMFC contaminants. ECS Trans. 2011, 41, 279–286. [Google Scholar]
  95. St-Pierre, J.; Zhai, Y.; Angelo, M.S. Effect of selected airborne contaminants on PEMFC performance. J. Electrochem. Soc. 2014, 161, F280–F290. [Google Scholar] [CrossRef]
  96. Fukuzumi, S.; Lee, Y.M.; Nam, W. Mechanisms of two-electron versus four-electron reduction of dioxygen catalyzed by earth—Abundant metal complexes. ChemCatChem 2018, 10, 9–28. [Google Scholar] [CrossRef]
  97. Chen, Y.; Hwang, C.; Liaw, C. One-step synthesis of methyl isobutyl ketone from acetone with calcined Mg/Al hydrotalcite-supported palladium or nickel catalysts. Appl. Catal. A Gen. 1998, 169, 207–214. [Google Scholar] [CrossRef]
  98. Nikolopoulos, A.; Jang, B.-L.; Spivey, J. Acetone condensation and selective hydrogenation to MIBK on Pd and Pt hydrotalcite-derived MgAl mixed oxide catalysts. Appl. Catal. A Gen. 2005, 296, 128–136. [Google Scholar] [CrossRef]
Figure 1. Schematic diagram of the experimental setup.
Energies 11 02691 g001
Figure 2. Flowchart of the experiment.
Energies 11 02691 g002
Figure 3. Isopropanol yield (percentage) change as a result of: (a) RH; and (b) temperature. H2 and acetone flow rates were 0.25 L/min and 6 mL/h, respectively. (a) The ECH experiments were conducted five times at 65 °C. Each ECH experiment was repeated twice. (b) The ECH experiments were conducted four times at 80% RH.
Energies 11 02691 g003
Figure 4. H2 Utilization, Current Efficiency, and Total efficiency calculated at different: (a) temperatures; and (b) RH. H2 and acetone flow rates were 0.25 L/min and 6 mL/h, respectively. (a) The ECH experiments were conducted five times at 80% RH; (b) The ECH experiments were conducted five times at 65 °C. Each ECH experiment was repeated twice.
Energies 11 02691 g004
Figure 5. V-I scans performed during three sets of ECH experiments: (a) The ECH experiments were conducted five times at 65 °C and 80% RH; (b) the ECH experiments were conducted four times at 65 °C but different RH (65%, 65%, 50% and 50%, respectively); (c) the ECH experiments were conducted five times at 80% RH but different temperatures (80 °C, 73 °C, 57 °C, and 50 °C, respectively). The black curves are the baseline data recorded for the fresh MEAs prior to ECH tests. After each test, pure N2 was purged for at least 10 h to remove all the temporary contaminants.
Energies 11 02691 g005
Figure 6. H2 Utilization, Current Efficiency and Total efficiency as a function of ECH experiment times. The ECH experiments were conducted four times at 65 °C and 80% RH. H2 and acetone flow rates were 0.25 L/min and 6 mL/h, respectively. After each test, pure N2 was purged for at least 10 h to remove all the temporary contaminants. Each ECH experiment was repeated twice.
Energies 11 02691 g006

