Article

Recursive Method for Distribution System Reliability Evaluation

1
College of Mechatronics and Control Engineering, Shenzhen University, Nanshan District, Shenzhen 518060, China
2
Department of Electrical Engineering, The Hong Kong Polytechnic University, Hong Kong, China
3
Maintenance & Test Center, CSG EHV Power Transmission Company, Guangzhou 518026, China
4
College of Optoelectronic Engineering, Shenzhen University, Nanshan District, Shenzhen 518060, China
*
Author to whom correspondence should be addressed.
Energies 2018, 11(10), 2681; https://doi.org/10.3390/en11102681
Submission received: 5 September 2018 / Revised: 18 September 2018 / Accepted: 25 September 2018 / Published: 9 October 2018
(This article belongs to the Section F: Electrical Engineering)

Abstract

:
This paper proposes a novel hybrid recursive method for distribution system reliability evaluation to deal with the computational limit and low-efficiency problem which exist in previously developed techniques as the system becomes larger. This method includes a bottom-up process and a top-down process, which are developed on the basis of a recursive principle, and the synthesis of both processes yield the reliability performance of each bus of the system. The bottom-up process considers the effects of downstream failures on upstream customers, and the top-down process considers the effects of upstream failures on downstream customers. In addition, a novel switch zone concept is defined and introduced into the bottom-up recursive process to save the computation cost. Besides, section technique (ST) and shortest path method (SPM) are employed to effectively simplify the recursive path and thus, the computation efficiency can be improved. The most significant feature of the proposed method over ST, SPM, failure mode and effect analysis (FMEA) is that it provides a more generalized equivalent approach to maximally simplify the network for reliable evaluation irrespective of the network topology. The effectiveness of the proposed method has been validated through comprehensive tests on Roy Billinton test system (RBTS) bus 6 and a practical-sized distribution system in China.

1. Introduction

Reliability evaluation is one of the essential functions required in the planning and operating stage of energy systems [1,2,3]. So far, considerable methodologies, such as Monte Carlo simulation (MCS), minimal cut set approach, and FMEA have evolved over the past 50 years to develop various reliability techniques [4,5,6,7]. However, those methodologies usually involve iterative computations, and hence are time-consuming and hard to be implemented in high-level analyses, such as risk analysis and sensitivity analysis [8]. Therefore, section technique (ST) [9,10], reliability network equivalent approach (RNEA) [11,12], shortest path method (SPM) [13] and zone-branch method [14], have been proposed to reduce the calculation complexity for reliability evaluation. Nevertheless, those methods are generally based on a sub-feeder equivalent approach, where, depending on the original topology, the network may not maximally be simplified. In other words, the equivalent path of those methods mainly depends on the network topology and, consequently, the computation cost involved in the subsequent reliability assessment is limited, which is the main drawback of those methods. Furthermore, these methods may fail to provide or even lose the reliability performance of some critical buses in the system, and thus cannot offer sufficient information required for system expansion and reinforcement [15].
It is clear that when a failure happens, the interruption effects spread over the entire network step by step since the elements in the system are closely connected with each other [16]. In other words, considering a certain element, the effect of all its downstream failures on any upstream load point (LP), as well as the effect of its upstream failures on downstream LP, will more or less depend on the operation state of the element. As comprehensively analyzed in this paper, those effects can be determined accurately using the recursive principles of reliability information for interlinked elements and adjacent buses. Accordingly, a novel recursive method for distribution system reliability evaluation is proposed in this paper as to improve the algorithm efficiency and to retain the calculation accuracy. It should be noted that several recursive algorithms have been developed in the literatures as existing reliability solutions [17,18,19,20]. However, they cannot be directly implemented in real distribution system because of the differences between power distribution systems and generalized series-parallel multi-state systems [18]. The differences can be mainly summarized as: (1) The power flow direction should be considered in distribution system reliability evaluation; (2) the effect of alternative supplies (AS) on reliability performance should also be considered in power systems; (3) the network of distribution system is more complex because of the hand-in-hand loop structure. Therefore, this work is further devoted to investigate the recursive principles that power networks exhibit and a recursive algorithm that can improve reliability evaluation efficiency. The main contributions of this paper include:
  • Comprehensive analysis on the bottom-up and top-down recursive principles of reliability performance for interconnected elements and adjacent buses.
  • The development of an novel hybrid recursive method for distribution system reliability evaluation based on the analyzed recursive principles.
  • The definition of switch zone concept, which has been introduced in the proposed method for efficiency improvement.
The proposed recursive method has been thoroughly tested and benchmarked on RBTS bus 6 and a practical-sized distribution system under various operational scenarios.

2. General Model for Distribution System

2.1. General Data Structure for Basic Elements

The basic element in the distribution system is a tie connecting any two adjacent buses. A tie may be a transformer, a piece of line, or protective device. Generally, the reliability performance of line and transformer can be statistically described as two independent indices, including failure rate and outage duration. In addition, the performance of protective devices can be represented as operation probability and (replacing) time. Therefore, all the basic elements in the distribution system can be summarized as a general data structure [21], as follows,
e = { i , j , a , λ , p , t }
where e denotes a certain element whose parent bus and offspring bus are represented as i and j; a denotes the type of the element; λ and r are the failure rate and outage duration; p is the probability of the element operating unsuccessfully; t is the repair time or replacing time for non-switch devices or operation time for the switch device.

2.2. Section of a Branch

A distribution system can be decomposed into several independent sections by protective devices. In any section, the protective devices that should be acted and the out-of-service duration for all LPs are irrespective of where the failure happens in this section. Therefore, the whole section, termed as section of a branch, can be treated as an equivalent unit to reduce the computation events for reliability evaluation. The reliability performances of an equivalent section can be determined as,
λ s = k = 1 N s λ k
r s = k = 1 N s λ k r k / λ s
where λs and rs denote the equivalent failure rate and outage duration for one section, respectively; Ns is the total number of elements;
The determination of equivalent sections involves the following steps: (1) Select one non-marked element randomly in the distribution system; (2) choose one feasible search direction and examine the successive elements along the selected direction as to identify the type of the elements until a protective device is encountered or it ends with the terminal of a feeder; (3) the search procedure terminates if all existing directions have been checked once, and then the area surrounded by the protective devices forms one equivalent section; (4) go to step (1) until all elements in distribution system are marked.

2.3. General Model for Distribution System

Using the general data structure and equivalent sections, a distribution system can be represented as a simplified tree data structure in which the components are related to each other through parent and offspring relationships [22,23]. One such equivalent process for a small-scale distribution system is illustrated in Figure 1. It is shown that the components in the simplified lower subfigure consist of equivalent sections and protective devices since all the section of branches in the upper subfigure are replaced with corresponding independent components in the lower subfigure.
Generally, there is a breaker between the main supply and the distribution system. The breaker is used to isolate the outages occurring in the distribution system from the rest of the power utility. Assuming the protective devices are perfectly coordinated, then all the components, in which a permanent fault occurred only results in the main breaker recognizing and isolating the fault, are categorized as 1st level components. Accordingly, 2nd level components are those ones in which when a fault occurs, will result in the protective devices that are connected to 1st level components recognizing and triggering. Therefore, any component in the distribution system can always be hierarchically classified as one of the nth level components, where n represents the number of protective devices between the main supply and the components. Take the lower subfigure in Figure 1 as an example, the 1st level components contain breaker B1 and line 1–2, the 2nd level contain switch S1, fuses 2–3 and 2–5, and equivalent sections 3–4, 5–6 and 7–8, and so on.
It can be found that when a fault occurred, both of its upstream LPs and downstream LPs will be affected to some degree conditionally. The degree relies on the operations state of the involving protective devices and AS [24,25]. In other words, considering a particular component, the effect of its downstream failures on its upstream LPs will more or less depend on its own operation state. As analyzed in the following Section 3 and Section 4, this kind of effect can be recursively determined using bottom-up recursive principles. Similarly, the effect of its upstream failures on downstream LPs can be determined using top-down recursive principles. Synthesizing both of the effects yields the reliability performances for any bus and LP.
In addition, the concept and formation of the proposed recursive algorithm are based upon the following assumptions,
(1)
All faults are permanent.
(2)
Overlapping failures are not considered in this paper because those effects are negligible in practical power system.
The protective devices are perfectly coordinated, i.e., the protective device closest to the fault needs to operate first.

3. Recursive Principles

3.1. Bottom-Up Recursive Principle

Generally, the protective devices used in distribution systems can be classified into two categories: The ones with an instantaneous response and the ones with a delayed response [26,27]. The former can isolate downstream failures immediately subject to an operation probability, and the latter includes switches, and can be used to reduce the restoration time when required. Considering a general case, two components are arranged as shown in Figure 2 where the arrow indicates the direction of power flow. eT denotes the failure component and both of the terminals for eS, i.e., i and j, will be affected. Therefore, the interruption effect of eT on bus i can be determined using the effect of eT on bus j, described as follows,
Condition A: eS is a breaker, fuse, relay or other protective device with instantaneous response.
Condition B: eS is the closest upstream switch to the failure eT, which is used to isolate the fault from upstream LPs.
λ b u i T = { λ b u j T   Condition   A   not   satisfied λ b u j T p S   Condition   A   satisfied
r b u i T = { r b u j T    Condition   B   not   satisfied min ( r b u j T , t S )   Condition   B   satisfied
where λbujT, rbujT are bottom-up interruption effect from eT to bus j of eS; Similarly, λbuiT, rbuiT are that from eT to bus i of eS; ts is the switching time of eS.
In summary, the interruption effect of eT on bus i can be recursively determined using the effect of eT on bus j. Specifically, if condition A is satisfied, then the equivalent failure rate of eT on bus i equals to the product of pS and λbujT. It can be easily concluded that the service of upstream LPs will not be interrupted by downstream failures when eS functions perfectly. Otherwise, the failure rate stays unchanged. If condition B is satisfied, the outage duration of eT on bus i selects the minimal of tS, and rbujT. This is because switch eS is responsible for acting to restore the service of upstream LPs. Otherwise, the duration remains the same. In addition, it can be summarized that the bottom-up recursive principles are irrespective of the location and the type of the failure component eT.

3.2. Top-Down Recursive Principle

It is clear that when a failure happens, the services of the entire downstream LPs will undoubtedly be interrupted, and part of that needs to be restored through AS. This is usually the case in the modern distribution system in which feeders are in the form of hand-in-hand loop. Top-down recursive principle is to address the interruption effect of upstream failures on downstream LPs. Similarly, consider a general case as shown in Figure 3, where eS and eT have the same meaning with Figure 2. Therefore, the interruption effect of eT on bus i can be determined using the effect of eT on bus j, described as follows,
Condition C: No AS exists on eT’s downstream area or no switching device sits between eT and eS.
Condition D: At least one switching device exists between eT and eS, and meanwhile at least one AS exists on the downstream area of the closest downstream switch to eT.
λ t d j T = λ t d i T
r t d j T = { r t d i T           Condition   C   satisfied min ( r t d i T , max ( t o , t AS ) )   Condition   D   satisfied  
where λtdjT and rtdjT denote the top-down equivalent effect from eT on bus j of eS, and λtdiT and rtdiT denote the effect from eT on bus i of eS; tAS is the switching time of an AS and to is the operation time of the responsible isolating switch.
To summarize, the interruption effect of eT on bus j can also be recursively determined using the effect of eT on bus i. Specifically, the equivalent failure rate of eT on bus j equals that of eT on bus i, and the equivalent outage duration depends on the location of switching devices and available AS. If condition C is satisfied, the outage duration of eT on bus j equals the repair time of eT. If condition D is satisfied, the duration chooses the minimum of the accessing time of corresponding AS and rbuiT.

4. The Proposed Recursive Algorithm

The proposed recursive algorithm consists of bottom-up and top-down recursive processes. The former considers the effect of downstream interruptions on upstream buses within a network, while the latter considers the impact of upstream interruptions on downstream buses. The synthesis of both procedures can generate the reliability indices of any bus and LP.

4.1. Bottom-Up Recursive Process

According to the bottom-up recursive principle, the interruption effect of one failure on its upstream buses differs with the type of the recursive component eS, that is whether eS is a switching device or not.
Definition 1: The zone surrounded by switches is defined as a switch zone, each of which contains only one upstream switch and several downstream switches, as shown in Figure 1. It should be stressed that the switch zone is distinguished from the section of a branch because of different definitions and objectives. The switch zone is classified based on switching devices and is used to simplify the recursive process and thus to offer facilities for recursive process. While the section of a branch is classified based on protective devices in any form and is employed to reduce the basic components, thereby simplifying the distribution system [28].
(1) eS denotes a switching device: In this case, eS is the upstream switch of a certain switch zone, denoted as Ω. Hence, when a fault occurs in Ω, the service of upstream LPs can be restored through opening eS. That means the outage duration for upstream LPs is not more than the operation time of eS. And then, according to (4)–(5), the bottom-up recursive process from eS’s bus j to its bus i can be summarized as follows,
λ b u i S = λ b u i S + λ b u j S + λ b u j Ω
r b u i S = ( λ b u i S r b u i S + λ b u j S r b u j S + min ( r b u j Ω , t S ) λ b u j Ω ) / λ b u i S
where λbujΩ and rbujΩ denote the aggregated interruption effects of downstream failures in Ω on bus j, and those effects can be mitigated via opening eS. While λbujS and rbujS denote the interruptions of failures occurring in other downstream areas on bus j, indicating that these interruptions cannot be mitigated by opening eS. Other symbols involving subscript i have similar meanings.
(2) eS denotes a non-switching device: In this case, bus i and bus j are in the same switch zone, and thus the bottom-up recursive process from eS’s bus j to bus i can be summarized as,
λ b u i S = λ b u i S + λ b u j S p S
r b u i S = ( λ b u i S r b u i S + λ b u j S r b u j S p S ) / λ b u i S
λ b u i Ω = λ b u i Ω + λ b u j Ω p S
r b u i Ω = ( λ b u i Ω r b u i Ω + λ b u j Ω r b u j Ω p S ) / λ b u i Ω
where pS is the operation probability for eS, and adopts 1 for any equivalent component.
In order to maximally improve the calculation efficiency, the reliability performance of buses at lthe owest-level should be determined as a priority, and then the performance of buses at higher-level can be calculated recursively. In other words, the calculation events on the higher-level can only be achieved as long as all components on the current level have been computed once.

4.2. Top-Down Recursive Process

Definition 2: The network whose components are on the shortest path from the main supply to any AS is referred to as the main network and the rest of the independent sections are referred to as lateral networks [29].
As presented in Section 3.2, the top-down recursive principle differs with the location of ASs and switching devices. Consequently, two general cases are considered in this paper: The current recursive component eS is on the main network or not. This is because the service to the downstream subarea of eS can be restored via closing one available AS if eS sits on the main network, otherwise the service cannot be restored [30].
(1) eS on Main Network: As shown in Figure 3, assuming eT and eS are two longitudinally connected switches on the main network, then the recursive rules from bus b of eT to bus j of eS can be described as follows,
λ t d j Ω = λ b u b Ω λ b u i Ω
r t d j Ω = min { max ( t S , min ( t A S 1 , t A S 1 ) ) ( λ b u b Ω r b u b Ω λ b u i Ω r b u i Ω ) / λ t d j Ω
λ t d j S = λ t d b + λ b u b S λ b u i S
r t d j S = ( λ t d b r t d b + λ b u b S r b u b S λ b u i S r b u i S / λ t d j S )
λ t d j = λ t d j S + λ t d j Ω
r t d j = ( λ t d j S r t d j S + λ t d j Ω r t d j Ω ) / λ t d j
where tAS1 and tAS2 represent the operation time of available AS1, AS2, respectively, and the one with minimal time should be chosen to restore the service, and thus to minimize the outage duration; λtdj and rtdj are the synthesized interruption effects of eS’s upstream failures; λtdjΩ and rtdjΩ are synthesized effects of failures happened in Ω (here, it is the switch zone between eS and eT) on bus j, and λtdjS and rtdjS denote the effect of failures in eT’s upstream areas on bus j.
If a fault occurs in Ω, the service to downstream LPs can be restored by opening eS, and thereby the top-down outage duration is not more than the accessing time of available AS, as presented in (15). Otherwise, eS should not be involved in the restoration process.
(2) eS on Lateral Network: In this case, the top-down equivalent failure rate stays the same with the case of the main network since service restoration cannot avoid outage. In addition, when a failure happens in Ω, its downstream LPs cannot be restored until the fault has been cleared since no AS exists on lateral networks, and thus the top-down equivalent duration can be described as follows,
r t d j Ω = ( λ b u b Ω r b u b Ω λ b u i Ω r b u i Ω ) / λ t d j Ω
It can be easily observed that only the switching devices are selected to go through the top-down recursive process. This is designed to maximally simplify the recursive path and thus the efficiency can be improved. The top-down recursive process begins with any switch at the highest-level, and terminates when all switches have been recursively calculated once. Similarly, in this process, the breadth-first search method is also employed to guarantee the high efficiency.
Note that only the top-down reliability performances of both terminals of the switch have been computed in the top-down recursive process. Thereby, the reliability performance of other buses can be determined using top-down recursive principles.

4.3. The Synthesis of Two Recursive Process

The service interruptions for any bus and LP can be attributed to failures in its upstream or downstream networks. Based on the recursive principles presented above, considering any LP, the reliability performance can be determined by synthesizing its bottom-up recursive process and the top-down recursive process, described as,
λ k = λ b u k Ω + λ b u k S + λ t d k
r k = ( λ b u k Ω r b u k Ω + λ b u k S r b u k S + λ t d k r t d k ) / λ k
where λtdk and rtdk denote the interruptions caused by failures on load point k’s upstream area; λbukΩ and rbukΩ denote interruptions caused by faults occurred in downstream Ω; and λbukS and rbukS denote the interruptions that happened on other downstream areas.

4.4. Procedures

In summary, the main execution steps for reliability evaluation using the proposed recursive method can be illustrated as a flowchart in Figure 4. Initialization block is to initialize the variables required in both recursive processes. In the bottom-up recursive process, set variables λbujS, rbujS, λbuiS, rbuiS to zero, and λbujΩ and rbujΩ to the reliability indices of the component whose offspring node is j. In the top-down recursive process, λtdjS and rtdjS at the highest-level are determined based on top-down recursive principles.

5. System Studies

The performance of the proposed recursive method has been fully evaluated through the following two case studies. The two test systems are the commonly used RBTS-BUS6 [31] and a practical industrial distribution system in Henan province, China [32].

5.1. RBTS-BUS6

As a typical mixed rural/urban distribution network with residential, commercial and agricultural customers, RBTS-BUS6 consists of 4 feeders, 40 load points, 82 lines, 40 fuses and 28 transformers, 9 breakers and 17 disconnect switches [31]. Normally, the tie-switch connecting feeder 1 and feeder 2 is assumed to be opened and other switches are set to be closed. The peak load and average load of this system are 20 MW and 10.72 WM, respectively. The reliability parameters for protective devices are given in Table 1, other system parameters and the network topology are referred to in Reference [31].
In order to comprehensively explore the benefits of the proposed method, three different cases have been considered:
  • Case 1: The operation time of all tie-switches is set to 1.5 h and that of other disconnect switches is set to 1 h. In addition, the fuses, breakers and relays are assumed to be 100% reliable, i.e., they belongs to ideal protective devices;
  • Case 2: All the fuses, breakers and relays are assumed to be 90% reliable and other conditions are set as the same with case 1;
  • Case 3: An AS has been installed at the terminal of feeder 4, and other conditions are set as the same with case 2.
Based on the reliability parameters presented in Table 1, the reliability performance of all LPs can be calculated using the proposed recursive method. The results are partly listed in Table 2. The experiment reveals that the results obtained from the proposed recursive method are completely consistent with the results obtained from FMEA/RNEA/ST/SPM in all three cases. Thus, it can be readily conferred that the system reliability performances obtained from the proposed method are also consistent with the system performance obtained from FMEA, RNEA, ST and SPM, which demonstrates the computation accuracy of the proposed method.
In addition, the results in Table 2 also demonstrate that the operation state of protective devices can more or less affect the reliability performances for each LP since the reliability results in case 2 are worse than the results in case 1. Moreover, with reference to case 1–3 or case 2–3, it can be concluded that ASs could largely improve the reliability performance for related LPs since they can shorten the interruptions via service restoration.
The significance of the proposed recursive method is its element-by-element equivalent principles, which result in computation efficiency improvement. In References [9,33], the efficiency of the distribution system is measured by calculation events. One unit of calculation event is defined as the time taken for calculating both λ and r once. The calculation event neglects the differences of each computing platform, i.e., the hardware and software aspects, and thus the efficiency of the reliability algorithm can be expressed more relatively. Considering case 3, the calculation events for FMEA, RNEA, ST, SPM and the proposed recursive method are tabulated in Table 3. It can be found that the calculation events of the overall system using the proposed method amount to 496, and are 21.02% of that required by FMEA, 39.02% of RNEA, 49.11% of ST, and 36.31% of the SPM, which indicates the proposed method exhibits the highest computation efficiency.
Moreover, considering case 3, the run time using FMEA, RNEA, ST, SPM and the recursive algorithm for the overall system are listed in Table 4, as to make the conclusion concerning the efficiency of the proposed method more convincing. The simulations are carried out with an Intel(R) Core i7-3612QM 2.1-GHz CPU and 16.00 GB of RAM. From Table 4, it can be seen that the execution time of the recursive method is 1.1564 s, which is 21.92% of that required by FMEA, 39.30% of RNEA, 34.08% of ST, and 47.73% of the SPM. This also indicates that the proposed recursive method exhibits the highest calculation efficiency amongst these listed algorithms. In addition, the execution time using ST takes 0.3393 s, which is 64.30% of that executed by FMEA. This is consistent with the conclusion in Reference [9] that ST takes 76.3% of the time using FMEA, considering the base case of RBTS-Bus6.

5.2. An Industrial Distribution System

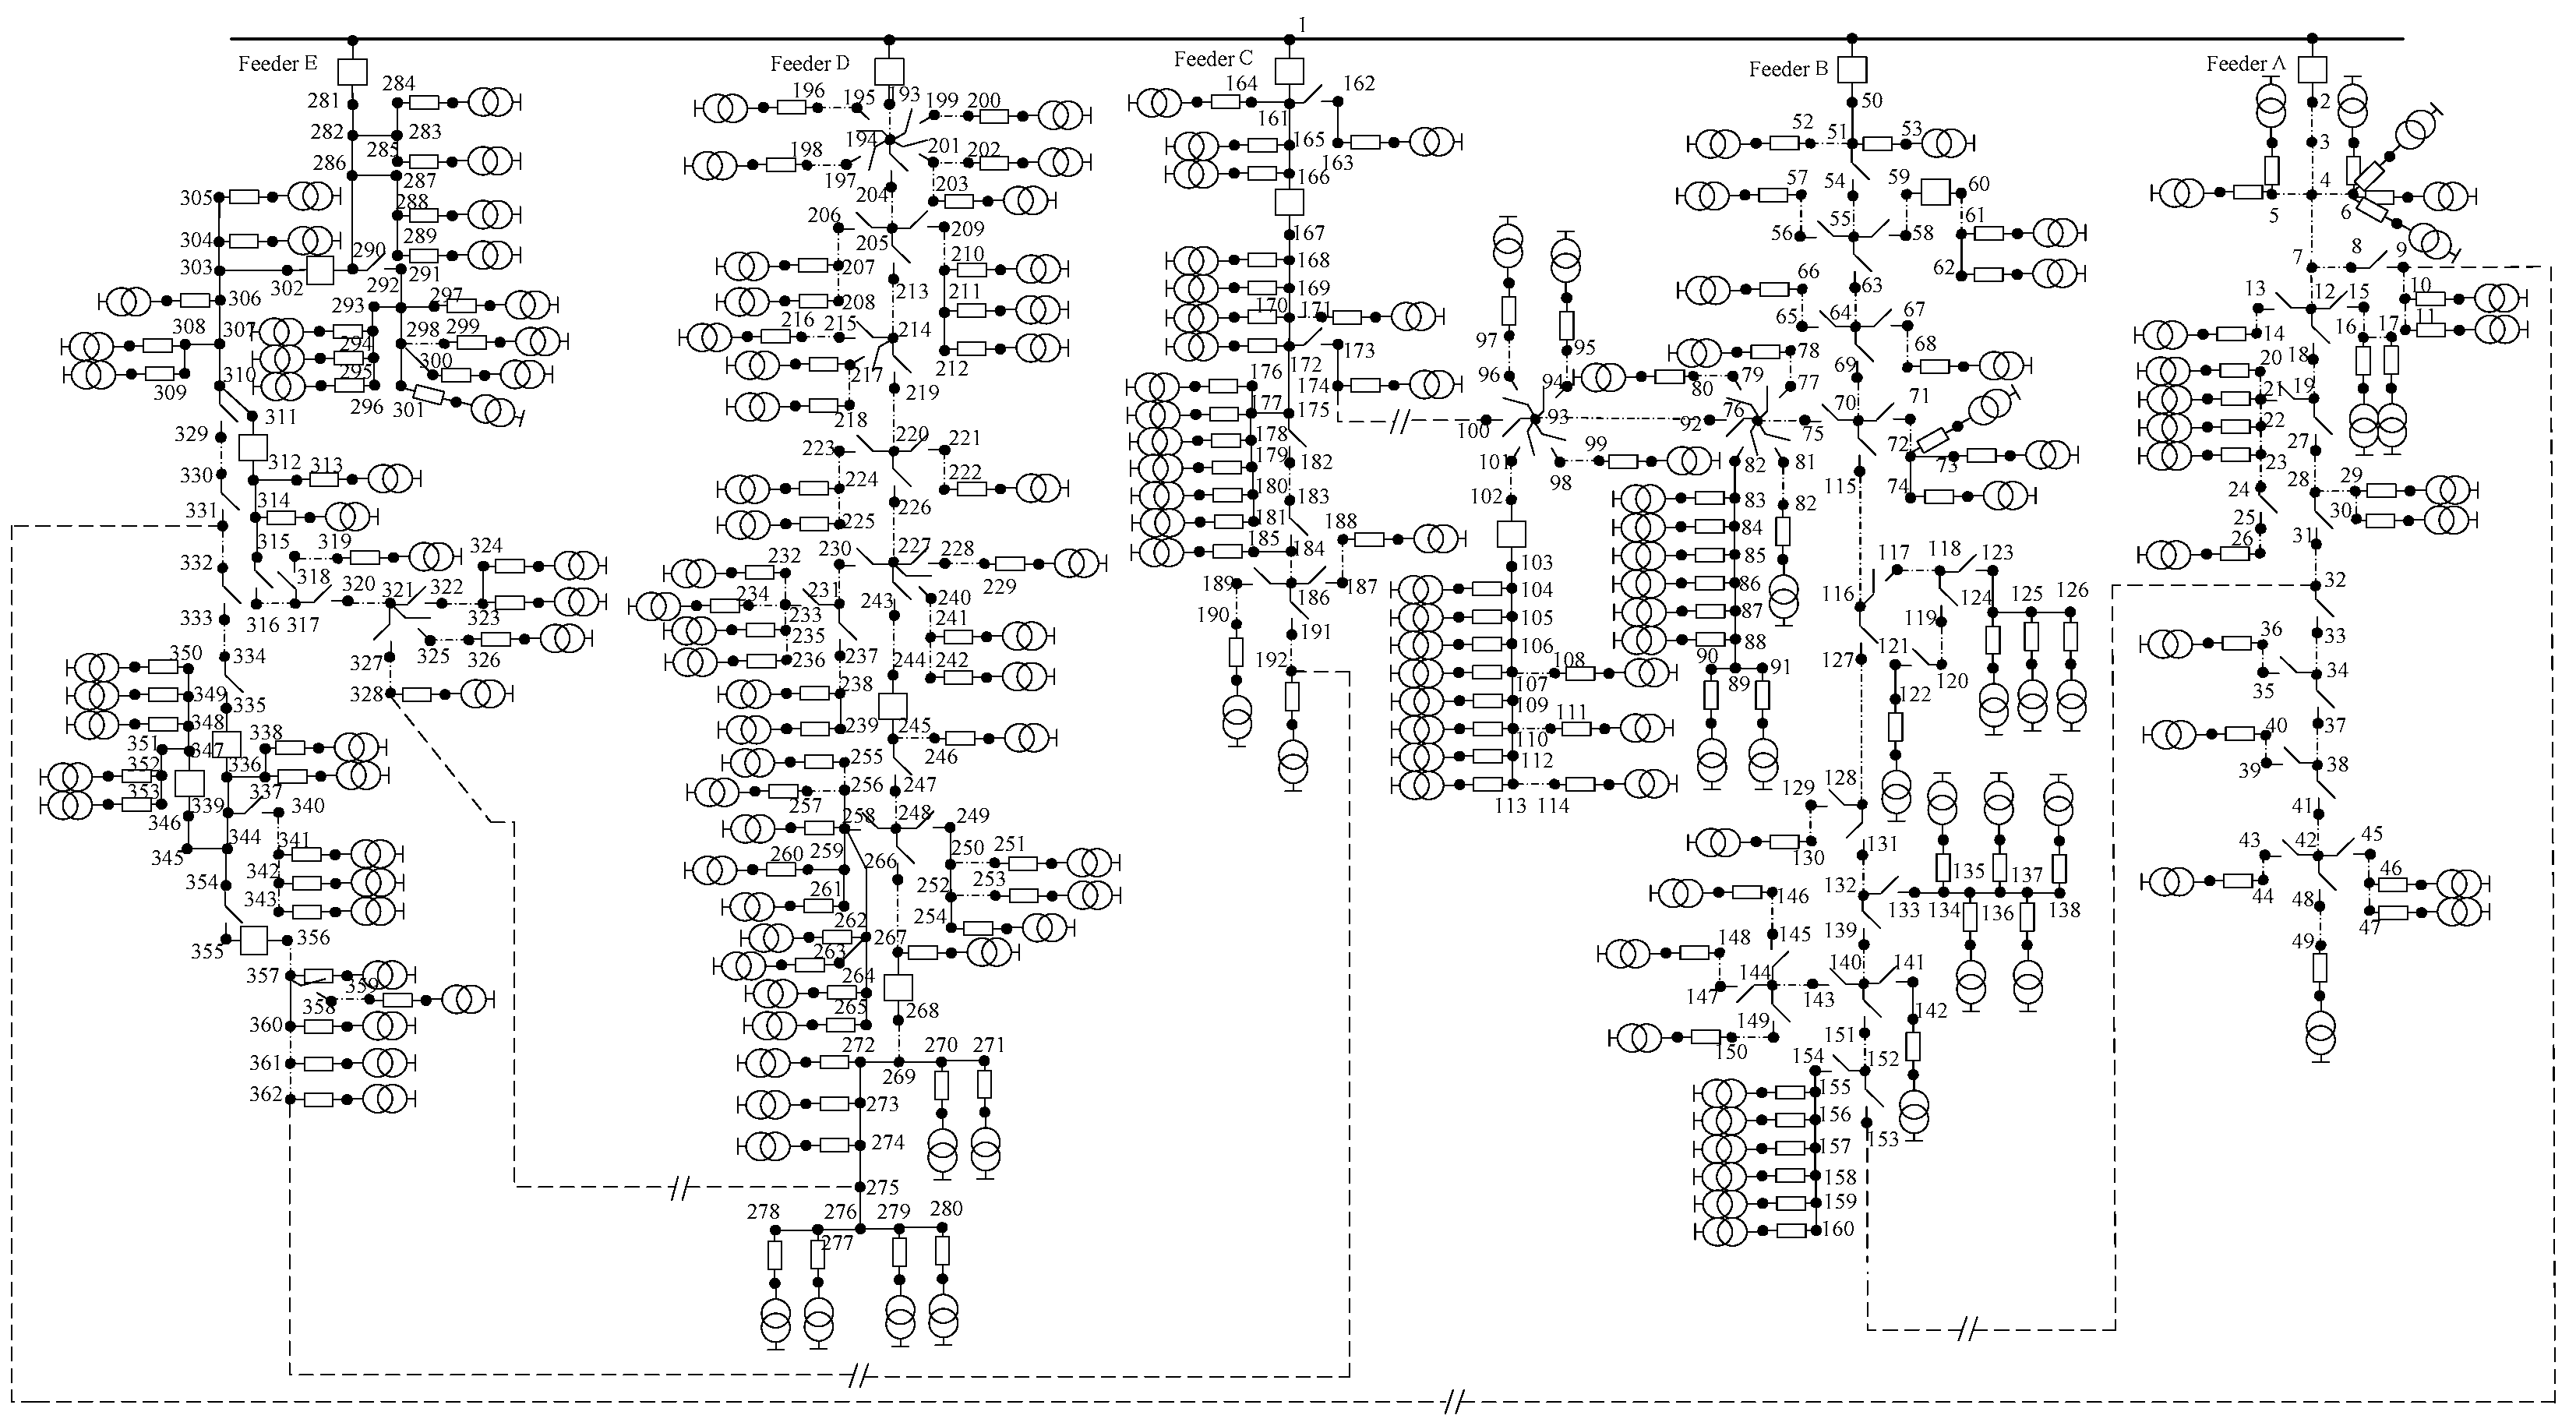
For an in-depth investigation into the efficiency benefits of the proposed recursive method, a practical 362-bus urban distribution system newly upgraded in Henan province [31], China, is adopted as the benchmark system. The distribution system, shown in Figure 5, consists of five 10-kV feeders, 242 branches and 186 load transformers. In addition, many types of protective devices, such as 98 normally closed disconnect switches, 5 normally opened tie-switches, 21 fuse cutouts and 14 circuit breakers, are also contained in the system. The length and capacity for feeders F1–F5 are 7.242 km & 3.5 MVA, 15.806 km & 26.1 MVA, 5.502 km & 2.9 MVA, 6.654 km & 5.7 MVA, and 7.441 km & 6.3 MVA, respectively. Each feeder contains industrial, office building, government, residential and commercial customers. The reliability data for the circuit equipment is listed in Table 5 and Table 6. Based on the reliability data for circuit equipments, the reliability performance for each feeder can be calculated.
Similarly, three different cases are simulated to demonstrate the benefits of the proposed recursive algorithm, described as follows,
  • Case 1: All types of protective devices, such as fuses, breakers and fuse cutouts are assumed to be 100% reliable.
  • Case 2: All types of protective devices are assumed to be 80% reliable.
  • Case 3: The operation time of all tie-switch is set to 1.5 h, and other conditions are set as the same as case 2.
The reliability performances for each feeder under three cases are shown in Table 7.
It can be seen from the results that the SAIDI of all five feeders ranges from a minimal of 1.6354 to a high of 10.4182 with an average of 5.7714 in case 1. However, if the breakers and fuses operate successfully at a probability of 0.8, the SAIDI of the whole system would jump to 7.3089 in case 2, indicating that breaker/fuse have a large effect on the system reliability performance. The changing trends of other reliability indices also support this conclusion. Therefore, more reliable protective equipments are crucial for minimizing the frequency and duration of interruptions, and so the system reliability performance can be accordingly enhanced. In other words, the system reliability performance for industrial distribution systems would deteriorate hugely if the protective equipment lacked adequate maintenance and inspection.
Moreover, with reference to case 2–3, it can be founded that SAIDI of the system jumps to 11.8669 when the operation time of all tie-switches is set to 1.5 h, which is far beyond 7.3089 in case 2. This indicates that the AS has a significant impact on the improvement of system reliability performance. This is why the modern distribution system is usually upgraded as a hand-in-hand loop structure in which a Tie-Line Switch (Sectionalizer) is located at the end and middle of these feeders.
The calculation events as well as the run time of FMEA, RNEA, ST, SPM and the proposed recursive method are tabulated in Table 8 and Table 9. As seen, the calculation events for FA-FE using the proposed method are 7.52%, 7.41%, 7.97%, 3.55%, and 3.68% of that required for FMEA. The run time for FA-FE using the recursive method is 7.18%, 6.75%, 5.34%, 3.81%, and 3.44% of that required for FMEA. The results also demonstrate that the proposed method exhibits the highest efficiency over RNEA, ST and SPM, which is consistent with the conclusions obtained in Section 5.1.

5.3. Discussions

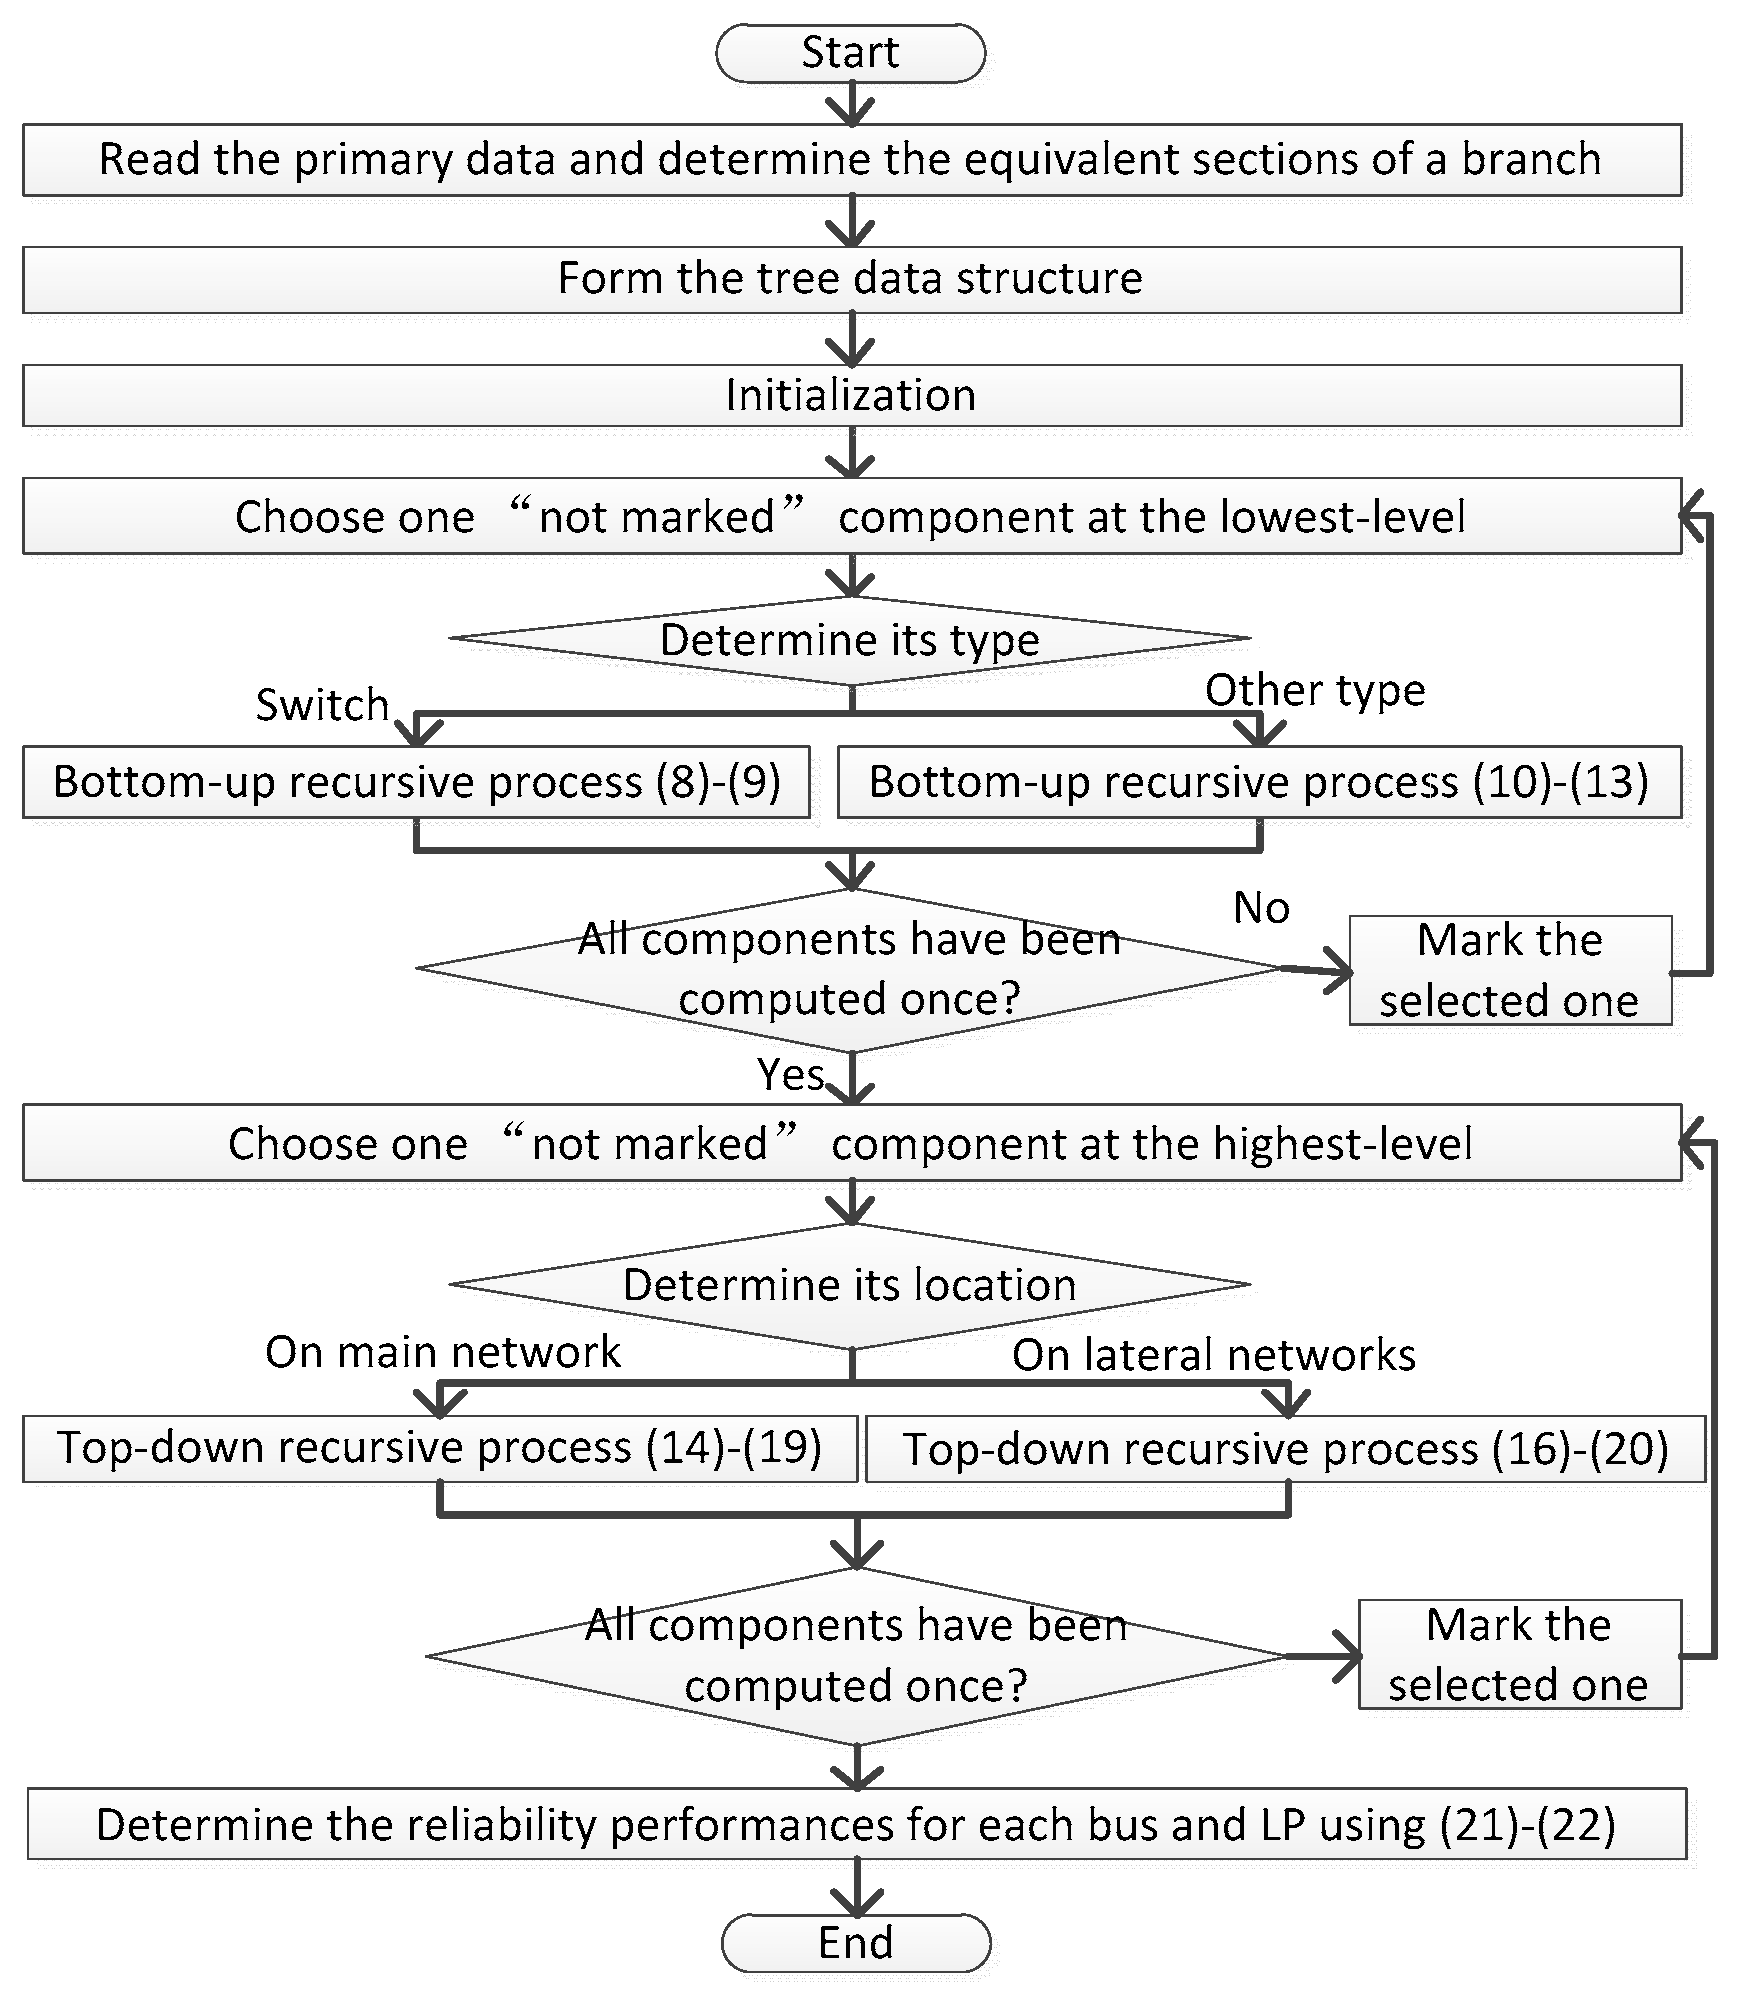
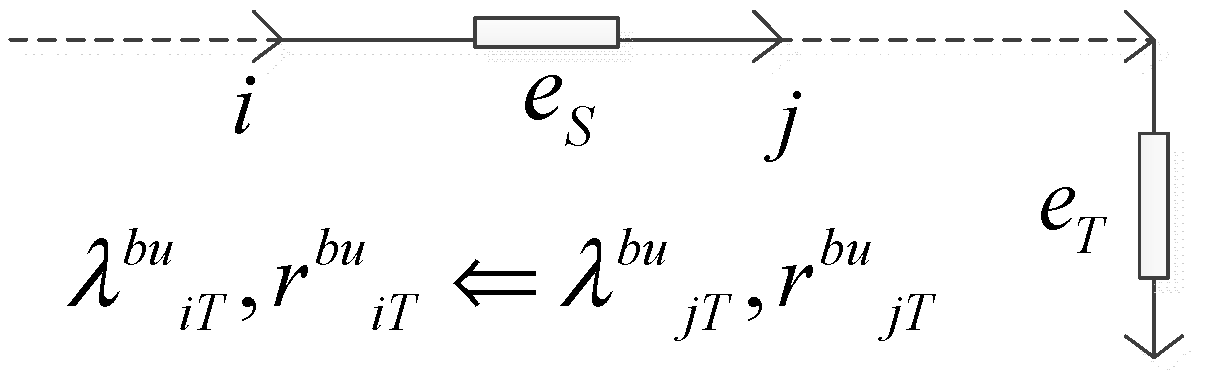
The proposed recursive algorithm mainly consists of a bottom-up and a top-down recursive process, which have been discussed in Section 3 and 
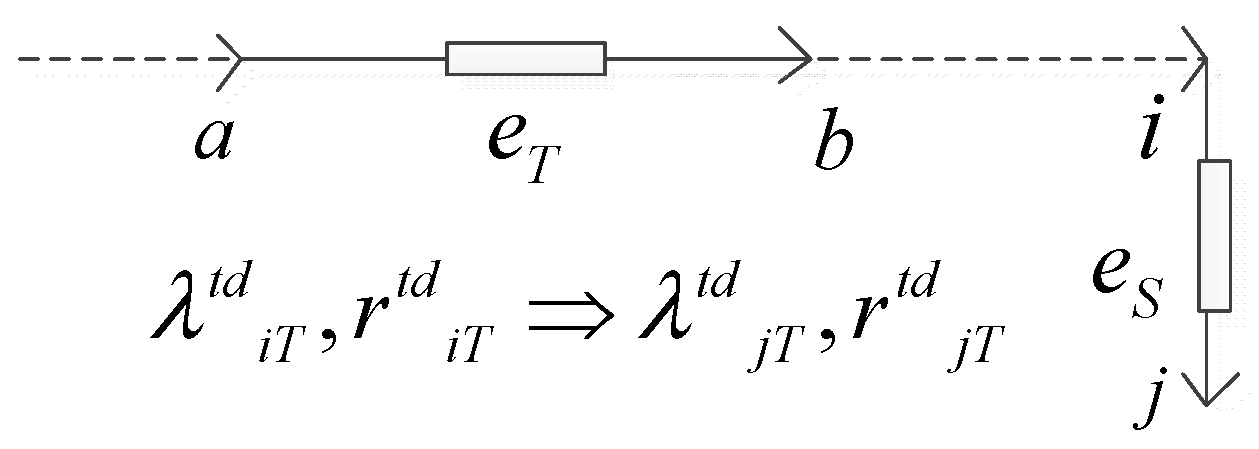
Section 4. The former quantifies the effect of downstream failures on certain upstream bus. This effect is similar to the effect of an equivalent lateral section on the bus in Reference [12]. The latter considers the effect of upstream failures on certain downstream bus, and this effect is similar to the effect of an equivalent series component on the bus in Reference [12]. The reliability indices of the equivalent lateral section and equivalent series component can be determined by using the recursive algorithm presented in Formulas (8)–(22). To any bus, there is always one equivalent series component and several equivalent lateral sections, and the synthesis of reliability indices of those components and sections yields the reliability performance of that bus.
With the above analysis, it is clear that the top-down or bottom-up recursive process is not only applied to the nodes in the lateral network, but also to the nodes in the main network. Also, the reliability indices of any node can be recursively obtained based on those of neighboring nodes only, while reliability information of the rest of network is not required at all. This is because the combined effect of downstream failures on a certain node is considered in analyzing the reliability performance of its connected downstream nodes in the proposed recursive method. Similarly, the combined effect of upstream failures on the node is accounted for in the reliability analysis of its connected upstream nodes. Therefore, the proposed recursive method provides a more generalized element-by-element equivalent principle, with which the network simplification for reliability evaluation can be fully realized. Compared to the sub-feeder-based approach in many existing methods, where network simplification has to be designed according to specific network topology involving excessive computational costs, the proposed recursive method can maximally simplify the network and thus minimize the computation cost accordingly due to its element-by-element recursive principles. Moreover, the computation cost of the proposed recursive method is further minimized using several techniques, as follows,
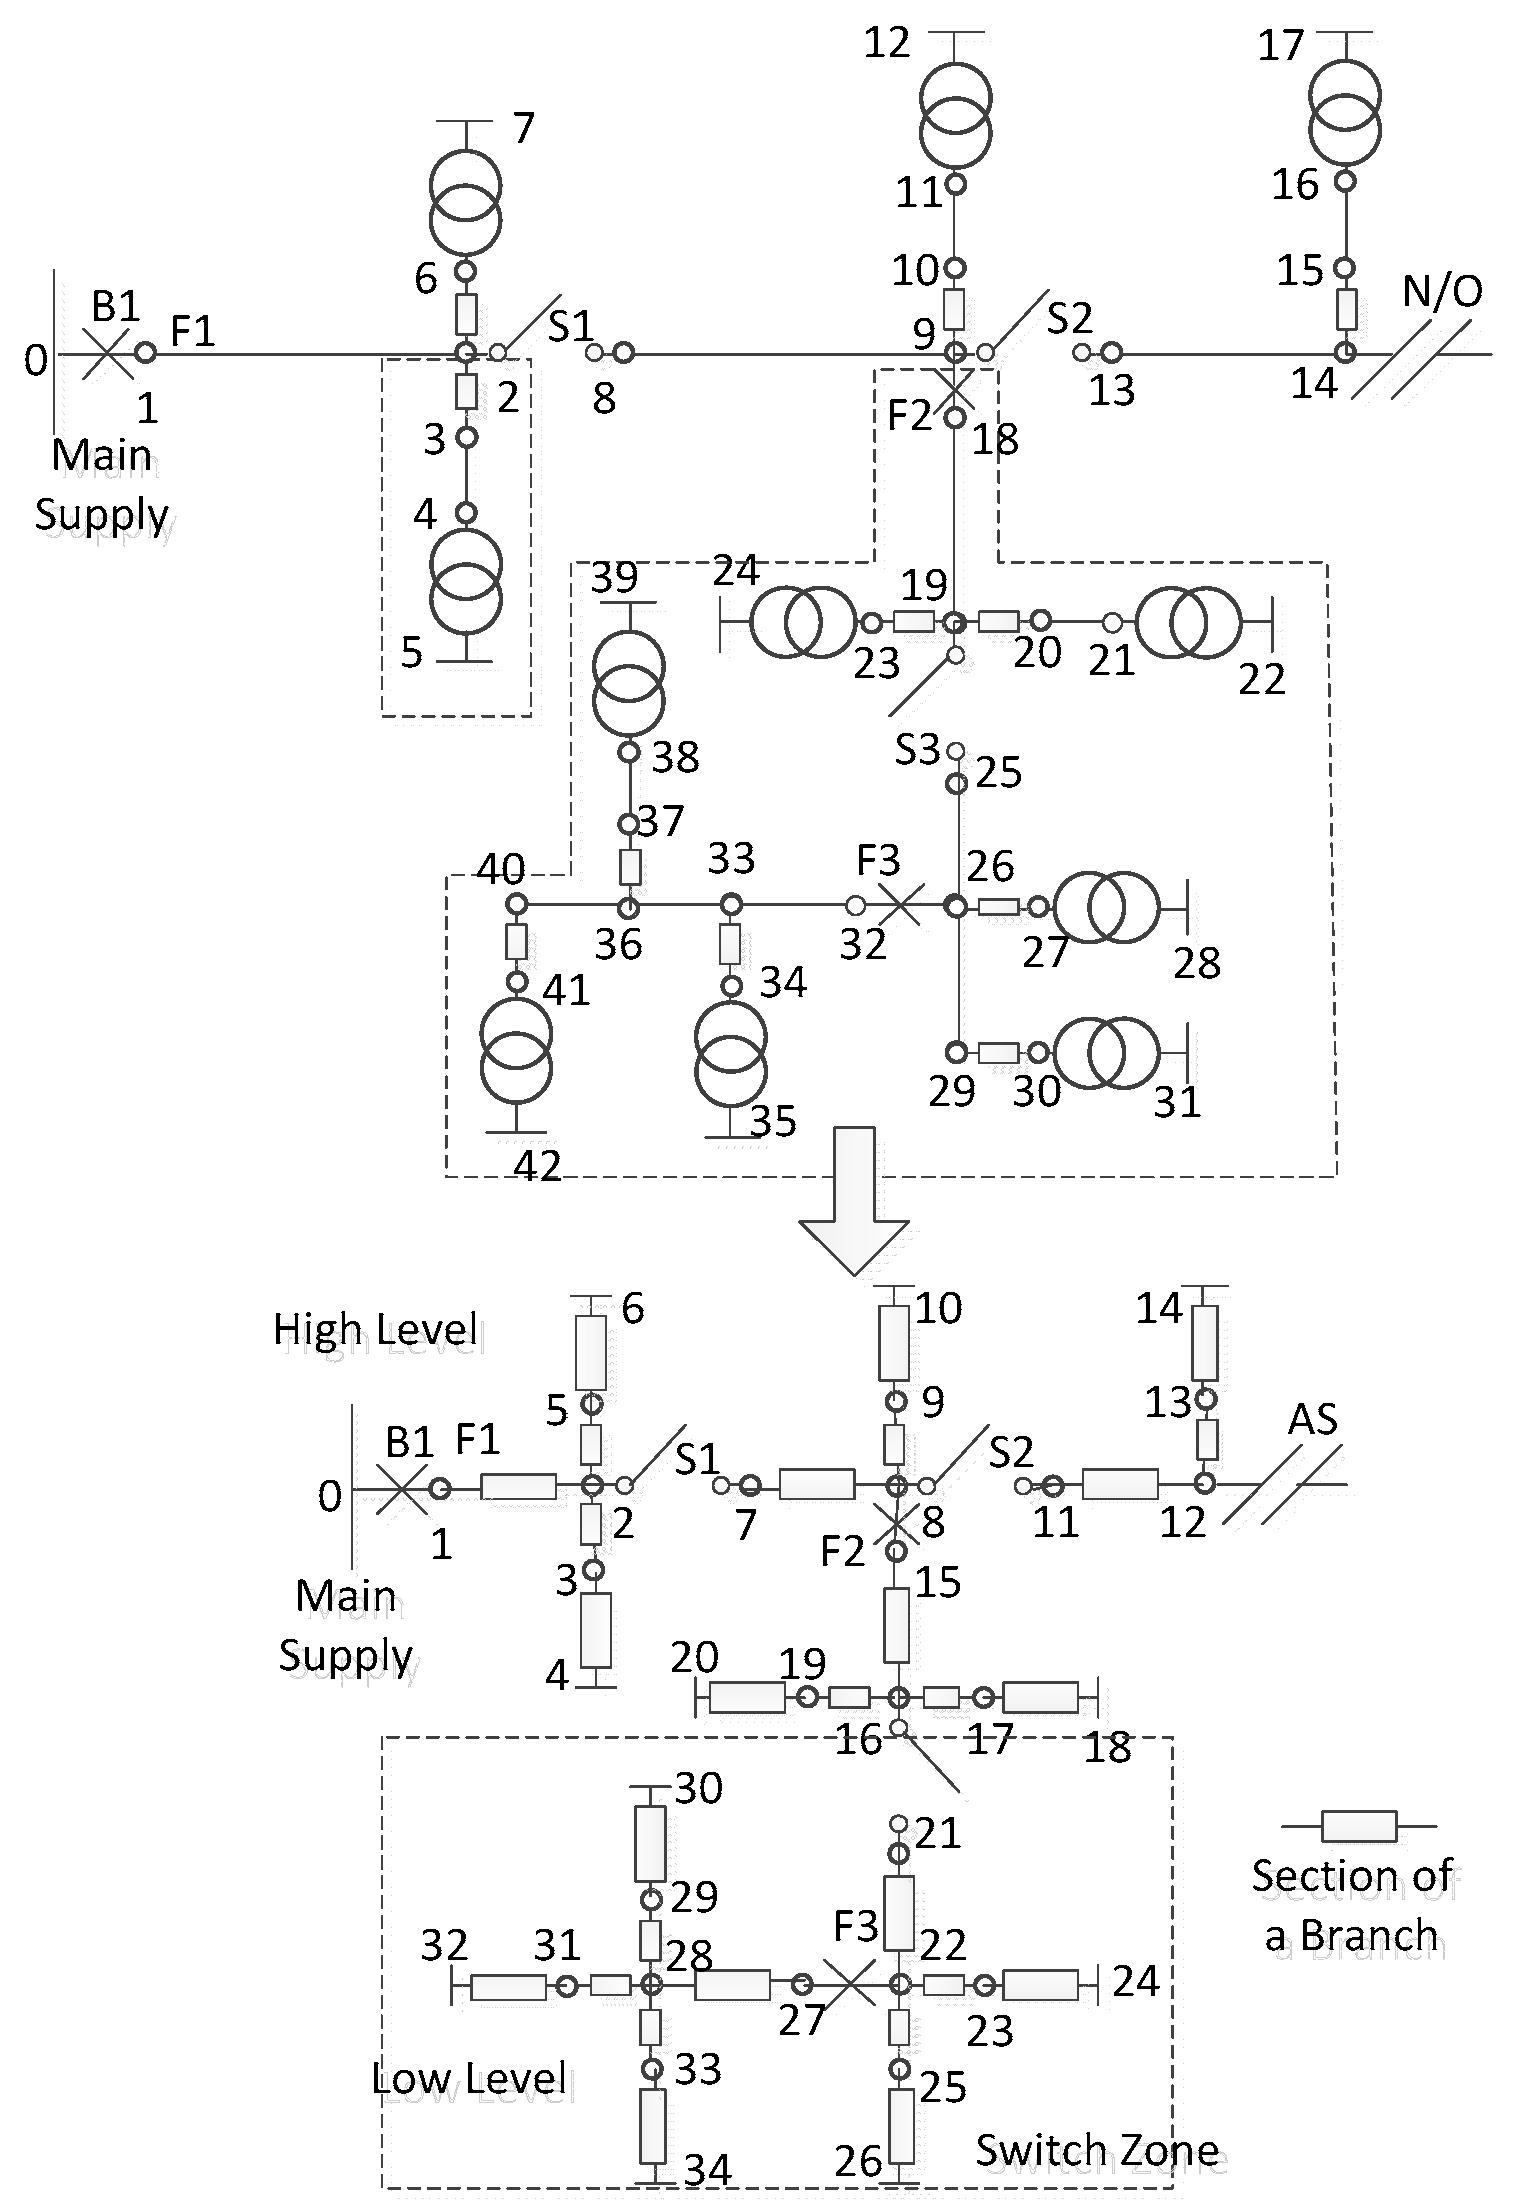
(1)
Section of a branch is utilized to reduce the number of equivalent process, and thus the distribution system can be simplified.
(2)
The upstream recursive process adopts SPM [13], in which the components in other branches are treated as a lateral equivalent section, and so the computation cost can be further mitigated.
Therefore, theoretically, it can be concluded that the proposed recursive method exhibits higher calculation efficiency than FMEA, RNEA, ST and SPM, which is consistent with the simulation results presented in Section 5.1 and Section 5.2.
It should be noted that the proposed recursive method can also be used in bidirectional power flow case and non-radial network’s structures, due to the emergency of sustainable energy and the requirement of high reliability in recent years. First, the distribution system has several typical operation scenarios. Here, operation scenario indicates the operational status of the distribution system at a given moment. Each scenario has a fixed power flow with a unique direction and different scenarios may exhibit different power flow directions. We can use our method to calculate the reliability indices at any operational scenario. Synthesizing these indices at all scenarios generates the final reliability indices of the distribution system. Second, the energy in the distribution system generally flows from the transmission system to load points. Any non-radial structure, such as a circular, can be viewed as a basic component in (1). Its equivalent failure rate and outage duration are calculated in Formulas (2) and (3), As a result, the reliability indices of the not-radial distribution system can be evaluated by taking the non-radial structure as an equivalent component. Therefore, our recursive method has wide application in distribution systems.

6. Conclusions

In this paper, a computationally effective recursive method is proposed for distribution system reliability evaluation. The bottom-up and top-down recursive processes are firstly investigated and developed on the basis of stringent recursive principles. In addition, a novel switch zone is embedded in the bottom-up equivalent process to save the computation cost. In addition, section technique and shortest path method are also introduced in the proposed method for network simplification. The proposed method has been successfully tested on a practical 362-bus distribution system in Henan province, China.
The primary advantage of the proposed approach over other methods is the superior calculation efficiency and applicability for large-scale distribution networks. This paper also demonstrated that the lack of maintenance and inspection for protective devices could significantly deteriorate the system reliability performance. Moreover, the hand-in-hand loop distribution structure could reduce the outage duration because of the restoration process.

Author Contributions

All the authors participated equally to this study, including the adopted methodology, the proposal of new algorithm and the implemented case analysis. H.W. conducted the research and drafted the methodology. X.Z. analyzed the results and wrote the case studies. Q.L. thoroughly revised the paper and attended the discussion of the work. G.W., H.J. and J.P. discuss the application of the recursive method for reliability evaluation.

Funding

This work is jointly supported by National Natural Science Foundations of China (51707123, 51507103, 51477104), Natural Science Foundations of Guangdong Province (2017A030310061, 2017A030310317, 2016A030313041) and the Foundation of Shenzhen Science and Technology Committee (JCYJ20170302153607971, JCYJ20170817100412438).

Conflicts of Interest

The authors declare no conflict of interest.

References

  1. Samet, O.; Vasilis, F.; Stefan, F. Failure Modes, Effects and Criticality Analysis for Wind Turbines Considering Climatic Regions and Comparing Geared and Direct Drive Wind Turbines. Energies 2018, 11, 2317. [Google Scholar] [CrossRef]
  2. Mohamad, F.; Teh, J.; Lai, C.-M.; Chen, L.-R. Development of Energy Storage Systems for Power Network Reliability: A Review. Energies 2018, 11, 2278. [Google Scholar] [CrossRef]
  3. Mohamad, F.; Teh, J. Impacts of Energy Storage System on Power System Reliability: A Systematic Review. Energies 2018, 11, 1749. [Google Scholar] [CrossRef]
  4. Lu, J.; Guo, J.; Jian, Z.; Yang, Y.; Tang, W. Resilience Assessment and Its Enhancement in Tackling Adverse Impact of Ice Disasters for Power Transmission Systems. Energies 2018, 11, 2272. [Google Scholar] [CrossRef]
  5. Allan, R.N.; Billinton, R.; Breipohl, A.M.; Grigg, C.H. Bibliography on the application of probability methods in power system reliability evaluation: 1992-1996. IEEE Trans. Power Syst. 1999, 14, 41–49. [Google Scholar] [CrossRef]
  6. Koval, D.O.; Billinton, R. Evaluation of distribution circuit reliability. IEEE Trans. Power Appar. Syst. 2008, PAS–97, 1–9. [Google Scholar] [CrossRef]
  7. Love, D.J. Reliability of utility supply configuration for industrial power systems. IEEE Trans. Ind. Appl. 1994, 30, 1303–1308. [Google Scholar] [CrossRef]
  8. Li, F.X.; Brown, R.E.; Freeman, L.A.A. A linear contribution factor model of distribution reliability indices and its applications in Monte Carlo simulation and sensitivity analysis. IEEE Trans. Power Syst. 2013, 18, 1213–1215. [Google Scholar]
  9. Xie, K.; Zhou, J.; Billinton, R. Fast algorithm for the reliability evaluation of large-scale electrical distribution networks using the section technique. IET Gen. Transm. Distrib. 2008, 2, 701–707. [Google Scholar] [CrossRef]
  10. Xie, K.G.; Cao, K.; Yu, D.C. Reliability evaluation of electrical distribution networks containing multiple overhead feeders on a same tower. IEEE Trans. Power Syst. 2011, 26, 2518–2525. [Google Scholar] [CrossRef]
  11. Wang, P.; Billinton, R.; Goel, L. Unreliability cost assessment of an electric power system using reliability network equivalent approaches. IEEE Trans. Power Syst. 2002, 17, 549–556. [Google Scholar] [CrossRef]
  12. Liu, W.; Guo, D.; Xu, Y.; Cheng, R.; Wang, Z.; Li, Y. Reliability Assessment of Power Systems with Photovoltaic Power Stations Based on Intelligent State Space Reduction and Pseudo-Sequential Monte Carlo Simulation. Energies 2018, 11, 1431. [Google Scholar] [CrossRef]
  13. Xie, K.; Zhou, J.; Billinton, R. Reliability evaluation algorithm for complex medium voltage electrical distribution networks based on the shortest path. Proc. Inst. Elect. Eng. Gen. Transm. Distrib. 2013, 150, 686–690. [Google Scholar] [CrossRef]
  14. Koval, D.O. Zone-branch reliability methodology for analyzing industrial power systems. IEEE Trans. Ind. Appl. 2010, 36, 1212–1218. [Google Scholar] [CrossRef]
  15. Ziari, I.; Ledwich, G.; Ghosh, A.; Platt, G. Optimal distribution network reinforcement considering load growth, line loss, and reliability. IEEE Trans. Power Syst. 2013, 28, 587–597. [Google Scholar] [CrossRef]
  16. Mendoza, J.E.; Lopez, M.E.; Coello, C.A.C.; Lopez, E.A. Microgenetic multi-objective reconfiguration algorithm considering power losses and reliability indices for medium voltage distribution network. IET Gen. Transm. Distrib. 2009, 3, 825–840. [Google Scholar] [CrossRef]
  17. Shogan, A.W. A recursive method for bounding network reliability. IEEE Trans. Reliab. 2007, R-26, 322–327. [Google Scholar] [CrossRef]
  18. Levitin, G. Recursive algorithm for reliability evaluation of non-repairable phased mission systems with binary elements. IEEE Trans. Reliab. 2012, 61, 533–542. [Google Scholar] [CrossRef]
  19. Lo, K.; Kimura, H. Recursive estimation method for discrete systems. IEEE Trans. Reliab. 2003, 48, 2019–2024. [Google Scholar]
  20. Huang, P.K.; Chang, C.S.; Cheng, J.; Lee, D.S. Recursive constructions of parallel FIFO and LIFO queues with switched delay lines. IEEE Trans. Inf. Theory 2007, 53, 1778–1798. [Google Scholar] [CrossRef]
  21. Wang, H.Z.; Lin, H.F.; Yu, T.; Xu, Z.; Yateendra, M. Dynamic equivalent-based reliability evaluation of distribution systems with DGs. IET Gener. Transm. Distrib. 2016, 10, 2285–2294. [Google Scholar] [CrossRef]
  22. Yang, B.; Zhang, X.S.; Yu, T.; Shu, H.C.; Fang, Z.H. Grouped grey wolf optimizer for maximum power point tracking of doubly-fed induction generator based wind turbine. Energy Convers. Manag. 2017, 133, 427–443. [Google Scholar] [CrossRef]
  23. Yang, B.; Jiang, L.; Wang, L.; Yao, W.; Wu, Q.H. Nonlinear maximum power point tracking control and modal analysis of DFIG based wind turbine. Int. J. Electr. Power Energy Syst. 2016, 74, 429–436. [Google Scholar] [CrossRef]
  24. Xi, L.; Chen, J.; Huang, Y.; Xu, Y.; Liu, L.; Zhou, Y.; Li, Y. Smart generation control based on multi-agent reinforcement learning with the idea of the time tunnel. Energy 2018, 153, 977–987. [Google Scholar] [CrossRef]
  25. Xi, L.; Zhang, Z.; Yang, B.; Huang, L.; Yu, T. Wolf pack hunting strategy for automatic generation control of an islanding smart distribution network. Energy Convers. Manag. 2016, 122, 10–24. [Google Scholar] [CrossRef]
  26. Hu, H.; He, Z.; Li, X.; Wang, K.; Gao, S. Power-Quality Impact Assessment for High-Speed Railway Associated With High-Speed Trains Using Train Timetable-Part I: Methodology and Modeling. IEEE Trans. Power Deliv. 2016, 31, 693–703. [Google Scholar] [CrossRef]
  27. Hu, H.; He, Z.; Wang, K.; Ma, X.; Gao, S. Power-Quality Impact Assessment for High-Speed Railway Associated With High-Speed Trains Using Train Timetable-Part II: Verifications, Estimations and Applications. IEEE Trans. Power Deliv. 2016, 31, 1482–1492. [Google Scholar] [CrossRef]
  28. Wang, H.Z.; Wang, G.B.; Li, G.Q.; Peng, J.C.; Liu, Y.T. Deep belief network based deterministic and probabilistic wind speed forecasting approach. Appl. Energy 2016, 182, 80–93. [Google Scholar] [CrossRef]
  29. Wang, H.; Li, G.; Wang, G.; Peng, J.Z.; Jiang, H.; Liu, Y. Deep learning based ensemble approach for probabilistic wind power forecasting. Appl. Energy 2017, 188, 56–70. [Google Scholar] [CrossRef]
  30. Wang, H.; Ruan, J.; Wang, G.; Zhou, B.; Liu, Y.; Fu, X.; Peng, J.-C. Deep Learning Based Interval State Estimation of AC Smart Grids against Sparse Cyber Attacks. IEEE Trans. Ind. Inform. 2018. [Google Scholar] [CrossRef]
  31. Billinton, R.; Jonnavithula, S. A test system for teaching overall power system reliability assessment. IEEE Trans. Power Syst. 2016, 11, 628–637. [Google Scholar] [CrossRef]
  32. Henan Power Grid Operational Committee. The Operation Mode of Henan Power Grid in 2012; China State Grid Co. Ltd.: Beijing, China, 2012. (In Chinese) [Google Scholar]
  33. Peng, J.C.; He, Y.Q.; Zhou, Z.M.; Jiang, H. Distribution System Reliability Evaluation Based on Up-stream Delivering and Down-stream Merging of Reliability Indices. Proc. CSEE 2010, 30, 40–46. (In Chinese) [Google Scholar]
Figure 1. The equivalent process of a typical distribution system.
Energies 11 02681 g001
Figure 2. Bottom-up recursive principle.
Energies 11 02681 g002
Figure 3. Top-down recursive principle.
Energies 11 02681 g003
Figure 4. Flowchart of the proposed algorithm.
Energies 11 02681 g004
Figure 5. A practical industrial distribution system in Henan Province.
Energies 11 02681 g005
Table 1. Reliability Parameters for Protective Devices.
Elementλ (f/year)r (h)Elementλ (f/year)r (h)
Breaker0.0064Transformer0.01510
Line0.0655Fuse0.0023
Switch0.0064
λ-failure rate, r-repair time, for lines (year·km−1).
Table 2. Calculation Events Using Several Algorithms.
FeedersFMEARNEASTSPMRecursive Method
F118018013510291
F2245245179133106
F37272605068
F41863774992725231
System2360127113661010496
Table 3. The Execution Time for Several Algorithms.
FeedersFMEARNEASTSPMRecursive Method
F1(s)0.03270.03270.02510.02260.0203
F2(s)0.03660.03660.03200.02470.0222
F3(s)0.01510.01510.01270.01130.0138
F4(s)0.44310.20970.26930.18360.0593
System0.52770.29430.33930.24230.1156
Table 4. Reliability Performance in RBTS-BUS 6 System.
FMEA/RNEA/ST/SPM The Proposed Recursive Method
Case 1Case 2Case 3Case 1Case 2Case 3
λ (f/year)r (h)λ (f/year)r (h)λ (f/year)r (h)λ (f/year)r (h)λ (f/year)r (h)λ (f/year)r (h)
LP10.36832.37950.32252.57510.32252.57510.36832.37950.32252.57510.32252.5751
LP30.37802.57900.37522.60750.37522.60750.37802.57900.37522.60750.37522.6075
LP50.37802.62070.40192.55500.40192.55500.37802.62070.40192.55500.40192.5550
LP70.41332.22930.35062.44910.35062.44910.41332.22930.35062.44910.35062.4491
LP100.40352.34170.41072.34290.41072.34290.40352.34170.41072.34290.41072.3429
LP140.26852.89200.25233.01320.25233.01320.26852.89200.25233.01320.25233.0132
LP181.68653.31311.85723.35631.85723.35631.68653.31311.85723.35631.85723.3563
LP231.72553.35121.89233.38681.89233.38681.72553.35121.89233.38681.89233.3868
LP261.72555.03421.98015.06581.98013.18441.72555.03421.98015.06581.98013.1844
LP312.55703.88502.65303.85942.65303.85942.55703.88502.65303.85942.65303.8594
LP372.57985.02052.76105.05682.76103.70752.57985.02052.76105.05682.76103.7075
LP402.53105.02092.71715.05772.71713.68662.53105.02092.71715.05772.71713.6866
Table 5. Reliability Data for Transformers and Lines.
Transformer Size (kVA)λ (f/year)r (h)Line Typeλ (f/year)r (h)
80–2000.003949.2YJV-70/1201.09 × 10−610.5
200–3150.004360.8YJV-240/3001.05 × 10−612.9
315–5000.004765.6YJLV-1201.16 × 10−614.1
500–8000.004970.1YJLV-4001.33 × 10−615.7
800–12000.005574.2LGJ-185/2407.86 × 10−63.6
1200–∞0.005979.5LGJ-3006.13 × 10−65.5
Table 6. Reliability Data for protection devices.
Elementλ (f/year)r (h)Elementλ (f/year)r (h)
Breaker0.0064Fuse-cutout0.3843.5
Fuse0.0023Disconnect0.0061
Tie switch0.0050.5Automatic switch0.0061
Table 7. System Reliability Performance under Three Cases.
FeedersSAIFI (int/cus.year)SAIDI (hr/cus.year)CAIDI (h/int)ASAI (%)EENS (GWh/year)
FACase 11.60426.27843.913799.928319.2620
Case 21.73158.08944.671999.907723.3609
Case 31.731511.12936.427699.873034.1682
FBCase 11.70367.89754.635899.909849.0729
Case 21.871810.78345.761099.876975.8316
Case 31.871816.66308.902199.8098109.1904
FCCase 11.14162.62762.301799.97009.0762
Case 21.20484.12883.427099.952912.2648
Case 31.20485.48384.551699.937421.3651
FDCase 11.889210.41825.514699.881143.1673
Case 22.132616.91687.932599.806969.8013
Case 32.132621.881510.260599.7502101.3390
FECase 11.03271.63541.583699.981326.0794
Case 21.16502.84402.441299.967542.2841
Case 31.16505.62264.826399.935850.0943
SystemCase 11.52643.81342.498399.9565146.6578
Case 21.63777.30894.462999.9166223.5427
Case 31.637711.86697.246199.8645316.1570
Notations: SAIFI is system average interruption frequency index; SAIDI is system average interruption duration index; CAIDI denotes customer average interruption duration index; ASAI denotes system average availability index; EENS denotes the electric energy not supplied each year.
Table 8. Calculation Events Using Several Algorithms.
FeedersFMEARNEASTSPMRecursive Method
FA659224012862882496
FB15,62011,067671925611158
FC4730162422611020377
FD12,608822640681592448
FE11,051762039131375407
System50,60130,93819,82374302886
Table 9. The Execution Time for Several Algorithms.
FeedersFMEARNEASTSPMRecursive Method
FA(s)2.04320.70520.80620.27150.1468
FB(s)4.46273.75931.64700.76800.3014
FC(s)1.73010.60280.75230.30070.0925
FD(s)3.56442.06711.23680.46820.1359
FE(s)3.30292.15361.11620.44160.1137
System(s)15.10339.2885.55852.250.7903

