Abstract
The demand response and battery energy storage system (BESS) will play a key role in the future of low carbon networks, coupled with new developments of battery technology driven mainly by the integration of renewable energy sources. However, studies that investigate the impacts of BESS and its demand response on the adequacy of a power supply are lacking. Thus, a need exists to address this important gap. Hence, this paper investigates the adequacy of a generating system that is highly integrated with wind power in meeting load demand. In adequacy studies, the impacts of demand response and battery energy storage system are considered. The demand response program is applied using the peak clipping and valley filling techniques at various percentages of the peak load. Three practical strategies of the BESS operation model are described in this paper, and all their impacts on the adequacy of the generating system are evaluated. The reliability impacts of various wind penetration levels on the generating system are also explored. Finally, different charging and discharging rates and capacities of the BESS are considered when evaluating their impacts on the adequacy of the generating system.
1. Introduction
Energy storage system (ESS) and demand response (DR) programs are now widely accepted as key factors in the future of low carbon energy networks [1,2]. For example, in the UK, discussions about the capacity market and similar schemes are becoming increasingly open to both ESS and DR [3]. Despite this situation, only a handful of studies have investigated the impacts of ESS and DR programs on the adequacy of power systems [4,5,6,7]. More importantly, no study has investigated the joint impact of both ESS and DR on the adequacy of generating systems. Hence, this gap needs to be addressed so that the joint contribution of ESS and DR to the adequacy of generating systems can be determined and the extent to which the technologies can replace conventional generators can be known. The adequacy contribution of ESS and DR is qualitatively distinct from that of normal generators. For instance, the ability of ESS to improve the adequacy of a power supply is affected by its charging and discharging cycle, storage capacity, power ratings, and roundtrip efficiency. The DR program is only effective with enough participation and cooperation from electricity consumers and is therefore affected by parameters such as building and occupancy profiles, underlying services, and the desired level of comfort [8,9]. Given the diversification in both technologies, DR is facilitated by different forms of ESS [8,10], especially thermal storage such as hot water tanks and building thermal inertial [11,12], and the more recent electric vehicles and battery ESS (BESS) [13]. Depending on choice of ESS, the capability of DR to reduce load consumption and the load recovery services for re-establishing the curtailed demand can be more or less flexible.
The impetus towards the concept of DR is the recent awareness and recognition of smart meters as a major component of future grids. DR is an operation strategy that grants utilities and consumers the opportunity to adjust electricity demand using real-time data at each point in time [14]. It aims to smooth or level out the electrical load pattern over a certain period without decreasing energy consumption. Given that the DR interferes with consumers’ electricity usage behaviours, it is usually accomplished using time-of-day energy pricing schemes to provide incentives to customers to shift electricity consumption from peak times to lower load periods. The ability to provide this information is given by smart meters, and relevant system-wide deployment costs are usually justified by customers obtaining a continuous stream of information on their load demand [6]. On the basis of the load-levelling benefits of DR, the demand on the capacity of generators can be reduced significantly as peak loads are reduced. Subsequently, the reliability of generating systems and, hence, the adequacy of the power supply is improved drastically, opening up more room for the integration of renewable energy sources (RES).
In the past, RES, especially wind, has had limited penetration due to their intermittent nature. Given that the natural driving force for renewable energy cannot be controlled, the ESS is introduced as a way to store excess energy from renewable power plants and is used when production levels are less than demand levels [15]. As a result, the power reserve and operating capability of the grid and, hence, system reliability and stability are increased. Despite this situation, the use of ESS to store electricity remains an ineffective approach. For example, most of the grid ESS in the USA comes from hydro pump stations, and exploiting this electro-hydro resource on a large scale without affecting local ecological systems is almost impossible. Thus, better ESS that is fast responding and scalable is continuously seek to achieve low reliable and low cost energy storage [16]. BESS is one of the most effective energy storage systems because it can provide mobile and flexible storage capacity and can be easily placed in desirable locations on the grid to optimise operations. The recent integration of electric vehicles into the electricity grid has also further increased the appeal of BESS despite its smaller storage capacity than that of the hydro pump storage. In 2015, the total installation capacity of BESS reached 0.67 GW, indicating a growth of more than 20 times the BESS capacity in 2008 [16]. With the announcements by both battery manufacturers and electric vehicle companies to improve battery capabilities, the application of BESS is expected to continue to grow [17]. Notably, the size of single BESS grid-connected projects is also increasing. For example, in the US alone, several BESS projects are more than 100 MW [16].
With the recognition that both DR and BESS will play a key role in the future of low carbon networks, coupled with the new developments of BESS, driven mainly by the integration of RES, and the lack of studies that investigate the impacts of BESS and DR on the adequacy of power supply, a need exists to address this important gap. Therefore, this paper proposes a novel study that jointly investigates the impact of DR and BESS on the adequacy of generating systems incorporating wind power. The load profile and the reliability data of the generating system in this study is based on the IEEE Reliability Test Network (RTN) [18]. This paper is organised into seven sections, including this introductory section. The DR model implemented in this study is given in Section 2. The wind generation system model is given in Section 3. Then, the operational model governing the interaction between BESS and the wind farm is given in Section 4. A summary of the simulation technique is given in Section 5. Results and analyses are presented in Section 6. The paper is concluded in Section 7.
2. Simulation Overview
The focus of this paper is to assess the adequacy of the generating system in satisfying load demand when wind energy, BESS, and DR are incorporated. Given that load demand and wind speed propagate and fluctuate over time, the adequacy assessments in this paper consider the chronological factor. Furthermore, the generating system in the adopted IEEE RTN consists of many generators, and their up–down cycles, as well as the many combinations of generator status, can be simulated effectively using the Monte Carlo (MC) method [19]. MC simulation has been used in many power system adequacy studies to handle a large amount of state space for a large number of simulations. It is especially suitable for simulating systems with many possible combinations of scenarios that need to be assessed. In light of the two conditions above, the characteristics of sequential MC (SMC) simulation are more suitable than those of the non-SMC simulation. Thus, the SMC simulation is used in this study to examine the adequacy of the generating system [20]. The step-by-step process of the SMC executed in this study is given as follows:
- Step 1:
- All conventional and wind farm generators are initiated to be in the normal up state. For simplicity, the BESS status are not considered and are assumed fully reliable.
- Step 2:
- The duration of all the generators in the up and down states is simulated. The duration is determined by the failure and repair rates of each generator taken from the IEEE RTN. The duration is determined using the inverse transform method [21]. According to the method, the status of the generator is given by . is the duration of the generator either in the up or down state. is the failure or repair rates of the generators. If is the failure rate, then the value shows the duration which the generator in the up state before transitioning into the down state. In the opposite situation, the value is the duration of the generator down state if is the repair rate. The variable is the uniformly distributed random number between 0 and 1. This step generates the up–down cycle of all the generators, including conventional and wind farm generators.
- Step 3:
- The chronological load model is constructed by modifying the original IEEE RTN load curve with the DR model (see Section 3).
- Step 4:
- The adequacy of power supply from both the conventional and wind farm generators is determined by considering the modified load curve and the support given by the BESS to the generating system. Section 4 presents the wind farm generating system model, including the modelling of wind speed. Section 5 presents the operational model of the wind farm and the BESS.
- Step 5:
- The system reliability index, such as the expected energy not supplied (EENS), is calculated and updated. The EENS index is an indication of the average energy not served in a year (MWhour/year). Steps 2 to 4 are repeated until the variation of the EENS value converges to less than 5%.
An overview of the simulation process is given in Figure 1 to provide a clear illustration. The figure shows that the modified load curve based on the DR model and the total power output from the conventional generating system and wind farm are analysed based the operation policy of the BESS. The wind farm power output takes into consideration the wind speed model. On the basis of the choice of the BESS policy, the total load demand and power supply are compared to determine the adequacy of power supply. Depending on the choice of the BESS policy, additional power may be supported or stored in the BESS. The process is simulated until the EENS converges, which indicates the adequacy of the power supply.
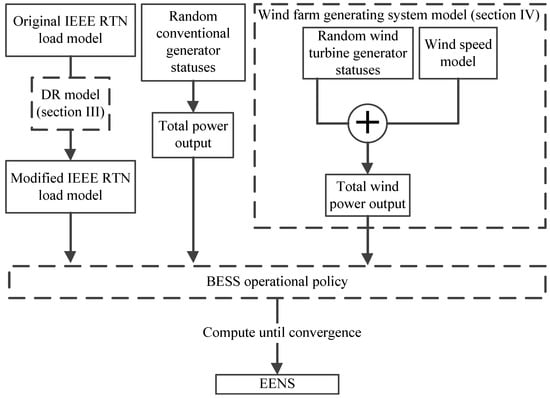
Figure 1.
Overview of the simulation process.
3. Demand Response Model
The DR program can be implemented using various techniques [8]. The load shifting technique is the most balanced technique, providing no to little loss of load demand due to manipulation of the load curve because the technique clips all the on-peak hours energy and transfers them to the off-peak hours [22]. Mathematically, it is expressed as follows.
where
is the original peak load curve, is the modified load curve, is the prespecified peak load, is the set of on-peak hours during which the load demand is reduced, is the set of off-peak hours during which the reduced load demand is recovered, and is the number of off-peak hours.
According to Equation (1), the energy that is reduced during on-peak hours is divided equally among all the off-peak hours. On-peak hours are identified as the duration when the load demand is above of the peak load. Off-peak hours are the duration when the load demand is below of the peak load. In this paper, the percentage value of is fixed as 60%. To ensure that the valleys do not become the new peaks, they are limited only to the of the peak load after adding new load clipped from on-peak hours. Excess load that cannot be filled into the current valley is filled in subsequent valleys until all valleys are considered. Any succeeding additional excess load is considered part of the loss of the load demand.
Henceforth, the DR program is understood to implement the load shifting technique unless otherwise stated
4. Wind Farm Generating System Model
The generation of wind power over a sufficiently long period of time depends on the simulation of the hourly wind speed at specific sites. The propagations of wind speeds have been identified as a stationary stochastic system, which is best approximated closely by the autoregressive moving average (ARMA) model of order [23]. The complicated process of fitting the ARMA model on the time-series wind speed was formalised in [24]. In the cited study, the developed ARMA wind speed models using this method have a high-order autocorrelation, thereby maintaining seasonal and diurnal distribution characteristic of the actual wind speeds, thereby making them accurate for adequacy studies that incorporate wind turbine generators (WTG). The generic mathematical expression of the ARMA wind speed model is given as:
and are the autoregressive and moving average constants of the model, respectively; is a normal white noise process with zero mean and a variance of , i.e., is normally and independently distributed ; and is the time-series value at time . The parameter values , , , and for the ARMA model are determined using the nonlinear least-squares method. is recursively calculated from and all the initial guess values of the aforementioned parameters. The least-squares method seeks to minimise the residual sum of squares of , and a smaller value is obtained using the Marquardt procedure [23]. A new iteration is begun by using the newly updated until the specified tolerances are reached.
After obtaining the ARMA model in Equation (2), wind speeds at specific sites are simulated according to
The parameters and are the site-specific mean and standard deviation of the wind speed data, respectively.
Historical wind speeds from Burbo Bank, an actual wind farm location in the UK, were sampled over 20 years from the British Atmospheric Data Centre website [25]. Its wind speed profile was fitted with the ARMA model and then simulated according to Equation (3) and is used for the wind farm that is included in the adequacy study of this paper. from Burbo Bank is further applied into Equation (4) to obtain the wind power generated by a WTG.
, , and are the cut-in, rated, and cut-out wind speeds, and their values are 5 m/s, 10 m/s, and 25 m/s, respectively; is the rated power output of a WTG and the total wind farm power output is set to of the total load demand divided equally among all the WTGs; the constants , , and are determined according to a past paper [26]. For simplicity, the wind farm is assumed to consist of only 100 identical WTG units, all of which are exposed to the same wind regime, thereby providing the same wind power outputs within the simulation period. Long-term adequacy studies generally consider hourly time interval in the simulations. The considered failure and repair rates of the WTG are 1.501/year and 123.582/year, respectively [26]. The total wind farm power output is the sum of the individual power produced by each WTG.
5. BESS Operational Model
The benefits of ESS for the reliability of small, isolated power systems are well known [27]. For large-scale power systems, new battery technologies have also been considered and successfully tested to improve the integration of wind energy [28]. Hence, the impacts of BESS on the adequacy of power supply for large power systems, especially from the viewpoint of BESS operating policies, need to be investigated. Such an investigation is important because the operating strategies of BESS a significant impact on the reliability of generating systems integrated with a large amount of wind power. In this section, these strategies are examined.
From the system reliability viewpoint, a desirable option is to have available capacity in the BESS whenever surplus wind power output exists, and to use the stored energy when deficits in wind power generations occur. Through this approach, the power supply fluctuations imposed by wind farms are contained and reduced. The implementation of BESS also reduces the uncertainty faced by wind farm owners because they usually estimate the next hour wind speed and commit to a certain amount of wind power based on this estimation. If the generated wind power is more than that is required by the system, then excess power is stored in the BESS. By contrast, stored energy in the BESS is used to support load demand if the wind power generation is underestimated. The process of estimating the amount of available wind power ahead of time is necessary to compete with other wind farm owners because power network operators often impose a limit on the penetration level of wind power to maintain system stability. Therefore, wind farm owners who can accurately commit to more wind power will take in more profit. Errors in the estimation of power commitment will have financial implications in the form of penalties. In view of this situation, ESS, especially the fast-responding BESS, is essential in the operation of power systems integrated with wind energy.
As a prerequisite to defining the BESS model mathematically, the following is explained. If the wind power commitment is of the total load demand, then the percentage of load supplied by the conventional power generations is reduced to , given by Equations (5) and (6).
and are the total wind and conventional generation at hour , respectively. and are the surplus wind and conventional generation at hour , respectively.
This paper considers the following three operating strategies in the wind farm–BESS operational model:
- Strategy 1:
- This strategy depicts a situation where the BESS is operated by the power system operator, as it is often the case. Wind power integration level is limited to of the total load demand. Whenever surplus wind generation is registered, excess wind power is stored in the BESS. Power supply from the conventional generators is used to support the wind farm whenever wind power generation is less than its power commitment. The BESS can be used to support both the power supply of wind farms and conventional generators. On the basis of the description, the state-of-charge of the BESS in the next hour is
- Strategy 2:
- With large wind power integration, the BESS is more suitable to be operated and managed by wind farm owners; this strategy depicts this situation. The benefits of BESS are dedicated to wind farm owners only, and the wind farm operation is not affected by conventional generators. This situation means that the stored excess wind energy in the BESS can only be used to help wind farms meet the commitment of load demands, and load demands will be curtailed if the storage in the BESS is insufficient. The wind power integration level is also limited to only of the total load demand. On the basis of the description, the state-of-charge of the BESS in the next hour is
- Strategy 3:
- This strategy is built on top of strategy 2. The difference is that the stored energy in the BESS can be used to serve load demands provided that surplus wind generation exists and the total power supply is inadequate to match load demands. On the basis of the description, the state-of-charge of the BESS in the next hour is
The minimum charge of BESS is assumed to be 20% of its rated capacity and its maximum charge is 5% of the total load demand. The BESS adopts a simple linear charging and discharging cycle over five hours, which is calculated as the average of the difference between the maximum and minimum charges of the BESS over five hours.
6. Results and Analyses
In this section, the effects of wind farm penetration and the integration of BESS and DR on the adequacy of the generating system are assessed. The assessments are divided into three parts. The first part considers three variations of the DR model, various penetration levels of wind energy, and the BESS operation model. Collectively, this study is known as ‘first screening’. The second and third parts investigate the effects of the BESS charging rate and capacity, respectively.
6.1. First Screening
The penetration levels of wind energy in this part are restricted to 5%, 10%, and 15% of the total load demand. The rest of the loads are supplied by conventional generators. The DR model presented in Section 3 is applied to the original IEEE RTN load curve. The percentages of peak load clipping explored in the DR model are 70%, 80%, and 90%. The three strategies of the BESS operational model in Section 5 are also considered. The impacts of all the possible combinations of the elements on the adequacy of the generating system are assessed using the SMC simulation according to the process depicted in Figure 1. The results are shown in Figure 2.
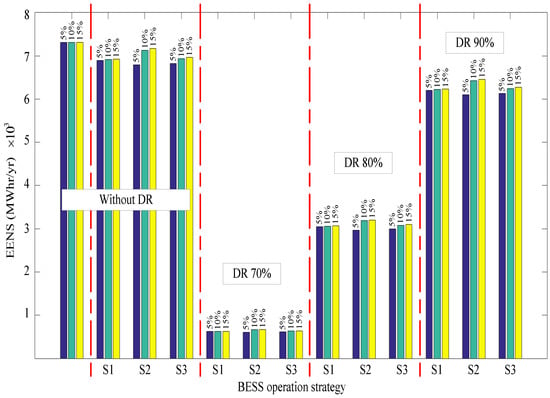
Figure 2.
Effects of demand response (DR) model, wind energy penetration levels and the battery energy storage system (BESS) operation model.
The figure shows four groups of studies. The first group maintains the original load curve in all wind power penetration levels. This group is further divided into two subgroups: the minority group, which was studied without integrating the BESS, and the majority group with BESS. Strategies 1 to 3 of the BESS policy are indicated with ‘S1’, ‘S2’, and ‘S3’, respectively. The wind penetration level is indicated by ‘5%’, ‘10%’, and ‘15%’ at the top of each bar. The second group, known as ‘DR 70%’, is the same as the first group except the original load curve was modified by sharing load demand that is above 70% of the peak load among all the valleys. The third and final groups are similar but with 80% and 90% peak clipping when applying the DR model.
The results from the first group demonstrate that the presence of the BESS improves the adequacy of the generating system regardless of the wind penetration levels or the strategy of the BESS policy used, although this improvement was not substantial. A significant reduction in the EENS values is observed only when the DR is implemented as shown by the DR 70% group, but the values increase as the study transitions to DR 80% and DR 90% groups. This observation proves that reducing peak loads through load levelling has significant implications towards the adequacy of power supply, during which the generating system is less strained and more generators can be taken out of service without affecting the ability to meet load demand. Hence, the DR program can maintain the flattest load curve; DR 70% recorded the lowest level of EENS. However, the DR program has various challenges, ranging from the distribution of a large number of smart meters, to the need to persuade consumers to participate in the DR program, and to the technological readiness of power system operators to implement DR. Such issues need to be overcome before the DR program can be fully implemented [8].
Regardless of the BESS operation strategy and penetration levels of wind energy, the DR 70% group consistently recorded the lowest EENS. The results will be investigated further in subsequent sections. The enlarged view of the DR 70% group is shown in Figure 3.
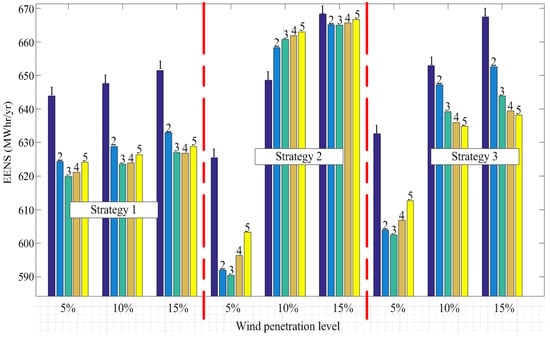
Figure 3.
Effects of the BESS charging rate (DR 70% load curve).
6.2. Effects of the BESS Charging Rate
In the previous section, the BESS adopts the five-hour linear charging and discharging cycle. In this section, the charging cycle is varied and its effects on the adequacy of power supply are investigated. The study also focuses only on the DR 70% group due to its overwhelmingly good reliability (Figure 2). The charging cycle explored in this section varies from one hour to five hours. Wind penetration levels of 5%, 10%, and 15% of peak load are also considered. The results are shown in Figure 3. The figure shows that the study is grouped based on the BESS operating policy strategy. In all the three strategies, five different charging cycles are considered for all the wind penetration levels. The charging cycles are labelled with ‘1’ to ‘5’ on each bar, indicating the number of hours of the linear charging and discharging cycle. The five-hour scenario obtains the same results as those shown in Figure 2.
The results in Figure 3 show that, when the wind penetration level is at the lowest (−5% of the peak load) and when similar charging and discharging cycles are compared, strategy 2 of the BESS operating policy has the lowest EENS values. For example, the EENS value of the one-hour charging cycle in strategy 2 is the lowest among the other two one-hour charging cycles in strategies 1 and 3. The same observations are noted for the other charging cycles. The greater adequacy of the generating system given by strategy 2 is not due to it being more robust than the other strategies. Rather, it is due to the low wind power penetration level, and during this time, the majority of the load is supplied by conventional generators that have more dispatch flexibility. Hence, the EENS values are among the lowest due to the high reliability of the conventional generators but not due to the operating strategy of the BESS.
This argument is justified by the results when the wind penetration level increases further to 10% and 15%. In these two conditions, strategy 2 for most of the considered charging and discharging cycles (except for the one-hour charging cycle at 10% wind power penetration level) has the highest EENS values among all the strategies. In these two levels of wind penetration as well, strategy 1 has the lowest EENS values when similar charging and discharging cycles are compared. The reason for this result is that this strategy is more flexible, with the stored energy being used to supplement both the wind turbine and conventional generators, thereby leading to greater overall power supply in the long term. Moreover, other generators can be dispatched to aid wind farms that are unable to meet their committed load demand. By contrast, the second and third strategies are more restrictive, especially the second strategy. Strategy 2 benefits only the wind farm, and strategy 3 restricts the power aid received by the wind farm from only the BESS.
6.3. Effects of the BESS Capacity
In this section, the effects of BESS capacity on the adequacy of generating system are investigated. Similar to Section 6.2, the investigation is only applied to the DR 70% group for the same reason mentioned previously. All three BESS operating policy strategies and wind penetration levels are considered. All the previous studies were performed by limiting the capacity of the BESS to 5% of the total load demand. In this study, this value is varied from 5% to 20% with a step-wise increment of 5%. The original five-hour BESS charging and discharging cycle is maintained. The results are shown in Figure 4.
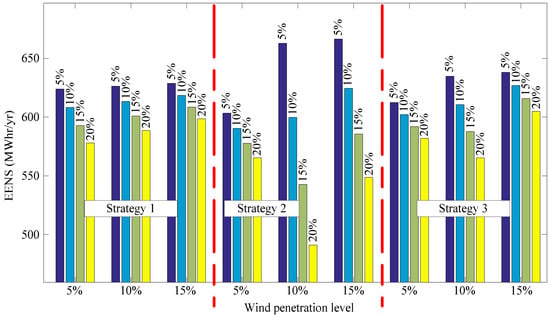
Figure 4.
Effects of the BESS capacity (DR 70% load curve).
Across the board in all the three BESS strategies, as the capacity of BESS increases, the EENS values drops, thereby signifying improvements in the adequacy of the generating system. The reduction in the EENS values is most obvious during the 10% and 15% wind penetration levels in the strategy 2 group. This result occurs because this strategy of BESS operating policy is the least flexible. Hence, the increased BESS capacity significantly affects the adequacy of power supply. The BESS operating under this strategy can only interact with wind turbine generators, and the conventional generators cannot be used to supplement the shortage of wind power. Thus, the BESS with a higher capacity provides the much-needed power relief in this strategy than in either strategy 1 or 3. Given the more robust policy in strategies 1 and 3, the increment in the BESS capacity has less effect on the adequacy of the generating system. Strategy 1 is more robust that strategy 3, as indicated by the overall lower EENS values in the former strategy.
7. Conclusions
This paper showed that the combination of the DR and BESS can improve the adequacy of generating systems significantly, because DR reduces peak load and BESS smoothens fluctuating wind power. The SMC simulation method was implemented to capture the chronological elements of the adequacy assessment on the considered generating system, which includes wind power, BESS, and DR model. An operation model of the BESS was described and included in the adequacy assessments throughout the paper. The BESS operation model consists of three different practical strategies of operation, and their impacts on the adequacy of the considered generating system were assessed. The proposed BESS model takes into account charging and discharging rates, as well as battery capacity, which are important components for influencing the reliability of the generating systems.
The DR model in this paper considers peak clipping at 70%, 80%, and 90% of the peak load. All loads were combined with all three strategies of the BESS operation model together with 5%, 10%, and 15% of wind penetration levels. Results show that the BESS effectively improves the adequacy of the generating system when it is combined with the DR model, especially DR 70%. As the threshold for peak clipping increases to 80% and 90% of the peak load, the reliability begins to deteriorate as the load curve begins to have more fluctuations. This finding shows that load levelling takes away much of the demand on the generation capacity. Moreover, the frequency for ramping generations is reduced when load demand is mostly maintained at lower levels. The application of the BESS alone is able to mitigate some load curtailment but is not as effective as when it is combined with DR. The reason for this result is that the capacity of the BESS is relatively much lower than the load demand. Hence, its contribution to the power supply during times of low wind power is mostly limited by its own capacity. More developments for expanding the capacity and responses of the BESS will mitigate this issue.
The results also demonstrate that the strategy by which the BESS is operated has a significant impact on the adequacy of the generation system. Through varying the charging and discharging cycle of the BESS, strategy 2 largely undermines the contribution of the BESS to the power supply pool due to its restrictive nature: a wind farm can only receive power aid from the BESS and not from other generators. The results also prove that strategy 1 of the BESS policy is the most robust; wind farms can receive contributions from both the BESS and conventional generators.
Finally, results show that the reliability of the generating system integrated with wind power will improve substantially if the capacity of the BESS is increased. The reliability benefits of increasing the capacity of the BESS are most profound in strategy 2 due to its stringent operating criteria: energy storage can interact with wind turbine generators only. Although a higher capacity BESS improves the adequacy of power supply for strategies 1 and 3, the reduction in EENS of the two strategies is less than that of strategy 2 due to their already more robust operating policy, leaving less room for reliability enhancement.
Funding
This research received no external funding.
Acknowledgments
This work is partly supported by the USM External grant 304/PELECT/6050385.
Conflicts of Interest
The author declares no conflicts of interest.
References
- Mohamad, F.; Teh, J. Impacts of Energy Storage System on Power System Reliability: A Systematic Review. Energies 2018, 11, 1749. [Google Scholar] [CrossRef]
- Mohamad, F.; Teh, J.; Lai, C.-M.; Chen, L.-R. Development of Energy Storage Systems for Power Network Reliability: A Review. Energies 2018, 11, 2278. [Google Scholar] [CrossRef]
- Zhou, Y.; Mancarella, P.; Mutale, J. Framework for capacity credit assessment of electrical energy storage and demand response. IET Gener. Transm. Distrib. 2016, 10, 2267–2276. [Google Scholar] [CrossRef]
- Wang, P.; Gao, Z.; Bertling, L. Operational Adequacy Studies of Power Systems With Wind Farms and Energy Storages. IEEE Trans. Power Syst. 2012, 27, 2377–2384. [Google Scholar] [CrossRef]
- Xu, Y.; Singh, C. Adequacy and Economy Analysis of Distribution Systems Integrated With Electric Energy Storage and Renewable Energy Resources. IEEE Trans. Power Syst. 2012, 27, 2332–2341. [Google Scholar] [CrossRef]
- Huang, D.; Billinton, R. Effects of Load Sector Demand Side Management Applications in Generating Capacity Adequacy Assessment. IEEE Trans. Power Syst. 2012, 27, 335–343. [Google Scholar] [CrossRef]
- Teh, J.; Ooi, C.A.; Cheng, Y.H.; Zainuri, M.; Lai, C.M. Composite Reliability Evaluation of Load Demand Side Management and Dynamic Thermal Rating Systems. Energies 2018, 11, 466. [Google Scholar] [CrossRef]
- Jabir, H.; Teh, J.; Ishak, D.; Abunima, H. Impacts of Demand-Side Management on Electrical Power Systems: A Review. Energies 2018, 11, 1050. [Google Scholar] [CrossRef]
- Jabir, H.; Teh, J.; Ishak, D.; Abunima, H. Impact of Demand-Side Management on the Reliability of Generation Systems. Energies 2018, 11, 2155. [Google Scholar] [CrossRef]
- Kirschen, D.S. Demand-side view of electricity markets. IEEE Trans. Power Syst. 2003, 18, 520–527. [Google Scholar] [CrossRef]
- Good, N.; Karangelos, E.; Navarro-Espinosa, A.; Mancarella, P. Optimization Under Uncertainty of Thermal Storage-Based Flexible Demand Response With Quantification of Residential Users’ Discomfort. IEEE Trans. Smart Grid 2015, 6, 2333–2342. [Google Scholar] [CrossRef]
- Good, N.; Zhang, L.; Navarro-Espinosa, A.; Mancarella, P. High resolution modelling of multi-energy domestic demand profiles. Appl. Energy 2015, 137, 193–210. [Google Scholar] [CrossRef]
- Papadaskalopoulos, D.; Strbac, G.; Mancarella, P.; Aunedi, M.; Stanojevic, V. Decentralized Participation of Flexible Demand in Electricity Markets—Part II: Application With Electric Vehicles and Heat Pump Systems. IEEE Trans. Power Syst. 2013, 28, 3667–3674. [Google Scholar] [CrossRef]
- Corbett, J.; Wardle, K.; Chen, C. Toward a Sustainable Modern Electricity Grid: The Effects of Smart Metering and Program Investments on Demand-Side Management Performance in the US Electricity Sector 2009–2012. IEEE Trans. Eng. Manag. 2018, 65, 252–263. [Google Scholar] [CrossRef]
- Hadjipaschalis, I.; Poullikkas, A.; Efthimiou, V. Overview of current and future energy storage technologies for electric power applications. Renew. Sustain. Energy Rev. 2009, 13, 1513–1522. [Google Scholar] [CrossRef]
- DOE Global Energy Storage Database. Available online: https://www.energystorageexchange.org/ (accessed on 2 September 2018).
- Tesla Website. Panasonic and Tesla Sign Agreement for the Gigafactory. Available online: https://www.tesla.com/blog/panasonic-and-tesla-sign-agreement-gigafactory (accessed on 2 September 2018).
- Grigg, C.; Wong, P.; Albrecht, P.; Allan, R.; Bhavaraju, M.; Billinton, R.; Chen, Q.; Fong, C.; Haddad, S.; Kuruganty, S.; et al. The IEEE Reliability Test System-1996. A report prepared by the Reliability Test System Task Force of the Application of Probability Methods Subcommittee. IEEE Trans. Power Syst. 1999, 14, 1010–1020. [Google Scholar] [CrossRef]
- Li, W. Risk Assessment of Power System; IEEE-Wiley: Hoboken, NJ, USA, 2005. [Google Scholar]
- Billinton, R.; Li, W. Reliability Assessment of Electrical Power Systems Using Monte Carlo Methods; Plenum: London, UK, 1994. [Google Scholar]
- Billinton, R.; Allan, R.N. Reliability Evaluation of Engineering Systems: Concepts and Techniques; Longman Scientific & Technical: New York, NY, USA, 1987. [Google Scholar]
- Fotuhi-Firuzabad, M.; Billinton, R. Impact of load management on composite system reliability evaluation short-term operating benefits. IEEE Trans. Power Syst. 2000, 15, 858–864. [Google Scholar] [CrossRef]
- Box, G.E.P.; Jenkins, G.M.; Reinsel, G.C.; Ljung, G.M. Time Series Analysis: Forecasting and Control, 5th ed.; Wiley: Hoboken, NJ, USA, 2015. [Google Scholar]
- Billinton, R.; Chen, H.; Ghajar, R. Time-series models for reliability evaluation of power systems including wind energy. Microelectron. Reliab. 1996, 36, 1253–1261. [Google Scholar] [CrossRef]
- British Atmospheric Data Center (BADC). Available online: http://badc.nerc.ac.uk/home/ (accessed on 2 September 2018).
- Teh, J.; Cotton, I. Reliability Impact of Dynamic Thermal Rating System in Wind Power Integrated Network. IEEE Trans. Reliab. 2016, 65, 1081–1089. [Google Scholar] [CrossRef]
- Billinton, R. Incorporating well-being considerations in generating systems using energy storage. IEEE Trans. Energy Convers. 2005, 20, 225–230. [Google Scholar]
- Poullikkas, A. A comparative overview of large-scale battery systems for electricity storage. Renew. Sustain. Energy Rev. 2013, 27, 778–788. [Google Scholar] [CrossRef]
© 2018 by the author. Licensee MDPI, Basel, Switzerland. This article is an open access article distributed under the terms and conditions of the Creative Commons Attribution (CC BY) license (http://creativecommons.org/licenses/by/4.0/).