Article

Impacts of the Base-Level Cycle on Pore Structure of Mouth Bar Sand Bars: A Case Study of the Paleogene Kongdian Formation, Bohai Bay Basin, China

1
State Key Laboratory of Petroleum Resource and Prospecting-Beijing, Beijing 102249, China
2
College of Geosciences, China University of Petroleum-Beijing, Beijing 102249, China
3
CNPC Da Gang Oilfield, Tianjin 061100, China
*
Author to whom correspondence should be addressed.
Energies 2018, 11(10), 2617; https://doi.org/10.3390/en11102617
Submission received: 23 August 2018 / Revised: 18 September 2018 / Accepted: 29 September 2018 / Published: 1 October 2018

Abstract

:
The pore structure of rocks can affect fluid migration and the remaining hydrocarbon distribution. To understand the impacts of the base-level cycle on the pore structure of mouth bar sand bodies in a continental rift lacustrine basin, the pore structure of the mouth bar sand bodies in the ZVC (ZV4 + ZV5) of the Guan195 area was studied using pressure-controlled mercury injection (PMI), casting sheet image and scanning electron microscopy (SEM). The results show that three types of pores exist in ZVC, including intergranular pores, dissolution pores, and micro fractures. The porosity is generally between 1.57% and 44.6%, with a mean value of 19.05%. The permeability is between 0.06 μm2 and 3611 μm2, with a mean value of 137.56 μm2. The pore structure heterogeneity of a single mouth bar sand body in the early stage of the falling period of short-term base-level is stronger than that in the late stage. During the falling process of the middle-term base level, the pore structure heterogeneity of a late single mouth bar sand body is weaker than that of an early single mouth bar sand body. In the long-term base-level cycle, the pore structure heterogeneity of mouth bar sand bodies becomes weaker with the falling of the base-level.

1. Introduction

Pore structure refers to the shape, size, distribution and the connective relationship of pores and pore throats [1,2]. Pore structure is an important factor controlling the porosity and permeability of rock, and hence the potential of remaining oil and gas recovery [3,4,5]. Investigations of the factors controlling pore structure are critical to the exploration and development of an oil field [6,7,8,9,10]. Many scholars have conducted extensive research work from different perspectives, using various methods such as rate-controlled mercury injection testing [11,12,13], pressure-controlled mercury injection (PMI) testing [14,15,16], scanning electron microscopy (SEM) [17,18,19,20,21] and multiscale computed tomography (CT) imaging technology [22,23,24].
The pore structure of the reservoir is not only controlled by tectonic movement and diagenesis but also by the influence of sedimentary factors (e.g., Ju et al. [25], Tang et al. [26], Wang et al. [27], Wang et al. [28]). The controlling effects of sedimentation on reservoir characteristics are mainly reflected by the changes of the base level. The influence of base level cycle on the reservoir characteristics can be divided into autocycles and allocycles [29]. Autocycles refer to the sedimentary cycles formed by the change of the internal factors of the basin under the condition of a relatively stable sedimentary background. Allocycles refer to the sedimentary cycles formed by the change of the source supply conditions, the tectonic movement of the ocean floor or eustatic sea level change. Short-term base-level cycles (SSC) is the minimal genetic stratigraphic unit and is also the basis for high-resolution sequence stratigraphy, which can be identified in outcrop, core and well logging curve data [30,31]. Middle-term base-level cycles (MSC) correspond to multiple mouth bar sand bodies in this study. Such factors as stratum erosion surface and regional deposition scour surface are taken as the basis upon which to divide the long-term base-level cycle (LSC), which is equivalent to three order sequence stratigraphic units [32]. Miall commented that the base level cycle process determines the rock types, lithological characteristics, geometric shape and spatial continuity of reservoir rock, and controls pore structure, size, arrangement, and sorting of detritus [33].
The pore structure of rock can be obtained from mercury injection testing, which is one of the most common methods [12,34,35,36,37]. Toledo et al. [38] investigated pore-space statistics based on capillary pressure curves. Zhao et al. [39] explored the pore structure of tight oil reservoirs using pressure-controlled porosimetry. Xi et al. [12] studied the influence of pore size distribution on the oiliness and the porosity and permeability of tight sandstones based on PMI. Wang et al. [5] calculated the fractal dimension of the pore structure using the combination of PMI and rate-controlled mercury injection.
Many studies were devoted to the controlling effect of base level cycles on macroscopic characteristics of reservoirs [40,41]. However, very few studies have focused on the effect of base level cycles on the pore structure of a reservoir [42]. This study took mouth bar sand bodies of Guan195 area as an example, investigated the effects of different levels of base level cycles on the pore structure.

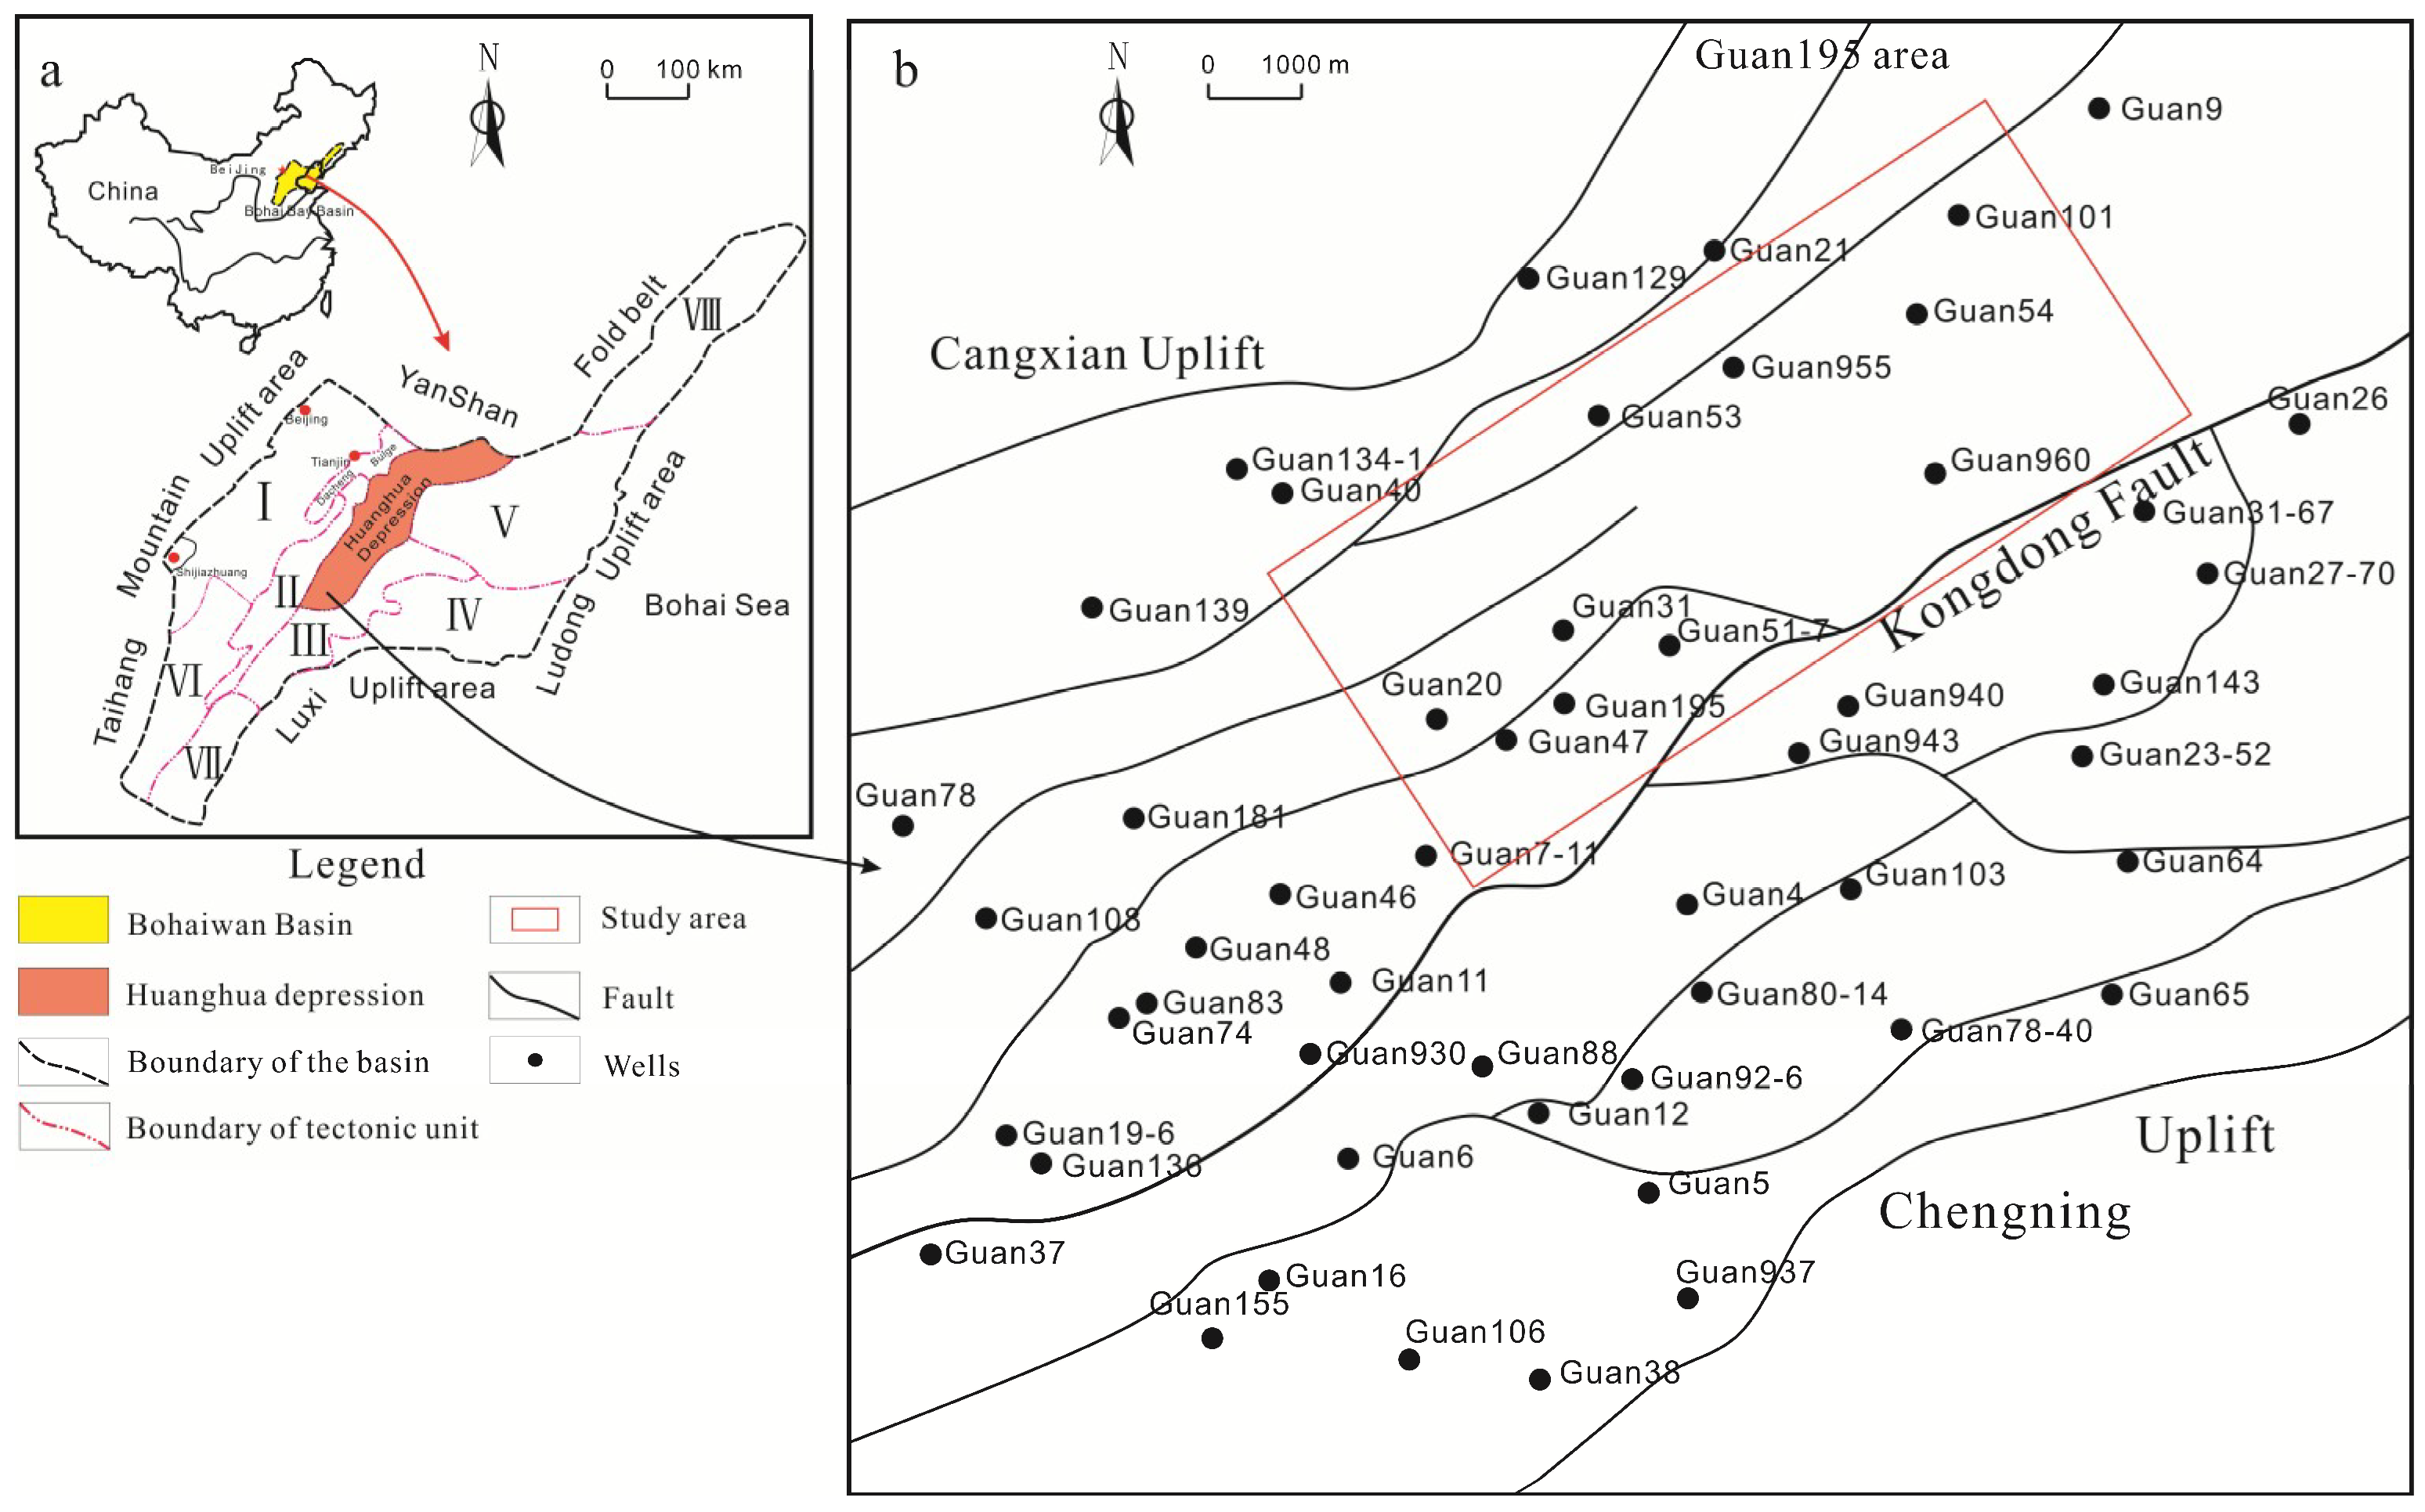
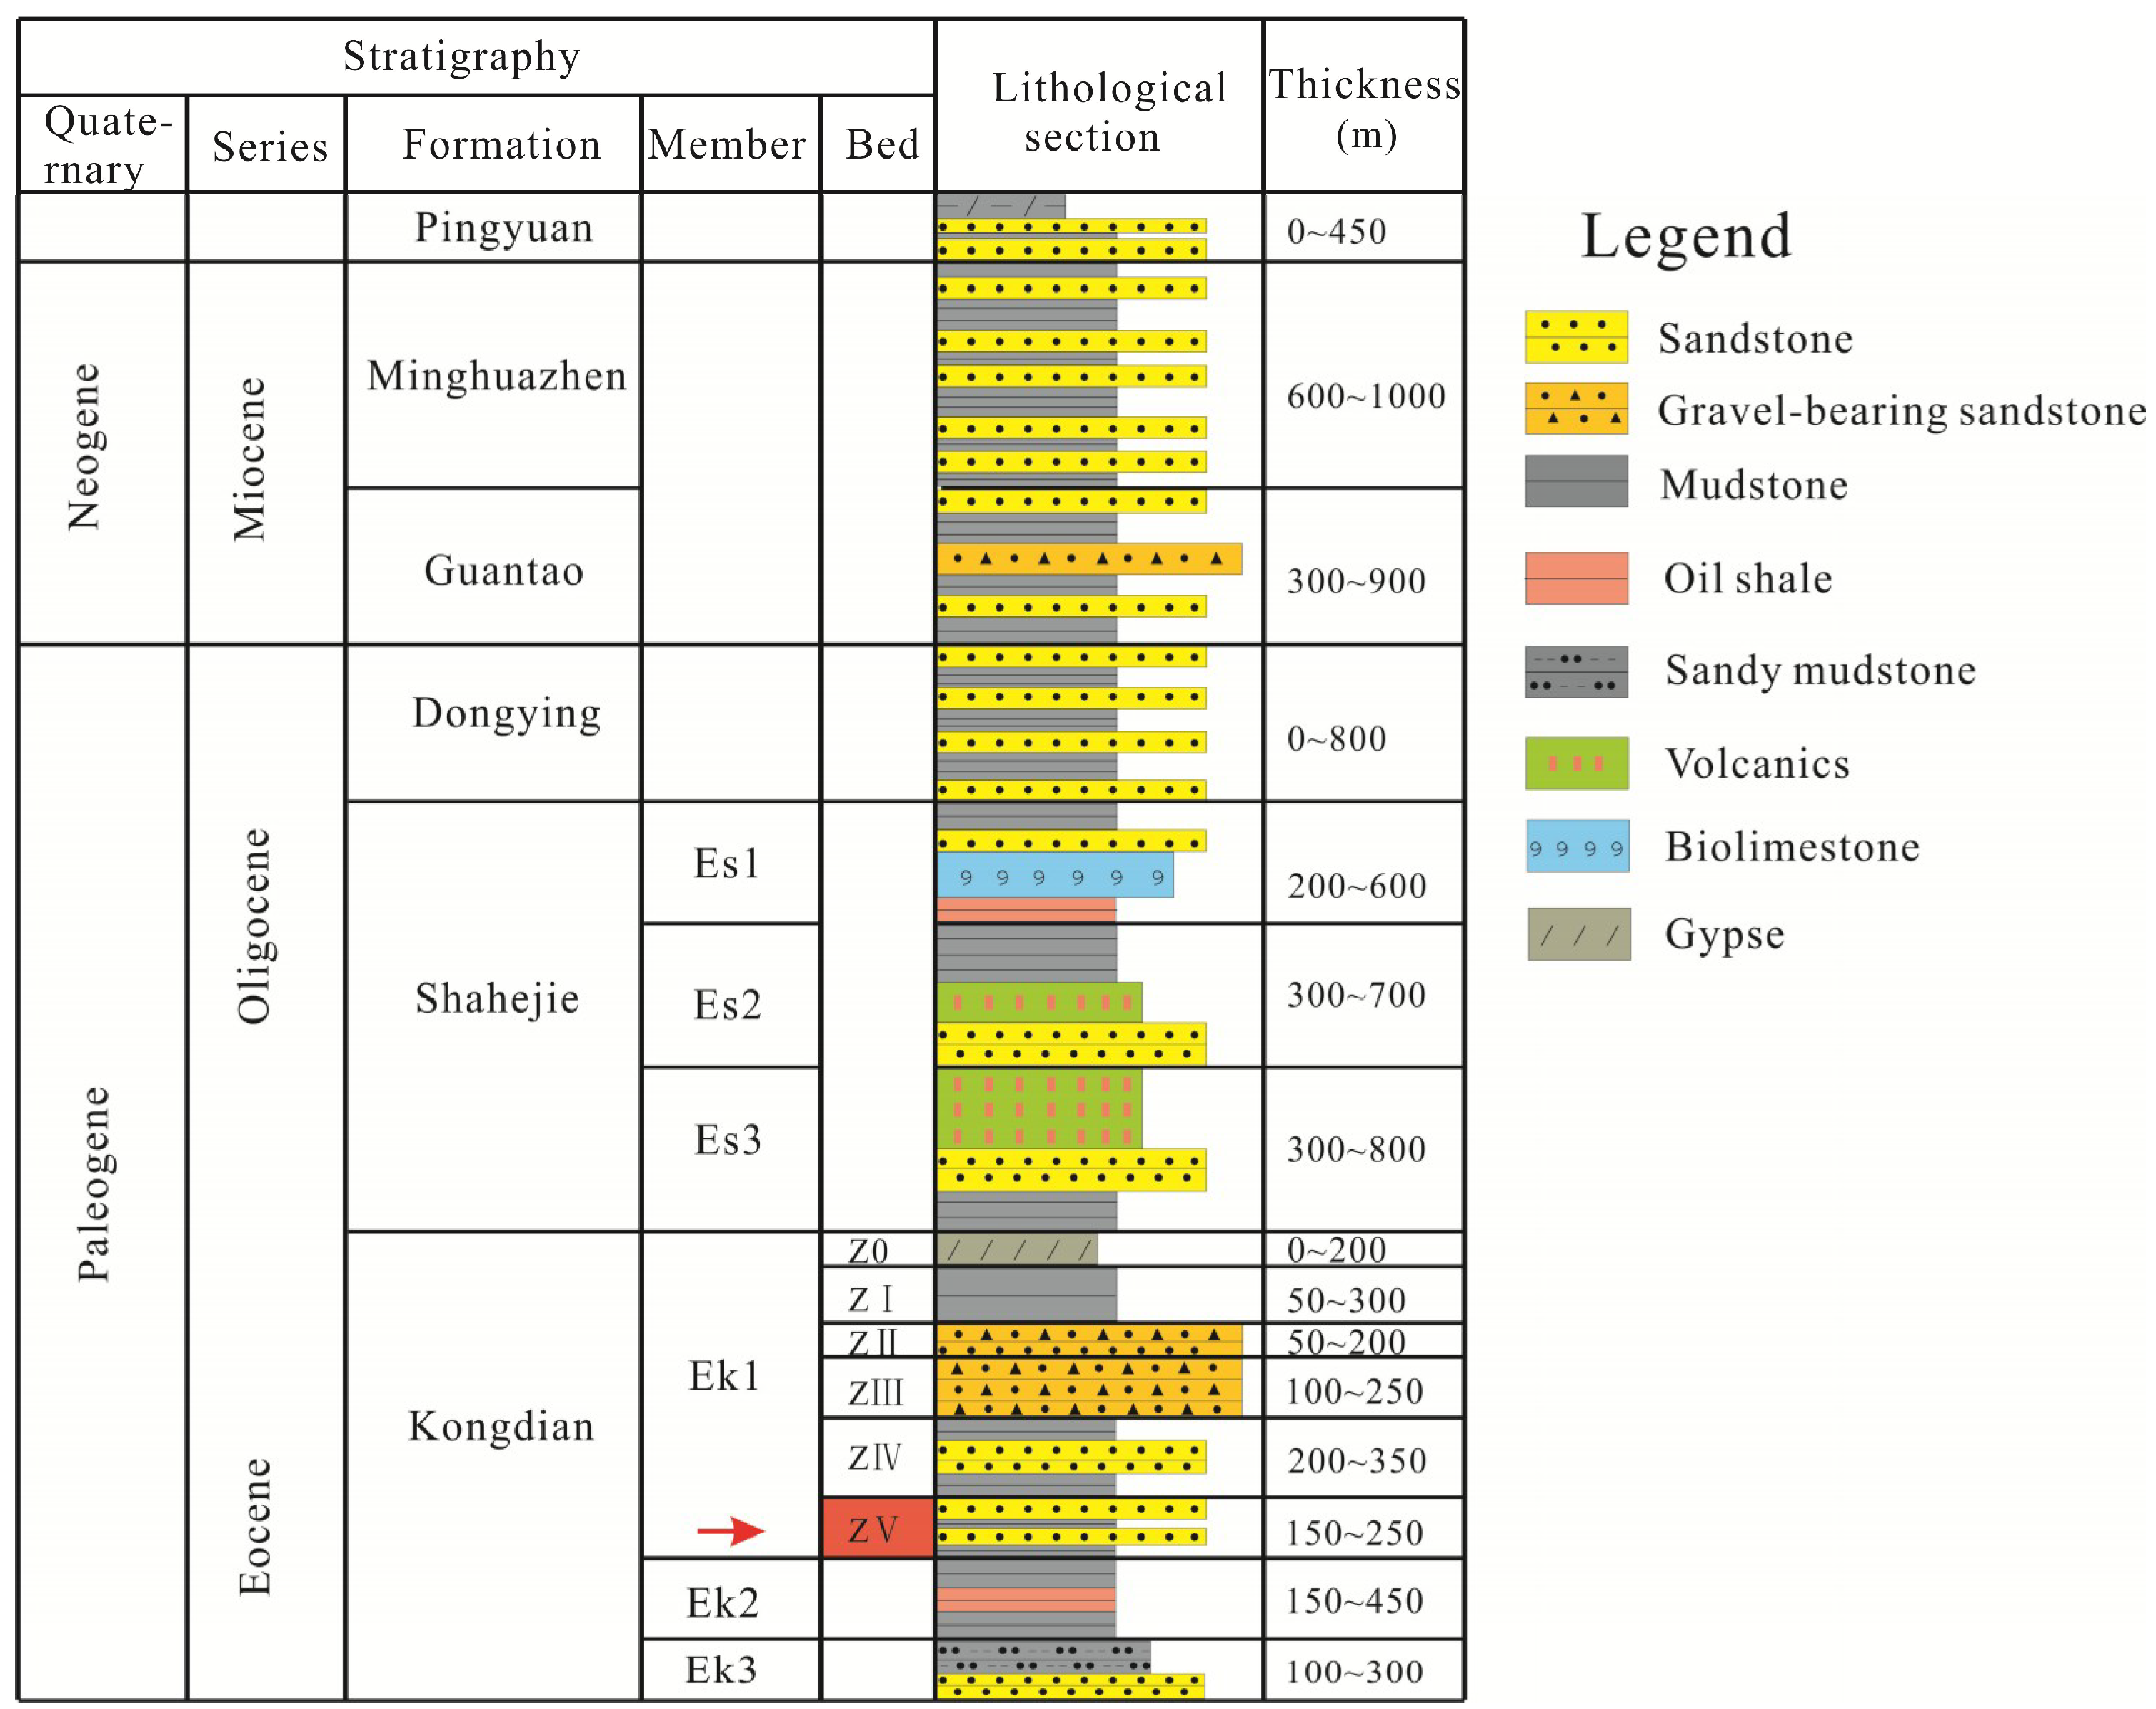
2. Geological Setting

The Bohai Bay Basin, located in eastern China, has an area of approximately 1.7 × 10⁴ km2 (Figure 1a), in which there are nine first class tectonic zones (Figure 1a). The Wang guantun oilfield, located in the Huanghua depression, is one of the most important oil-gas production areas. More than 1700 wells have been drilled in Wang guantun oilfield. Wang guantun oilfield is divided into two main tectonic zones by Kongdong fault, and some secondary faults make the structure of the oilfield more complicated (Figure 1b). Sediments comprise the Paleogene Kongdian (Ek), Shahejie (Es), Dongying (Ed) formations, the Neogene Guantao (Ng), Minghuazhen (Nm) Formations, the Quaternary Pingyuan (Q) formations (Figure 2). Oil shale of Ek2 (the second member of the Kongdian Formation) is the main source rock and oil-gas has migrated into suitable trap locations of Ek1 along connecting faults [43,44].
The studied interval is the six segments (ZV) in Ek1 (the first member of the Kongdian Formation); the ZV can be divided into seven layers (from ZV1 to ZV7). This research is focused on ZV4 and ZV5, called the ZVC (Figure 2). The ZVC is 40–80 m thick and mainly includes light gray fine sandstone, silty sandstone and mudstone (Figure 2). The reservoir sand body is mainly quartz sandstone, and the cementation type is mainly cement and calcareous cementation. The reservoir is characterized by high component maturity and relatively high textural maturity, and the particles are mainly characterized by point contact and point line contact; the sediment was mainly in the early diagenetic stage. The buried depth of the ZVC in this area and the spans of the buried depth are small (1820 m–1900 m), so diagenesis had a limited effect on reservoir characteristics. Therefore, the macroscopic and microscopic characteristics of the reservoir were mainly controlled by sedimentation [45]. Sediments including delta plain subfacies, delta front subfacies and front delta subfacies are deposited in the ZV in the study area with stronger water energy [46], where many mouth bar sand bodies are deposited in the horizontal and vertical, and mouth bar sand bodies are of cardinal significance for reservoir rock.

3. Data and Experimental Method

The EK1 member of the Wang guantun oilfield is one of the most oil-gas production members; there are more than 1700 wells, including vertical wells and inclined wells, have been drilled through the member. Among the wells, there are about 220 core wells, and consequently, the data necessary for this research are available, such as core, wireline-log, mud logging, oil test, and mercury injection data. Reservoir porosity and permeability of 4547 data points were collected from Dagang Oilfield, China National Petroleum Corporation (CNPC) (Beijing, China). 744 mercury injection testing data were tested in Research Institute of Petroleum Exploration & Development, Dagang Oilfield, CNPC.
One of the most commonly used methods to characterize pore structure characteristics is PMI testing. To obtain multifarious microscopic parameters, mercury, a non-wetting phase fluid, is forced into all the effective space and mercury intake volume is measured by a mercury porosimeter [47]. The pressure gradually increased to the highest value and slowly decreased thereafter, and the mercury extruded from the samples. Thus, test curves and different characterization parameters, including maximum pore-throat radius (Rmax), average pore-throat radius (Rave), residual injection saturation (Sr), maximum mercury injection saturation (Smax), sorting coefficient of pore throat, coefficient of variation of pore throat, homogeneity coefficient, characteristic structure coefficient, lithology coefficient, etc. were obtained according to the amount of mercury and the corresponding pressure.

4. Geological and Laboratory Modelling

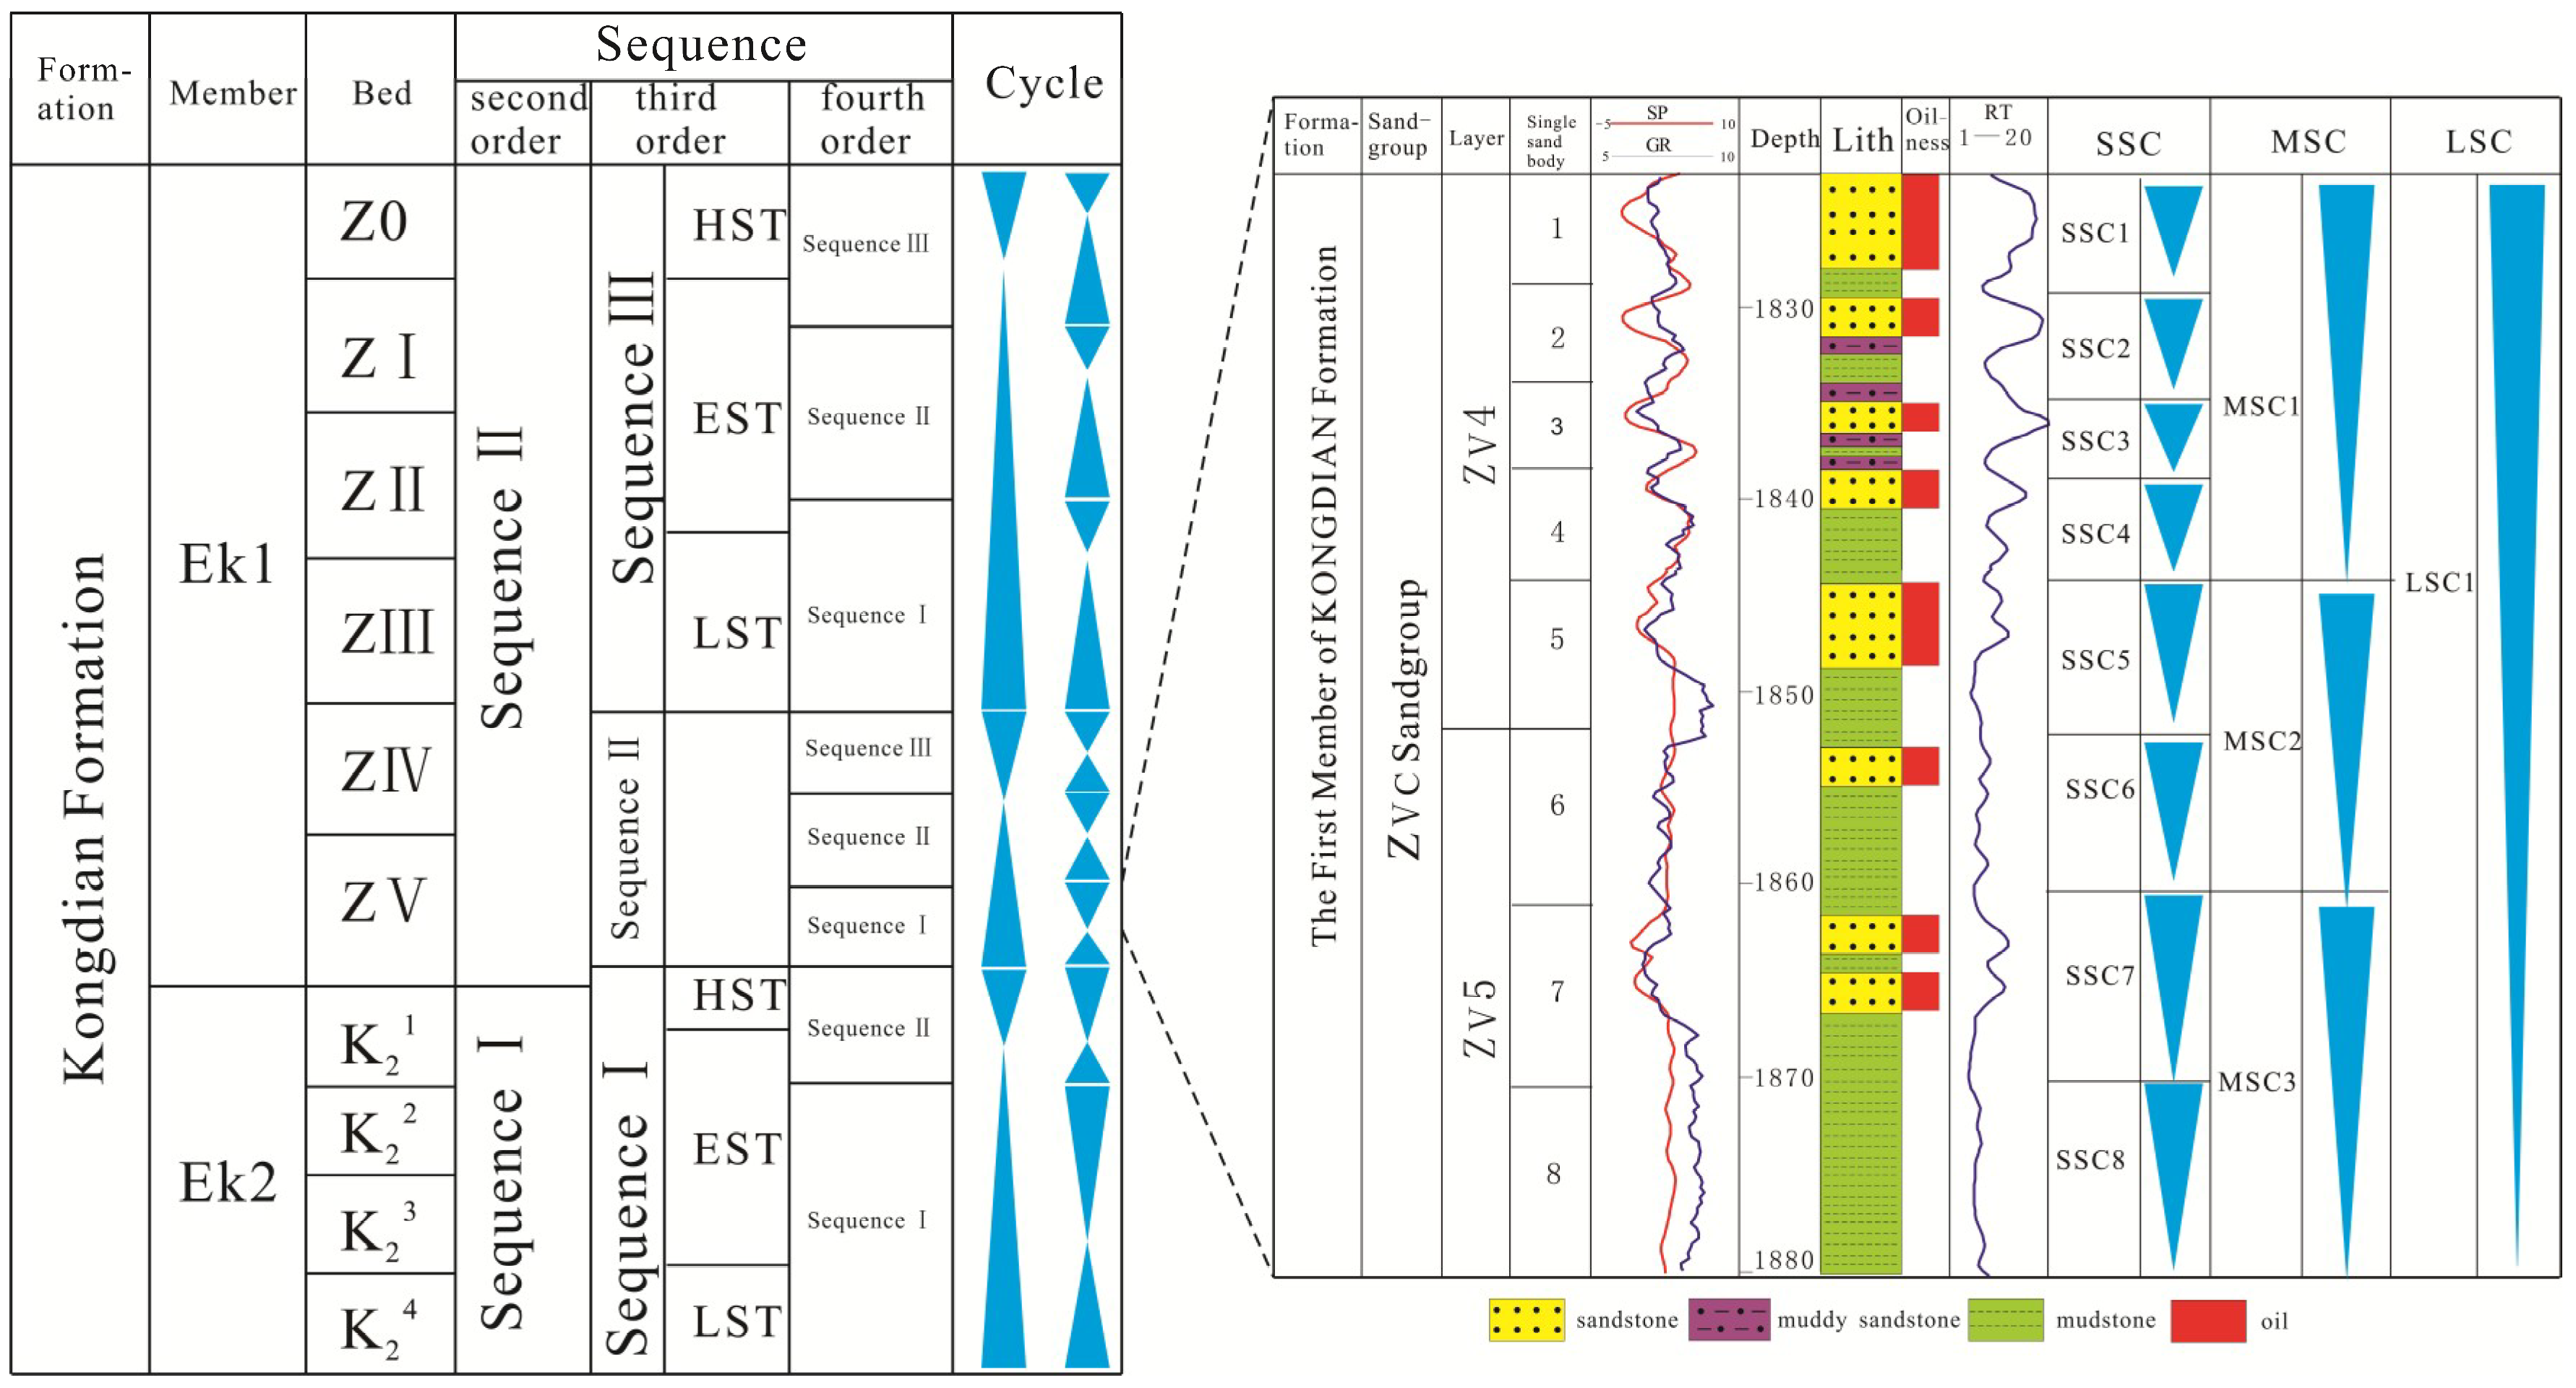
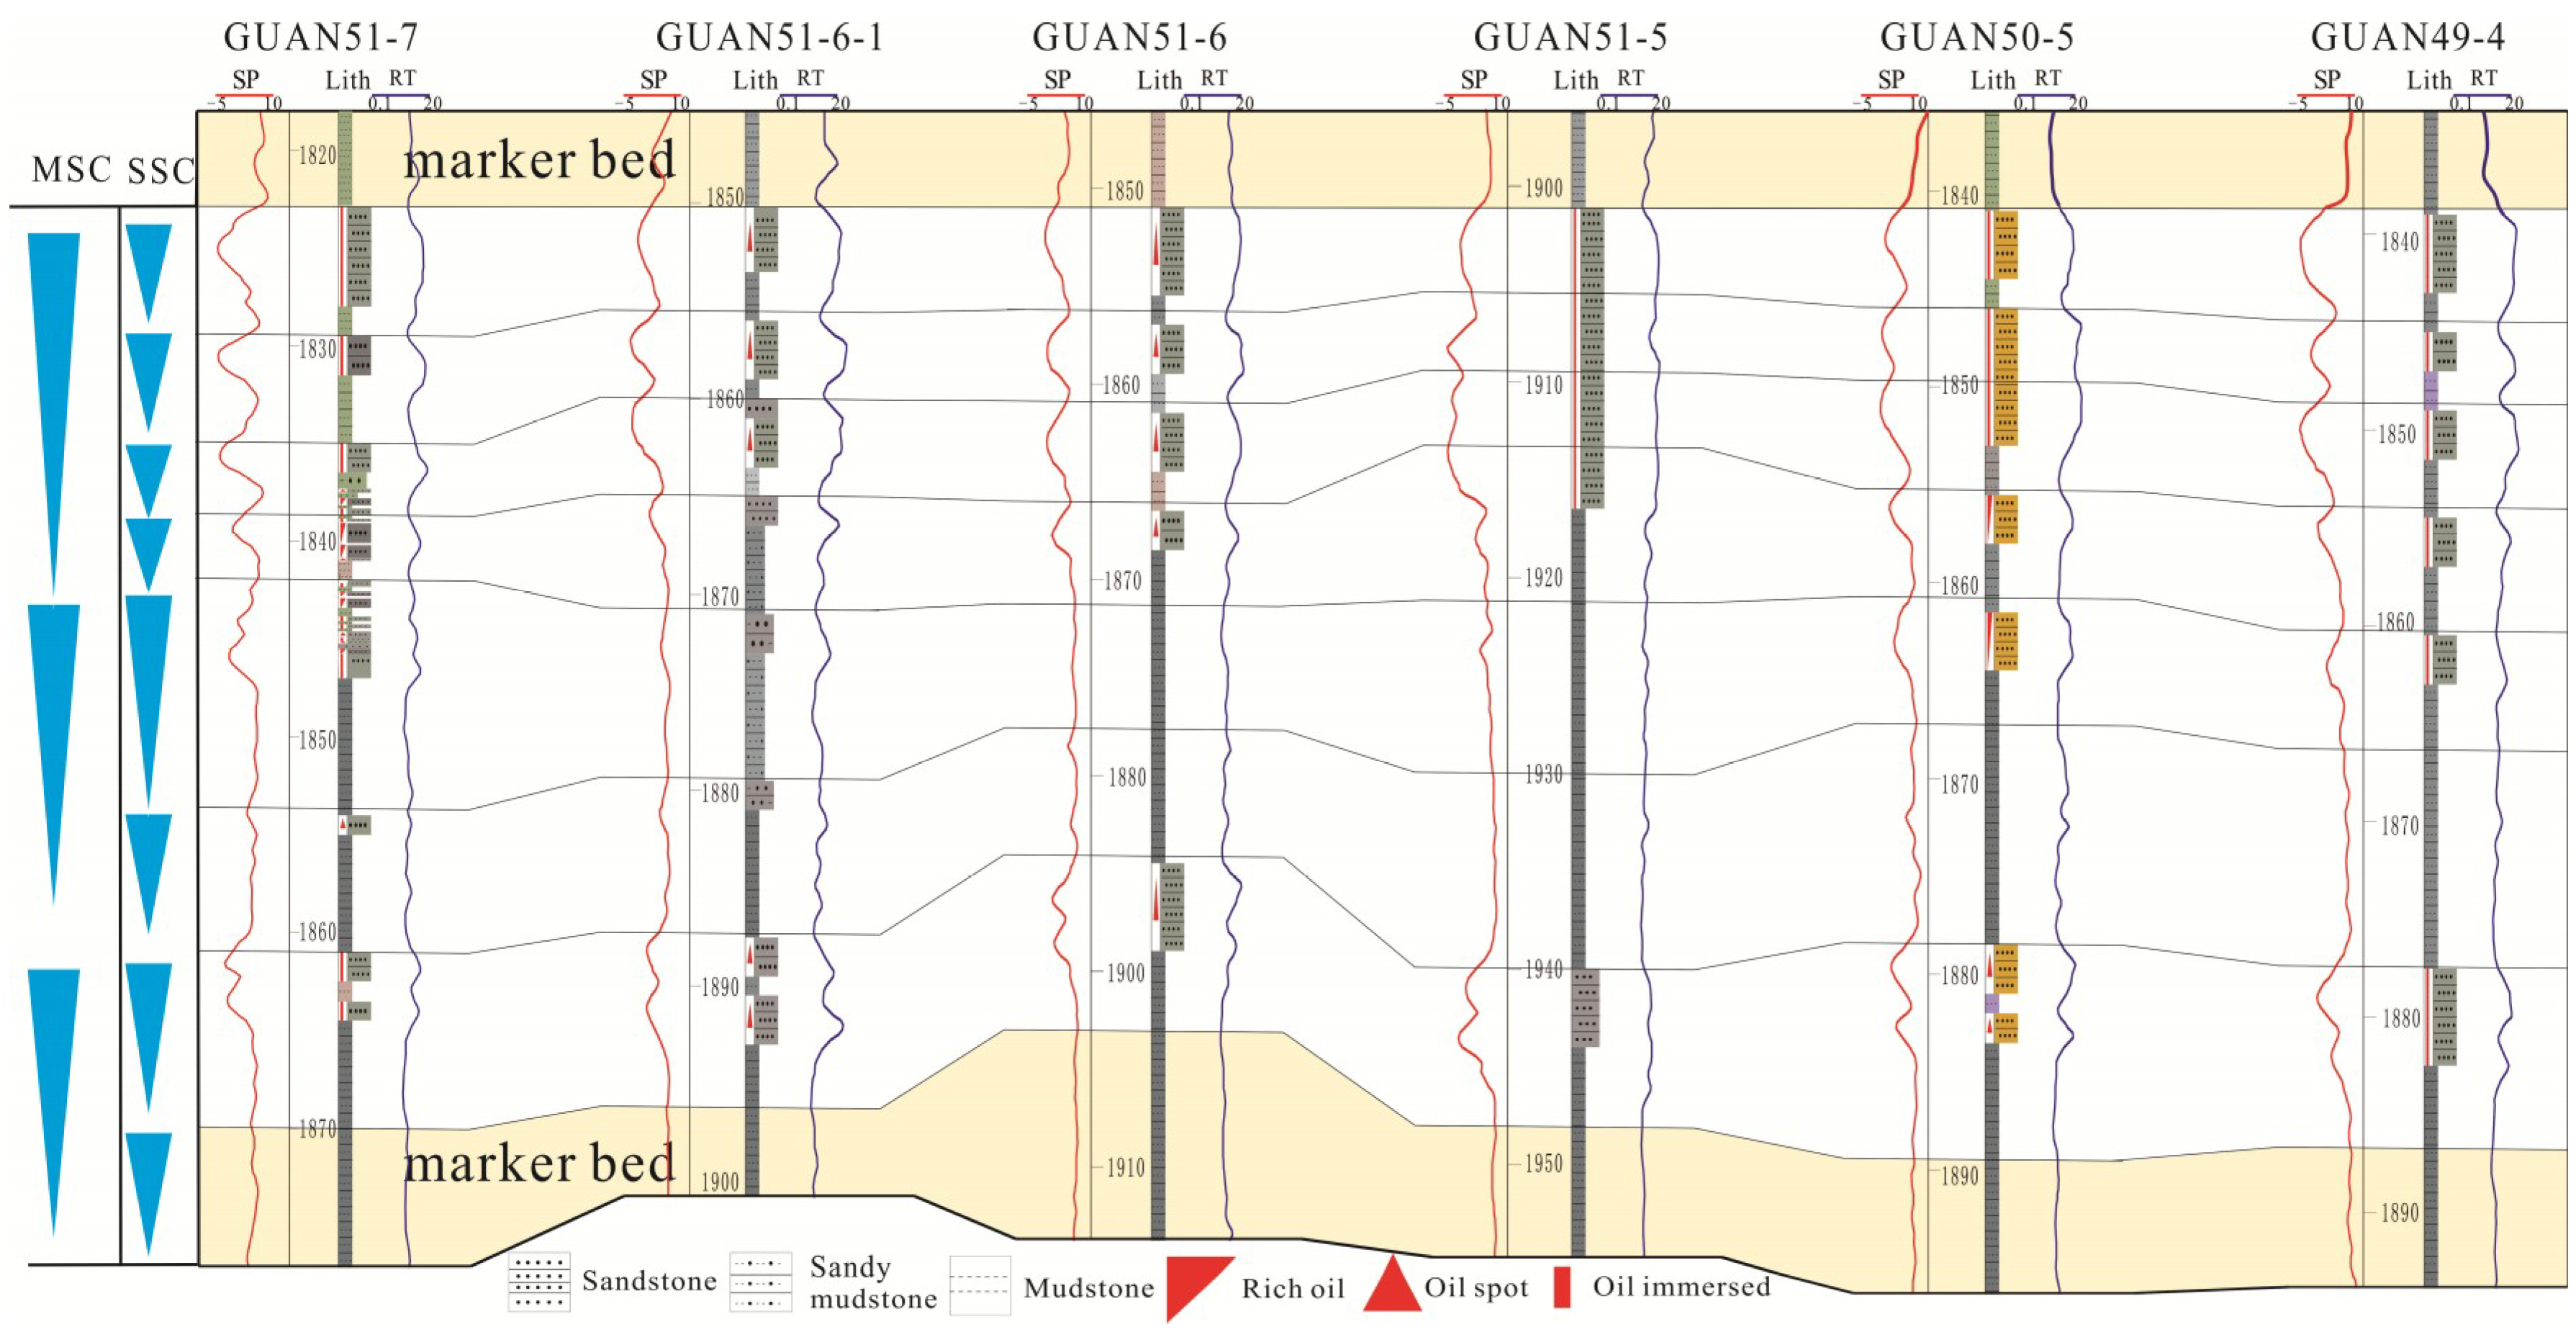
4.1. Stratigraphic Correlation and Cycle Identification

According to the formation characteristics of ZVC bed of EK1 (the first member of the Kongdian Formation), eight single layers were divided within the ZVC bed. The thickness of a single sand body ranges from 2 to 8 m and most of them are between 3.5 m and 5 m. The thickness difference of a given sand body in the horizontal is mainly controlled by the depositional environment and the location of the sequence, while the thickness difference in the vertical is mainly controlled by such factors as the expansion and contraction of the lake, provenance supply, climate, and tectonic movement. A total of one LSC, three MSC and eight SSC were further divided within the ZVC according to the characteristics of core, lithology and well logging curve (Figure 3). Based on those data, stratigraphic correlation and cycle identification were carried out on the profile (Figure 4).

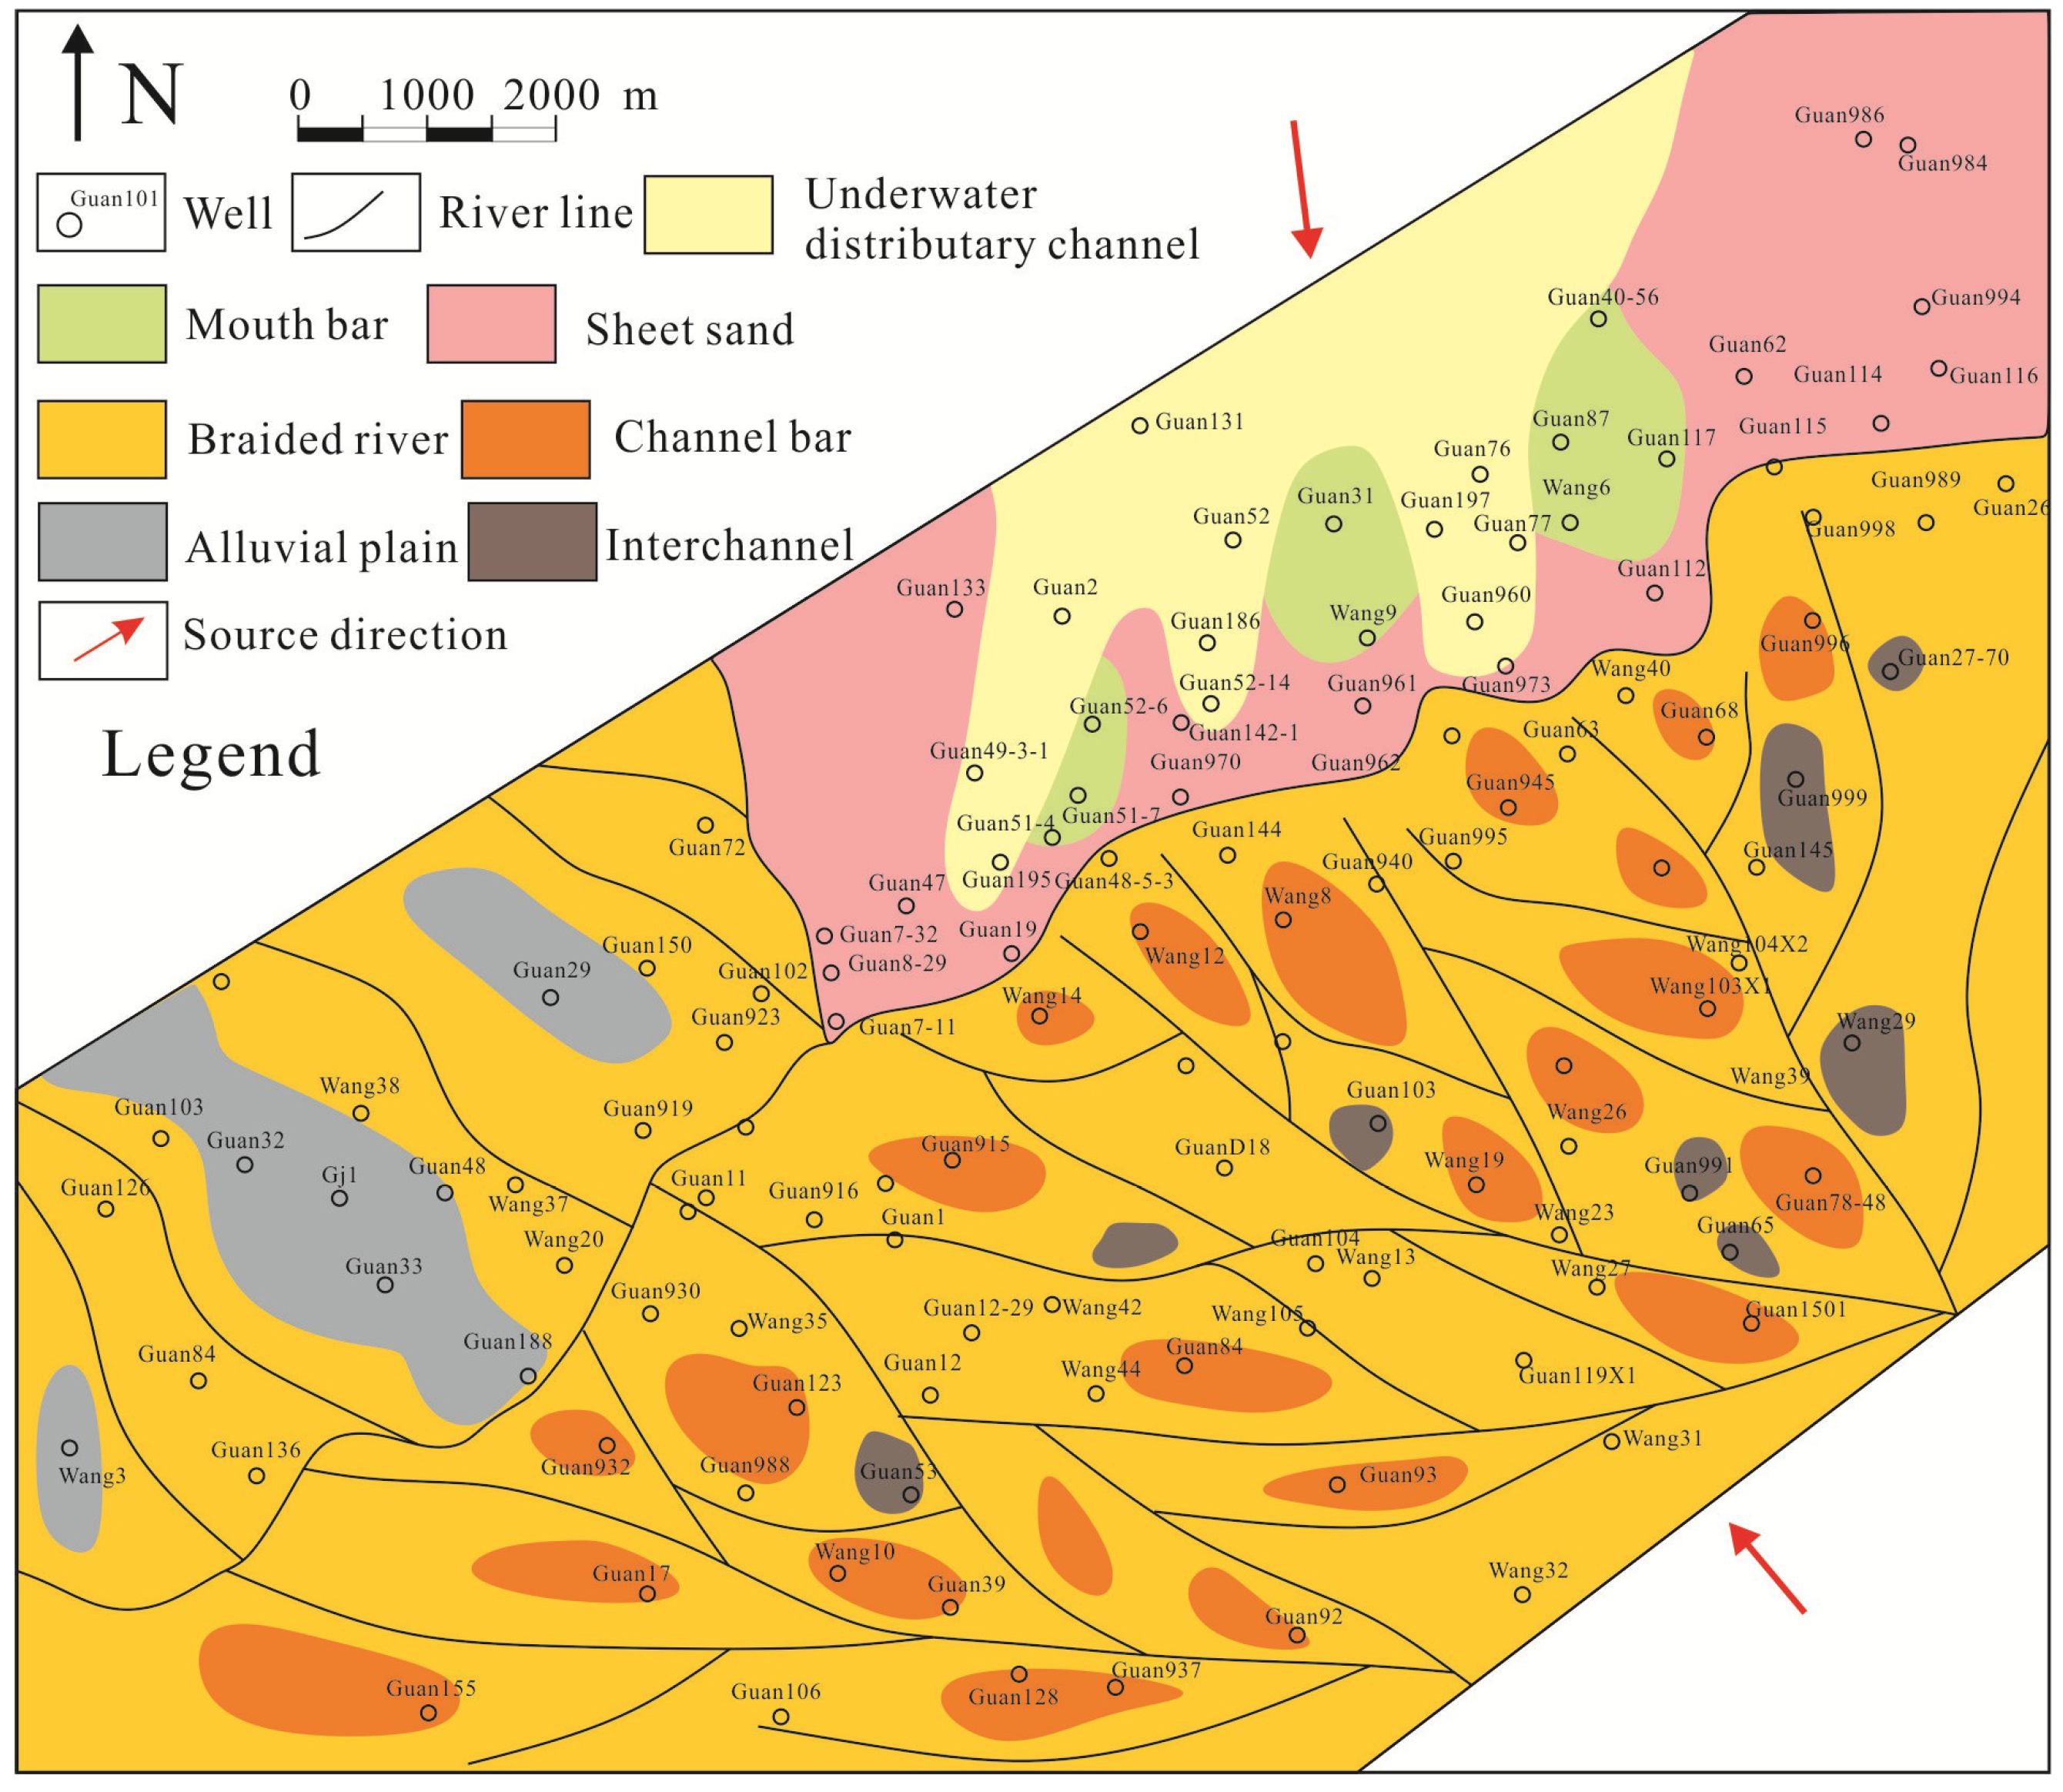
4.2. Sedimentary Microfacies Characteristics

The source of Wang guantun area comes mainly from two directions, the Cangxian uplift zone and Xuhei uplift zone [48]. Sediments from the north formed fan delta deposits in the Guan195 area, and sediments from the southeast formed an alluvial fan deposit in the ZV bed [46]. Based on a high resolution sequence stratigraphic framework, mouth bar, underwater distributary channel, sheet sand, and distributary bay micro-facies were distinguished in the delta front subfacies in Guan195 area according to the lithological characteristics, sedimentary structure and logging curve characteristics (Table 1). Braided rever, channel bar, interchannel and alluvial plain micro-facies were distinguished in the alluvial fan subfacies [49]. The sedimentary facies map in ZV of the Wang guantun area is shown in Figure 5.

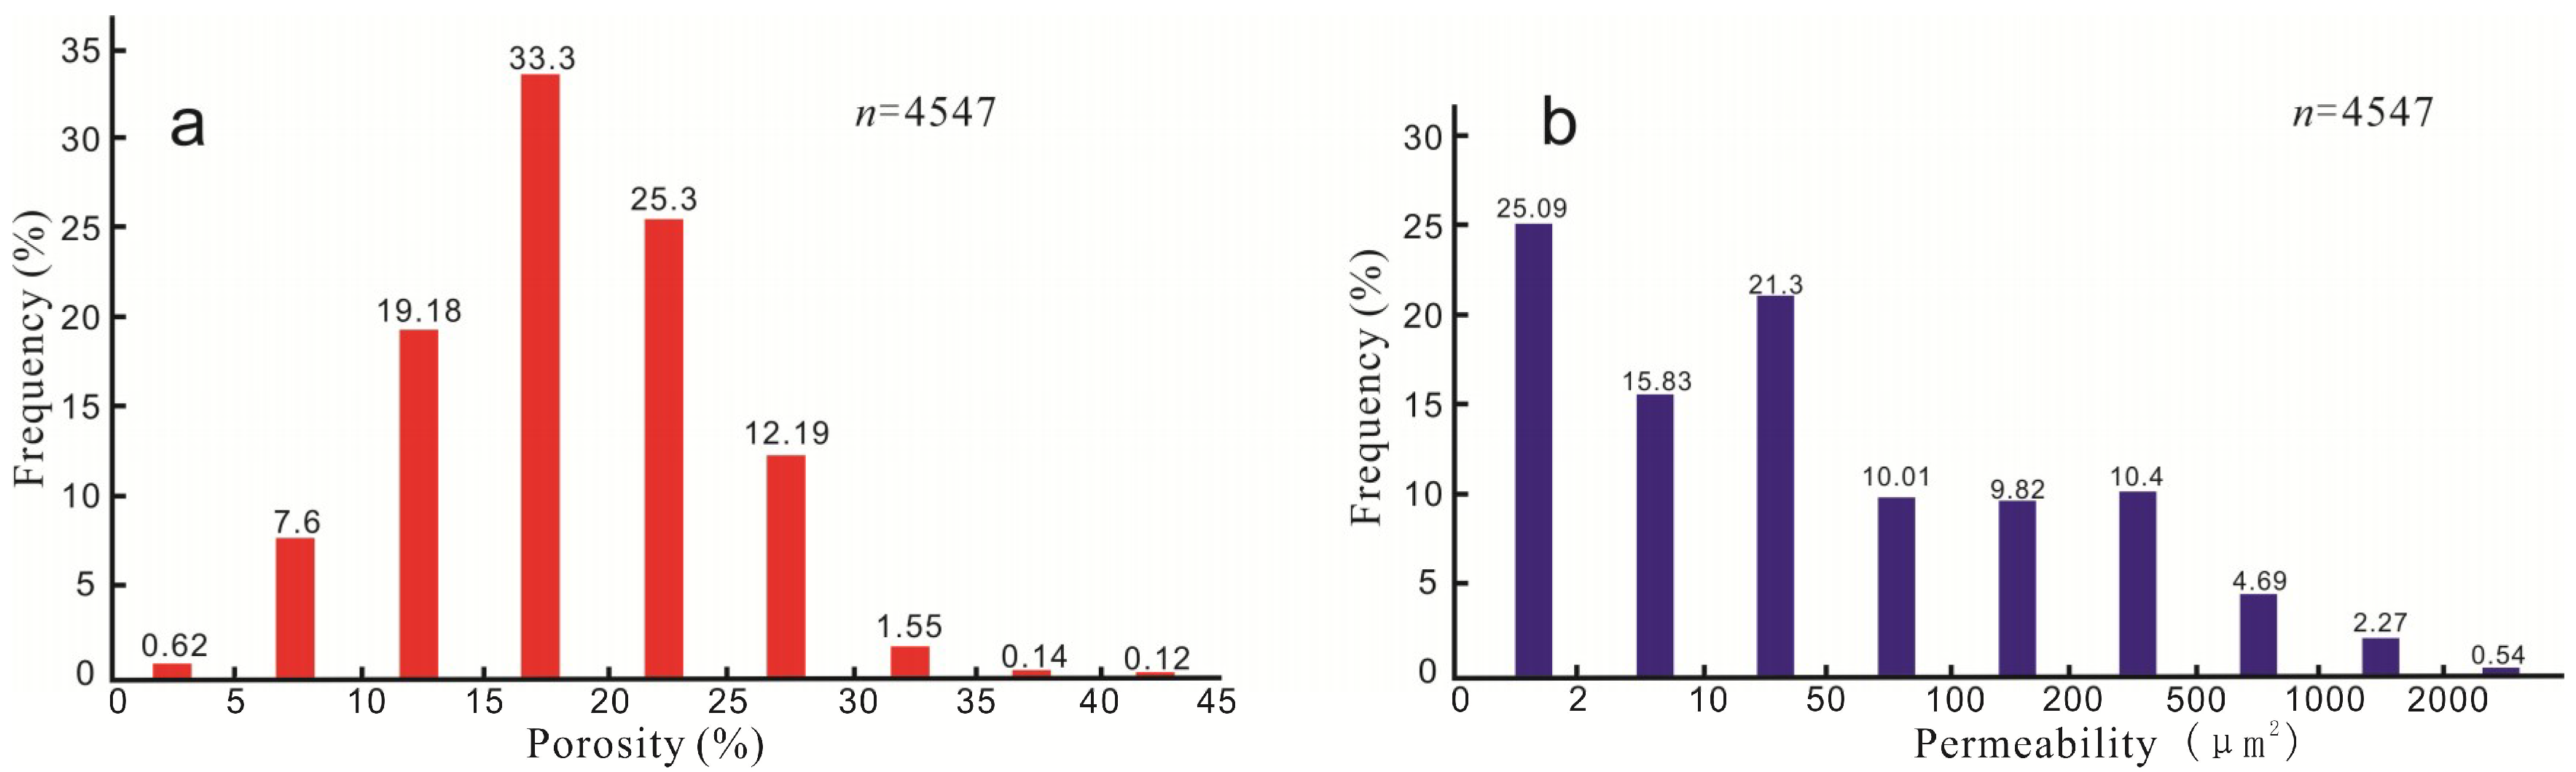
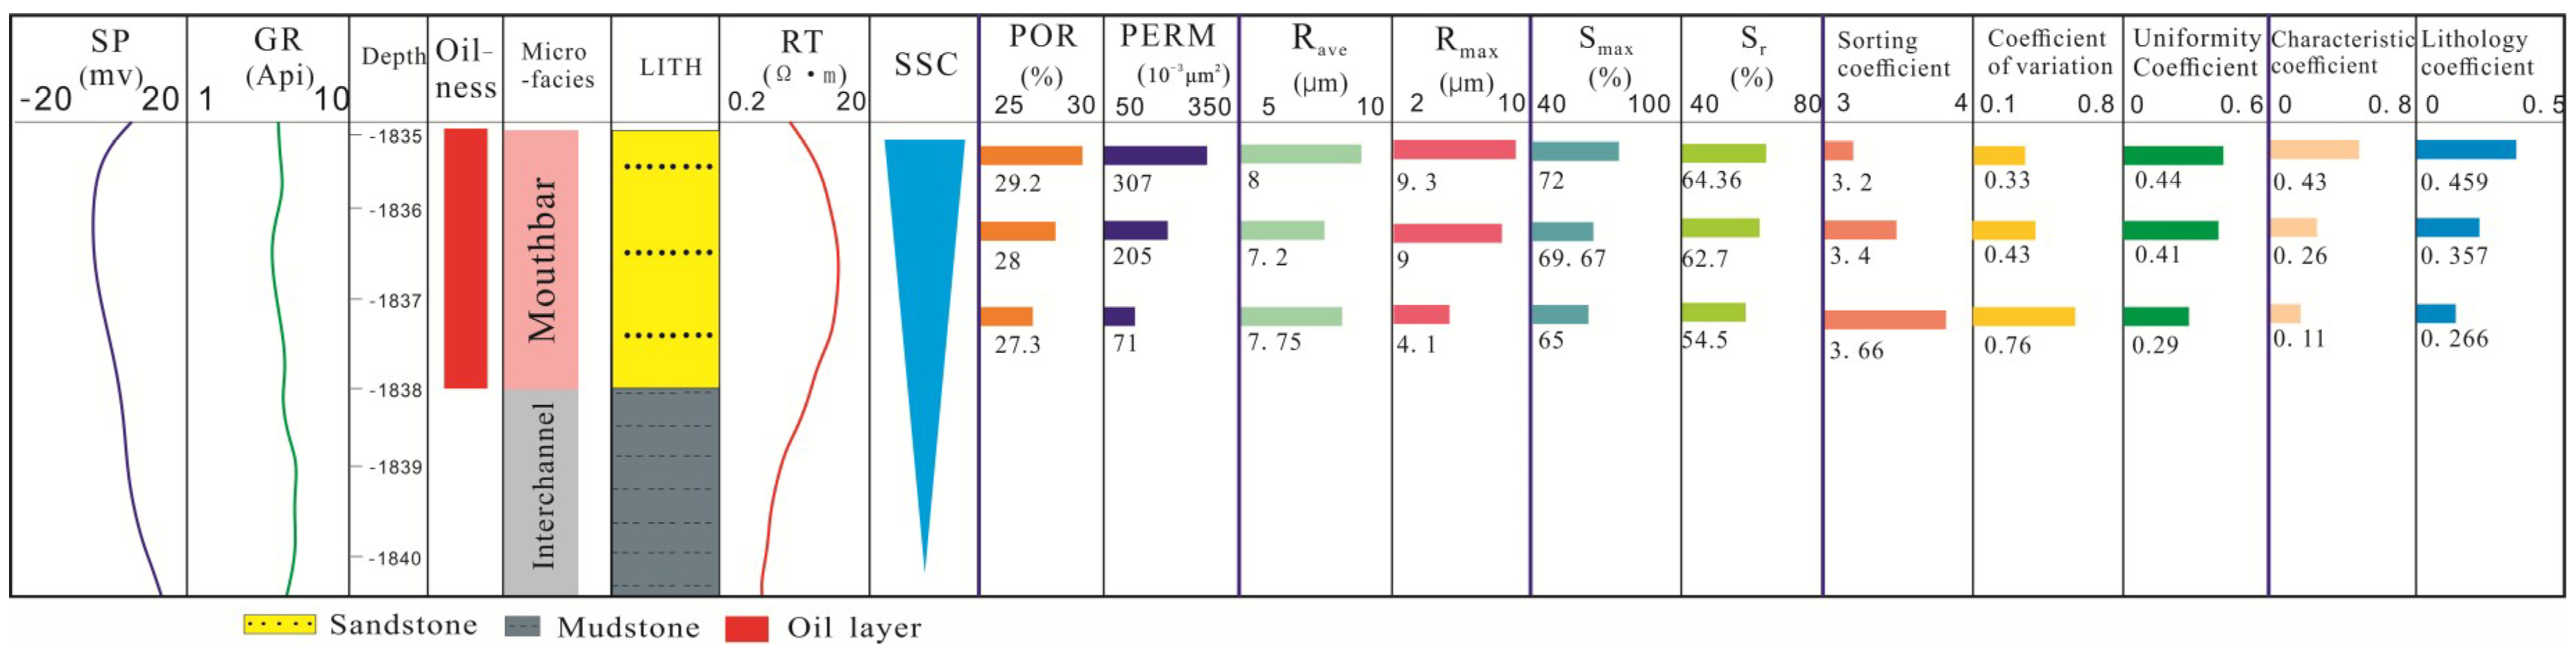
4.3. Petrophysical Properties and Pore Types

Under laboratory pressure conditions, the porosity of core samples is generally between 1.57% and 44.6% with an average of 19.05%, 58.6% of samples are between 15% and 25% (Figure 6a). The permeability is between 0.06 μm2 and 3611 μm2, 62.2% of samples are between 0.06 μm2 and 50 μm2, with an average of 137.56 μm2 (Figure 6b).
The micrographs of the casting sheet image and SEM show that the main pore types in the ZVC sandstone reservoirs are intergranular pores, dissolution pores and micro fractures (Figure 7). Intergranular pores are relatively large in size and mostly irregular-polygonal in shape. The size of intergranular pores generally ranges from about 30 μm to about 60 μm, which is mainly controlled by the compaction effect. Dissolution pores are mainly from feldspar and matrix dissolution, with sizes mainly between about 5 μm and about 40 μm. The size of micro fractures is approximately 5 μm in width. Different pore types have different pore structure characteristics (Figure 7).

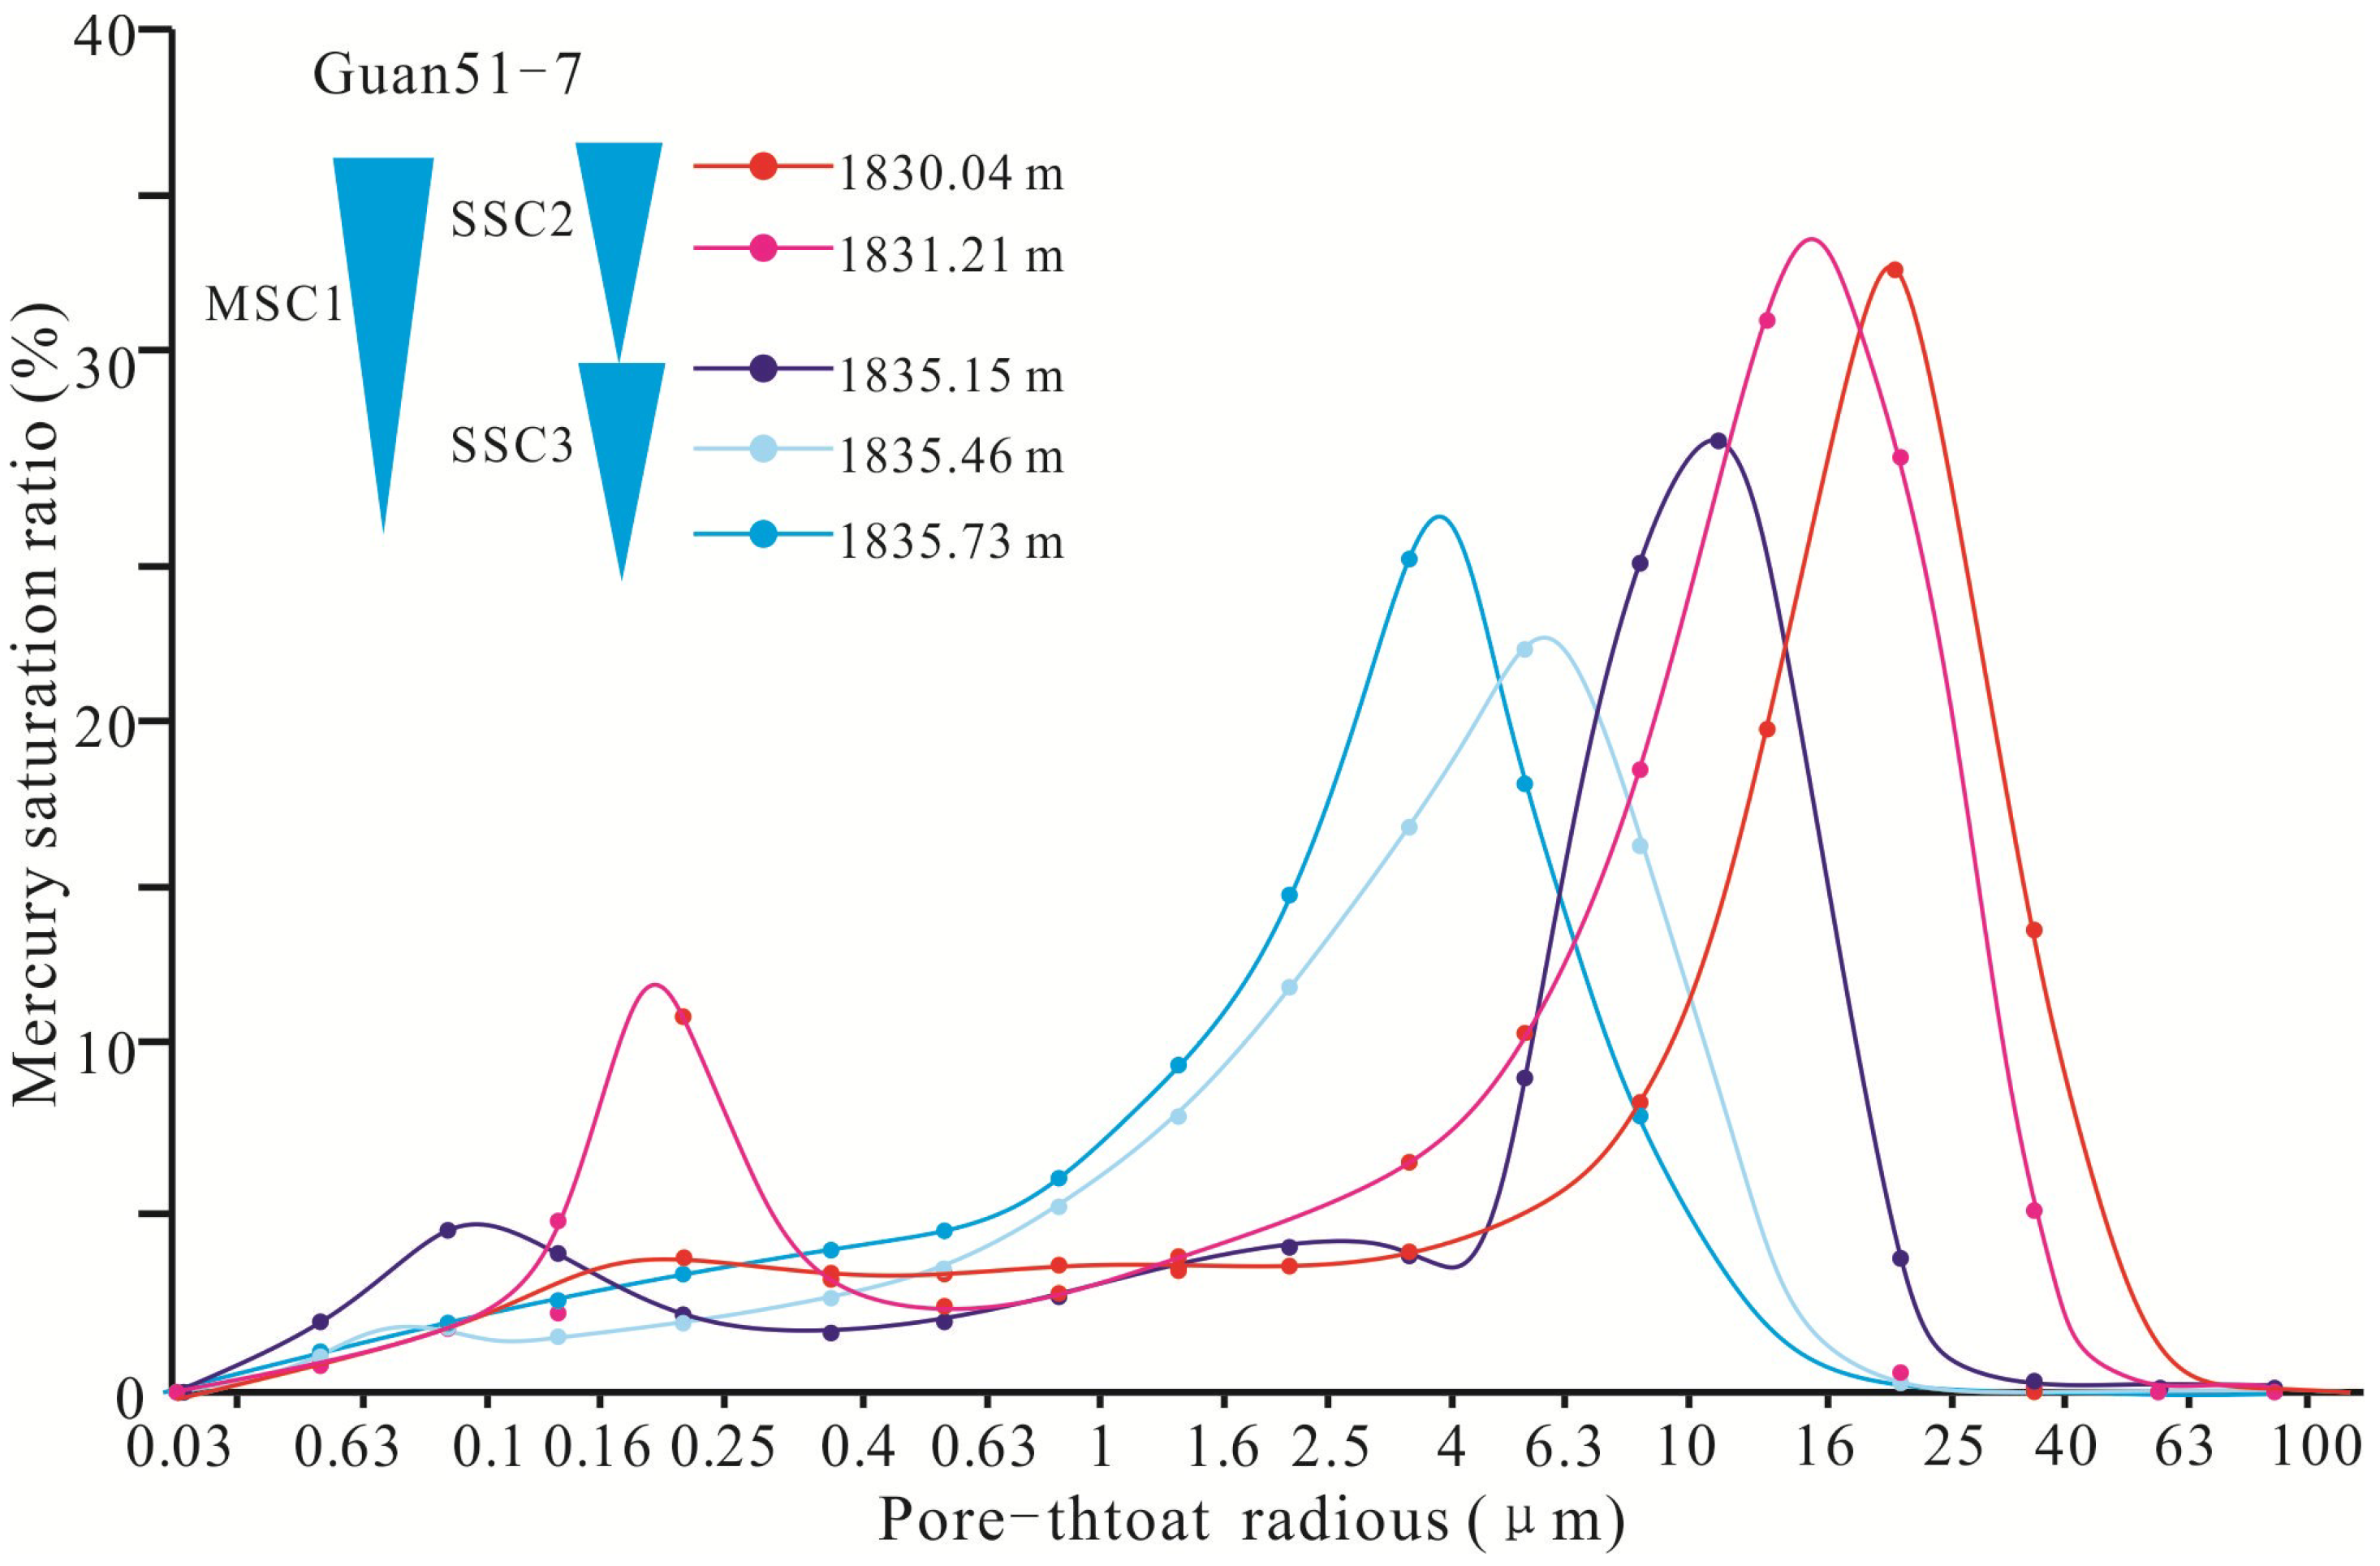
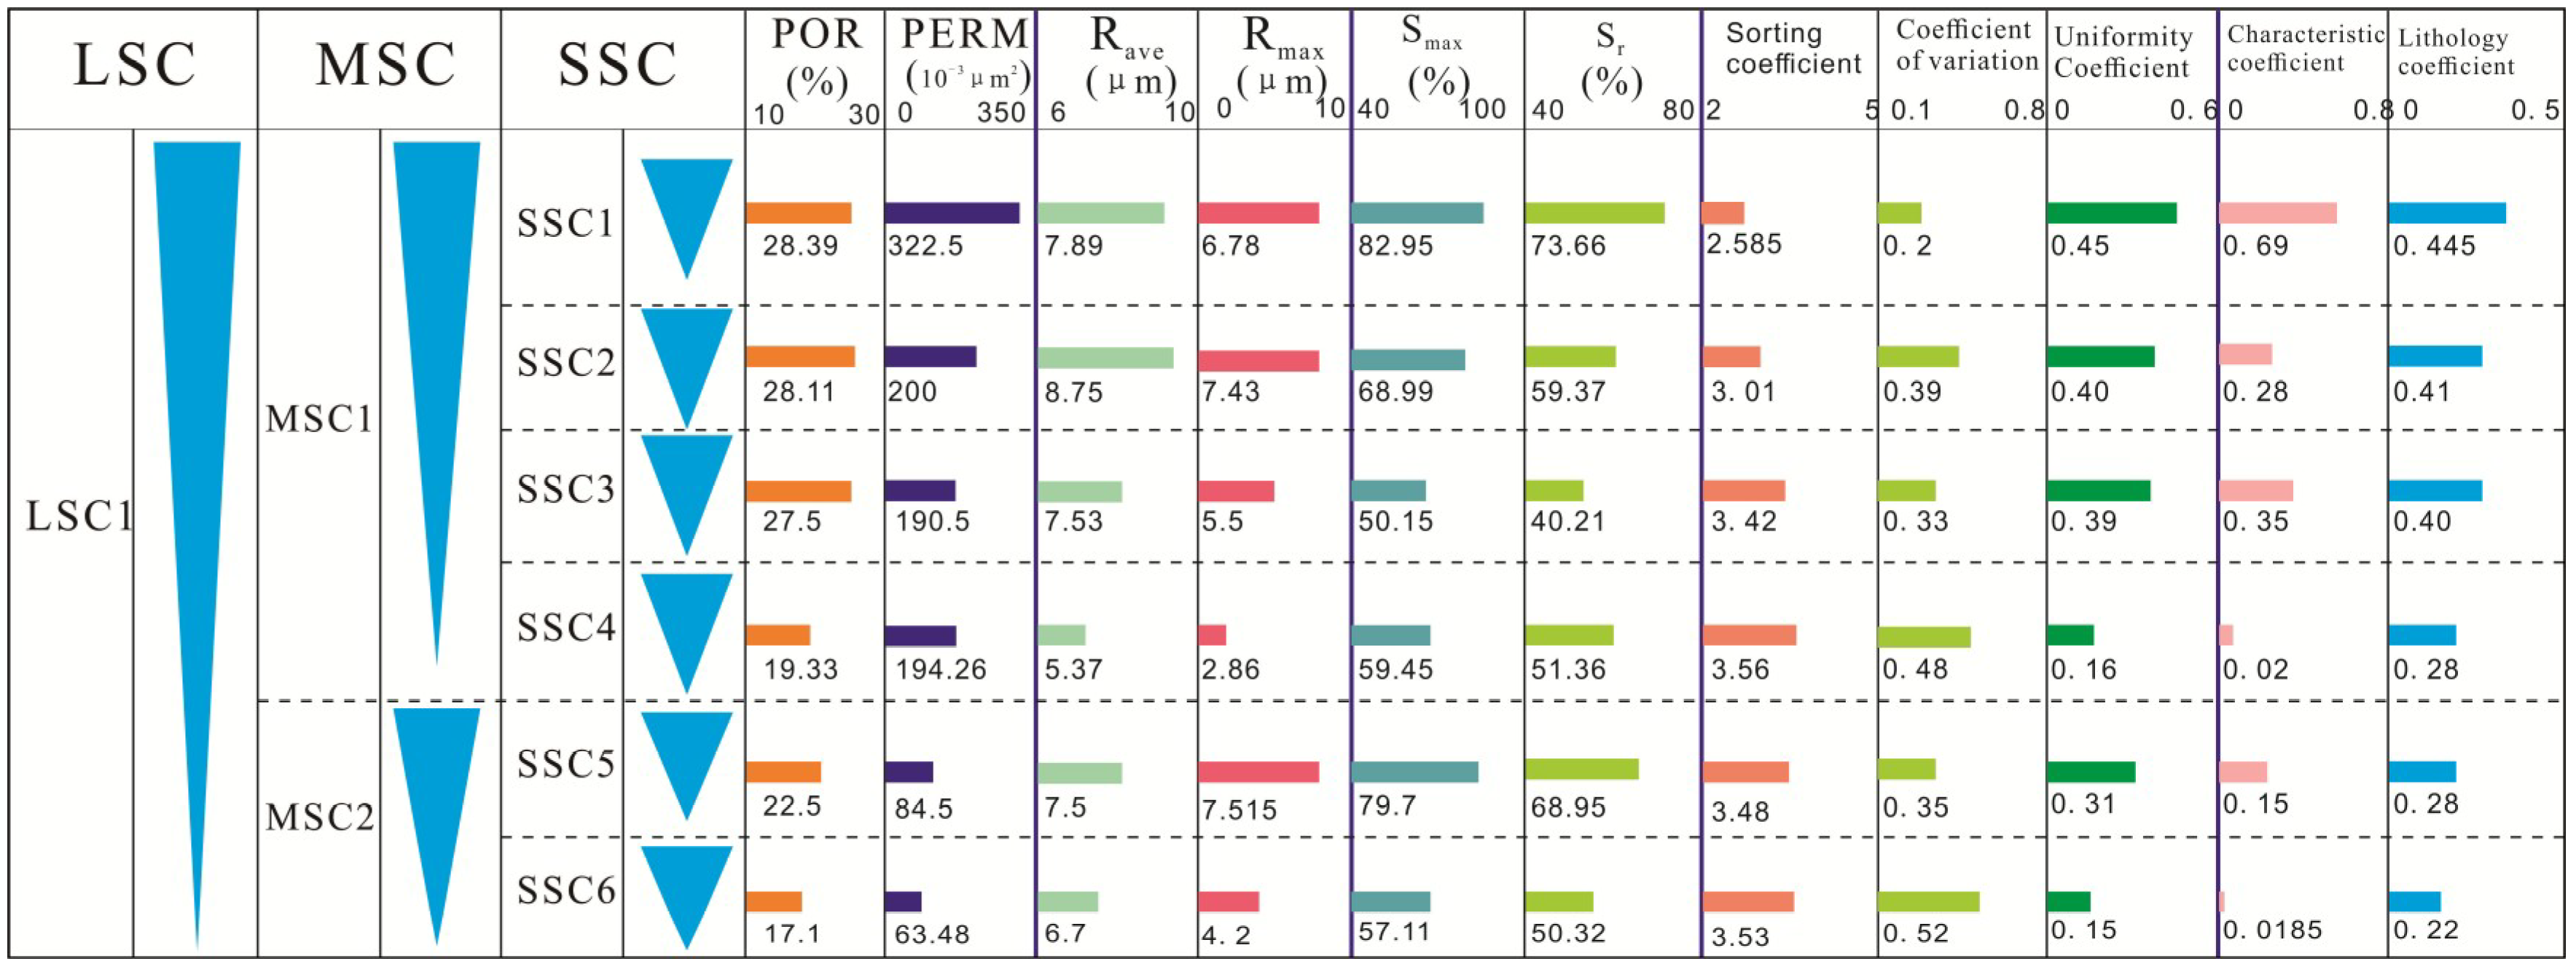
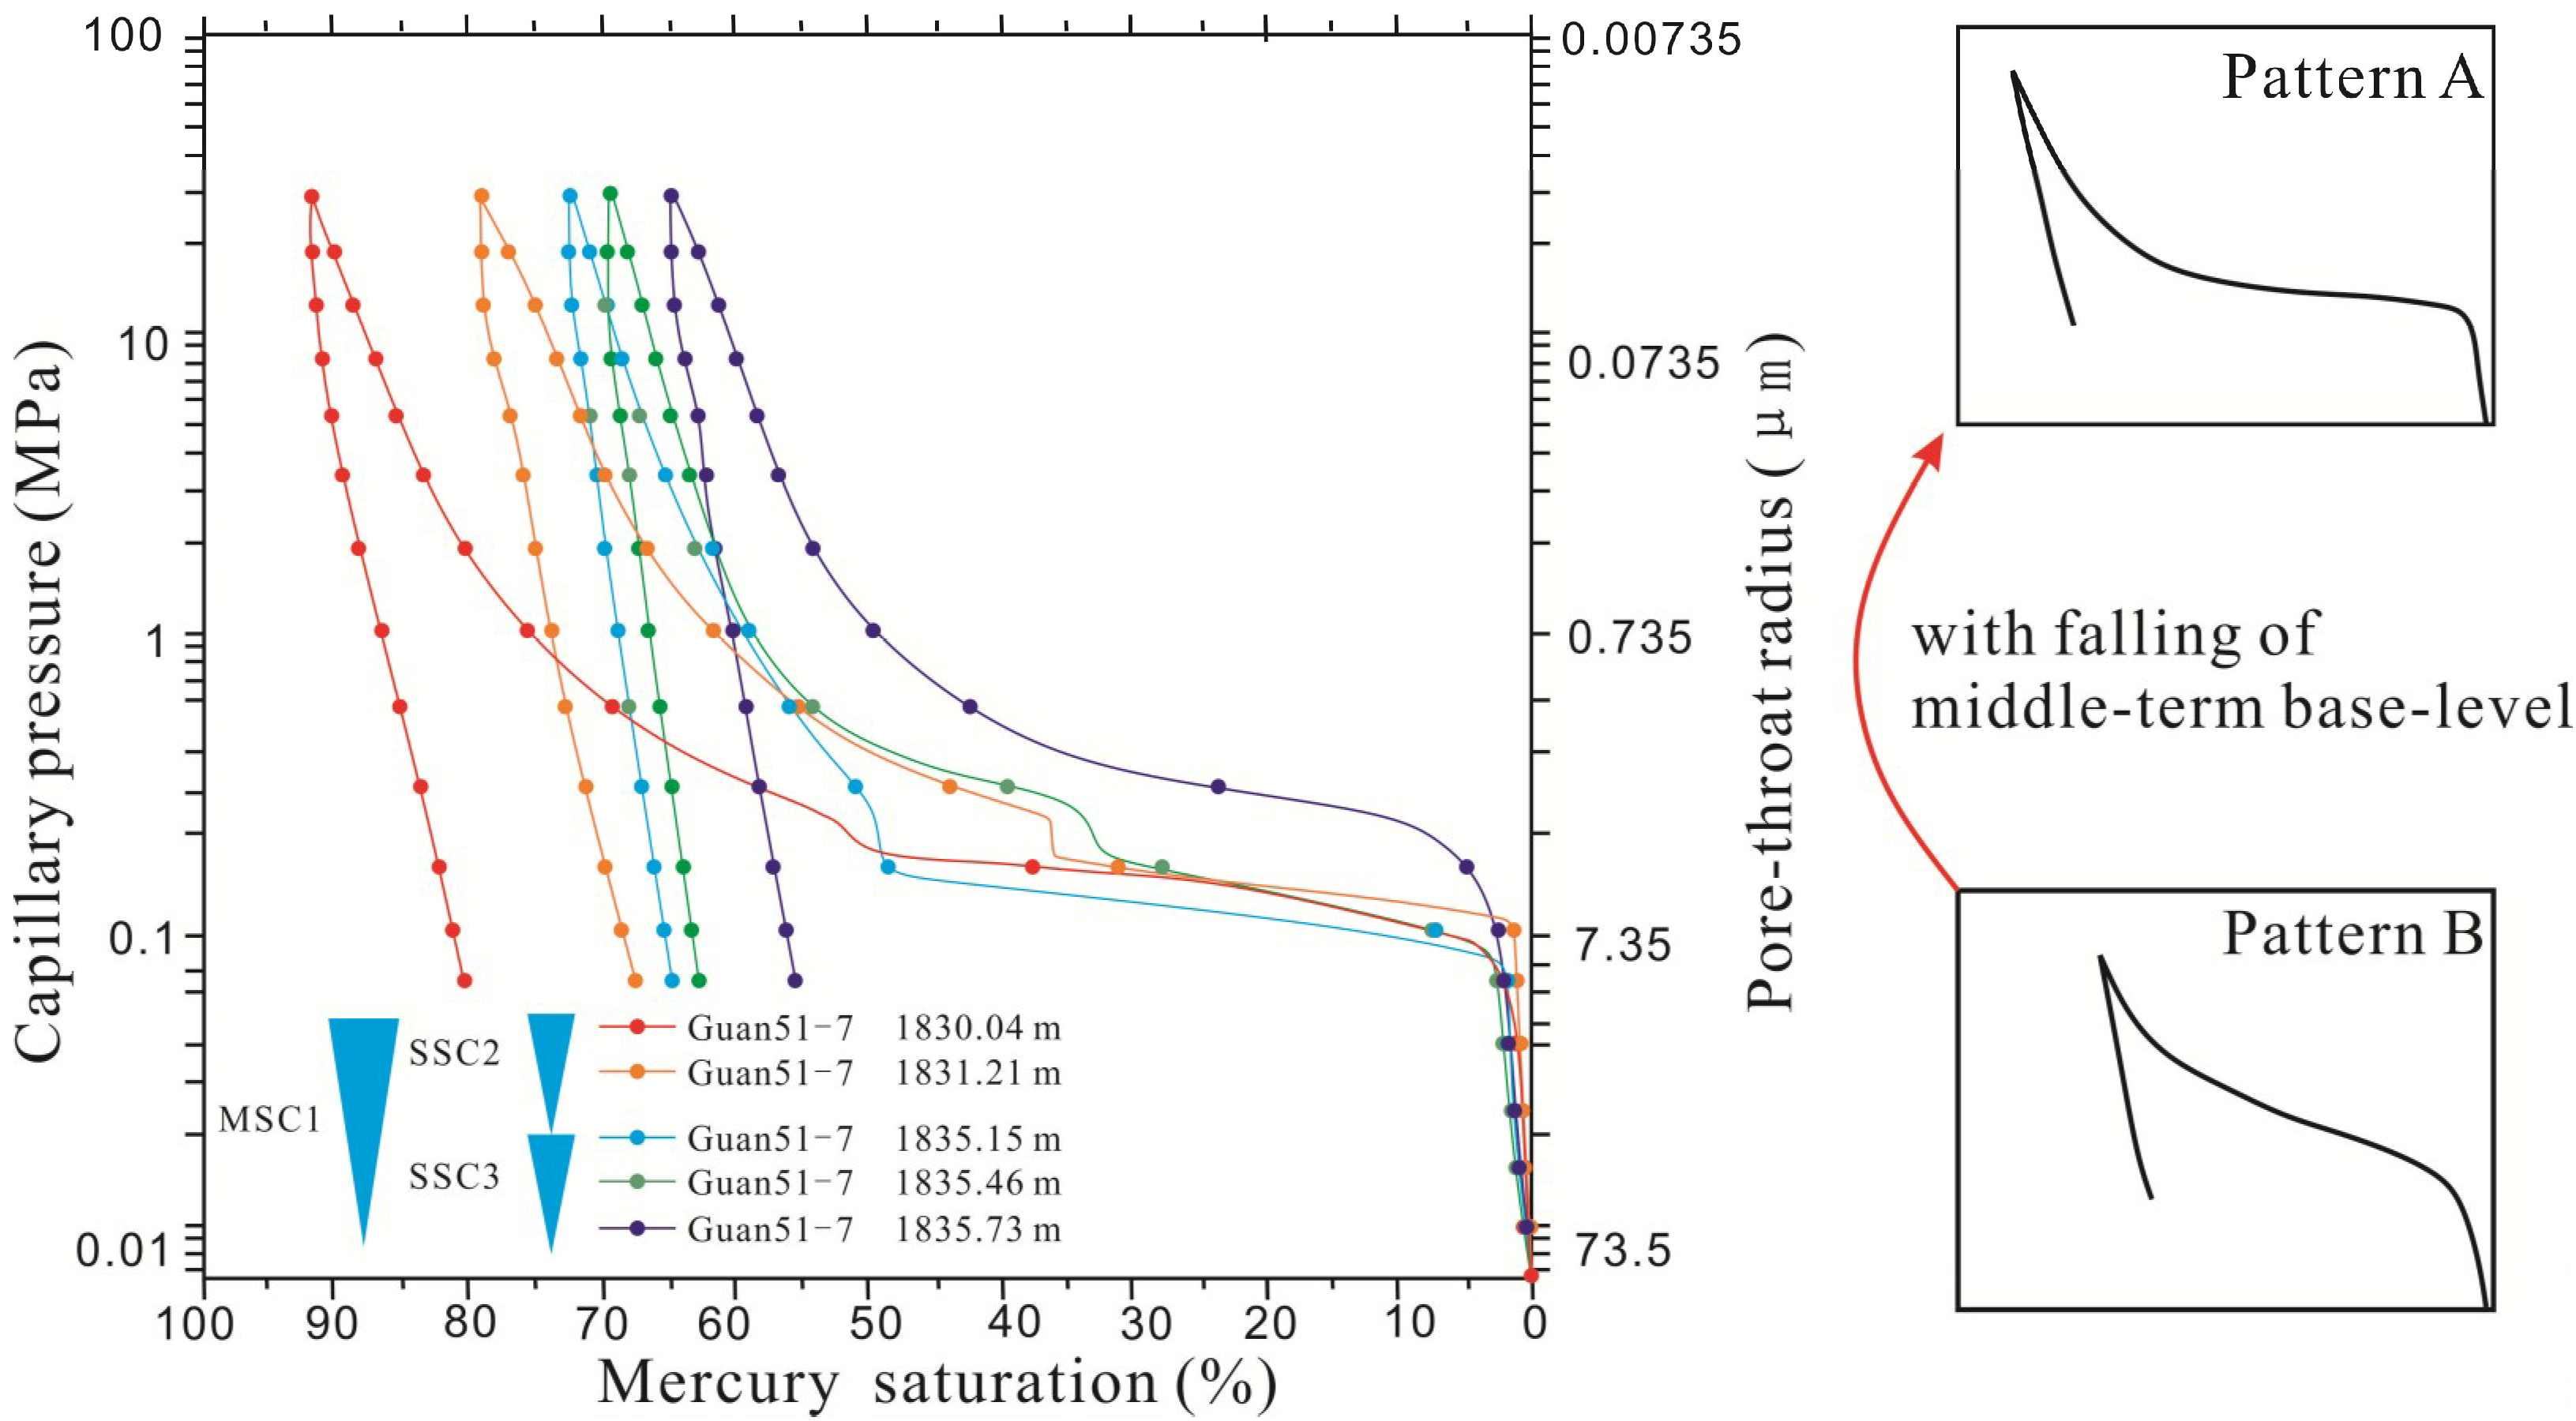
4.4. The Results Obtained from Pressure-Controlled Mercury Injection Testing

The mercury injection and extrusion curves of the samples change at the threshold pressure, which is the pressure at which a wetting phase will begin to be displaced by a non-wetting phase from a porous medium [50]. The lower the threshold pressure (Pt), the larger the pore throat size. The intrusion and extrusion curves of typical samples can be classified into three patterns according to curve features (Figure 8). Pattern A includes samples with minimal Pt, the widest horizontal stage, and maximal intake of mercury, which represents a larger pore throat radius, better sorting, and less pore throat heterogeneity (Figure 8). The mercury intrusion curves of pattern B also have a horizontal stage, while their slopes are larger. The average Pt of pattern B is higher than that of pattern A (Figure 8). There is no horizontal stage in the samples of pattern C, in the process of mercury intrusion, mercury injection saturation increases with the increase of injection pressure. Although Sr is small, the extrusion efficiency is poor.
Rave obtained from mercury intrusion saturation are mainly distributed between 0.0387 μm and 14.75 μm and the most common ones are from 9 μm to 12 μm (Figure 9a). Rmax according to mercury intrusion saturation is generally between 0.0981 μm to 27.84 μm (mainly 0.1 μm −10 μm) (Figure 9b). Smax is mainly between 60% and 90% (Figure 9c), while Sr mainly ranges from 10% to 40% (Figure 9d). This indicates that much of the mercury was constrained by the pore throat, and the larger the discrepancy between pores and pore throats, the more residual mercury.
Sorting coefficient refers to the uniformity of the pore throat radius distribution, which is calculated by Equation (1) [51]:
s c = Δ S i i = 1 n ( r i r m )
where sc is the sorting coefficient, ri is the pore throat radius of an interval in the pore throat radius distribution function, nm, rm is the average pore throat radius, nm, and ∆Si is the saturation corresponding to ri, %.
The more uniform the pore throat size, the better sorting, and the smaller sc. The coefficient of variation is the ratio of sorting coefficient and the average pore throat radius, which is calculated by Equation (2) [52]:
c v = Δ S i i = 1 n ( r i r m ) r m
where cv is the coefficient of variation.
The better the sorting, the smaller the cv. The uniformity coefficient is used to quantify the uniformity of the pore throat radius distribution, which is calculated by Equation (3) [53], whose value ranges from 0 to 1, and the bigger the value, the more uniform pore-throat distribution. The characteristic structure coefficient reflects the connectivity of throats, and the bigger the value, the better the connectivity. The lithology coefficient is the ratio of the measured permeability and the calculated permeability, which reflects the degree of pore throat curvature:
u e = i = 1 n r i Δ S i r d i = 1 n Δ S i
where ue is the uniformity coefficient, rd is the maximum pore throat radius, nm.
Sorting coefficients of pore throats range from 1.08 to 4.95 and display no obvious concentration distribution (Figure 9e). Coefficients of variation of pore throats range from 0.0361 to 3.27 and the most common ones are between 0.2 and 0.4 (Figure 9f). Uniformity coefficients of pore throats range from 0.0067 to 0.622 (mainly 0.2–0.4) (Figure 9g). This shows that the pore-throat distribution of the different samples is very different. Characteristic structure coefficients are mainly distributed between 0.3 and 0.5 (Figure 9h). Lithology coefficients are generally between 0.07 to 0.92 μm (mainly 0.1–0.2) (Figure 9i). This finding may be a manifestation of a complex tortuous shape in the pore throats. Overall, these relatively dispersed frequency distributions corroborate the complexity and heterogeneity of pore throat sizes.
With lower base-levels, the above parameters exhibit different behaviors. We intend to study and summarize these differences in order to further study the controlling effect of the base-level on the pore structure characteristics of sandstone.

5. Discussion

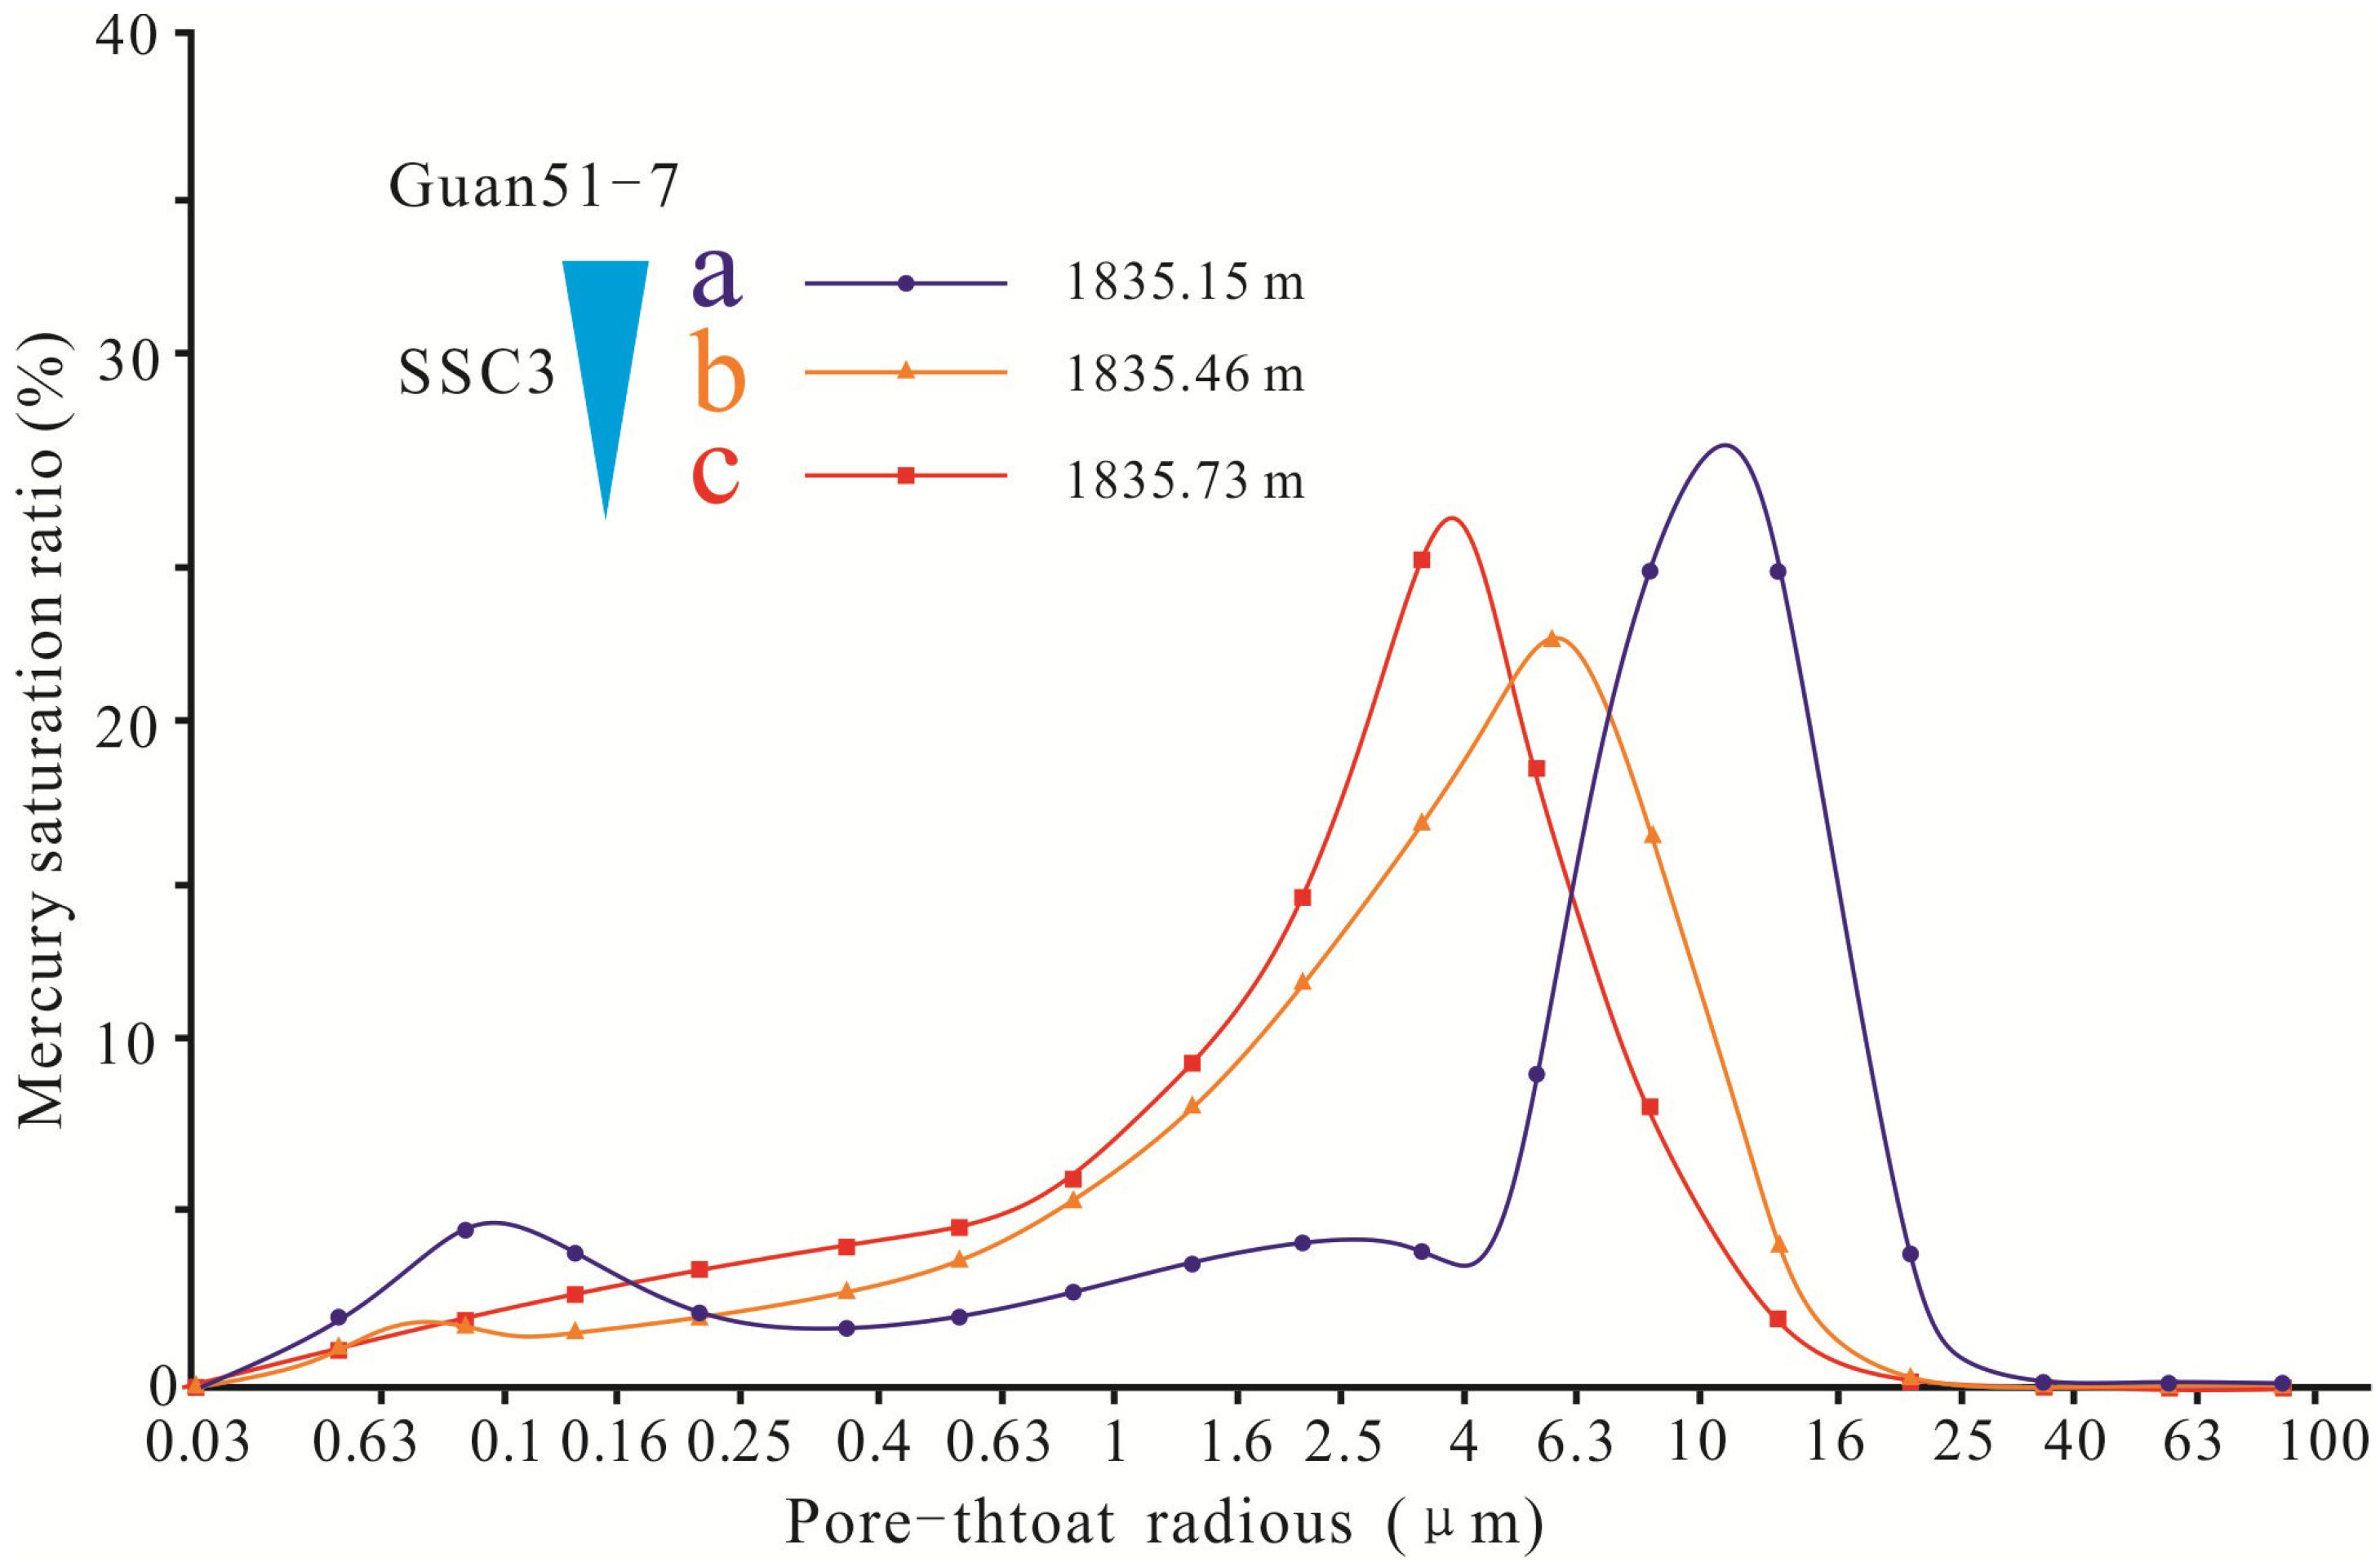
5.1. Relationship between Short-Term Base-Level Cycle and Pore Structure

The change of short-term base-level controls sedimentary sequence, stratigraphic structure, and superimposed pattern, and correspondingly controls the longitudinal variation of the physical properties and heterogeneity of the sand body [32,33]. An analysis of the relationship between short-term base-level cycles and pore structure of mouth bar sand bodies in the study area has shown that the pore structure of a mouth bar sand body is changed regularly with the falling of short-term base level.
The three samples in Figure 10 are from the SSC3 of well Guan51-7, and they belong to the same mouth bar sand body. The mercury intrusion curves of the three samples all display pattern B, and they all have a wider horizontal stage because of their shallower buried depth, though the horizontal stage of sample C is narrowest (Figure 10). The samples from late in the falling period of the SSC also have the lower Pt and larger Smax. This is an indication that the pore-throat distribution is better, and the effective porosity of the samples is larger in the late stage of the falling period of short-term base-level.
We can obtain the pore throat size distribution of samples from the test results of PMI [54]. The pore throat size distribution curves of Samples a, b and c are mainly distributed within 1.6–6.3 μm, 2.5–10 μm and 4–16 μm, respectively (Figure 11), which is gradually increasing with the falling of the short-term base level. This also shows that the pore throat size of the samples is larger in the late stage of the falling period of short-term base-level.
Because the developmental period of SSC was shorter, the allocyclic factors, such as geological structure and the change of lake level, were in a relatively static state, and the reduction rate of the accommodation space was approximately equivalent to the rate of sediment supply. As the short-term base-level fell, water energy was gradually strengthened, sediments could be fully washed; consequently, the porosity and permeability of the mouth bar sand body gradually increased upward, as did the radius of the pore throats, pore throat sorting, and the pore throat connectivity (Figure 12). In conclusion, the pore structure of single mouth bar sand bodies was mainly influenced by the autocycles and pore structure of single mouth bar sand bodies gradually become better with the falling of short-term base-level.

5.2. Relationship between Middle-Term Base-Level Cycle and the Pore Structure

The pore structure of the mouth bar of different SSCs in the same MSC has obvious differences. The five samples of the Guan 51-7 well were from 2 different short-term base-level cycles (SSC2, SSC3) but were all from the same middle-term base-level cycle (MSC1). It can be seen clearly in Figure 13 that the average width of the horizontal stage of samples is wider in SSC2 than in SSC3 and the samples in SSC2 also have the lower Pt and larger Smax. This indicates that the sorting of samples in SSC2 is better than in SSC3 and the interconnected pore space of the samples in SSC2 is larger under a given injection pressure. The two mercury curves of SSC2 belong to pattern A while the three mercury curves of SSC3 belong to pattern B, this may be an indication that the pattern of mercury curves changes from pattern B to pattern A with the falling of middle-term base-level (Figure 13).
The pore size distribution is shown in Figure 14; the pore throat radius of samples in SSC2 is mainly distributed between 6.3 μm and 30 μm; the samples in the SSC2 range from 1.6 μm to 10 μm, smaller than the samples in SSC2. This is an indication that the pore-throat radius of the single mouth bar sand body is larger in the late stage of the falling period of middle-term base-level.
The pore structure of multiple mouth bar sand bodies in MSC is primarily controlled by the allocyclic factors, such as tectonic movement and lake level change. The ratio of the reduction rate of accommodation space and the supply rate of sediment (A/S) decreased, and the water energy increased continuously. As a result, the microscopic characteristics of mouth bar sand bodies present regular changes (Figure 15). With the falling of middle-term base-level, the porosity and permeability of the later single mouth bar sand body were larger, pore throat radii increased upward, pore throat sorting became better upward, and the connectivity of the pore throat increased, under the common influence of allocycles and autocycles. In brief, the pore throat characteristics of the later mouth bar sand bodies were better than those of the early mouth bar sand bodies.

5.3. Relationship between Long-Term Base-Level Cycle and the Pore Structure

The ZVC in the study area corresponds to the falling semi-cycle of the long-term base-level cycle (LSC1), including three middle-term base-level cycles (MSC1, MSC2, MSC3). Through comparative analyses, it was observed that although pore structure of single-period multi-mouth bar sand bodies tends to be of poor quality at the bottom and good quality at the top, the regularity of pore structure in multi-period multi-mouth bar sand bodies is not obvious. In other words, because the developmental period of LSC is fairly long. During this period, lake level and basin basement experience a series of rises and drops, the supply rate of sediment and the change rate of accommodation space increase and decrease repeatedly, the transport distance of sediment experience a number of discontinuity changes. In addition, the energy of water changes repeatedly under the influence of the allocycles, which also leads to the poor regularity of pore throat heterogeneity. The long-term base-level is in a downward trend, and the pore structure of multi-period multi-mouth bar sand bodies was gradually better overall, but the regularity is not obvious (Figure 14).

5.4. Summary

According to the above analysis, the main factors controlling the different levels’ base-level cycles are different, which leads to different degrees of control of different levels base-level cycles on pore structure heterogeneity (Table 2). The pore structure of the sand bodies in the short-term base-level cycles and middle-term base-level cycles exhibit obvious changes. Therefore, the research on the pore structure of the sand bodies in short-term base-level cycles and middle-term base-level cycles can achieve better results. In summary, in the production process of oilfields, especially in the delta depositional environment of a continental fault depression basin, the pore structure of the sand bodies in the late stage of the falling period of base-level cycles are better, and those sand bodies are also the more favorable targets for production.

6. Conclusions

In this study, to investigate the effect of the base-level cycle on mouth bar pore structure, casting sheet image, SEM and PMI analyses were performed on samples from the Kongdian Formation. Several conclusions can be drawn as follows:
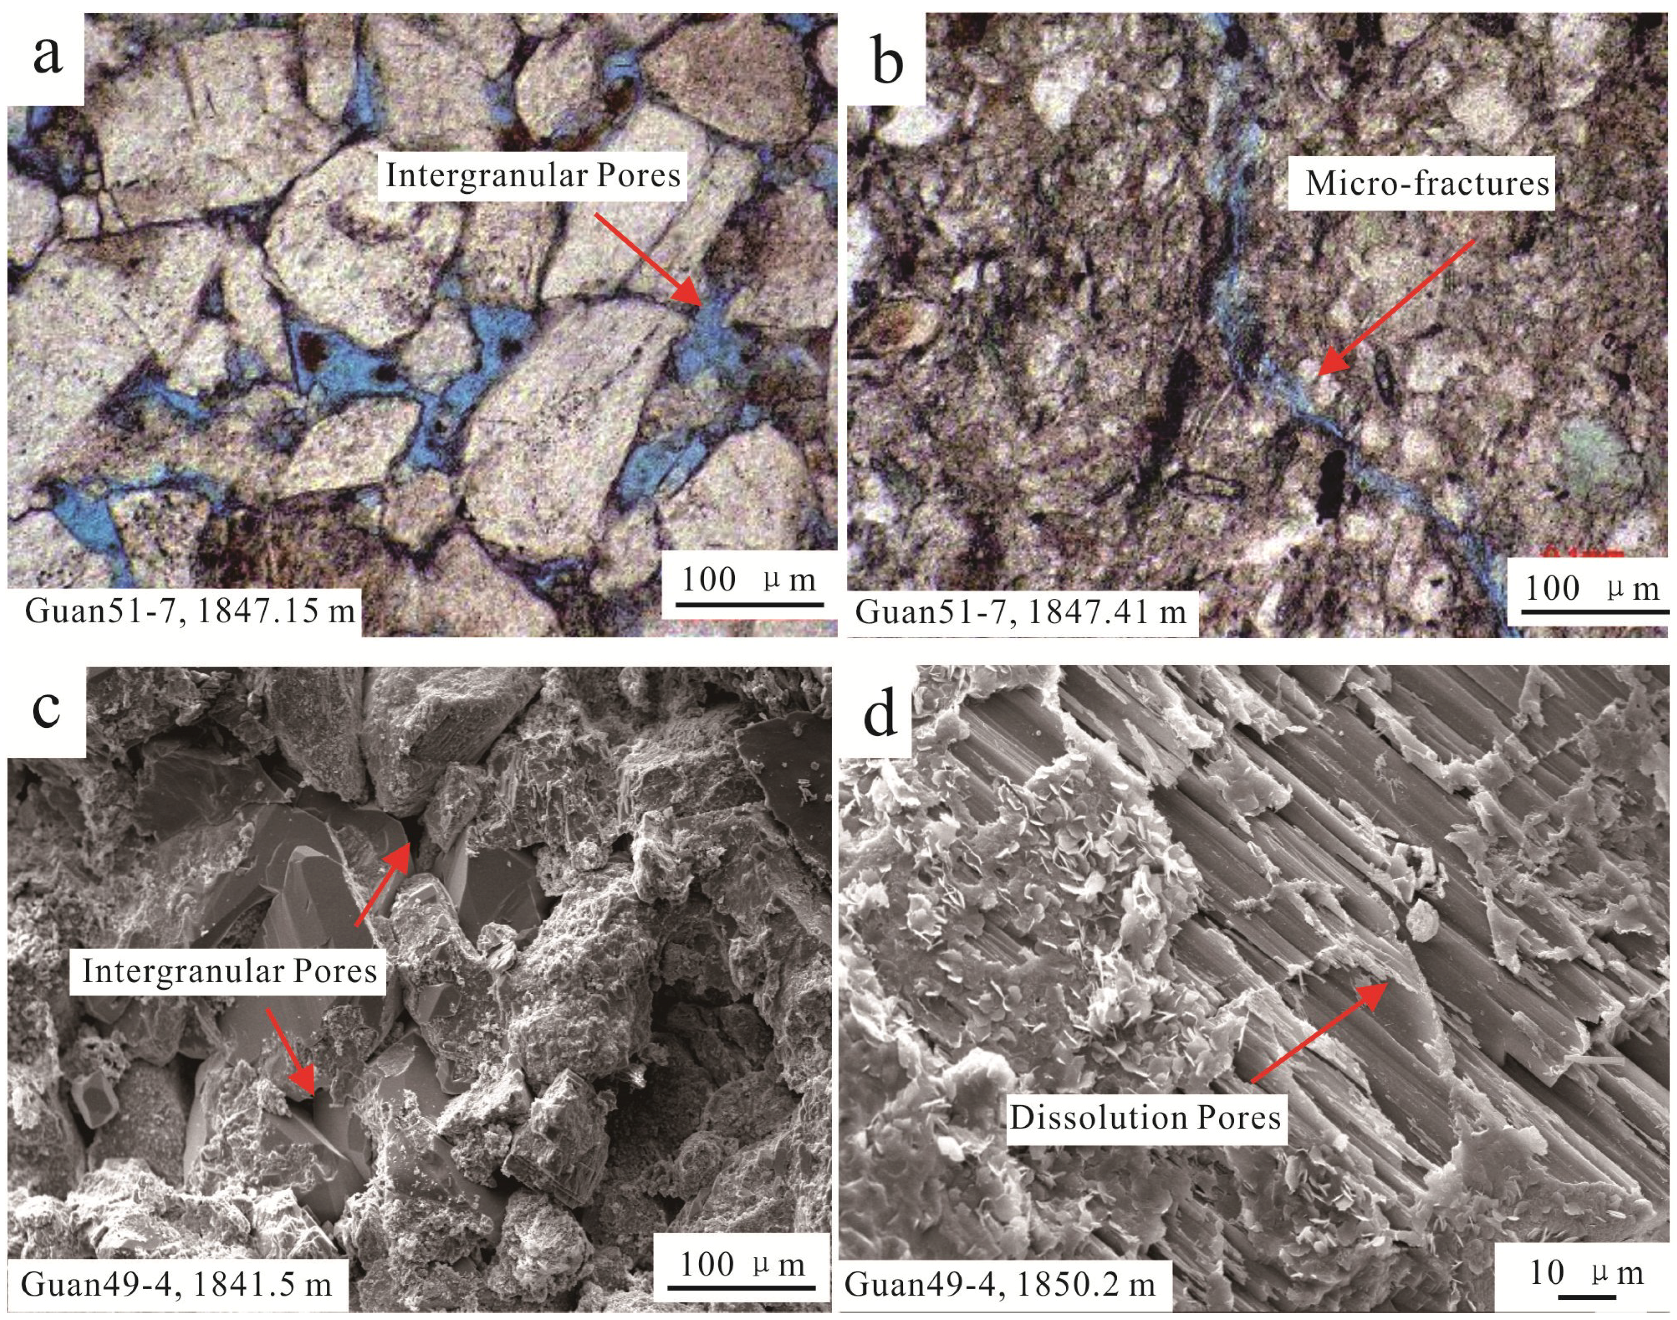
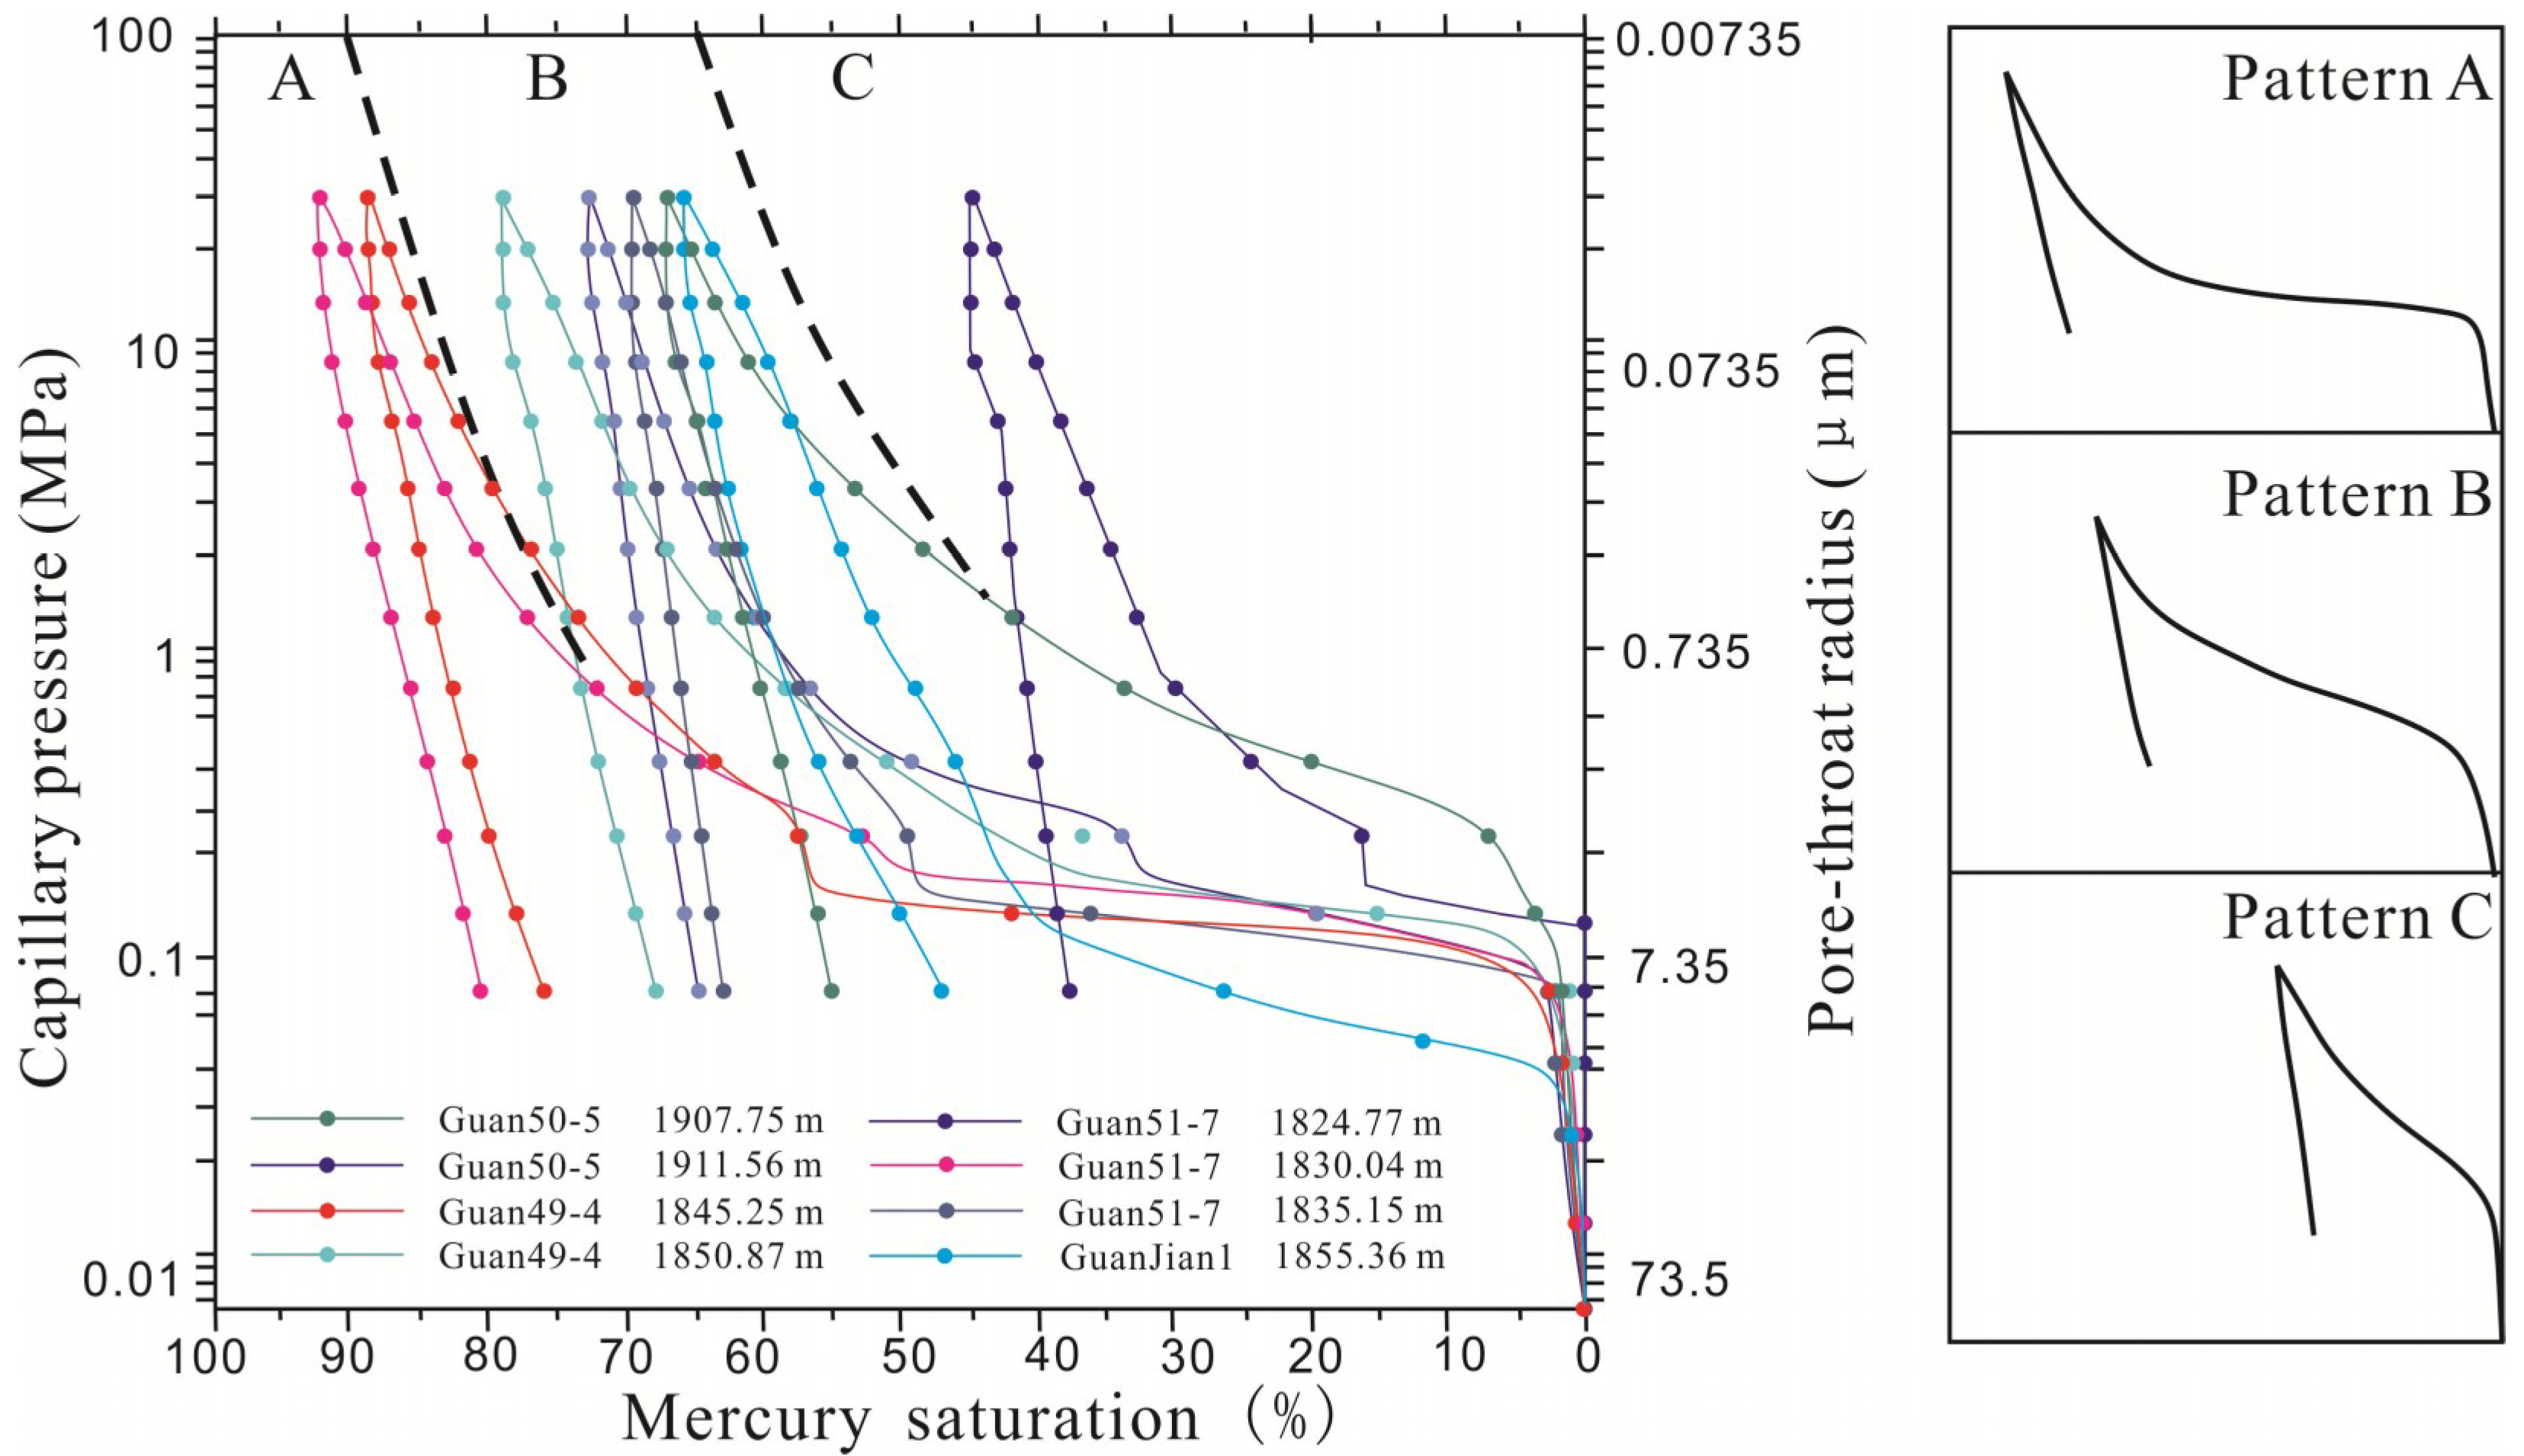
  • Three types of pores (intergranular pores, dissolution pores, and micro fractures) exist in the Kongdian Formation of the Wang guantun oilfield. The pore structures of the different types of pores are different. Intrusion and extrusion curves of PMI were divided into three patterns: the curves of pattern A have minimum Pt, widest horizontal stages, and maximum intake of mercury, which altogether represent larger pore throat radius, better sorting, and weaker heterogeneity. The intrusion curves of most samples in mouth bar sand bodies belong to pattern A or pattern B.
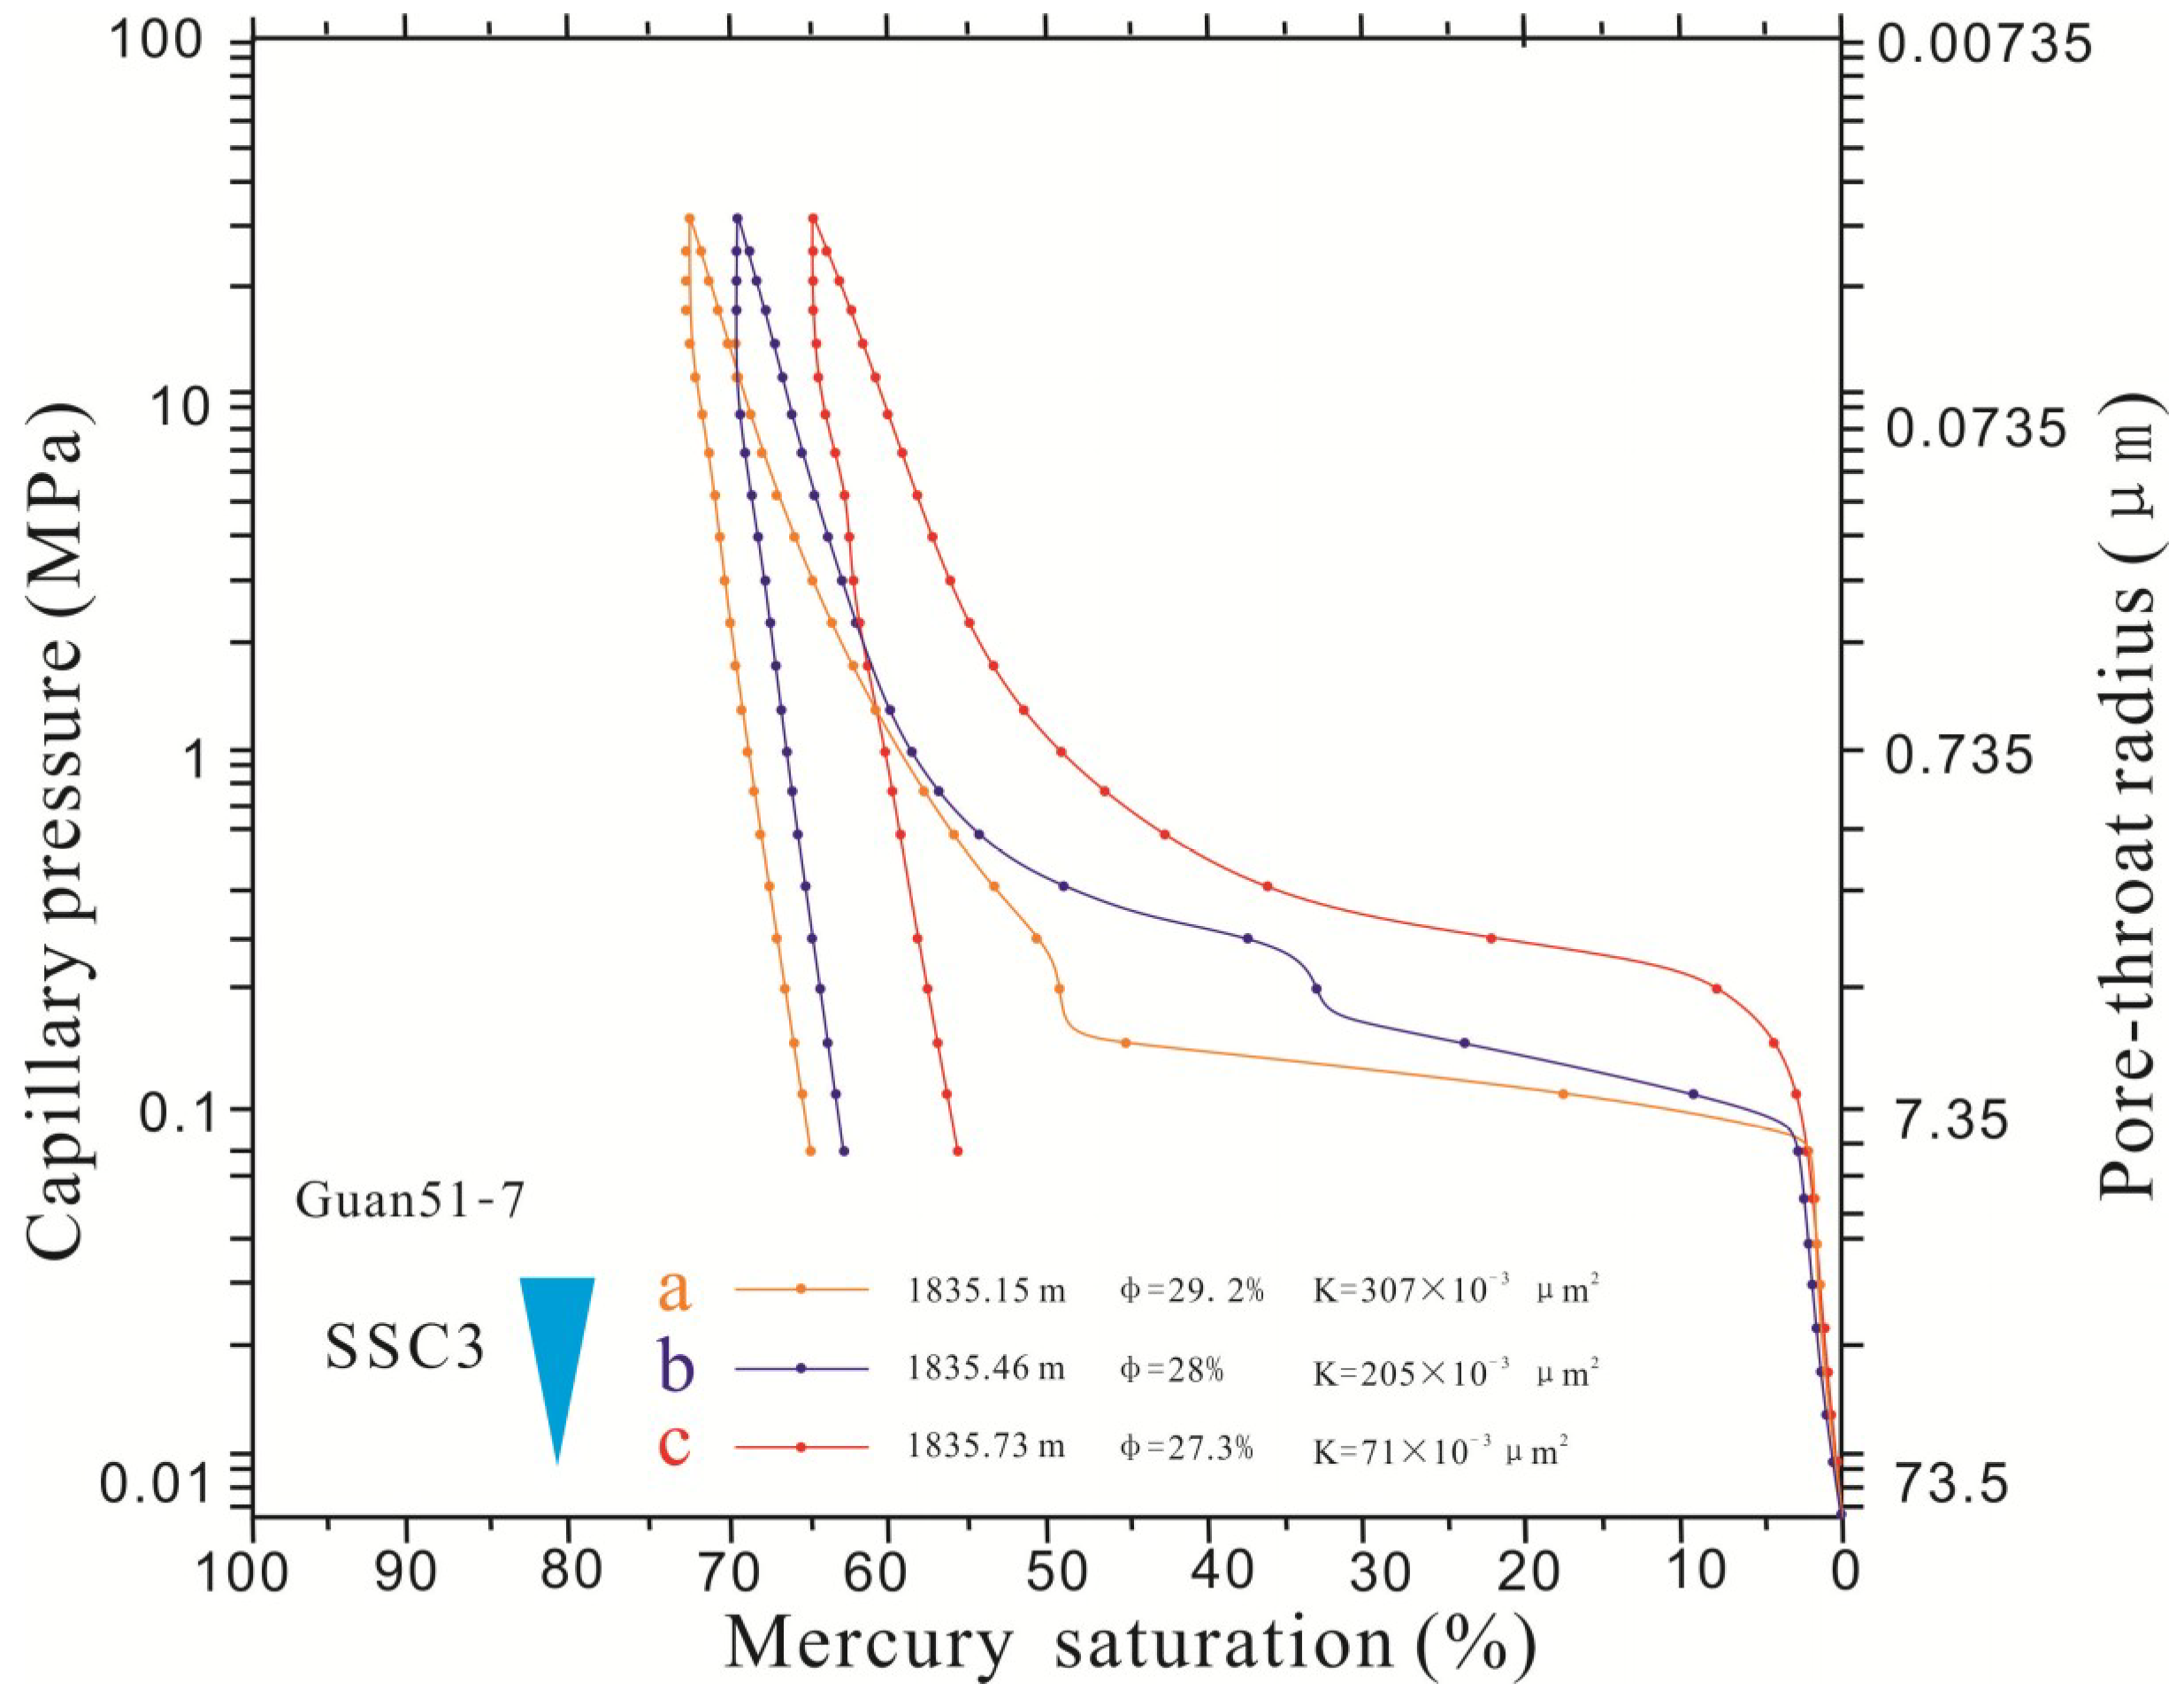
  • The pore structure heterogeneity in the early stage of the falling period of short-term base-level was stronger than that in the late stage, and pore size gradually became larger with the falling of short-term base-level; with the falling of middle-term base level, the pore size of late single mouth bar sand bodies were larger than those of early single mouth bar sand bodies, and the intrusion curves of samples tended to change from pattern B to pattern A; the pore size, porosity, and permeability in mouth bar sand bodies generally became larger with the falling of long-term base-level.
  • In the oilfield production process, especially in the delta depositional environment of a continental fault depression basin, the pore structure of the sand bodies in the late stage of the falling period of base-level cycles are better, and those sand bodies are also the more favorable targets for production.

Author Contributions

Conceptualization, J.H. and Y.L.; Data curation, L.J.; Formal analysis, J.S.; Resources, X.G.; Writing—Original Draft Preparation, X.W. Writing—Review & Editing, J.H. and X.W.

Funding

This research was funded by [National Science and Technology Major Project] grant number [2016ZX05010-001] and [2016ZX05014002-008], and [National Basic Research Program of China] grant number [2015CB250901].

Conflicts of Interest

The authors declare no conflict of interest.

References

  1. Durner, W. Hydraulic conductivity estimation for soils with heterogeneous pore structure. Water. Resour. Res. 1994, 30, 211–223. [Google Scholar] [CrossRef]
  2. Nelson, P.H. Pore throat sizes in sandstones, tight sandstones, and shales. AAPG Bull. 2009, 93, 329–340. [Google Scholar] [CrossRef]
  3. Ross, D.J.; Bustin, R.M. The importance of shale composition and pore structure upon gas storage potential of shale gas reservoirs. Mar. Petrol. Geol. 2009, 26, 916–927. [Google Scholar] [CrossRef]
  4. Ge, X.; Fan, Y.; Li, J.; Zahid, M.A. Pore structure characterization and classification using multifractal theory—An application in Santanghu basin of western China. J. Petrol. Sci. Eng. 2015, 127, 297–304. [Google Scholar] [CrossRef]
  5. Wang, X.; Hou, J.; Song, S.; Wang, D.M.; Gong, L.; Ma, K.; Liu, Y.M.; Li, Y.Q.; Lin, Y. Combining pressure-controlled porosimetry and rate-controlled porosimetry to investigate the fractal characteristics of full-range pores in tight oil reservoirs. J. Petrol. Sci. Eng. 2018, 171, 353–361. [Google Scholar] [CrossRef]
  6. Wang, R. Characteristics of micro-pore throat in ultra-low permeability sandstone reservoir. Acta Petrol. Sin. 2009, 30, 560–563. [Google Scholar] [CrossRef]
  7. Cai, J.C.; Wei, W.; Hu, X.Y.; Liu, R.C.; Wang, J.J. Fractal characterization of dynamic fracture network extension in porous media. Fractals 2017, 25, 1750023. [Google Scholar] [CrossRef]
  8. Li, C.; Ostadhassan, M.; Guo, S.; Gentzis, T.; Kong, L. Application of PeakForce tapping mode of atomic force microscope to characterize nanomechanical properties of organic matter of the Bakken Shale. Fuel 2018, 233, 894–910. [Google Scholar] [CrossRef]
  9. Li, C.; Ostadhassan, M.; Gentzis, T.; Kong, L.; Carvajal-Ortiz, H.; Bubach, B. Nanomechanical characterization of organic matter in the Bakken formation by microscopy-based method. Mar. Petrol. Geol. 2018, 96, 128–138. [Google Scholar] [CrossRef]
  10. Gong, L.; Fu, X.F.; Gao, S.; Zhao, P.Q.; Luo, Q.Y.; Zeng, L.B.; Yue, W.T.; Zhang, B.J.; Liu, B. Characterization and Prediction of Complex Natural Fractures in the Tight Conglomerate Reservoirs: A Fractal Method. Energies 2018, 11, 2311. [Google Scholar] [CrossRef]
  11. Gu, M.W.; Lu, S.F.; Xiao, D.H.; Guo, S.; Zhang, L. Present Situation of Core Mercury Injection Technology of Unconventional Oil and Gas Reservoir. Acta Geol. Sin.-Engl. 2015, 89 (Suppl. S1), 388–389. [Google Scholar] [CrossRef]
  12. Xi, K.L.; Cao, Y.C.; Beyene, G.H.; Zhu, R.K.; Jens, J.; Knut, B.; Zhang, X.X.; Helge, H. How does the pore throat size control the reservoir quality and oiliness of tight sandstones? The case of the Lower Cretaceous Quantou Formation in the southern Songliao Basin, China. Mar. Petrol. Geol. 2016, 76, 1–15. [Google Scholar] [CrossRef]
  13. Wang, X.; Hou, J.; Liu, Y.; Ji, L.; Sun, J. Studying reservoir heterogeneity by Analytic Hierarchy Process and Fuzzy Logic, case study of Es1x formation of the Wang guan tun oilfield, China. J. Petrol. Sci. Eng. 2017, 156, 858–867. [Google Scholar] [CrossRef]
  14. Cerepi, A.; Humbert, L.; Burlot, R. Pore-scale complexity of a calcareous material by time-controlled mercury porosimetry. Stud. Surf. Sci. Catal. 2000, 128, 449–458. [Google Scholar] [CrossRef]
  15. Zhao, J.J.; Liu, Z.W.; Xie, Q.C.; Zhou, J.P. Micro Pore Throat Structural Classification of Chang 7 Tight Oil Reservoir of Jiyuan Oilfield in Ordos Basin. China. Petrol. Exploit. 2014, 19, 73–79. [Google Scholar] [CrossRef]
  16. Zhu, H.Y.; An, L.Z.; Jiao, C.Y. The difference between constant-rate mercury injection and constant-pressure mercury injection and the application in reservoir assessment. Nat. Gas Geosci. 2015, 26, 1316–1322. [Google Scholar] [CrossRef]
  17. Curtis, M.E.; Ambrose, R.J.; Sondergeld, C.H. Transmission and Scanning Electron Microscopy Investigation of Pore Connectivity of Gas Shales on the Nanoscale. In Proceedings of the North American Unconventional Gas Conference and Exhibition, The Woodlands, TX, USA, 14–16 June 2011. [Google Scholar]
  18. Mendhe, V.A.; Mishra, S.; Khangar, R.G.; Kamble, A.D.; Kumar, D.; Varma, A.K.; Bannerjee, M. Organo-petrographic and pore facets of Permian shale beds of Jharia Basin with implications to shale gas reservoir. J. Earth Sci. 2017, 28, 897–916. [Google Scholar] [CrossRef]
  19. Singh, H. Representative Elementary Volume (REV) in spatio-temporal domain: A method to find REV for dynamic pores. J. Earth Sci. 2017, 28, 391–403. [Google Scholar] [CrossRef]
  20. Zhao, P.; Cai, J.; Huang, Z.; Ostadhassan, M.; Ran, F. Estimating permeability of shale gas reservoirs from porosity and rock compositions. Geophysics 2018, 83, MR283–MR294. [Google Scholar] [CrossRef]
  21. Kong, L.; Ostadhassan, M.; Li, C.; Tamimi, N. Pore characterization of 3D-printed gypsum rocks: A comprehensive approach. J. Mater. Sci. 2018, 53, 5063–5078. [Google Scholar] [CrossRef]
  22. Bloomfield, J.; Gooddy, D.; Bright, M.; Williams, P. Pore throat size distributions in permo-triassic sandstones from the United Kingdom and some implications for contaminant hydrogeology. Hydrogeol. J. 2001, 9, 219–230. [Google Scholar] [CrossRef]
  23. Bai, B.; Zhu, R.K.; Wu, S.T.; Yang, W.J.; Jeff, G. Multi- scale of Nano (Micro)-CT study on microscopic pore structure of tight sandstone of Yanchang Formation, Ordos Basin. Petrol. Explor. Dev. 2013, 40, 329–333. [Google Scholar] [CrossRef]
  24. Kong, L.; Ostadhassan, M.; Li, C.; Tamimi, N. Can 3-D Printed Gypsum Samples Replicate Natural Rocks? An Experimental Study. Rock Mech. Rock Eng. 2018, 1–14. [Google Scholar] [CrossRef]
  25. Ju, Y.; Sun, Y.; Tan, J.; Bu, H.; Han, K.; Li, X.; Fang, L. The composition, pore structure characterization and deformation mechanism of coal-bearing shales from tectonically altered coalfields in eastern China. Fuel 2018, 234, 626–642. [Google Scholar] [CrossRef]
  26. Tang, S.W.; Wang, L.; Cai, R.J. The evaluation of electrical impedance of three-dimensional fractal networks embedded in a cube. Fractals 2017, 25, 1740005. [Google Scholar] [CrossRef]
  27. Wang, L.; Zhao, N.; Sima, L.Q.; Meng, F.; Guo, Y.H. Pore Structure Characterization of the Tight Reservoir: Systematic Integration of Mercury Injection and Nuclear Magnetic Resonance. Energy Fuel 2018, 32, 7471–7484. [Google Scholar] [CrossRef]
  28. Wang, X.X.; Hou, J.G.; Liu, Y.M.; Zhao, P.Q.; Ma, K.; Wang, D.M.; Ren, X.X.; Yan, L. Overall PSD and fractal characteristics of tight oil reservoirs: A case study of lucaogou formation in junggar basin, China. Fractals 2019, 1, 1940005. [Google Scholar] [CrossRef]
  29. Read, W.A.; Forsyth, I.H. Allocycles and Autocycles in the Upper Part of the Limestone Coal Group (Pendleian E1) in the Glasgow–Stirling Region of the Midland Valley of Scotland. Geol. J. 1989, 24, 121–137. [Google Scholar] [CrossRef]
  30. Deng, H.W.; Wang, H.L.; Li, X.Z. Identification, comparison technique and application of sequence stratigraphic datum. Petrol. Nat. Gas Geol. 1996, 17, 177–184. [Google Scholar] [CrossRef]
  31. Zheng, R.C.; Yin, S.M.; Peng, J. Sedimentary dynamics analysis of base level cycle structure and superimposed style. J. Sediment. 2000, 18, 369–375. [Google Scholar] [CrossRef]
  32. Deng, H.W.; Wang, H.L.; Ning, N. Principle of sediment volume distribution: Basic theory of high resolution stratigraphy. Front. Earth Sci. 2000, 7, 305–313. [Google Scholar] [CrossRef]
  33. Miall, A.D. Reconstructing the architecture and sequence stratigraphy of the preserved fluvial record as a tool for reservoir development: A reality check. AAPG Bull. 2006, 90, 989–1002. [Google Scholar] [CrossRef]
  34. Pittman, E.D. Relationship of porosity and permeability to various parameters derived from mercury injection-capillary pressure curves for sandstone (1). AAPG Bull. 1992, 76, 191–198. [Google Scholar] [CrossRef]
  35. Yao, Y.; Liu, D. Comparison of low-field NMR and mercury intrusion porosimetry in characterizing pore size distributions of coals. Fuel 2012, 95, 152–158. [Google Scholar] [CrossRef]
  36. Clarkson, C.R.; Solano, N.; Bustin, R.M.; Bustin, A.; Chalmers, G.; He, L. Pore structure characterization of North American shale gas reservoirs using USANS/SANS, gas adsorption, and mercury intrusion. Fuel 2013, 103, 606–616. [Google Scholar] [CrossRef]
  37. Wang, S.; Wu, T.; Cao, X.; Zheng, Q.; Ai, M. A Fractal Model for Gas Apparent Permeability in Microfractures of Tight/shale Reservoirs. Fractals 2017, 25, 1750036. [Google Scholar] [CrossRef]
  38. Toledo, P.G.; Scriven, L.E.; Davis, H.T. Pore-space statistics and capillary pressure curves from volume-controlled porosimetry. SPE Form. Eval. 1994, 9, 46–54. [Google Scholar] [CrossRef]
  39. Zhao, H.; Ning, Z.; Wang, Q.; Zhang, R.; Zhao, T.; Niu, T.; Zeng, Y. Petrophysical characterization of tight oil reservoirs using pressure-controlled porosimetry combined with rate-controlled porosimetry. Fuel 2015, 154, 233–242. [Google Scholar] [CrossRef]
  40. Wang, X.; Hou, J.G.; Liu, Y.M.; Dou, L.X.; Sun, J.; Gong, X. Quantitative characterization of vertical heterogeneity of mouth bar based on the analitic hierarchy process and the fuzzy mathematics: A case study of Guan195 fault block of Wangguantun Oilfield. Nat. Gas Geosci. 2017, 1914–1923. [Google Scholar] [CrossRef]
  41. Liang, H.W.; Wu, S.H.; Yue, D.L. Base-level cyclic controls on the reservoir macro-heterogeneity: A case study of the mouth bar in 2block of the Shengtuo oilfield. J. Chin. Univ. Min. Technol. 2013, 42, 413–420. [Google Scholar] [CrossRef]
  42. Tang, M.A.; Sun, B.L. Relationship between base-level cycles and hiberarchy of reservoir flow units of Lower Shihezi Formation in Daniudi Gas field. Acta Sedimentol. Sin. 2007, 1, 39–47. [Google Scholar] [CrossRef]
  43. Xu, E.A.; Li, X.L.; Wang, Q.K.; Xia, G.C.; Dong, L.Y.; Li, Z.W. Main controlling factor and model of Kongdian Formation hydrocarbon accumulation in Kongnan Area of Huanghua Depression. Fault Oil Gas Field 2014, 21, 278–281. [Google Scholar] [CrossRef]
  44. Neng, Y.; Qi, J.F.; LI, T.H.; Zhang, G.; Li, M.G.; Shi, K.T. Characteristics of Cenozoic Fault System and Its Significance in Petroleum Geology in Kongnan Area, Huanghua Depression. Geoscience 2009, 23, 1077–1084. [Google Scholar] [CrossRef]
  45. Sung, K.; Jin, Z.K.; Wang, X.W.; Zhang, A.H.; Duan, Z.Q.; Wang, C.S.; Zhang, G.H. Control of sedimentary facies on reservoir quality—An example from Zao II and III oil sets in Wangguantun Oilfield, Huanghua Depression. Petrol. Explor. Dev. 2006, 33, 335–339. [Google Scholar] [CrossRef]
  46. Shi, Z.Z.; Ji, Y.L. Fan-delta Sedimentation Formed under the Environment of Lake Level Frequently Varying—Taking the First Member of Kongdian Formation, Huanghua Depression as an Example. J. Xi’an Petrol. Inst. 2002, 17, 24–28. [Google Scholar] [CrossRef]
  47. Ziarani, A.S.; Aguilera, R. Pore throat radius and tortuosity estimation from formation resistivity data for tight-gas sandstone reservoirs. J. Appl. Geophys. 2012, 83, 65–73. [Google Scholar] [CrossRef]
  48. Yang, Q.; Qi, J.F.; Chang, D.S.; Li, M.G. Tectonpalaeogeography during the deposition of Paleogene Kongdian Formation in Kongnan area, Huanghua Depression of Bohai Bay Bain. J. Palaeogeogr. 2009, 3, 306–313. [Google Scholar] [CrossRef]
  49. Xue, L.F.; Sun, J.; Chen, C.W.; Xu, X.K.; Meng, Q.L.; Yan, Q.H. Tectonic sedimentary evolution of the first and second members of the Kongdian Formation in southern Kongdian, Huanghua depression. Sediment. Geol. Tethyan Geol. 2006, 28, 62–68. [Google Scholar] [CrossRef]
  50. Thomas, L.K.; Katz, D.L.; Tek, M.R. Threshold pressure phenomena in porous media. Soc. Petrol. Eng. J. 1968, 8, 174–184. [Google Scholar] [CrossRef]
  51. Rogers, J.J.; Head, W.B. Relationships between porosity, median size, and sorting coefficients of synthetic sands. J. Sediment. Res. 1961, 31, 467–470. [Google Scholar] [CrossRef]
  52. Brown, C.E. Coefficient of variation. In Applied Multivariate Statistics in Geohydrology and Related Sciences; Springer Science & Business Media: Berlin, Germany, 1998; pp. 155–157. [Google Scholar]
  53. Sepaskhah, A.R.; Ghahraman, B. The effects of irrigation efficiency and uniformity coefficient on relative yield and profit for deficit irrigation. Biosyst. Eng. 2004, 87, 495–507. [Google Scholar] [CrossRef]
  54. Washburn, E.W. The dynamics of capillary flow. Phys. Rev. 1921, 17, 273–283. [Google Scholar] [CrossRef]
Figure 1. (a) Location map of the study area and sub-tectonic units of the Bohaiwan Basin. (I) JiZhong depression zone, (II) CangXian uplift zone, (III) ChengNing uplift zone, (IV) JiYang depression zone, (V) BoZhong depression zone, (VI) XingHeng uplift zone, (VII) LinQing depression zone, (VIII) LiaoHe uplift zone; (b) The sub-tectonic units of the study area and well locations.
Energies 11 02617 g001
Figure 2. Stratigraphy, lithology, and thickness of Kongdian Formation in the study area (modified from Neng et al. [44]).
Energies 11 02617 g002
Figure 3. The synthetic pattern of the base-level cycle of the study area. SP, spontaneous potential curve; GR, gamma-ray curve; RT, resistivity curve.
Energies 11 02617 g003
Figure 4. Cycle identification and stratigraphic correlation. SP, spontaneous potential curve; RT, resistivity curve.
Energies 11 02617 g004
Figure 5. Sedimentary facies map in ZV of the Wang guantun area.
Energies 11 02617 g005
Figure 6. Reservoir properties of sandstones: (a) porosity distribution; (b) permeability distribution. n is the sample quantity.
Energies 11 02617 g006
Figure 7. Typical pore types: (a) micrograph of casting sheet image showing intergranular pores; (b) micrograph of casting sheet image showing micro fractures; (c) micrograph of SEM showing intergranular pores; (d) micrograph of SEM showing dissolution pores.
Energies 11 02617 g007
Figure 8. Intrusion and extrusion curves of the Pressure mercury method and the three patterns of intrusion and extrusion curves.
Energies 11 02617 g008
Figure 9. Illustrates the parameters derived from PMI experiments which are characterizing pore throat distribution. The “frequency” on the y-axis represents the sample ratio of each value intervals, n is the sample quantity. (a) Distribution of average pore-throat radius; (b) distribution of maximum pore-throat radius; (c) distribution of maximum mercury intrusion saturation; (d) distribution of residual mercury saturation; (e) distribution of sorting coefficient of pore-throat; (f) distribution of coefficient of variation of pore-throat; (g) distribution of homogeneity coefficient of pore-throat; (h) distribution of characteristic structure coefficient; (i) distribution of lithology coefficient.
Energies 11 02617 g009
Figure 10. Intrusion and extrusion curves of PMI test of the samples in SSC3 (Well Guan51-7).
Energies 11 02617 g010
Figure 11. Pore throat size distributions by PMI of the samples in SSC3 (Well Guan51-7).
Energies 11 02617 g011
Figure 12. Pore structure of the samples in SSC3 (Well Guan51-7).
Energies 11 02617 g012
Figure 13. Intrusion and extrusion curves of PMI of the samples in MSC1.
Energies 11 02617 g013
Figure 14. Pore throat size distributions by PMI of the samples in MSC1.
Energies 11 02617 g014
Figure 15. Relationship diagram between the pore structure of mouth-bar sand bodies and MSC.
Energies 11 02617 g015
Table 1. Lithological and logging curve characteristics of different micro-facies.
Micro-Facies TypeCurve ModelLithological CharacteristicsLogging Curve CharacteristicsSedimentary Structure
Mouth bar micro-facies
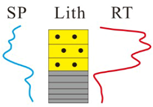
 Energies 11 02617 i001Medium sand; Fine sandFunnel shaped; Box shapedCross bedding
Wavy bedding
Parallel bedding
Lenticular bedding
Underwater distributary channel micro-facies Energies 11 02617 i002Gravel bearing sandstone; Medium sand; Fine sandBell shaped; Box shapedGraded bedding
Wavy bedding
Parallel bedding
Cross-bedding
Sheet sand Energies 11 02617 i003Medium sand; Fine sandFinger shapedParallel bedding
Cross-bedding
Distributary bay micro-facies Energies 11 02617 i004Mainly mudstoneLow amplitude tooth curve or straight sectionHorizontal bedding
Wormhole
Table 2. Impacts of the base-level cycle on pore structure of mouth bar.
CyclesWith the Falling of Base-Level
Pore SizePore-Throat DistributionPorosityPermeability
SSCGradually increasingGetting more uniformGetting largerGetting larger
MSCPore size of the sand body in the late period is largerGetting more uniformThe porosity of the sand body in the late period is largerThe permeability of the sand body in the late period is larger

