Article

Assessing the Effect of Incentive Policies on Residential PV Investments in Colombia

Department of Engineering, Natural Sciences and Engineering Faculty, Universidad Jorge Tadeo Lozano, Bogota 110311, Colombia
*
Author to whom correspondence should be addressed.
Energies 2018, 11(10), 2614; https://doi.org/10.3390/en11102614
Submission received: 30 August 2018 / Revised: 24 September 2018 / Accepted: 28 September 2018 / Published: 1 October 2018
(This article belongs to the Section A: Sustainable Energy)

Abstract

:
As the cost of solar photovoltaic (PV) falls, their potential for transforming modern electricity generation increases. Solar PV provides a simpler way of producing clean and affordable energy, which makes it an attractive investment. Great investments in solar PV have occurred in industrialized countries, but government efforts to promote this technology have not been effective in nonindustrialized countries. Despite this, some of these countries may have a high solar PV potential, such as Colombia, where policies to encourage solar PV are only just starting to take place. Therefore, this paper proposes a simulation model to assess different policies—feed-in tariff, net metering, and capital subsidy—to promote solar PV investments in the Colombian residential sector. Policies are assessed considering the criteria of efficiency and effectiveness. Simulation results suggest that (i) net metering is the most efficient policy with a cost indicator of 20,298 USD/MW; (ii) feed-in tariff is the most effective policy as it reaches the highest level of avoided CO2 emissions—4,792,823 million tons of CO2—and a meaningful PV installed capacity of 7522 MW; (iii) capital subsidy is the least efficient policy as it has the highest cost indicator of 509,616 USD/MW.

1. Introduction

Global investments of solar photovoltaics (PV) grew from 303 GW in 2016 to 402 GW in 2017—a growth of about 32% [1]. In 2017, the leading countries in terms of cumulative installed capacity of solar PV were China (131 GW), USA (51 GW), Japan (49 GW), and Germany (42 MW) [2]. During 2017, investment in solar PV technology for electricity generation was about 55% of newly installed power capacity, exceeding net additions of fossil fuels and nuclear power [1]. Underlying this growth has been significant cost reductions, with the cost of solar PV decreasing by 73% between 2010 and 2017 [3]. Besides, solar PV cost is predicted to fall even further by as much as 59% by 2025 [4].
Solar PV at distributed scale has particularly gained importance in recent years. Distributed solar PV is defined as small-scale electricity generation that is not centrally planned or dispatched, located near to the point of consumption, and usually connected to the distribution network [5]. Distributed solar PV in the residential sector is categorized as microdistributed generation, which covers a PV system size lower than 5 kW [6]. Australia has the highest proportion of residential distributed solar PV in the world; in fact, some suburbs in Australia have recorded household solar PV penetration rates above 50% [7].
Distributed solar PV has the potential to transform the power sector as it is clean, less expensive than conventional technologies, and offers improved quality/level of service [8]. Other advantages of distributed solar PV include its modular character, easy installation, and low maintenance costs [9].
Countries with high levels of distributed solar PV are already leading the integration of this technology into the grid. This has given rise to some potential challenges to the present power sector relating to technical and economic aspects [10,11]. However, under the right regulation and market design, distributed solar PV may be harnessed to establish a more efficient and cleaner electricity system than the current one [12].
In countries with low deployment of distributed solar PV, policy incentives carried out under reliable institutions are essential for promoting investment in this technology [13]. Evidence suggests that the countries producing the most solar PV power have been implementing strong policies to encourage the uptake of solar PV. Some of these policies include feed-in tariff (FIT), net metering, and capital subsidies [14]. These policies can be defined as follows: (i) feed-in tariff scheme involves PV producers receiving a fixed price for every unit of electricity produced during a specified period [15]; (ii) net metering scheme entails PV customers offsetting their electricity consumption against their PV production over an entire billing period [16]; and (iii) capital subsidies reduce the upfront investment cost, which is equivalent to a fixed percentage of the total investment cost [16,17].
Design these PV policies is not an easy task, and incentives to solar PV must contribute to learning effects [18]. However, as solar PV is becoming cost-competitive, there is a danger of overly generous solar PV incentives creating windfall profits for investors at a high public cost [15,19]. At the same time, subsidy cuts due to grid parity of solar PV may lead to investment drops in new solar capacity—as has already occurred in countries such as Italy, Spain, and Greece—affecting the achievement of renewable targets [20].
Energy policy design is a complex issue involving multiple stakeholders and interrelationships, depicting the dynamic behavior of the energy system [21]. A simulation model should be able to represent the dynamic behavior of the energy system to understand the structures that could lead to a sustainable energy policy [22]. The system dynamics (SD) methodology has emerged as a suitable approach to build a simulation model with the aforementioned feature. This methodology has been used to assess energy policies as it links observable patterns of behavior of a system to micro-level structure and decision making processes [22]. The SD methodology applies control theory to social systems, and it also consists of a system of ordinary differential equations [23].
Much research has been devoted to assessing the effect of policy on the diffusion of solar PV for industrialized countries [19,24,25]. Some studies have even focused on analyzing the performance of policies under criteria such as effectiveness and efficiency [26,27,28]. However, research relating to nonindustrialized countries is limited. This is particularly the case for the Colombian electricity market, although efforts have been previously made focusing on the transformative effect of distributed solar PV on the country’s power industry [29,30,31]. The objective of this paper was therefore to assess different policies to promote solar PV investment in the Colombian residential sector. The three policies—feed-in tariff, net metering, and capital subsidy—were analyzed using the criteria of efficiency and effectiveness. To reach this objective, a simulation model based on SD was built.
The rest of the paper is organized as follows: Section 2 provides a literature review about different approaches to the analysis of policy effects on solar PV investment. Section 3 is concerned with the simulation model that was used to accomplish the research objective. Section 4 provides a brief overview of the main results. Section 5 presents the impacts of PV policies and their design elements and draws conclusions.

2. Literature Review

This review identifies the full and complex landscape of existing literature about PV policies in promoting residential PV systems. In this section, publications are categorized into the following topics: (i) assessment of policies supporting renewables according to the criteria of efficiency, effectiveness, and equity; (ii) comparative assessment of the economic viability of renewable policies; and (iii) systemic approach to compare renewable policies.
Traditionally, governments around the world have intervened to effectively promote renewable power generation [32]. When grid parity is reached, incentives for renewables tend to be revised to keep pace with falling technology costs [15]. Policy instruments are still necessary to spur the investment in renewable technologies [33], and policymakers have been using different types of supporting policies to support the adoption of PV systems. The most used policy instruments include feed-in tariffs, net metering, and capital subsidies [16]. Instrument policies for promoting solar PV must be designed considering criteria such as effectiveness, efficiency, and equity [34]. Effectiveness entails accomplishing a renewable target and is measured as the amount of renewable power capacity in a given period [26]. Efficiency is equivalent to the ratio between outcomes and efforts, and it implies that renewable energy should be supplied to the end user at the least cost [35]. Efficiency is a static criteria, although dynamic efficiency considers the future effect of policies on technological improvements and cost reductions of renewable technologies [36]. Finally, equity performance is measured through two aspects: “polluter pays” principle and the right allocation of expenditures and revenues to customers [26].
Several studies have focused on comparing different policies to support renewables, considering their performance based on the criteria of effectiveness, efficiency, and equity [26,27,28]. Using a qualitative analysis to assess feed-in tariff and tradable green certificates, these studies highlighted feed-in tariff as the policy that showed better performance in terms of the aforementioned criteria [26,28]. In these papers, the discussion was focused on comparing price-driven against quantity-driven mechanism that correspond to feed-in tariff and tradable green certificates, respectively [37].
Furthermore, in recent years, net metering have gained worldwide importance as a tool for fostering distributed solar PV [38]. Net metering is categorized as an indirect method to support solar PV; this is in contrast to feed-in tariff, which is considered a direct method [15]. Several studies have compared net metering versus feed-in tariff schemes from a financial perspective. For instance, Sarasa-Maestro et al. [19] employed a financial model to calculate the internal rate of return of feed-in tariff, tradable green certificates with quota systems, tax support and incentives for investment, and bid to quota system. The analysis was carried out for several EU countries, and the authors warned about the danger of high feed-in tariff rates that affect affordability and can lead to windfall profits to investors.
Dusonchet and Telaretti [16] carried out a comparison of economic indexes, such as net present value (NPV) and internal rate of return (IRR), for PV systems in four EU countries—France, Germany, Greece, and Italy. Supporting measures such as feed-in tariff, net metering, and capital subsidies were evaluated for each country, and the paper showed that countries with net metering scheme obtained the best financial results due to higher electricity costs.
La Monaca and Ryan [39] presented a detailed model of household electricity demand and PV generation using Ireland as a case study. This model was more precise in calculating the financial gains of residential customers with PV system and exploring how those gains were affected by economic policy support. Net metering, fixed feed-in tariff, and declining feed-in tariff were studied specifically, and the results showed that net metering provides the best financial returns to residential customers with PV systems.
Yamamoto [40] used a microeconomic model to compare feed-in tariffs, net metering, and net purchase and sale as mechanisms to compensate PV generation in the residential sector. The study found that the mechanism that most contributed to social welfare differed depending on the amount of reduction in electricity consumption—if the reduction was small, a feed-in tariff produced more social welfare.
Finally, Poullikkas [41] presented a comparative study between net metering and feed-in tariff using an optimization algorithm. In this paper, the case study was the Cyprus electricity market. Results showed that net metering may become more profitable than feed-in tariff; when household electricity bill is considered, net metering may perform better than feed-in tariff.
Previous studies offer a very static perspective on the performance of policy instruments. A long-term and global perspective of the dynamics behind these policy instruments is therefore necessary to avoid policy resistance. In other words, it is necessary to analyze long-term effects of policies in order to avoid side effects such as windfall profits or free-riding. Studies that have applied a systemic approach to address this problem either only analyzed one policy [42], were focused on studying the effect of PV policies in a particular city instead of a country [43], were applied to industrialized countries [24], or only analyzed some of the PV policies proposed here [44]. For this reason, this paper used a simulation model based on SD methodology to analyze the performance of various policies to promote solar PV investment in the Colombian residential sector, with effectiveness and efficiency used as the criteria to compare these policies. The model was applied taking Colombia as a nonindustrialized country case study. Although efforts to analyze this country have been previously made by focusing on the transformative effect of distributed solar PV in the country’s power industry, the country remains largely unexplored in this regard [25,26,27]. Further, Colombia is an interesting case study as it has a high solar potential, with the average solar radiation measuring 4.5 kWh/m2/day [29,30,45,46]. Additionally, the government has taken an important step in supporting the development of renewable energies through Law 1715 [47].

3. Simulation Model

In this section, the simulation model is described in two stages. First, the dynamic hypothesis is presented, which depicts the structure of the diffusion of solar PV considering feedbacks, delays, and nonlinearities. Second, the subsystem diagram, the main equations, and the simulation model built with Vensim are shown, which are useful to represent the behavior patterns.

3.1. Dynamic Hypothesis

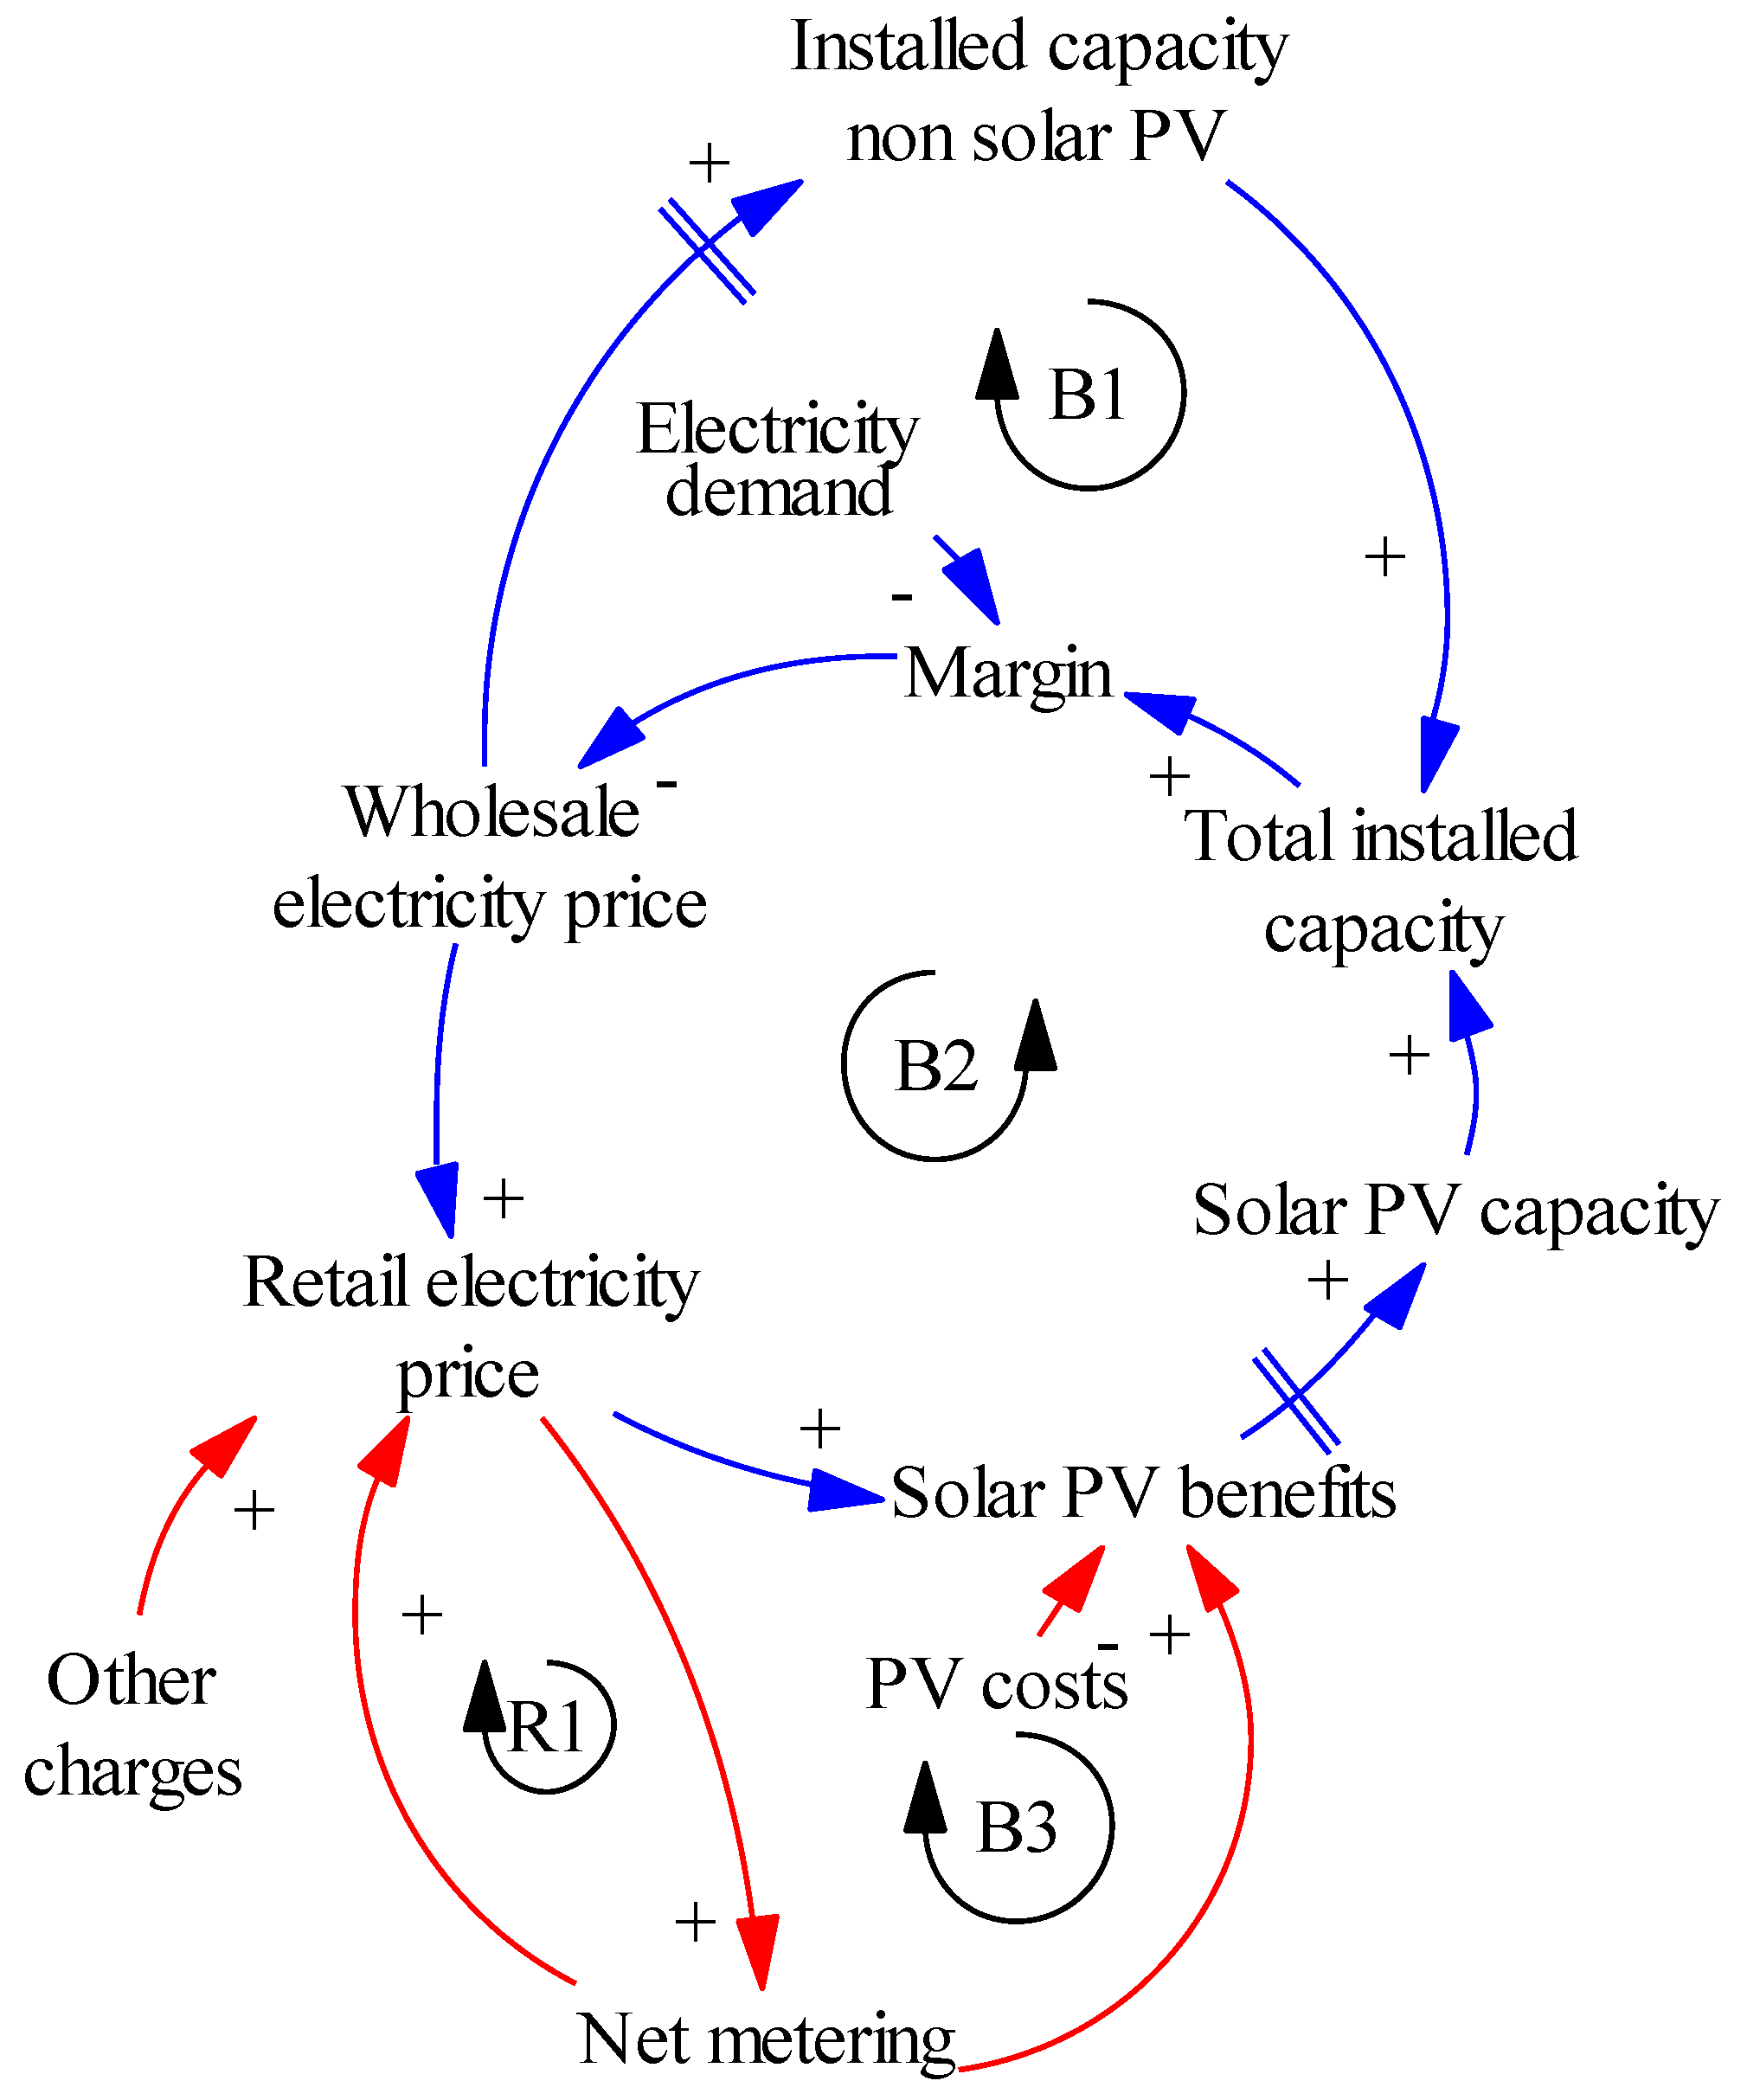
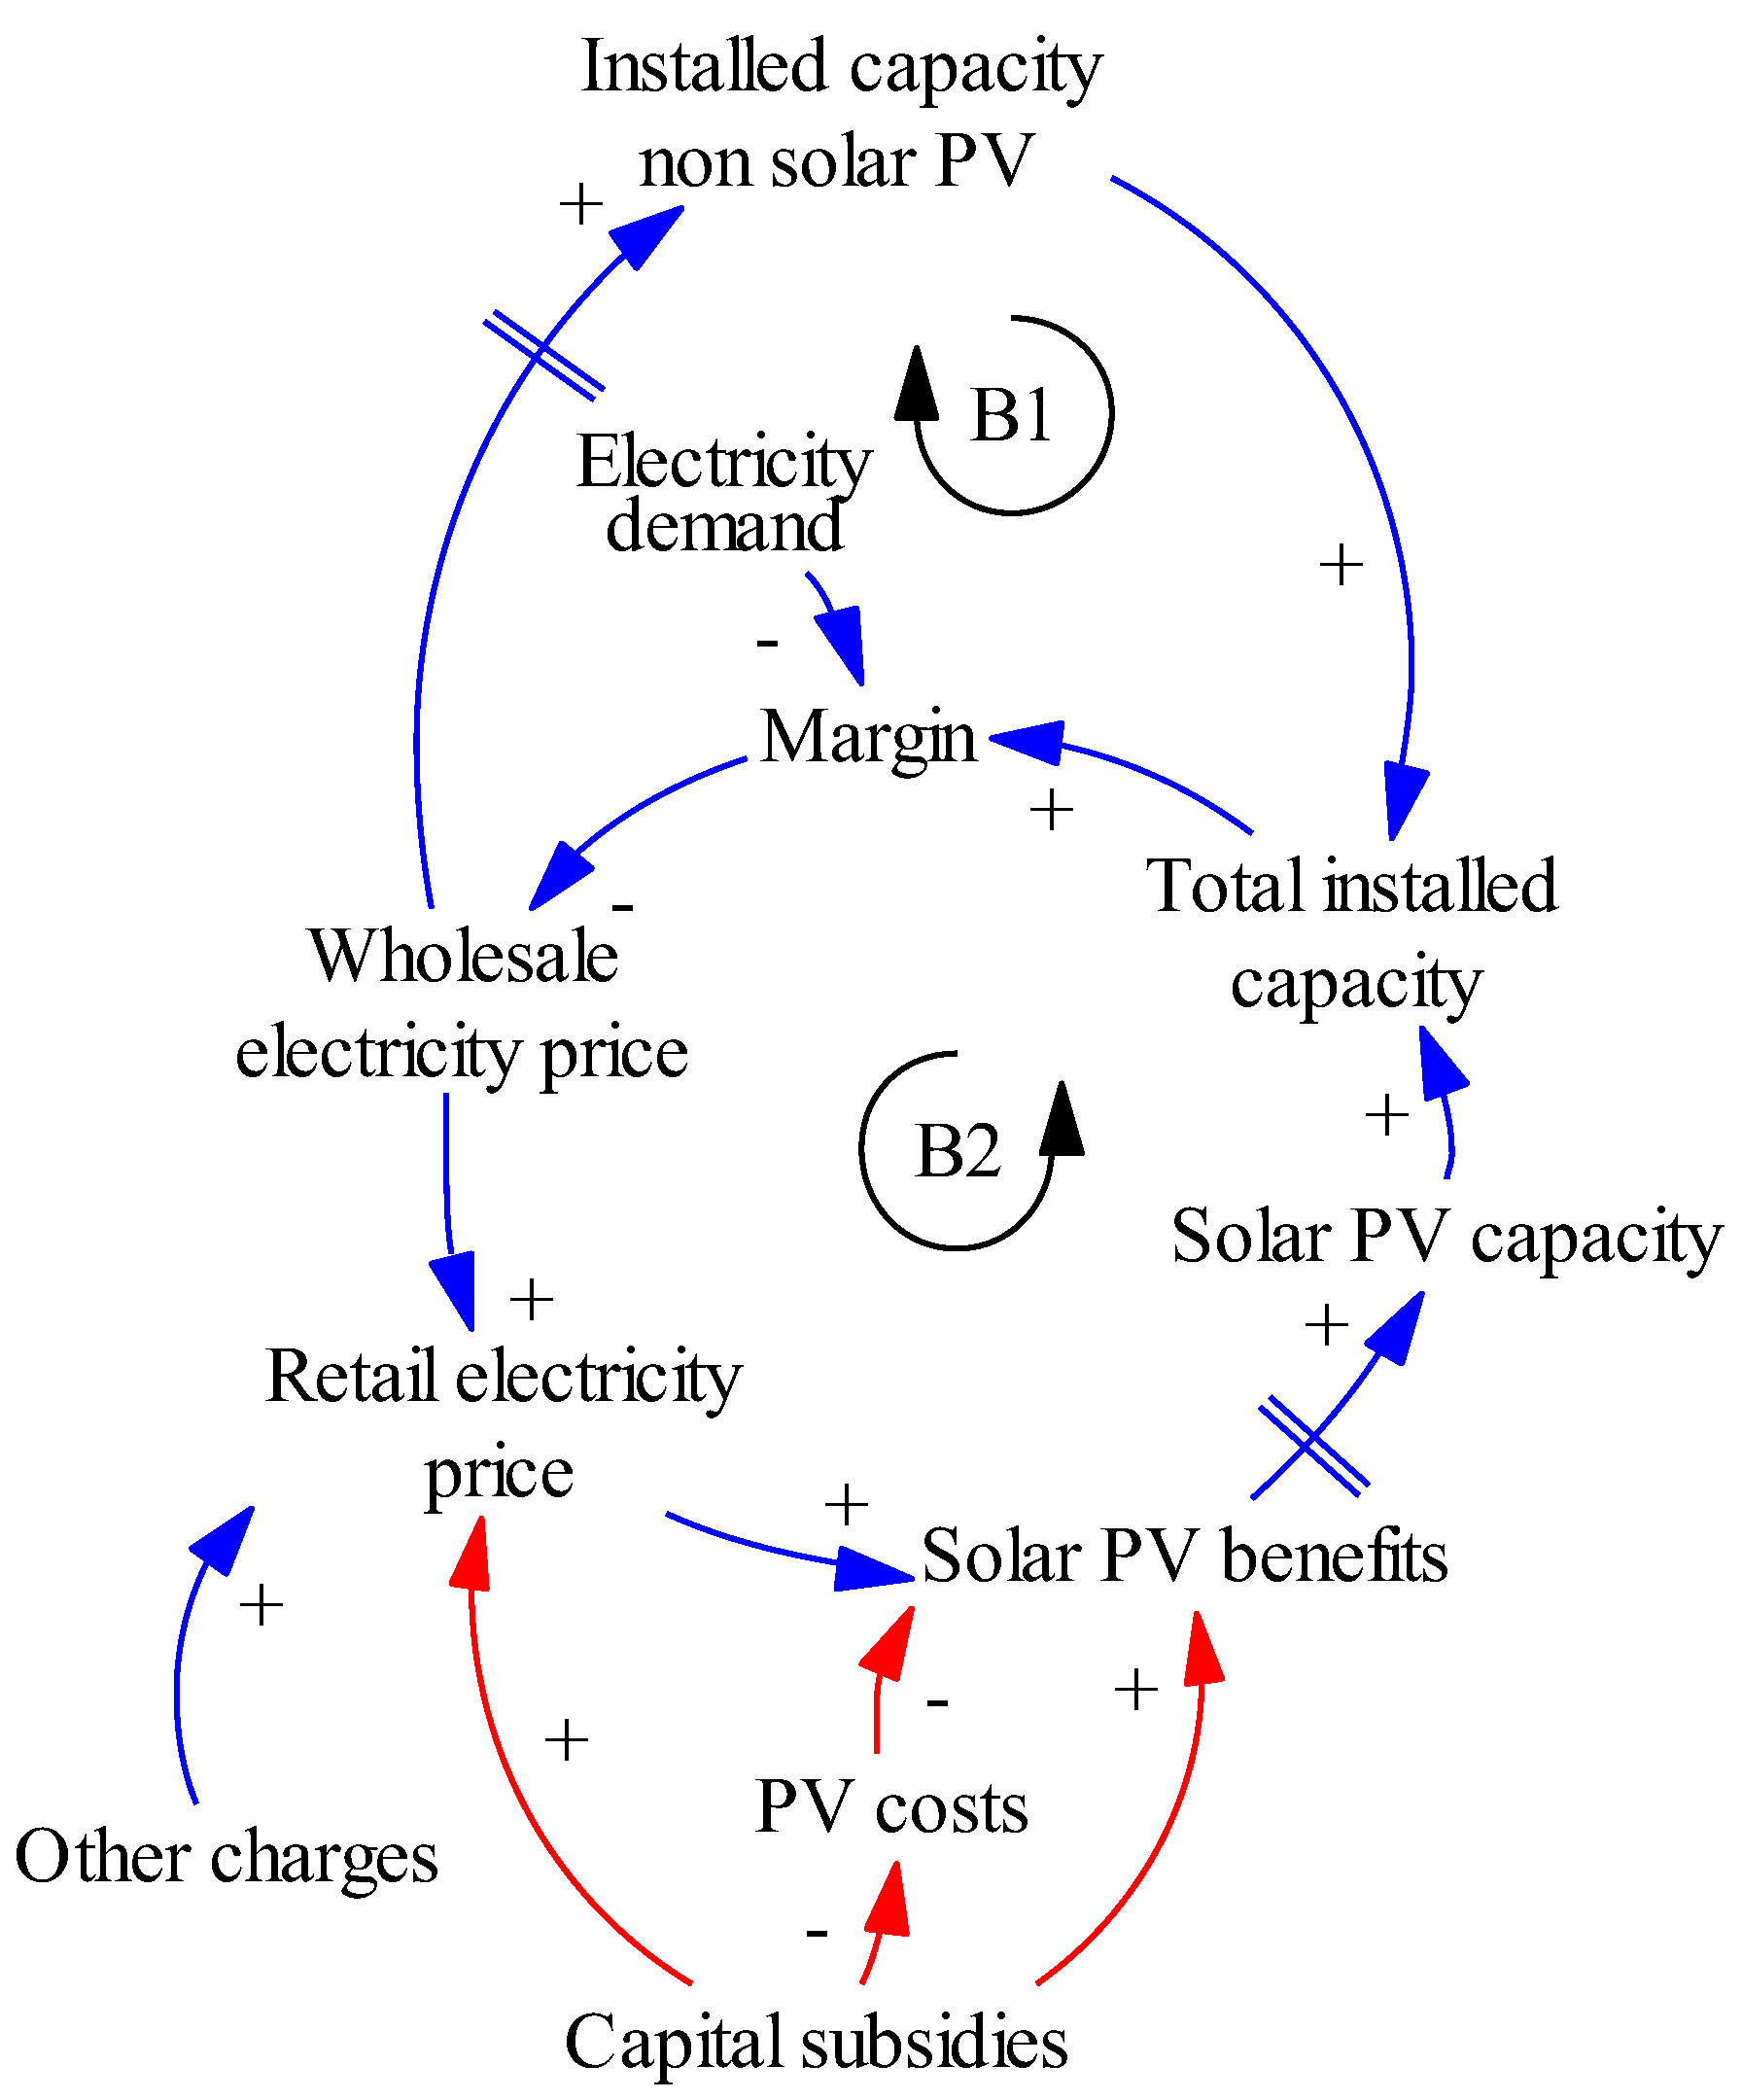
The main dynamic hypothesis of this study is shown in Figure 1, with the feedback cycles formed by blue arrows. This describes how PV diffusion is influenced by the electricity market, which is modeled by the interactions between supply and demand sides. The same dynamic hypothesis is shown again in Figure 2 and Figure 3. However, in Figure 1, a feedback cycle with red arrows is added to describe the feed-in tariff scheme, while the red-marked structure in Figure 2 and Figure 3 represent the net metering and capital subsidy schemes, respectively. Next, the main dynamic hypothesis is carefully described.
The balancing loop B1 in Figure 1 exhibits how supply and demand interact to set the margin, which is measured as the surplus of power electricity supply against electricity demand. An increase in margin implies a decrease in wholesale electricity price. Additionally, the wholesale electricity price is an economic signal that encourages investment in power capacity entering the market after a construction delay.
The balancing loop B2 in Figure 1 shares some of the variables from cycle B1. In cycle B2, the retail electricity price results from the sum of the wholesale electricity price, other charges, and the cost of implementing the solar PV policy, i.e., a feed-in tariff, net metering, or capital subsidy scheme. The retail electricity price is paid by consumers in exchange for electricity, with the willingness to adopt a solar PV system depending on the benefits of having one. The benefit of having a solar PV system includes the retail electricity price and PV costs as part of its calculation; in other words, this benefit results from an economic comparison between the production of solar PV against the demand for power from the grid. Finally, the benefits of PV encourage investment in solar PV.
The balancing loop B3 in Figure 1 determines the feed-in tariff rate, which depends on PV costs and the gap between the current solar PV capacity versus the solar PV target. To avoid windfall profits to PV owners, the PV costs are considered, and the gap is important to adjust the feed-in tariff for reaching the solar PV target. Finally, the cost of feed-in tariff policy is added to the retail rate that is charged to consumers.
Figure 2 and Figure 3 depict the other two policies to support solar PV investments—net metering and capital subsidy schemes. As mentioned earlier, in these figures, the differences regarding Figure 1 are highlighted with red arrows. By definition, net metering depends on the retail rate; therefore, if retail rate increases, the net metering rate received by PV owners will also increase, improving the benefits of having PV systems (see Figure 2, reinforcing feedback R1). In the case of capital subsidies, the cost of producing PV energy is reduced because of capital subsidy, increasing PV benefit and consequently PV adoption. In addition, the cost of capital subsidy is added to the retail electricity price (see Figure 3, red arrows).

3.2. Mathematical Model

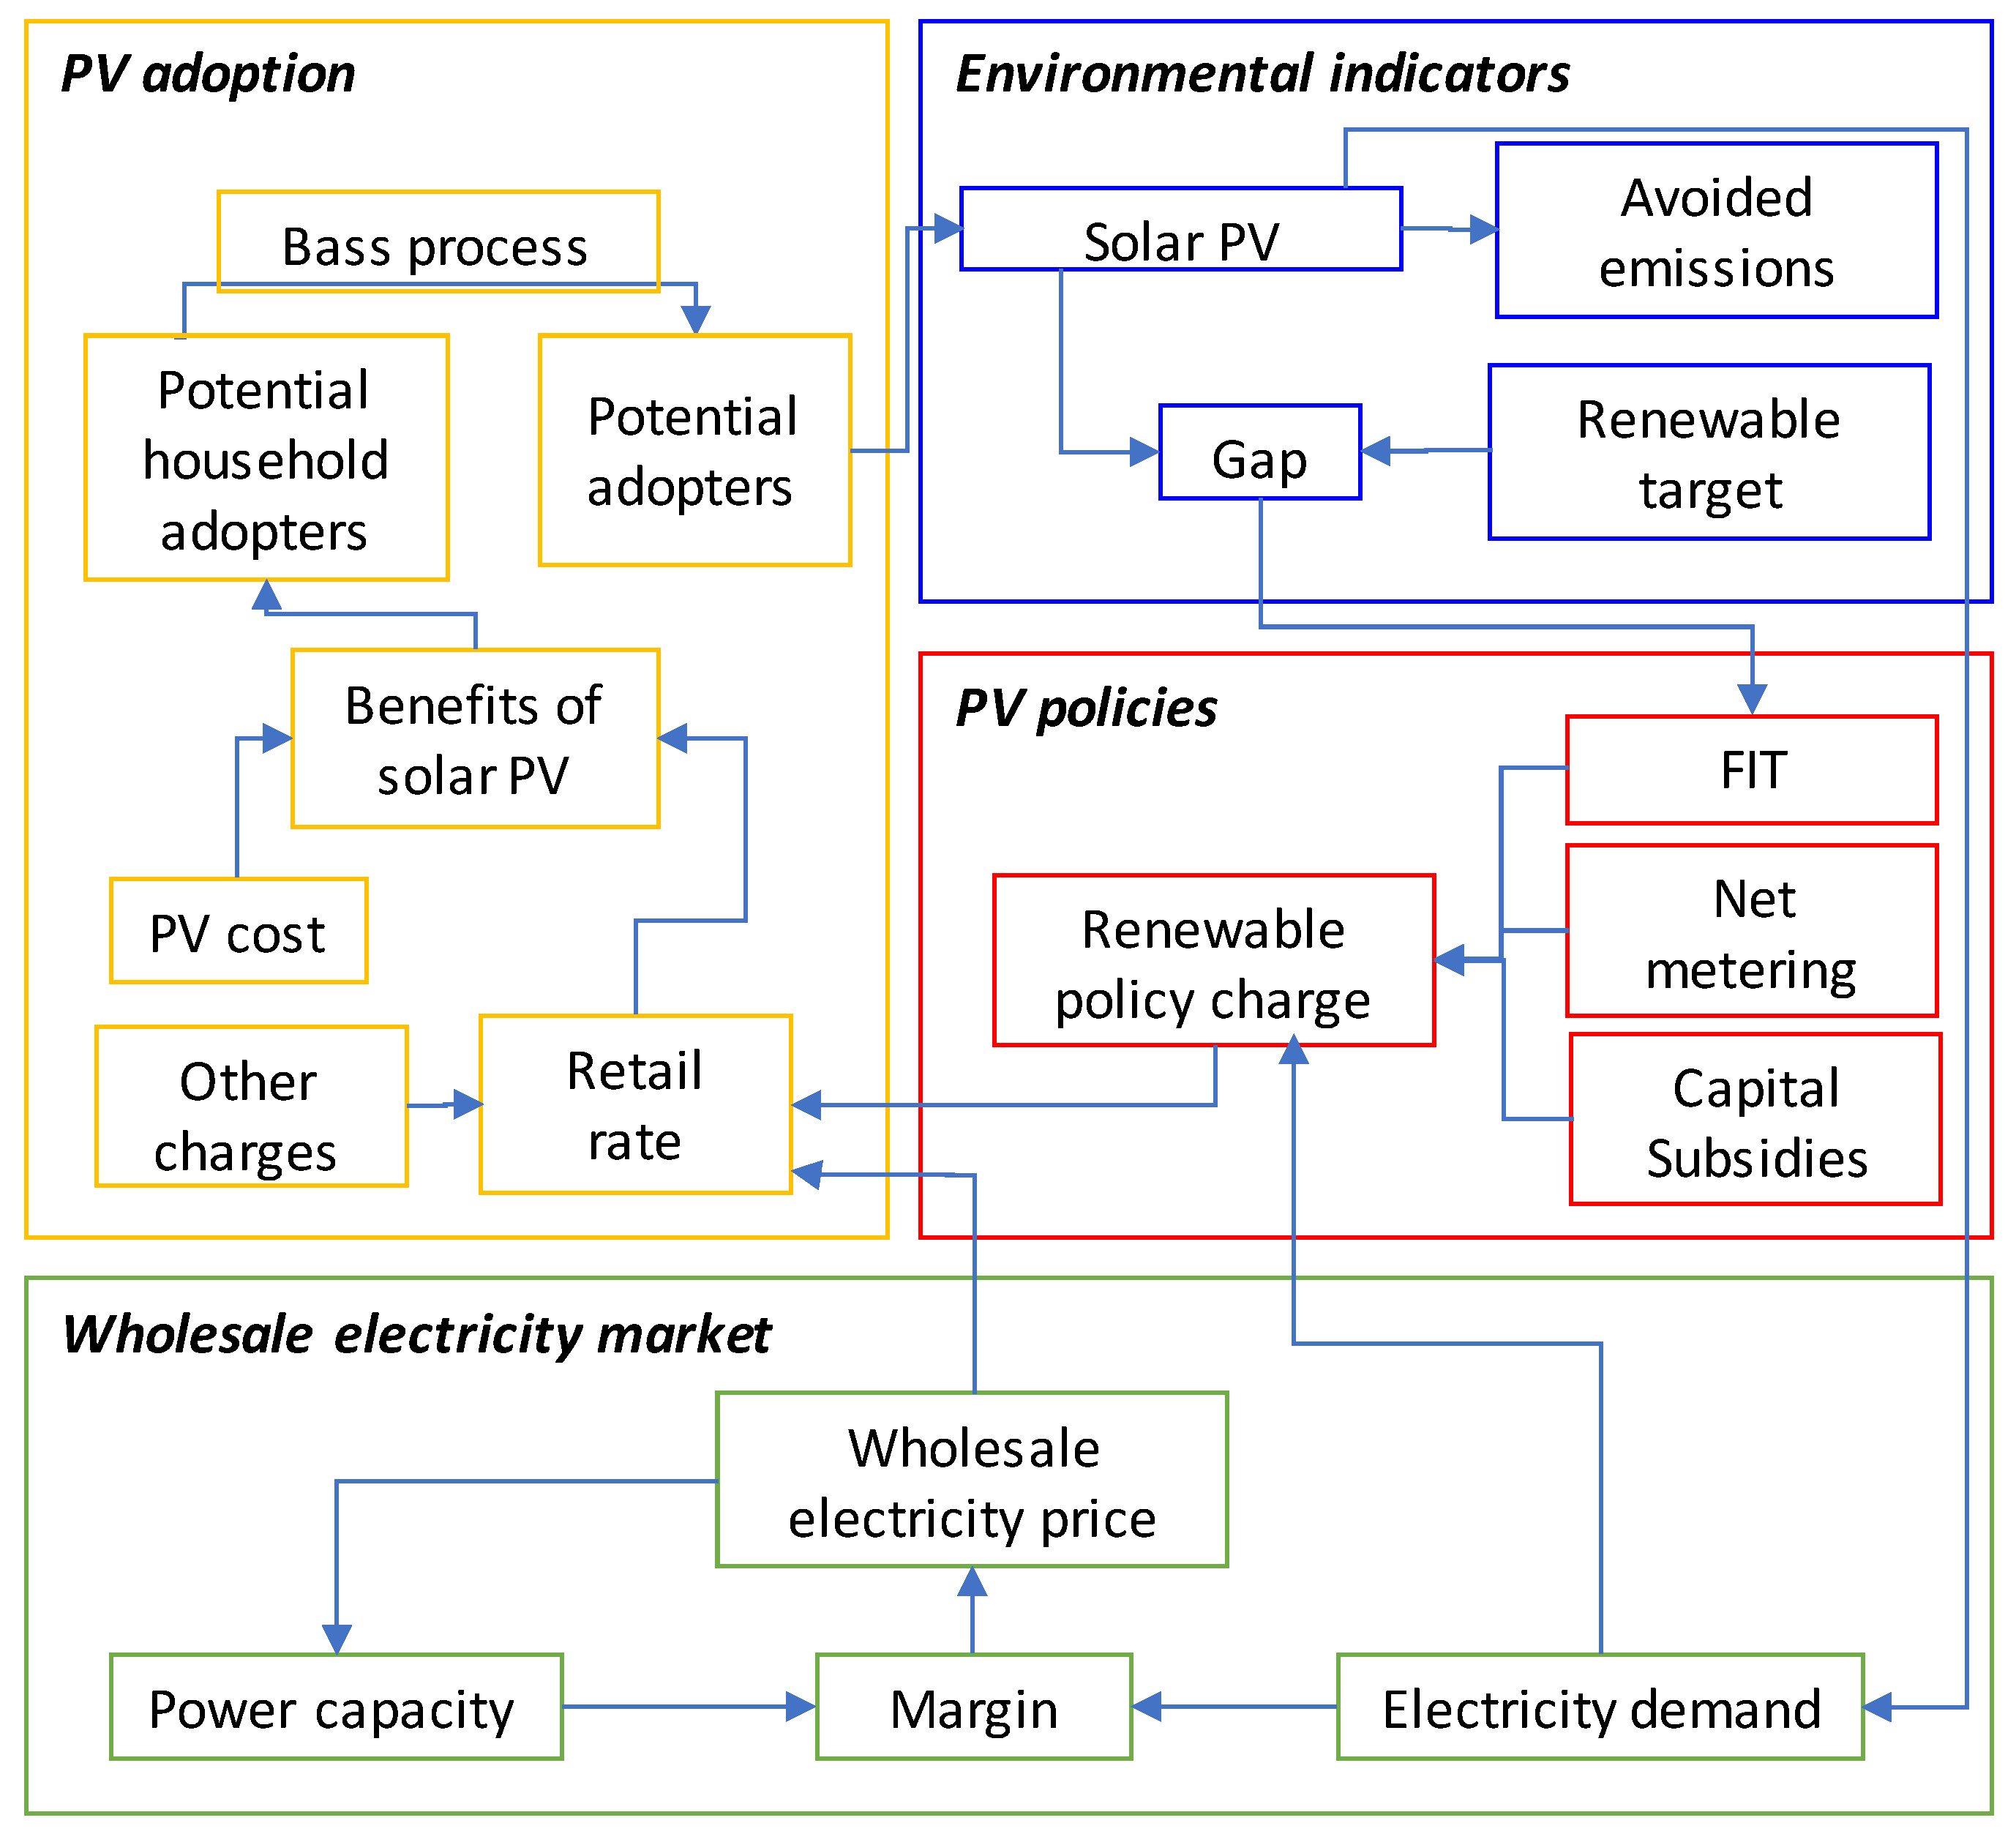
The simulation model may be represented through a subsystem diagram, where the system is divided into smaller subsystems that contain the dynamics of the key relationships in the simulation model. The subsystem diagram in Figure 4 is composed of the following components: wholesale electricity market, environmental indicators, PV policies, and PV adoption. In next subsection, the main equations are described for each component of the subsystem diagram.

3.2.1. Wholesale Electricity Market

Within this module, wholesale electricity price, w t , is set as a function of the margin, M t , which depends on the electricity demand, D t , and the power capacity, P C t [48]. See Equation (1).
  M t = P C t D t D t  
The effect of M t on w t is set through a Lookup function. This function is used to depict the nonlinear relationship between M t and w t . This function consists of a data set of ( x ,   y ) pairs, where M t is the independent variable, and w t is the dependent variable.
The wholesale electricity price, w t , is also a signal to invest in new power capacity, N P C t . The latter is determined by the average construction capacity per year, N C ¯ , affected by the effect of the wholesale electricity price on investments,   e , (see Equation (2)), which is also modeled by a lookup function.
  N P C t =   N C ¯ · e  
The capacity under construction, C U C t , results from integrating the inflow of new power capacity, N P C t , minus the outflow of construction rate, C R t (see Equation (3)) [49]. New power capacity, N P C t , becomes power capacity after an average time delay of five years; thus, the completion rate, C R t , is defined through a delay function as shown in Equation (4).
  C U C t =   t 0 t ( N P C t C R t ) d t + C U C t 0  
  C R t = d e l a y   f i x e d ( N P C t ,   5 ,   0 )  

3.2.2. PV Adoption

In this module, PV adoption occurs as a process of several stages. First, retail rate, R t , results from adding up the wholesale electricity price, subsidies, and other charges such as transmission and distribution costs (see Equation (5)) [50]. Total subsidies to solar PV are spread in electricity demand to obtain the subsidies for each kilowatt hour, s t , also called PV energy charge. It is assumed the variable other charges, o , is constant.
  R t = w t + s t + o  
Second, the benefits derived from each PV policy are calculated to determine the households willing to adopt PV. Through a feed-in tariff scheme, households will receive benefits, π F I T   in two ways: (1) from generation tariff, ( F I T t ), which is paid by the energy supplier for each unit (or kWh) of electricity generated, g ; (2) from the energy bill savings, as electricity is not bought from energy supplier. The latter is equivalent to multiplying the retail rate, R t , and the minimum between solar PV electricity generation,   g , and electricity consumption, c . The net benefit of feed-in tariff scheme is calculated after subtracting the cost of solar PV, L C O E t , multiplied by the solar PV electricity generation,   g (see Equation (6)).
  π F I T ( t )   = F I T t · g + R t · min ( c ,   g ) L C O E t · g  
Under the net metering scheme, households with PV systems save the minimum between the solar PV electricity generated ( g ) and the energy consumed by the household ( c ) as this minimum represents the amount of energy not consumed from the grid multiplied by the retail rate, R t . Furthermore, under net metering, households are billed for the net energy used each month, which is calculated as the difference between solar PV electricity generated ( g ) and the energy consumed by the household ( c ) during a billing period multiplied by the retail rate, R t . Finally, the cost of producing solar PV electricity is subtracted (see Equation (7)).
  π N E M   ( t ) = R t · min ( c , g ) + max ( 0 , ( g c ) ) · R t   L C O E t · g  
Regarding capital subsidies, the benefit is associated with the energy bill savings (first term of Equation (8)) minus the cost of producing solar PV electricity (see Equation (8)). For the capital subsidies, L C O E c s t corresponds to the new cost of producing solar PV, which is calculated after receiving the capital subsidy (see Equation (9)) [51]. Here, I t is the investment cost, reduced in the percentage of capital subsidy % c s , while O t and M t are the operational and maintenance costs, respectively; the costs are discounted at rate r . The energy produced by the PV system, E , during lifetime, n , is also discounted.
  π C S   ( t ) =   R t · min ( c , g )   L C O E c s t · g  
  L C O E c s t = I t · ( 1 % c s ) + t = 0 n ( O t + M t ) / ( 1 + r ) t t = 0 n E t / ( 1 + r ) t  
After calculating the benefit of adopting a solar PV system under different policies to encourage solar PV systems, the households willing to adopt PV ( H W A ) are calculated using the effect of willingness to adopt ( e w ) , which is a dimensionless variable that depends on the benefits of producing solar PV generation. To calculate H W A ( t ) , the total number of households, H ( t ) , the potential household adopters, M ( t ) , and the household adopters, N ( t ) , are also taken into account (See Equation (10)) [52].
  H W A ( t ) = ( H ( t ) M ( t ) N ( t ) ) · e w  
Finally, potential household adopters become household adopters through the adoption rate, n ( t ) . This is determined using the Bass model [53] (see Equation (11)), where p and q are the innovation and imitation coefficients, respectively [45]:
  n ( t ) = p ( M ( t ) N ( t ) ) + q M ( t ) N ( t ) ( M ( t ) N ( t ) )  
The first term of Equation (11) represents the households that adopt on their own, while the second term depicts the households that imitate.

3.2.3. PV Policies

In this subsection, it is explained how each policy is established and how its cost is calculated. Net metering uses retail rates to compensate PV generation. Capital subsidies assume a fixed percentage of 30% over the total system installation investment. Feed-in tariff rate depends on the gap between cumulative solar PV ( C p v ) and solar PV target ( T p v ), as shown in Equation (12).
  G a p = T p v C p v  
The cost of the PV policy is defined yearly, and it results from considering PV adopters, N ( t ) , feed-in tariff rate, F I T   p r i c e , PV generation, g , retail electricity tariff, R t , the percentage of energy exported to the grid, % e , the adoption rate, n ( t ) , and the capital subsidy, % c s (See Equations (13)–(15)).
  C o s t F I T ( t ) = N ( t ) · F I T   p r i c e ( t ) · g  
  C o s t N E M ( t ) = N ( t ) · R ( t ) · g · % e  
  C o s t c s ( t ) = n ( t ) · I ( t ) · ( 1 % c s )  

3.2.4. Environmental Indicators

In this module, important outputs such as PV cumulative installed capacity and avoided carbon dioxide (CO2) emissions are calculated. As the use of energy from PV systems lowers the energy consumption of the grid, PV cumulative installed capacity, P V C ( t ) , is calculated as a function of the PV adopters, N ( t ) , and the average PV panel size, s (see Equation (16)) [30]. The avoided CO2 emissions, A E ( t ) , are calculated considering the emission factor, f , the cumulative PV installed capacity, and average power generation per adopter, g , (see Equation (17)). Both emission factors and Equation (17) are based on the Intergovernmental Panel on Climate Change (IPCC) approach [54].
  P V C ( t ) = N ( t ) · s  
  A E ( t ) = f · g · P V C ( t )  

3.2.5. Simulation Model

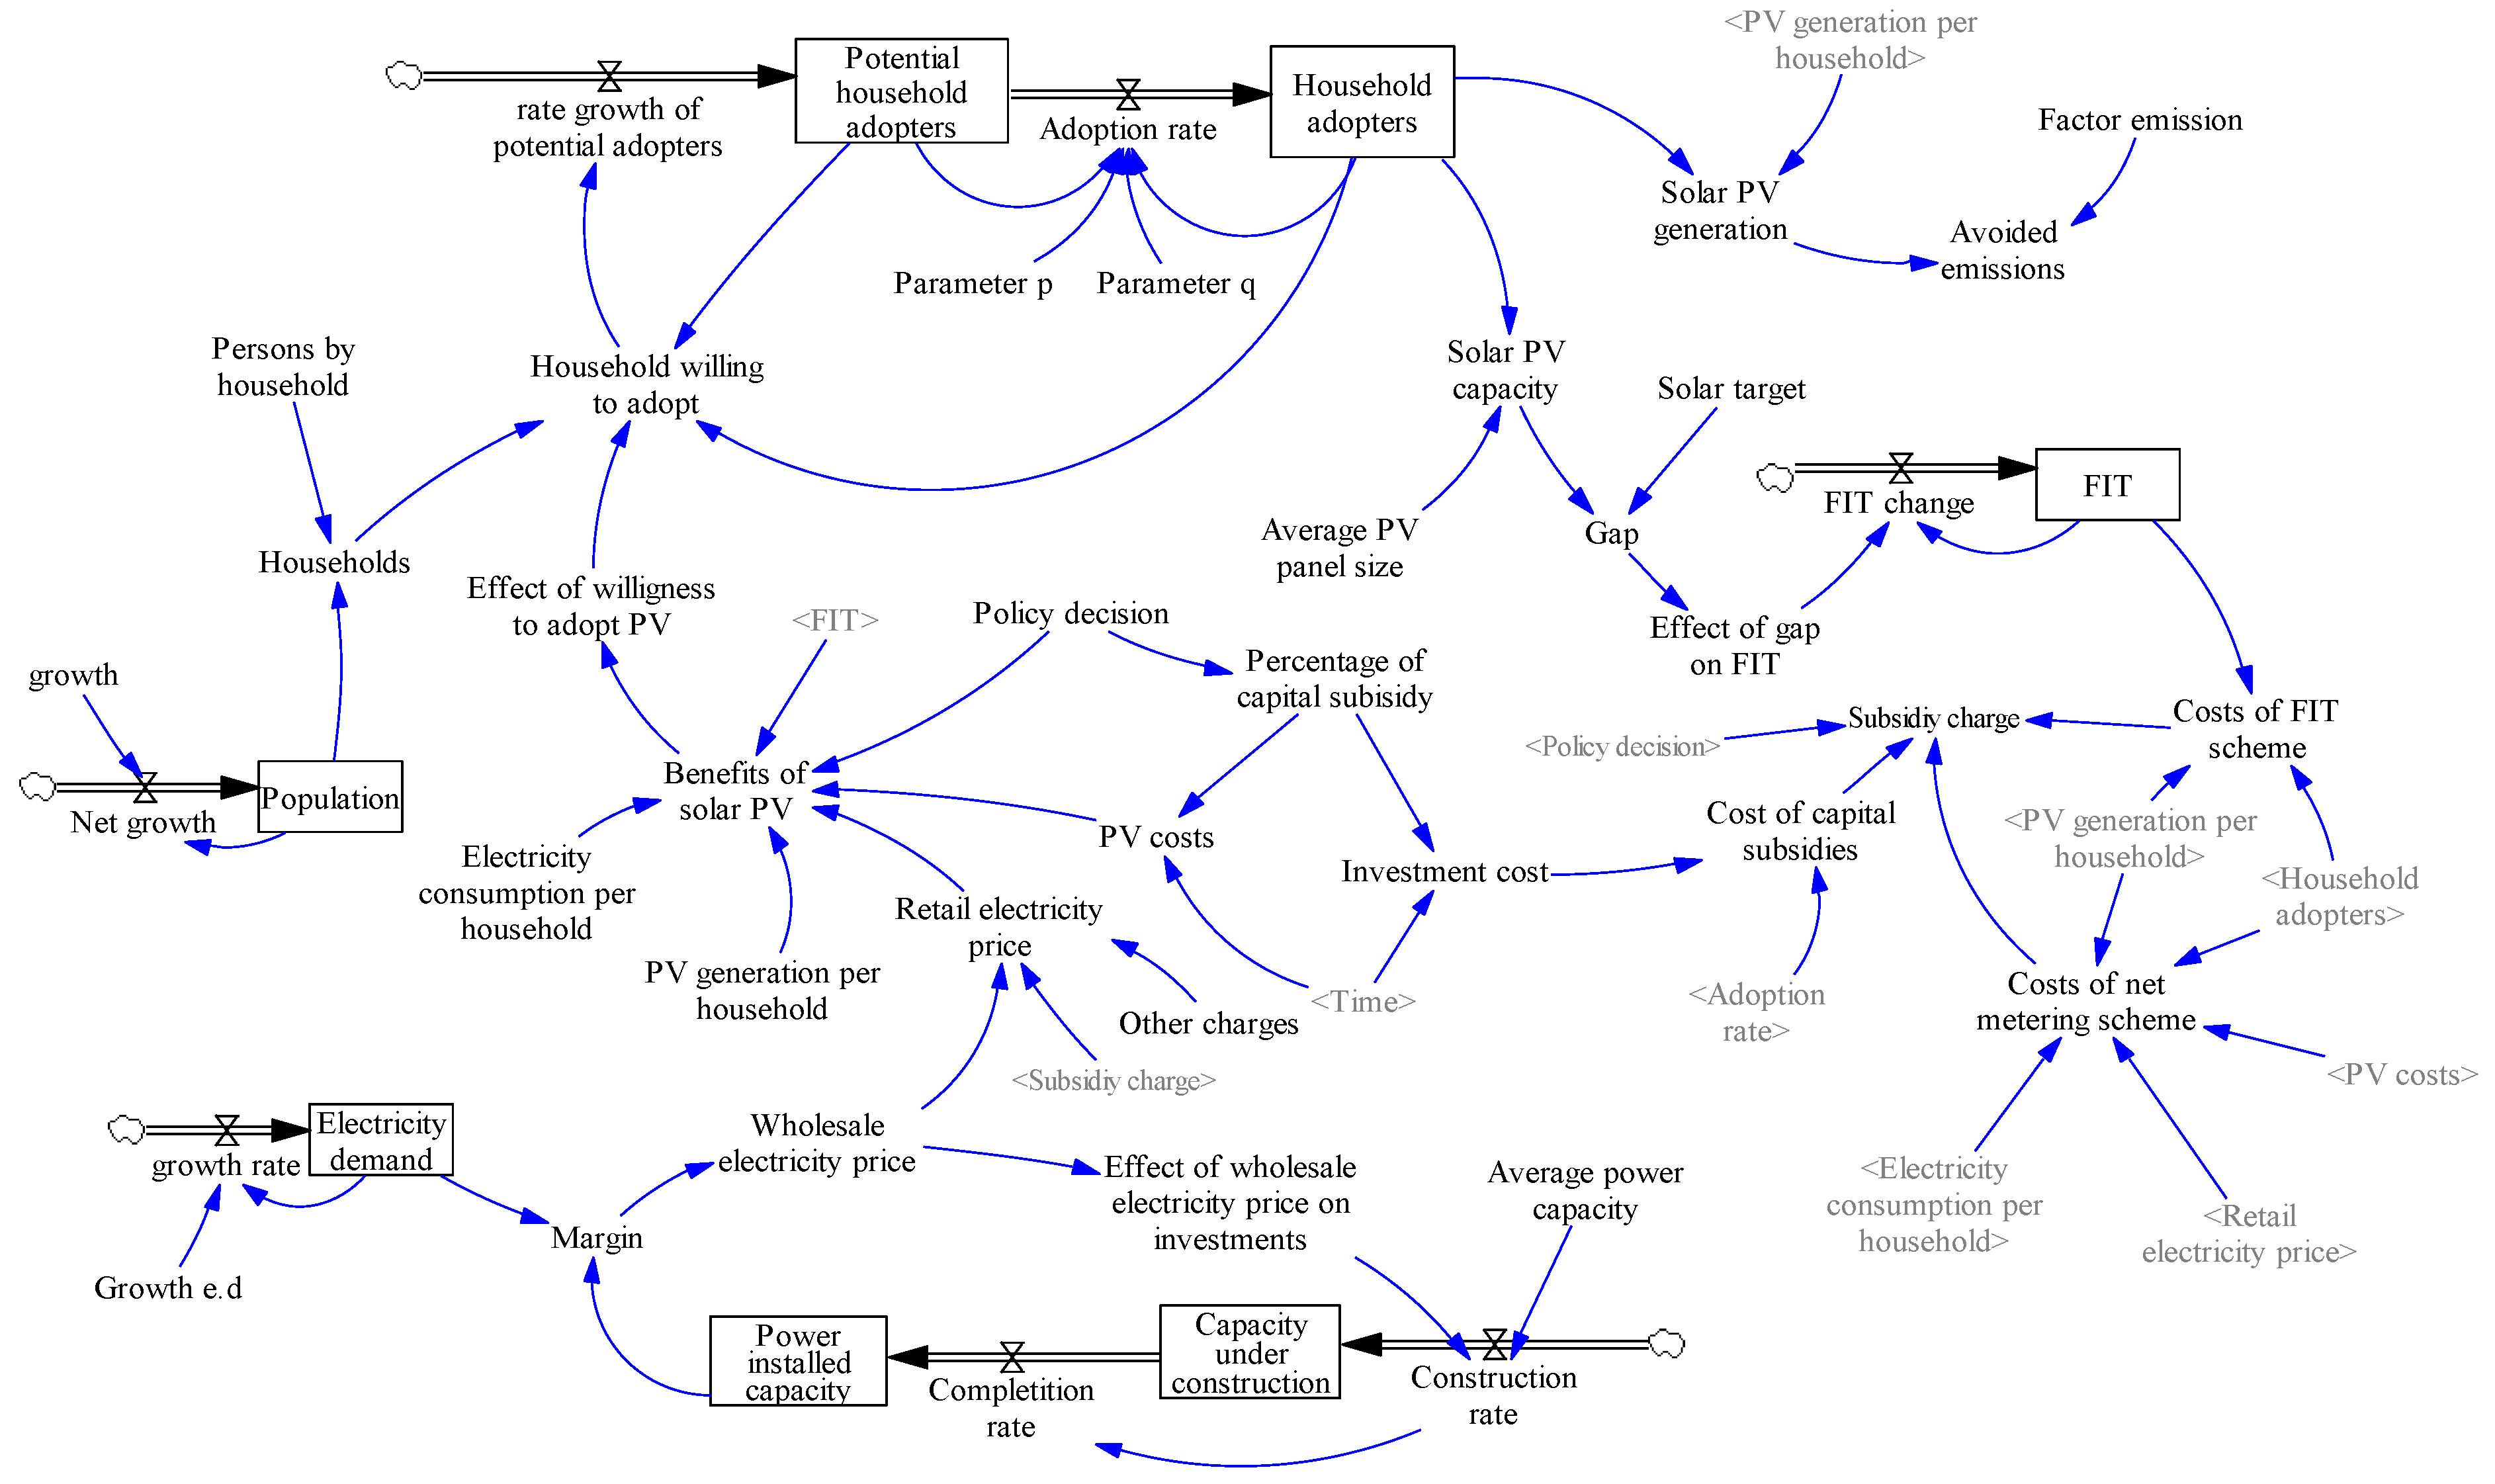
The equations mentioned in this section were used in the simulation model developed under Vensim software package and shown in Figure 5.

3.2.6. Data

The inputs used for the model included the cost associated with solar PV generation, average energy consumption, and electricity tariffs among other variables in the Colombian electricity market. Table 1 summarizes the inputs used for the described model as well as the main sources of information.

4. Results

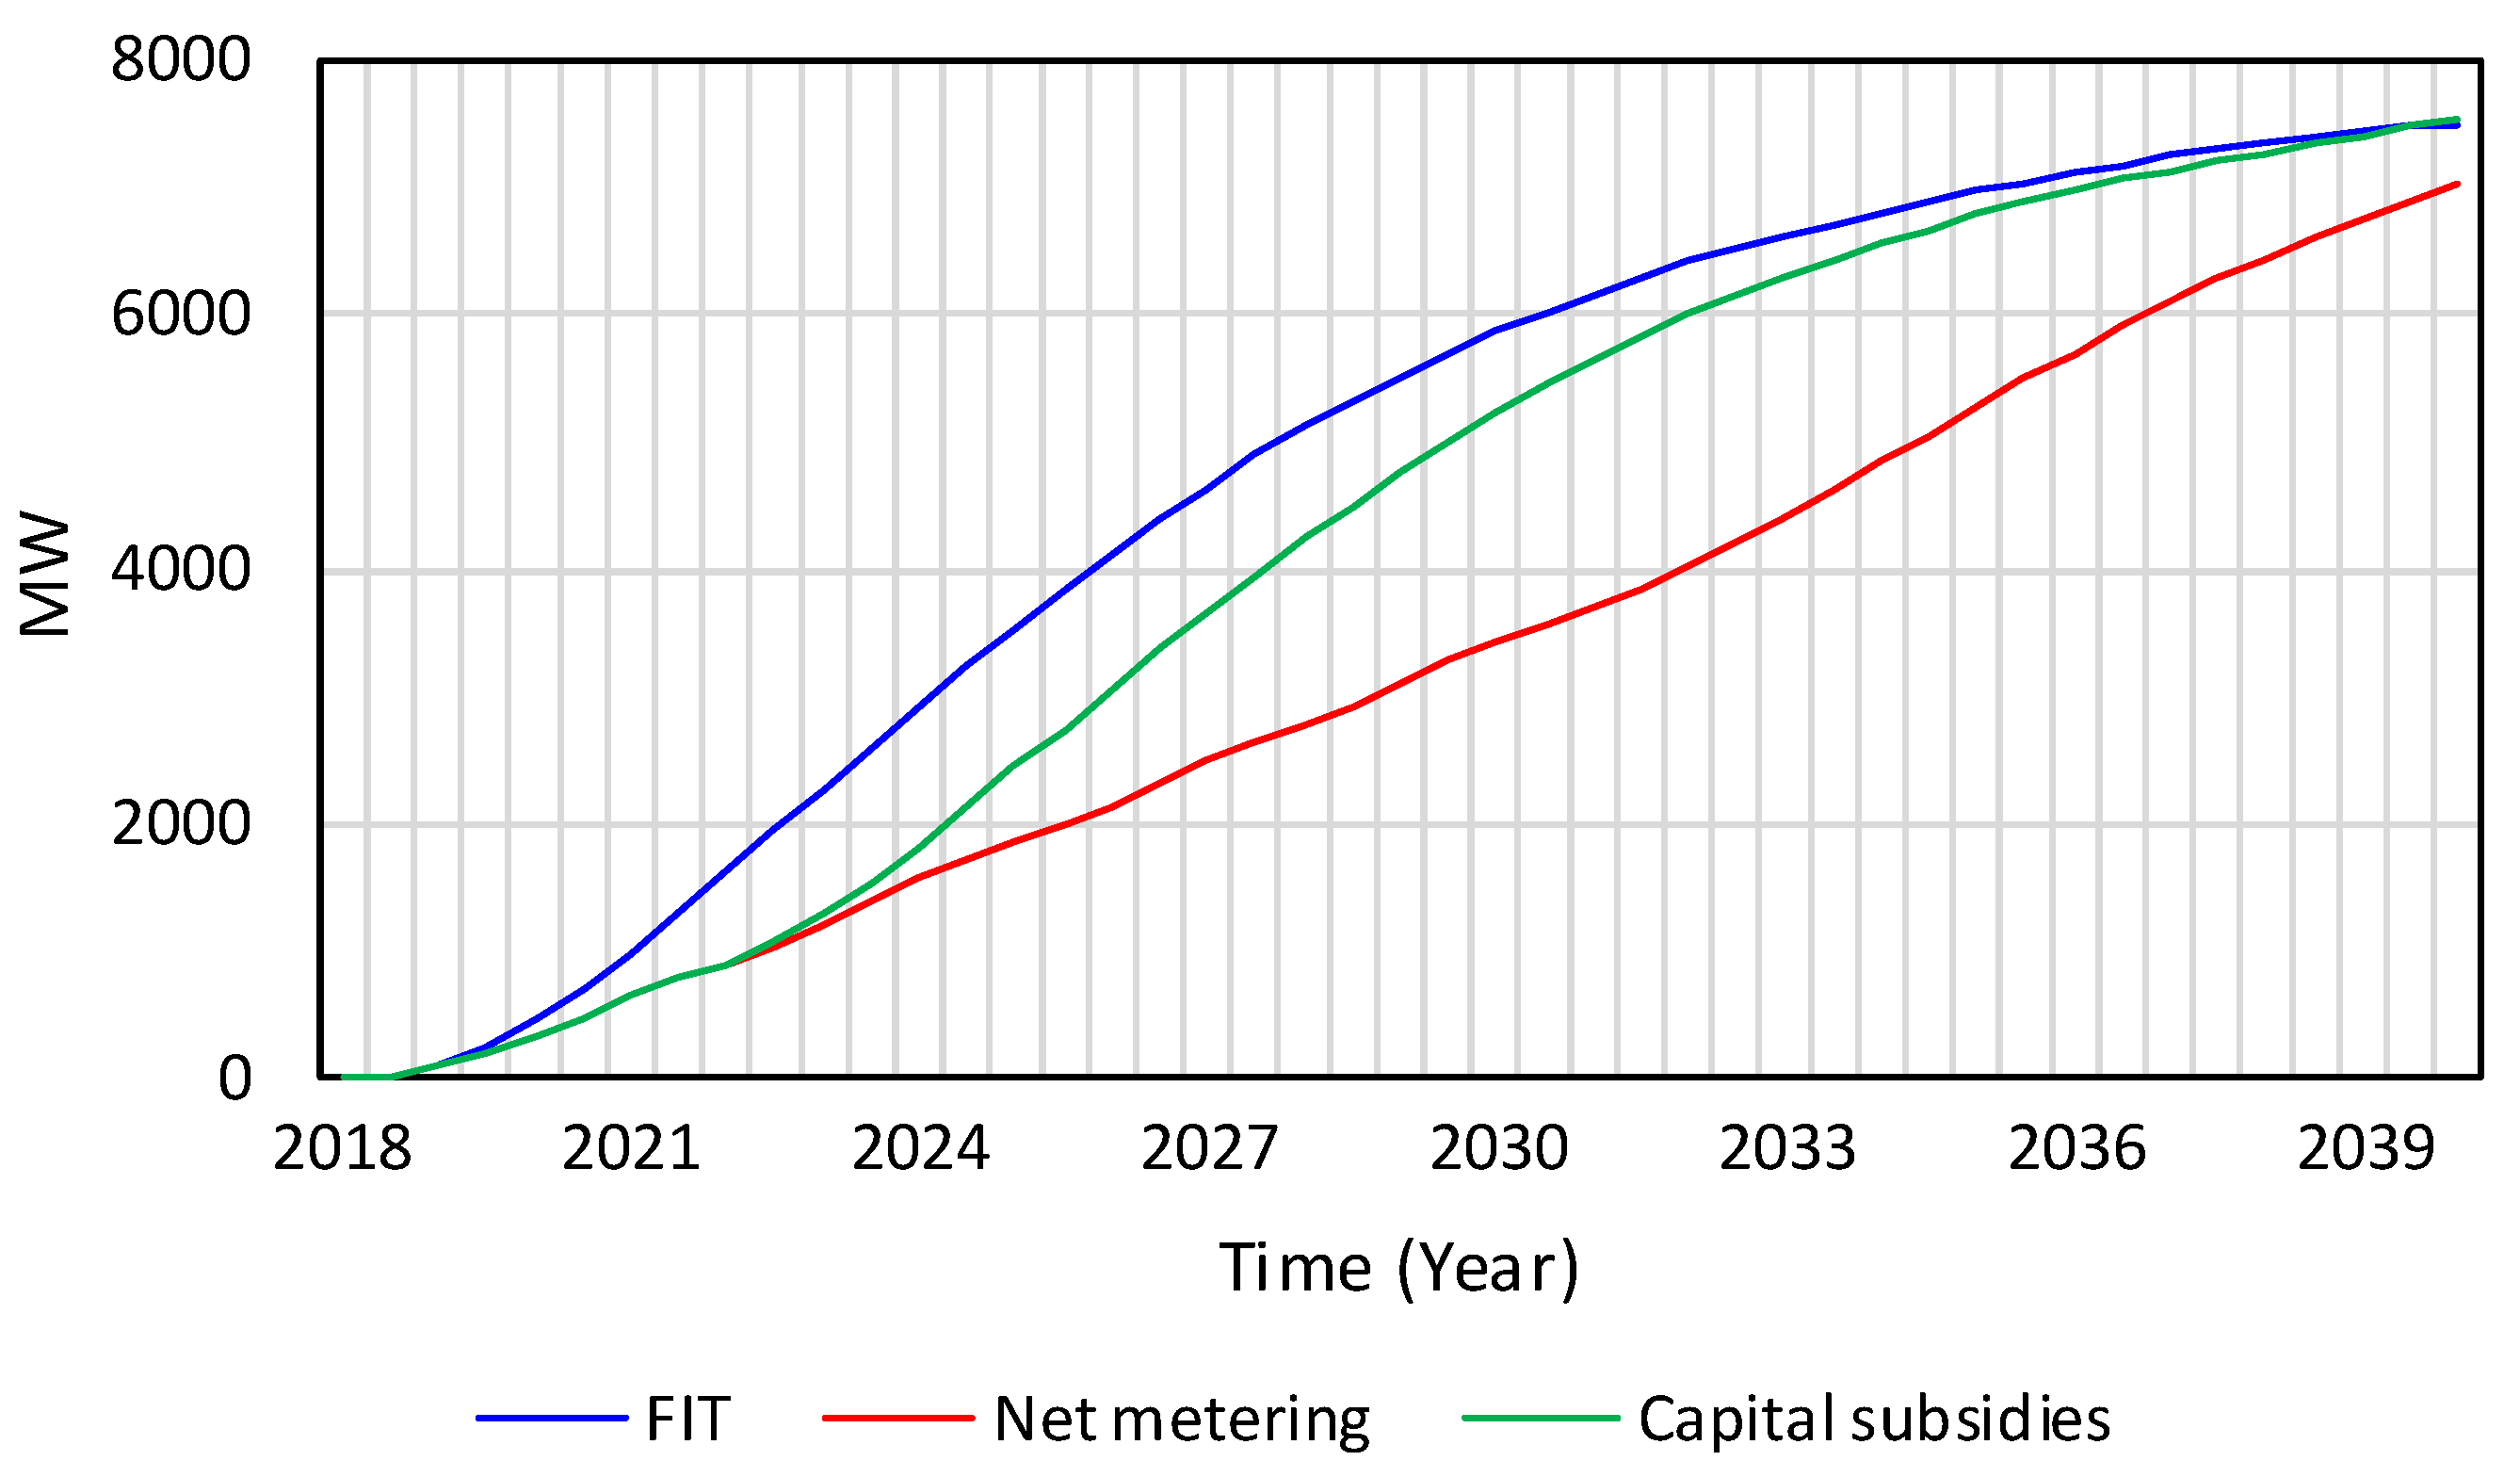
The simulation results show that in terms of effectiveness, as can be deduced from Figure 6, feed-in tariff scheme reaches better results than net metering and capital subsidies. However, by the end of the year 2040, both feed-in tariff and capital subsidies reach the same level of solar PV deployment. Under these policies, the predicted installed capacity of solar PV systems in 2040 will be about 7532 MW. However, during the simulation period, the feed-in tariff scheme is more effective to accelerate the investments of solar PV systems compared to capital subsidies, given that cumulative installed capacity with feed-in tariff always exceeds capital subsidies. In addition, net metering seems to be the least effective policy—when this support instrument is in place, it shows the lowest level of solar PV capacity installed. Under net metering, the number of solar PV systems in 2040 will be 7029 MW.
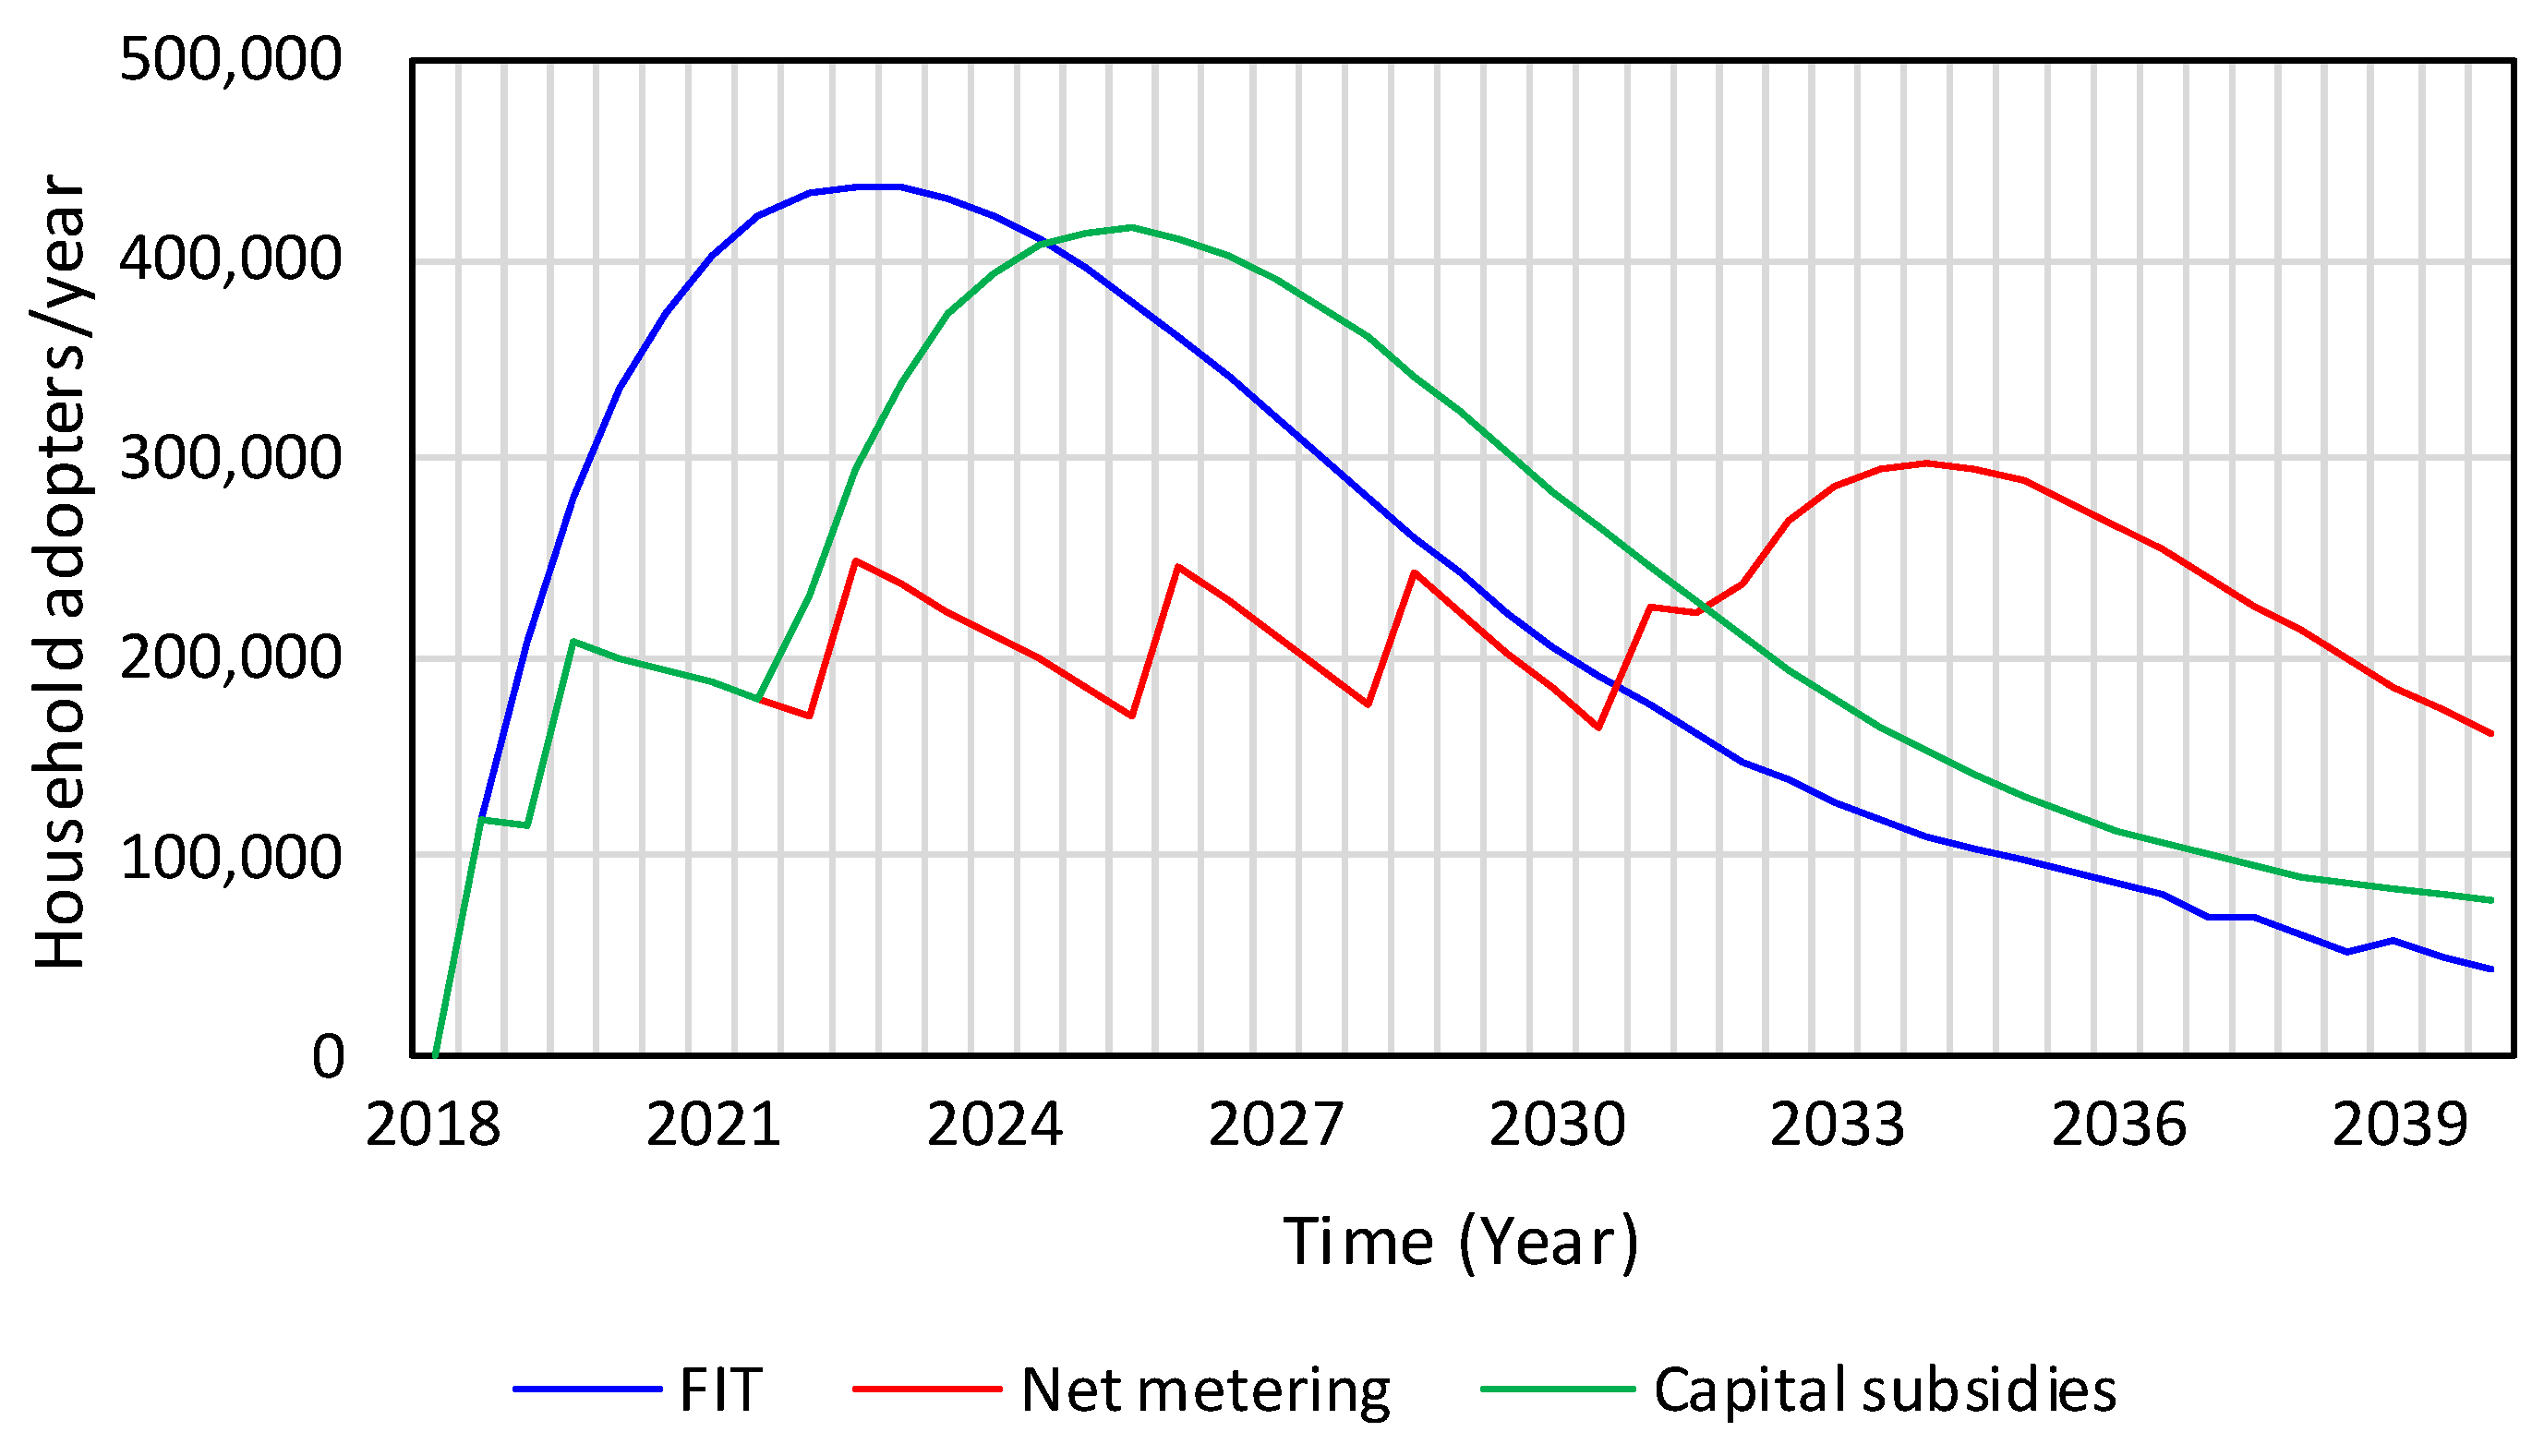
Figure 7 shows the adoption rate, i.e., period-by-period adoption, and corresponds to the innovation adoption curve. The adoption rate is influenced by potential adopters among other variables. Potential adopters in turn depend on households willing to adopt, which is a function of the benefit of having a solar PV system. This latter variable is calculated according to each policy (see Equations (6)–(8) in the Section 3.2.2) and has the main influence on PV adoption rate.
For instance, the benefits of having a solar PV system when a feed-in tariff scheme is in place mainly depend on the feed-in tariff rate, which is very high at the beginning of the simulation but progressively reduces when saturation is reached. In addition, feed-in tariff has a strong impact on adoption because under this policy, market saturation is reached faster compared to the other policies.
In the case of net metering, the benefit of having a PV system under this policy depends highly on the retail electricity price (see Equation (7)) compared to the benefits associated with the other policies (Equations (6) and (8)). With net metering, the adoption rate varies among a range of values because retail electricity price also presents an oscillatory behavior. From Figure 6 and Figure 7, it may be observed that net metering slows down the diffusion of solar PV systems compared to the other policies. This is because the solar PV benefits reached with net metering are lower compared to the benefits obtained under the other policies.
Under the capital subsidy scheme, at the beginning of the simulation period, the benefits of adopting a solar PV system mainly depend on the energy bill savings obtained via retail electricity rates (see first term of Equation (8)). However, capital incentive reduces the cost of solar PV generation (the second term of Equation (8)); by 2022, this reduction is greater than the augmentation of the first term of Equation (8), increasing the adoption of solar PV systems. After this year, the adoption rate increases until saturation and it starts to grow slowly, as can be observed in Figure 7.
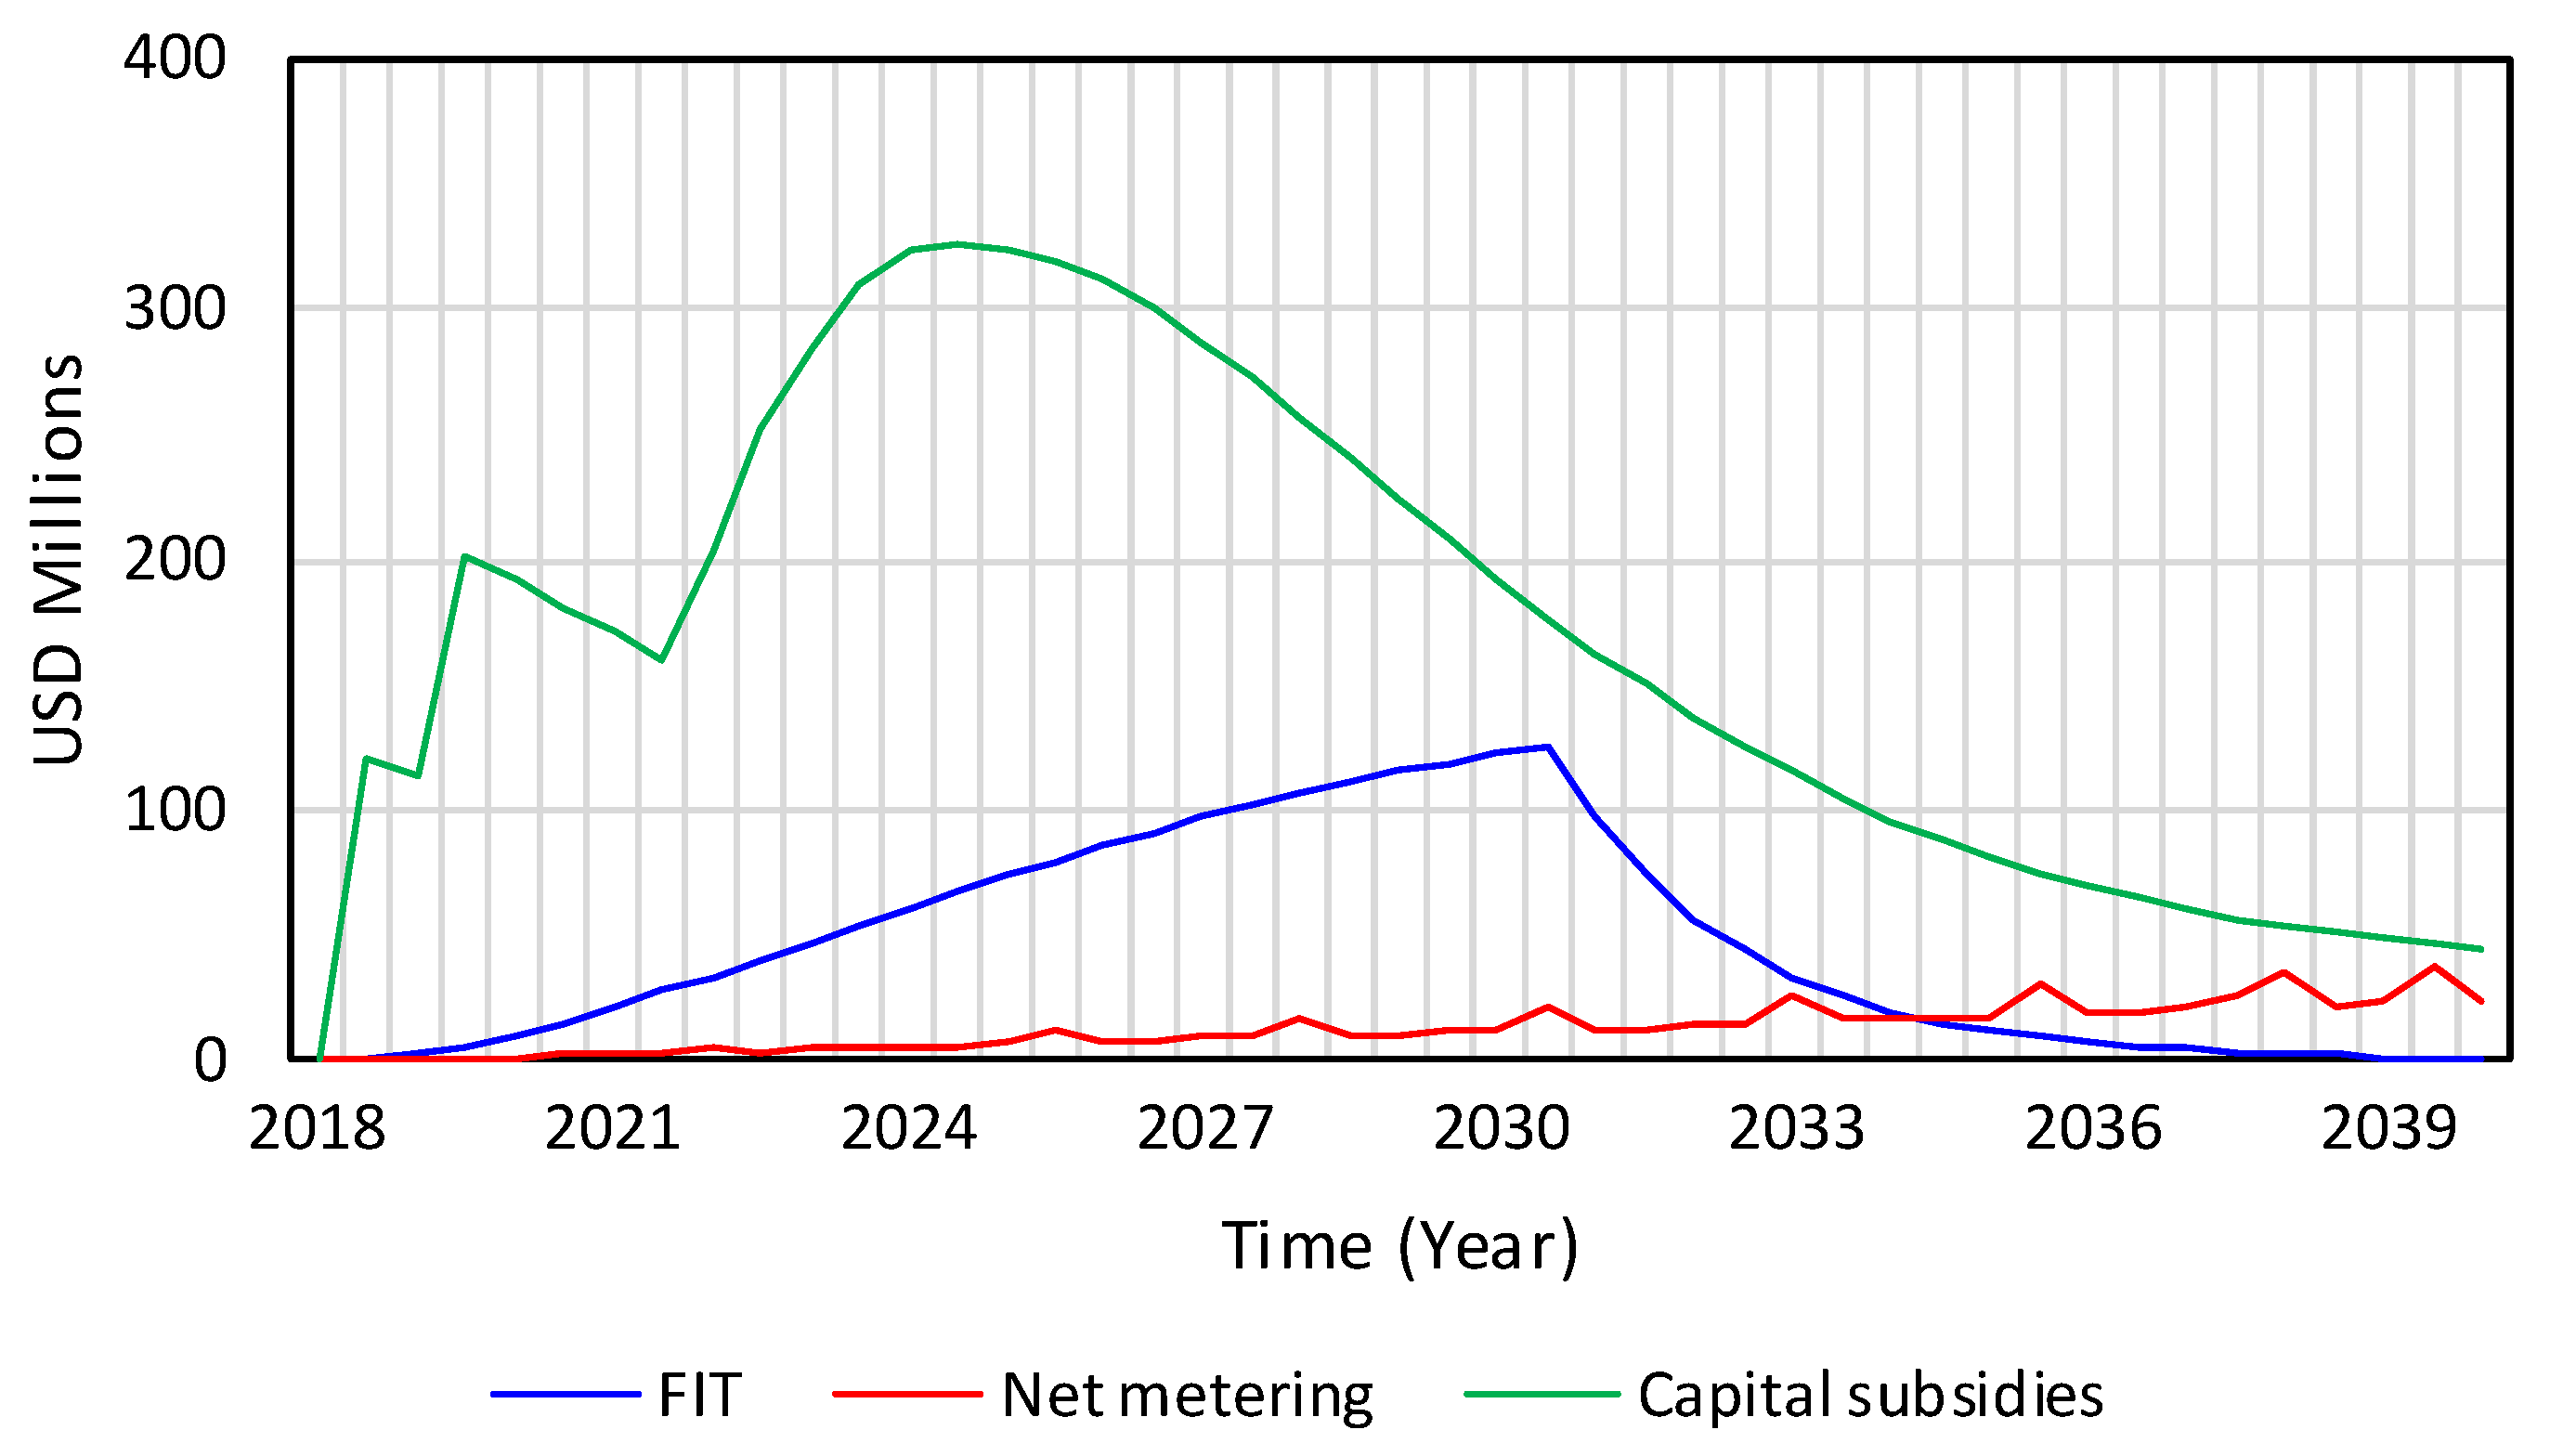
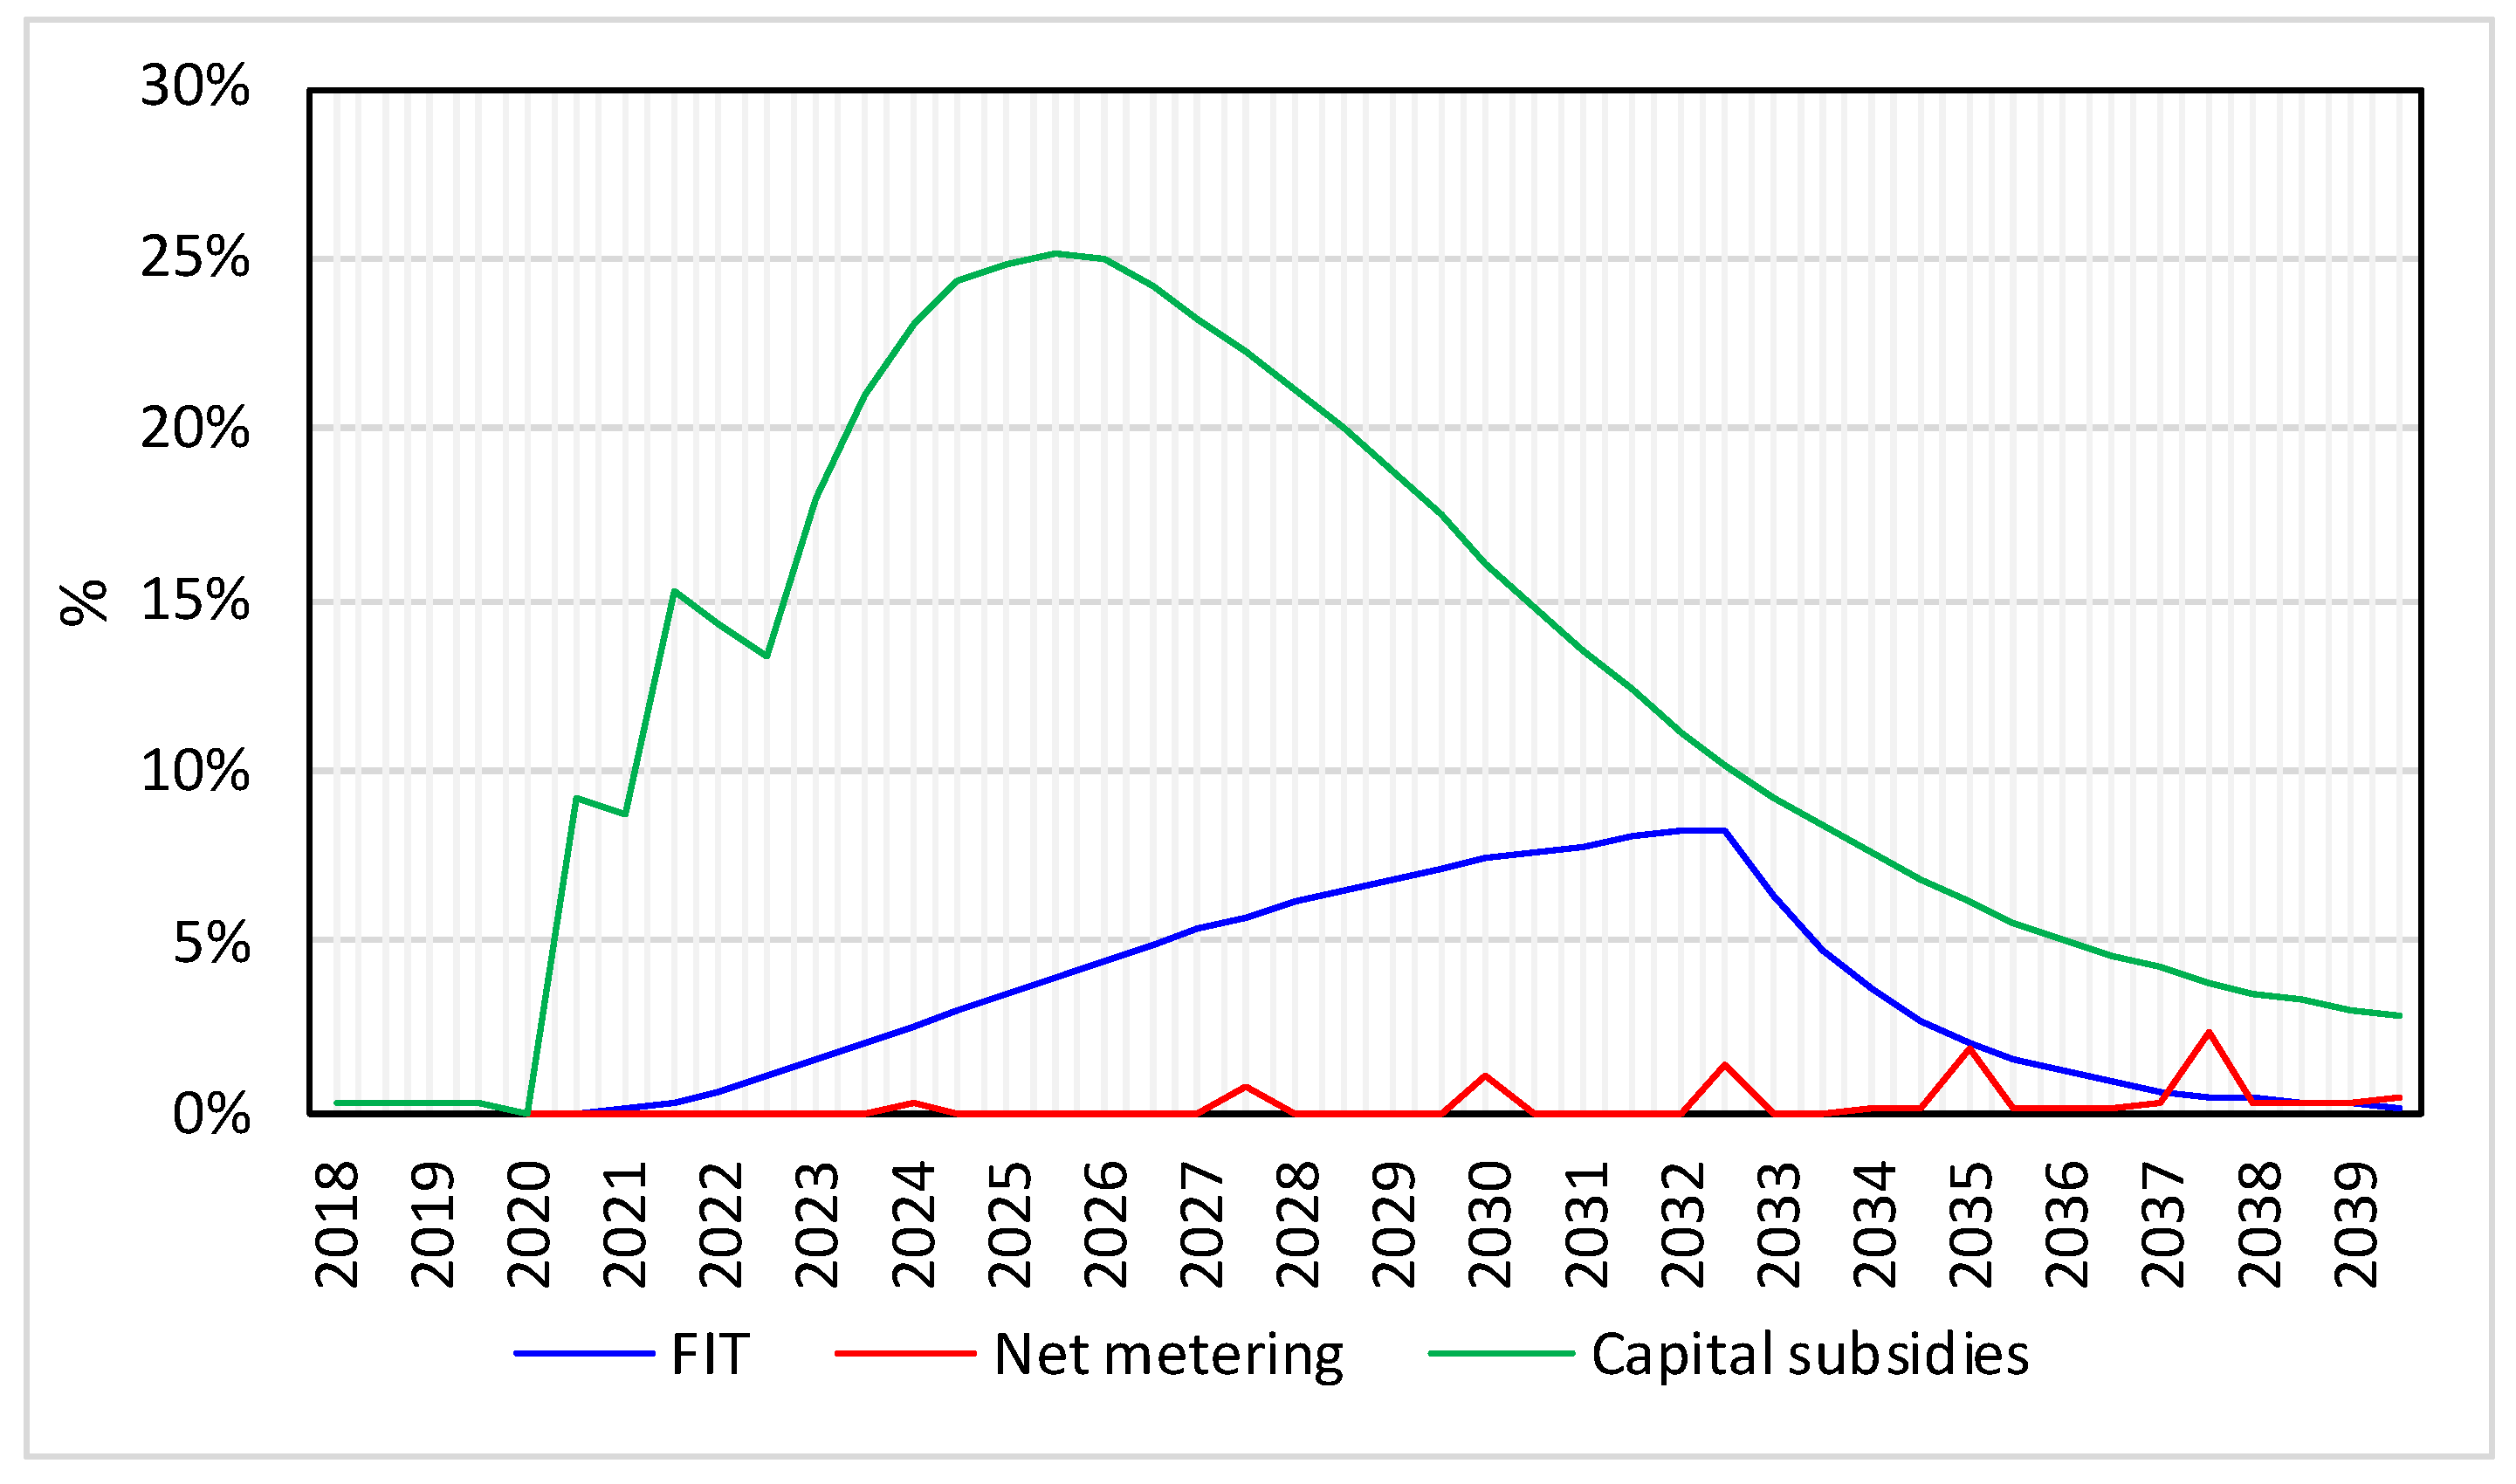
Figure 8 provides the costs of solar PV policies per year during the simulation period. Regarding the feed-in tariff scheme, the cost of this policy is proportional to the feed-in tariff rate, which is an endogenous variable that increases until PV cumulative installed capacity reaches the PV target; this explains why feed-in tariff starts to fall after 2030. Capital subsidies of 30% are the most expensive policy, and the cost of capital subsidies follows the behavior of the adoption rate. The least expensive policy is net metering, although the cost of net metering follows a growing trend.
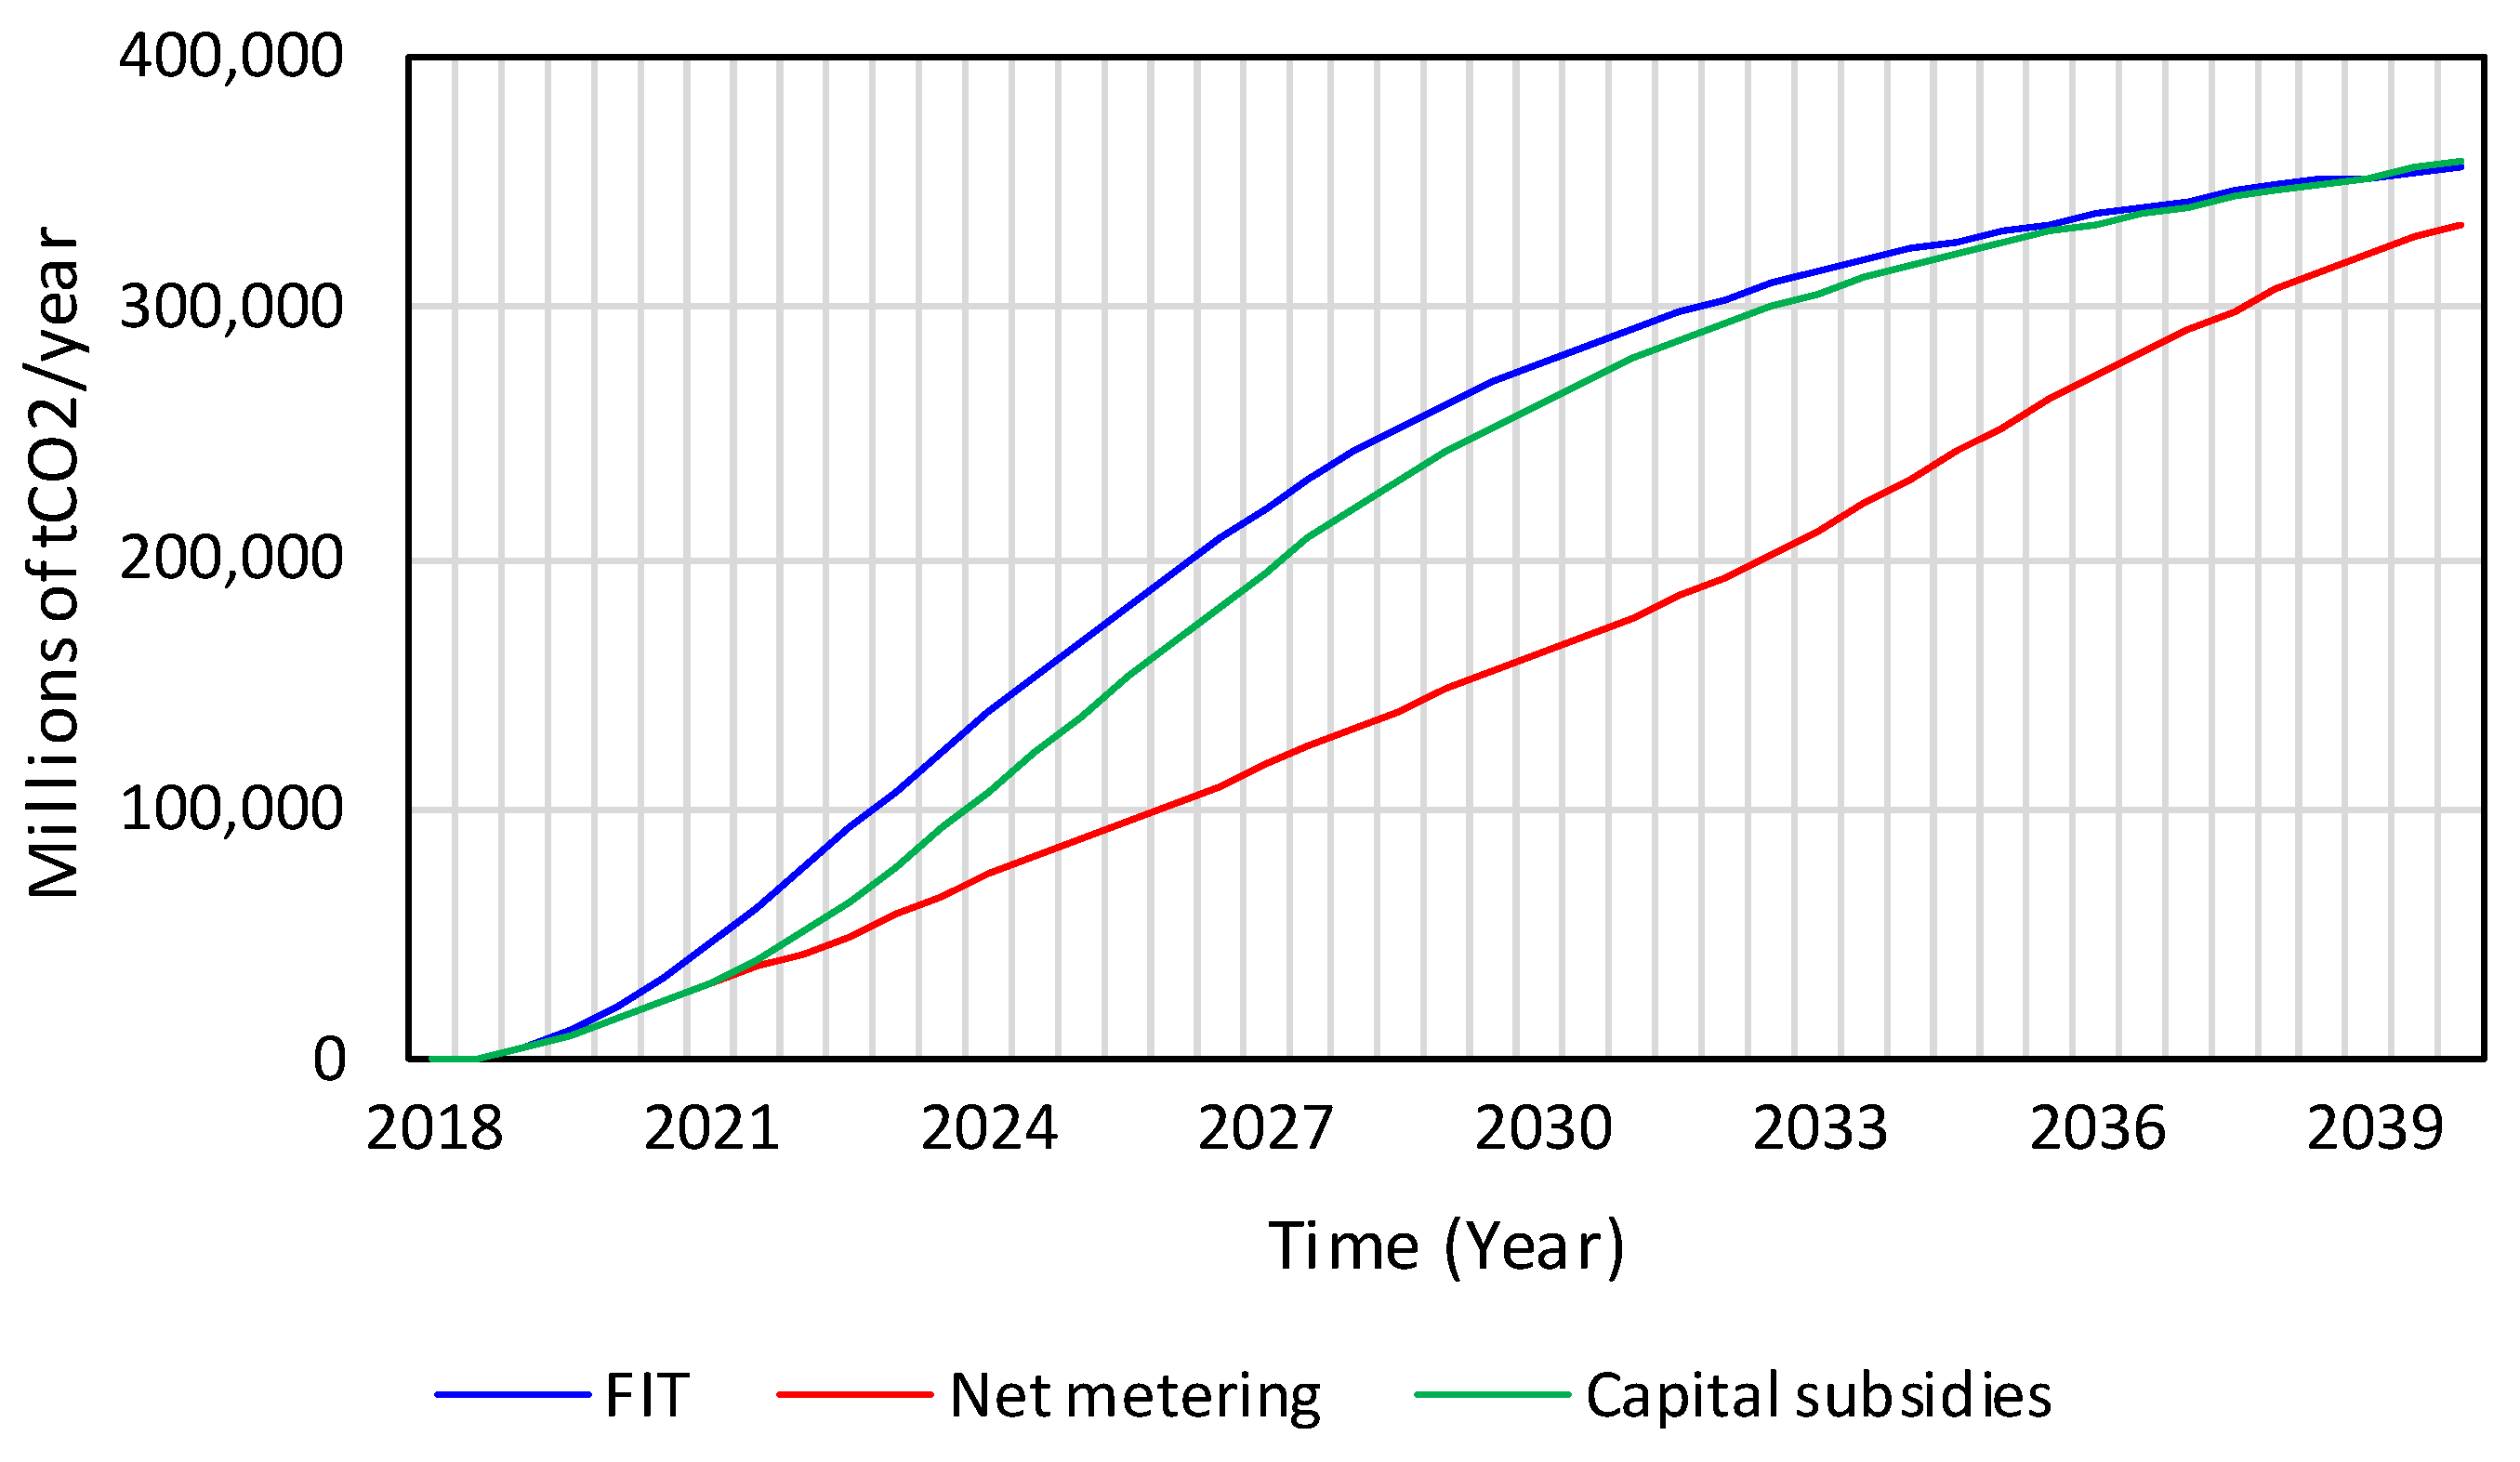
The deployment of solar PV systems by the implementation of policies leads to CO2 reduction. The reduction potential of solar PV systems depends on the availability of solar resource. Consequently, the most effective scenario for reducing CO2 emissions is the feed-in tariff, followed by capital subsidies and net metering (see Figure 9). According to the characteristics of the Colombian electricity market, the power plants affected by this reduction are mainly based on gas.
Among the components of retail electricity tariff, the cost of PV policy (PV energy charge) was analyzed next. The percentage contribution of PV energy charge to retail electricity tariff is shown in Figure 10. The feed-in tariff scheme contributes up to 12% to retail electricity tariff. In contrast, net metering contributes up to 4%. As expected, if capital subsidies are applied, this makes up the charges. The capital subsidy has the most significant impact on the retail electricity tariff, with the policy contributing up to a 30% to the tariff in total. Therefore, in terms of costs charged to the final consumers, the results are consistent with the total cost of the policy shown in Figure 8.
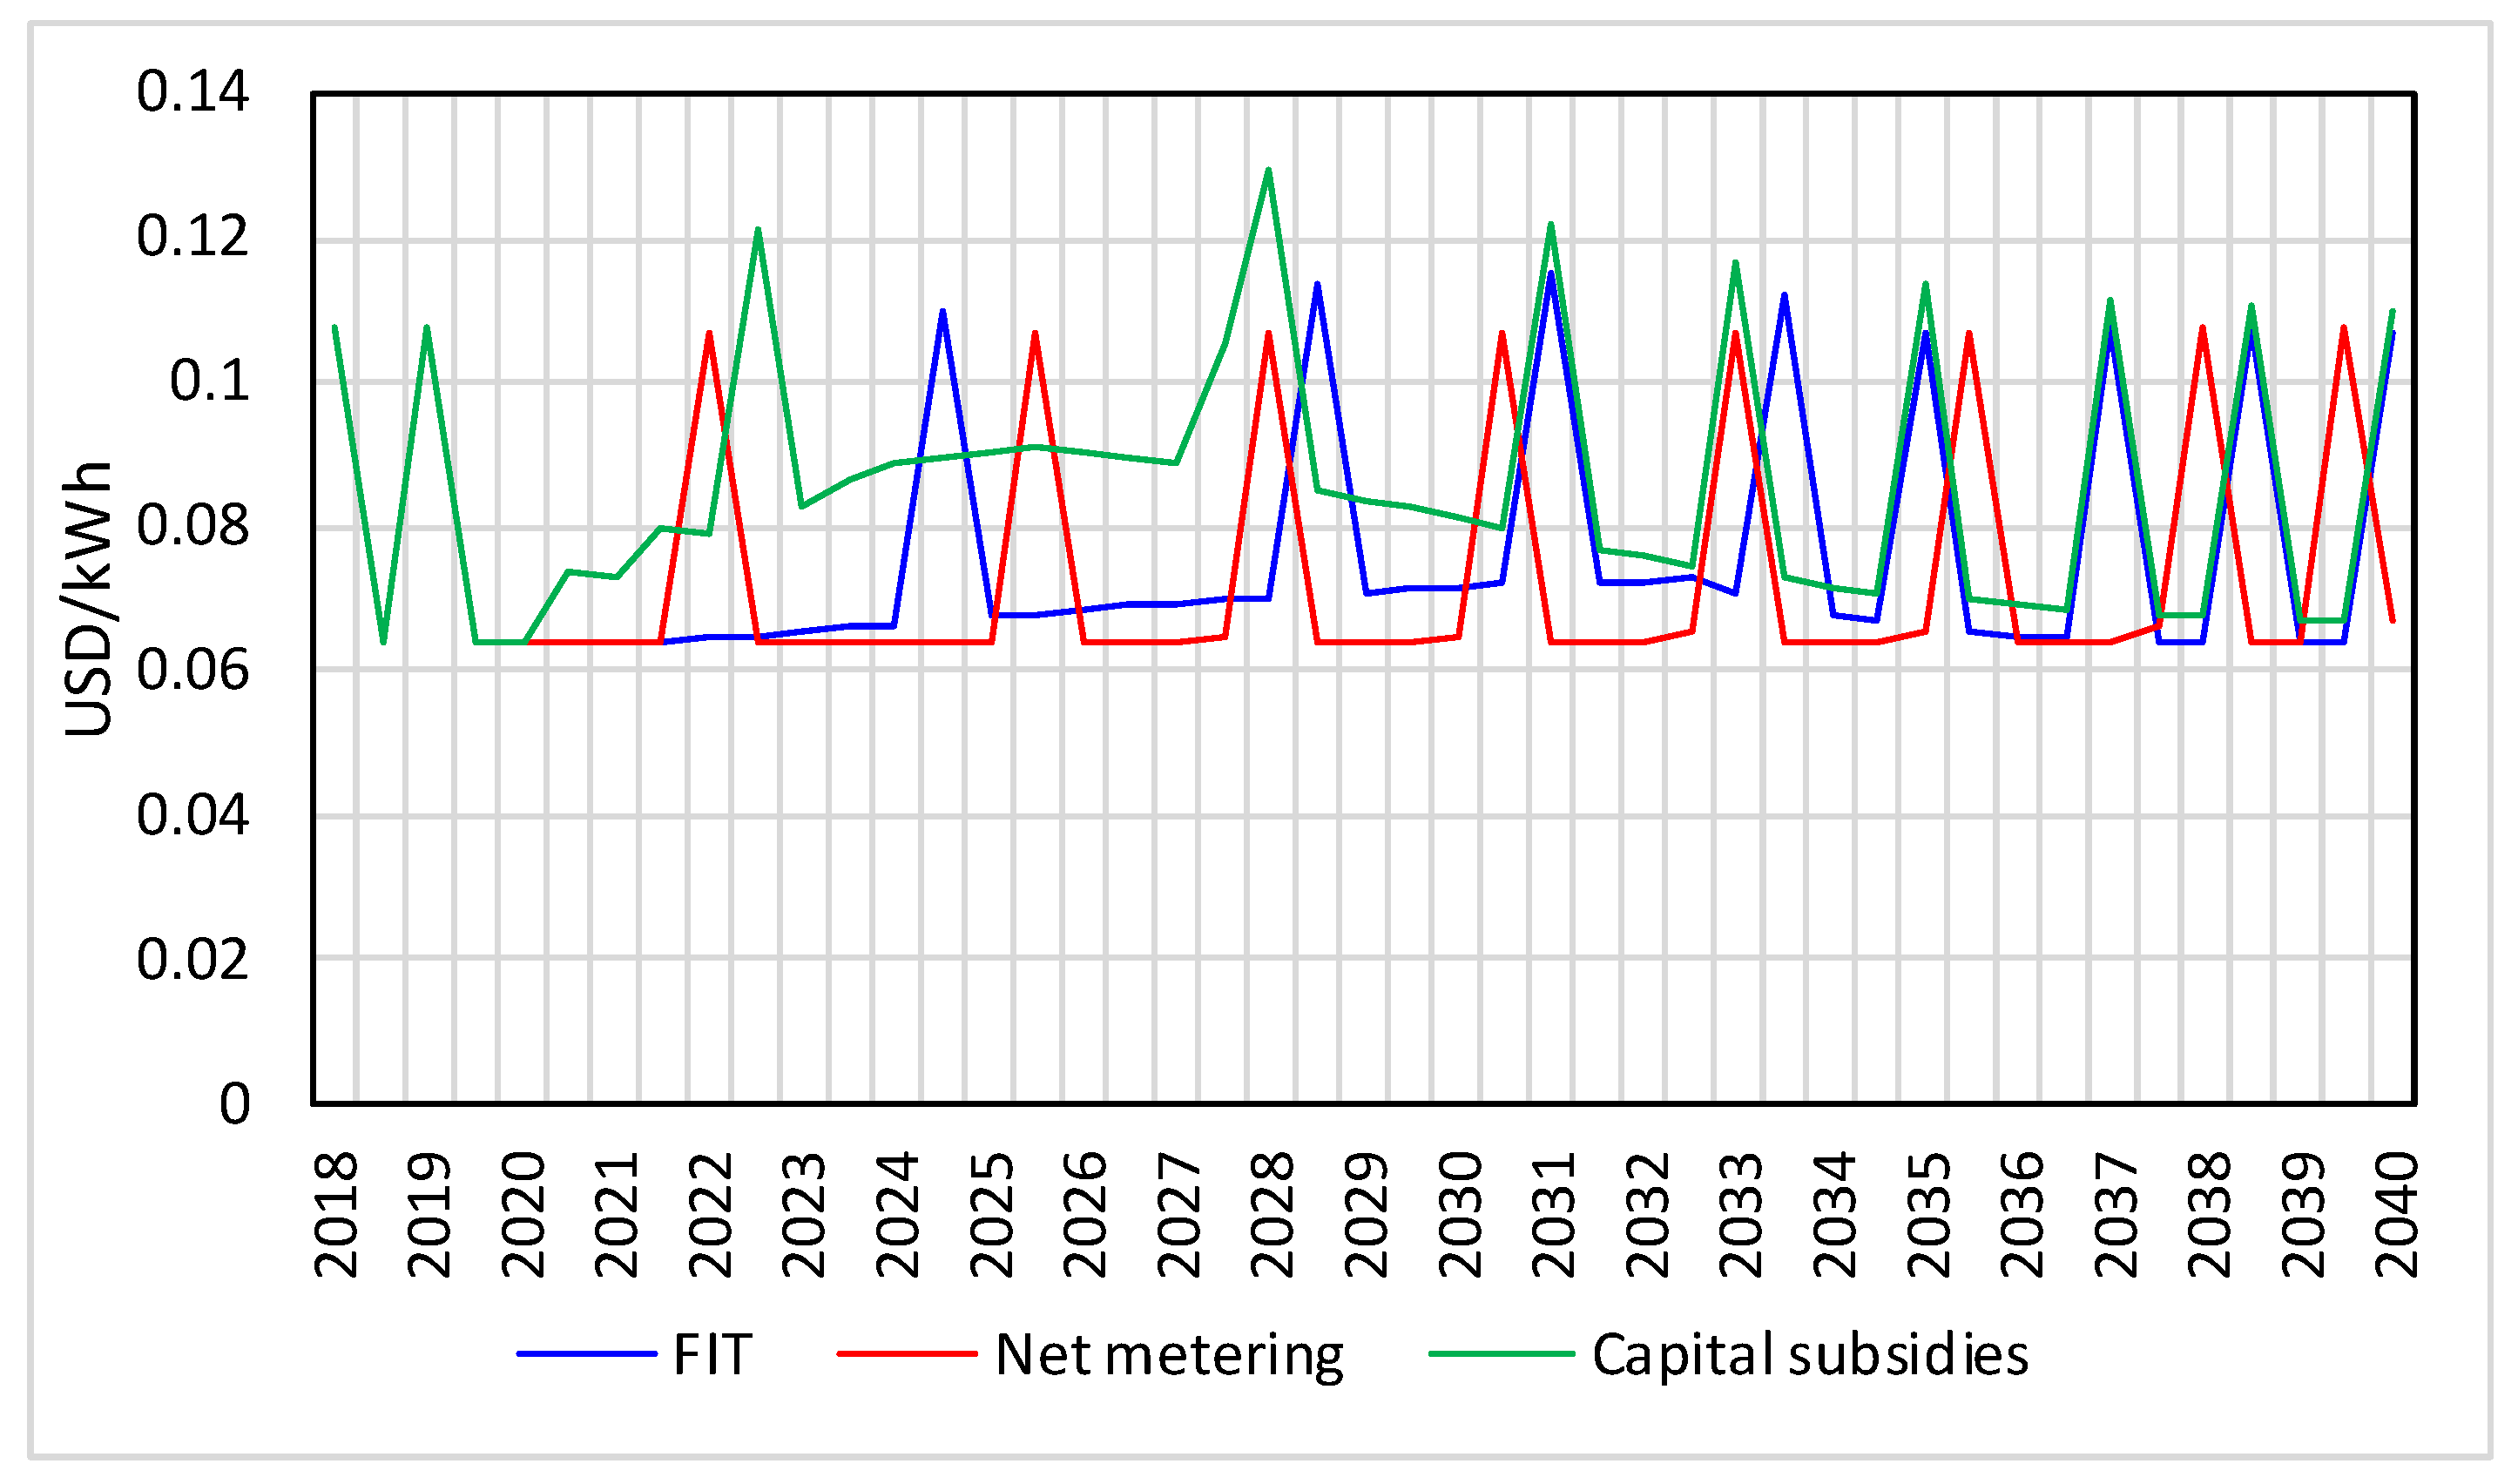
The three policies with respect to the retail electricity price are shown in Figure 11. These results confirm the effects of each isolated policy on the energy bill paid by final customers. However, the effect of the wholesale electricity price here is perceived. This shows some ups and downs, produced by investment cycles, i.e., periods of over-capacity followed by under-capacity. In other words, an excess of power capacity produces a high margin, which reduces the wholesale electricity price, leading to a period without capacity additions and therefore under-capacity conditions. This again produces a low margin that increases the wholesale electricity price, and the investment cycle repeats.
Table 2 compares the PV policy performance. The policy indicators analyzed to study the effectiveness of these policies are PV installed capacity and total avoided emissions. These indicators reflect the extent to which the environmental purpose of the PV policy is achieved. The efficiency of the PV policies is assessed through affordability indicators such as the average PV charge, which is included in the retail electricity tariff paid by the final consumers in the energy bill. Another indicator of efficiency is the average cost of each MW of solar PV installed, which is calculated as the total cost of the PV policy divided by the total PV installed capacity.
As can be observed in Table 2, the capital subsidy produces the highest levels of PV adoption; however, its avoided emissions are lower compared to those obtained under feed-in tariff. It is also the least efficient policy as it is associated with the highest policy costs. The most effective policy is feed-in tariff as it is associated with the highest reduction of CO2; regarding the affordability aspect, it is a moderate policy. The most efficient policy is net metering as it entails the lowest policy cost. However, with net metering, the highest levels of solar PV are not reached—the solar PV installed capacity is 7% lower compared to when feed-in tariffs are applied.
The next section discusses the main conclusions derived from this paper as well as the best policies to deploy solar PV in the Colombian residential sector.

5. Conclusions

This paper reaches conclusions on a variety of issues regarding the performance of solar PV policies in the Colombian residential sector, specifically feed-in tariff, net metering, and capital subsidy. The study provides insights into policy analysis, contributing to a better understanding of the long-term effects of solar PV policies. Results suggest that the most effective policy in terms of PV installed power capacity and avoided CO2 emissions is feed-in tariff and that in terms of efficiency, it is a moderate policy. Although, capital subsidy leads to a higher PV installed capacity compared to feed-in tariff, the avoided CO2 emissions with capital subsidy are lower compared to the feed-in tariff policy. In addition, capital subsidy is the least efficient policy compared to net metering and feed-in tariffs. In the case of net metering, this technology is not the most effective technology, but it is the most efficient. Next, some design aspects of each PV policy are discussed.
Feed-in tariff seems more effective but also less efficient than net metering. The danger of this policy is that it may create windfall profits for PV producers. Policy designers must carry out adjustments according to learning curves given that solar PV is expected to get cheaper as PV installed capacity increases in the future. Thus, to ensure that feed-in tariff rates are reduced progressively, a degression mechanism should be applied. Additionally, potential adopters must perceive positive economic conditions for investing in PV systems—in spite of the application of a degression mechanism—to avoid any drop in PV investments.
In the case of net metering, it seems an efficient and effective policy. However, this policy has been criticized for being unfair because PV owners are compensated with the full retail rate for essentially wholesale energy [61,62,63]. In addition, the network costs avoided by PV owners are paid by non-PV owner as cross-subsidies [64]. This aspect was not investigated in depth here, although other studies have previously demonstrated the opportunistic behavior associated with net metering [25,26].
The capital subsidy seems the least suitable policy to promote solar PV in the Colombian electricity market. However, this should not be totally ruled out given that the Colombian population is categorized according to their incomes, and most households belong to the low-income population—nearly 88%—representing about 80% of the residential energy consumption in 2017 [60]. For this population, the upfront costs may be a barrier for adopting a PV system.
In conclusion, any PV policy chosen should be carefully designed and continuously assessed to avoid any side effects. The two best alternatives to encourage PV investments are net metering and feed-in tariff. However, the best policy depends on the priorities of policy designers—those who give more importance to solar PV investments would prefer feed-in tariff, while designers who give priority to efficiency would prefer net metering. In addition, further work is necessary to determine the effect of policy combination. For instance, a capital subsidy may be applied temporarily to accelerate the adoption process, helping to saturate the potential market faster. This policy may be combined with net metering, which seems to be the most efficient policy.

Author Contributions

Conceptualization, M.C. and S.Z.; data collection, A.A.; investigation, M.C. and S.Z.; resources, A.A.; built the model, S.Z. and M.C.; supervision, A.A.; writing of the original draft, M.C. and A.A.; writing of review and editing, M.C. and S.Z.

Funding

This research was supported by Universidad de Bogota Jorge Tadeo Lozano under grant 830-15-17.

Acknowledgments

We are grateful with our friends, which give us a lot of advice and support.

Conflicts of Interest

The authors declare no conflict of interest.

References

  1. REN21. Renewable Energy Policy Network for the 21st Century; Renewables 2018 Global Status Report; REN21: Paris, France, 2018. [Google Scholar]
  2. Masson, G.; Kaizuka, I.; Brunisholz, M. 2018 Snapshot of global photovoltaic markets; International Energy Agency: Paris, France, 2018. [Google Scholar]
  3. International Renewable Energy Agency (IRENA). Global Renewable Generation Continues its Strong Growth, New IRENA Capacity Data Shows. Available online: http://www.irena.org/newsroom/pressreleases/2018/Apr/Global-Renewable-Generation-Continues-its-Strong-Growth-New-IRENA-Capacity-Data-Shows (accessed on 8 August 2018).
  4. Taylor, M.; Ralon, P.; Ilas, A. The Power to Change: Solar and Wind Cost Reduction Potential to 2025; IRENA: Abu Dhabi, UAE, 2016. [Google Scholar]
  5. Pepermans, G.; Driesen, J.; Haeseldonckx, D.; Belmans, R.; D’haeseleer, W. Distributed generation: definition, benefits and issues. Energy Policy 2005, 33, 787–798. [Google Scholar] [CrossRef]
  6. Ackermann, T. Distributed generation: A definition. Electr. Power Syst. Res. 2001, 57, 195–204. [Google Scholar] [CrossRef]
  7. Australian Energy Council. Renewable Energy in Australia—How Do We Really Compare? Australian Energy Council: Melbourne, Australia, 2016. [Google Scholar]
  8. Sioshansi, F.; Weinberg, C. Lessons from other industries facing disruptive technology. In Distributed Generation and Its Implications for the Utility Industry; Elsevier Inc.: Amsterdam, The Netherlands, 2014; pp. 141–162. ISBN 9780128002407. [Google Scholar]
  9. El Chaar, L.; Lamont, L.A.; El Zein, N. Review of photovoltaic technologies. Renew. Sustain. Energy Rev. 2011, 15, 2165–2175. [Google Scholar] [CrossRef]
  10. Anzalchi, A.; Sarwat, A. Overview of technical specifications for grid-connected photovoltaic. Energy Convers. Manag. 2017, 152, 312–327. [Google Scholar] [CrossRef]
  11. Tayal, D.; Rauland, V. Future business models for Western Australian electricity utilities. Sustain. Energy Technol. Assess. 2017, 19, 59–69. [Google Scholar] [CrossRef]
  12. Pérez-Arriaga, I.J.; Ruester, S.; Schwenen, S.; Battle, C.; Glachant, J.-M. From Distribution Networks to Smart Distribution Systems: Rethinking the Regulation of European Electricity DSOs; European University Institute: Fiesole, FI, Italy, 2013; ISBN 9789290841432. [Google Scholar]
  13. Thiam, D.R. An energy pricing scheme for the diffusion of decentralized renewable technology investment in developing countries. Energy Policy 2011, 39, 4284–4297. [Google Scholar] [CrossRef]
  14. Kumar, B. A study on global solar PV energy developments and policies with special focus on the top ten solar PV power producing countries. Renew. Sustain. Energy Rev. 2015, 43, 621–634. [Google Scholar] [CrossRef]
  15. De Boeck, L.; Van Asch, S.; De Bruecker, P.; Audenaert, A. Comparison of support policies for residential photovoltaic systems in the major EU markets through investment profitability. Renew. Energy 2016, 87, 42–53. [Google Scholar] [CrossRef]
  16. Dusonchet, L.; Telaretti, E. Comparative economic analysis of support policies for solar PV in the most representative EU countries. Renew. Sustain. Energy Rev. 2015, 42, 986–998. [Google Scholar] [CrossRef]
  17. Cansino, J.M.; Pablo-Romero, M.D.P.; Román, R.; Yñiguez, R. Promoting renewable energy sources for heating and cooling in EU-27 countries. Energy Policy 2011, 39, 3803–3812. [Google Scholar] [CrossRef]
  18. Del Río, P.; Mir-Artigues, P. Support for solar PV deployment in Spain: Some policy lessons. Renew. Sustain. Energy Rev. 2012, 16, 5557–5566. [Google Scholar] [CrossRef]
  19. Sarasa-Maestro, C.J.; Dufo-López, R.; Bernal-Agustín, J.L. Photovoltaic remuneration policies in the European Union. Energy Policy 2013, 55, 317–328. [Google Scholar] [CrossRef]
  20. Karneyeva, Y.; Wüstenhagen, R. Solar feed-in tariffs in a post-grid parity world: The role of risk, investor diversity and business models. Energy Policy 2017, 106, 445–456. [Google Scholar] [CrossRef]
  21. Bale, C.S.E.; Varga, L.; Foxon, T.J. Energy and complexity: New ways forward. Appl. Energy 2015, 138, 150–159. [Google Scholar] [CrossRef] [Green Version]
  22. Qudrat-ullah, H. Modelling and Simulation in Service of Energy Policy. Energy Procedia 2015, 75, 2819–2825. [Google Scholar] [CrossRef]
  23. Dyner, I.; Larsen, E.R. From planning to strategy in the electricity industry. Energy Policy 2001, 29, 1145–1154. [Google Scholar] [CrossRef]
  24. Movilla, S.; Miguel, L.J.; Blázquez, L.F. A system dynamics approach for the photovoltaic energy market. Energy Policy 2013, 60, 142–154. [Google Scholar] [CrossRef]
  25. Campoccia, A.; Dusonchet, L.; Telaretti, E.; Zizzo, G. An analysis of feed’ in tariffs for solar PV in six representative countries of the European Union. Sol. Energy 2014, 107, 530–542. [Google Scholar] [CrossRef]
  26. Verbruggen, A.; Lauber, V. Assessing the performance of renewable electricity support instruments. Energy Policy 2012, 45, 635–644. [Google Scholar] [CrossRef]
  27. Sovacool, B.K. The importance of comprehensiveness in renewable electricity and energy-efficiency policy. Energy Policy 2009, 37, 1529–1541. [Google Scholar] [CrossRef]
  28. Haas, R.; Resch, G.; Panzer, C.; Busch, S.; Ragwitz, M.; Held, A. Efficiency and effectiveness of promotion systems for electricity generation from renewable energy sources—Lessons from EU countries. Energy 2010, 36, 2186–2193. [Google Scholar] [CrossRef]
  29. Castaneda, M.; Jimenez, M.; Zapata, S.; Franco, C.J.; Dyner, I. Myths and facts of the utility death spiral. Energy Policy 2017, 110, 105–116. [Google Scholar] [CrossRef]
  30. Castaneda, M.; Franco, C.J.; Dyner, I. Evaluating the effect of technology transformation on the electricity utility industry. Renew. Sustain. Energy Rev. 2017, 80, 341–351. [Google Scholar] [CrossRef]
  31. Jimenez, M.; Franco, C.J.; Dyner, I. Diffusion of renewable energy technologies: The need for policy in Colombia. Energy 2016, 111, 818–829. [Google Scholar] [CrossRef]
  32. Sovacool, B.K.; Agostino, A.L.D.; Bambawale, M.J. The socio-technical barriers to Solar Home Systems (SHS) in Papua New Guinea: “Choosing pigs, prostitutes, and poker chips over panels”. Energy Policy 2011, 39, 1532–1542. [Google Scholar] [CrossRef]
  33. Hsu, A.; Rosengarten, C.; Weinfurter, A.; Xie, Y. Renewable Energy and Energy Efficiency in Developing Countries: Contributions to Reducing Global Emissions Third Report; UNEP: Nairobi, Kenya, 2017; ISBN 978-9-291426515. [Google Scholar]
  34. Intergovernmental Panel on Climate Change (IPCC). Mitigation of Climate Change: Contribution of Working Group III to the Fourth Assessment Report of the Intergovernmental Panel on Climate Change; IPCC: Geneva, Switzerland, 2007; ISBN 0521880114. [Google Scholar]
  35. Verbruggen, A. Performance evaluation of renewable energy support policies, applied on Flanders’ tradable certificates system. Energy Policy 2009, 37, 1385–1394. [Google Scholar] [CrossRef]
  36. Del Río, P. The dynamic efficiency of feed-in tariffs: The impact of different design elements. Energy Policy 2012, 41, 139–151. [Google Scholar] [CrossRef]
  37. Weitzman, M.L. Prices vs. Quantities. Rev. Econ. Stud. 1974, 1974, 477–491. [Google Scholar] [CrossRef]
  38. Franz, S. Regulatory Trends in Renewable Energy Self-Supply Título: Regulatory Trends in Renewable Energy Self-Supply Proyecto Energía Solar para la Generación de Electricidad y Calor Página 3; Ministerio de Energía de Chile: Santiago, Chile, 2016.
  39. La Monaca, S.; Ryan, L. Solar PV where the sun doesn’t shine: Estimating the economic impacts of support schemes for residential PV with detailed net demand pro fi ling. Energy Policy 2017, 108, 731–741. [Google Scholar] [CrossRef]
  40. Yamamoto, Y. Pricing electricity from residential photovoltaic systems: A comparison of feed-in tariffs, net metering, and net purchase and sale. Sol. Energy 2012, 86, 2678–2685. [Google Scholar] [CrossRef]
  41. Poullikkas, A. A comparative assessment of net metering and feed in tariff schemes for residential PV systems. Sustain. Energy Technol. Assess. 2013, 3, 1–8. [Google Scholar] [CrossRef]
  42. Ahmad, S.; Tahar, R.M.; Muhammad-Sukki, F.; Munir, A.B.; Rahim, R.A. Role of feed-in tariff policy in promoting solar photovoltaic investments in Malaysia: A system dynamics approach. Energy 2015, 84, 808–815. [Google Scholar] [CrossRef] [Green Version]
  43. Radomes, A.A.; Arango, S. Renewable energy technology diffusion: An analysis of photovoltaic-system support schemes in Medellín, Colombia. J. Clean. Prod. 2015, 2009. [Google Scholar] [CrossRef]
  44. Hsu, C.-W. Using a system dynamics model to assess the effects of capital subsidies and feed-in tariffs on solar PV installations. Appl. Energy 2012, 100, 205–217. [Google Scholar] [CrossRef]
  45. Mahajan, V.; Muller, E.; Bass, F.M. New product diffusion models in marketing: A review and directions for research. J. Mark. 1990, 54, 125–177. [Google Scholar] [CrossRef]
  46. Intergovernmental Panel on Climate Change (IPCC). Climate Change 2014: Mitigation of Climate Change; Cambridge University Press: Cambridge, UK; New York, NY, USA, 2014. [Google Scholar]
  47. Congreso Colombia Ley 1715 de 2014. Available online: http://www.comunidadcontable.com/BancoMedios/Imagenes/ley%201715%20de%202014.pdf (accessed on 30 September 2018).
  48. Zapata, S.; Castaneda, M.; Garces, E.; Franco, C.J.; Dyner, I. Assessing security of supply in a largely hydroelectricity-based system: The Colombian case. Energy 2018, 156, 444–457. [Google Scholar] [CrossRef]
  49. Franco, C.J.; Castaneda, M.; Dyner, I. Simulating the new British Electricity-Market Reform. Eur. J. Oper. Res. 2015, 245, 273–285. [Google Scholar] [CrossRef]
  50. CREG. Resolución 31 de 1997—Formula tarifaria; Ministry of Justice and Law: Bogotá, Colombia, 1997; pp. 1–14.
  51. Branker, K.; Pathak, M.J.M.; Pearce, J.M. A review of solar photovoltaic levelized cost of electricity. Renew. Sustain. Energy Rev. 2011, 15, 4470–4482. [Google Scholar] [CrossRef]
  52. Sterman, J.D. Business Dynamics: Systems Thinking and Modeling for a Complex World; McGraw-Hill Higher Education: Columbus, OH, USA, 2000; ISBN 0-07-231135-5. [Google Scholar]
  53. Bass, F. A new product growth for model consumer durables. Manag. Sci. 1969, 15, 215–227. [Google Scholar] [CrossRef]
  54. IPCC. IPCC Guidelines for National Greenhouse Gas Inventories 2006. Available online: https://www.ipcc-nggip.iges.or.jp/public/2006gl/index.html (accessed on 5 January 2018).
  55. Estimaciones y proyección de población (DANE). Estimaciones y Proyecciónes de Hogares y Viviendas; DANE: Bogotá, Colombia, 2010. Available online: http://www.dane.gov.co/index.php/poblacion-y-demografia/proyecciones-de-poblacion (accessed on 3 November 2015).
  56. Departamento Administrativo Nacional de Estadisticas (DANE). Proyecciones Nacionales y Departamentales de Poblacion 2005–2020; DANE: Bogotá, Colombia, 2009; ISBN 9789586240789. [Google Scholar]
  57. UPME; IDEAM. Atlas de Radiación solar de Colombia; Ministerio de Minas y Energía: Bogotá, Colombia, 2005.
  58. UPME; BID. Integración de las Energías Renovables no Convencionales en Colombia. Available online: https://www.senado.gov.co/historia/item/download (accessed on 8 August 2018).
  59. XM Portal BI. Available online: https://www.portalbi.org (accessed on 1 August 2018).
  60. SUI. Sistema unico de Informacion de Servicios Publicos Domiciliarios. Available online: http://www.sui.gov.co/web (accessed on 8 March 2018).
  61. Costello, K.W. Major Challenges of Distributed Generation for State Utility Regulators. Electr. J. 2015, 28, 8–25. [Google Scholar] [CrossRef]
  62. Brown, A.; Lund, L. Distributed Generation: How Green? How Efficient? How Well-Priced? Electr. J. 2013, 26, 28–34. [Google Scholar] [CrossRef]
  63. Kirsch, L.D.; Morey, M.J. Pricing Retail Electricity in a Distributed Energy Resources World. Electr. J. 2015, 28, 1–10. [Google Scholar] [CrossRef]
  64. Eid, C.; Reneses, J.; Frías, P.; Hakvoort, R. The economic effect of electricity net-metering with solar PV: Consequences for network cost recovery, cross subsidies and policy objectives. Energy Policy 2014, 75, 244–254. [Google Scholar] [CrossRef]
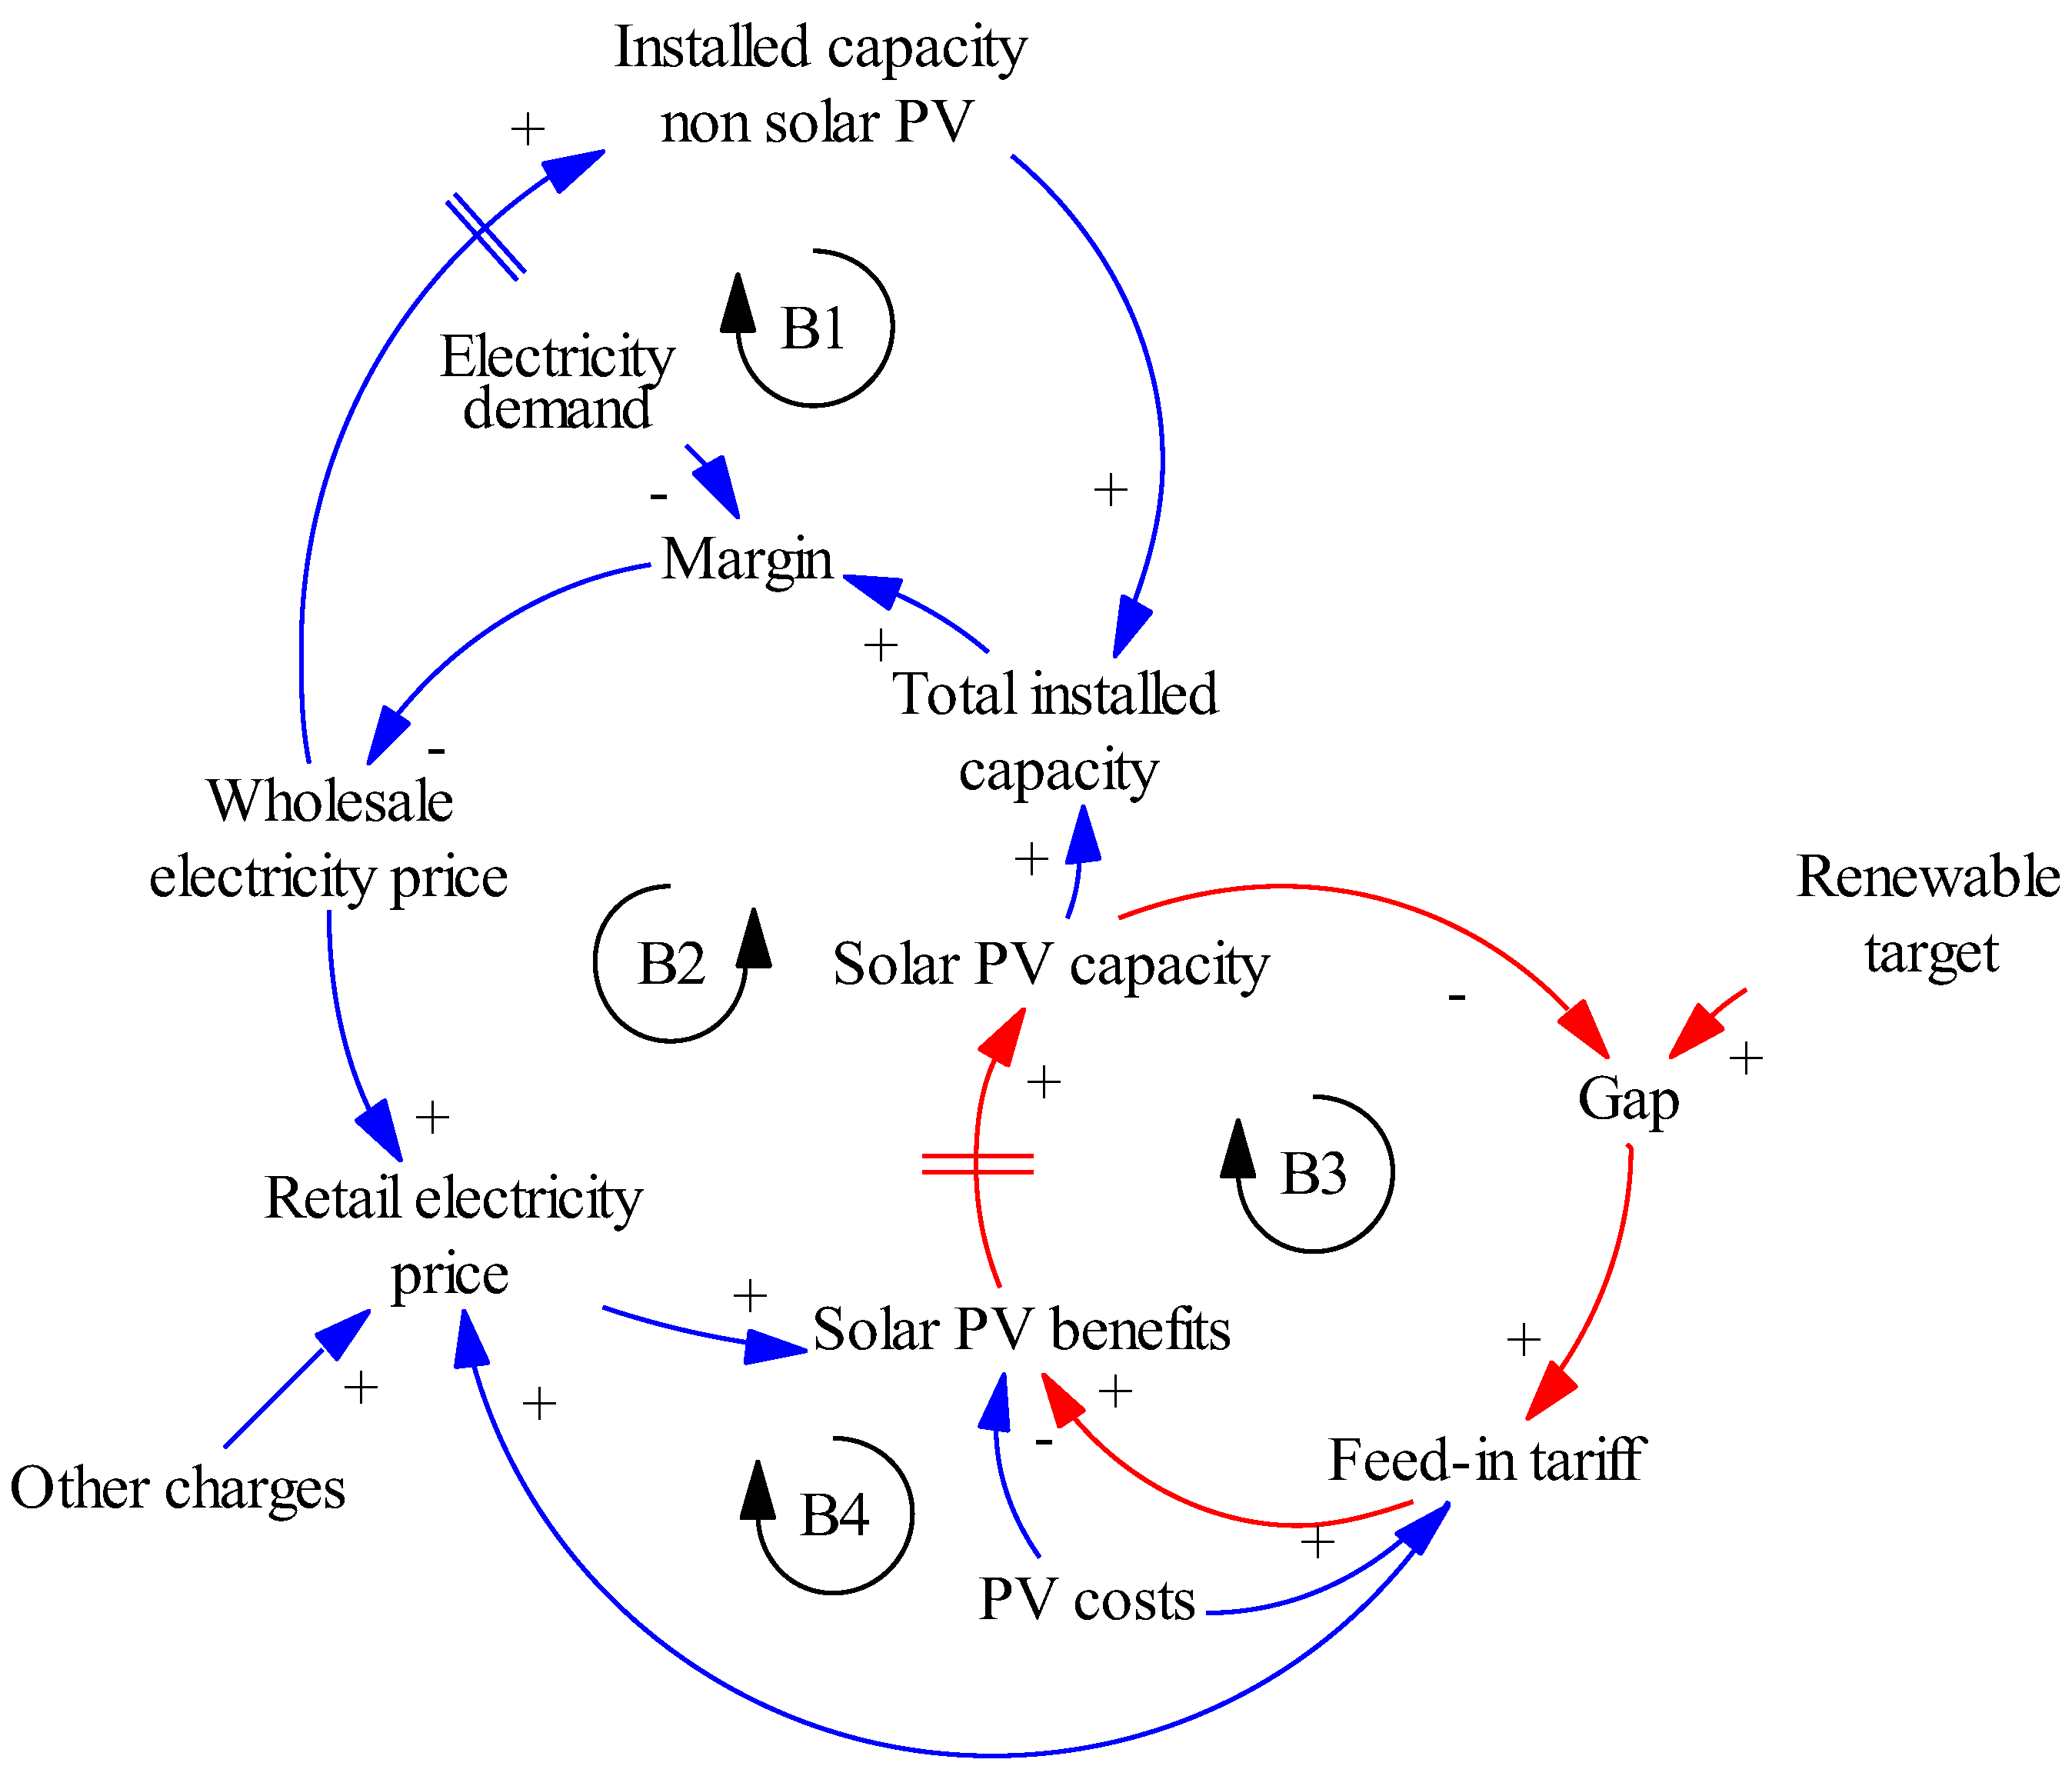
Figure 1. Dynamics hypothesis of photovoltaic (PV) adoption and feed-in tariff scheme.
Energies 11 02614 g001
Figure 2. Dynamics hypothesis of PV adoption and net metering scheme.
Energies 11 02614 g002
Figure 3. Dynamics hypothesis of PV adoption and capital subsidy.
Energies 11 02614 g003
Figure 4. Subsystem diagram.
Energies 11 02614 g004
Figure 5. Simulation model created with Vensim.
Energies 11 02614 g005
Figure 6. Solar PV cumulative installed capacity under different policies.
Energies 11 02614 g006
Figure 7. PV adoption rate under different policies.
Energies 11 02614 g007
Figure 8. Cost of policies.
Energies 11 02614 g008
Figure 9. Tons of avoided CO2 under different policies.
Energies 11 02614 g009
Figure 10. Percentage contribution of PV energy charge to retail electricity tariff.
Energies 11 02614 g010
Figure 11. Retail electricity price.
Energies 11 02614 g011
Table 1. Some parameters and their assigned value use in the simulation model.
VariableValueSource
Population49,834,240 (people)[55]
Population growth2%[56]
Sunshine hours4.5 kWh/m2/day[57]
Levelized Cost of Energy (LCOE) of solar PV0.15 USD/ kWh[58]
Installed capacity17.34 GW[59]
Peak electricity demand10 GW[59]
Retail electricity tariff0.15 USD/kWh[60]
Average energy consumption per household188 kWh-month[60]
Table 2. Policy indicators.
PV Installed Capacity (MW)Total Avoided Emissions (Millions t CO2)Average PV Charges (USD/kWh)Cost of PV Installed (USD/MW)
Feed-in tariff75224,792,8230.0033133,335
Net metering70293,312,5800.000320,298
Capital subsidy75444,493,0530.0125509,616