1. Introduction
The wide application of fossil fuels provides sufficient energy support for industrial production. Oil shale is a combustible, fine bedding sedimentary rock consisting of inorganic minerals and 15–50% organic matters including organic polymers [
1]. The latter is mainly kerogen and distributed in the framework of minerals. The proven oil shale reserves in the world exceed 400 billion tons. As an alternative resource for petroleum, it has been widely exploited around the world [
2,
3]. Kerogen in oil shale is mainly composed of carbon, hydrogen, and oxygen and can directly react with oxygen [
4]. When oil shale is heated to about 500 °C, its kerogen undergoes pyrolysis and produces petroleum-like shale oil, which can be further processed to extract gasoline, kerosene, diesel and other liquid fuels [
5]. During the pyrolysis of oil shale, pyrolysis gases or retort gases are produced including CO, CO
2, CH
4, and C
nH
m (hydrocarbons with the number of C ≤ 4 except CH
4) [
6]. Studying the compositions of gases generated from the heated oil shale is of great significance for industrial production. It is well known that oil shale, as an underground combustible, high-ash sedimentary mineral, has tendency for spontaneous combustion during excavation. For example, five-oil shale spontaneous combustion accidents, along with toxic and harmful gas intrusions, occurred at the 6112 oil shale working face of Haishiwan Coal Mine in 2012 [
7]. Index gases are a series of gases that are generated in the oxidation process. From the oxidation index gas, it is easy to judge the oxidation stage of coal, oil shale and other materials. Therefore, studying the changes in index gases and temperature of oil shale during low temperature oxidation is of great significance for the safe and efficient oil shale excavation.
Researchers have in-depth studied the characteristics of temperature rise and gas production of oil shale based on the pyrolysis temperature, temperature increase rate, retention period, pyrolysis atmosphere, operating pressure, particle size and density, as well as inorganic content [
8,
9,
10,
11,
12]. Ots analyzed the formation of nitrogen oxides, sulfur oxides, polycyclic aromatic hydrocarbons and ash in oil shale direct-combustion process [
13]. Tariksaif determined the fracture numbers and mineral contents of oil shale before and after pyrolysis of oil shale using X-ray micro-computed tomography (X-ray μCT), automated ultra-high resolution scanning electron microscopy (SEM), Modular Automated Processing System (MAPS), and Focused Ion Beam Scanning Electron Microscopy (FIB-SEM) [
14]. Konist et al. studied the effects of supply gas with different N
2, O
2 and CO
2 ratios on C-bearing groups decomposition and SO
2 production of oil shale at 800, 850 and 900 °C and found that the CO
2 content in supply gas has the greatest impact [
15]. Jiang et al. determined the optimal pyrolysis temperature of Huadian oil shale and evaluated the catalytic properties of transition metal salts on oil shale [
16]. Wang found that increase in temperature rise rate could accelerate the heat transfer rate and improve the pyrolysis rate of organic materials, which are inductive to pyrolysis product extraction. In addition, the increase in particle size can enlarge the escape route of pyrolysis products, promote secondary cracking reaction, and reduce the content of shale oil [
17]. Aboulkas and El Harfi analyzed kerogen in oil shale using TG/DTG and found that increasing the heating rate could shift the maximum rate loss to a higher temperature [
18].
Pyrolysis is usually used to study the oxidation of oxides at temperatures above 500 °C. However, the oxidation of oil shale in a natural state occurs at low temperature oxidation from room temperature up to 200 °C. Therefore, researchers usually examine the oxidation characteristics of materials at low temperature using a temperature-programmed method, which refers to the method of heating materials at a certain rate in the external environment while supplying air or proposed gas components to analyze changes in the temperature, gas generation rate, oxygen consumption rate, and other related physical parameters in the heating process. The crossing point temperature between the mineral and temperature-programmed tank is an important parameter for judging the oxidative capability of the material. Generally speaking, above the crossing point temperature, coal rock enters the rapid oxidation stage, and its temperature begins to rise rapidly. Therefore, in actual excavation, this temperature is used as an important indicator for judging the oxidation of residual coal in the goaf [
19,
20]. The indicative gas is another important investigated index. In general, CO, CO
2, and other alkane and alkene gases will be produced during coal oxidation and temperature rise. Thus, studying the temperature at which certain gas is produced and its variation is of importance for understanding the oxidation performance of the coal rock [
21,
22,
23,
24] and developing fire prevention and extinguishment schemes based on temperature rise features for safe production in coal mines [
25,
26].
Su et al. used a temperature-programmed tank to study the coal’s oxidation states at different oxygen supply rates and quantitatively analyzed the effect of gas concentration on its oxidation risk [
27]. Tang studied the oxidation of oil shale in the range of 60–150 °C through a temperature-programmed device and analyzed oxygen consumption rates and gas products, and found that both C
2H
4 and H
2 cannot be used as representative gases to predict spontaneous combustion of oil shale in the underground oil shale mines [
28]. Qi et al. used a temperature-programmed experimental device to accurately test the amount of heat produced by oxidation of coal in different oxygen concentration atmospheres, based on which the kinetic parameters (the activation energy and the pre-exponential factors) of low-temperature oxidation in coal can be worked out [
29]. Wang et al. utilized a temperature-programmed device to study CO and CO
2 production rates during coal decomposition at 60–110 °C and found that CO and CO
2 production rates are temperature-dependent, but independent of the particle size of the samples, indicating that the thermal decomposition process is dominated by chemical kinetics rather than diffusion [
30]. Li et al. conducted isothermal oxidation experiments on raw-coal and pyrolytic samples using a temperature-programmed device to study the effects of oxygen-containing functional group content, pyrolysis temperature, oxidation temperature, particle size, pyrolysis and pyrolysis times on the oxidation properties of coal samples [
31]. Wang et al. used a temperature-programmed experimental setup to determine the impact of secondary oxidation on residual coal in the goaf [
32].
The pyrolysis and combustion of oil shale under high temperature conditions have been extensively explored. However, the characteristics of released heat and light gas extraction of oil shale in low temperature oxidation process have not been deep studied. In this study, we examined the characteristics of temperature change and extracted gases of oil shale from Liangjia Coal Mine, China, during low-temperature oxidation in temperature-programmed experiments. It will provide the theoretical foundation for studies on oil shale in low-temperature oxidation, and determination of operation parameters in retorting process and design of the retort furnace. The results of these tests will be a comparison of the results obtained with the provision of information on what constitutes the main obstacles to an effective process of obtaining useful minerals and also have a great significance on environmental pollution control caused by oil shale combustion.
3. Results
Figure 2 shows the relationship between the oil shale temperature and time at different air supply rates. From
Figure 2, it is clear that the oxidation and temperature increase process of oil shale mainly showed three stages: an initial slow oxidation stage followed in turn by a rapid temperature-increasing oxidation stage and a steady temperature-increasing oxidation stage. The air supply rate significantly affected the starting temperature of the rapid temperature-increasing oxidation stage. The greater the air supply rate is, the more sufficient the oxygen supply is and the earlier the oil shale enters the rapid temperature-increasing oxidation stage. In the rapid temperature-increasing oxidation stage, the crossing point temperatures were shown in all shale samples, which is a significant index of coal oxidation. The lower the crossing point temperature was, the stronger the capability of oil shale to be oxidized was. The crossing point temperatures of oil shale samples were 120 °C, 123 °C and 129 °C at air supply rates of 70 mL/min, 50 mL/min and 30 mL/min, respectively. In the second oil shale oxidation stage, the greater the air supply rate is, the higher the oil shale temperature is. Above 150 °C, all three samples simultaneously entered the steady oxidation stage with roughly the same temperature increase rates. Temperature in the steady oxidation stage is positively correlated with the air supply rate.
CO is one of the main index gases produced in the low-temperature oxidation stage of carbonaceous materials. As shown in
Figure 3, the CO concentration of oil shale sample showed a trend of a stable stage, a rapid growth and a slow growth stage. The higher the air supply rate, the lower the inflection temperature of stage transition. At temperature higher than 140 °C, oil shale samples at the three different air supply rates simultaneously transited into a rapid CO generation stage, indicating that the air supply rate plays a positive role in CO production with a characteristic that the higher the air supply rate is, the more the CO production is. Oil shale samples entered the slow growth oxidation stage at inflection temperatures of 160 °C, 170 °C and 180 °C at air supply rates of 70, 50 and 30 mL/min, respectively, indicating that the temperature of oil shale into the slow oxidation stage is negatively correlated with air supply rate increasing. The final CO concentrations of the three samples from high to low corresponded to samples at air supply rates of 50 mL/min, 70 mL/min, and 30 mL/min, and the growth rates of the three samples were approximately the same. The reason may be that: (1) sufficient oxygen supply at an air supply rate of 70 mL/min could result in full oxidization of carbon inside the oil shale sample, resulting in a decreased CO production in the later stage; (2) oxygen supply at an air supply rate of 50 mL/min was closer to its stoichiometric ratio, resulting in the highest CO concentration in the later stage; and (3) insufficient oxygen supply at an air supply rate of 30 mL/min led to poor C oxidation, resulting in the lowest CO production and causing that the sample entered into the slow oxidation intersection at the highest temperature.
Figure 4 shows the relationships between CH
4 concentrations and temperatures at the three different air supply rates. It is clear that CH
4 production during the low temperature oxidation of oil shale mainly underwent four stages. In the initial CH
4 production stage, oil shale samples started to produce CH
4 at 130 °C at air supply rates of 50 and 70 mL/min and at 140 °C at an air supply rate of 30 mL/min, indicating that a high air supply rate helps produce CH
4. As the temperature increased, oil shale samples entered a slow CH
4 production stage named a stable stage in roughly the same temperature ranges, indicating that the air supply rate has no significant effect on the initial CH
4 production. Above 140 °C, three oil shale samples all synchronically entered a CH
4 rapid growth stage. During the stage, oil shale samples fully reacted with oxygen, resulting in a rapid increase in the CH
4 concentration with a characteristic that the faster the air supply rate, the higher the CH
4 production rate. The rapid oxidation stage ended at 160 °C with an air supply rate of 70 mL/min and at 170 °C with an air supply rate of 50 mL/min as CH
4 concentration decreased. However, the decrease of CH
4 concentration did not appear at the sample with an air supply rate of 30 mL/min till the end of the experiment. It can be deduced that the rapid growth stage end-temperature of 30 mL/min sample was more than 200 °C. At last, different from the CH
4 production of coal in the low-temperature oxidation process, oil shale entered a CH
4 concentration decrease stage after reaching a certain temperature, as the CH
4 concentration reduced by 13.02% at an air supply rate of 50 mL/min and by 9.65% at an air supply rate of 70 mL/min. Due to higher air supply rates and sufficient oxygen, this stage was shorter at an air supply rate of 70 mL/min. At temperatures higher than 170 °C, oil shale samples started to produce CH
4 at a slower rate.
Figure 5 shows changes in C
2H
6 concentrations with temperature at the three different air supply rates. It is clear from
Figure 5 that, similar to CH
4 production, the C
2H
6 production from oil shale in the low-temperature oxidation process also underwent four stages: an initial stable stage, followed in turn by a rapid growth stage, a concentration reduction stage, and a slow growth stage. The samples at air supply rates of 50 mL/min and 70 mL/min began to produce C
2H
6 at 110 °C at the same time and the sample at an air supply rate of 30 mL/min began to produce C
2H
6 at 120 °C. With slow C
2H
6 concentration increase, at 140 °C, all oil shale samples simultaneously entered the rapid C
2H
6 growth stage and showed characteristics that the greater the air supply rate, the faster the C
2H
6 production rate. Interestingly, higher air supply rate did not mean more C
2H
6 production. The concentration of C
2H
6 produced from oil shale at the highest air supply rate of 70 mL/min began to decrease when temperature reached 160 °C, and regained growth when the temperature reached 180 °C. The concentration of C
2H
6 produced from oil shale at an air supply rate of 50 mL/min began to decline at 180 °C at a slower rate. Therefore, the peak C
2H
6 amount produced from oil shale sample at an air supply rate of 50 mL/min was greater than that from the oil shale sample at an air supply rate of 70 mL/min. In addition, the C
2H
6 concentration only decreased at a narrow temperature range of 180–190 °C at an air supply rate of 50 mL/min. At last, oil shale samples at air supply rates of 50 and 70 mL/min entered in a slow C
2H
6 growth stage with similar C
2H
6 concentrations. Differently, the oil shale sample at an air supply rate of 30 mL/min entered the rapid C
2H
6 growth stage at 140 °C. By the end of the experiment when the temperature was higher than 200 °C, the C
2H
6 concentration was still increasing but at growth rates of 37.59% and 23.23% corresponding to air supply rates of 50 and 70 mL/min, respectively. Presumably, the C
2H
6 reduction stage of 30 mL/min oil shale sample was more than 200 °C.
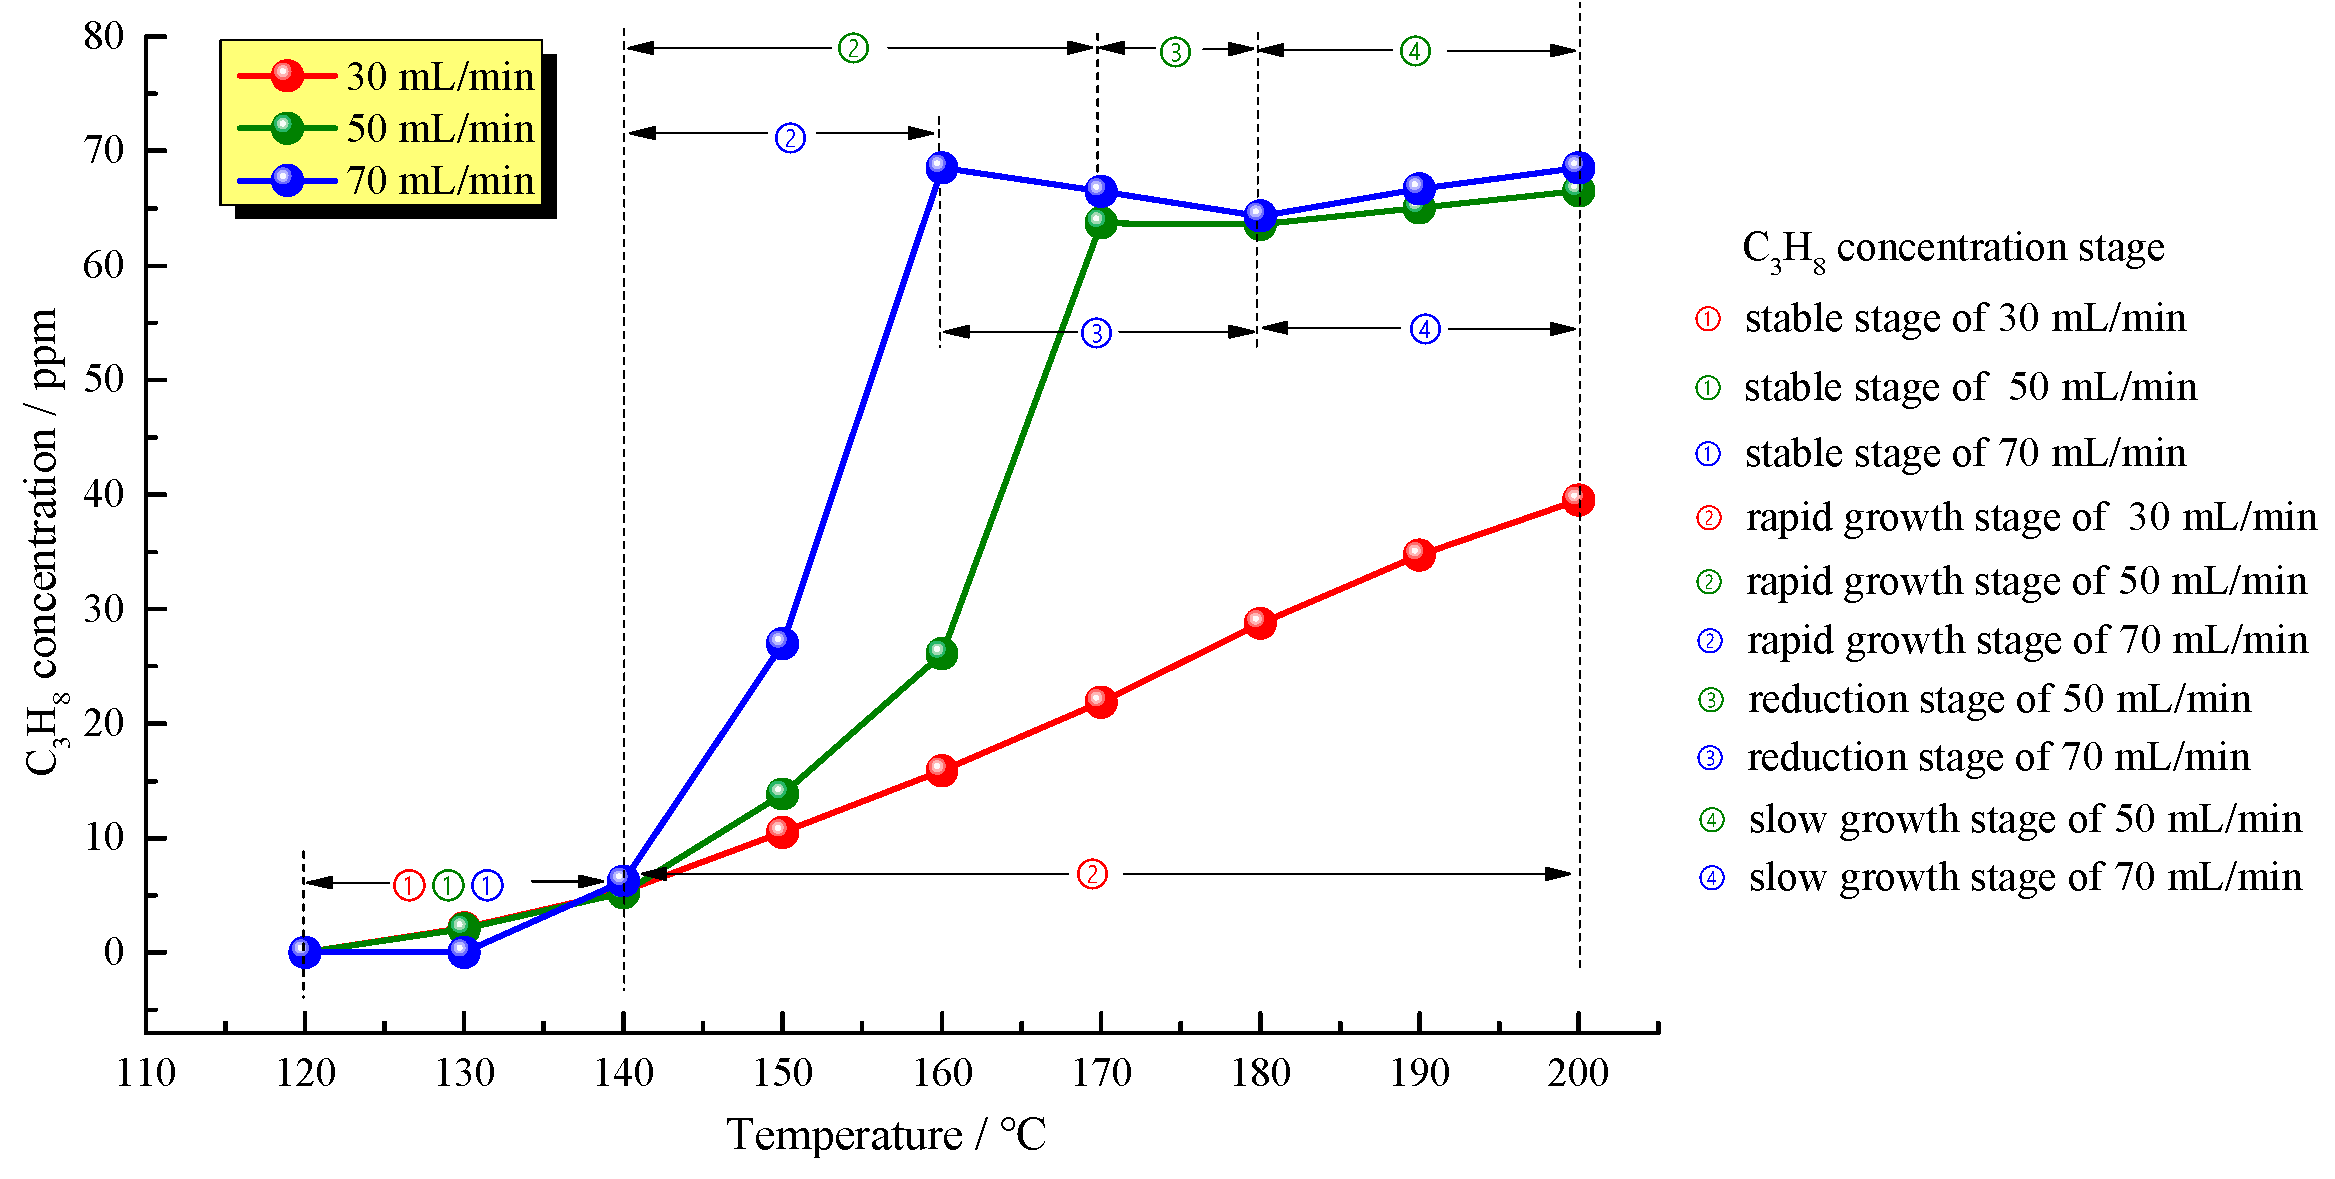
Figure 6 shows changes in C
3H
8 concentration with temperature at the three different air supply rates. It is clear from
Figure 6 that, similar to C
2H
6 production, the propane production from oil shale in the low-temperature oxidation process also underwent four stages. However, unlike C
2H
6, the air supply rates of 30 mL/min and 50 mL/min were generated at 130°C and the oil shale sample at an air supply rate of 70 mL/min did not generated C
3H
8 until the temperature reached 140 °C, revealing that air supply rate plays a negative role in C
3H
8 production of oil shale. At 130–140 °C, all oil shale samples were in the stable stages, which had a slow oxidation and where the C
3H
8 production was slow. Above 140 °C, all oil shale samples simultaneously stepped into the rapid C
3H
8 growth stage. C
3H
8 production started to decrease at 160 °C and 170 °C for oil shale samples at air supply rates of 70 mL/min and 50 mL/min, respectively, similar to the case in C
2H
6 production. Nevertheless, different from the C
2H
6 production, the air supply rate has a positive effect on the peak C
3H
8 concentration: the peak C
3H
8 concentration was 68.51 ppm at 150 °C for oil shale at an air supply rate of 70 mL/min and 63.71 ppm at 150 °C for oil shale at an air supply rate of 50 mL/min. Due to slow oxidation of oil shale at an air supply rate of 30 mL/min, C
3H
8 concentration did not reach its peak by the end of the experiment, with a maximum of 39.52 ppm. After reaching the peak concentrations, C
3H
8 concentration of oil shale reduced from 68.51 ppm to 64.31 ppm at an air supply rate of 70 mL/min by 6.13%, and decreased from 63.71 ppm to 63.59 ppm at an air supply rate of 50 mL/min by 0.19%. Afterwards, C
3H
8 concentrations of both samples began to gradually rise when the temperature exceeded 180 °C. As a whole, the higher the air supply rate, the more C
3H
8 generated eventually.
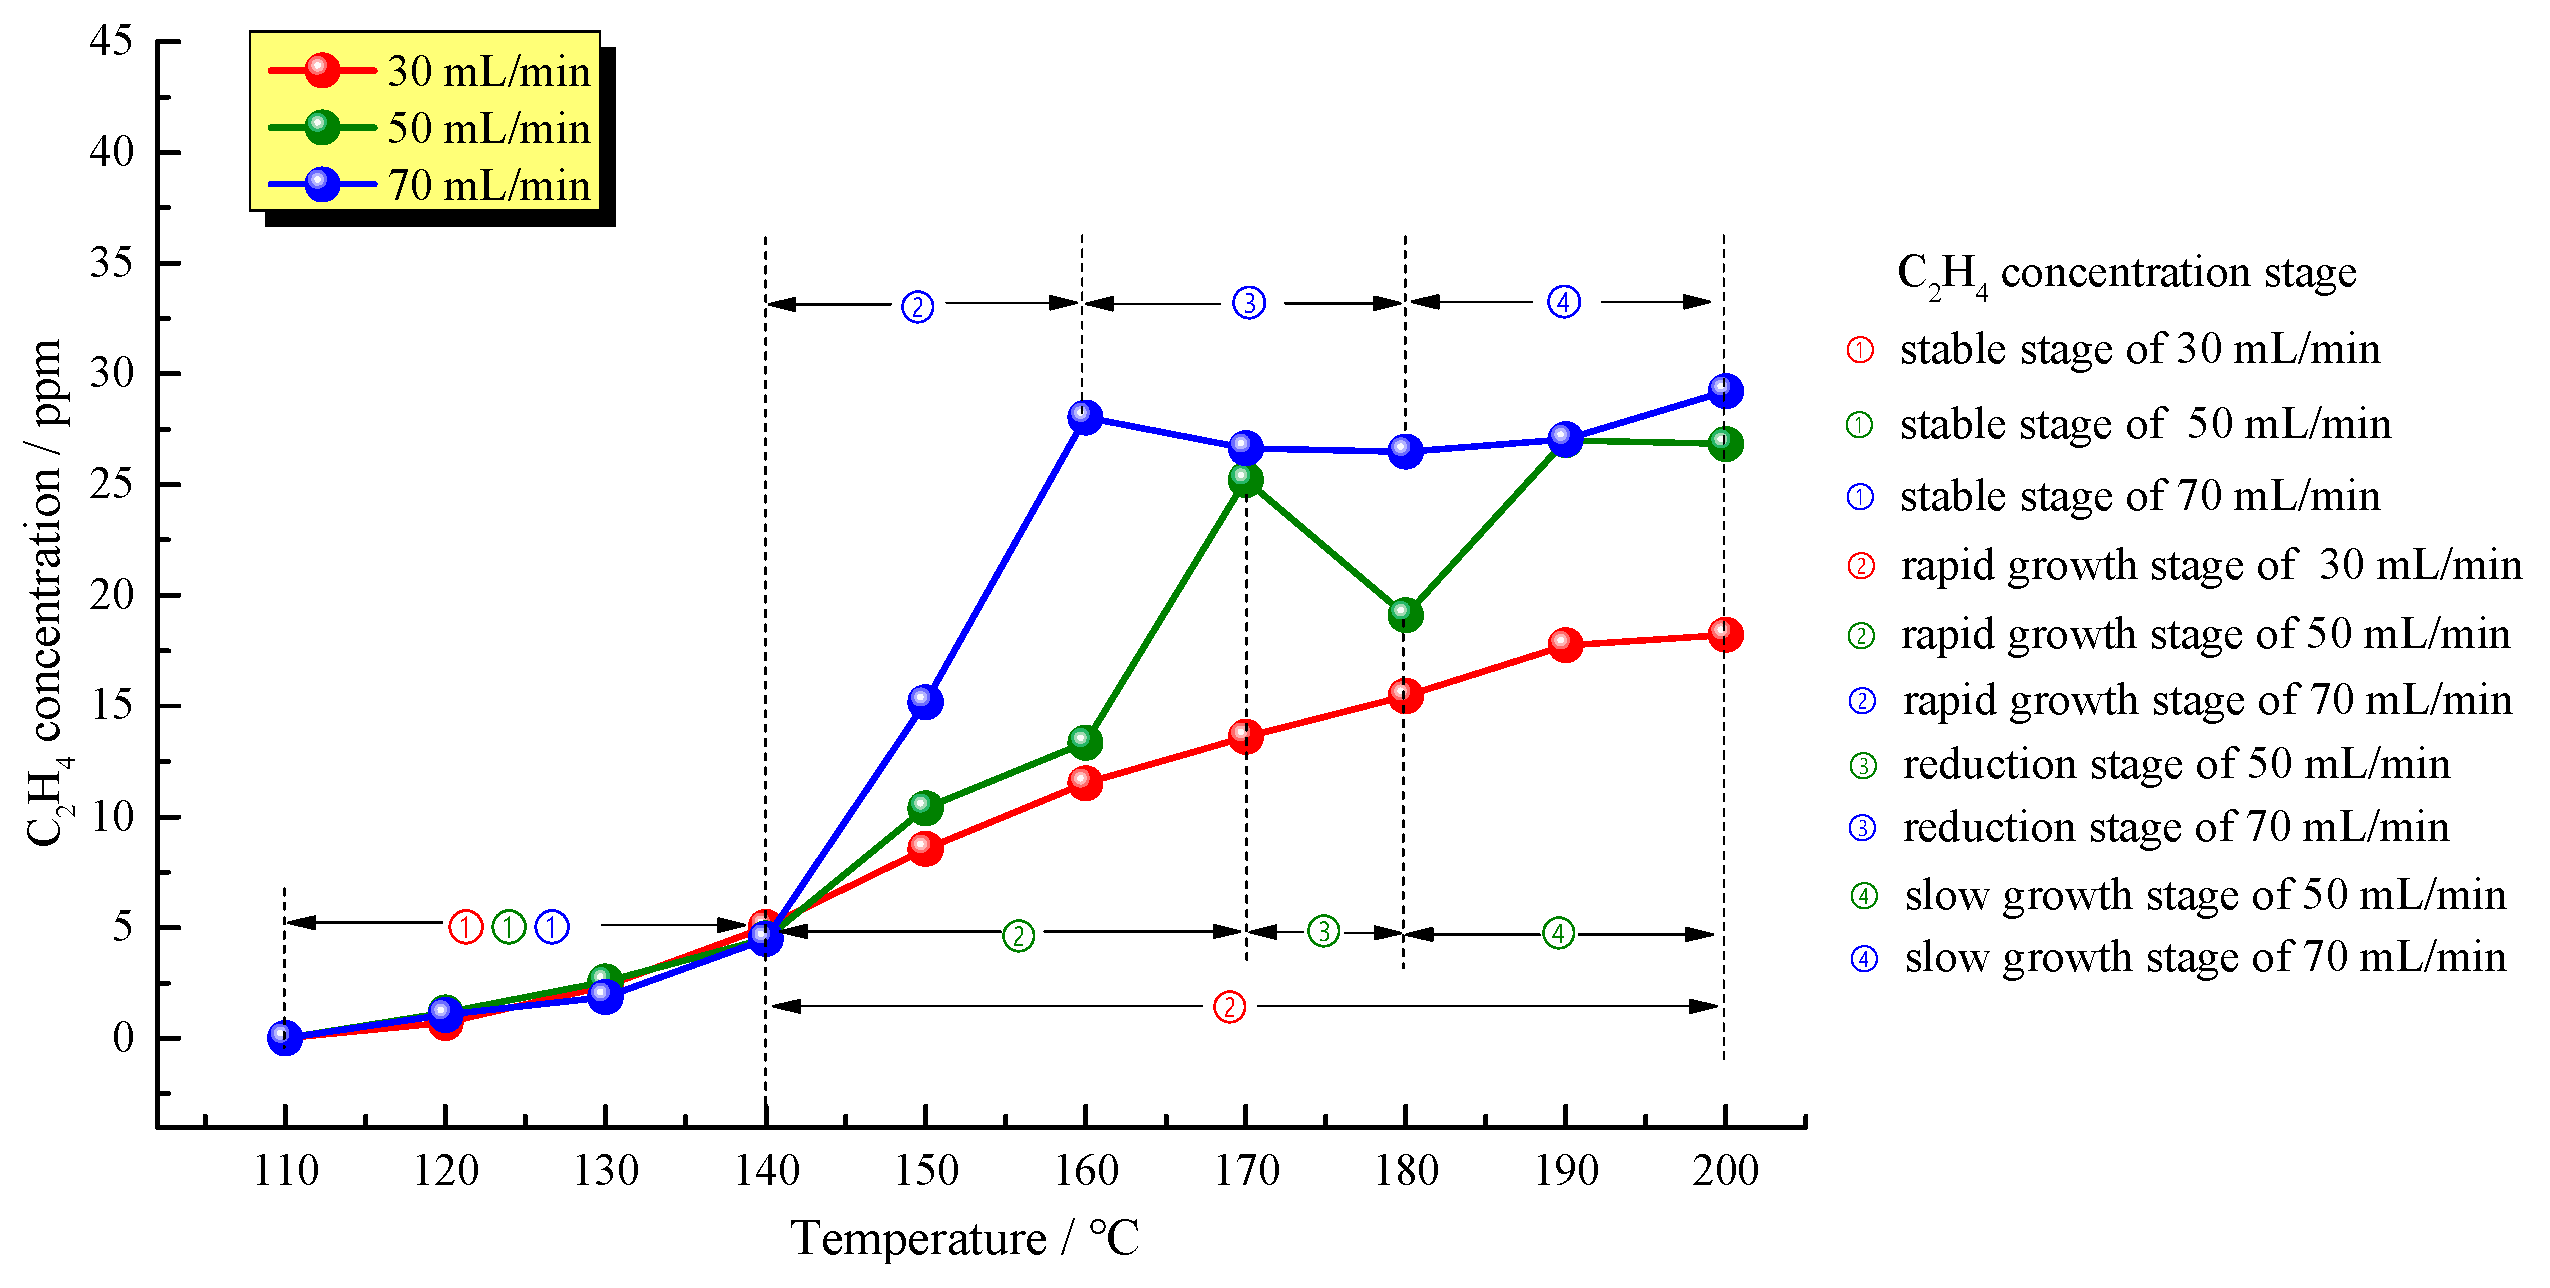
Figure 7 shows changes in C
2H
4 concentrations of oil shale with temperature at the three different air supply rates. As a key index gas used for judging the oxidation state of residual coal, C
2H
4 was specifically studied in the temperature-programmed experiment. It is clear from
Figure 7 that C
2H
4 was not produced from oil shale in the low-temperature oxidation process when temperature was lower than 120 °C. At 120 °C, the concentrations of C
2H
4 produced from oil shale samples at air supply rates of 50, 70 and 30 mL/min were 1.16 ppm, 1.16 ppm, and 0.7 ppm, respectively. With temperature increasing, C
2H
4 concentrations of the three samples increased slowly before the temperature reached 140 °C, showing no significant increase and the same concentration basically. These results indicated that, in the initial oxidation stage, the air supply rate has no significant effect on the production of C
2H
4. Above 140 °C, oil shale at an air supply rate of 70 mL/min first stepped into the rapid C
2H
4 growth stage with a C
2H
4 increase rate of 1.18 ppm/°C and this increase stopped at 160 °C; similarly, oil shale at an air supply rate of 50 mL/min entered the rapid C
2H
4 growth stage with a C
2H
4 increase rate of 0.69 ppm/°C and the growth stopped at 170 °C. After the end of the rapid growth stage, oil shale samples at air supply rates of 50 and 70 mL/min entered the C
2H
4 concentration reduction stage at 160–180 °C and 170–180 °C, with C
2H
4 concentrations reducing by 24.20% and 5.53%, respectively. Afterwards, oil shale samples at air supply rates of 50 and 70 mL/min stepped again into the slow growth stage with the C
2H
4 concentration fluctuating between 16.83 ppm and 29.22 ppm eventually. Oil shale at an air supply rate of 30 mL/min entered the rapid C
2H
4 growth stage till the end of the experiment with a C
2H
4 increase rate of 0.22 ppm/°C. However, due to the slower air supply rate, the C
2H
4 concentration reached maximum of 18.22 ppm by the end of the experiment without undergoing the reduction stage.
4. Discussion
In the present study, we analyzed the oxidation stages of oil shale at different air supply rates in the low-temperature oxidation process by examining changes in concentrations of gases produced from oil shale samples with temperature using a temperature-programmed experimental device.
At the initial stage of programmed temperature, the temperature of oil shale samples dropped, similar to that of coal, indicating that the oil shale samples were in the latent oxidation period. The higher the air supply rate, the lower the oil shale temperature. After 100 min, temperatures of oil shale samples rapidly increased and were positively correlated with the air supply rate. The higher the air supply rate was, the earlier the rapid increasing temperature began and the greater the temperature-increasing rate and range were. The air supply rate had a positive effect on the crossing point temperature, revealing that the higher the air supply rate, the lower the crossing point temperature. However, the air supply rate had no effect on the ends of rapid temperature increasing stage, and after that, three samples kept the same temperature-increasing rate. Therefore, the variation in oil shale temperature rise clearly showed that oil shale in the low temperature oxidation process had three major stages, namely the initial slow oxidation stage, the rapid temperature-increasing oxidation stage and the steady temperature-increasing oxidation stage. The initial slow oxidation stage was mainly characterized as the continuous endothermic process, while the rapid temperature-increasing oxidation stage was mainly characterized as the greater temperature-increasing rate than the programmed temperature-increasing rate, appearance of crossing point temperature as well as massive-heat relief. In the steady temperature-increasing oxidation stage, the heating rates were roughly consistent with set values and no significant energy was released.
The concentration and generation temperature of gases produced from oil shale in its temperature-programmed process were analyzed. Because oil shale contains a large amount of kerogens, we mainly studied gases produced by oxidation of C and H including CO, CH
4, C
2H
6, C
3H
8 and C
2H
4, and found the following results. The summary gas concentration stage is shown in
Table 1.
CO is the most important oxidation resultant of C in oil shale kerogens. Oxidation of C was mainly divided into three stages. At temperature higher than 140 °C, oil shale was in the slow oxidation stage, in which the air supply rate had no effect on the oxidation of C and CO production is limited. Above 140 °C, oil shale samples simultaneously underwent a rapid C oxidation stage and air supply rate had a significant impact on the production of CO. The higher the air supply rate, the faster the CO production rate and the sooner the rapid oxidation stage ended. However, the air supply rate was not completely positively correlated with CO production in oil shale samples. The oil shale sample gassed at an air supply rate of 50 mL/min produced the largest amount of CO. After entering the final low-temperature oxidation stage, all oil shale samples produced CO at roughly the same rate. Meanwhile, the temperature-increasing rate of oil shale samples was independent of temperature, and the CO generation rates for these three samples were approximately the same.
Alkane and alkene gases are the major products of H oxidation in kerogens of oil shale. Therefore, we analyzed the production of CH
4, C
2H
6, C
3H
8 and C
2H
4 from oil shale samples and found that, similar to coal’s temperature-programmed increase, oil shale did not produce these gases at temperature lower than 100 °C. At temperatures of 100–140 °C, three samples were in the stable stage and slowly produced these gases. At 140 °C, all oil shale samples simultaneously stepped into the rapid growth stage, independent of the air supply rate. Tang placed oil shale samples at different constant temperature environments and found that, at 150 °C, the concentrations of C
2H
4 and CH
4 produced from oil shale were significantly higher than those produced at 125, 100, 80 and 60 °C, consistent with our current findings [
28]. Therefore, 140 °C is a critical temperature in the low temperature oxidation of oil shale. Above 140 °C, oil shale samples rapidly produced various alkane and alkene gases, with a characteristic that the higher the air supply rate, the faster the alkene gases-producing rate. The rapid growth stage of different gases produced from oil shale samples at different air supply rates ended at different time points. Interestingly, after the rapid growth stage, the concentrations of various alkene and alkene gases began to decrease, which was absent in the low-temperature oxidation process of coal. The largest gas concentration reduction dropped by up to 24.20% and then all gas concentrations increased again into a slow growth stage, which had a lower increasing rate than the rapid growth stage.
To further investigate the mechanism of alkene gases concentration reduction in oil shale oxidation, we analyzed kerogens group reaction in oil shale compared to coal. When coal samples encounter with oxygen, oxygen is physically adsorbed, releasing a small amount of heat and thereby raise the temperature. Meanwhile, chemical adsorption of oxygen leads to interaction of oxygen with the most active groups. In these oxidation reaction processes, these active structures will breakup and release free radicals, such as –CH
2– and C–O. These free radicals will simultaneously react with two types. The first type is producing gases including H
2, CH
4, C
2H
4, C
2H
2, C
3H
8, while the other type with oxygen is producing oxygen-containing gases, such as CO and CO
2. At this time, a portion of oxygen atoms still react with the structures in coal rock, forming new and more oxygen-containing groups. Tang et al. analyzed the infrared spectra of both oil shale and coal samples and found that both of them have same chemical bond structures, revealing that the organic components of oil shale can also be oxidized at room temperature [
28]. However, different from the coals, the contents of –CH
2– and C–O in oil shale samples will decrease after an increase stage with temperature increasing. The temperature-programmed experimental results showed that, at temperature above 140 °C, the concentrations of CH
4, C
2H
6, C
3H
8 and C
2H
4 increased rapidly. It was found that the gas rapid growth stage is caused by the sufficient contents of –CH
2– and C–O, and the temperature of 140 °C is the critical triggering temperature for group reactions. Afterwards, the concentration of alkene gases decreased due to decrease of group concentration at the reduction stage. Because the coal sample tank was filled with air, the oil shale samples in the tank were oxidized and produced enough –CH
2– and CO. Therefore, even if the CO concentration decreases, sufficient O
2 and high temperature will oxidize more C to produce CO, resulting in CO concentration increasing.


