Concept Research of a Countermeasure Device for Preventing Scour around the Monopile Foundations of Offshore Wind Turbines


Abstract
:1. Introduction
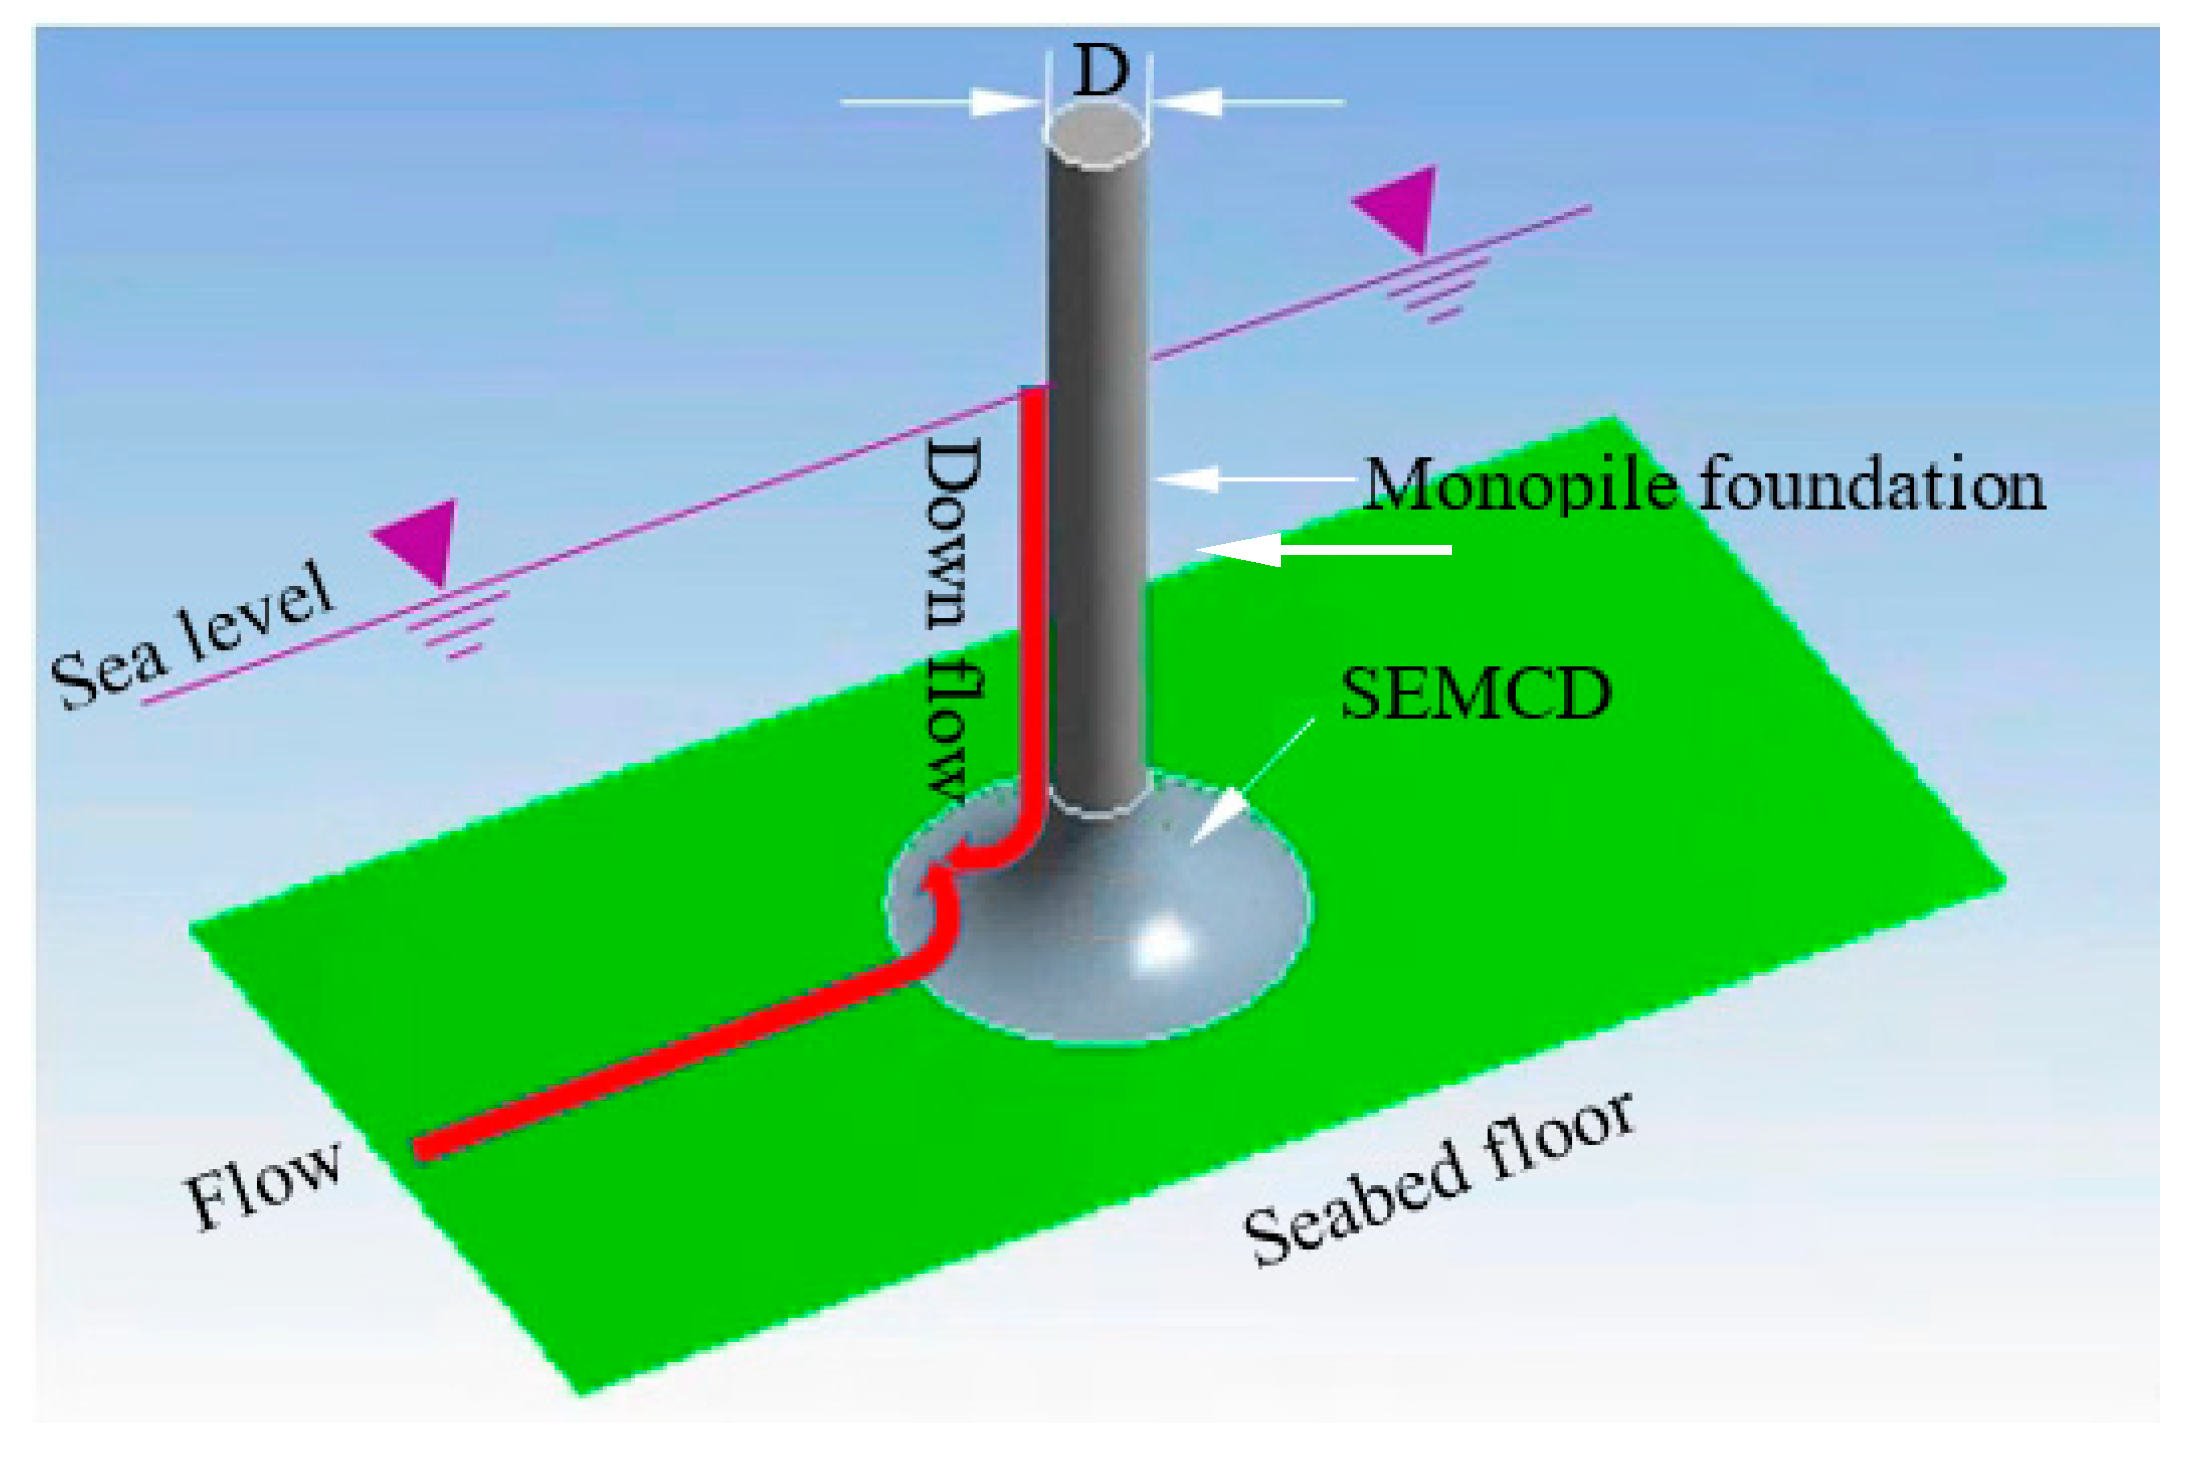
2. Concept Design of the SEMCD
- Altering the streamlines of the current flow around the monopile foundation and guiding them to consume energy by each other (e.g., the energy of down-flow is consumed by up-flow, and vice versa), thus reduce the energy of horseshoes vortices;
- Breaking up the vortices via the specifically designed curve profiles of the SEMCD.
3. Site Description
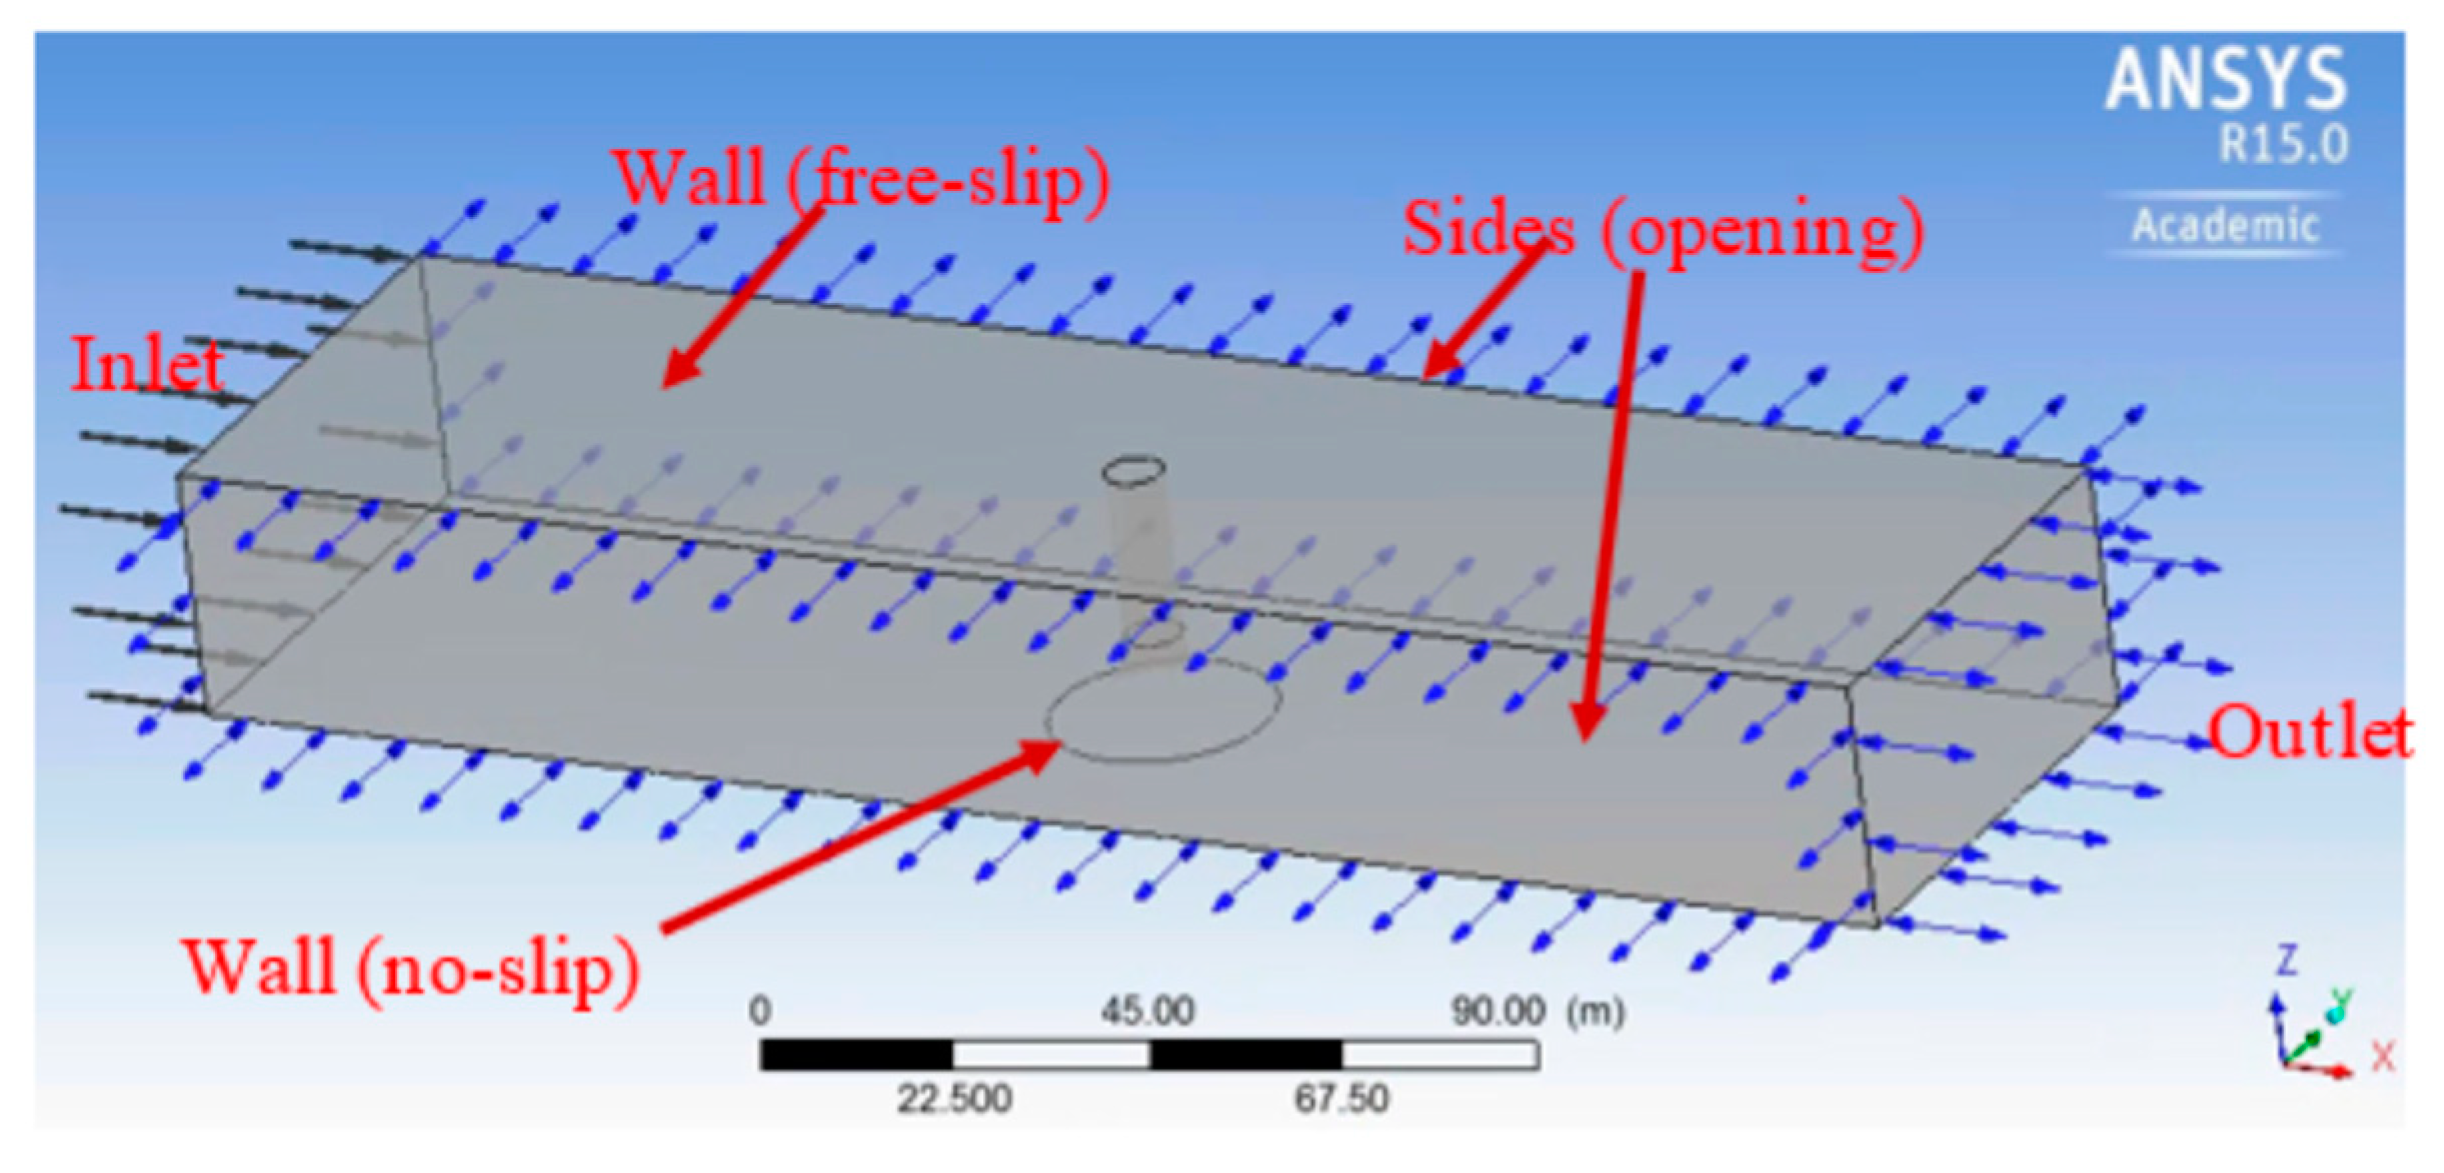
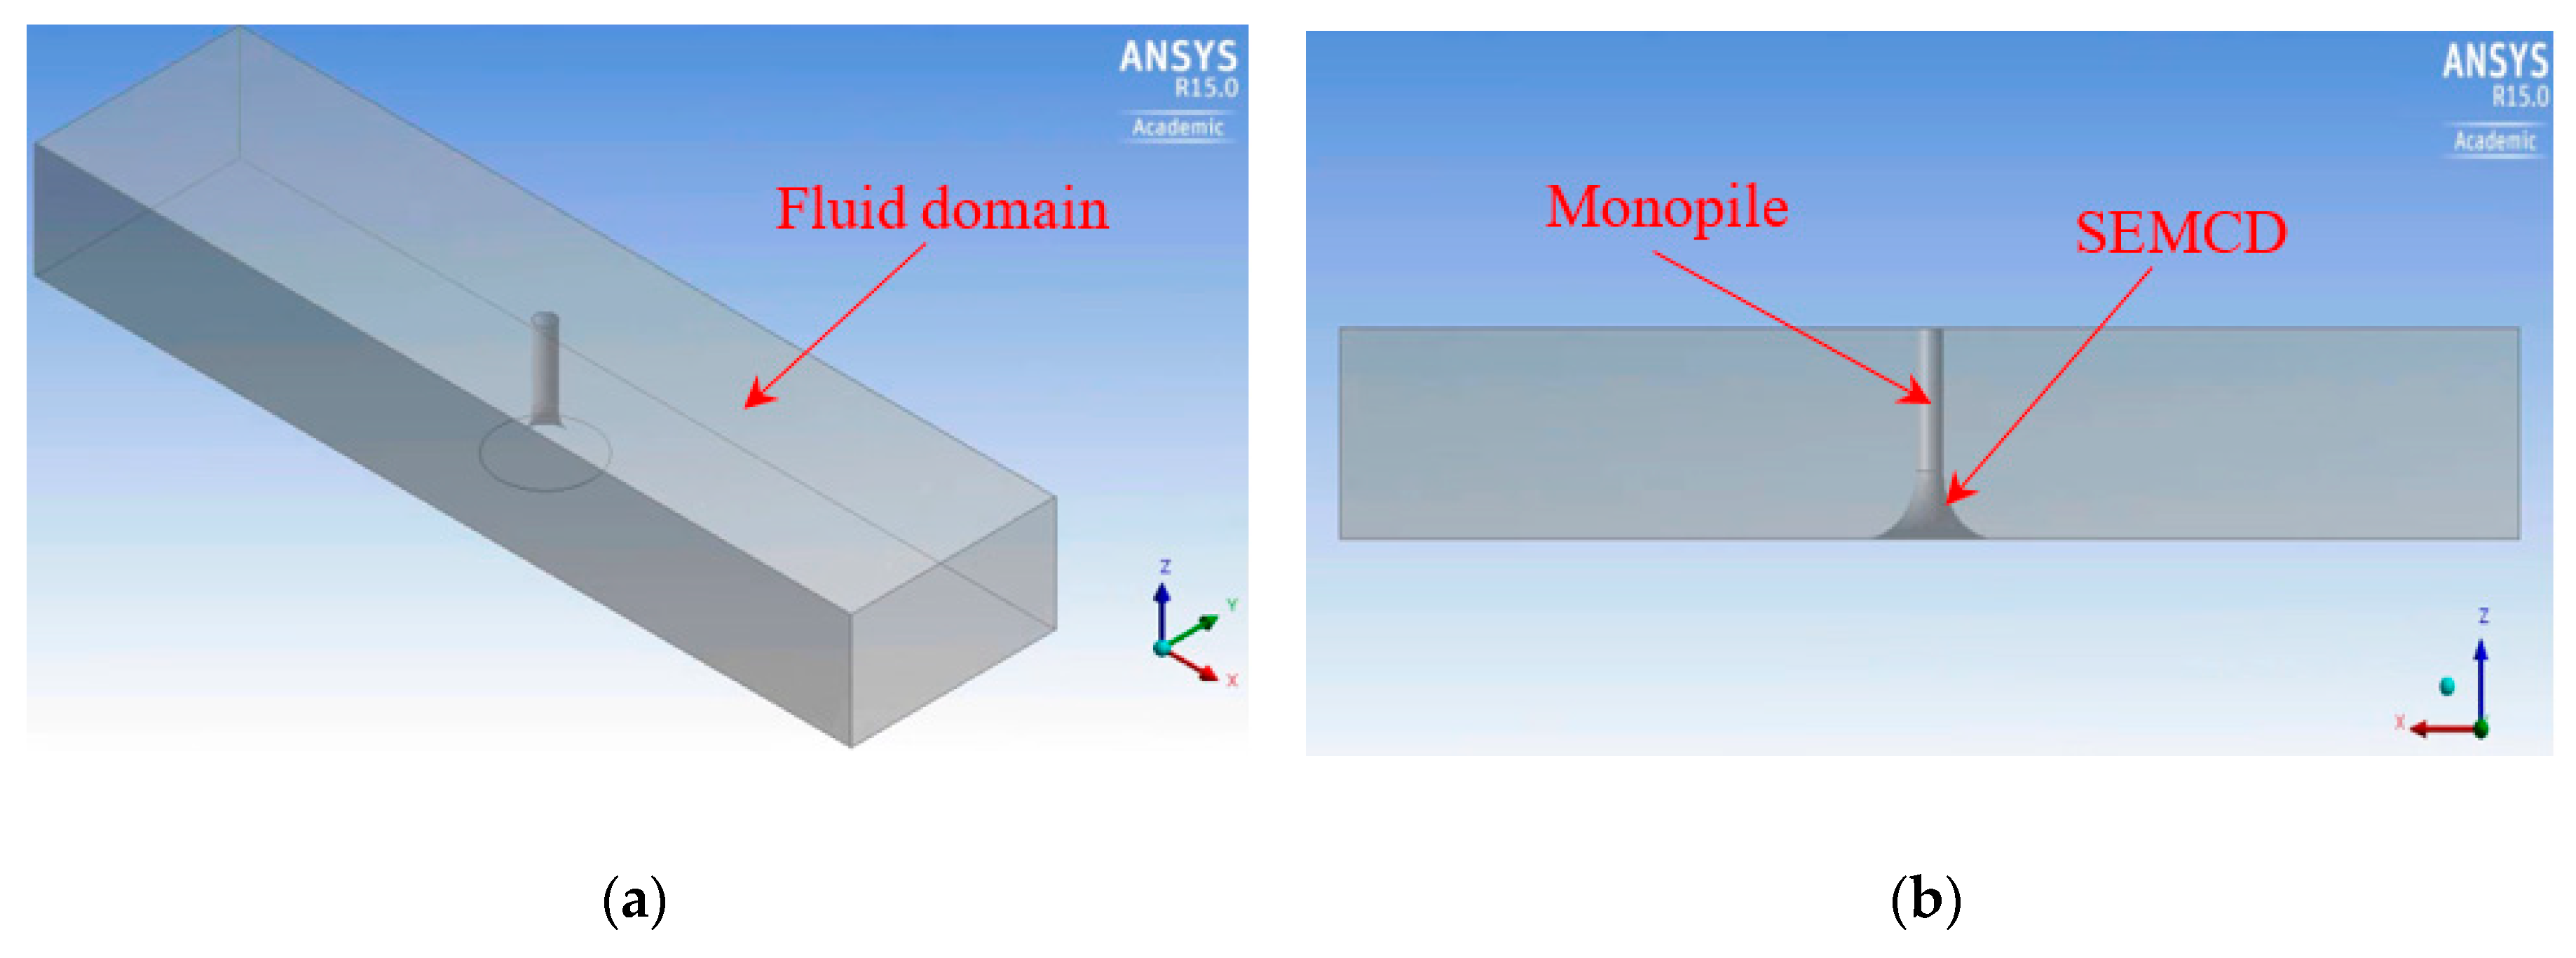
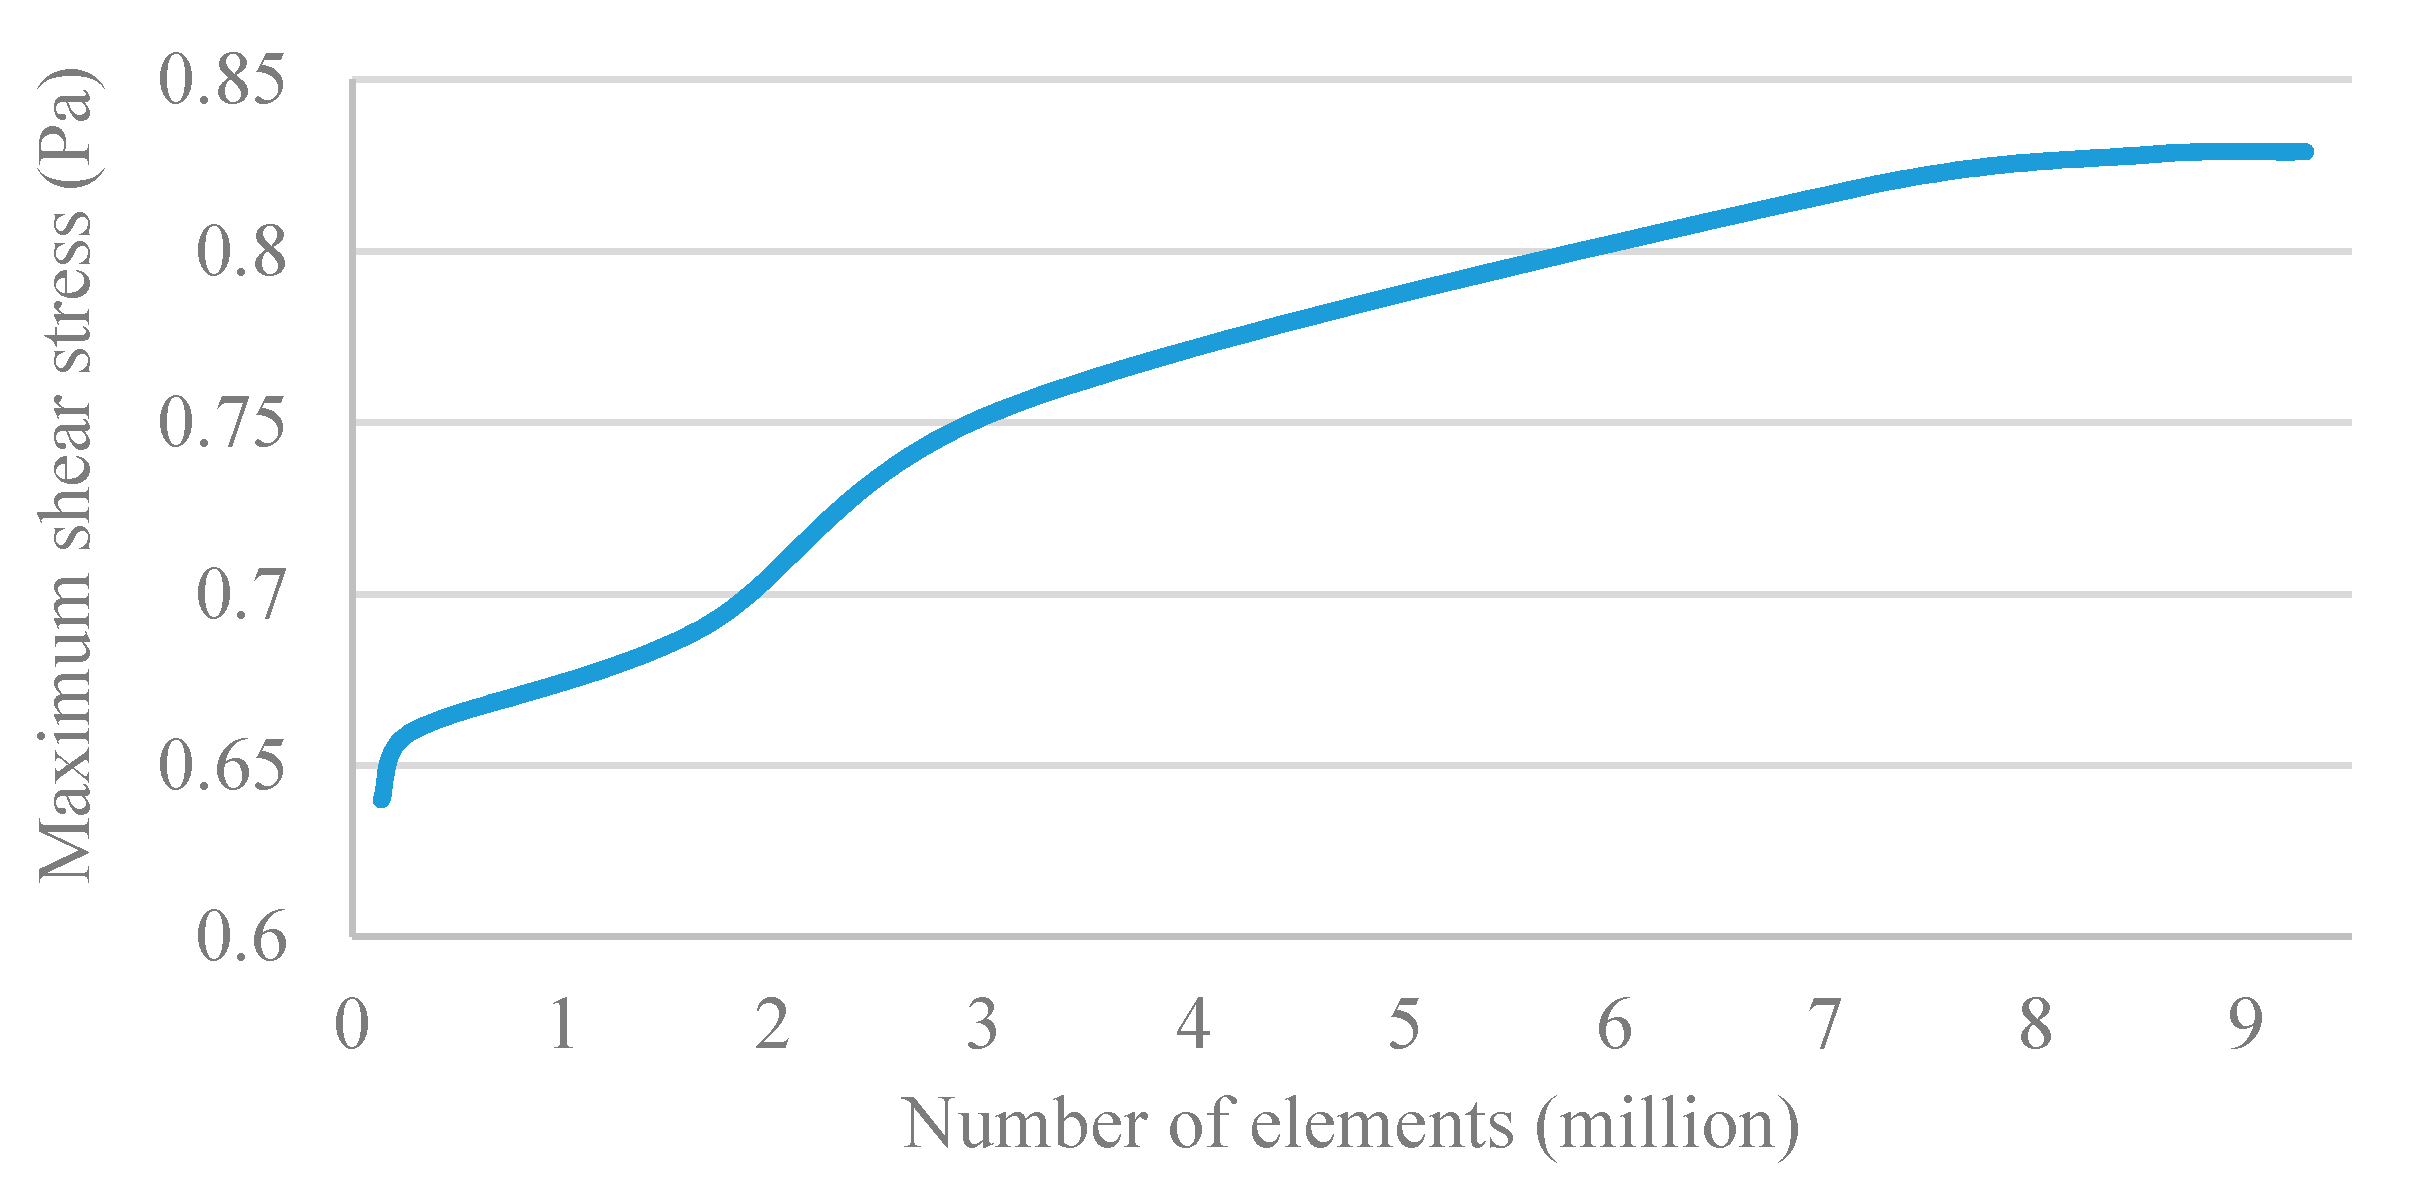
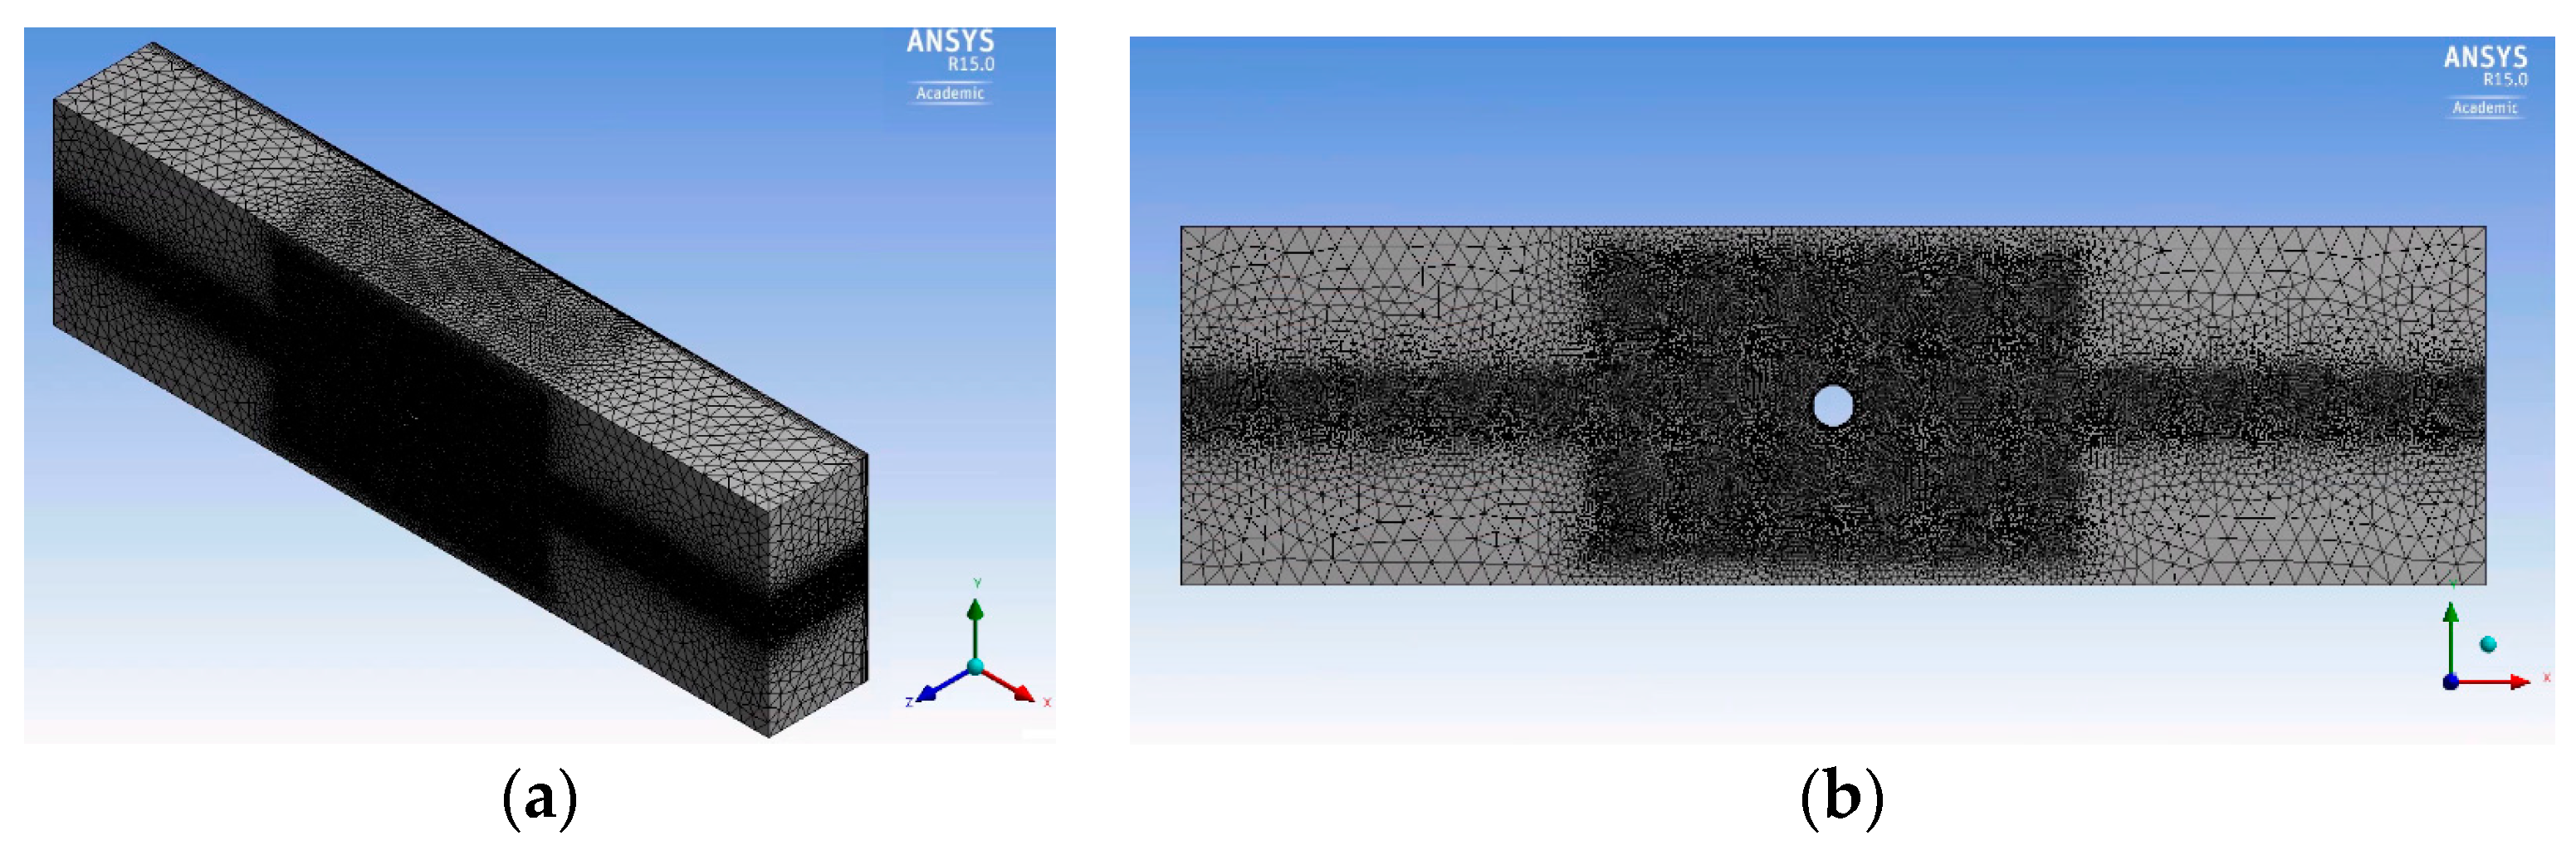
4. Numerical Model for SME Analysis
5. Simulation Results and Discussions
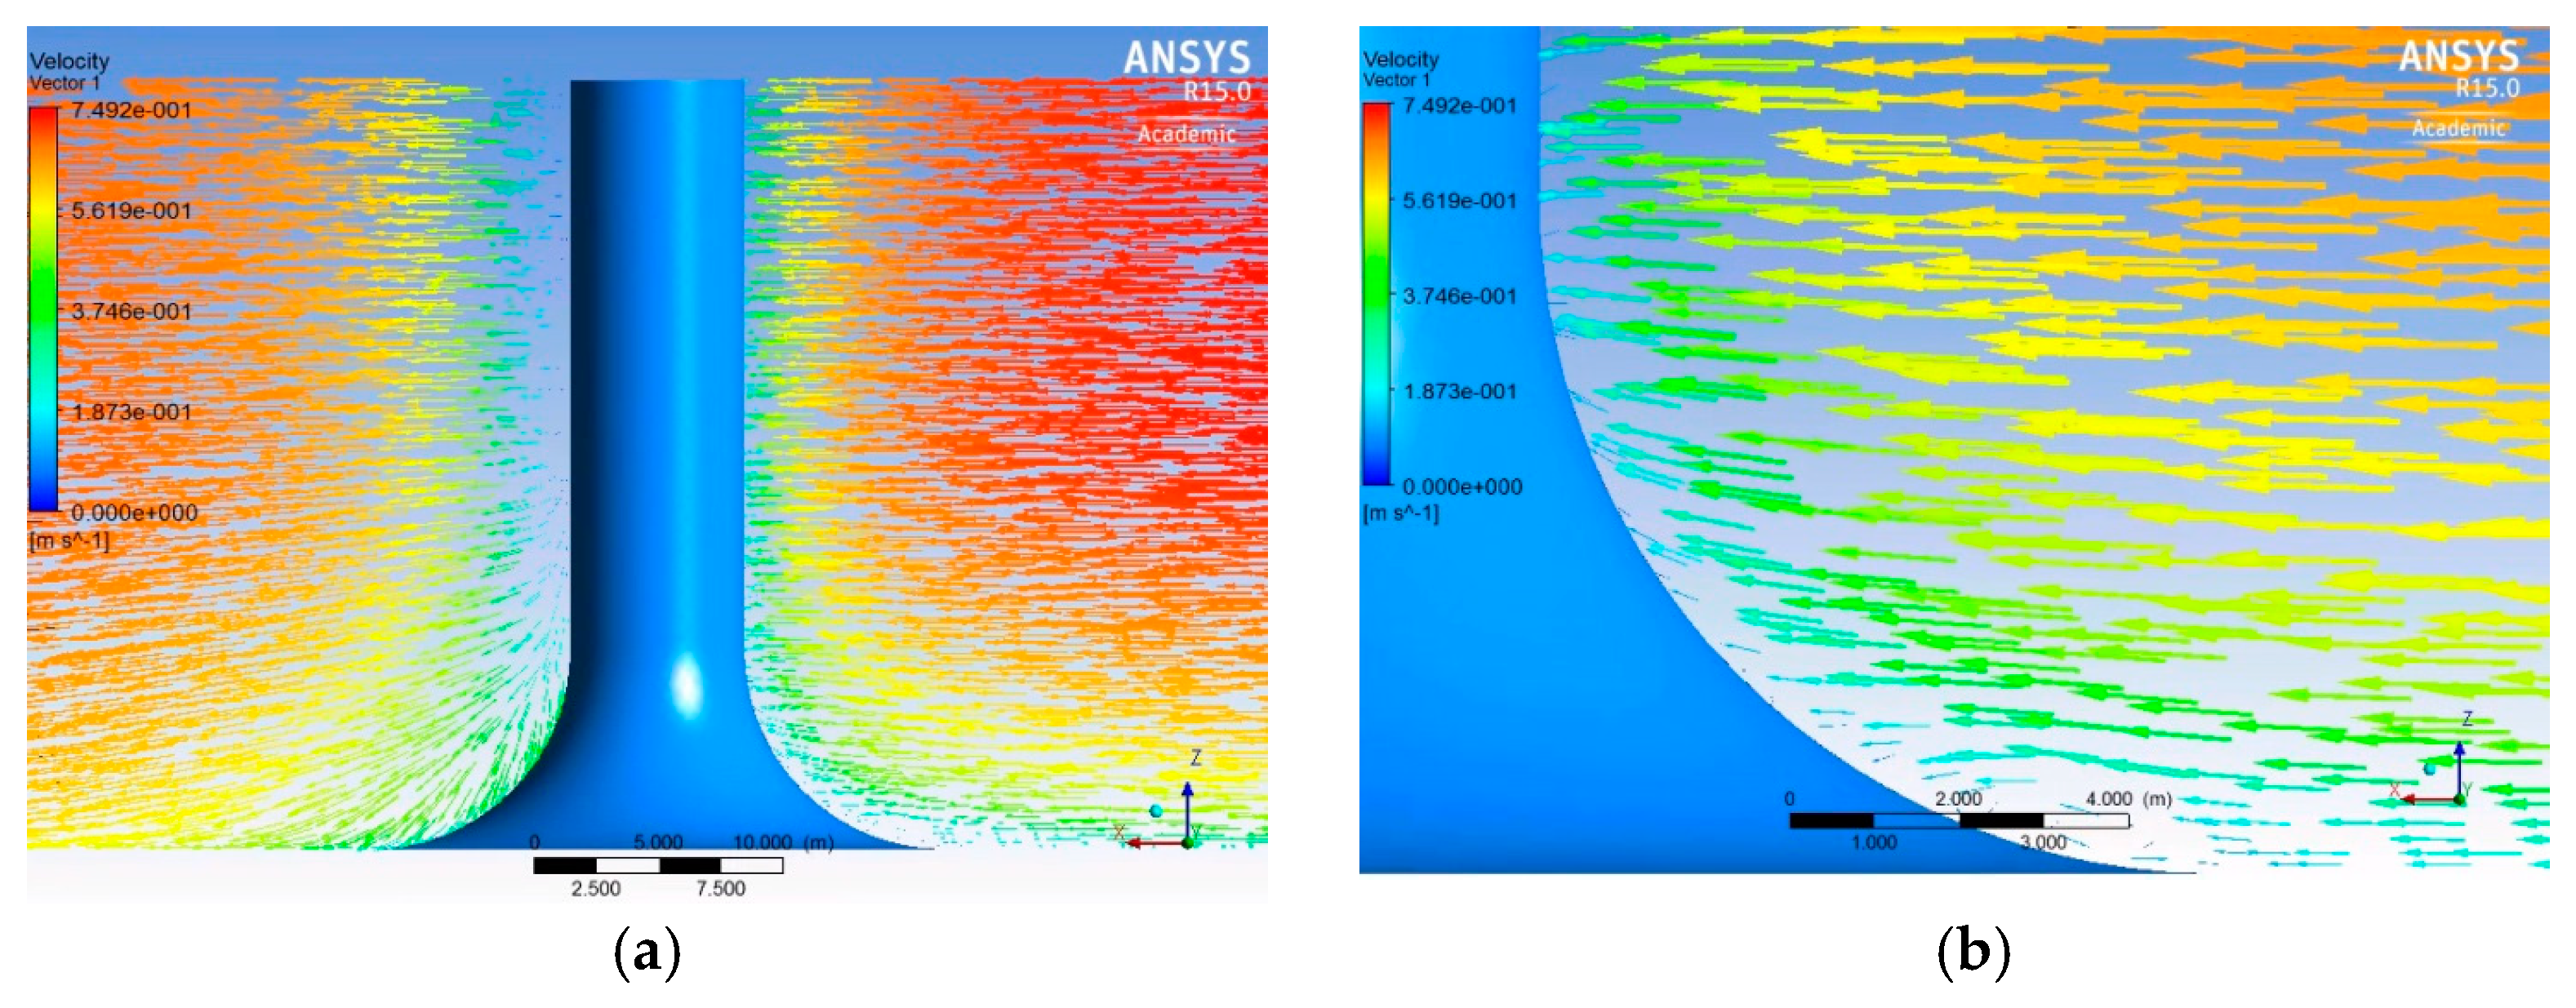
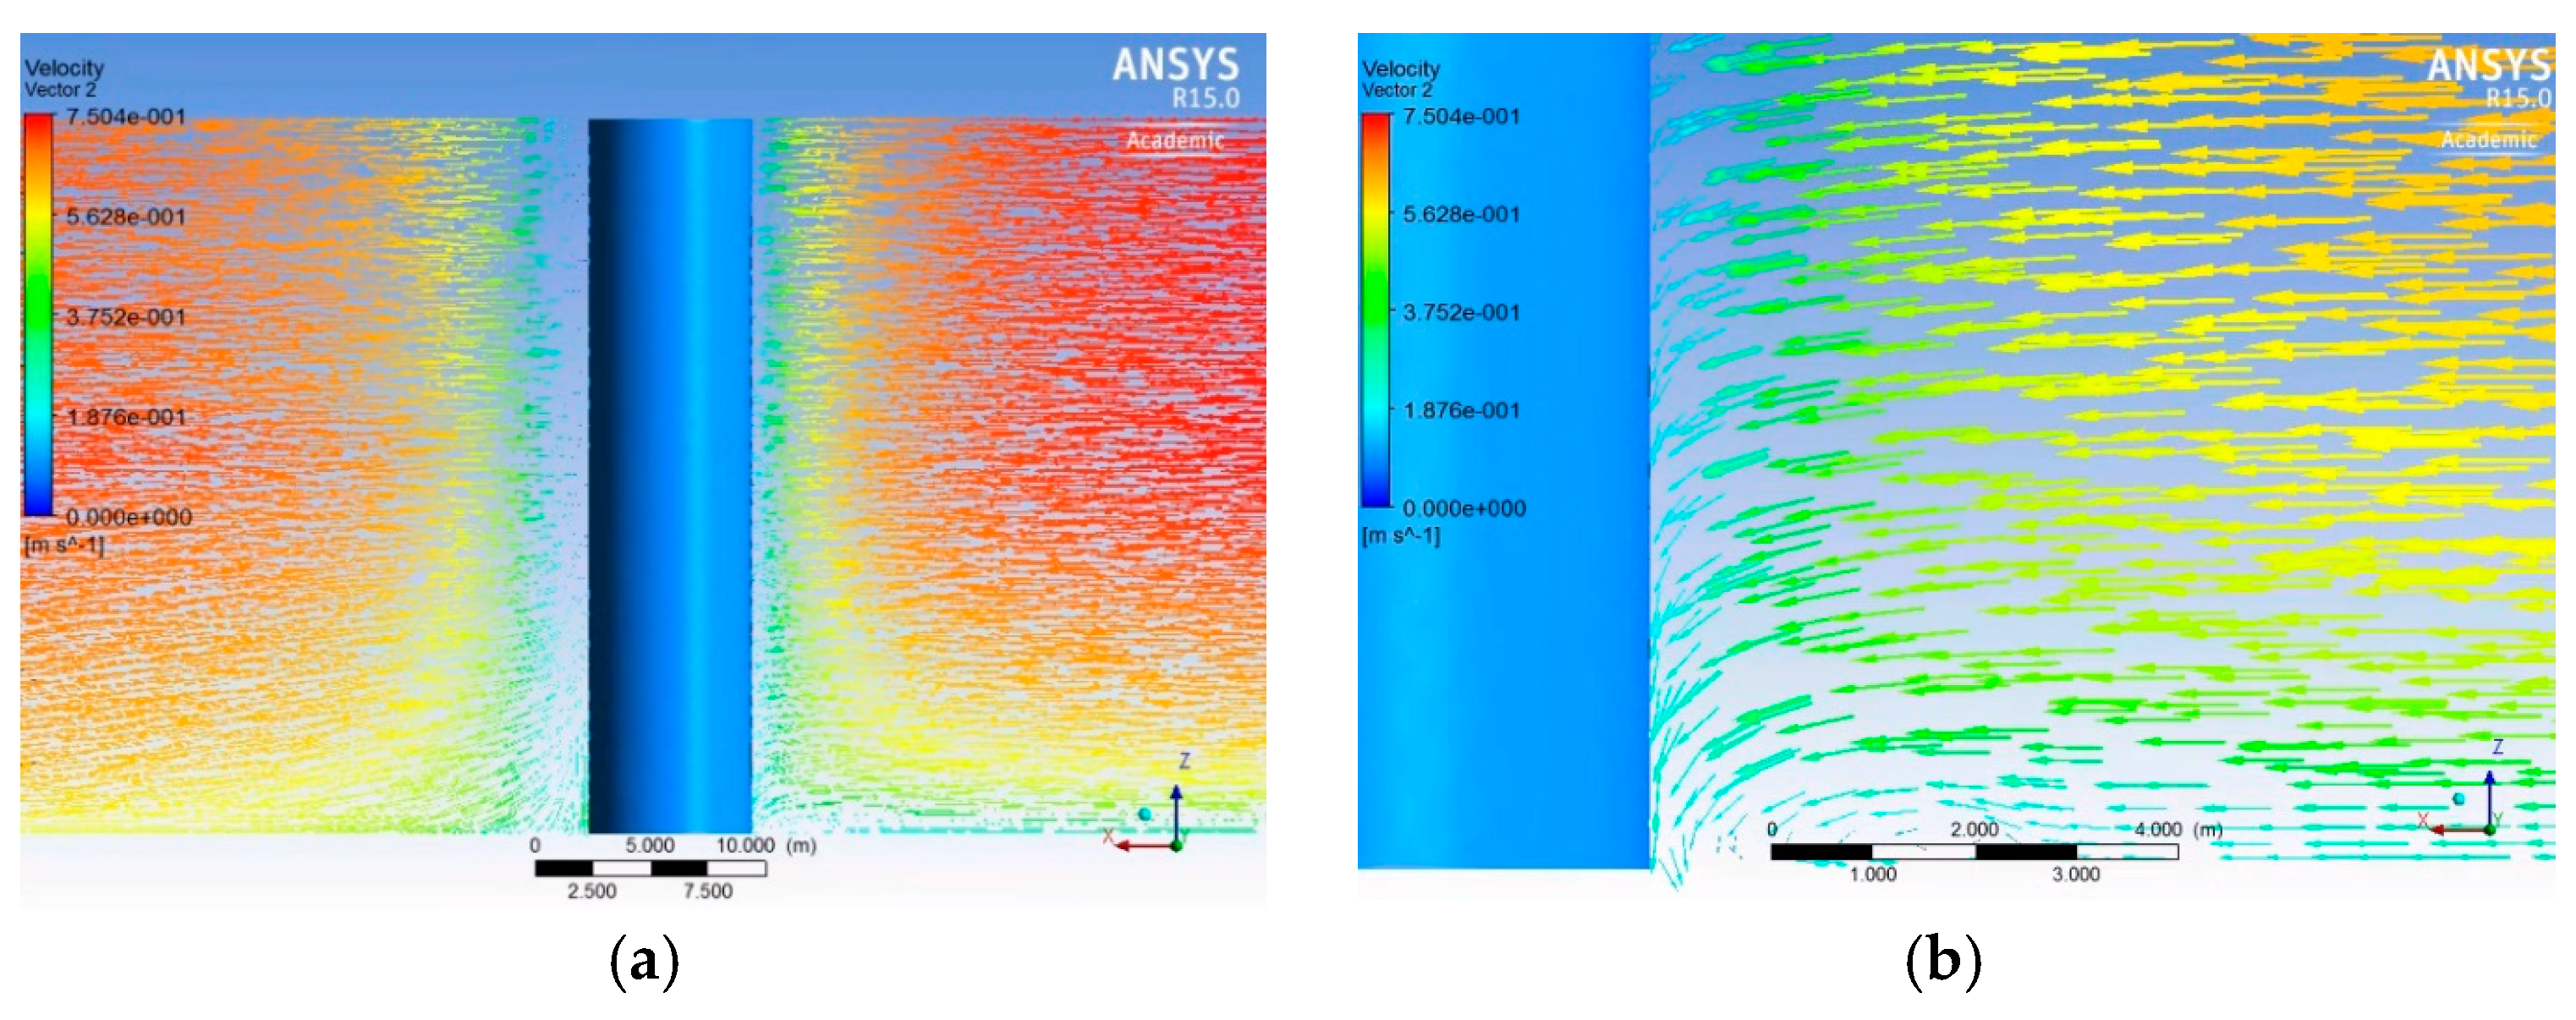
5.1. Operation Mechanism of the SEMCD
- (1)
- down/up-flows in front of the monopile;
- (2)
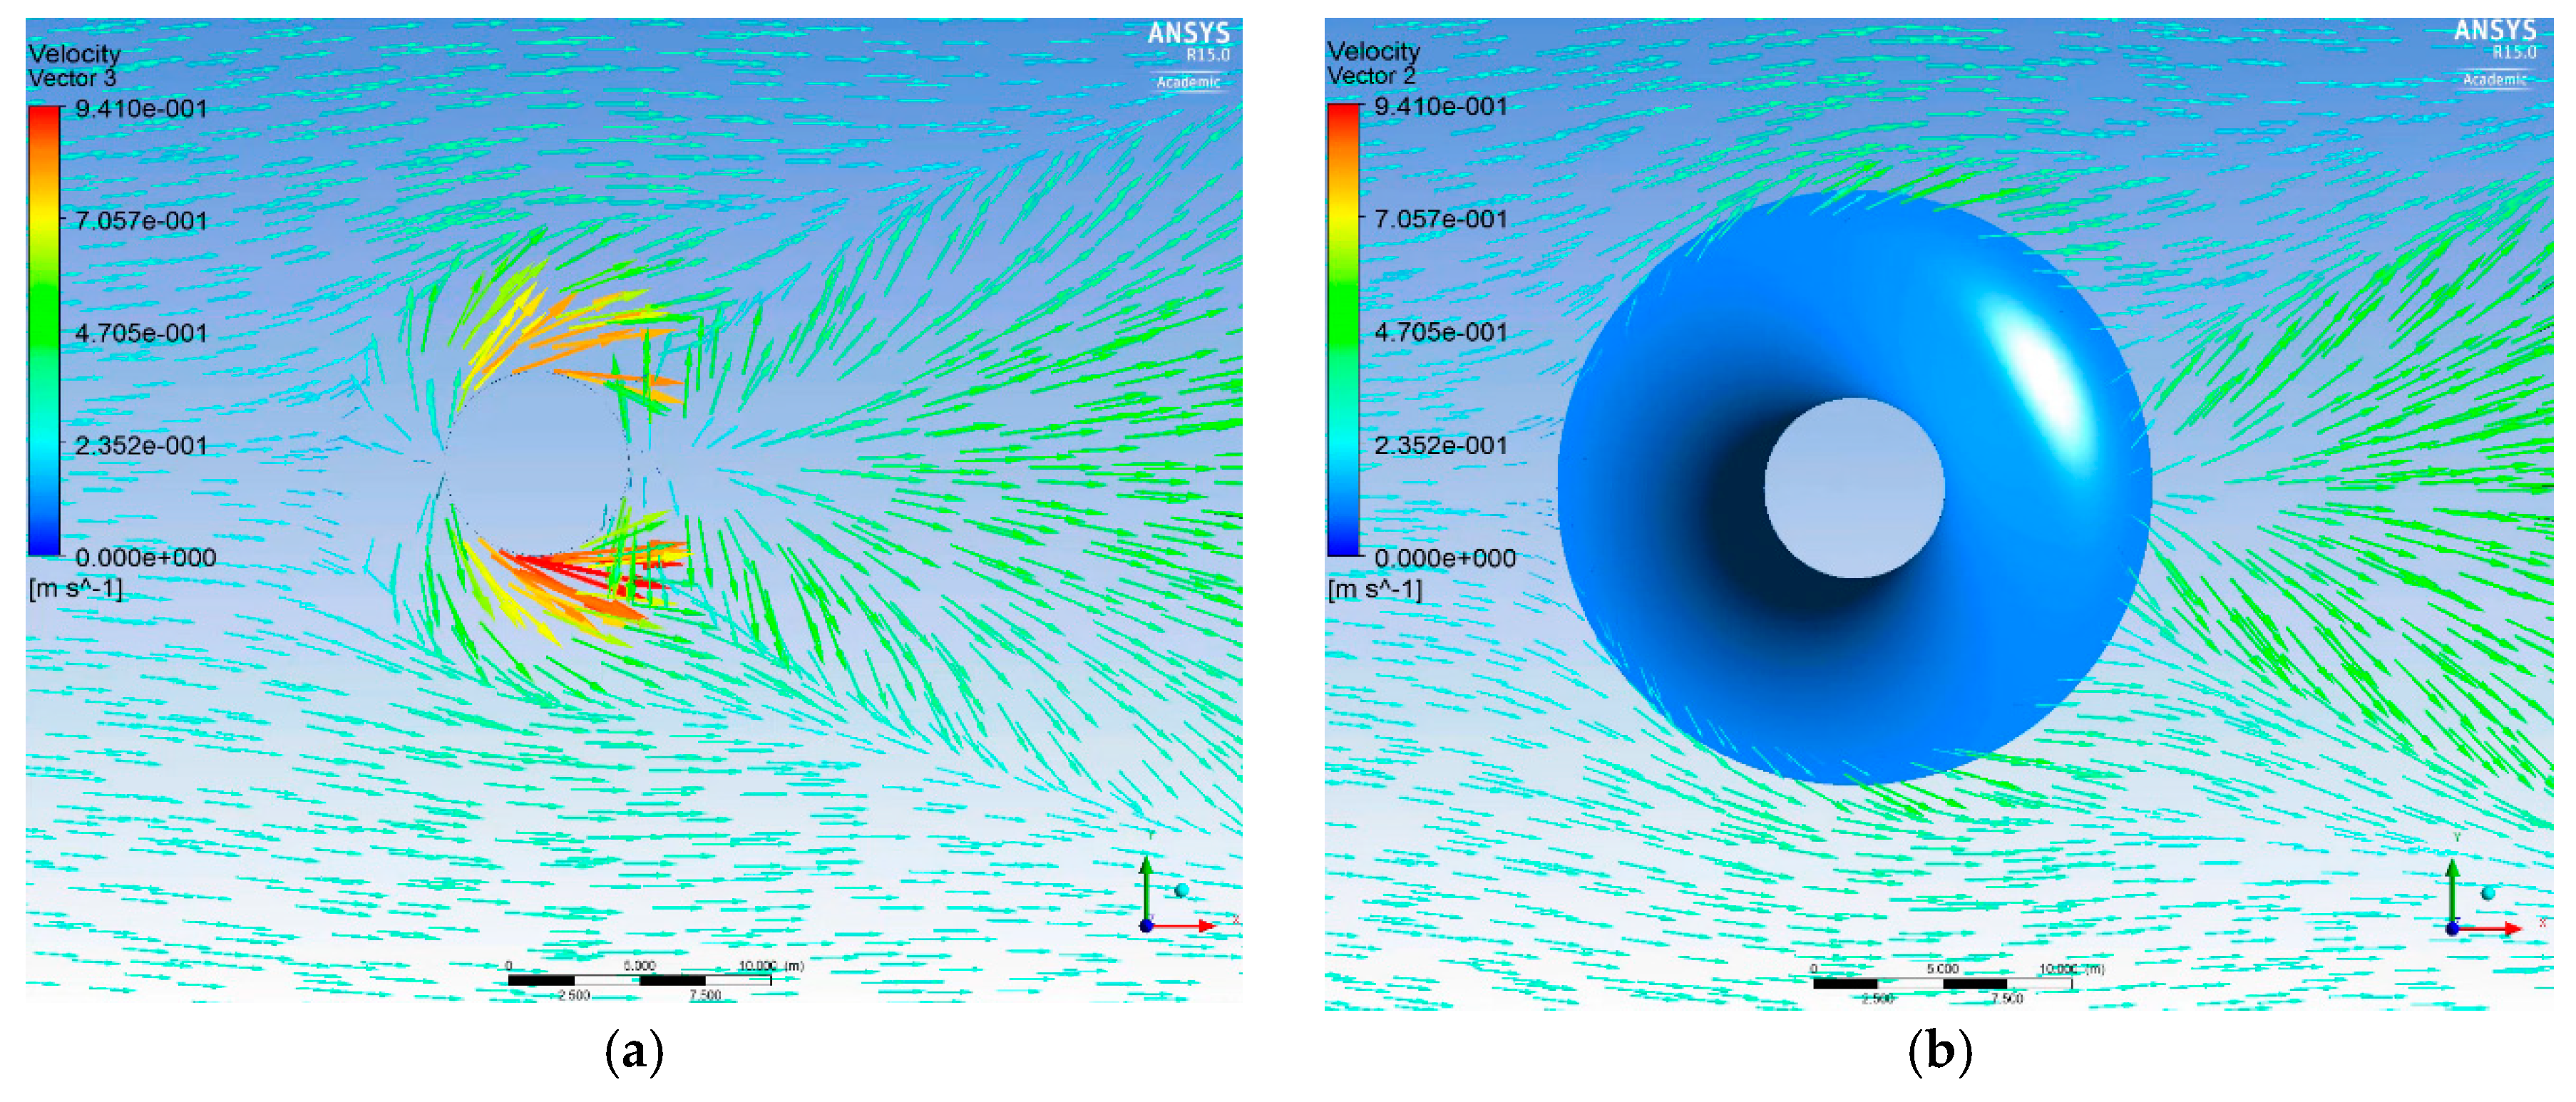
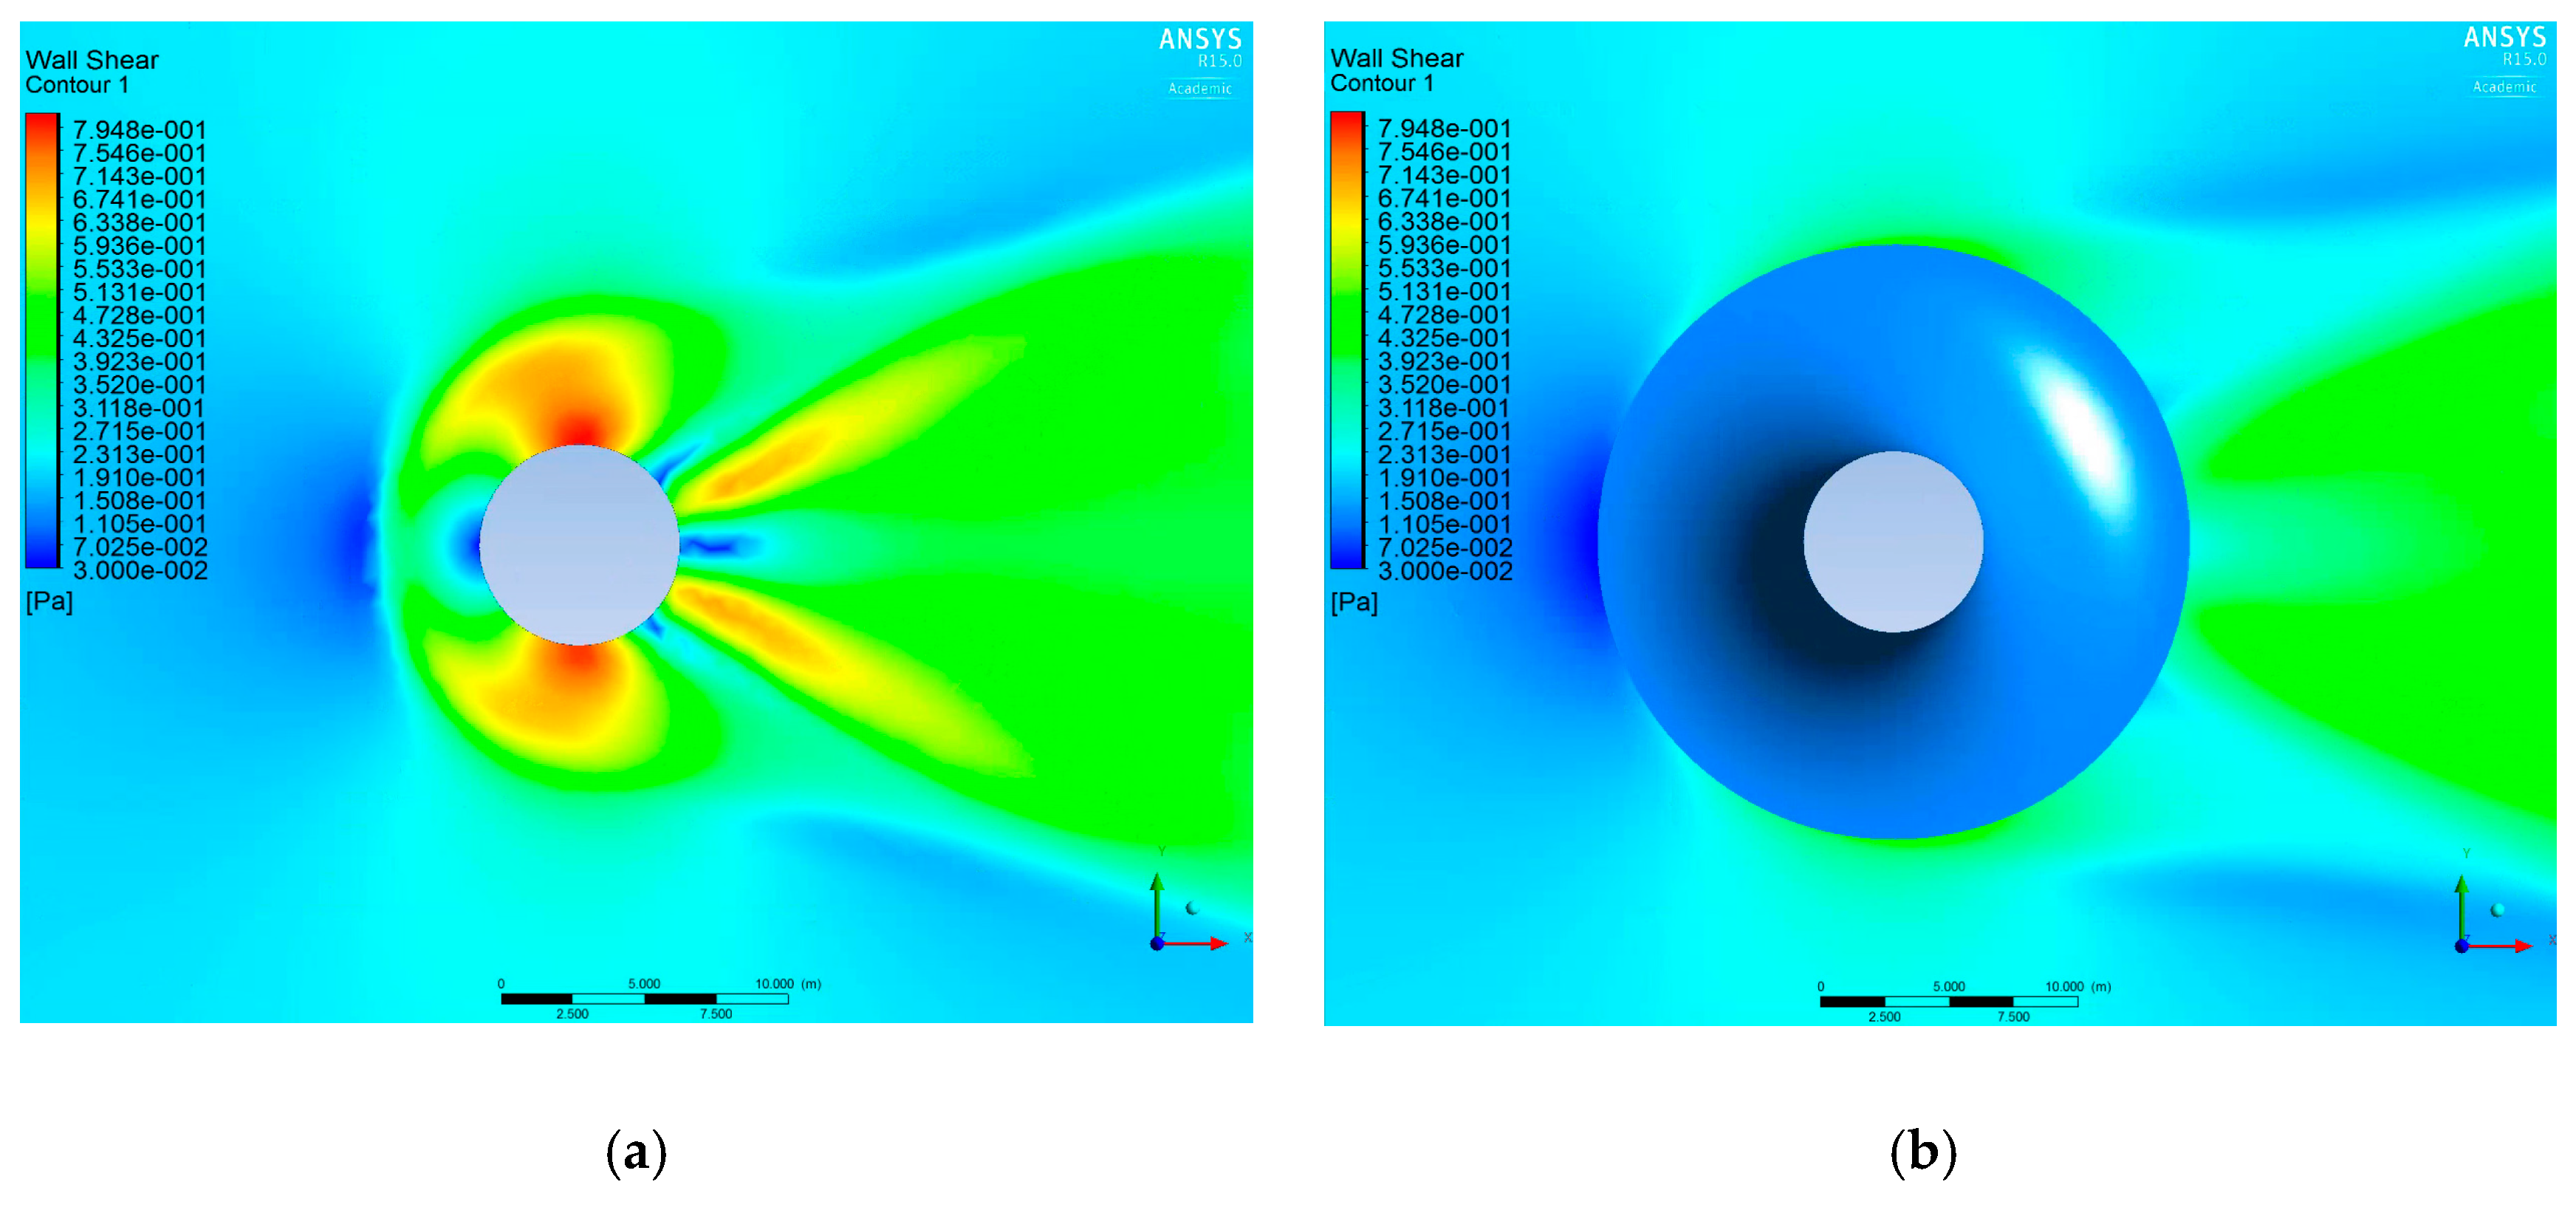
- horseshoe vortices at both sides of the monopile; and
- (3)
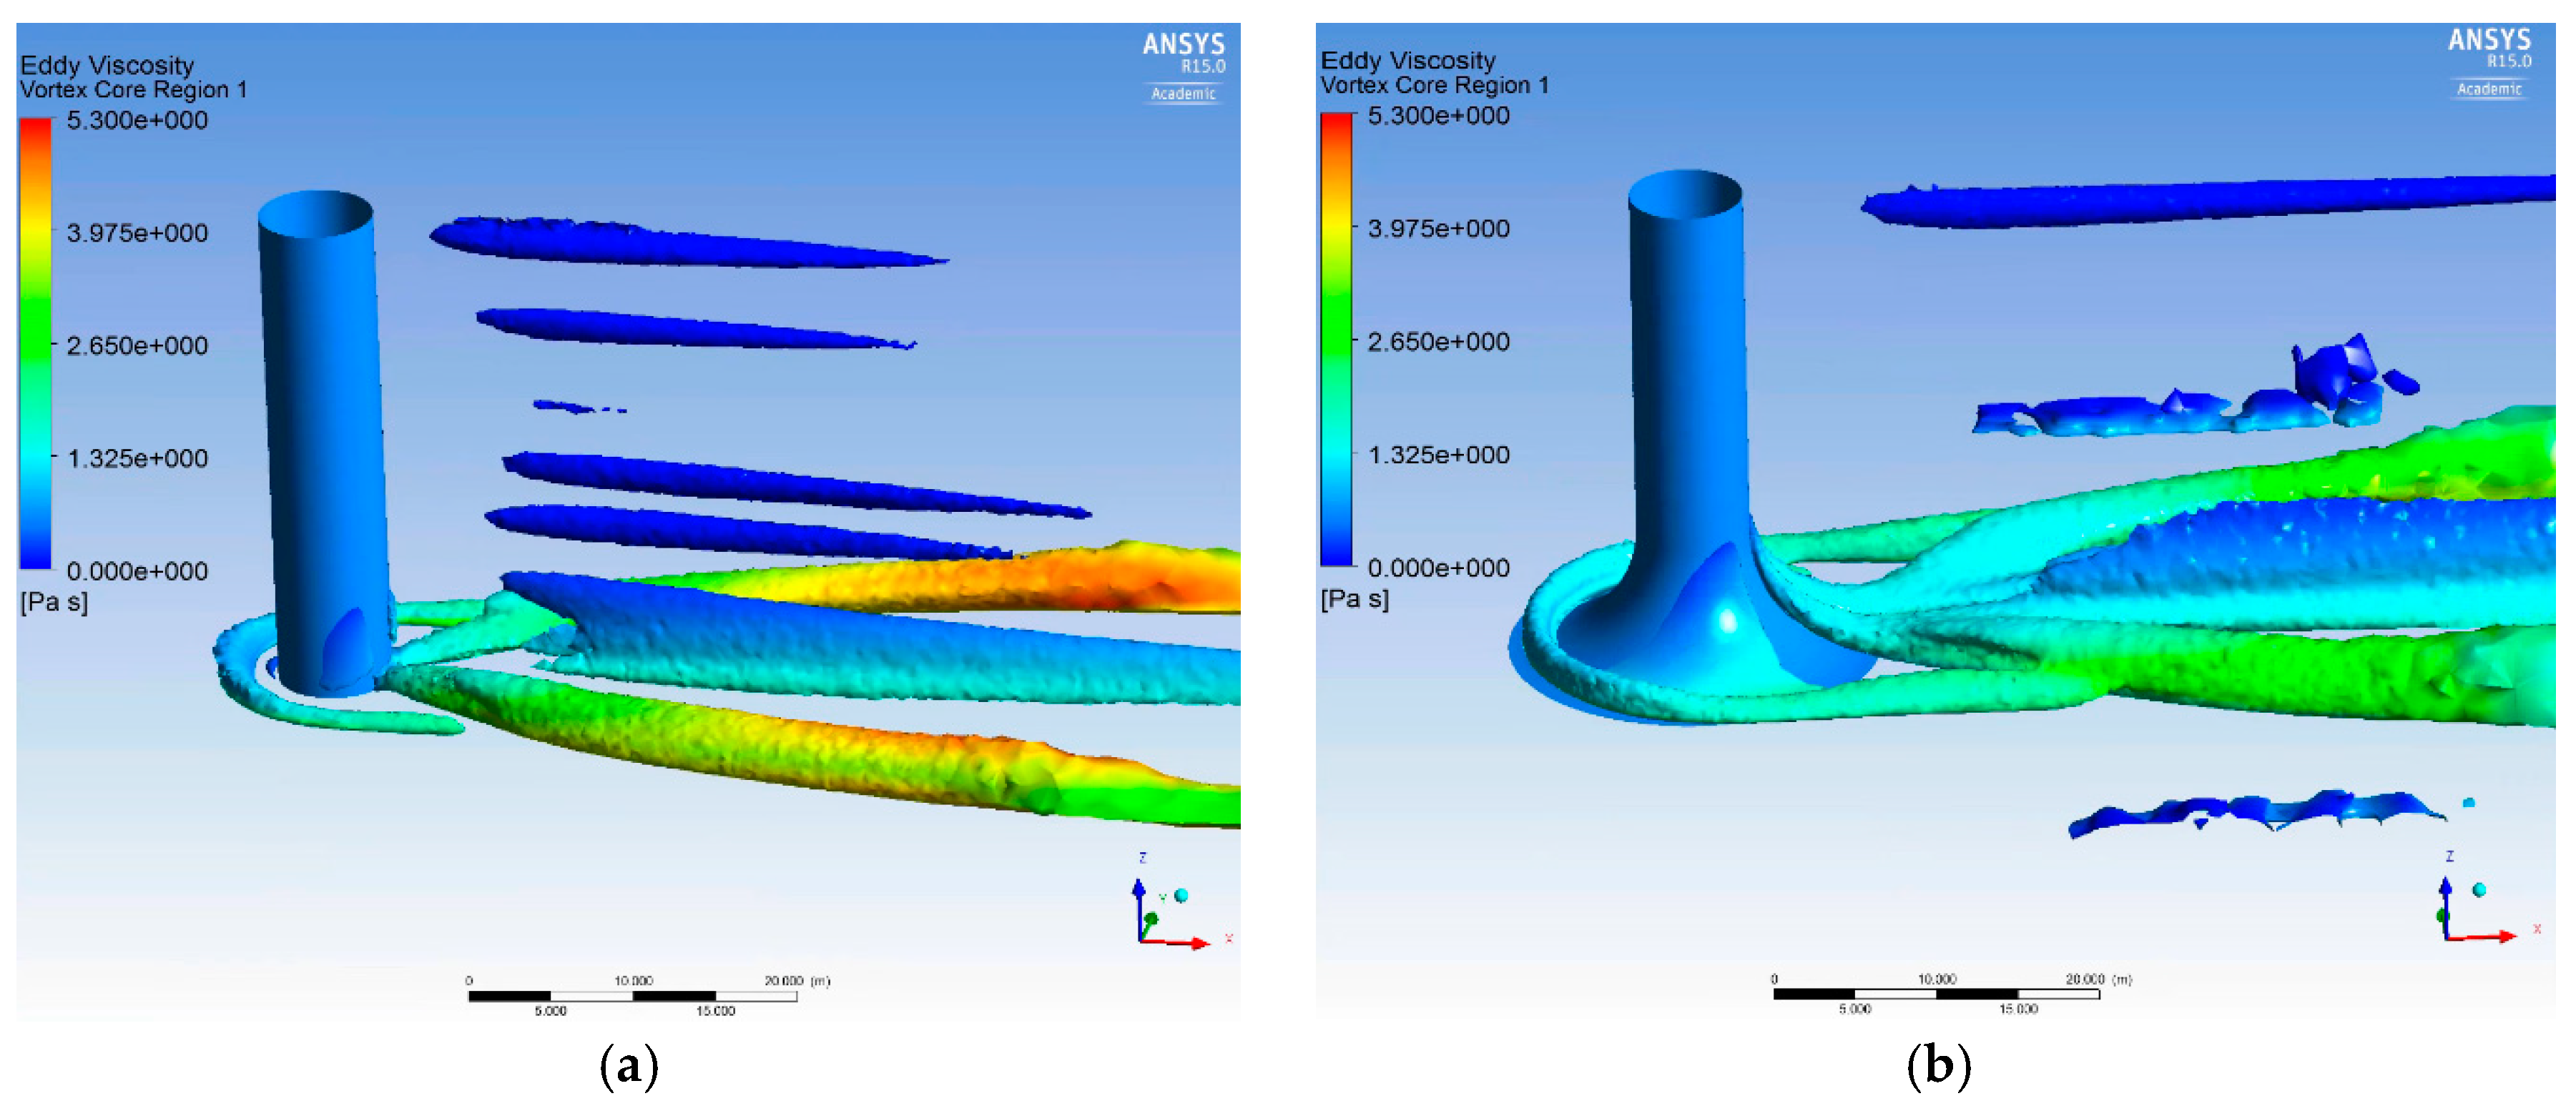
- vortices in wake region behind the monopile.
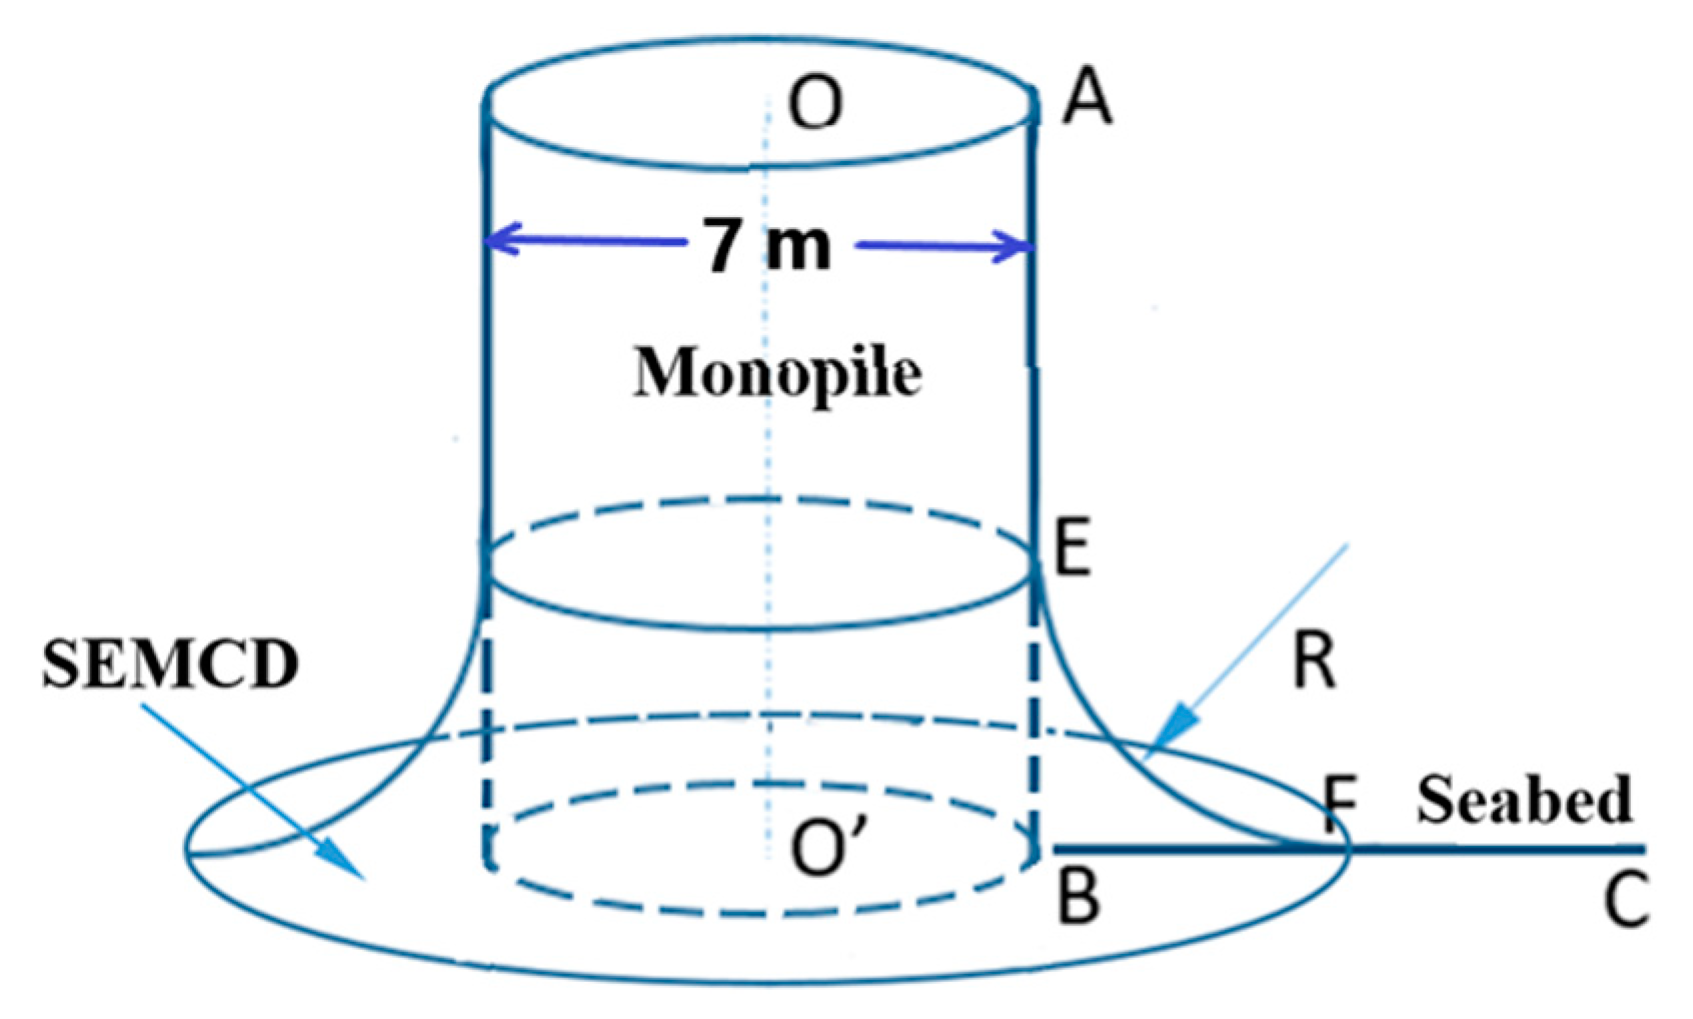
5.2. Optimal Size of the SEMCD
6. Conclusions
- As opposed to the existing scour mitigation measures, the proposed SEMCD is easy to install, replace and decommission. Therefore, it is more ideal for site use;
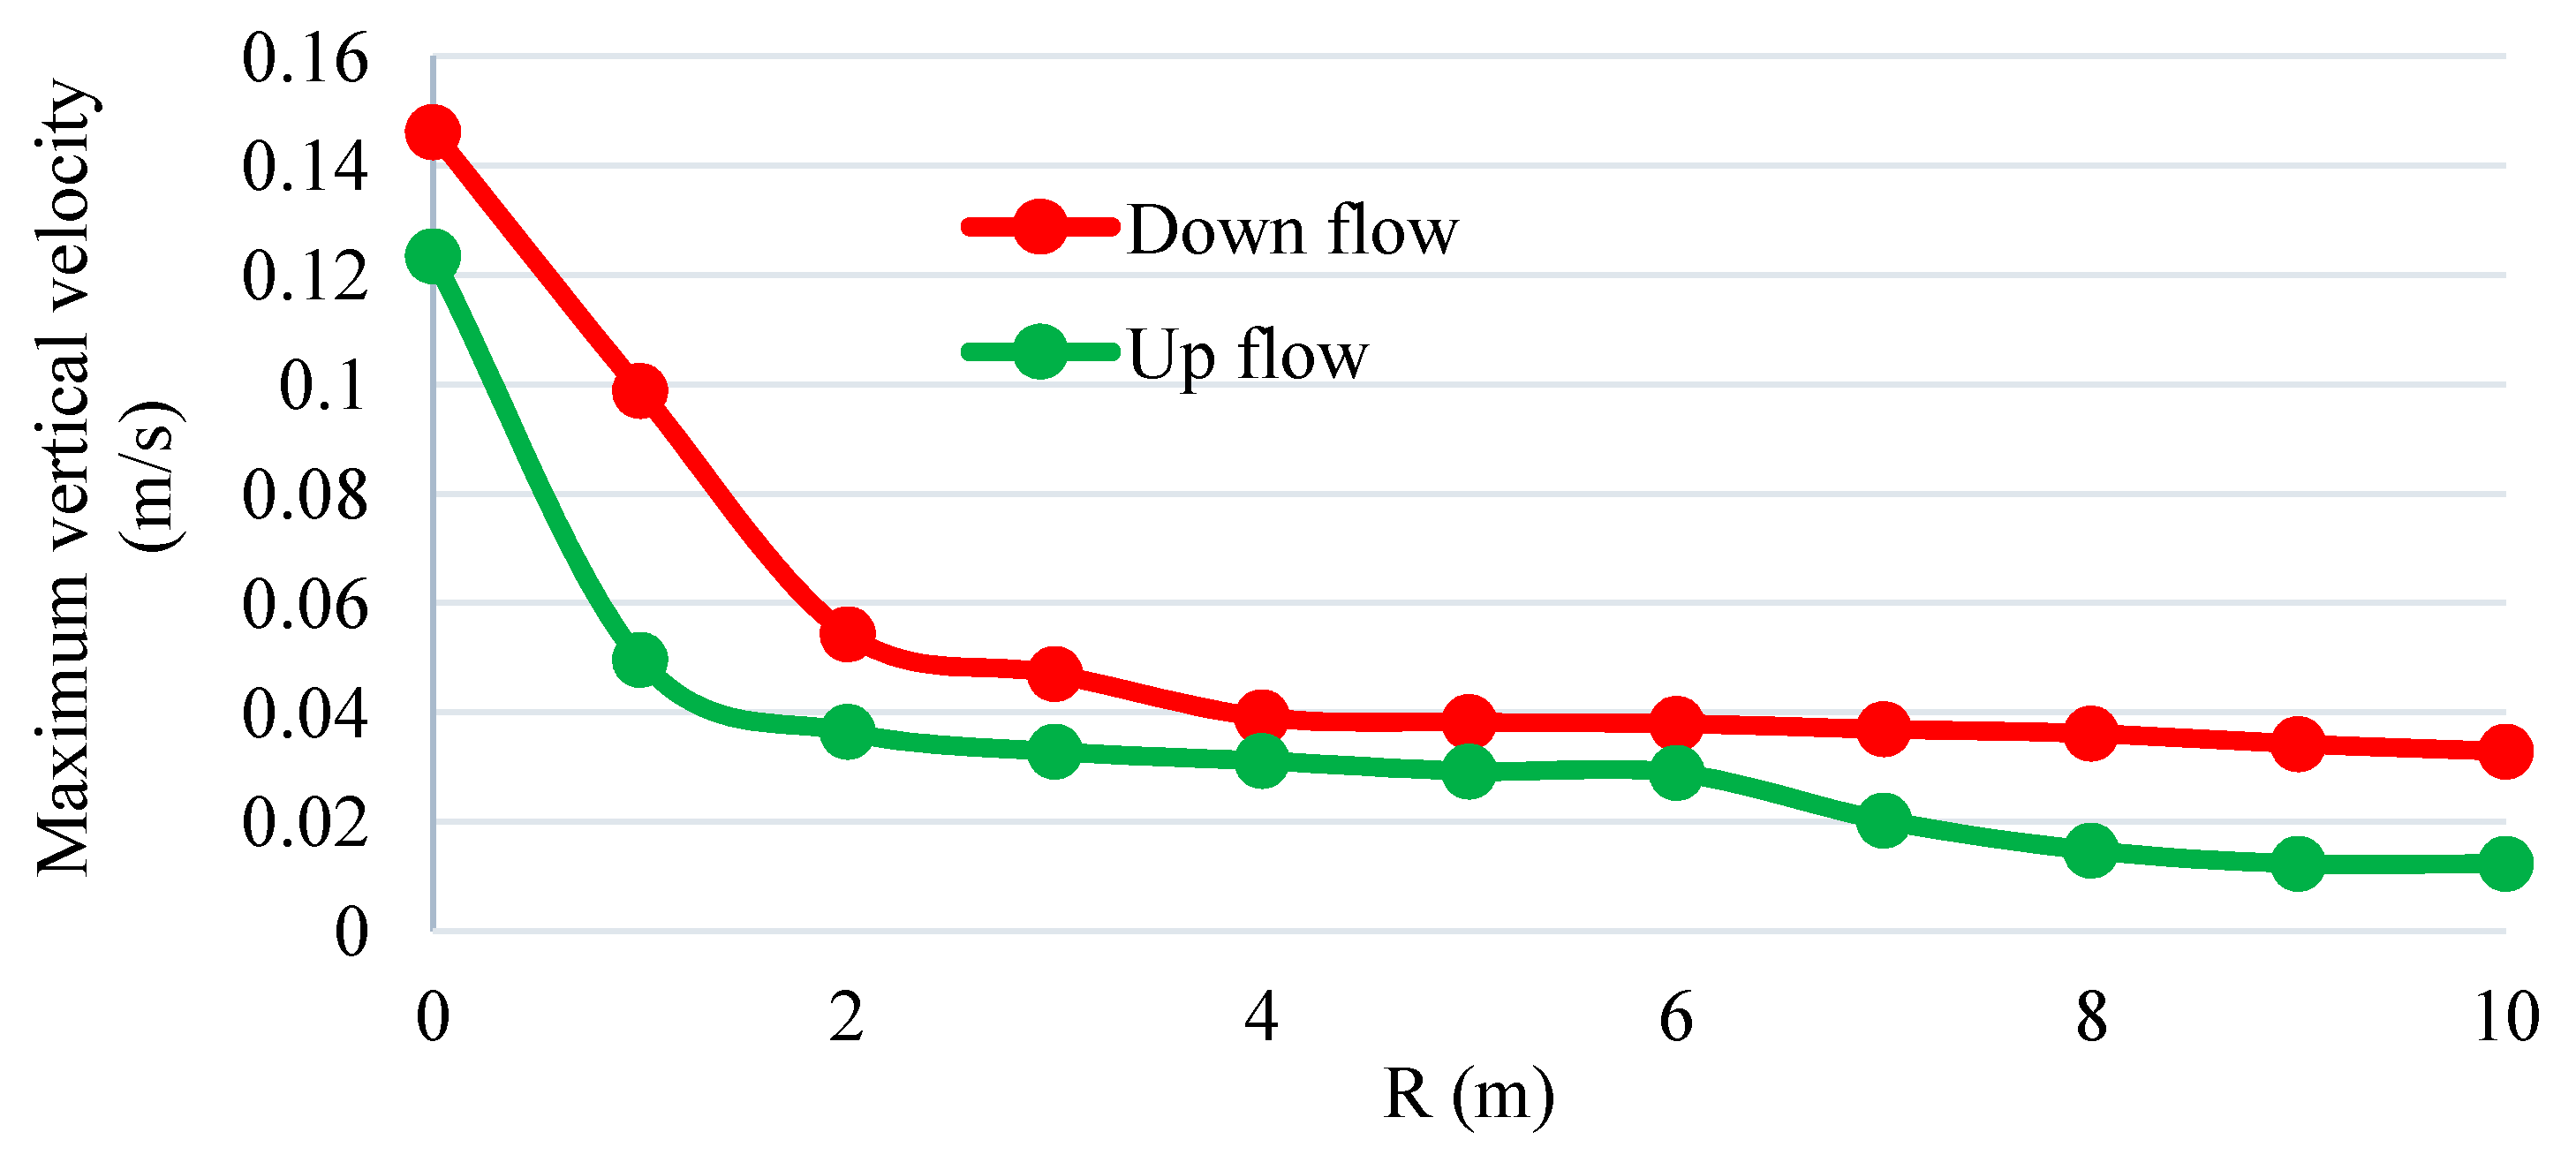
- The SEMCD is effective in cancelling up- and down-flows, as well as horseshoes vortices around monopile foundations, which are the main drivers of the scouring process;
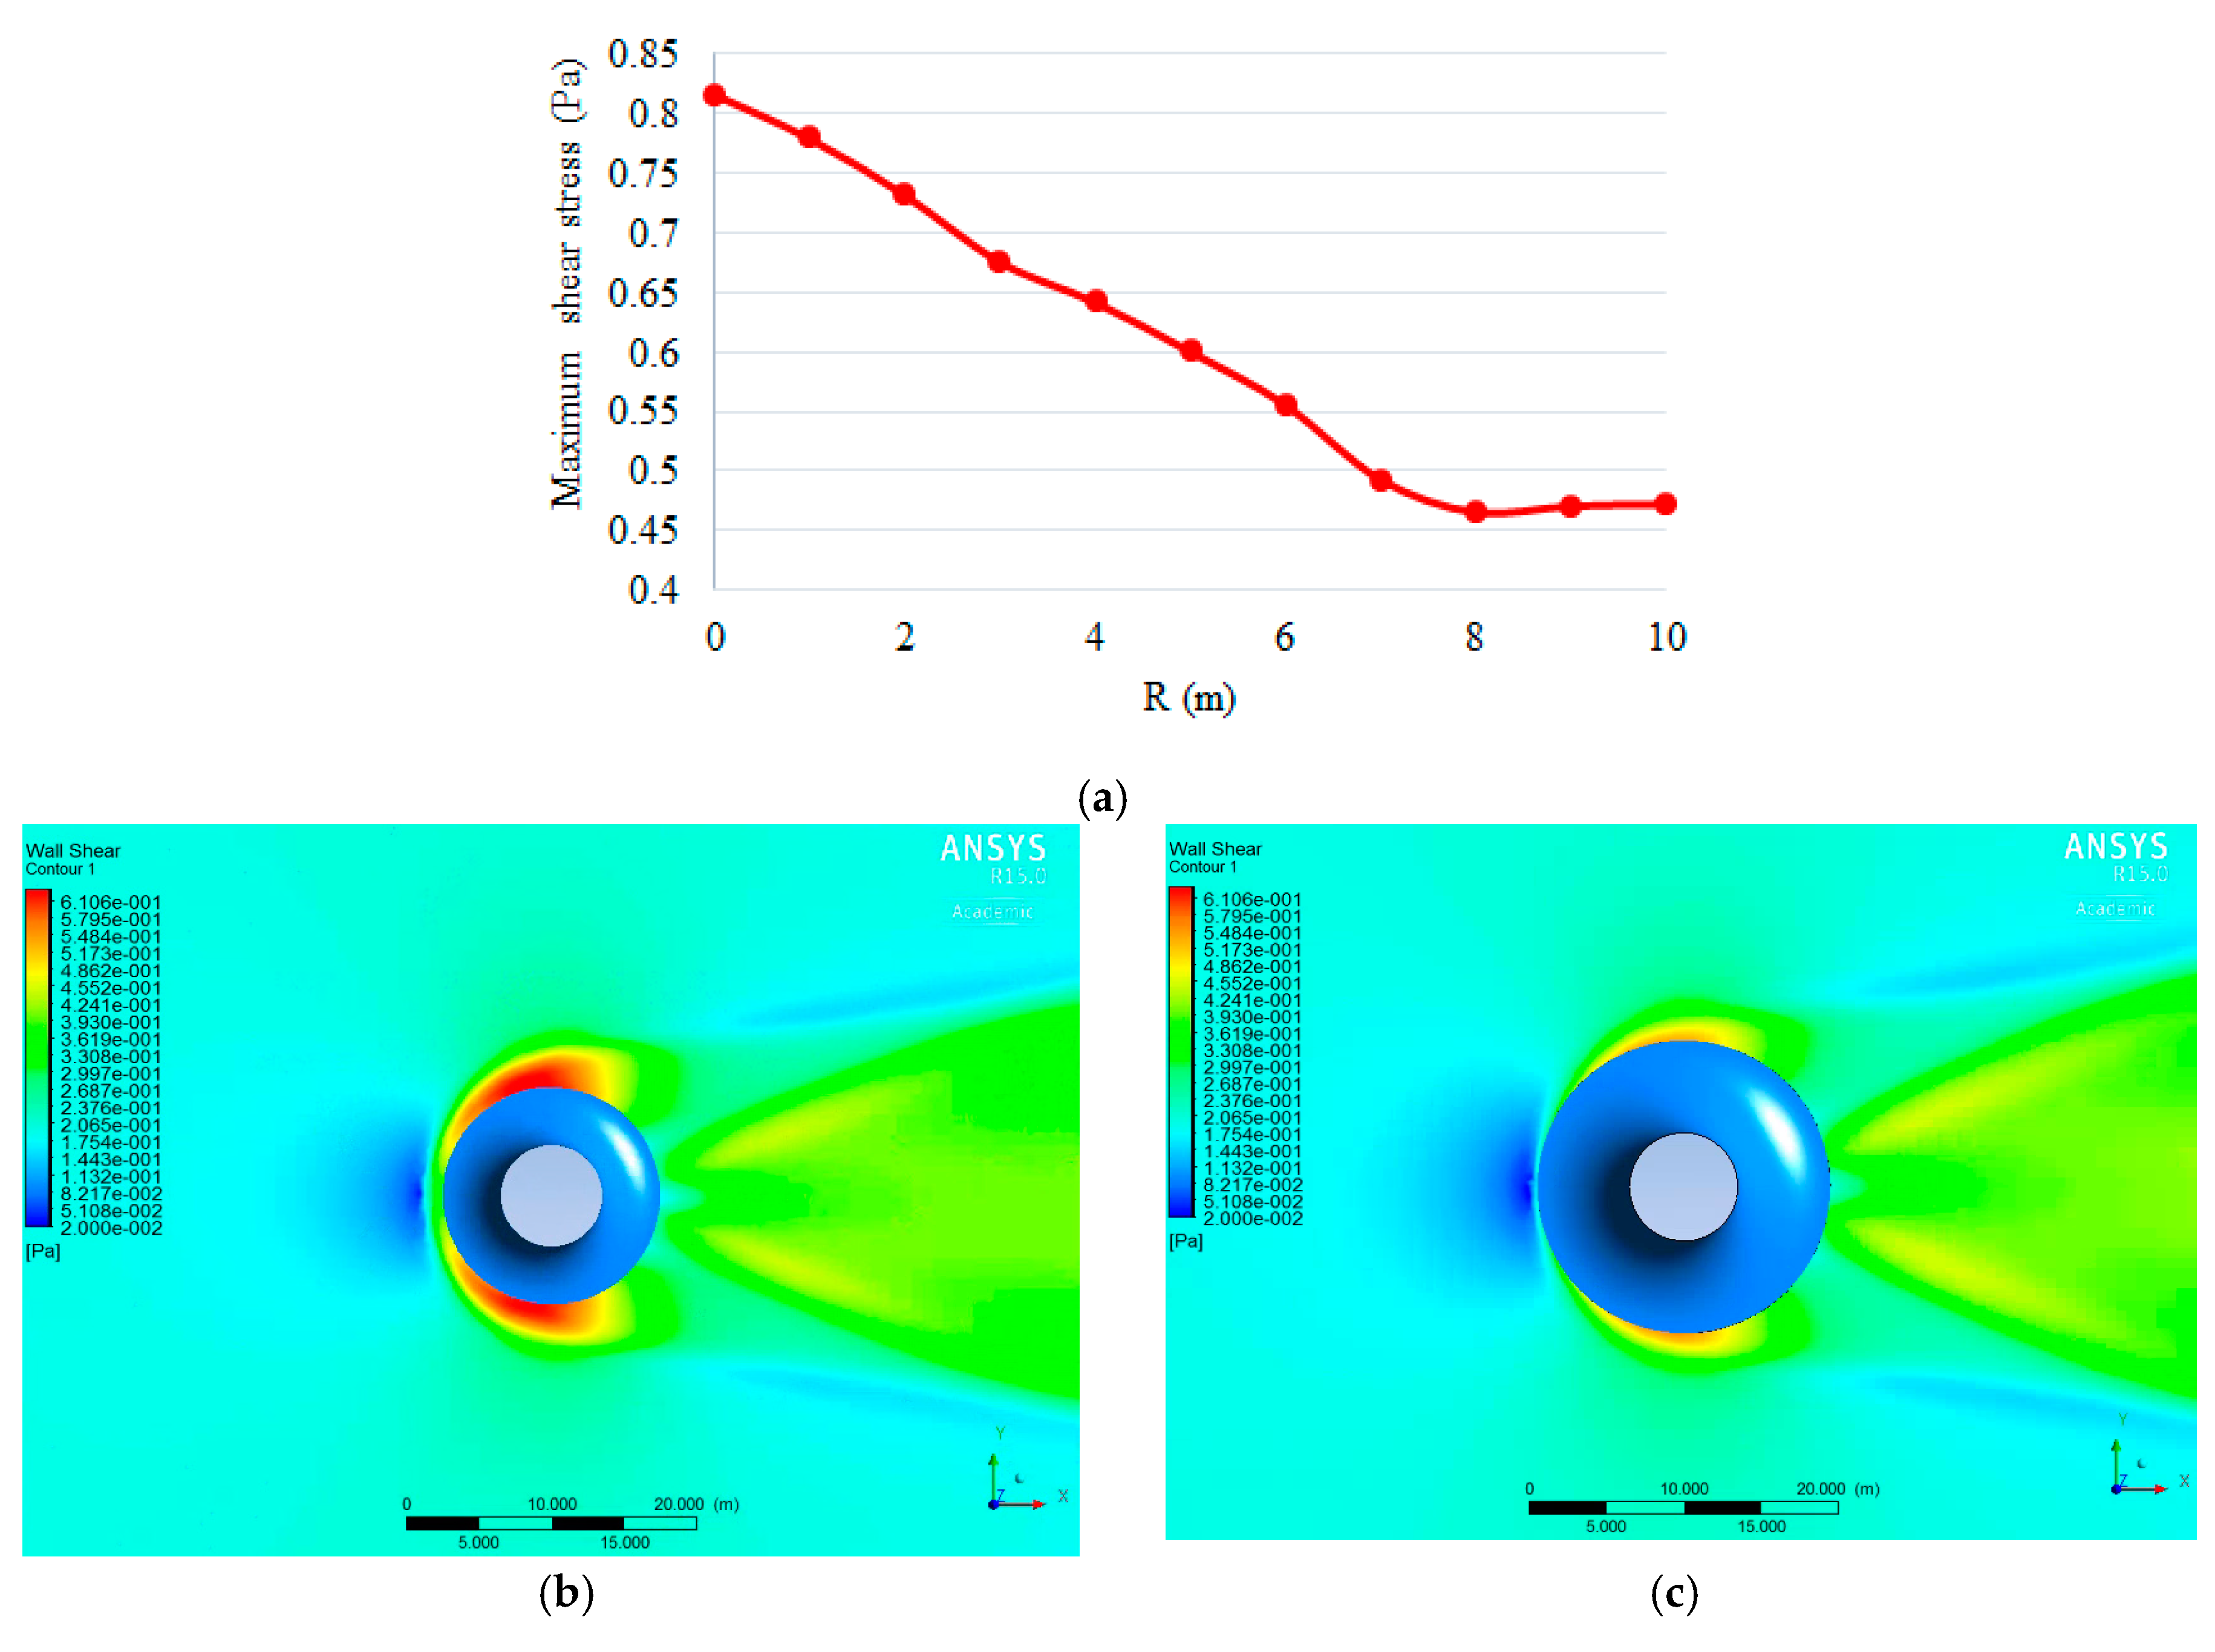
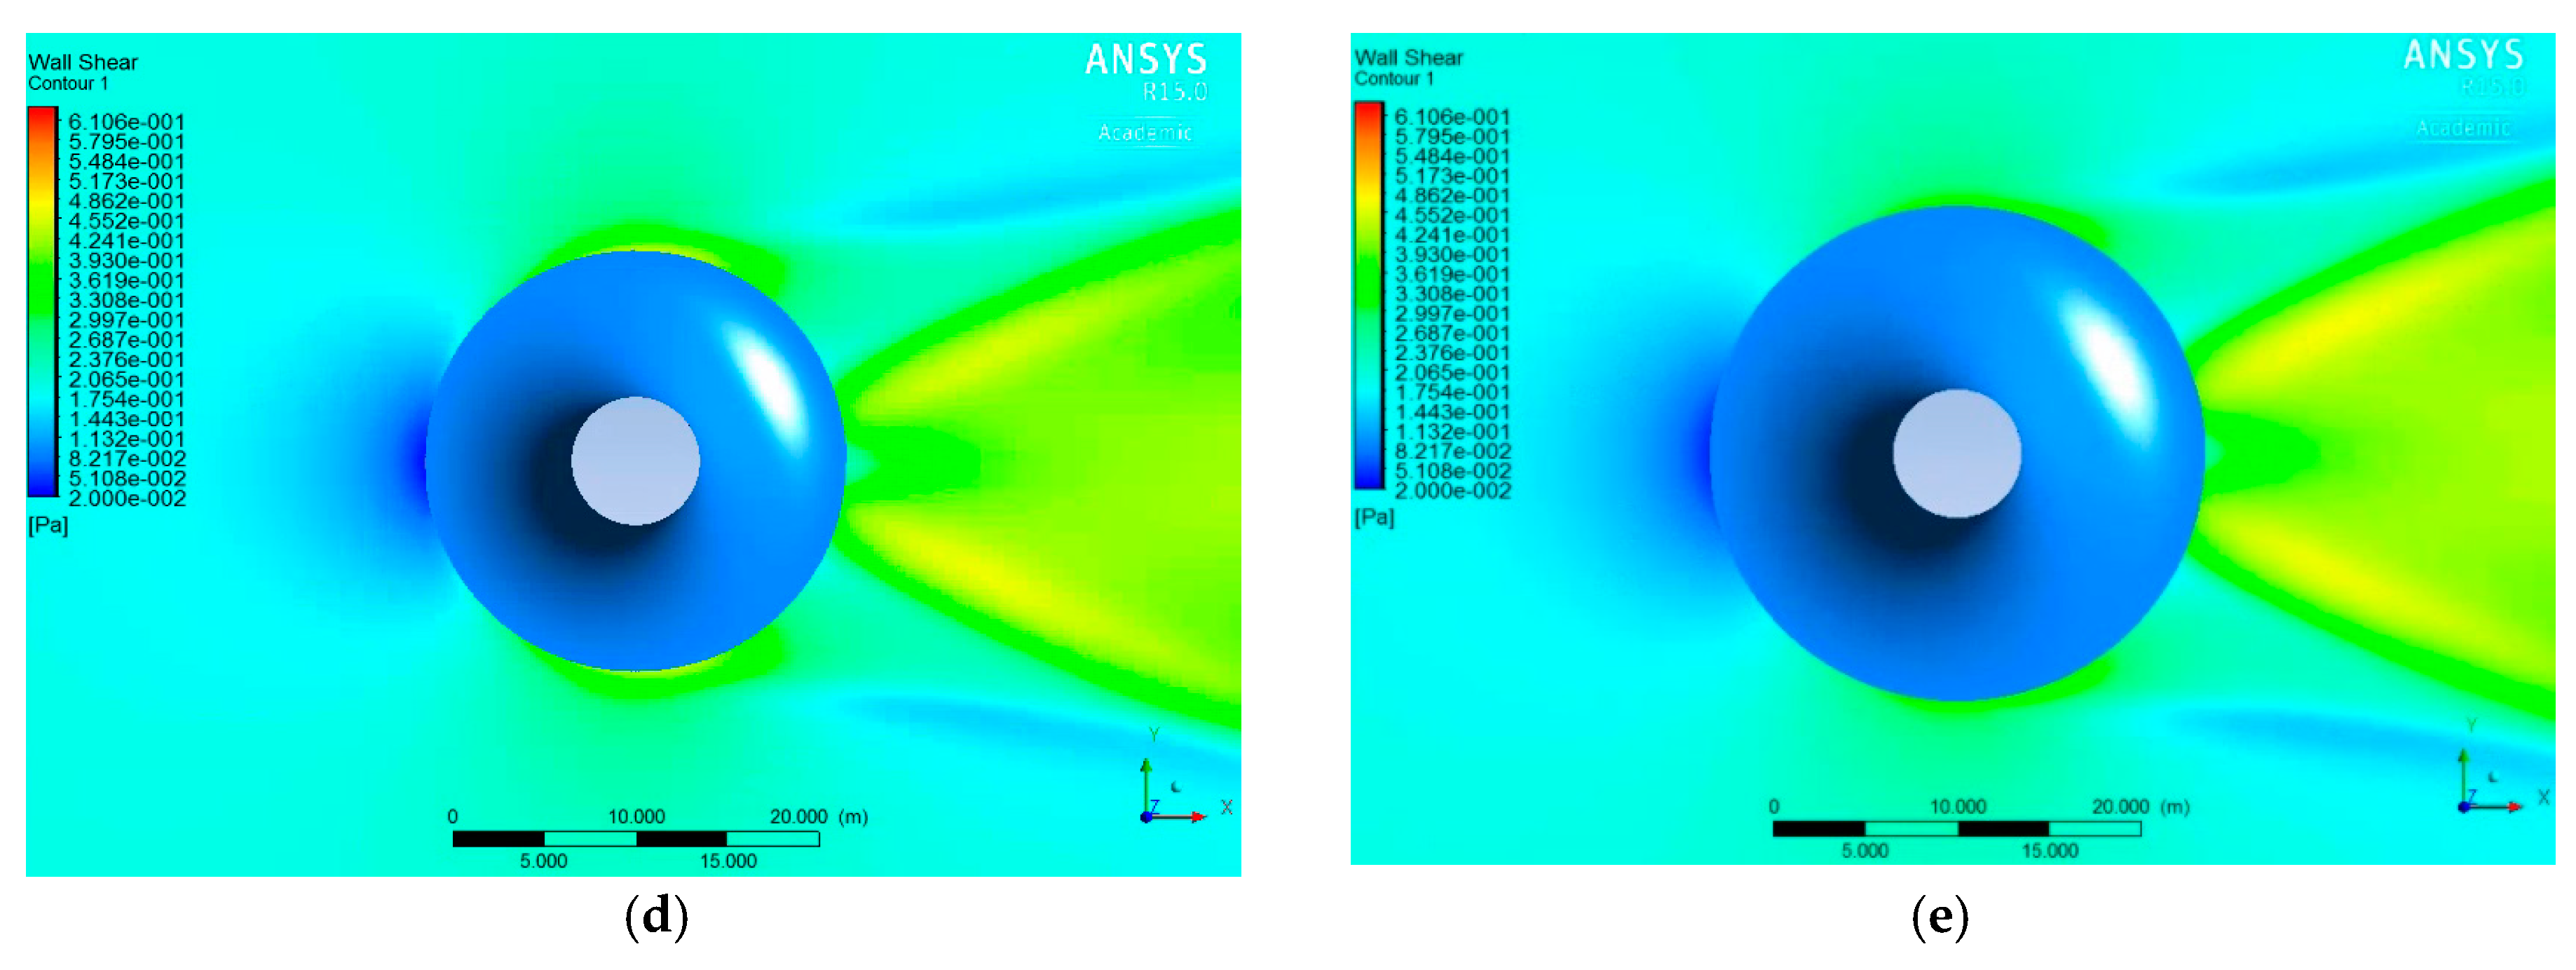
- After using the proposed SEMCD, the shear stress on seabed is reduced, which implies that the SEMCD does have the potential to prevent seabed erosion;
- The eddy viscosity results indicate that the maximum vortex energy is reduced by the SEMCD. Moreover, the horseshoes vortices are constrained on the surface of the SEMCD. All these merits will benefit the prevention of scour;
- A larger SEMCD can lead to better SME. For a 7 m diameter monopile foundation, R = 8−9 m is regarded as the best size of the SEMCD. However, in practice, the optimal size of the SEMCD will be compromised by its financial cost.
Author Contributions
Funding
Conflicts of Interest
Nomenclature
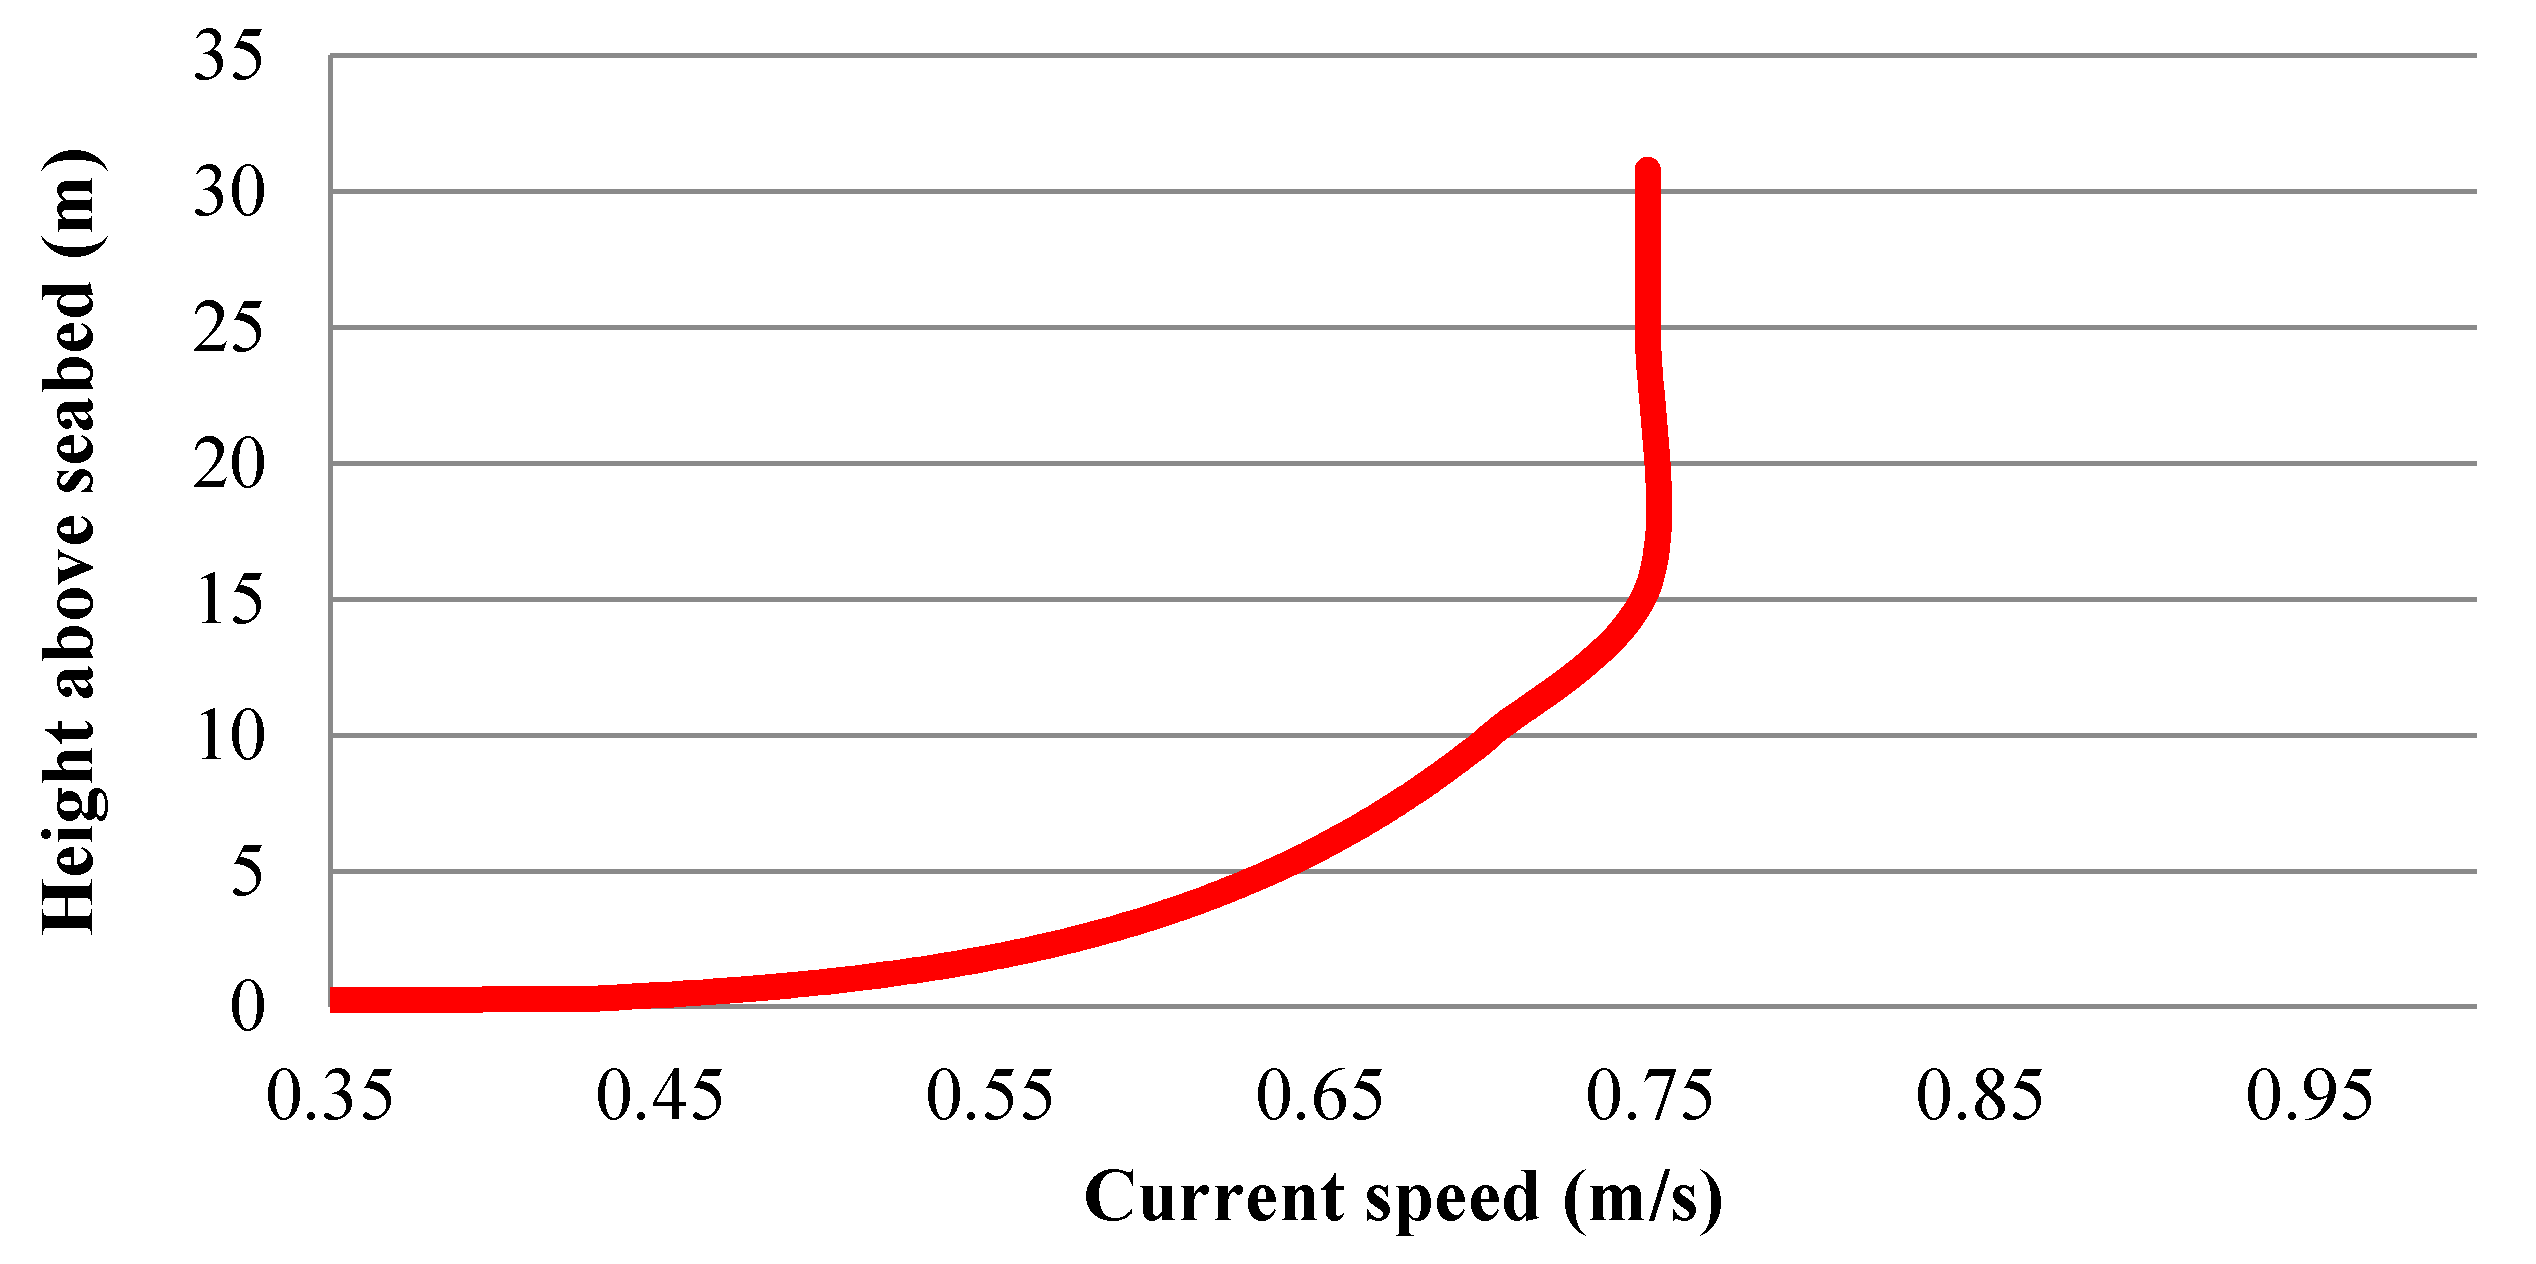
| Speed of tidal current at height above the seabed | |
| h | Water depth |
| Depth-averaged current speed | |
| Cartesian coordinates | |
| Velocity | |
| Fluctuating velocity | |
| Body force | |
| Water density | |
| p | Pressure |
| Kronecker delta | |
| μ | Viscosity |
| Turbulent viscosity | |
| Turbulence frequency | |
| Kinematic eddy viscosity | |
| Turbulence kinetic energy | |
| Production | |
| S | Invariant measure of strain rate |
| Kinematic viscosity | |
| F | Blending function |
| n | Normal direction |
| , | Indices for the scalar components of vectors |
References
- Offshore Wind in Europe. Key Trends and Statistics 2017. Available online: https://windeurope.org/wp-content/uploads/files/about-wind/statistics/WindEurope-Annual-Offshore-Statistics-2017.pdf (accessed on 27 September 2018).
- Gupta, A. The World’s 10 Biggest Wind Turbines. Available online: https://www.power-technology.com/features/featurethe-worlds-biggest-wind-turbines-4154395 (accessed on 29 September 2018).
- The European Offshore Wind Industry–Key Trends and Statistics 2013. Available online: https://windeurope.org/wp-content/uploads/files/about-wind/statistics/European_offshore_statistics_2013.pdf (accessed on 27 September 2018).
- Hundreds of Wind Turbines Could Be SINKING Due to Design Flaw. Available online: http://www.dailymail.co.uk/sciencetech/article-1265886/Sinking-turbines-cost-British-wind-farms-50million.html (accessed on 27 September 2018).
- Posey, C.J. Test of scour protection for bridge piers. J. Hydraul. Div. 1974, 100, 1773–1783. [Google Scholar]
- Brice, J.C.; Bloggett, J.C. Countermeasures for Hydraulic Problems at Bridge Piers; U.S Department of transportation: Washington, DC, USA, 1978. [Google Scholar]
- Worman, A. Riprap Protection without Filter Layers. J. Hydraul. Eng. ASCE 1989, 115, 1615–1629. [Google Scholar] [CrossRef]
- Gupta, A.K.; Gangadharaiah, T. Local scour reduction by a delta wing-lick passive device. In Proceedings of the 8th Congress of Asia and Pacific Regional Division, 2, CWPRS, Pune, India, 20–23 October 1992; pp. B471–B481. [Google Scholar]
- Froehlich, D.C. Protecting bridge piers with loose rock riprap. J. Appl. Water Eng. Res. 2013, 1, 39–57. [Google Scholar] [CrossRef]
- Chiew, Y.M. Mechanics of Riprap Failure at Bridge Piers. J. Hydraul. Eng. ASCE 1995, 121, 635–643. [Google Scholar] [CrossRef]
- Hadfield, A.C. Sacrificial Piles as a Bridge Pier Scour Counter-Measure. Master’s Thesis, University of Auckland, Auckland, New Zealand, 1997. [Google Scholar]
- Chiew, Y.M. Scour protection at bridge piers. J. Hydraul. Eng. ASCE 1992, 118, 1260–1269. [Google Scholar] [CrossRef]
- Chiew, Y.M.; Lim, F.H. Failure Behavior of Riprap Layer at Bridge Piers under Live-Bed Conditions. J. Hydraul. Eng. ASCE 2000, 126, 43–55. [Google Scholar] [CrossRef]
- Lim, F.H.; Chiew, Y.M. Parametric Study of Riprap Failure around Bridge Piers. J. Hydraul. Res. 2001, 30, 61–72. [Google Scholar] [CrossRef]
- Kumar, V.; Ranga Raju, K.G.; Vittal, N. Reduction of Local Scour around Bridge Piers Using Slot and Collar. J. Hydraul. Eng. ASCE 1999, 125, 1302–1305. [Google Scholar] [CrossRef]
- Melville, B.W.; Hadfield, A.C. Use of sacrificial piles as pier scour countermeasures. J. Hydraul. Eng. ASCE 1999, 125, 1221–1224. [Google Scholar] [CrossRef]
- Zarrati, A.M.; Gholami, H.; Mashahir, M.B. Application of collar to control scouring around rectangular bridge piers. J. Hydraul. Res. IAHR 2004, 42, 97–103. [Google Scholar] [CrossRef]
- Zarrati, A.M.; Nazariah, M.; Mashahir, M.B. Reduction of local scour in the vicinity of bridge pier group using collars and riprap. J. Hydraul. Eng. ASCE 2006, 132, 154–162. [Google Scholar] [CrossRef]
- Tafarojnoruz, A.; Gaudio, R.; Dey, S. Flow-altering countermeasures against scour at bridge piers: A review. J. Hydraul. Res. 2010, 48, 441–452. [Google Scholar] [CrossRef]
- Mubeen, B.; Salman, B. Scour reduction around bridge piers: A review. Int. J. Eng. Invent. 2013, 2, 7–15. [Google Scholar]
- Shatirah, A.; Noor, L.; Hossein, B.; Afshin, J. Reducing local scouring at bridge piles using collars and geobags. Sci. World J. 2014. [Google Scholar] [CrossRef]
- Huang, C.K.; Tang, C.J.; Kuo, T.Y. Use of surface guide panels as pier scour countermeasure. Int. J. Sediment Res. 2005, 20, 119–130. [Google Scholar]
- Cho, Y.J.; Yang, K.S.; Kim, B.K. Development of counter measures against scouring at the toe of offshore wind turbine foundation. In Proceedings of the EWEA OFFSHORE 2015, Copenhagen, Denmark, 10–12 March 2015. [Google Scholar]
- Stroescu, I.E.; Frigaard, P.; Fejerskov, M.; Nielsen, S.A. Scour design for self-protecting mono bucket foundation used for offshore wind turbines. In Proceedings of the EWEA OFFSHORE 2015, Copenhagen, Denmark, 10–12 March 2015. [Google Scholar]
- AnsysCFX-Solver Theory Guide. Available online: https://www.scribd.com/document/146465149/ANSYS-CFX-Solver-Theory-Guide (accessed on 27 September 2018).
- Soulsby, R.L. Dynamics of Marine Sands; Thomas Telford: London, UK, 1997. [Google Scholar]
- Menter, F.R. Zonal Two Equation k-ω Turbulence Models for Aerodynamic Flows. In Proceedings of the 23rd Fluid Dynamics, Plasmadynamics, and Lasers Conference, Orlando, FL, USA, 6–9 July 1993. [Google Scholar]
- Menter, F.R. Two-Equation Eddy-Viscosity Turbulence Models for Engineering Applications. AIAA J. 1994, 32, 1598–1605. [Google Scholar] [CrossRef]
- SST k-Omega Model. Available online: http://www.cfd-online.com/Wiki/SST_k-omega_model (accessed on 2 September 2018).
- Reynolds-Averaged Navier–Stokes Equations. Available online: https://en.wikipedia.org/wiki/Reynolds-averaged_Navier%E2%80%93Stokes_equations (accessed on 2 September 2018).
- Hunt, J.C.R.; Wray, A.A.; Moin, P. Eddies, Stream and Convergence Zones in Turbulent Flows; Report CTR-S88; Centre for Turbulence Research: Moffett Field, CA, USA, 1988. [Google Scholar]


| Parameter | Setting |
|---|---|
| Size function | Curvature |
| Initial size seed | Active assembly |
| Smoothing | Medium |
| Transition | Slow |
| Span angle center | Fine |
| Curvature normal angle | 12.0° |
| Min size | 0.01 |
| Max face size | 4.0 m |
| Max txt size | 4.0 m |
| Growth rate | Default (1.20) |
| Use automatic inflation | Program controlled |
| Inflation option | First aspect ratio |
| Fir aspect ratio | 5 |
| Maximum layers | 5 |
| Triangle Surface Mesher | Program controlled |
| Topology checking | Yes |
| Pinch tolerance | Default (0.009 m) |
| Parameter | Setting | |
|---|---|---|
| Fluid model | Heat transfer | None |
| Turbulence option | Shear stress transport | |
| Turbulence wall function | Automatic | |
| Advection scheme option | High resolution | |
| Turbulence numeric option | First order | |
| Convergence control min. iterations | 1 | |
| Convergence criteria max. iterations | 500 | |
| Fluid timescale control | Auto timescale | |
| Fluid length scale option | Conservative | |
| Fluid timescale factor | 1.0 | |
| Convergence criteria residual type | RMS | |
| Convergence criteria residual target | ||
| R (m) | Maximum Velocity of Up Flow (m/s) | Reduction Rate (%) |
|---|---|---|
| 0 | 0.1234 | 0.00 |
| 1 | 0.0496 | 59.80 |
| 2 | 0.0364 | 70.50 |
| 3 | 0.0328 | 73.41 |
| 4 | 0.0311 | 74.79 |
| 5 | 0.0292 | 76.33 |
| 6 | 0.0289 | 76.58 |
| 7 | 0.0202 | 83.63 |
| 8 | 0.0147 | 88.08 |
| 9 | 0.0123 | 90.03 |
| 10 | 0.0123 | 90.03 |
© 2018 by the authors. Licensee MDPI, Basel, Switzerland. This article is an open access article distributed under the terms and conditions of the Creative Commons Attribution (CC BY) license (http://creativecommons.org/licenses/by/4.0/).
Share and Cite
Yang, W.; Tian, W. Concept Research of a Countermeasure Device for Preventing Scour around the Monopile Foundations of Offshore Wind Turbines. Energies 2018, 11, 2593. https://doi.org/10.3390/en11102593
Yang W, Tian W. Concept Research of a Countermeasure Device for Preventing Scour around the Monopile Foundations of Offshore Wind Turbines. Energies. 2018; 11(10):2593. https://doi.org/10.3390/en11102593
Chicago/Turabian StyleYang, Wenxian, and Wenye Tian. 2018. "Concept Research of a Countermeasure Device for Preventing Scour around the Monopile Foundations of Offshore Wind Turbines" Energies 11, no. 10: 2593. https://doi.org/10.3390/en11102593
APA StyleYang, W., & Tian, W. (2018). Concept Research of a Countermeasure Device for Preventing Scour around the Monopile Foundations of Offshore Wind Turbines. Energies, 11(10), 2593. https://doi.org/10.3390/en11102593