Article

Optimization of the Electric Field Distribution at the End of the Stator in a Large Generator

1
Key Laboratory of Engineering Dielectrics and Its Application, Ministry of Education, Harbin University of Science and Technology, Harbin 150080, China
2
College of Rongcheng, Harbin University of Science and Technology, Rongcheng 264300, China
*
Author to whom correspondence should be addressed.
Energies 2018, 11(10), 2510; https://doi.org/10.3390/en11102510
Submission received: 21 August 2018 / Revised: 14 September 2018 / Accepted: 16 September 2018 / Published: 20 September 2018

Abstract

:
The electric field distribution at the end of a large hydro-generator is highly nonuniform and prone to corona discharge, which damages the main insulation and significantly reduces the service life of the hydro-generator. In order to reduce the thickness of the main insulation and the physical size of a large hydro-generator, it is necessary to understand the distribution of the electric field at the end of its stator bar. In this paper, the stator bar at the end of a large generator is simulated using the finite element method to determine the distribution of the potential, electric field, and loss at the rated voltage, as well as to elucidate the differences between the linear corona protection, two-segment nonlinear corona protection, and three-segment nonlinear corona protection structures. The influences of the arc angle, length of each corona protection layer, intrinsic resistivity of the corona protection material, and nonlinear coefficient are also analyzed. The results manifest that the angle of the stator bar should be 22.5°, the difference in resistivity between the two adjacent corona protection coatings should not exceed two orders of magnitude, and the resistivity of the medium resistivity layer should be nearly 106 Ω·m or 107 Ω·m, for an optimal design of the corona protection structure.

1. Introduction

In large hydro-generators, the area of the partial discharge (PD), sometimes also known as corona, is mostly concentrated at the end of the stator winding/bar [1,2]. Partial discharges are, in most cases, the symptom of deterioration of generator stator windings/bars rated 6 kV and above [3,4]. A significant increase in PD over time may reduce the operating life of the stator winding insulation system [5]. To improve this situation, almost all generator stator windings rated 6 kV and above have coatings on the surface of the bars to suppress the occurrence of PD on bars operating at high voltage. In the stator core slot area of the bar, and for a few centimeters outside of it, the coating is usually a graphite-loaded paint or tape that is referred to as semi-conductive coating. It is also called the outer corona protection (OCP), which prevents the build-up of any voltage between the surface of the stator bar and the stator core, and thus prevents surface PD. We refer to it as the low resistive coating, since its resistivity is low. There are some other surface coatings that extend from the end of the semi-conductive coating to the end of the winding area. These coatings are often referred to as stress relief coating, end winding corona protection (ECP), semi-conductive coating (which is confusing since the graphite coating is called the same by some users), or silicon carbide coating. We refer to these coatings as medium, medium-high, and high resistive coatings according to the magnitude of the resistivity. The purpose of the ECP is to linearize the axial electric field at the end of the semi-conductive coating, which would otherwise be highly non-uniform and thus create PD at the ends of the semi conductive coating [6,7,8,9].
Meanwhile, over the past few decades, calculation and optimization of the electric field distribution at the end of the stator bar in large generators has always been an important research topic. A variety of calculation methods have been developed based on the theories of circuits and electromagnetic fields, and engineering approximation, link model, and finite element methods have been widely applied in the development of the ECP technology. In the 1950s, empirical formulas were employed to design the ECP structures of generators. This approach was refined by employees during their daily work, and so, while the developed method was reliable, it lacked theoretical support [10]. In the 1970s, the resistance capacitance link model was widely applied in analyses of the corona protection structure at the end of the stator bar to rapidly find a suitable solution without considering the state of the space electric field. However, the disadvantage of this method is that it cannot be used to conduct three-dimensional modeling or to accurately analyze the electric fields in the corner and along narrow edges [11,12]. In recent years, with the rapid development of computer technology, simulation tools for the finite element method have been applied to determine the electric field distribution and optimize the calculations pertaining to the generator bar [13]. In 2003, researchers at the Federal University of Parana, Brazil, conducted numerical simulations of the bar and adopted a special location modeling approach for the interphase electric field. However, the calculation accuracy of this approach is low, and the method did not gain popularity. In 2008, researchers at the KTH Royal Institute of Technology in Stockholm, Sweden, employed the finite element and transient solution methods to evaluate the nonlinear electric field distribution; however, the method was inefficient, and the accuracy of the solution was low [14,15]. In 2014, Zhang et al. [16] applied the finite element and multi field modeling methods to calculate the electric field and loss density distribution of the corona protection layer at the end of the stator bar in a large generator. The results were then compared to those obtained using the resistance capacitance chain algorithm to provide a basis for further development of an optimal calculation model. Sun [17] improved the traditional finite element analysis method, set the electric field control equation in the corona protection coating boundary, effectively combined the resistance-capacitance chain method and the finite element method, and addressed the error in the process of transforming surface resistivity to volume resistivity. This method is efficient and accurate and satisfactorily analyzes the electric field at the end of the stator bar.
In this paper, a large hydro-generator with a rated capacity of 120 MW and a rated voltage of 15.75 kV is used an example. The Creo Parametric software package is used to establish a three-dimensional model that is consistent with the stator bar of an actual machine. Then, the COMSOL Multiphysics finite element analysis software package (COMSOL) is used to simulate and characterize the bar. The distribution of the potential, electric field, and loss of the nonlinear corona protection structure at the rated voltage is compared and analyzed, and the influences of the arc angle, nonlinearity coefficient, corona protection layer, and resistivity of the corona protection layer are evaluated. In addition, the electric field distribution at the end of the generator is investigated. Then, an optimal corona protection structure and the properties of the corona protection material are determined to provide a theoretical basis for a rational design of the corona protection structure and selection of the corona protection materials at the end of the stator bar of the generator.
The remainder of this paper is organized as follows. In Section 2, the application of the finite element analysis method is discussed for electric field analysis. In Section 3, a suitable model is constructed in COMSOL. In Section 4, the optimized design of a corona protection structure for the end of a large generator is presented. Finally, the conclusions drawn from the study are summarized in Section 5.

2. Finite Element Analysis of the Electric Field

The differential form of Maxwell’s equations is as follows [18]:
{ × H = D t + J D = ρ × E = B t B = 0
where H is the magnetic field intensity (in A/m), D is electric displacement vector (in C/m2), J is the current density (in A/m2), E is electric field intensity (in V/m), B is the magnetic flux density (in T), and ρ is the charge density (C/m3).
The finite element method uses a constant electric potential to calculate the electric field while ignoring the term B t in Equation (1). An electroquasistatic formulation can be obtained using the following simplified differential form:
{ × H = D t + J D = ρ × E = 0 B = 0
Under electroquasistatic conditions, the total current density J of the lossy medium is:
J = γ E + ε t E
where ε is the permittivity and γ is the conductivity (in S/m).
According to the continuity equation and E = φ :
( γ φ + ε t φ ) = 0
The electric field distribution at the end of the stator bar depends not only on the dielectric constant but also on the conductivity. When the corona protection layer at the end of the stator winding consists of nonlinear material, the resistivity of the material will change with the variation of the electric field strength as follows:
ρ = ρ 0 exp ( n | E | α )
where ρ is the resistivity (in Ω·m), ρ0 is the intrinsic resistivity (in Ω·m), and n is the non-linear coefficient.
An examination of the experimental data indicates that the resistivity varies exponentially in which α = 2/3 is the power of the electric stress [19,20]. According to Equation (5), the non-linear equation of conductivity is:
γ = 1 ρ = γ 0 exp ( n | E | 2 / 3 )
where γ0 is the intrinsic conductivity (in S/m).
By using the Galerkin finite element method, a semi discrete finite element equation in the following form can be obtained [21,22]:
K ε φ t + K γ φ = 0
where φ is the node potential column vector, Kε is the finite element coefficient matrix of medium permittivity, and Kγ is the finite element coefficient matrix of conductivity [23].
Based on these equations, a model of the stator bar end was constructed in COMSOL in order to calculate the electric field and loss distribution at each point.

3. Establishment of the Model

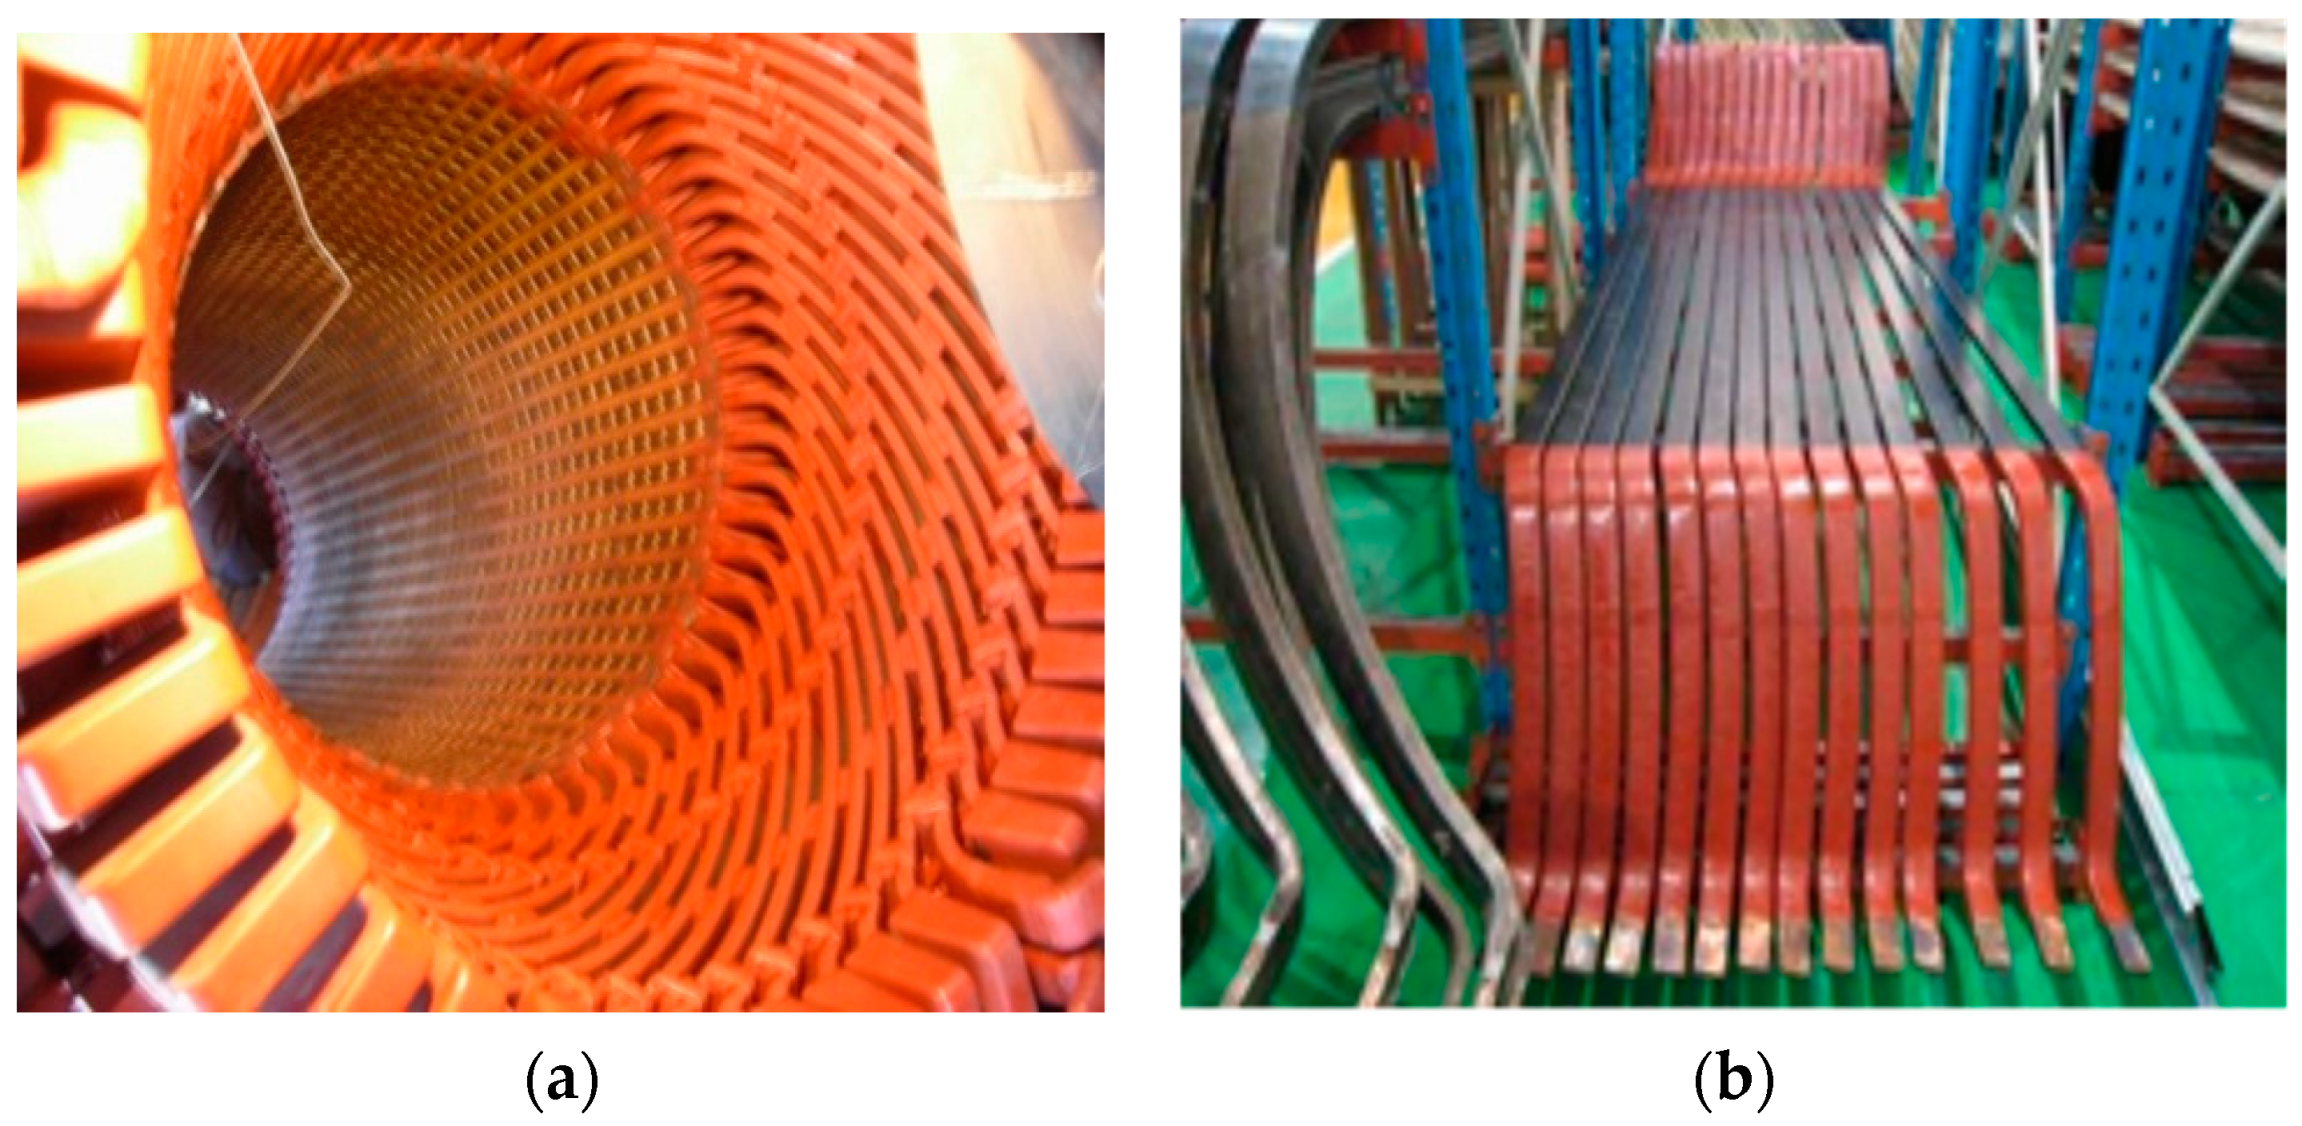
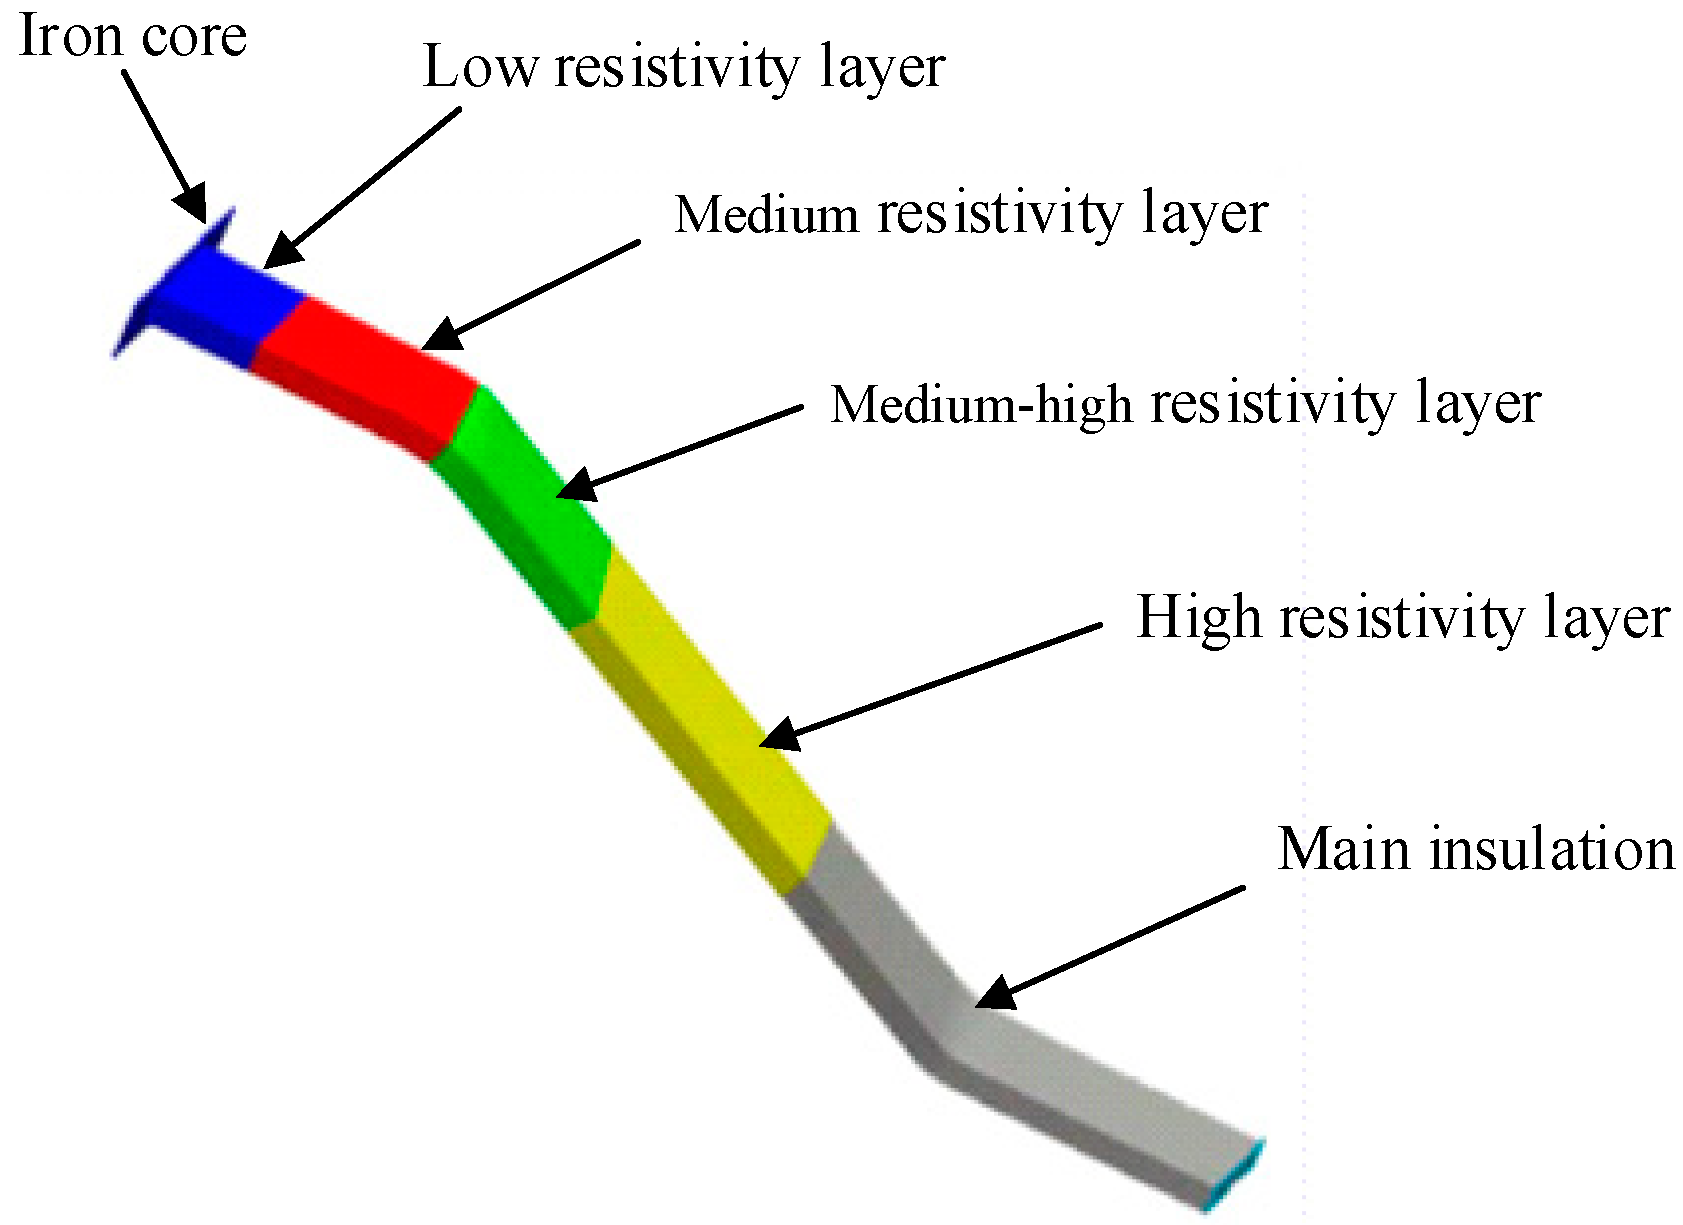
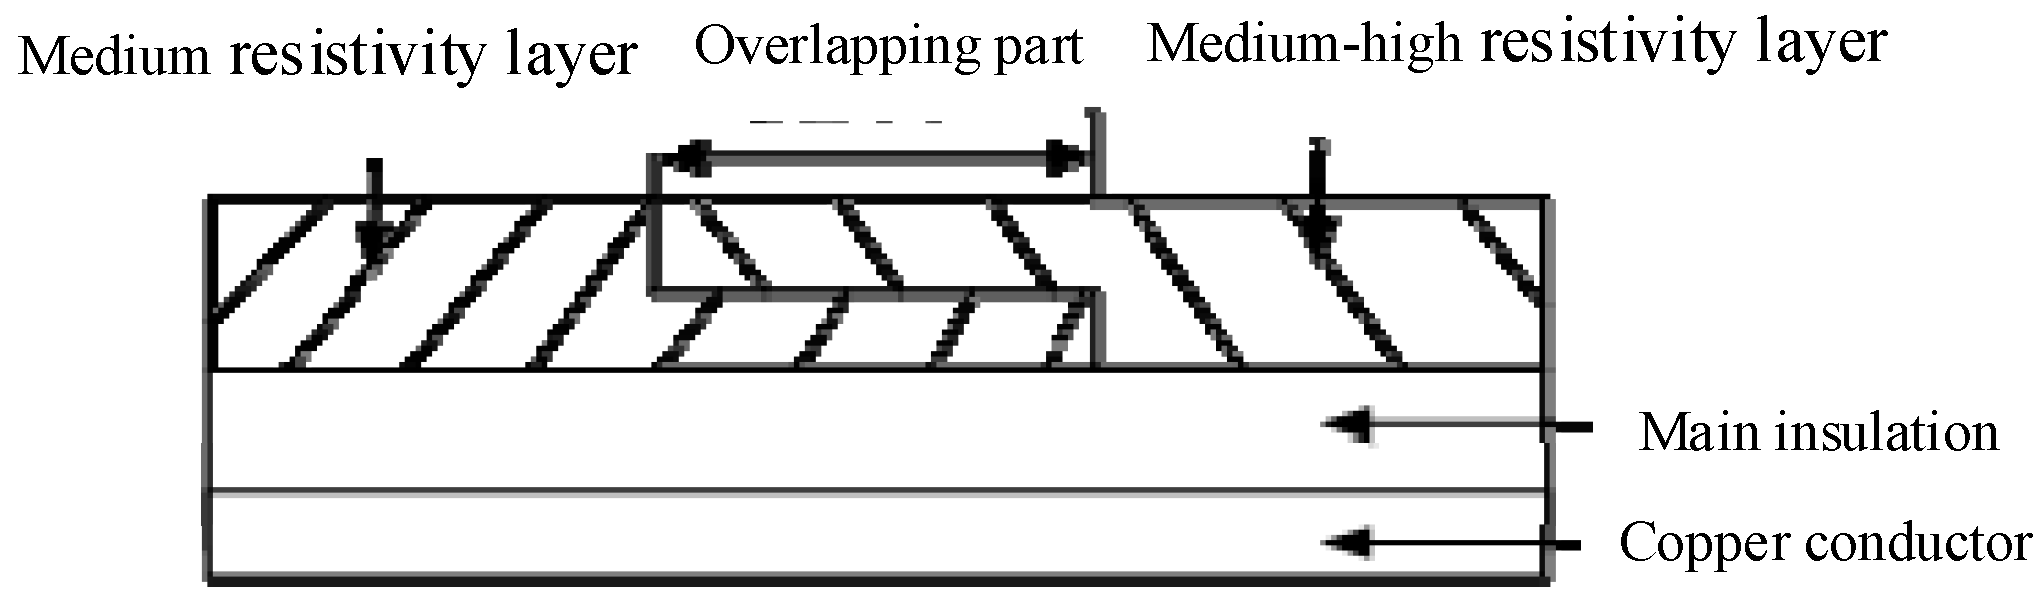
3.1. Model of the Three-Dimensional at the End of a Stator Bar

The construction of the end of the stator winding in a hydro-generator is complex, and the structure from the outlet to the lead corona protection layer is comprised of low, medium, medium-high, and high resistivity layers (OCP and ECP) as well as primary insulation. In this study, a single end stator bar was modeled in COMSOL. A photograph of an actual stator is shown in Figure 1. The model considered in this paper is shown in Figure 2 and considers the fact that the ends of the actual stator bars are curved and rotate [24,25]. In the model, the connections between the low, medium, and high resistive layers overlap by 20 mm [26], as shown in Figure 3.
In terms of selection of insulation materials, modified epoxy mica tape with continuous insulation is usually used as the basic material for large generators [27]. Its resistivity is 2 × 10¹⁴ Ω·m and the relative dielectric constant is 4. Because of the nonuniform distribution of the electric field at the end of the stator bar, it is necessary to set up the (ECP). Silicon carbide is used as the corona protection material. As a nonlinear material, the resistivity of silicon carbide varies with the change of electric field, which can homogenize the field strength at the end region of the stator bar and thus can suppress partial discharge.

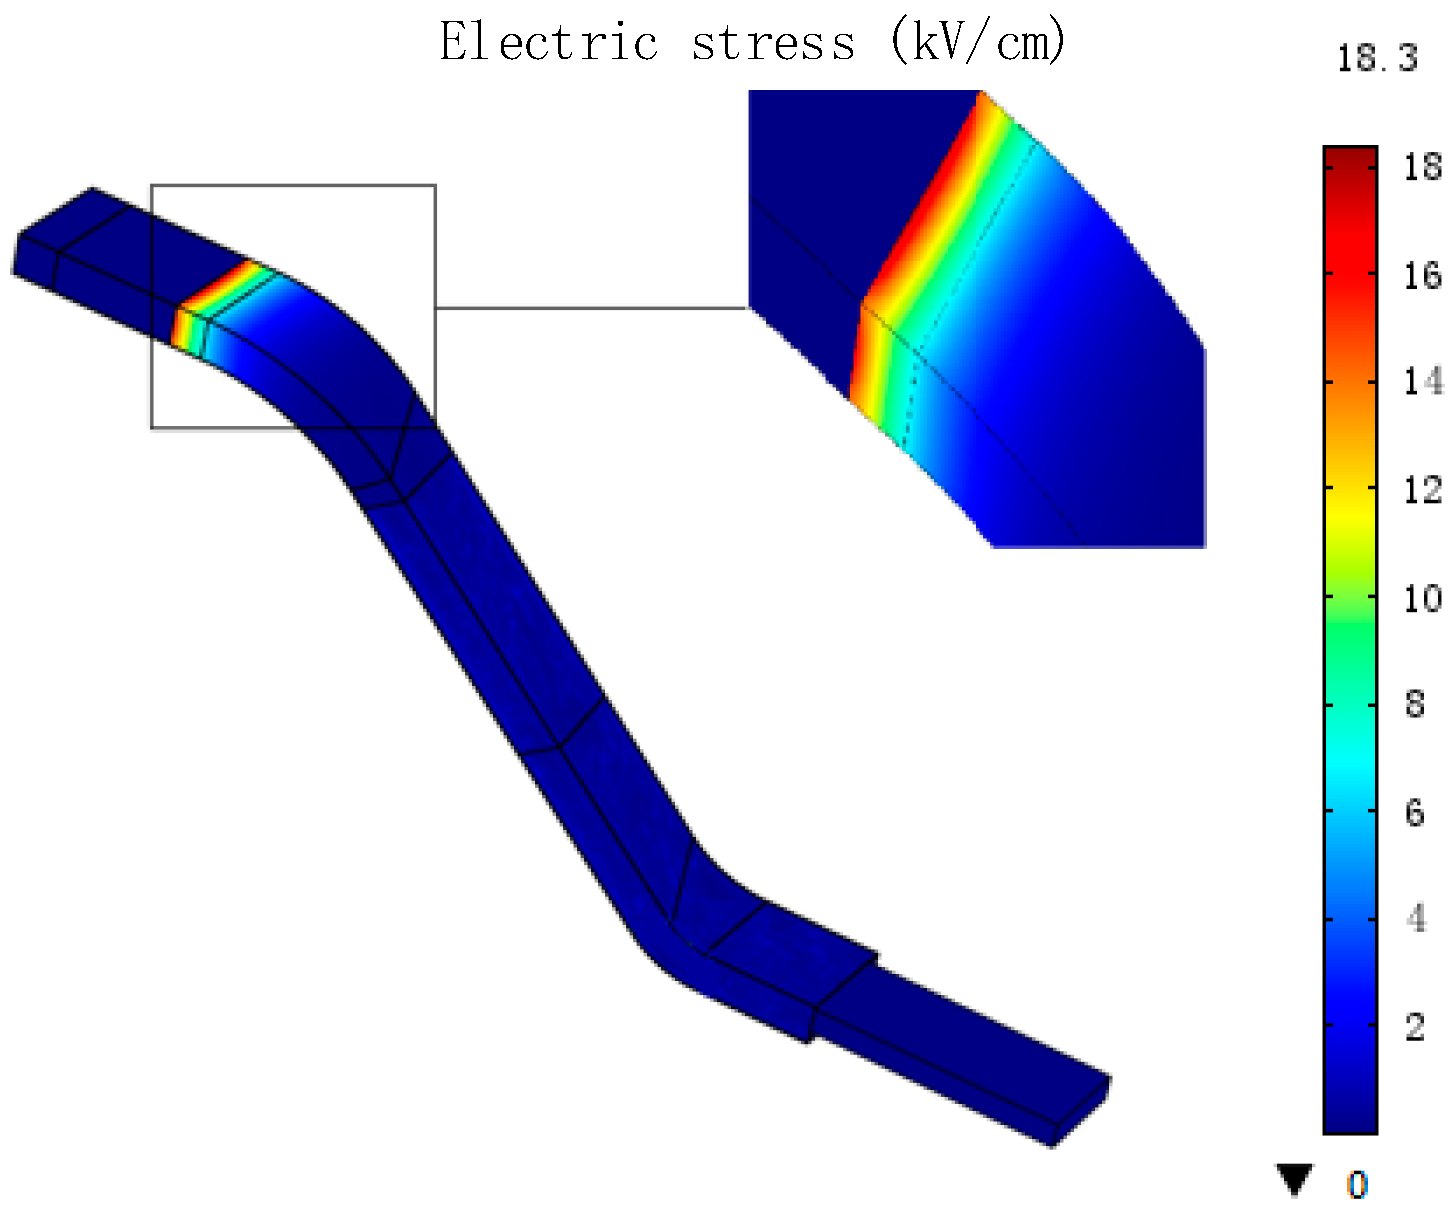
3.2. Analysis of the Calculation Results

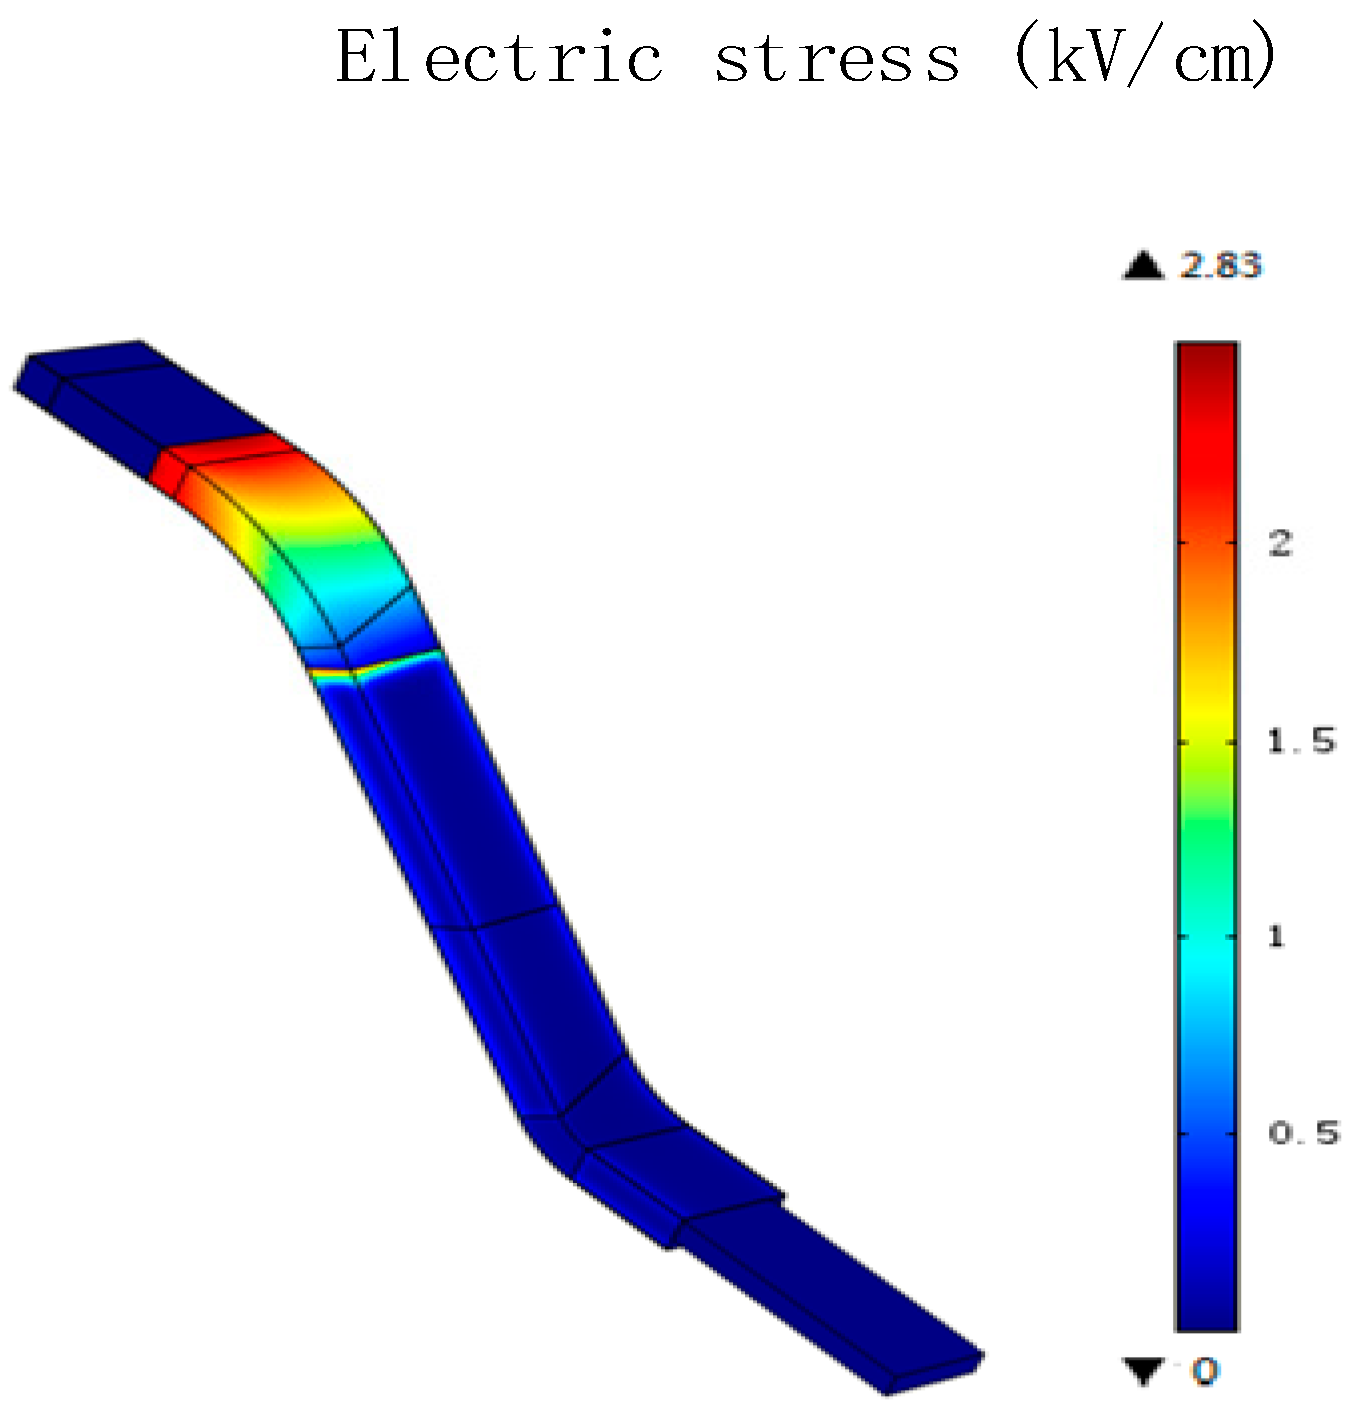
3.2.1. Influence of Nonlinear Corona Protection Material on the Distribution of Electric Field

The distribution of the electric field when the corona layer is linear is shown in Figure 4. As shown in the figure, the electric field distribution is concentrated only at the notch and has a value of 18.3 kV/cm. In addition, the concentration at the outlet is visible, although the corona protection requirements have not been met.
The distribution of the electric field on the surface of the bar when two layers of nonlinear corona protection are used is shown in Figure 5. The area concentrated at the end of the stator is primarily a low resistivity section, while the section at the outlet is a medium resistivity section. The highest field strength was 3.37 kV/cm, which is two times higher than the maximum field strength in the intermediate resistivity section. The distribution of the electric field on the surface of a bar with three segment nonlinear corona protection is shown in Figure 6. The electric field distribution of the three-segment corona protection structure at the start of the medium resistivity section is more uniform than that of the two-segment structure. However, the electric field is concentrated at the junction between the medium and high resistivity sections. As the capacitance current pass through this junction, the electric field becomes concentrated and easily causes the junction to overheat, which eventually causes thermal damage to the corona protection layer. The maximum electric field of the three-segment nonlinear corona protection decreased to 2.80 kV/cm, which was 16% lower than that of the two-segment nonlinear corona protection, and the field strength distribution improved as a result.
In order to verify the correctness of the model presented in this paper, the result of Ref. [28] is used as a reference. The stator bar of a hydro generator at the end region with a rated voltage of 20 kV is analyzed using the finite element method in Ref. [28]. The distribution of the electric field strength is shown in Figure 7, which only shows the color plot of the ECP, and the maximum field strength is 3.77 kV/cm in the ECP/OCP overlapping area. The maximum electric field intensity is 2.83 kV/cm according to the calculation result in Figure 6, and the position where the field intensity is concentrated is the same as that in Figure 7. By comparison, the simulation results presented in the two figures are consistent, although there are some differences in the maximum field intensity, which proves that the results obtained in this study are credible.

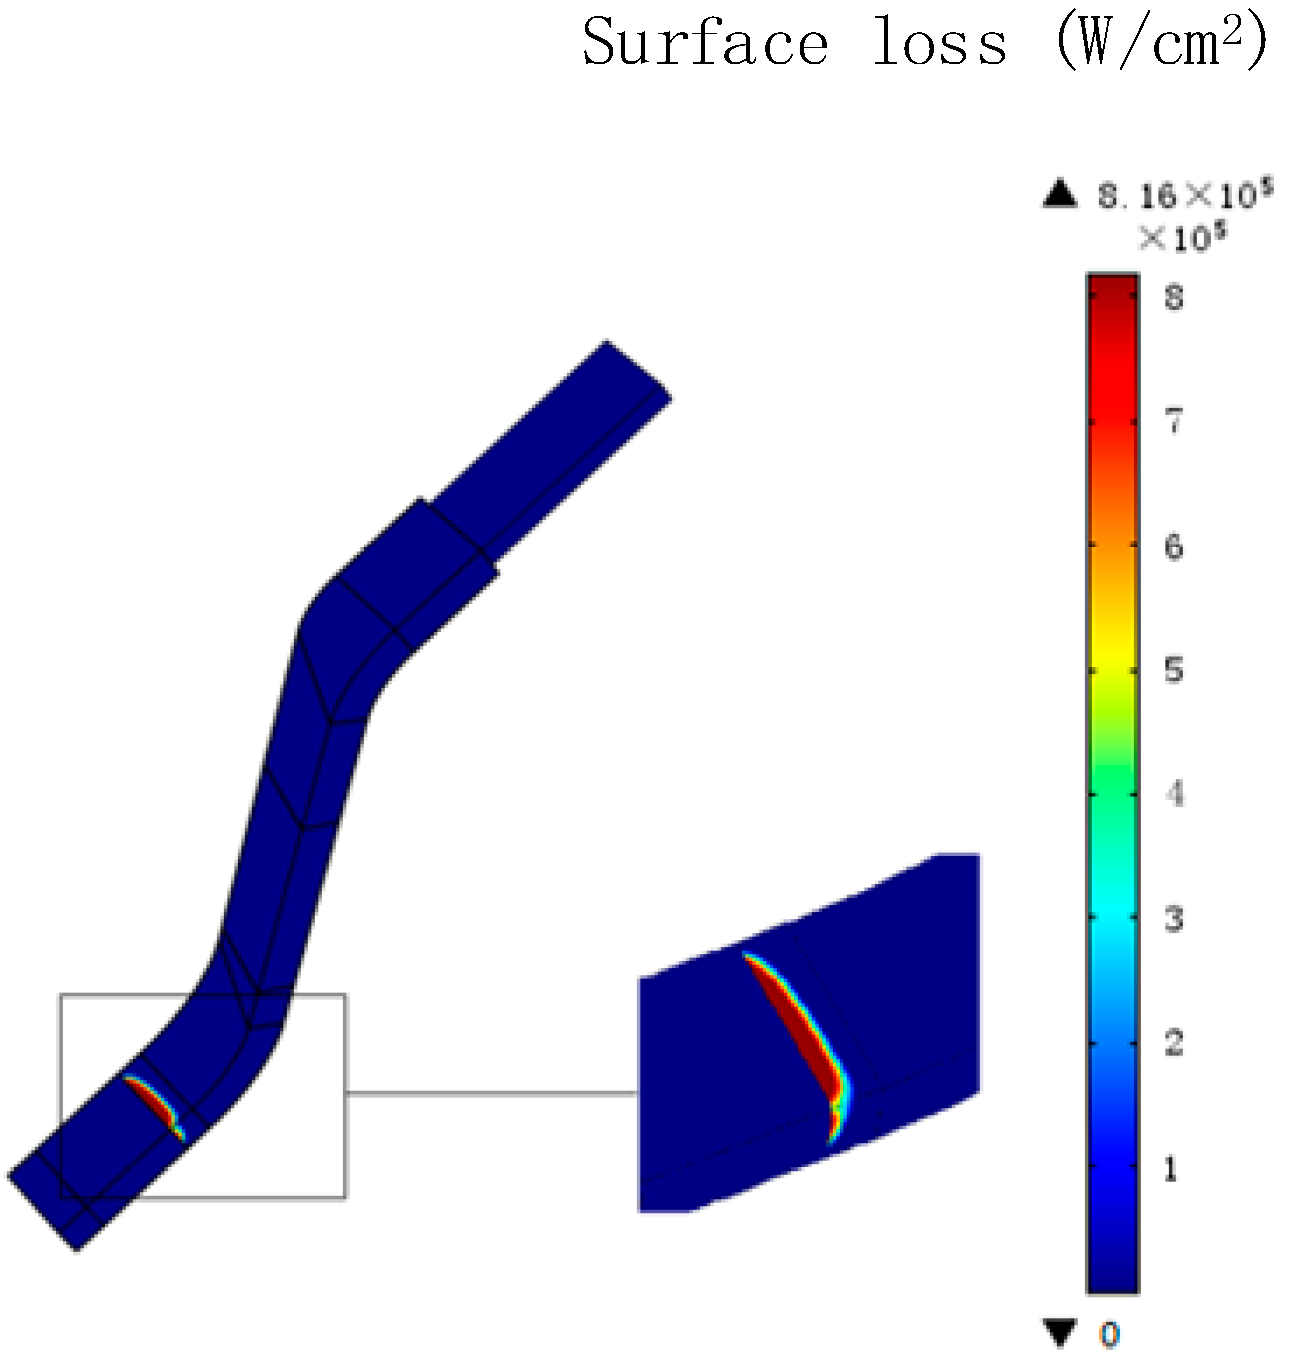
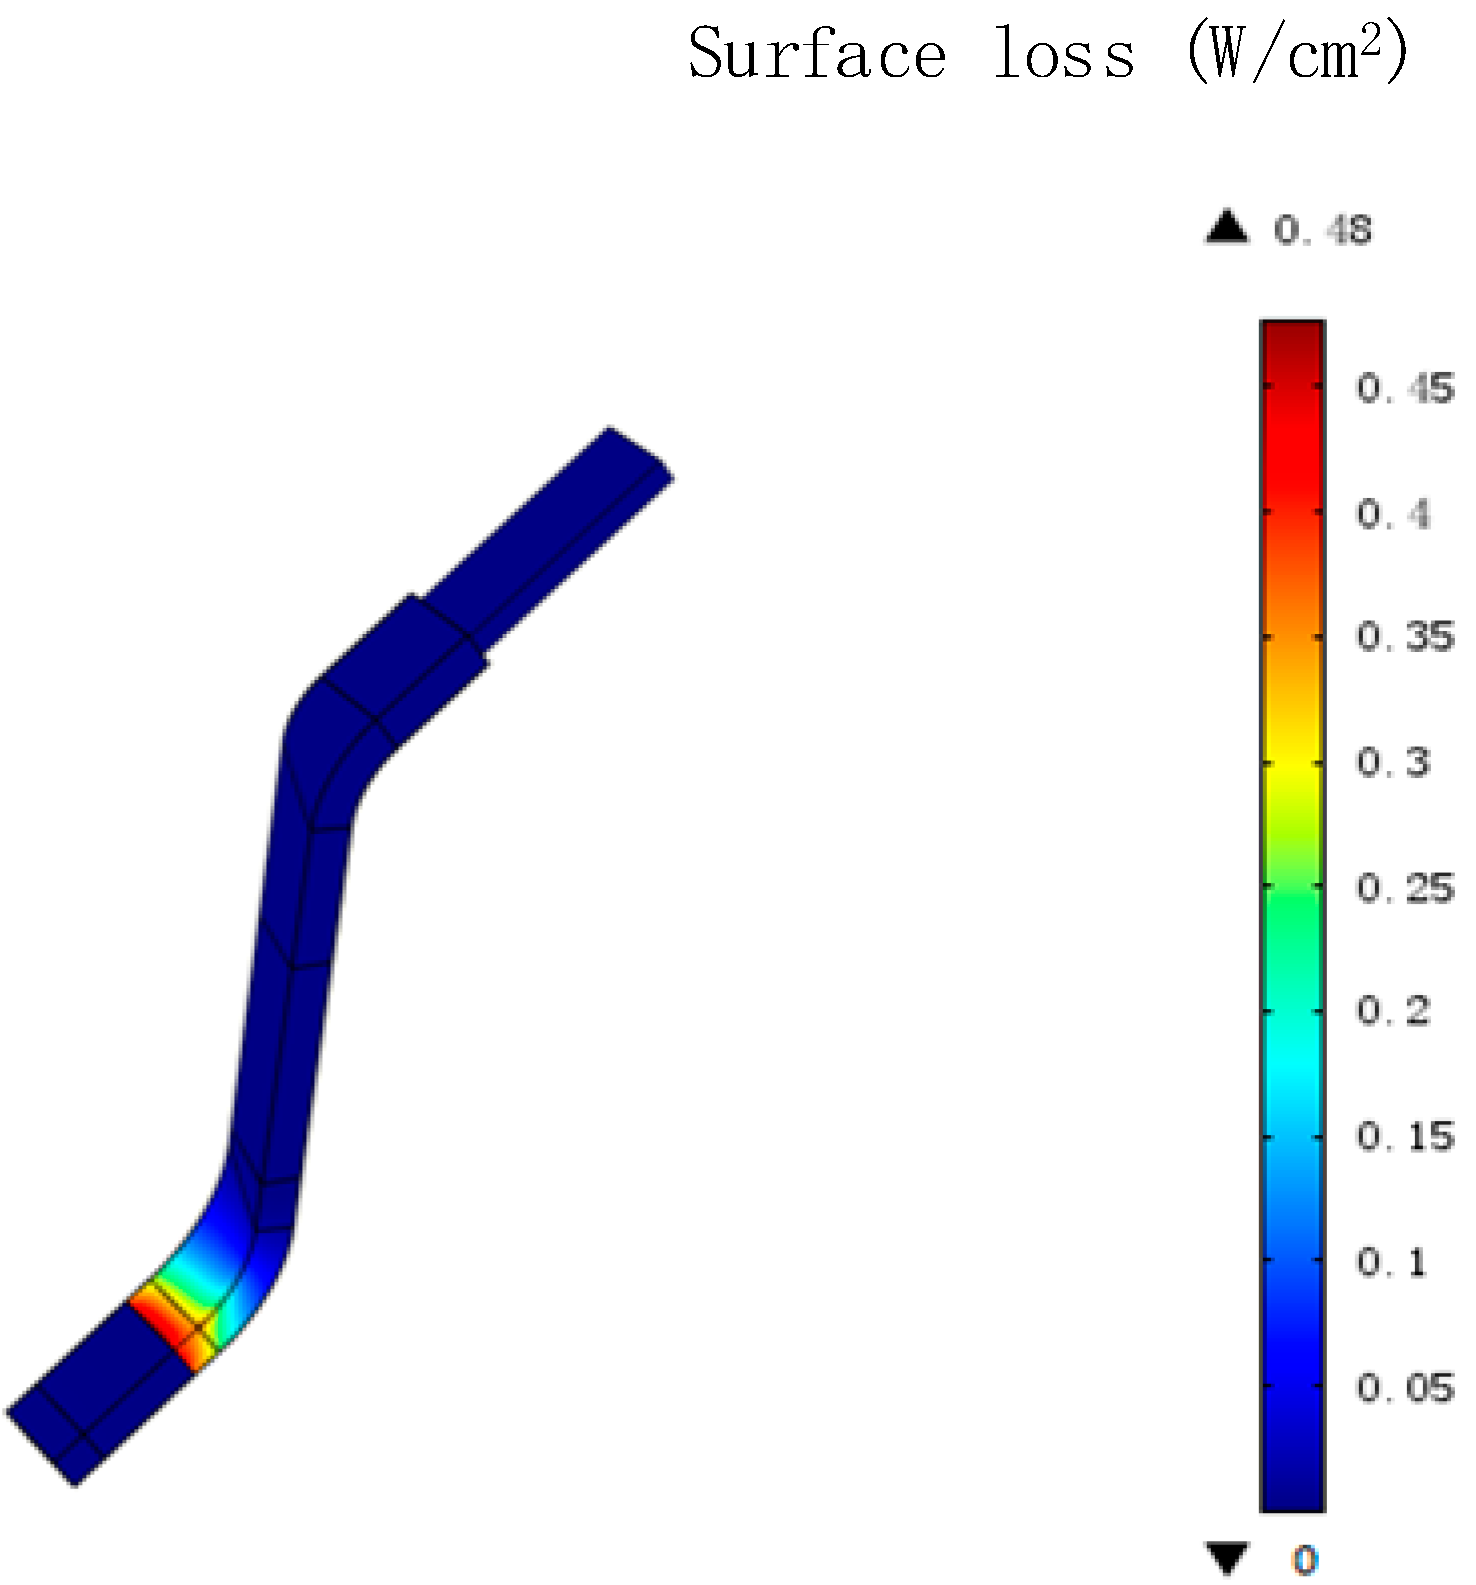
3.2.2. Influence of the Nonlinear Corona Protection Material on the Loss Distribution

As shown in Figure 8, the loss of the generator stator is concentrated at the junction close to the outlet, which is between the low and intermediate resistivity sections. The maximum loss was 8.16 × 10⁵ W/cm2, which was sufficient to cause damage to the insulation of the stator bar and to heat up and damage the stator bar.
According to Figure 9 and Figure 10, the loss was effectively reduced when nonlinear corona protection was applied. The higher loss was primarily located at the inside of the narrow side of the corner, where the temperature was higher than that at the broad side. For the two-segment corona protection structure, the loss was concentrated at the corner of the circular arc, and the highest loss was 2.06 W/cm2. There was no loss at the corner for the three-segment corona protection structure, and the highest loss value decreased to 0.48 W/cm2, which is one order of magnitude less than that of the two-segment nonlinear corona structure. In addition, there was no observed loss concentrated at the junction between the medium and medium-high resistivity sections.
Based on the above analysis, the distribution of the electric field and the surface loss in the three-segment nonlinear corona protection structure were more uniform than those in the two-segment nonlinear corona protection and the linear structures. Thus, the three-segment anti corona structure should be adopted at the end of a large generator as this structure was found to effectively reduce the maximum field strength and surface loss at the end of the stator bar.

4. Design of an Ideal Corona Protection Structure at the End of the Stator Bar

The design of the corona protection structure at the end of the stator bar is critical. If the design is inadequate, breakdowns and/or flashovers can easily occur on the surface of the corona protection layer. The main factors that affect the electric field strength and loss distribution at the end of the stator bar are the rotation angle, length of the various halo layers, inherent resistivity of the corona protection material, and nonlinear coefficient. In this section, an ideal corona protection performance structure is designed based on numerical calculations. The structure is then optimized by varying the key design parameters. Although only one bar is taken as an example, the optimization result is applicable to all stator bars, because the geometry of all stator bars is the same in the structure of a large generator.
As recommended by the large generator research institute, when the altitude is not more than 1000 m and the ambient air temperature is between −15 °C and 40 °C [29], in order to ensure that the generator does not experience corona discharge during operation, it should meet the following requirements when running at the rated voltage [30]:
(1)
The electric field intensity should not be higher than 3.1 kV/cm.
(2)
The maximum surface loss of the corona protection layer should be less than 0.6 W/cm2.
(3)
The termination voltage should be 0 V to prevent flashover from an excessive voltage at the end of the stator bar.

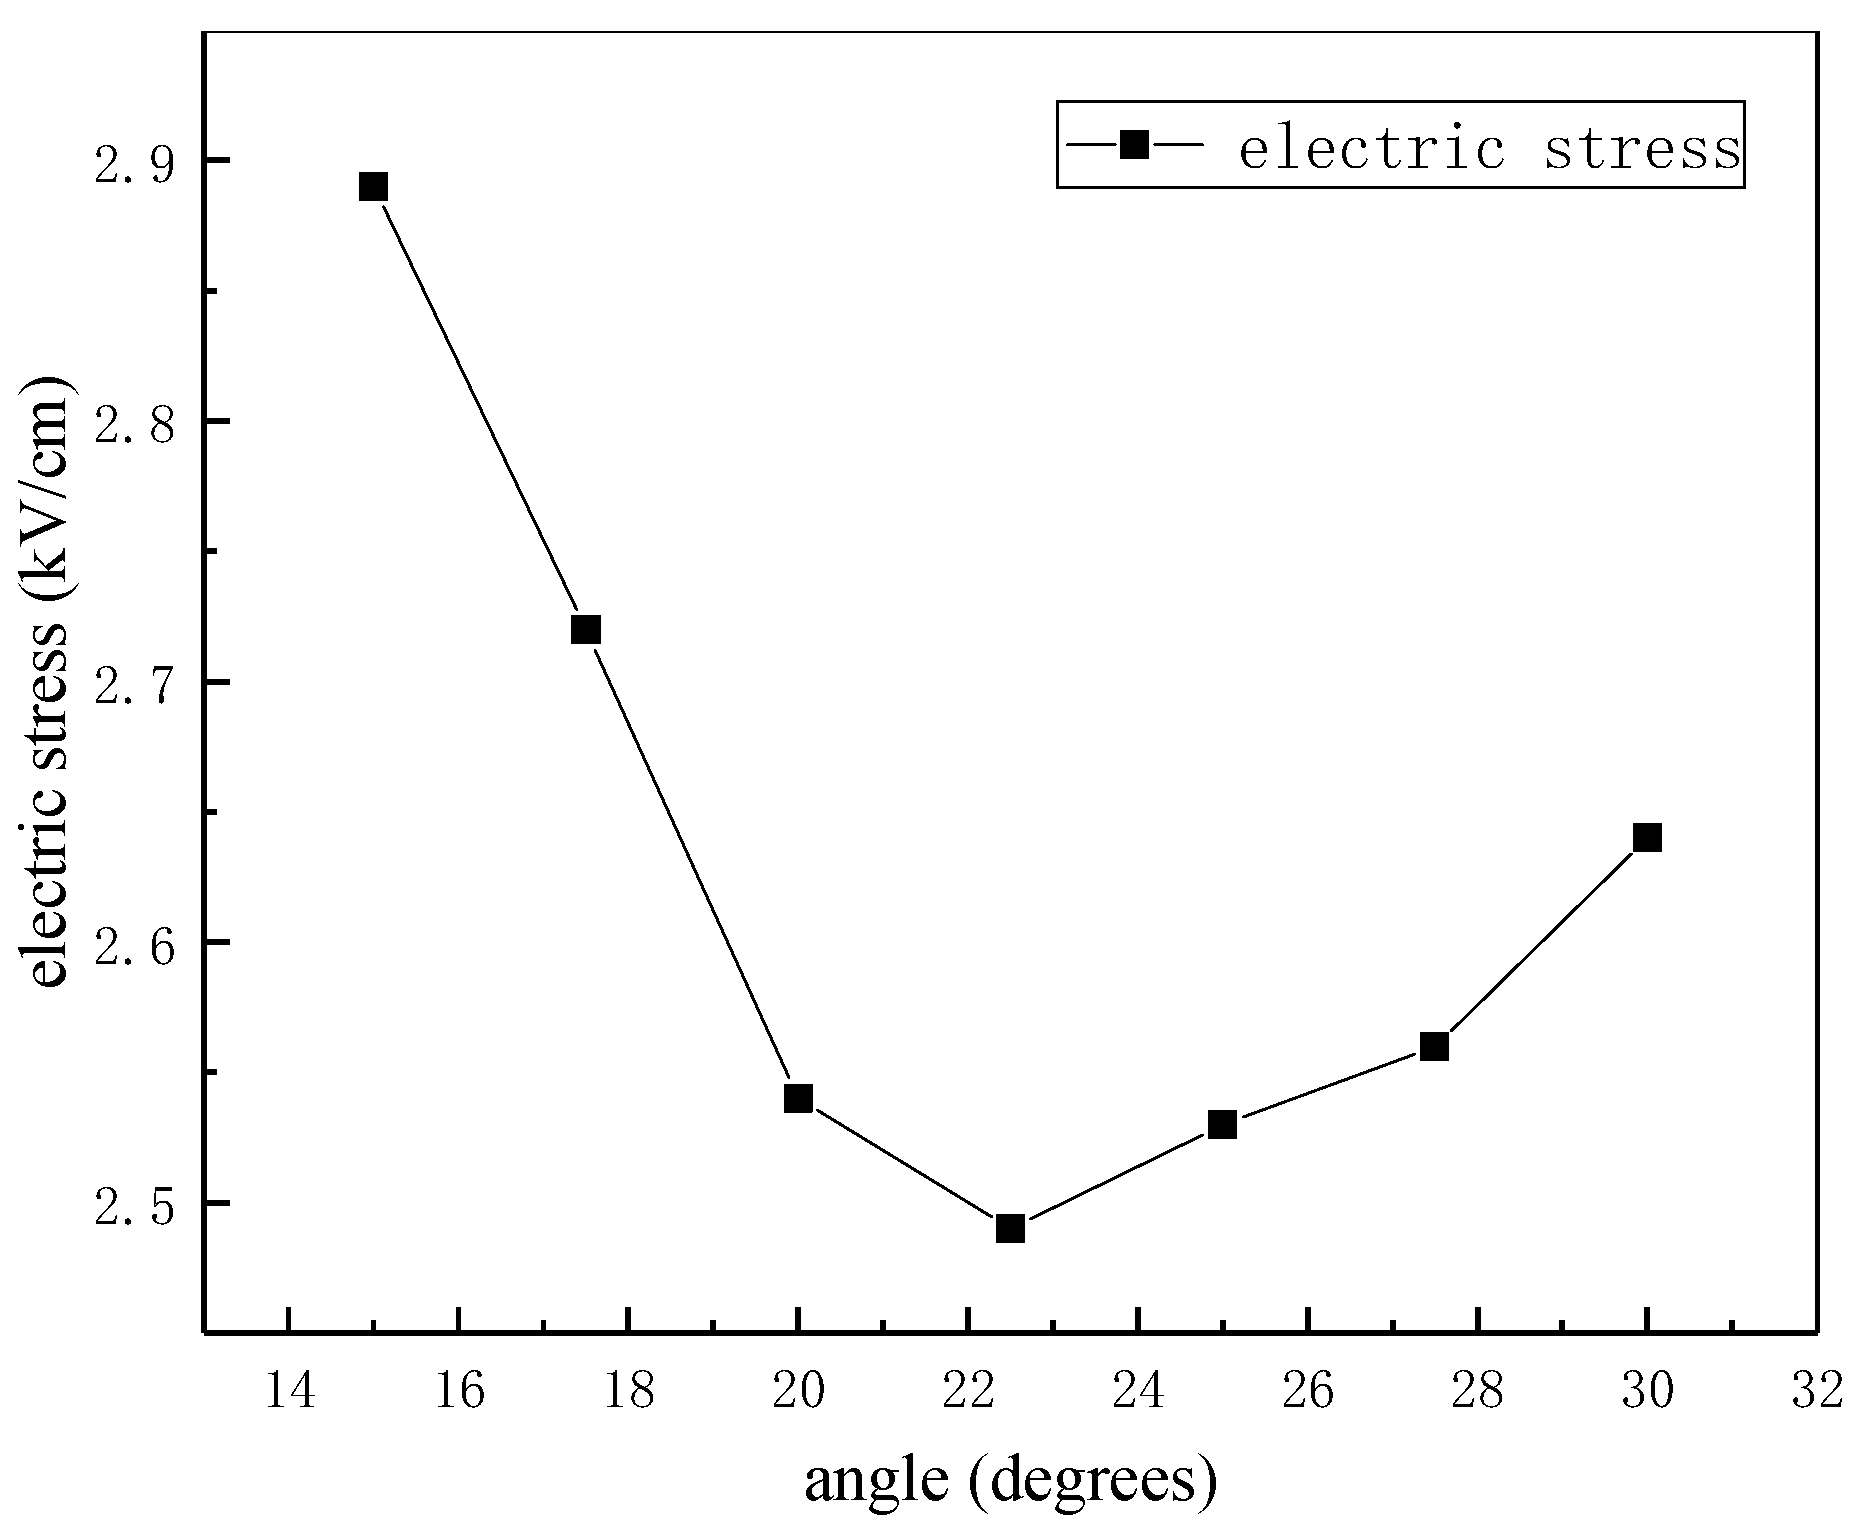
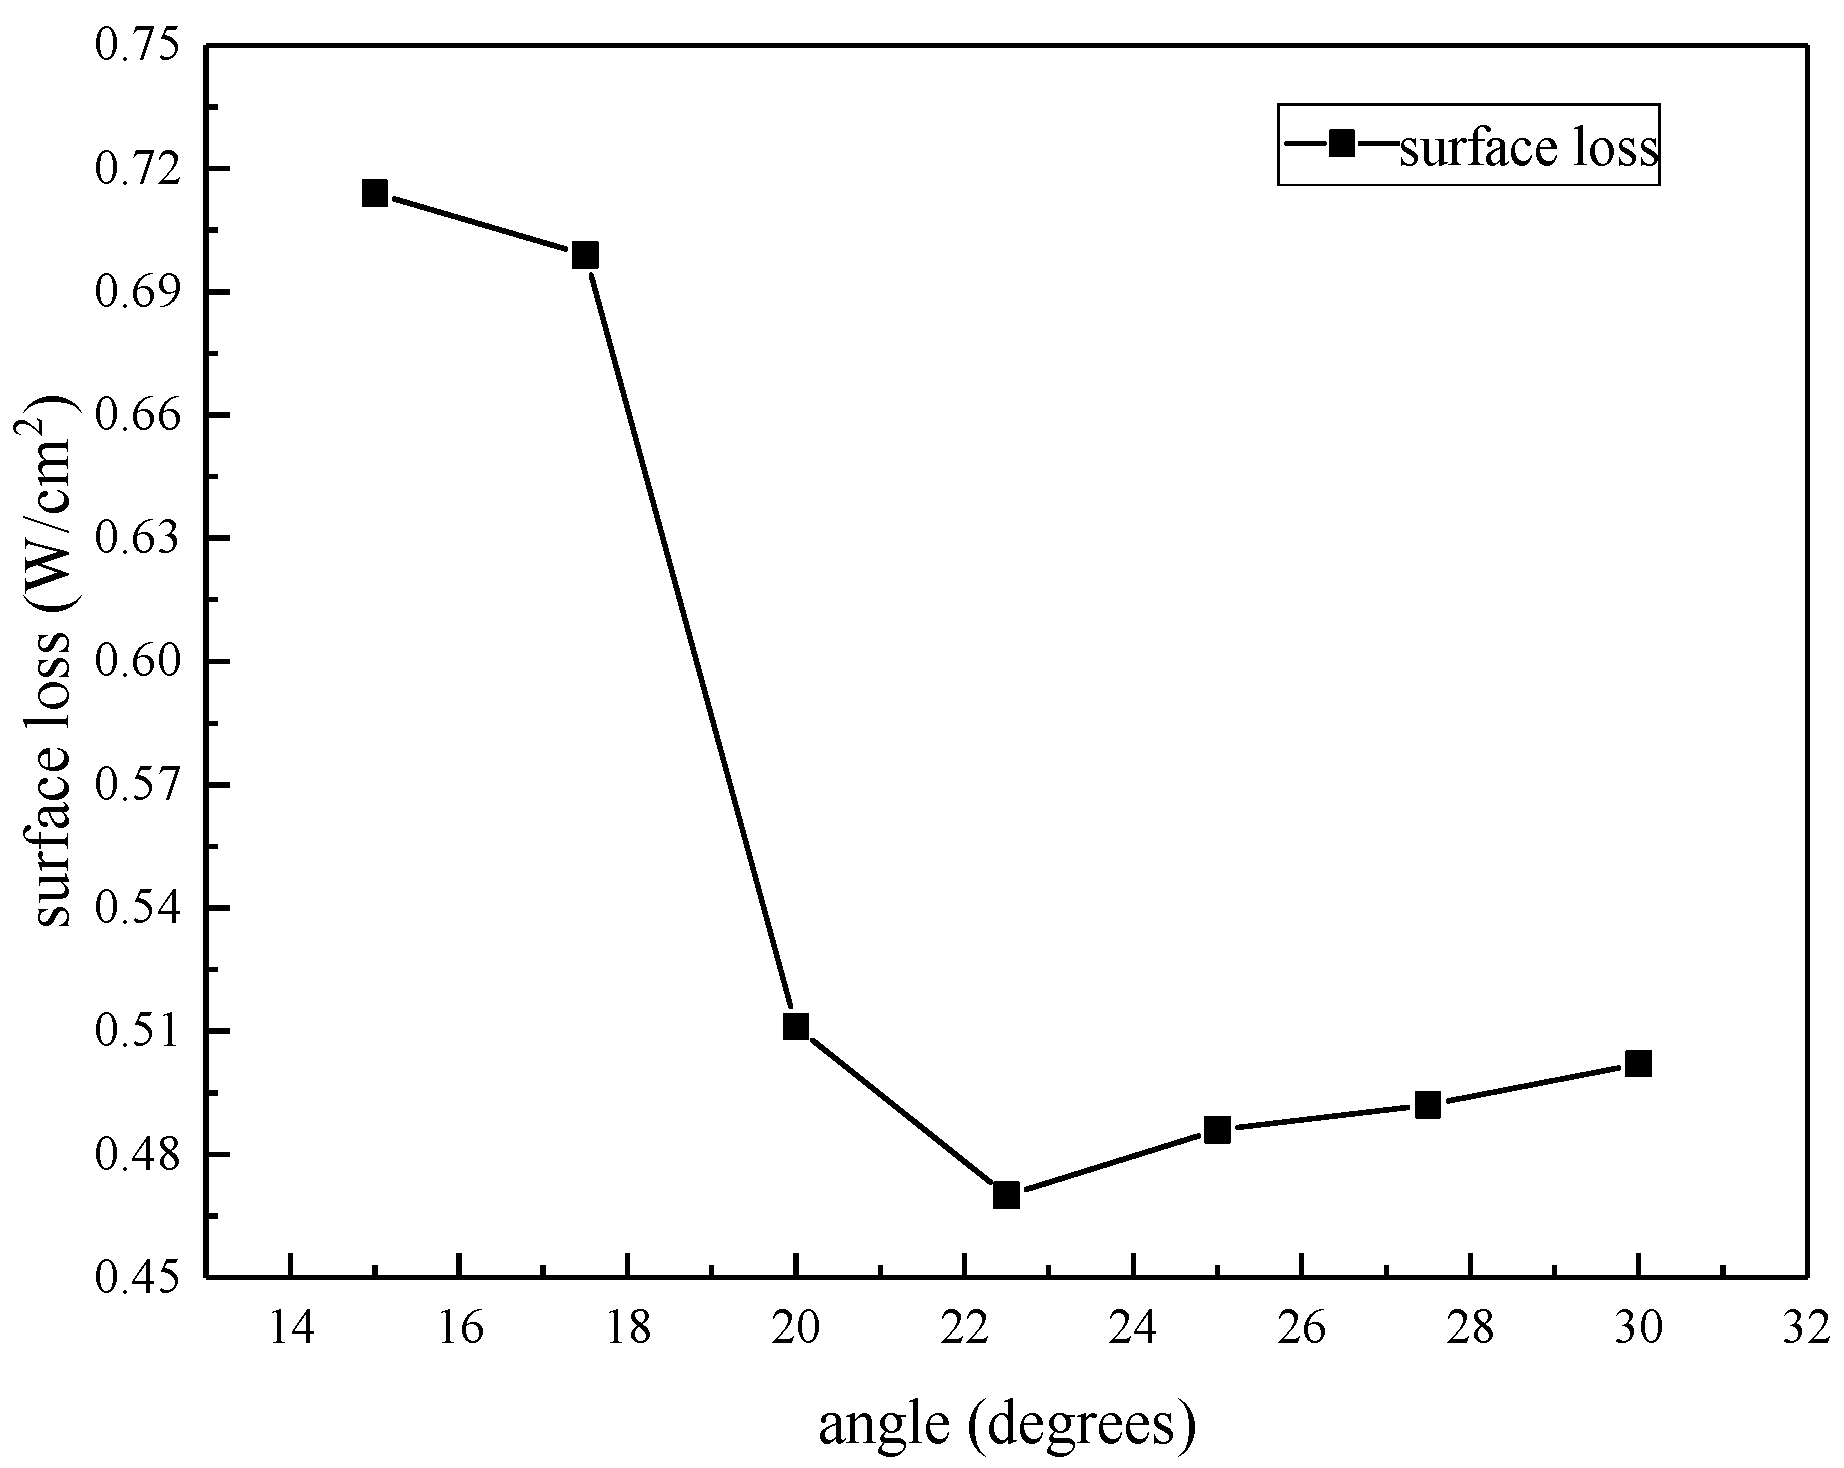
4.1. Influence of the Rotation Angle

If the stator bar is bent, this results in a nonuniformly distributed electric field and increases the corresponding loss. However, an optimal circular arc angle effectively reduces the maximum electric field strength, reduces the size of the generator, and extends the service life of the generator. For these reasons, the choice of circular arc angle is the first step in the design process. A comparison between the electric field and the loss in the stator bars with the same structure and material properties was conducted and COMSOL simulations of the developed model were performed for rotation angles of 15, 17.5, 20, 22.5, 25, 27.5, and 30°. The maximum electric field intensity obtained for the different angles is shown in Figure 11. When the circular arc angle was 15°, the highest electric stress was 2.89 kV/cm, and when the circular arc angle was 22.5°, the electric stress reached a minimum of 2.49 kV/cm. This is a decrease of 13.84% when compared to the value at 17.5°, which indicates that the effects of corona protection at this level are close to ideal.
The maximum loss for each angle is shown in Figure 12. In the figure, it can be seen that the maximum loss of the stator bar was 0.70 W/cm3 at 17.5° and 0.47 W/cm2 at 22.5°, which is a decrease of 32.76%.
The distribution of the electric field was similar to that of the loss, and the maximum values of the electric field and loss were the lowest at a circular arc angle of 22.5°. Based on these results, the optimal circular arc angle was set to 22.5°.

4.2. Influence of the Length of the Corona Protection Layer

In technical terms, the length of the corona protection should be as short as possible. However, it is easy to flashover at the junction between the end of the corona protection and the main insulation. Therefore, the length of the corona layer was adjusted under the condition that the total length of the corona was fixed. The optimum corona protection length was then determined by calculating the maximum field strength and loss. In previous studies, it was determined that the electric field and loss were mainly concentrated at the junction between the low resistivity and medium resistivity areas, and between the medium resistivity and medium-high resistivity areas. Thus, in this study, the effects of the medium resistivity and medium-high resistivity length on the electric stress and loss were of particular concern. The length of each corona protection layer was adjusted by 20 mm. A continuous line was selected on the surface of the corona for reference when measuring the electric field and loss distribution of the rod length along the line. The adjusted medium resistivity and medium-high resistivity corona protection lengths are shown in Table 1.
The maximum electric stress and loss were obtained by calculation and are shown in Figure 13. As shown in the figure, the second scheme was better than the first. In the second scheme, the maximum field strength was 2.44 kV/cm, the maximum loss was 0.43 W/cm2, and the distribution of the electric field and loss was more uniform. In these tests, the lengths of the medium resistivity, medium-high resistivity, and high resistivity layers were 170, 204, and 211 mm, respectively.

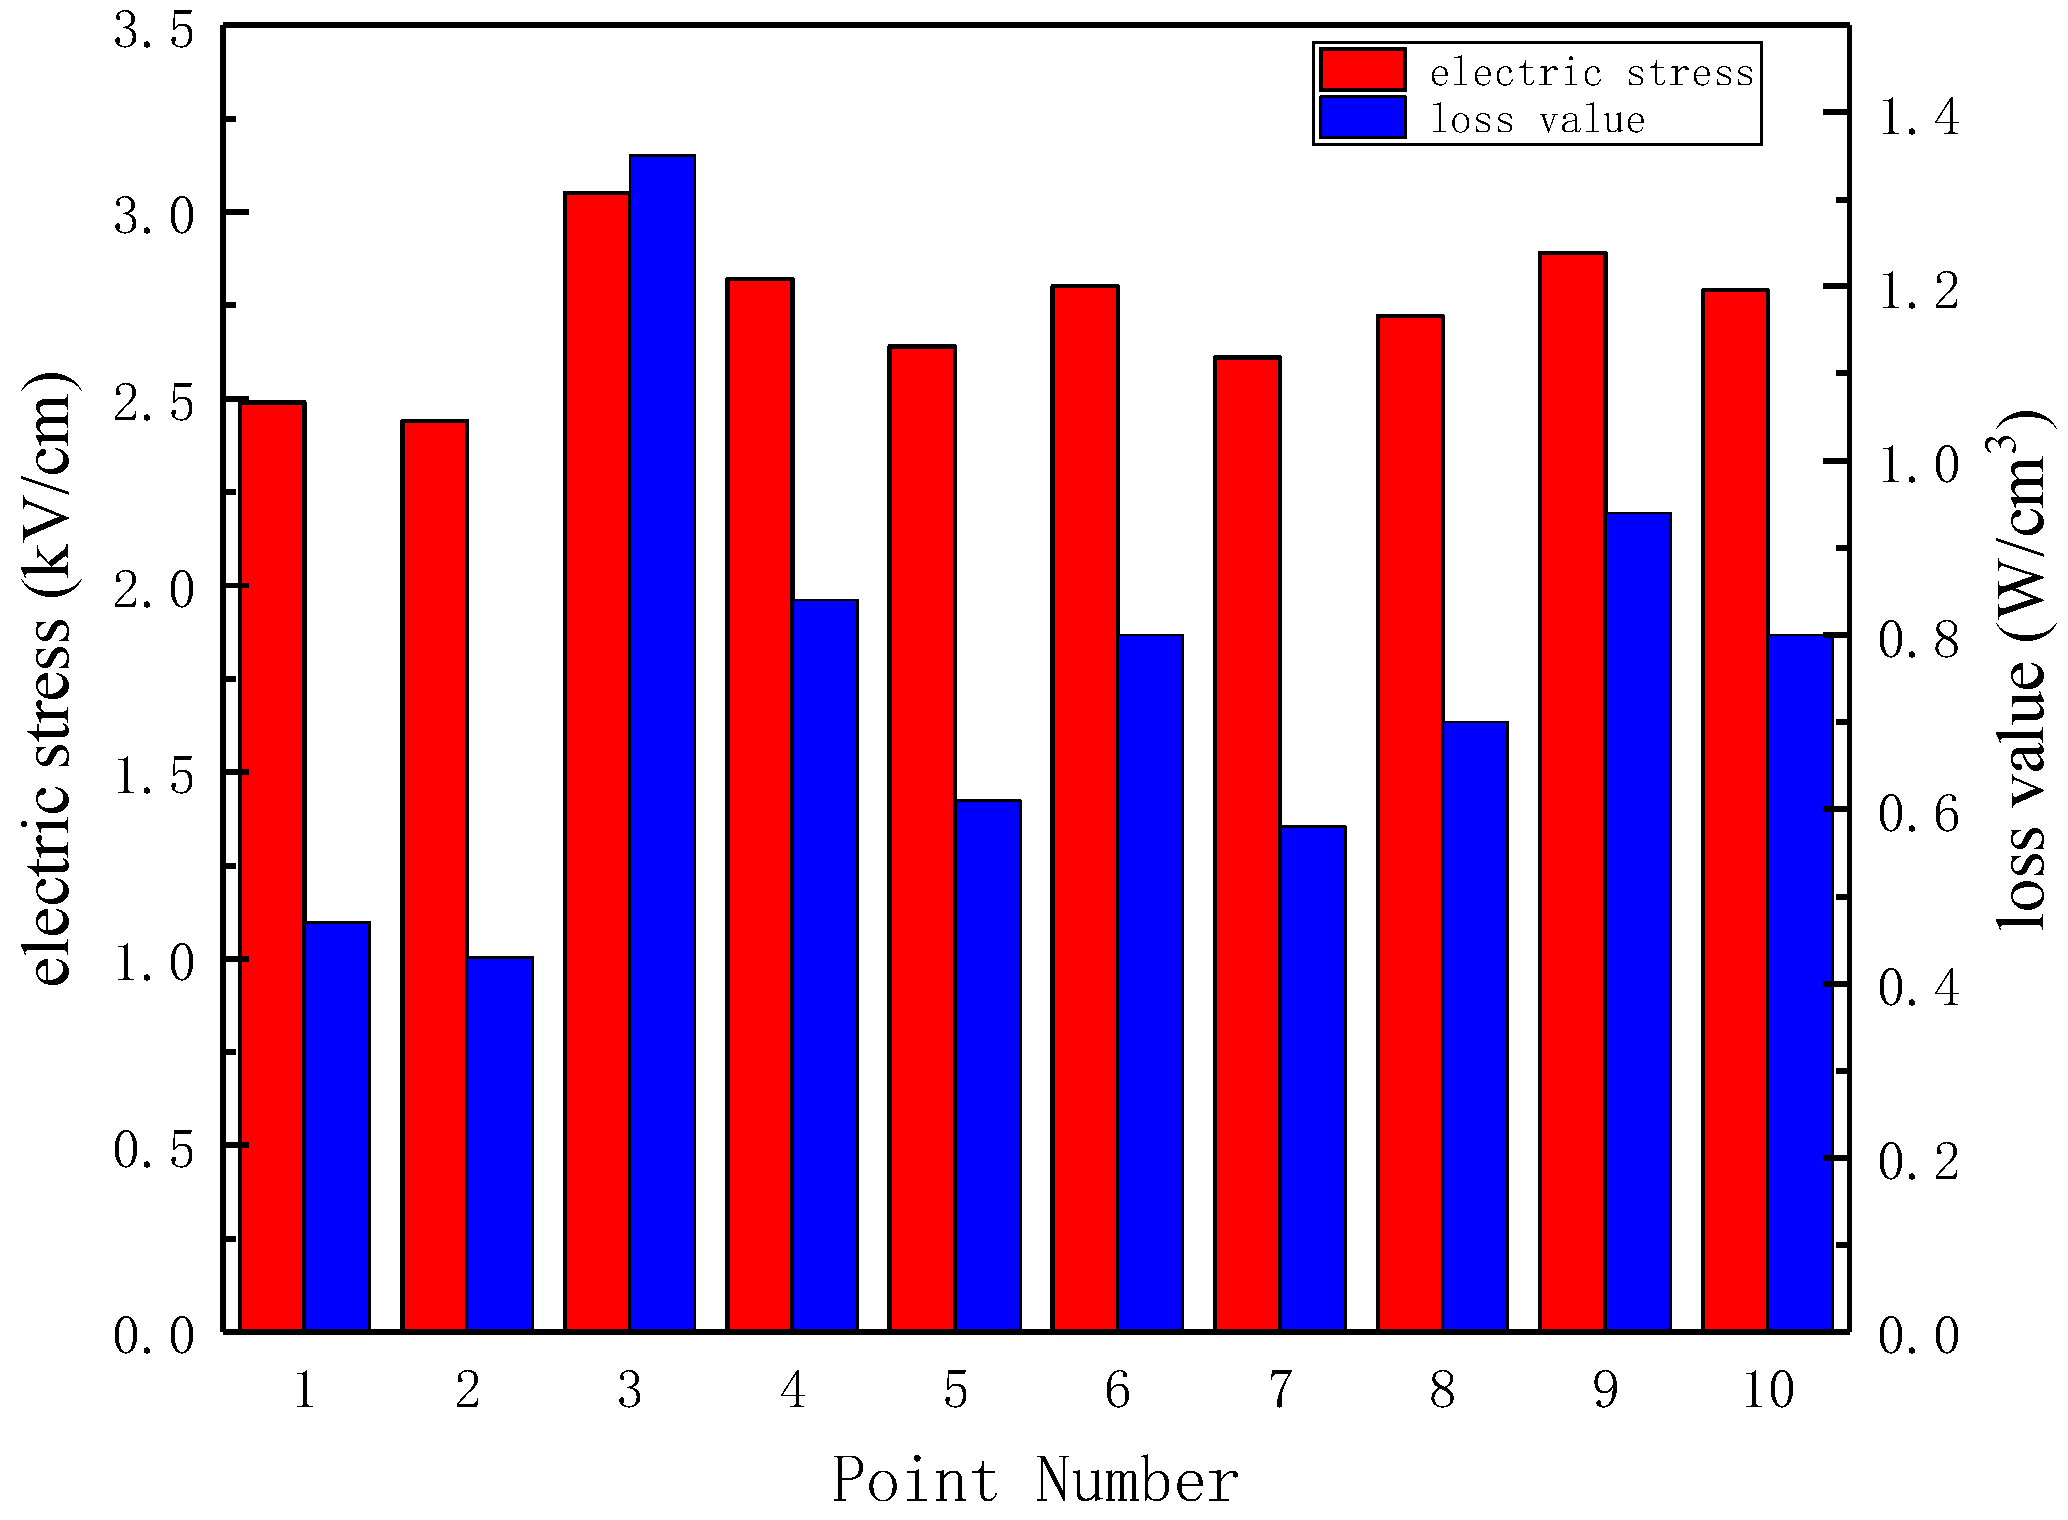
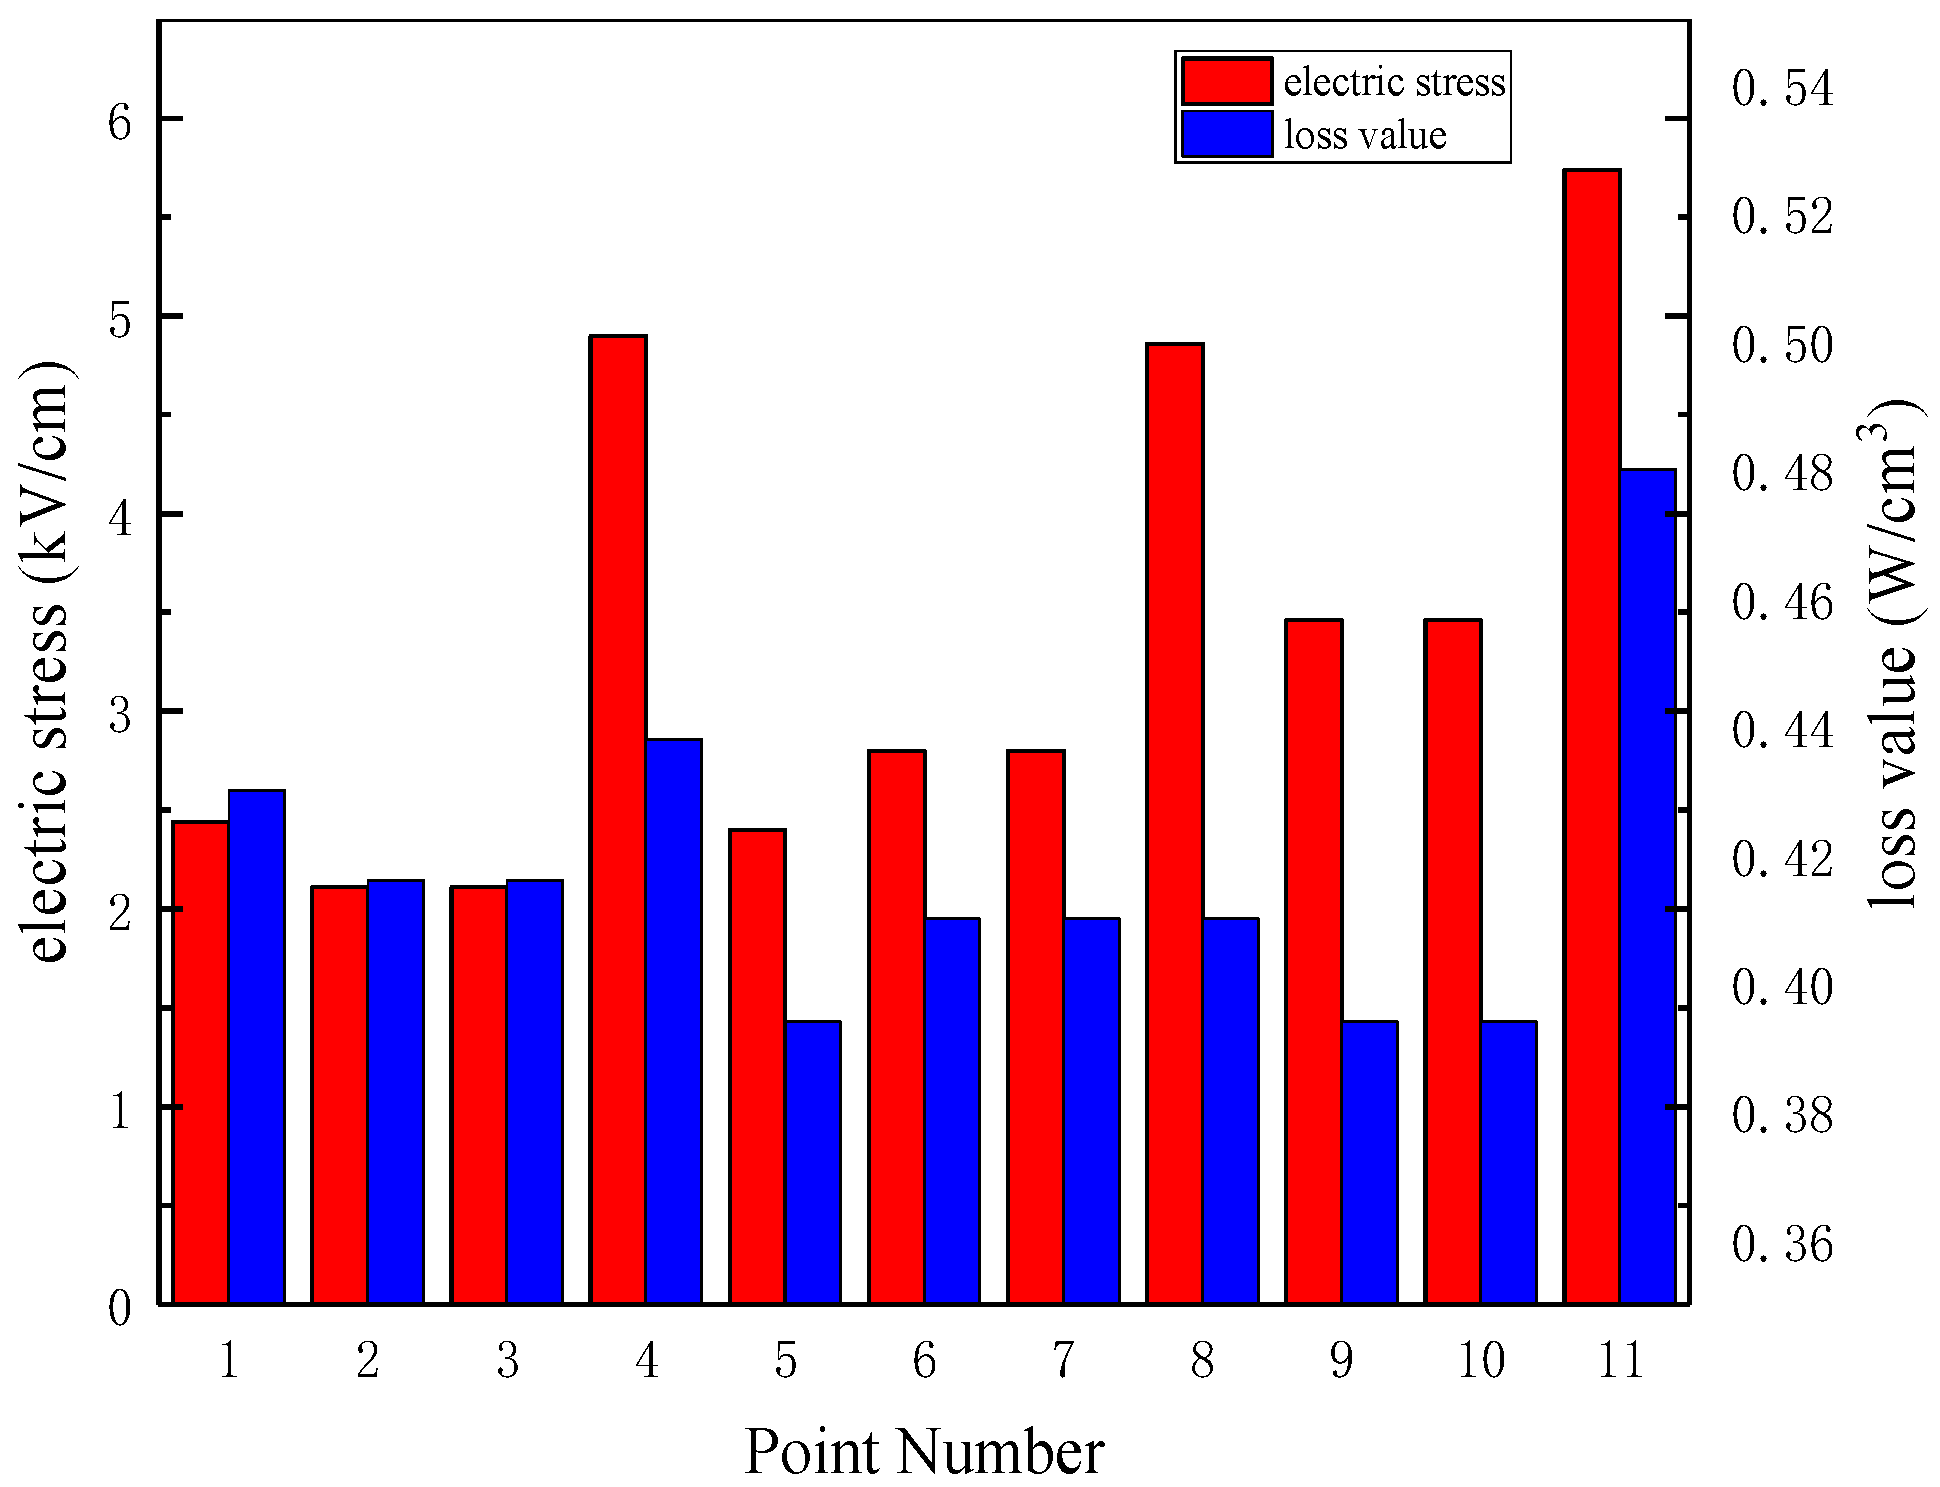
4.3. Influence of the Resistivity

Since the resistivity of the corona protection layer has a significant effect on the electric field and loss distribution, the selection of the resistivity of the corona protection layer material is particularly important. Due to the abrupt change in the resistivity at the overlap of the corona protection layers, the potential suddenly rises and increases the concentration of the electric fields and losses. Therefore, it is essential that the resistivity for all three levels in the corona protection layer are suitably chosen as this can substantially equalize the distribution of the electric field and loss.
According to the actual data provided by the generator factory, the resistivity of the low-resistivity layer was fixed at 0.02 Ω·m and the resistivity of the medium, medium-high, and high resistivity layers ranged from 106 Ω·m to 1014 Ω·m. Based on the second scheme in Table 1, the selected values of the resistivity of the corona protection layers are shown in Table 2.
The maximum field strength and loss were obtained by simulation based on the values in Table 2 and are shown in Figure 14.
The maximum electric stress of the second and third schemes was 2.2 kV/cm, the maximum loss was 0.42 W/cm3, and the electric field distribution for these schemes was the most uniform. These schemes therefore meet the requirements. On the other hand, the maximum loss of the 5th, 9th, and 10th solutions was 0.39 W/cm3, but the maximum electric stress was larger than the allowable range. This was mainly due to the fact that the field strength was primarily concentrated at the connection between the medium and medium-high resistivity layers, and the loss mostly occurred in the medium resistivity area. Therefore, when the resistivity value of the corona protection layer for each level is selected, the resistivity of adjacent corona protection layers should be similar, and the difference should not exceed two orders of magnitude. If the difference reaches three orders of magnitude, the corona protection effect will be significantly reduced. Selection of the resistivity of the medium-resistivity layer is important and should not be set too high; reasonable values are 106 or 107 Ω·m.

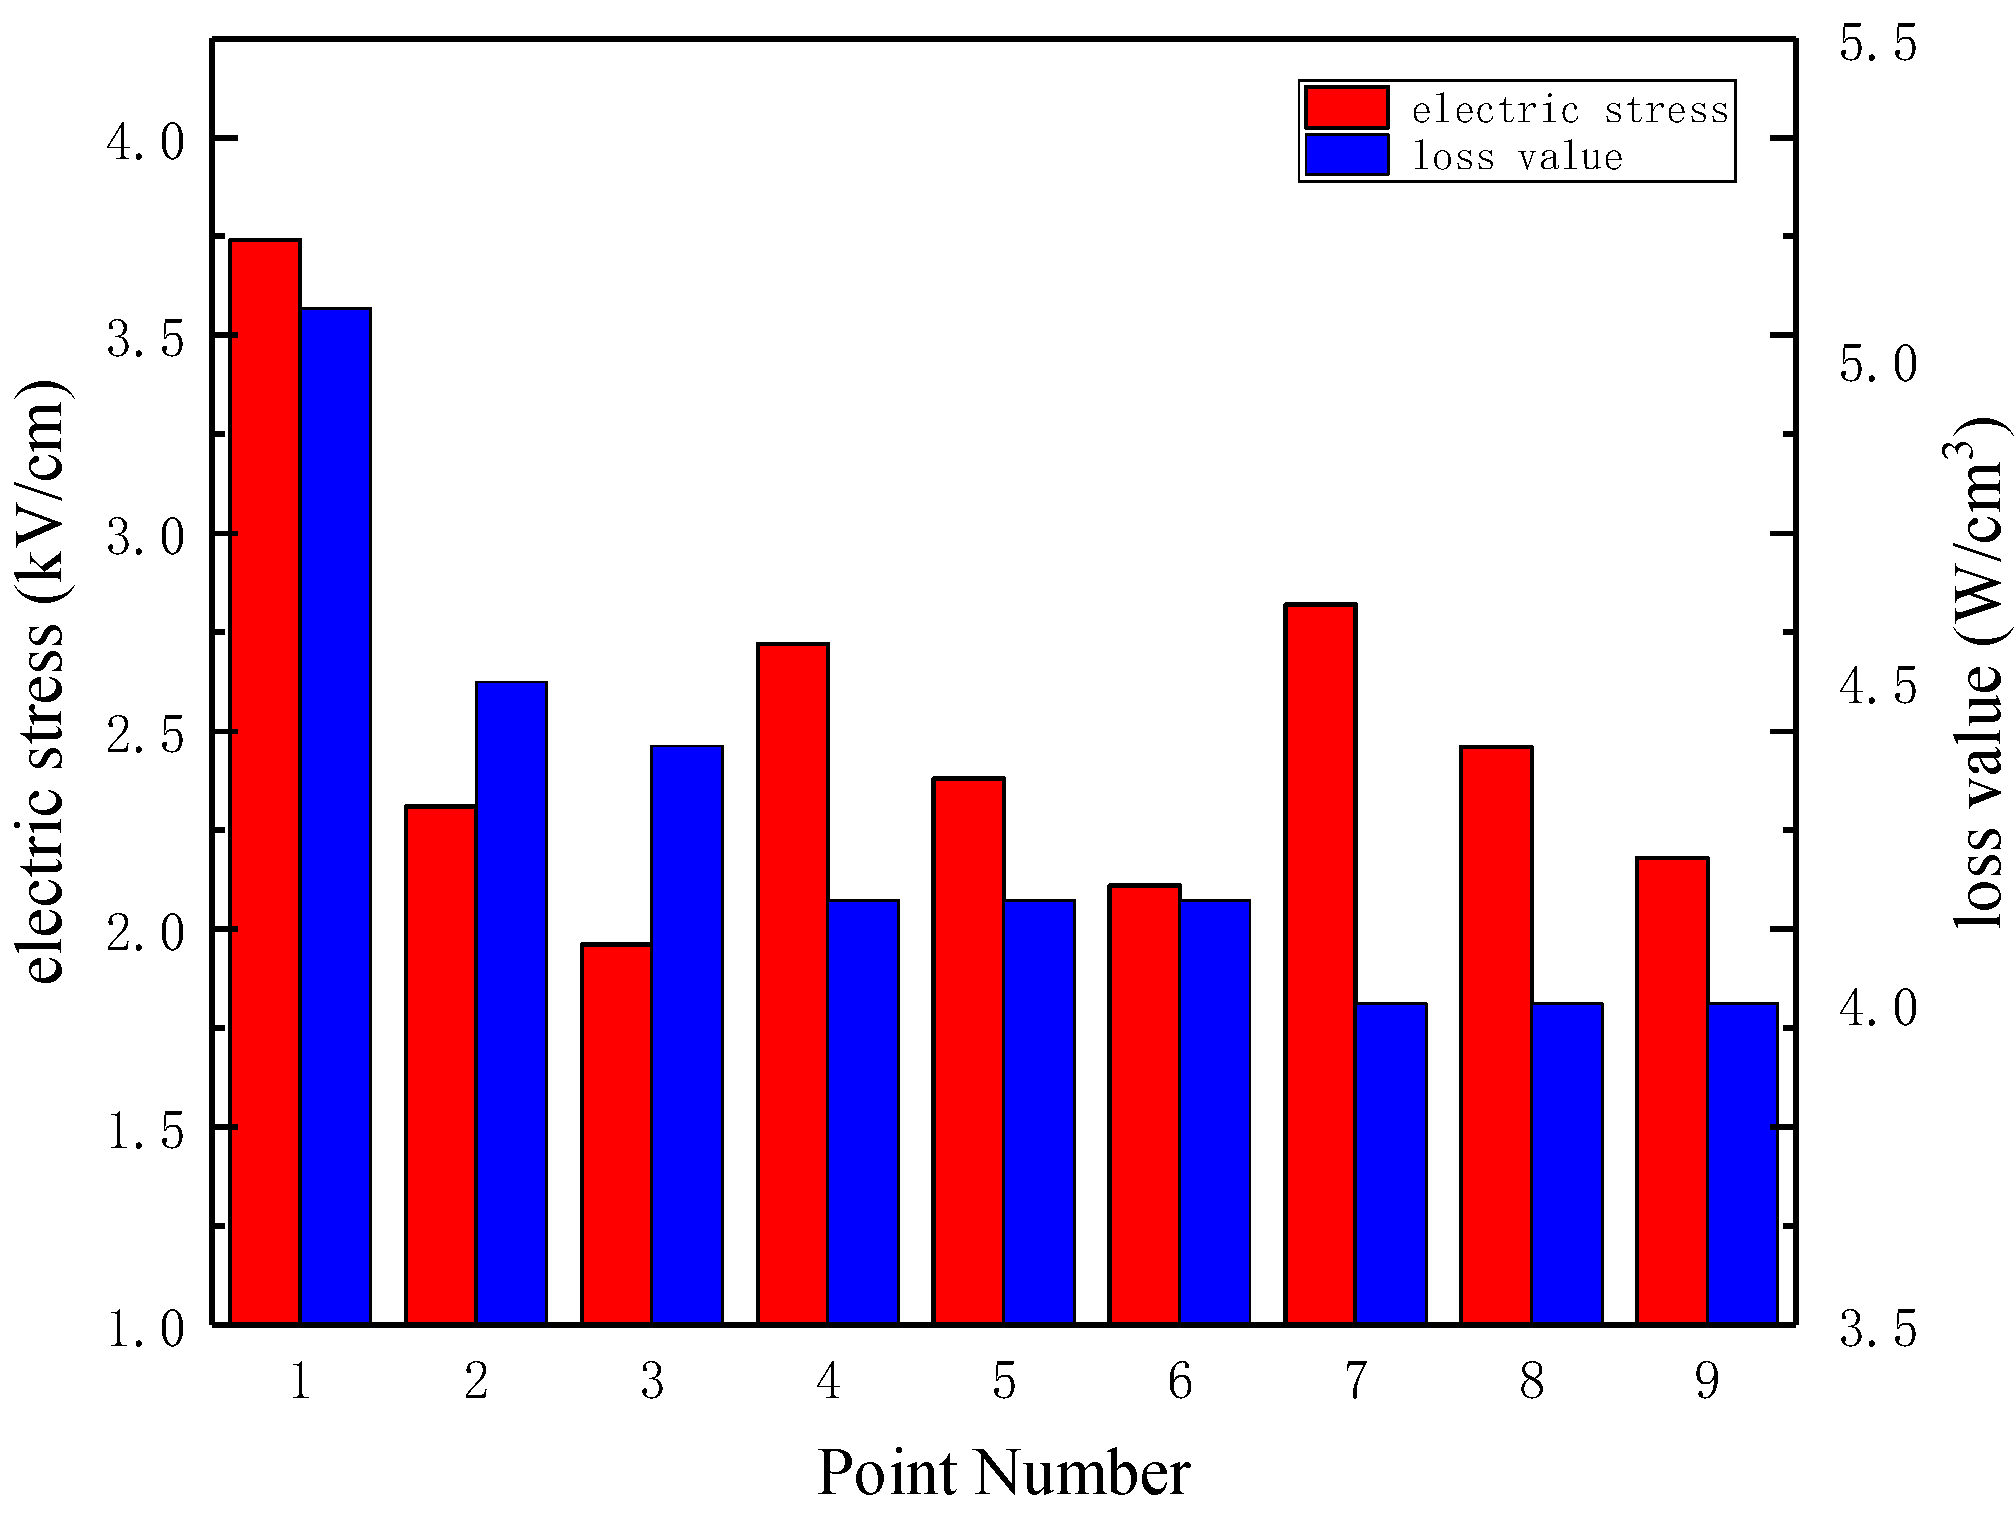
4.4. Influence of the Nonlinear Coefficient

The nonlinear coefficient is also an important corona protection parameter as it directly affects the distribution of the electric field and the loss at the end of the stator bar. To explore the influence of the nonlinear coefficient on the electric field distribution and loss, the second scheme in Table 2 was employed as an example, as shown in Table 3. The first group is a linear corona protection layer.
As listed in Table 3, nine different combinations of nonlinear coefficients were assigned while the remaining parameters were unchanged. The maximum electric stress and loss of the corona protection layer was calculated and are shown in Figure 15.
From Figure 15, it can be seen that when the nonlinear coefficient of the medium-high resistivity layer was 1.2, the corona protection effect exhibited the best performance. As the nonlinear coefficient of the medium resistivity layer increased, the maximum electric stress increased, and the maximum loss decreased. Considering the maximum value of the electric stress and the minimum value of loss, the final selection of the six schemes, namely, the nonlinear coefficients of the medium, medium-high, and high resistivity layers, were 1, 1.2, and 1.2, respectively. Although the maximum electric stress was not the lowest, the center of the electric stress transferred from the junction of the low and medium resistivity layers to the junction between the medium and medium-high resistivity layers, thereby reducing the maximum loss.

5. Conclusions

In this paper, a simulation model was developed using the end of the stator bar in a hydroelectric generator with a rated voltage of 15.75 kV and a rated capacity of 120 MW as an example. In the design process, the angle of the stator bar, and the length, intrinsic resistivity, and nonlinear coefficient of each corona protection layer were optimized, and the electric field and loss distribution at the end of the stator bar were calculated using COMSOL. The conclusions drawn from this study are as follows:
(1)
The angle of the stator bar should not be too large. The best performance was obtained at an angle of 22.5° and the electric field distribution at this angle was the most uniform.
(2)
If the length of the medium resistivity layer is shortened appropriately, the electric field concentration can be transferred from the junction of the low and medium resistivity layers to the junction of the medium and medium-high resistivity layers. In this way, the distribution of the electric field and loss can be effectively homogenized.
(3)
The resistivity of adjacent corona protection layers should be similar and should not exceed two orders of magnitude. If the difference reaches three orders of magnitude, the corresponding corona protection effect will be considerably reduced. The selection of the resistivity of the medium-resistivity layer is important and should not be too high; reasonable values are 106 Ω·m or 107 Ω·m.
(4)
Larger values of the nonlinear coefficient of the medium-high resistivity layer are acceptable as this reduces the maximum electric stress and allows the distribution of the electric field to be more even.

Author Contributions

Conceptualization, H.H.; Data curation, J.G.; Formal analysis, H.H.; Funding acquisition, X.Z.; Investigation, J.G.; Methodology, Y.L.; Software, L.G.; Writing—original draft, H.H.; Writing—review & editing, X.Z.

Funding

This research work is funded by [the National Natural Science Foundation of China] grant number [51577045 and 11801121] and [Natural Science Foundation of Heilongjiang Province of China] grant number [QC2018006].

Conflicts of Interest

The authors declare no conflict of interest.

References

  1. Lu, W.; Jiang, X.; Han, Z. Electric field analysis at the end of large generator stator windings. In Proceedings of the IEEE Bologna Power Tech, Bologna, Italy, 23–26 June 2003. [Google Scholar]
  2. Stone, G.C.; Sedding, H. Detection of stator winding stress relief coating deterioration in conventional and inverter fed motors and generators. In Proceedings of the 2016 International Conference on Condition Monitoring and Diagnosis (CMD), Xi’an, China, 25–28 September 2016; pp. 270–273. [Google Scholar]
  3. Stone, G.C.; Sedding, H.G. In-service evaluation of motor and generator stator windings using partial discharge tests. In Proceedings of the Industry Applications Society Annual Meeting, Toronto, ON, Canada, 2–8 October 1993. [Google Scholar]
  4. Stone, G.C.; Sasic, M.; Dunn, D. Motor and generator windings. IEEE Ind. Appl. Mag. 2011, 17, 29–36. [Google Scholar] [CrossRef]
  5. Stone, G.C.; Stranges, M.K.W.; Dunn, D.G. Recent developments in IEEE and IEC standards for off-line and on-line partial discharge testing of motor and generator stator windings. In Proceedings of the IEEE Petroleum and Chemical Industry Technical Conference (PCIC), San Francisco, CA, USA, 8–10 September 2014. [Google Scholar]
  6. Malamud, R.; Cheremisov, I. Anti-corona protection of the high voltage stator windings and semi-conductive materials for its realization. In Proceedings of the Conference Record of the 2000 IEEE International Symposium on Electrical Insulation, Anaheim, CA, USA, 5 April 2000; pp. 32–35. [Google Scholar]
  7. Espino-Cortes, F.P.; Cerney, E.A.; Jayaram, S. Effectiveness of stress grading coatings on form wound stator coil ground wall insulation under fast rise time pulse voltages. IEEE Trans. Energy Convers. 2005, 20, 844–851. [Google Scholar] [CrossRef]
  8. Emery, F.T. Partial discharge, dissipation factor, and corona aspects for high voltage electric generator stator bars and windings. IEEE Trans. Dielectr. Electr. Insul. 2005, 12, 347–361. [Google Scholar] [CrossRef]
  9. Stone, G.C.; Warren, V. Objective methods to interpret partial discharge data on rotating machines. In Proceedings of the Conference Record of 2005 Annual Pulp and Paper Industry Technical Conference, Jacksonville, FL, USA, 20–23 June 2005; pp. 115–120. [Google Scholar]
  10. Roberts, A. Stress grading for high voltage motor and generator coils. IEEE Electr. Insul. Mag. 1995, 11, 26–31. [Google Scholar] [CrossRef]
  11. Pan, Y.; Sun, Y.; Liu, Y.; Chen, Y. Research progress in anti-corona technology of stator bar and winding for large generator. Insul. Mater. 2017, 50, 1–5. [Google Scholar]
  12. Malamud, R.; Cheremisov, I.; Shumovskaya, G.; Stepanova, T. The principles of obtaining stable semiconducting compositions and reliable anti-corona designs for high voltage windings. In Proceedings of the 2009 IEEE Electrical Insulation Conference, Montreal, QC, Canada, 31 May–3 June 2009; pp. 91–95. [Google Scholar]
  13. Zhou, K.; Pries, J.; Hofmann, H. Computationally efficient 3-D finite-element-based dynamic thermal models of electric machines. IEEE Tran. Transp. Electrif. 2015, 1, 138–149. [Google Scholar] [CrossRef]
  14. Sui, X.; Huang, Y.; Chai, X.; Wang, G. 3D finite element analysis of the electric field generated by epi-retinal MEMS electrodes. In Proceedings of the 2012 IEEE Biomedical Circuits and Systems Conference (BioCAS), Hsinchu, Taiwan, 28–30 November 2012; pp. 37–41. [Google Scholar]
  15. Ren, C.; Yan, P.; Wang, J. Study on corona discharge of winding cables in linear motor. In Proceedings of the 2007 Annual Report—Conference on Electrical Insulation and Dielectric Phenomena, Vancouver, BC, Canada, 14–17 October 2007; pp. 542–544. [Google Scholar]
  16. Zhang, J.F.; Zhao, C.; Li, H.; Tao, W. 3D numerical simulation of heat transfer of a heated plate under the electric field generated by a needle electrode. Math. Probl. Eng. 2014, 2014, 354180. [Google Scholar] [CrossRef]
  17. Sun, Y.; Chunxiu, H.U.; Liu, D. Finite element study of electric fields on stator bar anti-corona layer for large generator. Larg. Electr. Mach. Hydraul. Turbine 2012, 3, 5–8. [Google Scholar]
  18. Abedalla, Y. FEM Modeling of Non-Linear Electrical Field Grading for Rotating Machine Windings; Royal Institute of Technology: Stockholm, Sweden, 2008. [Google Scholar]
  19. Hu, C.; Zhao, Y.; Hou, H. 600 mesh silicon carbide corona protection varnish with epoxy/OMMT nano-composite adhesive. J. Wuhan Univ. Technol. 2016, 31, 166–169. [Google Scholar] [CrossRef]
  20. Taylor, N.; Edin, H. Stator end-winding currents in frequency-domain dielectric response measurements. IEEE Trans. Dielectr. Electr. Insul. 2010, 17, 1489–1498. [Google Scholar] [CrossRef]
  21. Wen, K.; Zhou, Y.J.; Fu, J.; Jin, T. A calculation method and some features of transient field under polarity reversal voltage in HVDC insulation. IEEE Trans. Power Deliv. 1993, 8, 223–230. [Google Scholar] [CrossRef]
  22. Nabipour-Afrouzi, H.; Abdul-Malek, Z.; Vahabi-Mashak, S. Study on effect of size and location of void on electric field and potential distributions in stator bar insulation with finite-element-model. Life Sci. J. 2013, 10, 2036–2041. [Google Scholar]
  23. Guo, X.; Zhang, Q.; Zhang, J. Improvement of corona discharge model and its application on simulating corona discharge in the presence of wind. Math. Probl. Eng. 2017, 2017, 9853439. [Google Scholar] [CrossRef]
  24. Zhou, C.; Bian, X.; Liang, Y.; Zong, R. Numerical calculation and analysis of temperature field for stator transposition bar in hydro-generator. Int. J. Therm. Sci. 2018, 125, 350–357. [Google Scholar] [CrossRef]
  25. Zohdi, T.L.; Abali, B.E. Modeling of power transmission and stress grading for corona protection. Comput. Mech. 2018, 62, 1–10. [Google Scholar] [CrossRef]
  26. Taylor, N. Measured and modeled capacitance, loss and harmonics in stator insulation with nonlinear stress control. IEEE Trans. Dielectr. Electr. Insul. 2015, 22, 3133–3145. [Google Scholar] [CrossRef]
  27. Haque, S.M.; Rey, J.A.A.; Masúd, A.A. Electrical properties of different polymeric materials and their applications: The influence of electric field. In Properties and Applications of Polymer Dielectrics; InTech: Haverhill, MA, USA, 2017. [Google Scholar]
  28. Staubach, C.; Hildinger, T.; Staubach, A. Comprehensive electrical and thermal analysis of the stress grading system of a large hydro generator. IEEE Electr. Insul. Mag. 2018, 34, 37–49. [Google Scholar] [CrossRef]
  29. International Electrotechnical Commission. Standard IEC 60034 on Rotating Electrical Machines; International Electrotechnical Commission: Geneva, Switzerland, 2017. [Google Scholar]
  30. Zhao, X.X.; Shi, X.F.; Xin, H.E. The corona protective materials and design of VPI electric machines. Electr. Mach. Control 2000, 12, 251–254. [Google Scholar]
Figure 1. Photograph of a stator bar end: (a) Stator bar end structure of a large hydro generator; (b) Stator bar.
Energies 11 02510 g001
Figure 2. Three-dimensional end model of a stator bar.
Energies 11 02510 g002
Figure 3. Schematic of the overlapping structure of a corona protection layer.
Energies 11 02510 g003
Figure 4. Electric field distribution of the linear corona protection structure.
Energies 11 02510 g004
Figure 5. Electric field distribution of the two-segment nonlinear corona protection structure.
Energies 11 02510 g005
Figure 6. Electric field distribution of the three-segment nonlinear corona protection structure.
Energies 11 02510 g006
Figure 7. Electric field distribution of nonlinear corona protection coating at rated voltage of 20 kV [28].
Energies 11 02510 g007
Figure 8. Surface loss distribution of the linear corona protection layer.
Energies 11 02510 g008
Figure 9. Surface loss distribution of the two-segment nonlinear corona protection layer.
Energies 11 02510 g009
Figure 10. Surface loss distribution of the three-segment nonlinear corona protection layer.
Energies 11 02510 g010
Figure 11. Maximum electric stress at various angles.
Energies 11 02510 g011
Figure 12. Maximum loss value at various angles.
Energies 11 02510 g012
Figure 13. Maximum electric stress and loss for various lengths of corona protection layer.
Energies 11 02510 g013
Figure 14. Maximum electric stress and loss for various resistivities of the corona protection layer.
Energies 11 02510 g014
Figure 15. Maximum electric stress and loss versus various values of the nonlinear coefficient of the corona protection layer.
Energies 11 02510 g015
Table 1. Length of the corona protection coating for the medium resistivity layer.
Point NumberCorona Protection Layer
Medium Resistivity Layer (mm)Medium-High Resistivity Layer (mm)High Resistivity Layer (mm)
1170183232
2170204211
3170226189
4170247167
5170269146
6192161232
7213140232
8235118232
925696232
1027875232
Table 2. Resistivity of the corona protection layer for all segments.
Point NumberResistivity of the Corona Protection Layer at All Levels
Medium Resistivity Layer (Ω·m)Medium-High Resistivity Layer (Ω·m)High Resistivity Layer (Ω·m)
11 × 1061 × 1081 × 109
21 × 1061 × 1071 × 109
31 × 1061 × 1071 × 108
41 × 1061 × 1091 × 1010
51 × 1071 × 1081 × 109
61 × 1071 × 1091 × 1010
71 × 1071 × 1091 × 1011
81 × 1071 × 10101 × 1011
91 × 1081 × 1091 × 1010
101 × 1081 × 10101 × 1011
111 × 1091 × 10101 × 1011
Table 3. Value of the nonlinear coefficient.
Point NumberNonlinear Coefficient of the Corona Protection Layer at All Levels
Medium Resistivity Layer (cm/kV)Medium-High Resistivity Layer (cm/kV)High Resistivity Layer (cm/kV)
1------
20.81.01.2
30.81.21.2
41.00.81.2
51.01.01.2
61.01.21.2
71.20.81.2
81.21.01.2
91.21.21.2

