Abstract
The heat transfer in double pipe heat exchangers is very poor. This complicates its application in absorption cooling systems, however, the implementation of simple passive techniques should help to increase the heat and mass transfer mainly in the absorber. This paper carried out a simulation and its experimental comparison of a NH3-H2O bubble absorption process using a double tube heat exchanger with a helical screw static mixer in both central and annular sides. The experimental results showed that the absorption heat load per area is 31.61% higher with the helical screw mixer than the smooth tube. The theoretical and experimental comparison showed that the absorption heat load difference values were 28.0 and 21.9% for smooth tube and the helical mixer, respectively. These difference values were caused by the calculation of the log mean temperature difference in equilibrium conditions to avoid the overlap of solution temperatures. Therefore, the theoretical and experimental results should be improved when the absorption heat is included in the heat transfer equation or avoiding the operation condition when output is lower than input solution temperature.
1. Introduction
The employment of absorption systems are a sustainable way to be used in air conditioning applications and reduce the electricity consumption in warm and hot climates. However, they are still more expensive and bulkier than vapor compression systems due to the low coefficient of performance caused basically by the thermodynamic properties of the working fluids and the low heat transfer rate in the components.
The design of the heat exchangers is still complicated in the absorption systems, mainly the absorber component. However, there are passive techniques available to increase the heat and mass transfer such as corrugation, microchannels, and finned surfaces, amongst others. Gutulothu et al. [1] presented a review of experimental and theoretical studies related to heat exchangers using passive techniques such as tape inserts or nanoparticles. The study describes the results of the heat transfer enhancement at different Reynolds number, Nusselt number, the concentration of nanofluids, and size of the nanoparticle.
Among studies applying passive techniques in the absorbers component of absorption cooling systems, it was found that Lee et al. [2] analyzed an absorber using a flat plate heat exchanger with NH3-H2O. They concluded that the increase of solution flow rate affected slightly the mass transfer process, but improved the heat transfer process. On the other hand, the heat transfer was improved when the vapor flow rate was increased. The authors proposed an experimental correlation for the dimensionless Nusselt and Sherwood numbers.
Cerezo et al. [3] carried out a theoretical and experimental comparison of an absorber with NH3-H2O using a corrugated plate heat exchanger. The absorber heat load and absorption flux obtained the maximum difference of 11.1 and 28.8% between simulation and experimental data.
R. Cardenas and V. Narayanan [4] studied the NH3-H2O absorption process into a constrained microscale film. The solution flows in a microchannel and the ammonia vapor bubbles were injected in cross flow from a porous wall. The result showed that a lower inlet cooling water temperature affects the absorption rate by increasing the local concentration difference between the saturation and bulk values.
Oronel et al. [5] studied the absorption performance of a plate heat exchanger with NH3-H2O and NH3-(LiNO3 + H2O) mixtures at operating conditions of air-cooled absorption system. The results showed that the mass absorption flux and solution heat transfer coefficient was around 1.3 to 1.6 and 1.4 times higher with ternary than the binary mixture. It was by the lower viscosity achieved with the ternary mixture and the high affinity between ammonia and water.
Amaris et al. [6] compared a tubular bubble absorber with smooth tube and an internally micro-finned tube using NH3-LiNO3 at typical operating conditions for absorption chillers. The results showed that with the use of a microchannel tube an absorption rate 1.7 times higher than a smooth tube was obtained at a flow rate of 40 kg/h, also the absorption mass flow rate increases when tube diameter is reduced and decreases when tube length is increased. Moreover, Amaris et al. [7] analyzed the absorption performance using carbon nanotubes, an internal helical micro-fins and the combination of carbon nanotube and helical micro fins simultaneously in a tubular absorber with NH3-LiNO3. The results obtained a maximum absorption mass flux of 1.64 and 1.48 higher with nanoparticles than smooth tubes at 40 and 35 °C, respectively. The simultaneous effect of nanotubes and advanced surface obtained an important improvement in the absorption mass flux at low solution mass flow values.
Triché et al. [8] studied the NH3-H2O heat and mass transfer process in a falling film absorber with a plate heat exchanger. They obtained a maximal relative error of 15% between numerical and experimental data. Besides they concluded that the mass transfer was controlled by the falling film mass transfer resistance while the liquid heat transfer resistance is negligible.
Membrane contactors have been studied as absorber because the use of polymeric hydrophobic microporous membrane contactors can reduce the manufacturing cost. F. Asfand and M. Bourouis [9] presented a review of this kind of application in absorption systems.
The static mixers have been considered appropriate for the gas-liquid absorption process for a long time now [10]. However, in its understanding, there is a gap corresponding to the studies related to the ammonia-water absorption along static mixers. This is confirmed in a recent static mixers review, in which this application is absent [11]. So, recent air-water and advanced studies in an upward co-current gas-liquid flow along a helical static mixer consider the visualization and quantitative of the dispersive mixing of air in a water flow, as well as its simulations in Computational Fluid Dynamic (CFD) software [12,13]. These studies give details of the physical processes involved in this mixing process and show the path to be followed by the processes carried out in ammonia-water absorption, where there is a chemical reaction.
The design of the absorber component usually is a complex design due to the heat generated by the absorption of vapor into the liquid phase which should imply high values of heat and mass transfer coefficients. The double pipe heat exchangers are relatively simple to build and with a very low pressure drop, however the poor heat transfer capacity is a disadvantage [14].
The static mixer has been used in many applications in order to increase the heat transfer; however, there are no studies on absorption process in absorption cooling systems. This paper carries out an experimental and theoretical study of NH3-H2O absorption process at typical operation at air conditioning conditions using a simple double pipe heat exchanger with helical screw static mixers in both cooling water and solution flow rate to increase the heat and mass transfer.
2. Experimental Description
2.1. Test Rig Description
A test rig was designed to study the absorption process. It consisted basically of 2 circuits: the ammonia solution (black line) and the cooling water (dot line) as shown in Figure 1. In the solution circuit, the poor solution was stored in a container (TA1) and pumped to a plate heat exchanger (HX) to be heated to the operation conditions, after that it was sent to the bottom side of the absorber in the central tube, where ammonia vapor (yellow line) and solution were mixed. The rich solution left the absorber and it was sent to a second storage container (TA2). The heat generated in the absorber (AB) was removed by the cooling water circuit where water was pumped from a reservoir into the annulus tube of the absorber and passed through the needle valve that regulated the cooling water mass flow rate.
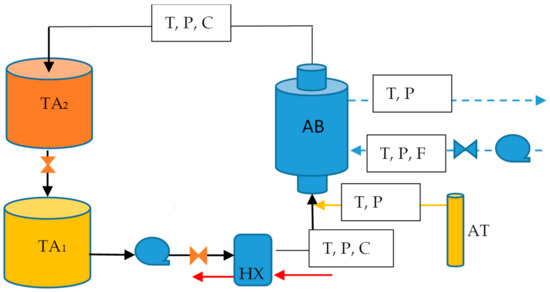
Figure 1.
Schematic diagram of the experimental rig.
The sensors used to measure temperatures (T), pressure (P) and mass flow rates (F) are described in Table 1. A Coriolis (C) type mass flow meter was used to measure the density and mass solution.

Table 1.
Parameters of the sensors used in the experimental study and associated uncertainty values.
2.2. Absorber Description
The absorber was a double pipe made of carbon steel (Figure 2a). The ammonia vapor and solution flowed in co-current mode, while cooling water flowed in counter-current. The vapor was injected at the bottom side of the absorber using a tube diameter of 0.005 m, as Figure 2b shows.
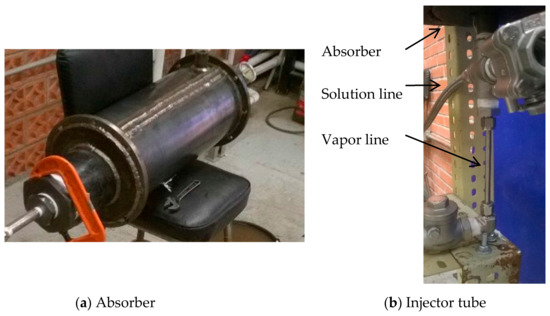
Figure 2.
Double pipe heat exchanger (a) and vapor injection (b).
A helical screw mixer was fixed in the annulus side (Figure 3a), while a helical screw tape with a rod (HM) was inserted into the central tube (Figure 3b).
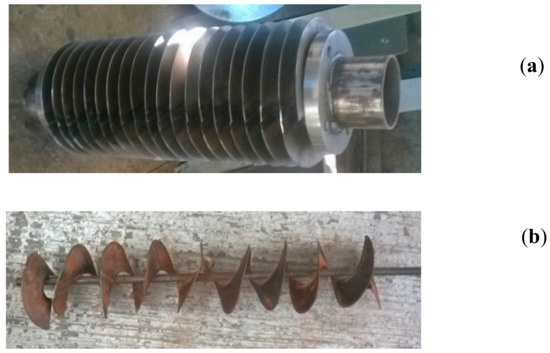
Figure 3.
Picture of the helical mixer inserted in the (a) annulus and (b) central tube.
2.3. Experimental Results
The objective of the experimental test is to compare the absorber performance between a smooth pipe (SP) and a pipe with a helical screw static mixer (HM) in the central tube. The first step was to analyze the heat load of the absorber without absorption. This means that ammonia vapor is not injected into the solution. The absorption process will be analyzed in the second step. Table 2 shows the absorber geometry specifications and input data.
Table 2.
Geometric and input data of double pipe heat exchanger.
Table 3 shows the experimental data without absorption process. The average heat load per area (QAVE) was higher with HM (1.40 kW/m2) than ST (1.17 kW/m2), in spite that the solution concentration in SP is lower than HM [15]. This represents an increment of 16%. The solution heat transfer coefficients were 0.37 and 0.59 kW/(m2·°C)for an SP and HM, respectively.
Table 3.
Experimental results without absorption.
Table 4 shows that the average absorption heat load per area (QAB,AVE) was 3.18 and 4.65 kW/m2 in SP and HM, respectively; this represents an increase of 31.61%. Besides the vapor flow rate absorbed (mV) was higher with HM (0.0010 kg/s) than SP (0.0008 kg/s). The solution heat transfer coefficients were 0.27 and 0.45 kW/(m2·°C) for SP and HM, respectively.
Table 4.
Experimental results with absorption.
3. Mathematical Model Description
The absorber modeling consists in a numerical discretization that divides the double tube exchanger into small control volumes along the absorber length, as it can be seen in Figure 4. The solution (mL) and vapor (mV) flow rates flow up in a co-current way in the inner tube, while cooling water (mC) flows in counter-current through the annulus side and extracts the absorption heat generated (QAB). The indices (i) and (i + 1) means the input and output streams for each control volume (i).
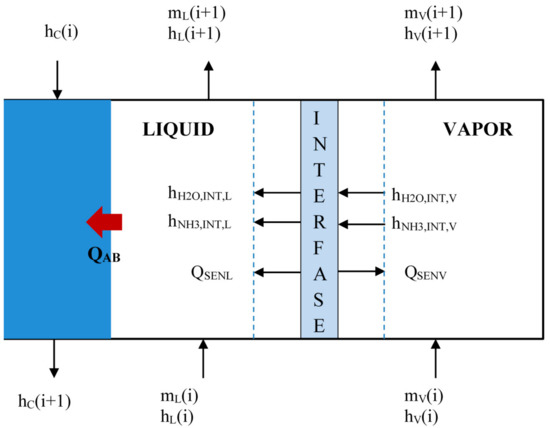
Figure 4.
Control volume of bubble absorber.
3.1. Assumptions
The following assumptions were considered on the mathematical model:
- The absorption process takes place at steady state conditions.
- The vapor and liquid phases are in equilibrium at the interface zone.
- The bubble velocity is constant.
- The vapor bubble has a spherical shape.
- There is no break-up and no interaction or coalescence amongst bubbles.
- There is no mass transfer in the sensible zone (absorption process is finished).
3.2. Governing Equations
The mathematical model is based on energy and mass balance for each section. Equations (1) and (2) represent the mass and species balance, respectively.
mV(i + 1) + mL(i + 1) = mV(i) + mL(i),
mV(i + 1)y(i + 1) + mL(i + 1) × (i + 1) = mV(i)y(i) + mL(i) × (i).
The absorber energy balance was calculated in the solution and water cooling side from Equations (3) and (4), respectively:
where eL, eV are liquid and vapor specific enthalpies, respectively.
QAB = mL(i + 1)eL (i + 1) − mL(i)eL(i) + mV(i + 1)eV(i + 1) – mV(i)eV(i),
QC = Cp(i)mC(i)(TC(i+1) – TC(i)),
The heat transfer from the liquid (hL) to water cooling (hC) was calculated using the heat transfer Equation (5), as it is shown in Figure 3:
where U, hL, hC are the overall, liquid and water cooling heat transfer coefficients (kW/(m2·°C)), respectively. ΔTML,EQ is the logarithmic mean temperature difference at equilibrium conditions to avoid subcooling conditions due to the absorption heat [15].
QAB = UAΔTML,EQ,
The heat released by the ammonia vapor bubble was calculated from an interfacial energy balance in the vapor and liquid phase from Equations (8) and (9):
mV(i + 1)eV(i + 1) = QSENV + mV(i)eV(i) − NNH3 eNH3,INT,V − NH2O eH2O,INT,V
mL(i + 1)eL(i + 1) = QSENL − QAB + mL(i)eL(i) + NNH3 eNH3,INT,L + NH2O eH2O,INT,L
3.3. Empirical Correlations
The heat transfer considers five thermal resistances from bulk vapor bubble (RSENV) to water cooling (RC), as it is shown in Figure 5.
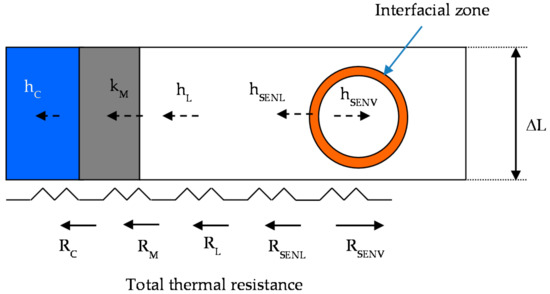
Figure 5.
Thermal resistance from vapor phase to cooling water.
The sensible vapor [16] and liquid [17] heat coefficients are calculated from Equations (10) and (11) (interfacial zone), respectively.
where vv is vapor velocity (m/s), dB is the bubble diameter (m), AP and AS are the projected area and superficial bubble (m), σ is the surface tension (N/m) and βV is the vapor phase diffusivity (m2/s).
The liquid [18] and vapor [19] mass transfer coefficients at the bubble are calculated as follows:
Equations from (10) to (13) are used to calculate the heat and mass transfer from bulk vapor to bulk liquid phase. These correlations can be applied to several substances which imply an interaction between a gas and liquid without absorption, although they were considered in this work due to the lack of information. The thermodynamic properties were obtained from Ibrahim and Klein [20]. The simulation details can be found in Cerezo et al. [3].
Equations (14) to (20) are used to calculate the heat transfer from bulk (hL) to cooling water (hC) side. The solution heat transfer coefficient was calculated with Equation (14) for SP [21]. The solution and water cooling (hC) heat transfer coefficients were calculated with Equation (15) for HM [22]. The water cooling heat transfer coefficient (hC) always use an HM in this study.
where X and Y are the ratios between spacer length/diameter of the rod and twist ratio, respectively. X = 0 because there is no space length (S = 0). a and b are the length of one twist and the diameter of the twist, respectively, as Figure 6 is shown. hSOL represents the heat transfer coefficient in liquid phase.
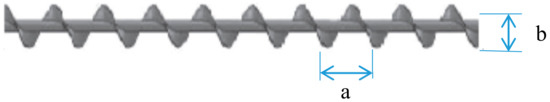
Figure 6.
Diagram of the helical screw mixer.
Equation (20) was used to calculate the solution heat transfer coefficient which includes a factor to incorporate the vapor fraction to the solution heat transfer. RVL is the gas hold up in the bubble.
hL = hSOL (1 − RVL)−0.8
3.4. Absorber Simulation Using Empirical Heat Transfer Coefficient Correlations
Figure 7 shows the behavior of the temperatures as a function of the tube length without HM in solution flow rate side (SP), and an HM on the cooling water side. The vapor temperature (TV) increases from 36 to 115 °C. This high increment of vapor temperature was caused by the small quantity of vapor flow rate (around 0.001 kg/s), which is easily heated by convection (QSENV, Equation (8)). The absorption process is considered finished at 0.10 m of absorber length (absorption heat zone) when vapor flow rate is an insignificant quantity (0.00005 kg/s), after that there is only sensible heat exchange (sensible heat zone). Interfacial (TINT) and solution (TL) temperatures have very similar values and both grow up from 36.5 to 46.6 °C at the beginning of the absorber, after that, only solution temperature decreases until 46.0 °C, this soft decrease is due to the low heat transfer coefficient on the solution side. The water cooling temperature (TC) very nearly is kept constant at 26.0 °C due to the high flow rate.
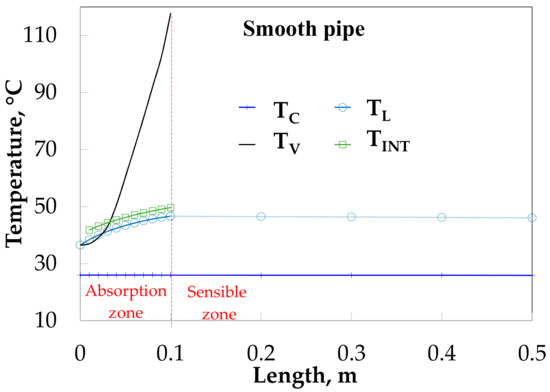
Figure 7.
Temperature profiles along bubble absorber length without HM in the inside tube.
The thermal resistance of the absorption heat load (QAB) is determined by liquid (hL = 0.031 kW/(m2·°C)) and not by the cooling water (hC = 0.95 kW/(m2·°C)), as it can be seen in Figure 8. On the other hand, the thermal resistance at the interface heat transfer (heat released by the bubble) is influenced by the vapor side (hV = 0.002 kW/(m2·°C)) and not by the liquid (hL,INT). Heat transfer coefficients are almost kept constant along the absorber due to the poor heat transfer and low vapor mass flow rate injected.
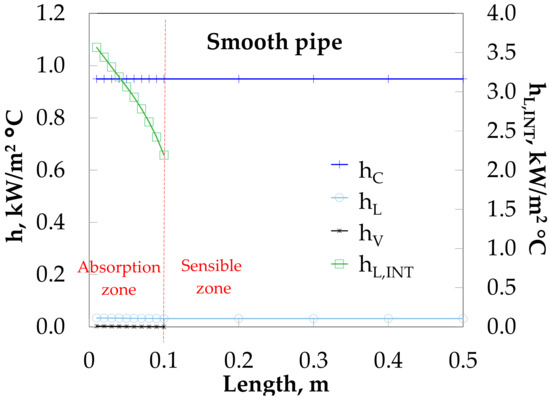
Figure 8.
Heat transfer coefficient profiles along bubble absorber length.
Figure 9 compares the overall heat transfer coefficients along the absorber with and without HM. The insertion of HM increases slightly the U from 0.16 to 0.15 kW/(m2·°C), while for the SP decreases slightly from 0.03 to 0.02 kW/(m2·°C).
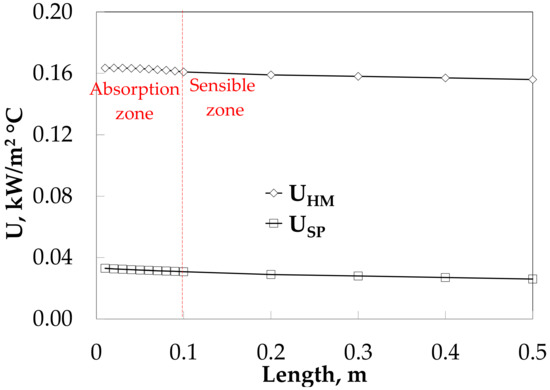
Figure 9.
Overall heat transfer coefficient profiles along the absorber length with an HM.
The absorption heat load was 0.11 and 0.54 kW with SP and HM, respectively, as it can be seen in Figure 10.
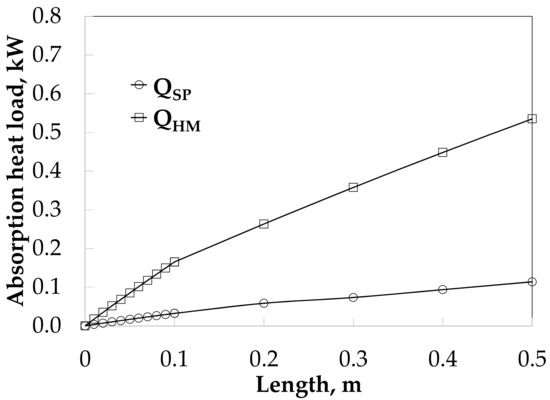
Figure 10.
Heat load profiles along the absorber length without and with HM.
4. Theoretical and Experimental Data Comparison
This section shows the simulation of the bubble absorber using solution heat transfer coefficients obtained from experimental data referred from Table 3 and Table 4. Figure 11 shows that the vapor increases from 36 to 110 °C for SP. The absorption process is considered completed at 0.11 m of absorber length. The solution and interfacial temperatures have a similar tendency in the absorption heat zone and both increase from 36.9 to 44.0 °C and 41.7 to 48.3 °C in the absorption zone, respectively, after that, the solution temperature decrease until 40.8 °C. The cooling water temperature increased from 26.5 to 27.2 °C.
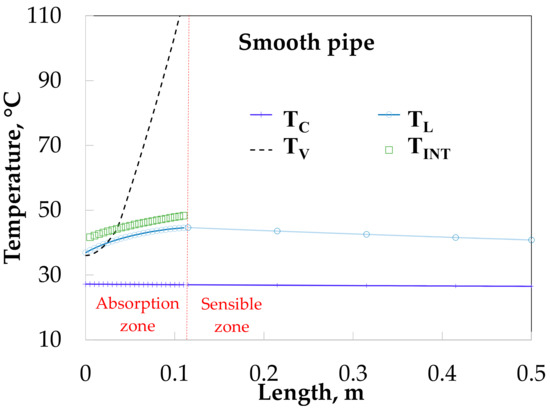
Figure 11.
Temperature profiles along the absorber with absorption.
Figure 12 shows the temperature profiles along the absorber with HM. The vapor and solution temperatures have similar behavior for the SP (Figure 11). The solution temperature increases from 38.0 to 47.9 °C during the absorption process and later decreases to 42.1 °C.
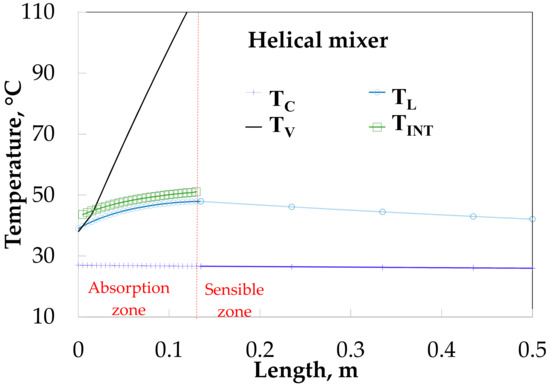
Figure 12.
Temperature profiles along the absorber with absorption.
The absorption heat load obtained values of 0.22 and 0.40 kW for SP and HM in the absorption heat zone, and both increase up to 0.72 and 1.14 kW in sensible heat zone respectively, as it can see in Figure 13.
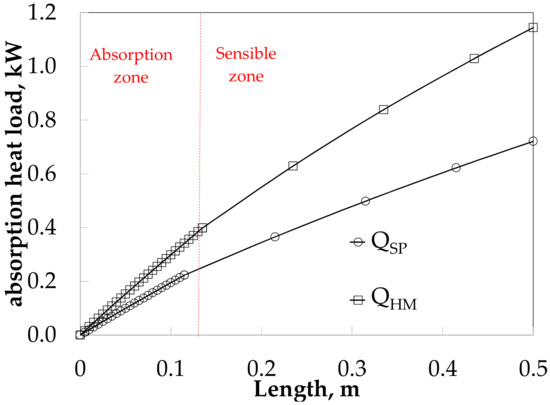
Figure 13.
Absorber heat load along the absorber for SP and HM.
Table 5 shows a comparison between theoretical and experimental data results. Simulation results were lower than experimental data in general. The difference of heat load between numerical results was 28.0 and 21.9% lower than experimental data for SP and HM, respectively.
Table 5.
Theoretical and experimental data of the absorber.
5. Discussion
The difference between numerical and experimental data could be caused by the lower values of hL at the absorption (Table 4) than those of the sensible heat zone (Table 3) because of the heat transfer equation (Equation (5)). The hL was calculated by ΔTML in the sensible heat zone, but hL was calculated by ΔTML,EQ equilibrium conditions in the absorption heat zone, because the results showed that the outlet solution temperature was higher than the inlet temperature input (due to the absorption heat). The use of ΔTML,EQ avoids this overlap of temperatures [15] because solution temperatures are calculated from pressure, concentration and saturation conditions, however it includes energy not considered in the energy balance, then ΔTML,EQ obtains higher values than ΔTML. Mahmoud et al. [23] presented an alternative driving potential for heat transfer defined as ΔT = TL,IN,EQ − TC,IN. It was also considered, but similar results were obtained.
A better theoretical temperature for the absorption process is required, in order to improve its agreement with the experimental data.
6. Conclusions
A theoretical and experimental comparison of an NH3-H2O bubble absorber was carried out with an HM in both, the solution and cooling water sides, in order to increase the absorber performance using a double tube heat exchanger. The following conclusions were drawn from this study:
A mathematical model was carried out in order to analyze the behavior of the absorber process with an SP and an HM using empirical correlations in the inside tube. The results showed that the absorption heat value was higher with the HM than the SP; however, simulation results were much lower than experimental data.
The experimental test consisted of comparing the absorption performance using an SP and an HM. The QAB,AVE was 1.17 and 1.40 kW/m2 for SP and HM insert without absorption (no injection of vapor). The QAB,AVE was 3.18 and 4.65 kW/m2 for SP and HM with absorption, respectively, this represented an increment of 31.61%.
Numerical results were analyzed using experimental data. It was shown that the absorption zone length was around 0.11 m for SP and HM, after that the heat transferred is only sensible heat. The difference of absorption heat load between numerical results was 28.0 and 21.9% lower than experimental data for SP and HM, respectively. It was caused by the lower value of hL in the absorption zone than sensible heat zone. The result could be improved using a log mean temperature difference equation (ΔTML) that includes the absorption heat.
Acknowledgments
The authors would like to acknowledge the partial economic support from CeMIE_Sol project P09 for the acquisition of materials.
Author Contributions
Rosenberg J. Romero and Roberto Best contributed to the data reduction, the design and the operation of the rig test. Jorge Jesús Chan carried out the experimental tests. Jorge I. Hernandez contributed to the absorber re-design, construction and the installation; experimental test and analysis of results. Jesús Cerezo and Fernando Lara contributed to the bubble absorber mathematical model and the selection of the operation conditions.
Conflicts of Interest
The authors declare no conflict of interest.
Nomenclature
| Q | absorption heat load, kW |
| T | temperature, °C |
| U | overall heat transfer coefficient, kW/(m2·°C) |
| e | specific enthalpy, kJ/kg |
| h | heat transfer coefficient, kW/(m2·°C) |
| m | mass flow rate, kg/s |
| x | liquid ammonia concentration, % by weight |
| y | vapor ammonia concentration, % by weight |
| R | thermal resistance, °C/kW |
| Km | mass transfer coefficient, kg/m2 s |
| a | length of one twist, m |
| b | diameter of the twist, m |
| s | spacer length, m |
| Greek Symbols | |
| µ | dynamic viscosity, kg/m s |
| σ | surface tension, N/m |
| ρ | density, kg/m3 |
| β | diffusivity, m2/s |
| Subscripts | |
| AB | absorber |
| L | solution, liquid phase |
| V | vapor phase |
| IN | input |
| OUT | output |
| EQ | equilibrium |
| C | cooling water |
| SENV | vapor sensible heat |
| SENL | liquid sensible heat |
| NH3 | ammonia |
| H2O | water |
| INT | interfacial zone |
References
- Gugulothu, R.; Reddy, V.; Somanchi, N.S.; Adithya, E.L. A Review on Enhancement of Heat Transfer Techniques. Mater. Today 2017, 4, 1051–1056. [Google Scholar] [CrossRef]
- Lee, K.B.; Chung, B.H.; Lee, J.C.; Lee, C.H.; Kim, S.H. Experimental analysis bubble mode in a plate-type absorber. Chem. Eng. Sci. 2002, 57, 1923–1929. [Google Scholar] [CrossRef]
- Cerezo, J.; Best, R.; Bourouis, M.; Coronas, A. Comparison of numerical and experimental performance criteria of an ammonia-water bubble absorber using plate heat exchangers. Int. J. Heat Mass Transf. 2010, 53, 3379–3386. [Google Scholar] [CrossRef]
- Cardenas, R.; Narayanan, V. A numerical model for ammonia-water absorption into a constrained microscale film. Int. J. Therm. Sci. 2010, 49, 1787–1798. [Google Scholar] [CrossRef]
- Oronel, C.; Amaris, C.; Bourouis, M.; Vallès, M. Heat and mass transfer in a bubble plate absorber with NH3/LiNO3 and NH3/(LiNO3 + H2O) mixtures. Int. J. Therm. Sci. 2013, 63, 105–114. [Google Scholar] [CrossRef]
- Amaris, C.; Bourouis, M.; Vallès, M. Effect of advanced surfaces on the ammonia absorption process with NH3/LiNO3 in a tubular bubble absorber. Int. J. Heat Mass Transf. 2014, 72, 544–552. [Google Scholar] [CrossRef]
- Amaris, C.; Bourouis, M.; Vallès, M. Passive intensification of the ammonia absorption process with NH3/LiNO3 using carbon nanotubes and advanced surfaces in a tubular bubble absorber. Energy 2014, 68, 519–528. [Google Scholar] [CrossRef]
- Triché, D.; Bonnot, S.; Perier-Muzet, M.; Boudéhenn, F.; Demasles, H.; Caney, N. Experimental and numerical study of a falling film absorber in an ammonia-water absorption chiller. Int. J. Heat Mass Transf. 2017, 111, 374–385. [Google Scholar] [CrossRef]
- Asfand, F.; Bourouis, M. A review of membrane contactors applied in absorption refrigeration systems. Renew. Sustain. Energy Rev. 2015, 45, 173–191. [Google Scholar] [CrossRef]
- Rader, R.G.; Mutsakis, M.; Grosz-Roell, F.; Maugweiler, W. Better Absorption? Try a Static Mixer. Chem. Eng. 1989, 96, 137–142. [Google Scholar]
- Ghanem, A.; Lemenand, T.; Della Valle, D.; Peerhossaini, H. Static mixers: Mechanisms, applications, and characterization methods—A review. Chem. Eng. Res. Des. 2014, 92, 205–228. [Google Scholar] [CrossRef]
- Rabha, S.; Schubert, M.; Grugel, F.; Banowski, M.; Hampel, U. Visualization and quantitative analysis of dispersive mixing by a helical static mixer in upward co-current gas-liquid flow. Chem. Eng. J. 2015, 262, 527–540. [Google Scholar] [CrossRef]
- Zidouni, F.; Krepper, E.; Rzehak, R.; Rabha, S.; Schubert, M.; Hampel, U. Simulation of gas-liquid flow in a helical static mixer. Chem. Eng. Sci. 2015, 137, 476–486. [Google Scholar] [CrossRef]
- Kakaç, S.; Liu, H. Heat Exchangers: Selection, Rating and Thermal Design, 2nd ed.; CRC Press: Boca Raton, FL, USA, 2002. [Google Scholar]
- Cerezo, J.; Bourouis, M.; Vallès, M.; Coronas, A.; Best, R. Experimental study of an ammonia-water bubble absorber using a plate heat exchanger for absorption refrigeration machines. Appl. Therm. Eng. 2009, 29, 1005–1011. [Google Scholar] [CrossRef]
- Deckwer, W.D. On the mechanism of heat transfer in bubble column reactor. Chem. Eng. Sci. 1980, 35, 1341–1349. [Google Scholar] [CrossRef]
- Clift, R.; Grace, J.R.; Weber, M.E. Bubbles, Drops and Particles, 1st ed.; Academic Press: New York, NY, USA, 1978. [Google Scholar]
- Incropera, F.P.; De Witt, D.P. Fundamental of Heat and Mass Transfer, 3rd ed.; John Wiley & Sons: New York, NY, USA, 1990. [Google Scholar]
- Sherwood, T.K.; Pigford, R.L.; Wlke, C.R. Mass Transfer; McGraw-Hill: New York, NY, USA, 1975. [Google Scholar]
- Ibrahim, O.M.; Klein, S.A. Thermodynamic properties of ammonia-water mixtures. ASHRAE Trans. Symp. 1993, 99, 1495–1502. [Google Scholar]
- Cengel, Y.A. Heat and Mass Transfer: A Practical Approach, 2nd ed.; Mc Graw-Hill Professional: New York, NY, USA, 2007. [Google Scholar]
- Ibrahim, E.Z. Augmentation of laminar flow and heat transfer in flat tubes by means of helical screw-tape inserts. Energy Convers. Manag. 2011, 52, 250–257. [Google Scholar] [CrossRef]
- Bourouis, M.; Vallès, M.; Medrano, M.; Coronas, A. Absorption of water vapour in the falling film of water—(LiBr + LiI + LiNO3 + LiCl) in a vertical tube at air-cooling thermal conditions. Int. J. Therm. Sci. 2005, 44, 491–498. [Google Scholar] [CrossRef]


© 2017 by the authors. Licensee MDPI, Basel, Switzerland. This article is an open access article distributed under the terms and conditions of the Creative Commons Attribution (CC BY) license (http://creativecommons.org/licenses/by/4.0/).