Review

A Survey of WEC Reliability, Survival and Design Practices

1
Sandia National Laboratories, Albuquerque, NM 87185, USA
2
National Renewable Energy Laboratory, Golden, CO 80303, USA
*
Author to whom correspondence should be addressed.
Energies 2018, 11(1), 4; https://doi.org/10.3390/en11010004
Submission received: 30 November 2017 / Revised: 14 December 2017 / Accepted: 15 December 2017 / Published: 21 December 2017
(This article belongs to the Special Issue Wave Energy Potential, Behavior and Extraction)

Abstract

:
A wave energy converter must be designed to survive and function efficiently, often in highly energetic ocean environments. This represents a challenging engineering problem, comprising systematic failure mode analysis, environmental characterization, modeling, experimental testing, fatigue and extreme response analysis. While, when compared with other ocean systems such as ships and offshore platforms, there is relatively little experience in wave energy converter design, a great deal of recent work has been done within these various areas. This paper summarizes the general stages and workflow for wave energy converter design, relying on supporting articles to provide insight. By surveying published work on wave energy converter survival and design response analyses, this paper seeks to provide the reader with an understanding of the different components of this process and the range of methodologies that can be brought to bear. In this way, the reader is provided with a large set of tools to perform design response analyses on wave energy converters.

Graphical Abstract

1. Introduction

As the development of wave energy converters (WECs) has increased in detail and scope, increasing attention is now being given to the prediction of design responses and loads for devices to allow for thorough and efficient WEC design. In the past, failures of WECs have lead to closures of private developers. While less immediately obvious, a lack of confidence in design methods has also likely resulted in over-inflated fabrication and maintenance costs. The need to both ensure device survival and minimize safety factors (and therefore unnecessary structural costs) has thus created an increased incentive to better understand design responses and loads for WECs. At the same time, thanks to increased research and development work on WECs, there is now rapidly growing knowledge about methods that can be applied to the design of WECs.
In 2014, a workshop was held to gather WEC researchers and developers with the goal of better understanding the state of the art in WEC design response analysis [1]. The workshop attendees highlighted that while design response analysis is widely understood as a critical step in the design process for WECs, additional development in this area would be crucial for the success of the industry. Both device modeling tools and methods for determining environmental loads were identified as key areas in need of further development. Additionally, a need for more publicly available experimental datasets for validation of design processes and numerical models was noted. The workshop attendees also agreed that there was a need for additional guidelines, best-practices documents and standards to normalize the design process of the WECs and increase investor confidence. The recommendations from this workshop highlight the need for improvements to components within the WEC design process, as well as increased understanding and confidence in the WEC design process as a whole.
A number of standards/technical specifications (TS) can be considered for WEC design. An even larger number of informal guidelines and best-practices documents are available on the subject, with yet more standards, guidelines and other documents available on related systems, such as ships and offshore structures. However, as of the writing this article, IEC TS 62600-2 is the only standard/TS dedicated specifically to WEC design [2]. This TS gives design guidance for WECs, as well as current energy converters (CECs) and tidal energy converters (TECs). In addition to IEC TS 62600-2, a number of documents for offshore structures can also provide useful guidance. N-003 [3] is the NORSOK offshore structure design standard; DNV-RP-C205 is a Det Norkse Veritas (DNV) recommended practices document targeted at offshore structures [4]; ABS (American Bureau of Shipping) [5], DNV [6] and IEC [7] all have design documents for offshore wind turbines.
This work was completed in the interest of two related goals. Firstly, this survey should provide researchers and practitioners with some general background on available methodologies for WEC design. Secondly, considering that there are currently efforts underway to create, revise and improve design standards for WECs, this paper should serve as an overview both of the WEC design process as a whole and also specific practices. Due to the short history and limited experience in WEC design, it is essential that all of the available knowledge and understanding of best-practices be used to define standards. An initial review of extreme conditions modeling and design response analysis practices was presented by [8]. Extending the previous work, this paper provides a review and general survey of design practices for WECs, by examining the key components of the WEC design process. A generalized workflow diagram is shown in Figure 1. Working from left to right, this diagram illustrates a major steps in determining characteristic loads for a WEC. This characteristic load, which may be the maximum mooring tension or equivalent fatigue load in a structural member, can be evaluated against structural capacities. The workflow blocks in Figure 1 (design framework selection, device configurations, failure modes analysis, environmental characterization, modeling, experimental testing, extreme response statistics and fatigue analysis) are considered in turn. For each of these areas/blocks, some general discussion of relevant methods is provided, and when possible, studies applying these methods for WECs and related systems are considered.

2. Device Configuration

In defining a design case, device configuration must be considered in addition to environmental conditions. While operational loads are often considered the most crucial, it is also important to consider the other scenarios/conditions, such as fault conditions and transportation. IEC TS 62600-2 considers transportation, normal operation, faults and emergency shutdown, survival, loss of stability, mooring failure and maintenance scenarios. In addition to defining modeling and experimental design, these configurations can also drive the identification of failure modes.
A variety of survival modes are currently being considered for WECs. These special device configurations are intended to reduce both energy absorption and loading during the most dangerous sea states for a device. In a sense, a WEC survival strategy is intended to be analogous to the way a wind turbine feathers its blades to reduce loading above a certain wind speed. In some cases, the PTO can be “locked” to prevent motion and problems with component end stops [9,10,11]. Some research has also been focused on applying the concept of life extending control (LEC), in which control algorithms are used to alter a WEC’s PTO performance to avoid damage [12,13]. The inclusion of constraints in WEC control design can also be an important factor when considering design loads [14,15]. Such efforts have the potential to interface well with ongoing work to improve WEC energy absorption through control (see, e.g., [14,16]). In some cases, a passive load shedding mechanism can be incorporated into a WEC design. Retzler and Pizer [17] tested a 1/20-scale model of the Pelamis device in regular and irregular waves. This study reported that the Pelamis device’s design allowed it to effectively detune in waves of a height larger than the diameter of its cylinders.
Relatively small changes in geometry can also reduce loads. Stallard et al. [18] performed a study to investigate tailoring the above-water geometry of a point absorber in a way that allows for small changes in draft to result in large changes in device response. The study achieved a 50% reduction in device response with a need for only a 10% change in mass. Terminator devices are often designed to change their angle to incoming waves or increase their draft to reduce energy absorption, and therefore loading, in large waves [19,20,21,22]. Pecher et al. [22] detailed 1/15-scale testing of the Weptos WEC to assess mooring force and structural bending moments in five extreme wave conditions. The Weptos, which is a terminator-style device, is designed to reduce its opening angle to incoming waves in order to limit loading during extreme wave conditions. This survival strategy was shown to be effective in reducing the structural bending moments within the device down to levels on the order of those in operational conditions. This strategy was also shown to be partially effective for reducing mooring loads, however not to the same degree.
Submergence is an attractive survival strategy. Wan et al. [23] performed numerical modeling and wave tank testing to assess survival modes of a combined floating wind turbine and spar-torus-type point absorber. These tests elicited slamming, green water and Mathieu instabilities. Wan et al. found that when the torus WEC was submerged for survival mode, reducing the natural period of the system in heave, loads were significantly reduced. While not feasible for many devices, the Wavestar device was capable of simply lifting the reacting bodies out of the water in survival mode [24].

3. Failure Modes Analysis

A failure modes and effects analysis (FMEA; also referred to as failure modes, effects and criticality analysis (FMECA)) is a process used to identify possible failure modes in an engineering system. In addition to estimations of maintenance schedules and levelized cost of energy (LCOE), an FMEA process is critical within the design workflow illustrated in Figure 1. As shown in Figure 1, the task of developing an experimental or numerical model is influenced by the FMEA. Since these models will, in many ways, be simplified representations of a full-scale device, it is important that they capture the necessary physics that are needed to assess failure modes.
With limited historical experience and a wide variety of WEC archetypes, the FMEA process and common failure modes for WECs are not as developed as in many other fields. Kenny et al. [25] defined a set of failure modes for a multi-body WEC so that a conditional monitoring system (CMS) could be designed to schedule preemptive maintenance. Here, the WEC was considered as a conglomerate of subsystems with varying groupings of priority. This study defined the high-priority subsystems to include hydraulic, high-voltage electrical and instrumentation systems. In a subsequent study, Kenny et al. [26] assessed the failure log of the deployed WEC against the original FMEA. For this novel WEC, which underwent design updates after deployment, numerous failure modes, often linked to human factors, not originally identified in the FEMEA occurred. Okoro et al. [27] created a system for ranking (giving relative priority to) failure modes of a WEC, which may provide some further insight into prioritizing maintenance and inspections.

4. Design Frameworks

A key area of interest for WEC design is determining which cases should be evaluated to determine design loads and, consequently, how the responses predicted in those case should be interpreted to produce a characteristic load (see Figure 1). For a WEC, this requires two major steps: selection of the design case (e.g., 50-year waves combined with 25-year wind during an operational condition) and definition (i.e., how will the precise conditions, which will be evaluated through experimental testing and/or numerical modeling, be determined). Selection of design load cases depends foremost on the intended usage and lifetime of the system. A demonstration system intended to collect data over the course of three years may not be evaluated using as harsh of conditions as a commercial device expected to last 25 years. Additionally, the consequences of failure can be considered at this stage to influence the return periods of conditions selected. Offshore oil and gas platforms are typically designed using 100-year return conditions [3,4] as a way of including a safety factor since loss of life is a potential consequence of failure. Once a set of conditions with which to compose design cases has been selected, some work is required to define (in terms of actual waves, currents, etc.) the physical condition that must be considered.
Figure 2 illustrates the three main methodologies for selecting the environmental conditions of survival/extreme response design cases. This figure focuses on wave conditions, but similar contours (and at a higher dimension, surfaces) can be used to incorporate additional environmental conditions. The all sea states approach, shown in Figure 2 with red squares, is both the most rigorous and most expensive approach. Additionally, this approach is often also referred to as the full long-term approach. Descriptions for such an approach can be found in a number of guidelines and standards, including N-003 [3] and DNV-RP-C205 [4]. Additionally, this approach has been considered for WECs in a number of studies [28,29]. The short-term responses (i.e., the sea state-specific responses), F ¯ X 3 hr ( t , h ) , are integrated, along with a weighting for occurrence likelihood of each sea state, f ( T e , H s ) ( t , h ) .
F ¯ X 3 hr ( x ) = h t F ¯ X 3 hr ( t , h ) ( x ( T e , H s ) ) f ( T e , H s ) ( t , h ) d t d h .
Here, the sea state is defined by the energy period, T e , and significant wave height, H s , which are integrated over the relevant ranges via t and h, respectively. Following the common convention, Equation (1) uses 3-h storms to define the short-term responses. The survival function on the left-hand side of Equation (1), also known as a complementary cumulative distribution function (CCDF), can be written as:
F ¯ X ( x ) = f ( X > x ) = 1 F ( x ) ,
where F ( x ) is the cumulative distribution function. In other words, F ¯ X ( x ) represents the probability that some response of interest (e.g., mooring tension, PTO force), X, will exceed some arbitrary limit of x. Thus, Equation (1) gives the probability that the largest value of X in a 3-h sea state will exceed a limit of x. Based on return periods of interest, which can be defined in terms of probability levels, expected limits on the response/load X can be predicted.
The blue dots in Figure 2 illustrate a contour approach for load case selection. This approach, also commonly referred to as the inverse first-order method (I-FORM), was popularized for ocean systems by Winterstein and Haver [30,31]. Contour analyses have been applied for WECs in multiple studies [29,32] and are suggested for offshore structures in N-003 and DNV-RP-C205. For a desired return period, e.g., 50 years, an environmental contour is determined. Figure 2 shows such a contour in the H s - T e (significant wave height and energy period) space. Working along the defined contour, device responses are predicted for a series of environmental conditions. From each of the predictions along the contour, the largest response is taken to be the design response. Correction factors are generally applied to account for short-term variation. This can be accomplished by selecting a high percentile from the short-term response on the contour to represent design load. Within the marine industry, percentiles of 75–99% are often applied [4,29,33,34,35]. An alternative approach is to apply a correction factor to the expected (mean) value from the extreme distribution (Ren et al. [36] suggests a factor of 1.3). This latter approach is attractive since predictions of extreme response distributions often exhibit a large degree of variability in the tail region (see, e.g., [33,37]).
The green “X” marks in Figure 2 illustrate a one-dimensional design load selection. This approach is suggested in IEC 62600-2 [2] and NORSOK N-003 [3]. The n-year significant wave height, H s , n , is predicted through an extreme value analysis and a range of sea states with relevant wave periods are evaluated.
a H s , n T b H s , n
Here, a and b are based on empirical data. IEC 62600-2 currently suggests a = 3.54 and b = 4.56 . The relevant wave periods vary depending on location. Thus, when following this approach, it is best to use location-specific information to determine a range of relevant wave periods. The sea state with the largest response is then used as the design condition. Alternatively, for responses driven by excitation period, a wave period can be determined first, then used, in turn, to obtain a wave height. This may be a useful approach for many WECs with strong resonant dynamics. Again, as with the contour approach, it may be necessary to apply a correction factor. Fonseca et al. [38] applied a variation on this 1D analysis of significant wave height buoy data to define design cases for use in the mooring design of a WEC.
Various researchers have compared predictions from contour and all sea states approaches. Muliawan et al. [29] presented a comparison of the contour line and full long-term methods for loading in the mooring lines of a two-body floating WEC using a Morison’s equation model. This study showed the contour line method to be capable of predicting the characteristic load in the system’s mooring lines using correction factors similar to those employed by the oil and gas industry. A similar study was conducted by Ren et al. [36] on a combined spar offshore wind turbine and torus WEC. Rendon and Manuel [35] implemented a contour analysis in which characteristic extreme values were chosen as a function of the variance of each short-term distribution (that is, higher variance in the short-term distribution requires the usage of a higher percentile to represent that distribution’s characteristic extreme). Agarwal [39] found the 2D contour method to potentially be both inaccurate and nonconservative for offshore wind turbines. Baarholm et al. [33] analyzed offshore platforms using both a contour method and a full long-term approach. The percentile level from the contour approach that matched the full long-term approach ranged from 75% to 97%.

5. Environmental Characterization

As discussed in Section 4, characterizing a WEC device’s deployment environment represents a crucial step in the design load analysis process. A number of factors combine to make the ocean a challenging environment to characterize for engineering design. The remote nature of many prospective ocean deployment sites makes long-term measurement of conditions challenging and expensive. With IEC TS 62600-2 suggesting a 50-year return period in many design cases, this generally means that the period of record will be less than or equal to the return period for the design case. This makes for a challenging extreme value problem, as is further discussed in Section 8.2.
Additionally, seasonal and longer scale weather variations (e.g., El Niño/La Niña) necessitate longer sampling periods. Climate change may also be an important factor. The use of historical records to predict extreme sea states of a given return period has recently come into question with growing evidence of climate change. Ruggiero et al. [40] investigated the changing wave climate in the U.S. Pacific Northwest via two buoys with 40 years of data. Their results showed that the average yearly significant wave height has increased steadily over that period (at a rate of 0.015 m/year), while the average significant wave height of the five largest storms per year has grown at a rate of 0.071 m/year. Young et al. [41] looked at wind and wave data across the entire globe for roughly 20 years and saw a similar trend, with the extreme waves increasing faster (on the order of 1% annually throughout most U.S. coastal waters) than the mean. Modeling into the future, climate scientists predict that significant wave heights will increase. This increase in extreme conditions is expected to similarly increase downtime in WEC testing at the Wave Hub site [42].
Given these challenges, it is clear that characterizing extreme conditions for a specific ocean environment is a nontrivial task. In general for WEC design, as shown in Figure 2, it is desirable to characterize the environment in terms of significant wave height and energy period. While empirical distributions for commonly-occurring sea states can be obtained directly from buoy data or hindcasts, characterizing extreme waves requires extrapolation into the tails of the joint distribution and thus some statistical framework. In their application of the I-FORM, Haver and Winterstein utilized a Ronsblatt transformation so that a desired return period can be used to define a fixed radius sphere within the new space [30,43]. Alternative transformations, such as a Nataf transformation, have also been utilized [44]. Huseby et al. [45] introduced a second class of methods for extrapolating extreme sea states, which rely on Monte Carlo simulation of sea states based on a joint probability model. Vanem and Bitner-Gregersen [46] provided a useful comparison of these two approaches, both in terms of methodology and performance. An improved version of the I-FORM process is presented in [47]. Here, a principle component analysis (PCA) approach is applied to better utilize the physical relationship between wave period and height. Many of these contour methods have been implemented in the open-source WEC Design Response Toolbox (WDRT) [48]. Figure 3 shows an example where the WDRT was used to produce a set of 50-year contours using a variety of methods. From Figure 3, it is clear that these various processes of determining extreme environmental conditions return a wide variety of results.

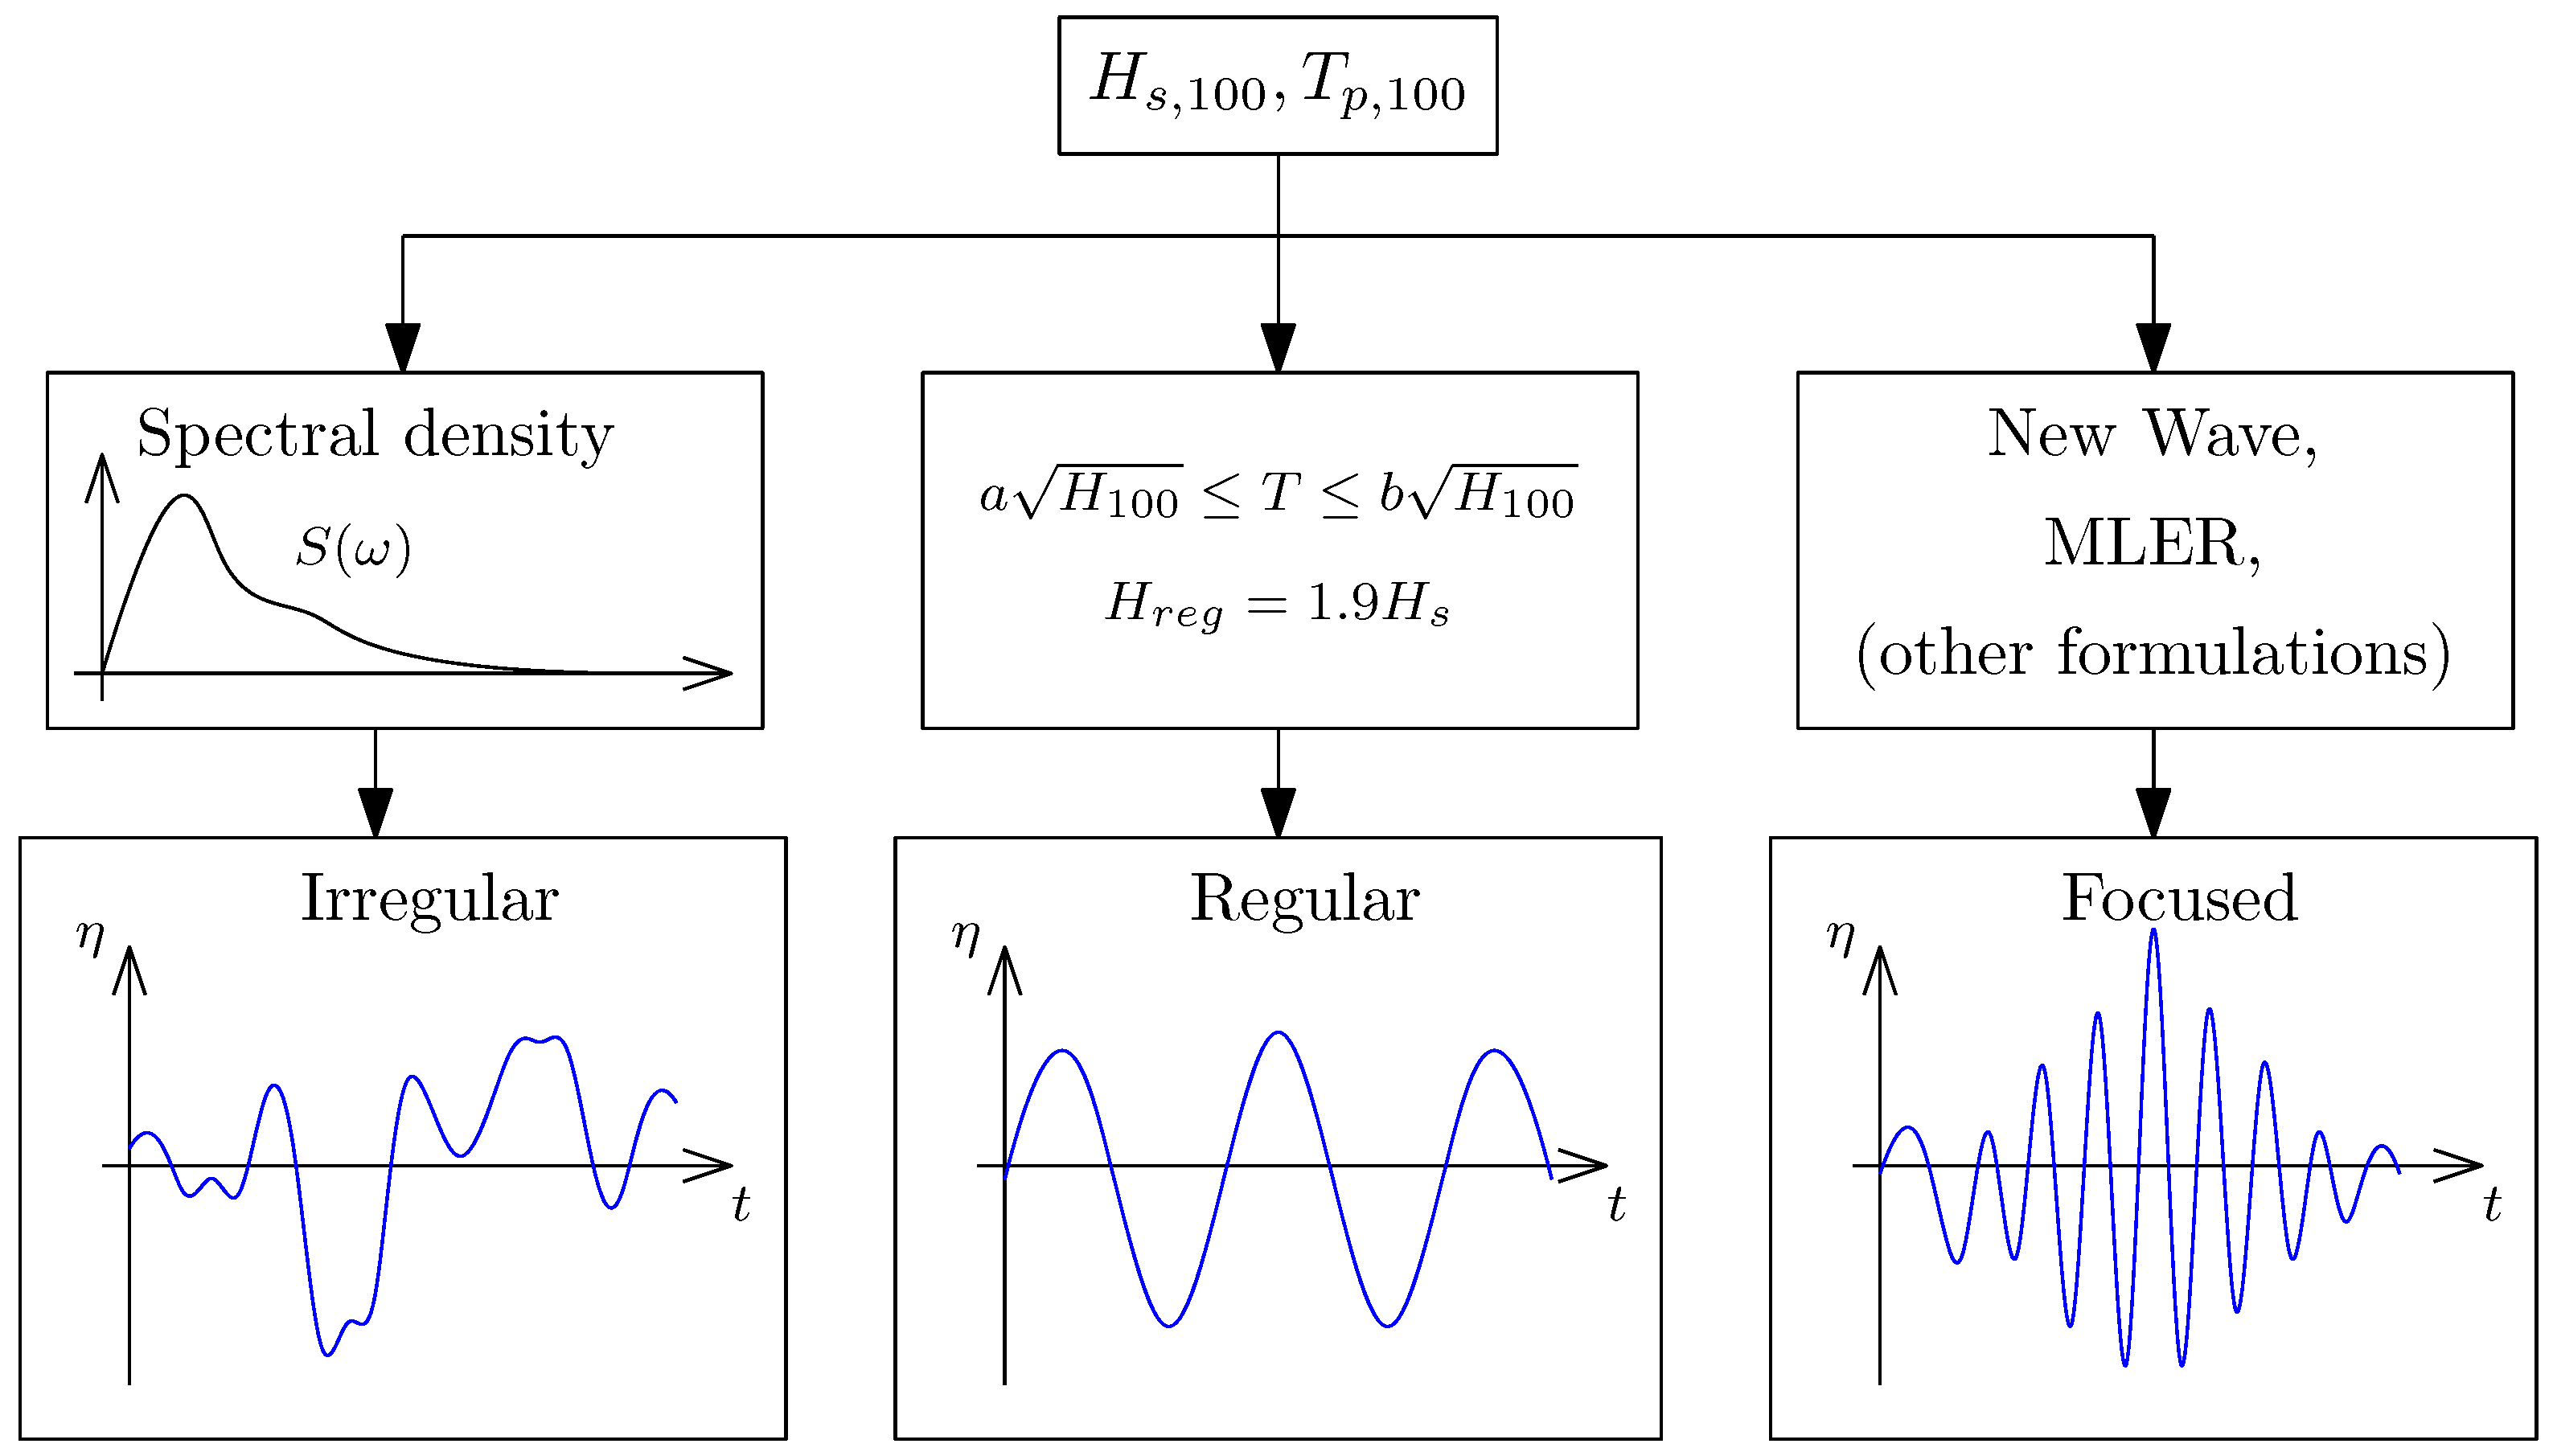
6. Sea State Realization

Once design cases have been defined, the specifics of realizing the design case, in order to allow for response prediction through experimental testing and modeling (see Figure 1), must be determined. While, as previously discussed, other metocean factors may play an important role for certain devices, we focus here on the definition of a design-wave. The three most common general paths for defining a design-wave are illustrated in Figure 4. The most obvious choice for a design-wave is to use either a representative or idealized spectrum to define an irregular sea state. Alternative approaches, which are generally meant to be more efficient than the “brute force” approach of simulating long irregular wave-trains, are to define representative regular waves or even focused waves based on sea state parameters. This can be helpful, or even essential, when faced with the challenges and time-restraints of high-fidelity modeling and experimental testing.
When utilizing an irregular design-wave, three-hour realizations of the sea state are generally recommended. This derives from the well-supported concept that wave amplitudes in a sea state follow a Rayleigh distribution (see, e.g., [49,50]). However, multiple realizations of each sea state should be considered. IEC 62600-2 requires that at least six three-hour realizations (18 h total) be considered for each sea state. If sufficient information is available, a representative spectral density and spreading function should be used to create sea state realizations. When more detailed information is not available, idealized spectral spectral shapes can be utilized. However, studies of offshore platforms have shown that spectral shape can play an important role in determining extreme responses [51], so care should be taken to consider the spectral shape at the deployment location whenever possible. Additional discussion of extreme value analyses in irregular sea states will be presented in Section 8.2.
In one variant of the design-wave approach, the irregular ocean sea state is represented by a regular wave. The design-wave height ( H n ) is generally chosen as 1.9-times the n year return significant wave height ( H s , n ), which follows from the Raleigh distribution of wave amplitudes discussed previously (see, e.g., [3,49]). While seemingly somewhat simplistic, a regular design wave can be thought of as a limit for extremely narrow-banded spectra. When utilizing a regular design-wave, it is often recommended that, as with the one-dimensional design case approach discussed in Section 4, a range of wave periods be considered. For this, we can simply replace H s with H 100 in (3).
a H 100 T b H 100
The bounding constants are fairly similar as in (3): DNV-RP-C205 recommends a = 2.55 , b = 3.22 ; NORSOK N-003 recommends a = 2.55 , b = 3.31 . The wave eliciting the largest response is then used as the design-wave, and the response becomes the characteristic load.
An alternative design-wave approach is to define a focused wave based on the spectral sea state. A number of formulations have been developed to design focused waves. The New Wave formulation [52] uses broad-banded wave theory to define amplitudes and phases of individual waves such that the most probable maximum wave occurs. A number of studies have applied the New Wave approach in wave tank testing of WECs [53,54,55,56,57]. The most-likely-extreme-response (MLER) method was used for a WEC by Quon et al. [58]. This approach utilizes both the desired spectrum and an estimate for the linear response of the system to define a design-wave.
One of the known drawbacks of focused waves is that they are unable to properly incorporate memory/dynamic state effects, which can play a dominant role in system dynamics. A hybrid approach, which utilizes irregular wave series with extremes inserted based on a Gaussian process, has been used with some success to alleviate this issue [59]. This approach creates wave trains on the O ( minutes ) and thus falls somewhere between the O ( hours ) irregular wave simulations and O ( seconds ) focused waves. Göteman et al. [60] employed embedded extreme waves during wave tank tests of a point absorber.

7. Response Prediction

With a design case realized by a design-wave, the next step in the analysis process is to predict the device response. Two main approaches can be used to determine the response of a WEC in a set of conditions. Numerical modeling and physical modeling can both be utilized at this stage and are often used in conjunction with each other to improve efficiency and increase confidence in the results.

7.1. Numerical Modeling

A wide range of numerical modeling approaches is available for prediction of WEC responses. Fortunately, a number of guidance documents and review papers are available on this topic. Topper [61] provides a general discussion of numerical modeling for WECs. This guide covers many subjects that can help a designer assess the relative importance of different physical phenomena for their device and select appropriate modeling approaches. Penalba et al. [62], Folley et al. [63] and Li and Yu [64] each provide useful surveys and reviews of numerical modeling approaches for WECs.
Frequency-domain models represent the most efficient formulation for predicting WEC dynamics. Falnes [65] provides an excellent overview of this style of model. In general, frequency-domain models assume a linear decomposition of the dynamics of a floating body. Assuming the water to be an inviscid and irrotational fluid, a potential flow formulation can be applied along with boundary conditions for the free surface, sea floor and other solid bodies (see, e.g., [66]). By assuming small motions, the radiation and diffraction phenomena can be decoupled. In practice, a frequency-domain model for a WEC can be obtained either numerically, using boundary element model tools such as WAMIT [67] and Nemoh [68], or through experimental system identification (see, e.g., [69]). Note that some nonlinear frequency-domain approaches, such as Volterra models (see, e.g., [70]), can also be applied. One example was shown by Gkikas and Athanassoulis [71], in which the pressure of an oscillating water column WEC was modeled using a Volterra formulation. Another option is to employ local linear models, which may be tuned to provide a suitable representation of WEC dynamics within a regime [69].
Cummins [72] provided the best-known translation of the frequency-domain model for a floating body into the time-domain. The main advantages of working with this type of formulation is the more straightforward ability to include arbitrary nonlinear dynamics as some perturbation from the linear solution. This may include nonlinear hydrodynamics (see, e.g., [73,74,75,76,77]), nonlinear mechanical dynamics, such as due to a mooring system (see, e.g., [78]) or some arbitrary control input (see, e.g., [14,16]). Giorgi and Ringwood [79] performed an assessment of the relative importance of various nonlinear perturbations within a Cummins-style time-domain model and compared computational expenses. In this study, Giorgi and Ringwood found that viscous drag nonlinearities can be significant, even for the simple spherical WEC considered in their study, when motions are large. Nonlinear Froude–Krylov phenomenon were found to have a smaller impact. A similarly focused study on nonlinear hydrodynamics was completed by Bharath et al. [80] using the commercial CFD code STAR-CCM+.
By solving the potential flow problem in a time-dependent fashion, a nonlinear potential flow model can also be created. There are a few well-known nonlinear potential flow solvers from the naval architecture field (AEGIR [81] and LAMP (Large Amplitude Motion Program) [82]). Letournel et al. [83] performed a comparison of such nonlinear potential flow models with those that rely on superposition. Greenhow et al. [84] presented an analysis of Salter’s “duck” in extreme waves using a two-dimensional nonlinear potential flow code and experimental testing. Guerber et al. [85] have investigated a nonlinear potential flow model for analyzing a simple submerged WEC.
CFD models solve spatially- and temporally-discretized form of Navier–Stokes equations. In practice for most real engineering systems, these models rely on a Reynolds-averaged turbulence closure to perform simulations. ITTC 7.5-03-02-03 [86] provides useful guidelines for conducting CFD simulations of ships. While some considerations for ships focus on forward speed and resistance issues, which are of lesser interest for most WECs, other issues, such as free surface modeling, mesh density to capture waves and temporal discretization, remain of prime importance. Ransley et al. [87] used OpenFOAM to model the response of simple moored buoy. Using a New Wave focused wave, the response of the buoy predicted by CFD matched the experimental results quite closely. Yu and Li [88] showed a similar approach using the commercial code STAR-CCM+ for analysis of the Reference Model 3 (RM3) [89]. The RM3 was studied in both “locked” and “operational” PTO configurations. When considering the response amplitude operator (RAO) defined as regular, these CFD simulations showed fair agreement with experimental results; in general, the device response predicted in CFD tended to be smaller than predicted by linear models. Sjökvist and Göteman [90] studied the response of a tethered point absorber using regular waves and tsunami waves in OpenFOAM. Westphalen et al. [91] performed CFD simulations for a simple floating body (the “Manchester Bobber”) and performed comparisons with experimental data collected by Weller et al. [54]. In Wesphalen’s study, both a finite volume Navier–Stokes and smooth particle hydrodynamics (SPH) model generally showed good agreement with the near-focused wave trains considered. Madhi and Yeung [92] applied SPH modeling to analyze the effect of breaking waves on a WEC. The SPH model was able to accurately capture the breaking waves and showed good agreement with experimental results.

7.2. Experimental Testing

Experimental testing of WECs is mostly defined by two components: model design/fabrication and test design. Both components are of key importance and must be considered in conjunction with each other. However, before detailed work may begin on model and test design, a key assessment should be made about the stage of technology development. This topic has been discussed by a number of authors. Both Holmes [93] and ITTC 7.5-02-07-03.7 [94] suggest that WEC survival testing be undertaken during the design exploration phase at a small scale ( 1 / 100 < λ < 1 / 25 ) and during the design validation stage at a medium scale ( 1 / 25 < λ < 1 / 10 ). Note that working at a smaller scale can allow for extreme sea states to produced in a wider range of wave tanks. ITTC 7.5-02-07-02.3 [95], which focuses experiments on rarely occurring events for ships, recommends that extreme conditions be evaluated at as large a scale as feasible. This opposing recommendation is driven by the desire to limit effects of scaling.
As with other types of model-scale testing, dynamic similitude is desired for testing of a WEC, but not fully obtainable. Froude scaling is generally preferred for most WECs; however, as noted in Section 7.1, when motions are large, viscous damping can begin to play an important role in WEC dynamics. Therefore, Reynolds scaling should at least be calculated in order to understand potential implications [93,96]. The presence of electro-mechanical systems in a WEC adds additional complicating factors. While the use of a survival mode (see discussion in Section 2) may reduce their importance for tests focused on extreme conditions, a number of WEC testing guidelines call out the importance of designing a model’s PTO system [94,96]. Mooring systems must also be represented in model scale. These mechanical subsystems may prove challenging to scale with appropriate frictional rates and/or fluid compressibility (e.g., for an oscillating water column device).
Considering the design of a wave tank testing experiment to assess WEC survival, one is primarily concerned with combinations of wave conditions and WEC configurations. It is generally recommended that sea states with a range of angles of incidence to the WEC be considered [93,94], as these can create unexpected responses in the device. ITTC 7.5-02-07-03.7 also stresses the importance of considering short-crested waves [94]. Available guidelines on experimental WEC testing generally recommend performing survival tests corresponding to three hours at full scale (on the order of 30 to 45 min at model scale) [93,94]. This is relevant when applying an irregular sea state approach as discussed in Section 6.
In addition to typical sensors, such as strain gauges, force/torque transducers, position sensors and accelerometers, ITTC 7.5-02-07-02.3 also recommends that the relative motion between the model and free surface be measured when considering extreme conditions. This can be achieved by mounting wave probes to the model itself. Slamming may also be important and thus necessitate surface pressure measurements. This has been investigated for the near-shore flapping Oyster device by Henry et al. [97]. Dedicated slamming tests have also been conducted on a composite point absorber at Ghent University, which found a roughly 50% reduction in slamming loads for the composite structure when compared to steel [98,99].

8. Determining a Characteristic Load
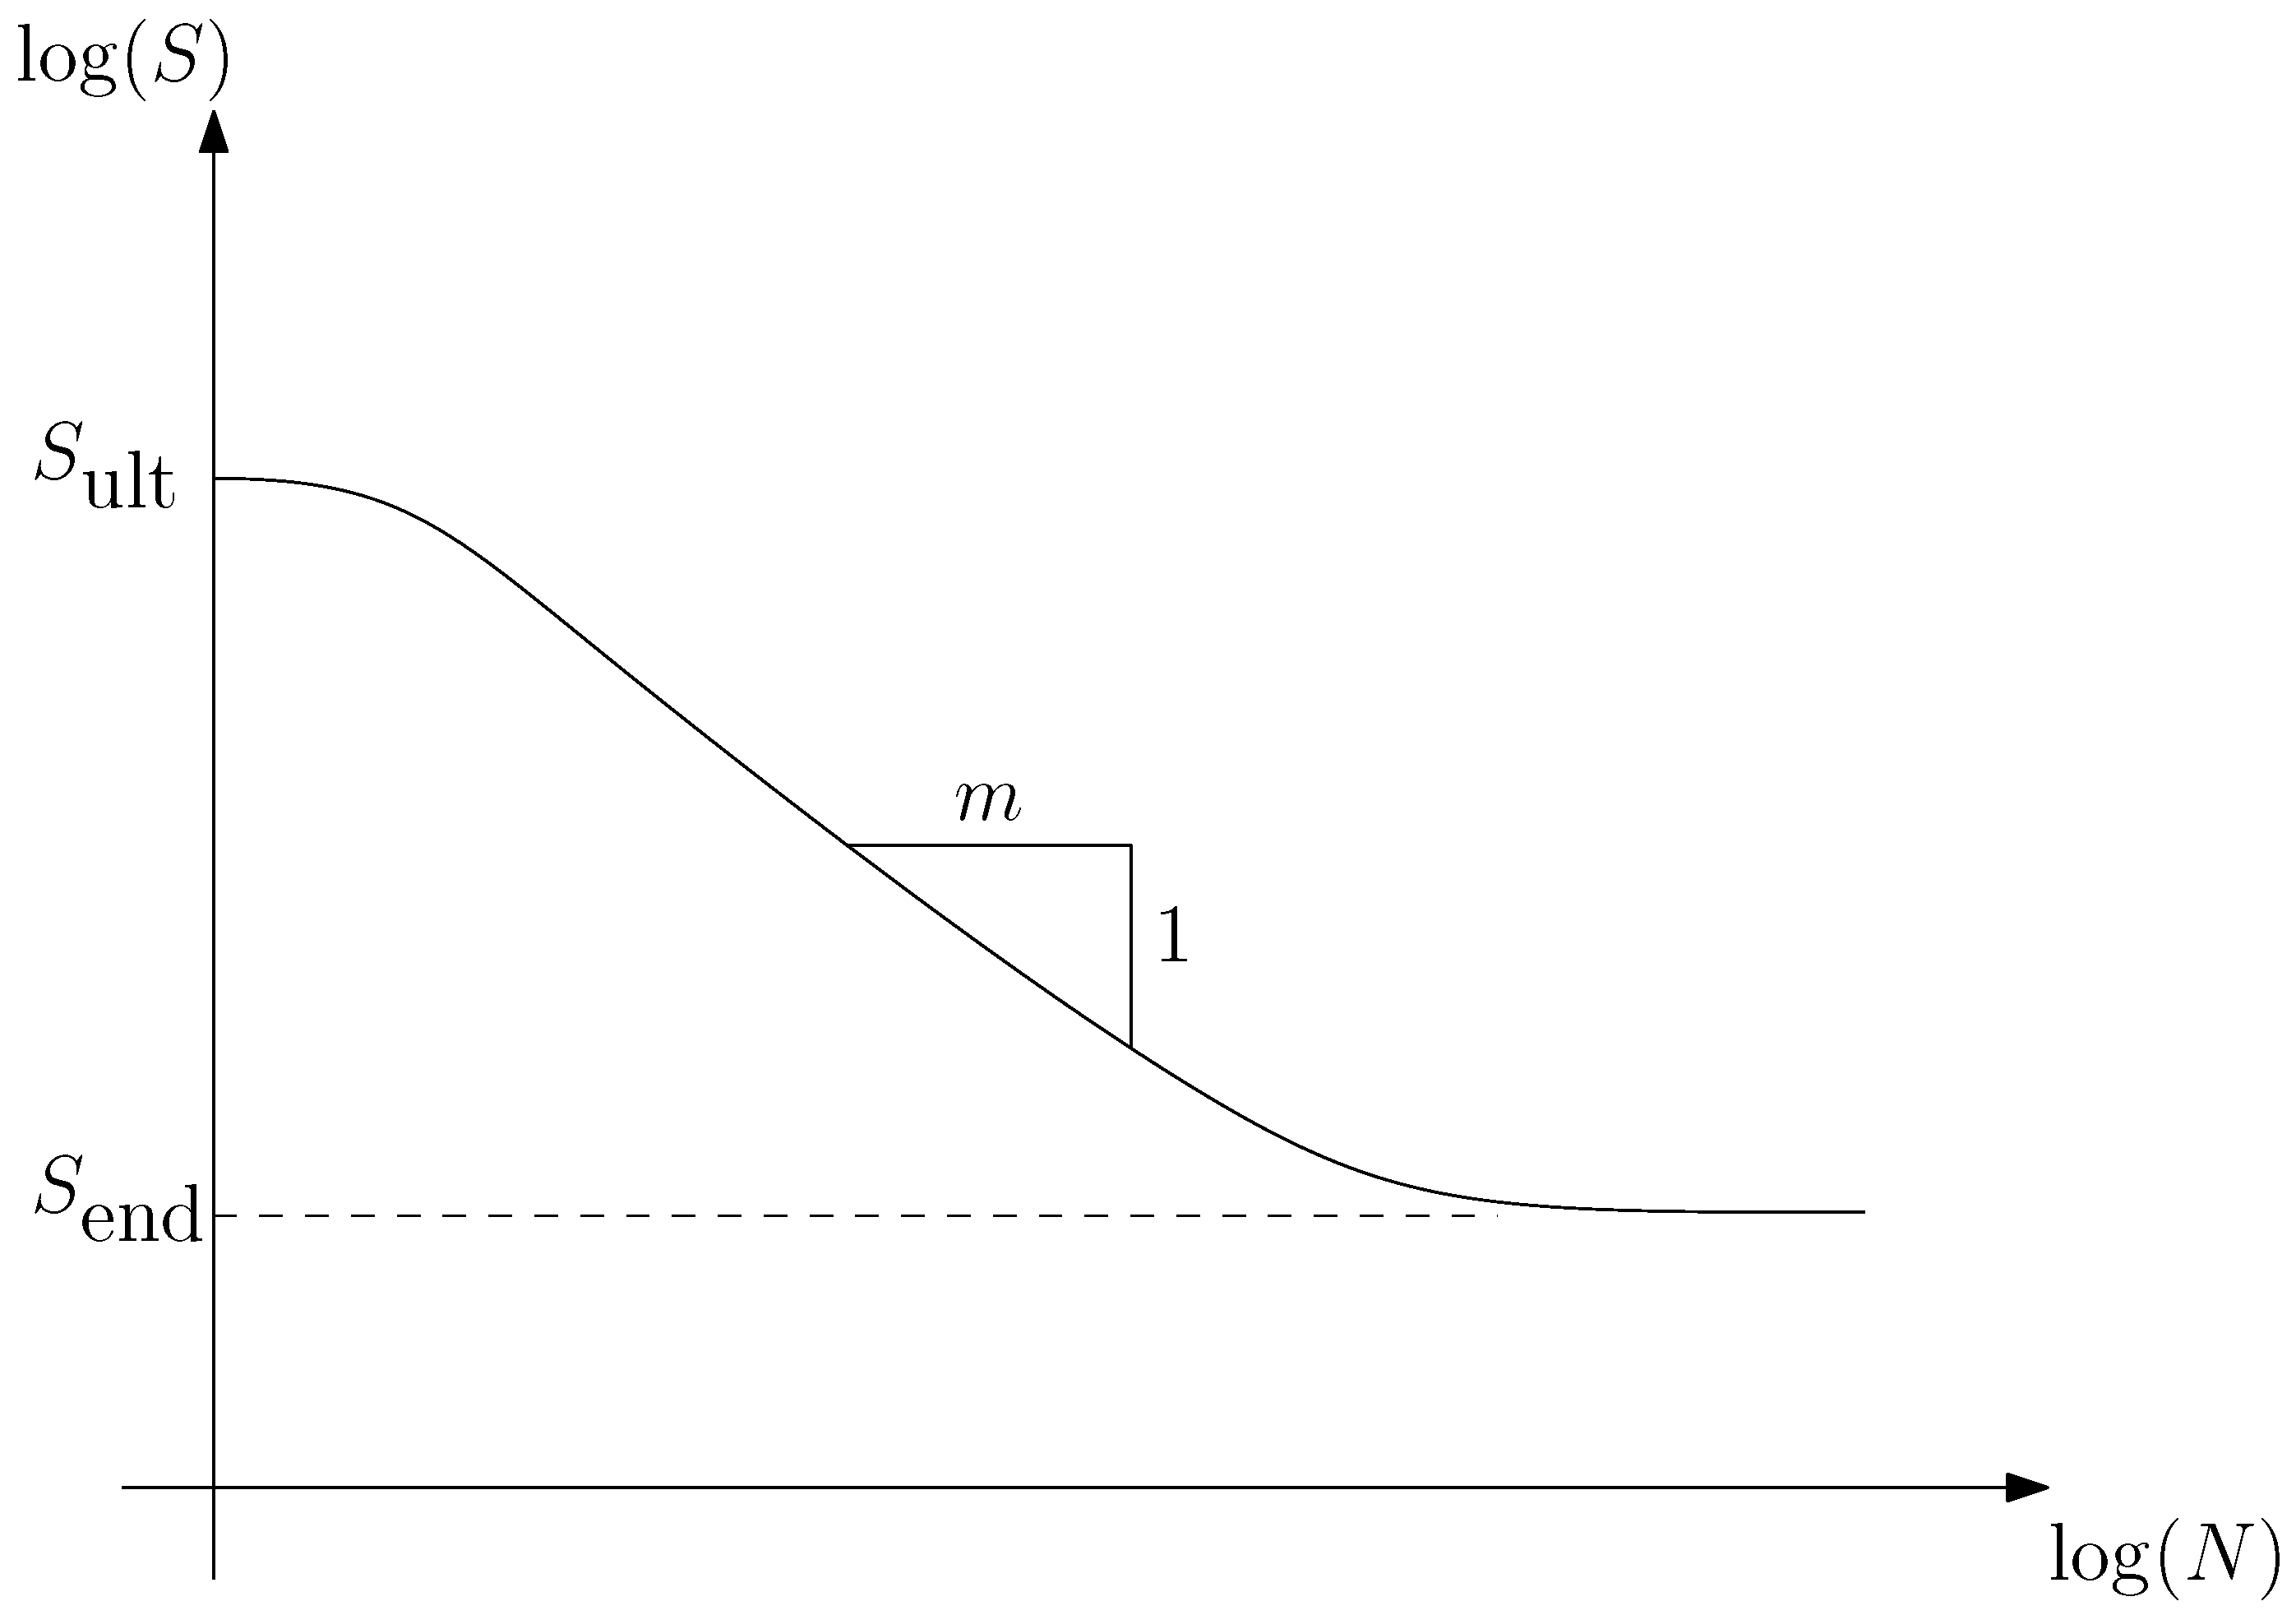
Through experimental testing and numerical modeling of specific design cases, it is possible to generate large amounts of data for responses of interest identified through an FMEA. To utilize these results within the WEC design process, we must distill and/or extrapolate these results to estimate a single design values in either fatigue and/or ultimate loading. Depending on the design case and failure mode, fatigue or extreme responses can be considered.

8.1. Fatigue

In addition to extreme loads, a WEC must also be structurally able to withstand fatigue loading for its design lifetime. Fatigue loads are time-varying loads, which cause cumulative damage to structural components and eventually lead to structural failure. Usually, a component’s fatigue life/strength is reported in terms of an S-N curve (see, e.g., [100,101]). The S-N curve, which is typically obtained empirically, gives the number of load cycles, N, to failure at constant load amplitude, S, as illustrated in Figure 5. Mathematically, the behavior in Figure 5 is given by, log ( N ) = log ( K ) m log ( S ) . Here, S ult is the ultimate strength, S end is the endurance limit below which no failure occurs with constant amplitude loading, m is the slope of the S-N curve and K is an empirical material constant determining the level of the S-N curve.
WEC loads, however, are typically highly variable and by no means of constant amplitude. The most common method used to predict the cumulative damage due to variable loading is the Palmgren–Miner rule. The Palmgren–Miner rule is based on the assumption that the cumulative damage of each load cycle is sequence independent, and thus, the total damage equivalent load, S N , is obtained with a linear summation of the distributed load ranges [102].
S N = S i m n i / N m
Here, S i is the load range for bin i and n i is the number of cycles for load range bin i. The discretized load distribution used in Equation (5) is usually obtained via the rain-flow counting method [103].
Fatigue analyses have been used increasingly in studies of WECs [104,105,106]. These have begun to provide some guidance on the calibration of design factors when considering fatigue in a WEC and have also allowed for some more refined estimates of reliability and maintenance [107]. Thies et al. [108] investigated mooring fatigue in WECs, which is known to be an important consideration for some WEC designs. Thies et al. found large uncertainties in the spread mooring system’s line fatigue loads. A number of studies have also considered fatigue in WEC design in conjunction with the assessment of control strategies [58,109].

8.2. Extreme Response Statistics

As illustrated in Figure 1, extreme response statistics are employed to obtain long-term characteristic design loads for a specific design case. As an intermediary step, a “short-term” extreme response (i.e., the sea state-specific extreme response) is also generally computed. However, as discussed in Section 2, the process to obtain a characteristic load (“long-term” response) depends on the design frame work utilized (i.e., all sea states, contour, or 1D approaches shown in Figure 2). Coles [110] provides an excellent general introduction to extreme response statistics. Naess and Moan [111] cover the application of extreme response statistics to marine systems.
A broad comparison of different short-term extreme response methods applied to WECs is presented by Michelen and Coe [37] (many of these methods have been implemented in an open-source toolbox [48]). In general, short-term extreme response methods attempt to balance the amount of data utilized with the importance of that data to predicting extremes. While more data are typically beneficial, the amount of data required to perform an analysis is highly-dependent on both the method being used and the response being considered. The block-maxima method requires a large amount of data and is therefore often seen as more robust. However, in order to be effective, the block-maxima method (as with other extreme response methods) requires a sufficient amount of data. In the interest of better understanding the amount of required data, Agarwal [39] developed a convergence criterion for short-term load statistics of offshore wind turbines based on bootstrapping. Global and block maxima methods were used to produce extreme response distributions; however, it was shown that the block maxima method offered no advantage over the global maxima method for the system studied.
Other methods, such as all-peaks Weibull fitting, peaks-over-threshold methods and Weibull tail-fitting, attempt to use less data by focusing more on the tail of the distribution (see, e.g., [110,111]). Naess [112] developed a method that exploits an envelope process of some narrow-banded response. Since the extremes of the envelope process are very similar to those of the underlying process, the envelope process can be analyzed instead. Another alternative is the average conditional exceedance rate (ACER) method, which utilizes the conditional exceedance rate of a process to create an extreme response distribution [113].
The frequency response of the load being considered also plays a role in the amount of data required to perform a short-term extreme response analysis. Responses with lower frequency content (e.g., mooring loads) will require longer simulations/experiments than those with higher frequency content. Vazquez-Hernandez et al. [114] used Weibull-tail fitting and a number of other methods to find design loads of mooring lines in floating platforms. This study observed a large degree of variability in extreme distribution extrapolation for short-term extremes. Very rare events, such a slamming and overtopping, carry their own additional challenge for characterization of survival loads. Lian and Haver [115] examined the process to obtain the response statistics due to a slamming on a semisubmersible offshore oil and gas structure. For slamming loads, this study observed large variability in loading due to subtle differences in wave trains. As such, roughly ten-times the number of sea state realizations were needed to accurately characterize the load when compared with other responses.

9. Conclusions

A survey of practices for survival and design response analysis of WECs has been presented. Considering a general workflow for this process, subprocesses, including design case specification, environmental characterization, modeling, experimental testing, fatigue and extreme response statistics, were examined in detail. For each of these component steps in the workflow of considering the design response of WEC, we have presented a survey of available methods and common practices. Together, these tools comprise a set that can be applied to assess WEC survival in a variety of ways.
Further research and application of these tools will lead to refinements and, likely, a down-selection to a smaller subset of tools, which can be considered definitive best-practices. Thus, to achieve this goal, future studies should be conducted to better explore the WEC design process. While, as shown in this survey, there has been a large number of studies that report on the application of some subset of steps within the design process, there is a need for sharing experiences on conducting more complete WEC design analyses. Such case-studies would likely prove very useful to individual designers and researchers, as well as those looking to define technical specifications and standards.

Acknowledgments

This work was funded by the U.S. Department of Energy’s Water Power Technologies Office. Sandia National Laboratories is a multi-mission laboratory managed and operated by National Technology and Engineering Solutions of Sandia, LLC., a wholly-owned subsidiary of Honeywell International, Inc., for the U.S. Department of Energy’s National Nuclear Security Administration under Contract DE-NA0003525. This work was also supported by the U.S. Department of Energy under Contract No. DE-AC36-08GO28308 with the National Renewable Energy Laboratory.

Author Contributions

R.G.C., Y.-H.Y. and J.v.R. wrote the paper.

Conflicts of Interest

R.G.C. serves as the subject-matter expert for the IEC 62600 MT-2, which is charged with revising the IEC TS 62600-2 (“Design requirements for marine energy systems”). The funding sponsors had no role in the design of the study; in the collection, analyses or interpretation of data; in the writing of the manuscript; nor in the decision to publish the results.

Abbreviations

The following abbreviations are used in this manuscript:
ABSAmerican Bureau of Shipping
ACERaverage conditional exceedance rate
CECcurrent energy converter
CFDcomputational fluid dynamics
CMSconditional monitoring system
DNVDet Norske Veritas
FEAfinite element analysis
FMEAfailure modes and effects analysis
FMECAfailure mode, effects and criticality analysis
IECInternational Electrotechnical Commission
I-FORMinverse first-order reliability method
ITTCInternational Towing Tank Conference
LCOElevelized cost of energy
LEClife extending control
NDBCNational Data Buoy Center
PCAprinciple component analysis
PTOpower take-off
RM3Reference Model 3
TECtidal energy converter
TStechnical specification
WECwave energy converter

References

  1. Coe, R.G.; Neary, V.S.; Lawson, M.J.; Yu, Y.H.; Weber, J. Extreme Conditions Modeling Workshop Report; Technical Report NREL/TP-5000-62305 SNL/SAND2014-16384R; Sandia National Laboratories: Albuquerque, NM, USA, 2014.
  2. International Electrotechnical Commission. Marine Energy—Wave, Tidal and Other Water Current Converters—Part 2: Design Requirements for Marine Energy Systems; IEC TS 62600-2:2016; IEC: Geneva, Switzerland, 2016. [Google Scholar]
  3. NORSOK. Actions and Action Effects (N-003); N-003; Standards Norway: Oslo, Norway, 2007. [Google Scholar]
  4. Det Norske Veritas. Environmental Conditions and Environmental Loads; DNV-RP-C205; Det Norske Veritas: Oslo, Norway, 2007. [Google Scholar]
  5. American Bureau of Shipping. Design Standards for Offshore Wind Farms; M10PC00105; American Bureau of Shipping: Houston, TX, USA, 2011. [Google Scholar]
  6. Det Norske Veritas. Design of Offshore Wind Turbine Structures; DNV-OS-J101; Det Norske Veritas: Oslo, Norway, 2014. [Google Scholar]
  7. International Electrotechnical Commission. Design Requirements for Offshore Wind Turbines; IEC 61400-3:2009; International Electrotechnical Commission: Geneva, Switzerland, 2014. [Google Scholar]
  8. Coe, R.G.; Neary, V.S. Review of Methods for Modeling Wave Energy Converter Survival in Extreme Sea States. In Proceedings of the 2nd Marine Energy Technology Symposium, Seattle, WA, USA, 15–17 April 2014. [Google Scholar]
  9. Whittaker, T.; Collier, D.; Folley, M.; Osterried, M.; Henry, A.; Crowley, M. The development of Oyster—A shallow water surging wave energy converter. In Proceedings of the 7th European Wave and Tidal Energy Conference (EWTEC2007), Porto, Portugal, 11–14 September 2007. [Google Scholar]
  10. Beatty, S.J.; Hiles, C.E.; Nicoli, R.S.; Adamson, J.E.; Buckham, B.J. Design Synthesis of a Wave Energy Converter. In Proceedings of the 28th International Conference on Ocean, Offshore and Arctic Engineering (OMAE2009), Honolulu, HI, USA, 31 May–5 June 2009. [Google Scholar]
  11. Yu, Y.H.; Li, Y. Preliminary results of a RANS simulation for a floating point absorber wave energy system under extreme wave conditions. In Proceedings of the 30th International Conference on Ocean, Offshore and Arctic Engineering (OMAE2011), Rotterdam, The Netherlands, 19–24 June 2011. [Google Scholar]
  12. Stillinger, C.; Brekken, T.; von Jouanne, A. Furthering the study of real-time life extending control for ocean energy conversion. In Proceedings of the IEEE Power and Energy Society General Meeting, San Diego, CA, USA, 22–26 July 2012. [Google Scholar]
  13. Tom, N.M.; Yu, Y.H.; Wright, A.D.; Lawson, M.J. Pseudo-spectral control of a novel oscillating surge wave energy converter in regular waves for power optimization including load reduction. Ocean Eng. 2017, 137, 352–366. [Google Scholar] [CrossRef]
  14. Hals, J.; Falnes, J.; Moan, T. A Comparison of Selected Strategies for Adaptive Control of Wave Energy Converters. J. Offshore Mech. Arct. Eng. 2011, 133, 031101. [Google Scholar] [CrossRef]
  15. Wang, L.; Engström, J.; Göteman, M.; Isberg, J. Constrained optimal control of a point absorber wave energy converter with linear generator. J. Renew. Sustain. Energy 2015, 7, 043127. [Google Scholar] [CrossRef]
  16. Coe, R.G.; Bacelli, G.; Wilson, D.; Abdelkhalik, O.; Korde, U.A.; Robinett, R.D., III. A comparison of control strategies for wave energy converters. Int. J. Mar. Energy 2017, 20, 45–63. [Google Scholar]
  17. Retzler, C.H.; Pizer, D.J. The hydrodynamics of the PELAMIS wave energy device: experimental and numerical results. In Proceedings of the 20th International Conference on Offshore Mechanics and Arctic Engineering (OMAE2001), Rio de Janeiro, Brazil, 3–8 June 2001. [Google Scholar]
  18. Stallard, T.J.; Weller, S.D.; Stansby, P.K. Limiting heave response of a wave energy device by draft adjustment with upper surface immersion. Appl. Ocean Res. 2009, 31, 282–289. [Google Scholar] [CrossRef]
  19. Palm, J.; Eskilsson, C.; Moura Paredes, G.; Bergdahl, L. CFD Simulation of a Moored Floating Wave Energy Converter. In Proceedings of the 10th European Wave and Tidal Energy Conference (EWTEC), Aalborg, Denmark, 2–6 September 2013. [Google Scholar]
  20. Parmeggiani, S.; Kofoed, J.P.; Friis-Madsen, E. Extreme Loads on the Mooring Lines and Survivability Mode for the Wave Dragon Wave Energy Converter. In Proceedings of the World Renewable Energy Congress (WREC), Linköping, Sweden, 8–13 May 2011. [Google Scholar]
  21. Parmeggiani, S.; Muliawan, M.J.; Gao, Z.; Moan, T.; Friis-Madsen, E. Comparison of Mooring Loads in Survivability Mode on the Wave Dragon Wave Energy Converter Obtained by a Numerical Model and Experimental Data. In Proceedings of the 31st International Conference on Ocean, Offshore and Arctic Engineering (OMAE2012), Rio de Janeiro, Brazil, 1–6 July 2012; pp. 341–350. [Google Scholar]
  22. Pecher, A.; Kofoed, J.P.; Larsen, T. Design Specifications for the Hanstholm WEPTOS Wave Energy Converter. Energies 2012, 5, 1001–1017. [Google Scholar] [CrossRef]
  23. Wan, L.; Gao, Z.; Moan, T. Experimental and numerical study of hydrodynamic responses of a combined wind and wave energy converter concept in survival modes. Coast. Eng. 2015, 104, 151–169. [Google Scholar] [CrossRef]
  24. Zurkinden, A.S.; Damkilde, L.; Gao, Z.; Moan, T. Structural modeling and analysis of a wave energy converter applying dynamical substructuring method. In Proceedings of the 32nd International Conference on Ocean, Offshore and Arctic Engineering (OMAE2013), Nantes, France, 9–14 June 2013. [Google Scholar]
  25. Kenny, C.J.; Findlay, D.; Lazakis, I.; Shek, J.; Thies, P.R. Development of a Condition Monitoring System for an Articulated Wave Energy Converter. In Proceedings of the European Safety and Reliability Conference (ESREL 2016), Glasgow, Scotland, 25–29 September 2016. [Google Scholar]
  26. Kenny, C.J.; Findlay, D.; Thies, P.R.; Shek, J.; Lazakis, I. Lessons Learned from 3 Years of Failure: Validating an FMEA with Historical Failure Data. In Proceedings of the 12th European Wave and Tidal Energy Conference (EWTEC2017), Cork, Ireland, 27 August–1 September 2017. [Google Scholar]
  27. Okoro, U.; Kolios, A.; Cui, L. Multi-criteria risk assessment approach for components risk ranking—The case study of an offshore wave energy converter. Int. J. Mar. Energy 2017, 17, 21–39. [Google Scholar]
  28. Coe, R.G.; Michelen, C.; Eckert-Gallup, A.; Sallaberry, C. Full long-term design response analysis of a wave energy converter. Renew. Energy 2018, 116, 356–366. [Google Scholar] [CrossRef]
  29. Muliawan, M.J.; Gao, Z.; Moan, T. Application of the Contour Line Method for Estimating Extreme Responses in the Mooring Lines of a Two-Body Floating Wave Energy Converter. J. Offshore Mech. Arct. Eng. 2013, 135, 031301. [Google Scholar]
  30. Winterstein, S.R.; Ude, T.C.; Cornell, C.A.; Bjerager, P.; Haver, S. Environmental parameters for extreme response: Inverse FORM with omission factors. In Proceedings of the 6th International Conference on Structural Safety & Reliability (ICOSSAR), Innsbruck, Austria, 9–13 August 1993. [Google Scholar]
  31. Haver, S.; Winterstein, S.R. Environmental contour lines: A method for estimating long term extremes by a short term analysis. Trans. Soc. Nav. Archit. Mar. Eng. 2009, 116, 116–127. [Google Scholar]
  32. Yu, Y.H.; Van Rij, J.; Coe, R.; Lawson, M. Preliminary Wave Energy Converters Extreme Load Analysis. In Proceedings of the 35th International Conference on Ocean, Offshore and Arctic Engineering (OMAE2015), St. John’s, NL, Canada, 19–24 June 2015. [Google Scholar]
  33. Baarholm, G.S.; Haver, S.; ∅kland, O.D. Combining contours of significant wave height and peak period with platform response distributions for predicting design response. Mar. Struct. 2010, 23, 147–163. [Google Scholar] [CrossRef]
  34. Haver, S.; Sagli, G.; Gran, T. Long term response analysis of fixed and floating structures. In Proceedings of the 1998 International OTRC Symposium, Houston, TX, USA, 30 April–1 May 1998. [Google Scholar]
  35. Rendon, E.A.; Manuel, L. Long-term loads for a monopile-supported offshore wind turbine. Wind Energy 2014, 17, 209–223. [Google Scholar] [CrossRef]
  36. Ren, N.; Gao, Z.; Moan, T.; Wan, L. Long-term performance estimation of the Spar-Torus-Combination (STC) system with different survival modes. Ocean Eng. 2015, 108, 716–728. [Google Scholar] [CrossRef]
  37. Michelen, C.; Coe, R. Comparison of Methods for Estimating Short-Term Extreme Response of Wave Energy Converters. In Proceedings of the OCEANS 2015—MTS/IEEE Washington, Washington, DC, USA, 19–22 October 2015. [Google Scholar]
  38. Fonseca, N.; Pascoal, R.; Morais, T.; Dias, R. Design of a mooring system with synthetic ropes for the FLOW wave energy converter. In Proceedings of the 28th International Conference on Ocean, Offshore and Arctic Engineering (OMAE2009), Honolulu, HI, USA, 31 May–5 June 2009; pp. 1189–1198. [Google Scholar]
  39. Agarwal, P. Structural Reliability of Offshore Wind Turbines. Ph.D. Thesis, The University of Texas at Austin, Austin, TX, USA, 2008. [Google Scholar]
  40. Ruggiero, P.; Komar, P.D.; Allan, J.C. Increasing wave heights and extreme value projections: The wave climate of the U.S. Pacific Northwest. Coast. Eng. 2010, 57, 539–552. [Google Scholar] [CrossRef]
  41. Young, I.; Zieger, S.; Babanin, A.V. Global trends in wind speed and wave height. Science 2011, 332, 451–455. [Google Scholar] [CrossRef] [PubMed]
  42. Reeve, D.; Chen, Y.; Pan, S.; Magar, V.; Simmonds, D.; Zacharioudaki, A. An investigation of the impacts of climate change on wave energy generation: The Wave Hub, Cornwall, UK. Renew. Energy 2011, 36, 2404–2413. [Google Scholar] [CrossRef] [Green Version]
  43. Haver, S. On the joint distribution of heights and periods of sea waves. Ocean Eng. 1987, 14, 359–376. [Google Scholar] [CrossRef]
  44. Silva-González, F.; Heredia-Zavoni, E.; Montes-Iturrizaga, R. Development of environmental contours using Nataf distribution model. Ocean Eng. 2013, 58, 27–34. [Google Scholar] [CrossRef]
  45. Huseby, A.B.; Vanem, E.; Natvig, B. A new approach to environmental contours for ocean engineering applications based on direct Monte Carlo simulations. Ocean Eng. 2013, 60, 124–135. [Google Scholar] [CrossRef]
  46. Vanem, E.; Bitner-Gregersen, E.M. Alternative environmental contours for marine structural design—A comparison study. J. Offshore Mech. Arct. Eng. 2015, 137, 051601. [Google Scholar]
  47. Eckert-Gallup, A.C.; Sallaberry, C.J.; Dallman, A.R.; Neary, V.S. Application of principal component analysis (PCA) and improved joint probability distributions to the inverse first-order reliability method (I-FORM) for predicting extreme sea states. Ocean Eng. 2016, 112, 307–319. [Google Scholar] [CrossRef]
  48. Coe, R.G.; Michelen, C.; Eckert-Gallup, A.C.; Yu, Y.H.; van Rij, J. WDRT: A toolbox for design-response analysis of wave energy converters. In Proceedings of the 4th Marine Energy Technology Symposium, Washington, DC, USA; 2016. [Google Scholar]
  49. Ochi, M.K. Ocean Waves: The Stochastic Approach; Cambridge University Press: Cambridge, UK, 2005; Volume 6. [Google Scholar]
  50. Faltinsen, O. Sea Loads on Ships and Offshore Structures; Cambridge University Press: Cambridge, UK, 1993; Volume 1. [Google Scholar]
  51. Ochi, M.K. Wave statistics for the design of ships and ocean structures. Trans. Soc. Nav. Archit. Mar. Eng. 1978, 86, 47–76. [Google Scholar]
  52. Tromans, P.S.; Anaturk, A.R.; Hagemeijer, P. A new model for the kinematics of large ocean waves-application as a design wave. In Proceedings of the 1st International Offshore and Polar Engineering Conference, Edinburgh, UK, 11–16 August 1991; pp. 64–71. [Google Scholar]
  53. Orszaghova, J.; Rafiee, A.; Wolgamot, H.; Draper, S.; Taylor, P. Experimental Study of Extreme Responses of a Point Absorber Wave Energy Converter. In Proceedings of the 20th Australasian Fluid Mechanics Conference, Perth, Australia, 1–8 December 2016. [Google Scholar]
  54. Weller, S.; Stallard, T.; Stansby, P. Experimental measurements of the complex motion of a suspended axisymmetric floating body in regular and near-focused waves. Appl. Ocean Res. 2013, 39, 137–145. [Google Scholar] [CrossRef]
  55. Rafiee, A.; Wolgamot, H.; Draper, S.; Orszaghova, J.; Fiévez, J.; Sawyer, T. Identifying the design wave group for the extreme response of a point absorber wave energy converter. In Proceedings of the Asian Wave and Tidal Energy Conference (AWTEC), Singapore, 24–28 October 2016. [Google Scholar]
  56. Santo, H.; Taylor, P.; Moreno, E.C.; Stansby, P.; Taylor, R.E.; Sun, L.; Zang, J. Extreme motion and response statistics for survival of the three-float wave energy converter M4 in intermediate water depth. J. Fluid Mech. 2017, 813, 175–204. [Google Scholar] [CrossRef]
  57. Hann, M.; Greaves, D.; Raby, A.; Howey, B. Use of constrained focused waves to measure extreme loading of a taut moored floating wave energy converter. Ocean Eng. 2018, 148, 33–42. [Google Scholar] [CrossRef]
  58. Quon, E.; Platt, A.; Yu, Y.H.; Lawson, M. Application of Most Likely Extreme Response Method for Wave Energy Converters. In Proceedings of the 35th International Conference on Ocean, Offshore and Arctic Engineering (OMAE2016), Busan, Korea, 19–24 June 2016. [Google Scholar]
  59. Taylor, P.H.; Jonathan, P.; Harland, L.A. Time domain simulation of jack-up dynamics with the extremes of a Gaussian process. J. Vib. Acoust. 1997, 119, 624–628. [Google Scholar] [CrossRef]
  60. Göteman, M.; Engström, J.; Eriksson, M.; Hann, M.; Ransley, E.; Greaves, D.; Leijon, M. Wave loads on a point-absorbing wave energy device in extreme waves. In Proceedings of the 25th International Ocean and Polar Engineering Conference, Kona, HI, USA, 21–26 June 2015. [Google Scholar]
  61. Topper, M.B. Guidance for Numerical Modelling in Wave and Tidal Energy; SuperGen Marine; The University of Edinburgh: Edinburgh, Scotland, 2010. [Google Scholar]
  62. Penalba, M.; Giorgi, G.; Ringwood, J.V. Mathematical modelling of wave energy converters: A review of nonlinear approaches. Renew. Sustain. Energy Rev. 2017, 78, 1188–1207. [Google Scholar] [CrossRef]
  63. Folley, M.; Babarit, A.; Child, B.; Forehand, D.; O’Boyle, L.; Silverthorne, K.; Spinneken, J.; Stratigaki, V.; Troch, P. A Review of Numerical Modelling of Wave Energy Converter Arrays. In Proceedings of the 31st International Conference on Ocean, Offshore and Arctic Engineering (OMAE2012), Rio de Janeiro, Brazil, 1–6 July 2012; pp. 535–545. [Google Scholar]
  64. Li, Y.; Yu, Y.H. A synthesis of numerical methods for modeling wave energy converter-point absorbers. Renew. Sustain. Energy Rev. 2012, 16, 4352–4364. [Google Scholar] [CrossRef]
  65. Falnes, J. Ocean Waves and Oscillating Systems; Cambridge University Press: Cambridge, UK, 2002. [Google Scholar]
  66. Newman, J.N. Marine Hydrodynamics; MIT Press: Cambridge, MA, USA, 1978. [Google Scholar]
  67. WAMIT. WAMIT User Manual, 7th ed.; WAMIT: Chestnut Hill, MA, USA, 2012. [Google Scholar]
  68. Babarit, A.; Delhommeau, G. Theoretical and numerical aspects of the open source BEM solver NEMOH. In Proceedings of the 11th European Wave and Tidal Energy Conference (EWTEC2015), Nantes, France, 6–11 September 2015. [Google Scholar]
  69. Bacelli, G.; Coe, R.G.; Patterson, D.; Wilson, D. System Identification of a Heaving Point Absorber: Design of Experiment and Device Modeling. Energies 2017, 10, 472. [Google Scholar] [CrossRef]
  70. Kim, Y.; Kim, J.H.; Kim, Y. Time series prediction of nonlinear ship structural responses in irregular seaways using a third-order Volterra model. J. Fluids Struct. 2014, 49, 322–337. [Google Scholar] [CrossRef]
  71. Gkikas, G.; Athanassoulis, G. Development of a novel nonlinear system identification scheme for the pressure fluctuation inside an oscillating water column-wave energy converter Part I: Theoretical background and harmonic excitation case. Ocean Eng. 2014, 80, 84–99. [Google Scholar] [CrossRef]
  72. Cummins, W.E. The Impulse Response Function and Ship Motions; Technical Report DTNSDRC 1661; Department of the Navy, David Taylor Model Basin: Bethesda, MD, USA, 1962. [Google Scholar]
  73. Lawson, M.; Yu, Y.H.; Nelessen, A.; Ruehl, K.; Michelen, C. Implementing Nonlinear Buoyancy and Excitation Forces in the WEC-Sim Wave Energy Converter Modeling Tool. In Proceedings of the 33rd International Conference on Ocean, Offshore and Arctic Engineering (OMAE2014), San Francisco, CA, USA, 8–13 June 2014. [Google Scholar]
  74. Penalba, M.R.; Mérigaud, A.; Gilloteaux, J.C.; Ringwood, J. Nonlinear Froude-Krylov force modelling for two heaving wave energy point absorbers. In Proceedings of the 11th European Wave and Tidal Energy Conference (EWTEC2015), Nantes, France, 6–11 September 2015. [Google Scholar]
  75. Merigaud, A.; Gilloteaux, J.C.; Ringwood, J. A nonlinear extension for linear boundary element methods in wave energy device modelling. In Proceedings of the International Conference on Offshore Mechanics and Arctic Engineering (OMAE2012), Rio de Janeiro, Brazil, 1–6 July 2012. [Google Scholar]
  76. Gilloteaux, J.C.; Bacelli, G.; Ringwood, J. A non-linear potential model to predict large-amplitudes-motions: Application to a multi-body wave energy converter. In Proceedings of the 10th World Renewable Energy Congress (WREC), Glasgow, Scotland, 19–25 July 2008; Sayigh, A., Ed.; WREC: Brighton, UK, 2008; pp. 934–939. [Google Scholar]
  77. Zurkinden, A.S.; Ferri, F.; Beatty, S.; Kofoed, J.P.; Kramer, M. Non-linear numerical modeling and experimental testing of a point absorber wave energy converter. Ocean Eng. 2014, 78, 11–21. [Google Scholar] [CrossRef]
  78. Sirnivas, S.; Yu, Y.H.; Hall, M.; Bosma, B. Coupled mooring analyses for the WEC-Sim wave energy converter design tool. In Proceedings of the 35th International Conference on Ocean, Offshore and Arctic Engineering (OMAE2016), Busan, Korea, 19–24 June 2016. [Google Scholar]
  79. Giorgi, G.; Ringwood, J.V. Nonlinear Froude-Krylov and viscous drag representations for wave energy converters in the computation/fidelity continuum. Ocean Eng. 2017, 141, 164–175. [Google Scholar] [CrossRef]
  80. Bharath, A.; Nader, J.R.; Penesis, I.; Macfarlane, G. Nonlinear hydrodynamic effects on a generic spherical wave energy converter. Renew. Energy 2018, 118, 56–70. [Google Scholar] [CrossRef]
  81. Kring, D.C. Time Domain Ship Motions by a Three-Dimensional Rankine Panel Method. Ph.D. Thesis, Massachusetts Institute of Technology, Cambridge, MA, USA, 1994. [Google Scholar]
  82. Shin, Y.; Belenky, V.; Lin, W.; Weems, K.; Engle, A. Nonlinear Time Domain Simulation Technology for Seakeeping and Wave-Load Analysis for Modern Ship Design. Trans. Soc. Nav. Archit. Mar. Eng. 2003, 111, 557–583. [Google Scholar]
  83. Letournel, L.; Ferrant, P.; Babarit, A.; Ducrozet, G.; Harris, J.C.; Benoit, M.; Dombre, E. Comparison of fully nonlinear and weakly nonlinear potential flow solvers for the study of wave energy converters undergoing large amplitude motions. In Proceedings of the 33rd International Conference on Ocean, Offshore and Arctic Engineering (OMAE2014), San Francisco, CA, USA, 8–13 June 2014; p. 23912. [Google Scholar]
  84. Greenhow, M.; Vinje, T.; Brevig, P.; Taylor, J. A theoretical and experimental study of the capsize of Salter’s duck in extreme waves. J. Fluid Mech. 1982, 118, 221–239. [Google Scholar] [CrossRef]
  85. Guerber, E.; Benoit, M.; Grilli, S.T.; Buvat, C. A fully nonlinear implicit model for wave interactions with submerged structures in forced or free motion. Eng. Anal. Bound. Elem. 2012, 36, 1151–1163. [Google Scholar] [CrossRef] [Green Version]
  86. International Towing Tank Conference. Practical Guidelines for Ship CFD Applications; Technical Report 7.5-03-02-03; International Towing Tank Conference: Rio de Janeiro, Brazil, 2011. [Google Scholar]
  87. Ransley, E.; Greaves, D.; Raby, A.; Simmonds, D.; Hann, M. Survivability of wave energy converters using CFD. Renew. Energy 2017, 109, 235–247. [Google Scholar] [CrossRef]
  88. Yu, Y.H.; Li, Y. Reynolds-Averaged Navier-Stokes simulation of the heave performance of a two-body floating-point absorber wave energy system. Comput. Fluids 2013, 73, 104–114. [Google Scholar] [CrossRef]
  89. Neary, V.S.; Lawson, M.; Previsic, M.; Copping, A.; Hallett, K.C.; Labonte, A.; Rieks, J.; Murray, D. Methodology for Design and Economic Analysis of Marine Energy Conversion (MEC) Technologies; Technical Report SAND2014-9040; Sandia National Laboratories: Albuquerque, NM, USA, 2014.
  90. Sjökvist, L.; Göteman, M. Peak Forces on Wave Energy Linear Generators in Tsunami and Extreme Waves. Energies 2017, 10, 1323. [Google Scholar]
  91. Westphalen, J.; Greaves, D.M.; Raby, A.; Hu, Z.Z.; Causon, D.M.; Mingham, C.G.; Omidvar, P.; Stansby, P.K.; Rogers, B.D. Investigation of Wave-Structure Interaction Using State of the Art CFD Techniques. Open J. Fluid Dyn. 2014, 4, 18–43. [Google Scholar] [CrossRef]
  92. Madhi, F.; Yeung, R.W. On survivability of asymmetric wave-energy converters in extreme waves. Renew. Energy 2017, in press. [Google Scholar]
  93. Holmes, B. Tank Testing of Wave Energy Conversion Systems: Marine Renewable Energy Guides; European Marine Energy Centre: Orkney, Scotland, 2009. [Google Scholar]
  94. International Towing Tank Conference. Wave Energy Converter Model Test Experiments; 7.5-02-07-03.7; International Towing Tank Conference: Rio de Janeiro, Brazil, 2011. [Google Scholar]
  95. International Towing Tank Conference. Final Report and Recommendations to the 23rd ITTC—The Specialist Committee on Waves; International Towing Tank Conference: Rio de Janeiro, Brazil, 2002. [Google Scholar]
  96. Payne, G. Guidance for the Experimental Tank Testing of Wave Energy Converters; SuperGen Marine; University of Strathclyde: Glasgow, Scotland, 2008. [Google Scholar]
  97. Henry, A.; Kimmoun, O.; Nicholson, J.; Dupont, G.; Wei, Y.; Dias, F. A two dimensional experimental investigation of slamming of an oscillating wave surge converter. In Proceedings of the Twenty-Fourth International Ocean and Polar Engineering Conference, Busan, Korea, 15–20 June 2014. [Google Scholar]
  98. Blommaert, C.; Van Paepegem, W.; Dhondt, P.; De Backer, P.G.; Degrieck, J.; De Rouck, J.; Vantorre, M.; Van Slycken, J.; De Baere, I.; De Backer, H. Large scale slamming tests on composite buoys for wave energy applications. In Proceedings of the 17th International Conference on Composite Materials (ICCM), Edinburgh, UK, 27–31 July 2010. [Google Scholar]
  99. Van Paepegem, W.; Blommaert, C.; De Baere, I.; Degrieck, J.; De Backer, G.; De Rouck, J.; Degroote, J.; Vierendeels, J.; Matthys, S.; Taerwe, L. Slamming wave impact of a composite buoy for wave energy applications: Design and large-scale testing. Polym. Compos. 2011, 32, 700–713. [Google Scholar] [CrossRef]
  100. Hughes, O.F.; Paik, J.K. Ship Structural Analysis and Design; Society of Naval Architects and Marine Engineers: Jersey City, NJ, USA, 2010. [Google Scholar]
  101. Lewis, E. Principles of Naval Architecture: Stability and Strength; Principles of Naval Architecture, Society of Naval Architects and Marine Engineers: Jersey City, NJ, USA, 1989. [Google Scholar]
  102. Veldkamp, D. Chances in Wind Energy: A Probabilistic Approach to Wind Turbine Fatigue Design. Ph.D. Thesis, Delft University of Technology (TU Delft), Delft, The Netherlands, 2006. [Google Scholar]
  103. Downing, S.D.; Socie, D. Simple rainflow counting algorithms. Int. J. Fatigue 1982, 4, 31–40. [Google Scholar] [CrossRef]
  104. Ambühl, S.; Ferri, F.; Kofoed, J.P.; Sørensen, J.D. Fatigue reliability and calibration of fatigue design factors of wave energy converters. Int. J. Mar. Energy 2015, 10, 17–38. [Google Scholar] [CrossRef]
  105. Ambühl, S.; Kramer, M.; Sørensen, J.D. Reliability-based Calibration of Partial Safety Factors for Wave Energy Converters. In Proceedings of the International Conference on Applications of Statistics and Probability in Civil Engineering (ICASP12), Vancouver, BC, Canada, 12–15 July 2015. [Google Scholar]
  106. Ambühl, S.; Kramer, M.; Sørensen, J.D. Reliability-Based Structural Optimization of Wave Energy Converters. Energies 2014, 7, 8178–8200. [Google Scholar] [CrossRef]
  107. Sørensen, J.D. Reliability and Maintenance for Offshore Wind Turbines and Wave Energy Devices. In Renewable Energies Offshore; CRC Press: Boca Raton, FL, USA, 2015; pp. 39–46. [Google Scholar]
  108. Thies, P.R.; Johanning, L.; Harnois, V.; Smith, H.C.; Parish, D.N. Mooring line fatigue damage evaluation for floating marine energy converters: Field measurements and prediction. Renew. Energy 2014, 63, 133–144. [Google Scholar] [CrossRef] [Green Version]
  109. Ferri, F.; Ambühl, S.; Fischer, B.; Kofoed, J.P. Balancing power output and structural fatigue of wave energy converters by means of control strategies. Energies 2014, 7, 2246–2273. [Google Scholar] [CrossRef]
  110. Coles, S. An Introduction to Statistical Modeling of Extreme Values; Springer: London, UK, 2001. [Google Scholar]
  111. Naess, A.; Moan, T. Stochastic Dynamics of Marine Structures; Cambridge University Press: Cambridge, UK, 2012. [Google Scholar]
  112. Naess, A. Extreme value estimates based on the envelope concept. Appl. Ocean Res. 1982, 4, 181–187. [Google Scholar] [CrossRef]
  113. Naess, A.; Gaidai, O. Estimation of extreme values from sampled time series. Struct. Saf. 2009, 31, 325–334. [Google Scholar] [CrossRef]
  114. Vazquez-Hernandez, A.O.; Sagrilo, L.V.S.; Ellwanger, G.B. On the Extreme Analysis Applied to Moored Floating Platforms. In Proceedings of the 22nd International Conference on Ocean, Offshore and Arctic Engineering (OMAE2003), Cancun, Mexico, 8–13 June 2003; pp. 241–247. [Google Scholar]
  115. Lian, G.; Haver, S.K. Estimating long term extreme slamming from breaking waves. In Proceedings of the 34th International Conference on Ocean, Offshore and Arctic Engineering (OMAE2015), St. Johns, NL, Canada, 31 May–5 June 2015. [Google Scholar]
Figure 1. General WEC design workflow with component processes.
Energies 11 00004 g001
Figure 2. Frameworks for survival/extreme response WEC design cases: all sea state approach shown in red squares; contour approach shown in blue disks; 1D approach shown in green “X” marks.
Energies 11 00004 g002
Figure 3. Data and fifty-year contours for NDBC (National Data Buoy Center) 46022 (off the coast of Eureka, CA, USA).
Energies 11 00004 g003
Figure 4. Design-wave paths.
Energies 11 00004 g004
Figure 5. Typical S-N curve.
Energies 11 00004 g005

