1. Introduction
Different works related to RES and especially wind energy integration are given in the following paragraphs.
In [
1], the International Electro-technical Commission (IEC) analyses the RES integration in different countries from the technical and policy point of view. In addition, IEC provides a series of recommendations regarding RES integration that refers to: better forecasting methods for wind power plants (WPP) and photovoltaic (PV) generation; technical and policy-related integration framework agreed by policies in different economies that can lead to an efficient connection rules and incentives; advanced forecasting model for demand that leads to a more reliable dispatching.
An integration model developed for the whole European power system that is focused on technical aspects regarding RES integration within the timeframe 2030–2050 is described in [
2]. It presents the findings of the SUSPLAN project that include scenarios, recommendations, strategies, benchmarks for a better RES integration in nine European countries or regions. In addition, in [
3] authors refer to infrastructure barriers, investments and financing differences in these regions and propose strategies to accelerate development in grid infrastructure in order to improve the integration of RES.
Power Systems Laboratory from Eidgenössische Technische Hochschule (ETH) Zurich, Switzerland analyses in [
4] the impact on RES integration on power nodes and proposed a framework for power nodes modelling. The paper also presents some simulations regarding RES impact on power nodes in Germany and Switzerland.
In [
5], authors analyze in detail the actual situation of large-scale wind energy integration in China and propose transmission grid reinforcement and supporting policy. The authors take into consideration eight WPP in China, focusing on Gansu Jiuquan with 10 GW-level wind power base.
Renewables integration models and policy are proposed in the book [
6], modelling the variable RES through electricity market and power grids perspective. The author analyses various cases such as: Scandinavian case of wind energy integration from electricity market perspective, Australian case of RES integration from power grid and market perspective, Danish case analyzing advantages of wind energy integration into a flexible power system. The issues of PV integration are also analyzed from German perspective and energy storage systems are taking into consideration in the United States case study.
An exhaustive review of wind energy integration studies can be found in [
7]. Authors analyze in detail the methods and results provided in 12 large-scale wind energy integration case studies done by industrial companies at regional level between 2005 and 2012. Authors review data and statistical models approached by these studies and point out the major differences between their findings and conclusions. The common results of these studies are: large scale integration of wind energy is technologically feasible; costs related to integration processes can be reduced by wider areas for balancing authority; and wind energy integration on electricity markets may be improved.
Final report of IEA Wind regarding Task 25—Design and operation of power systems with large amount of wind power in [
8] involved 24 countries and revealed important conclusions regarding wind energy integration impact on power systems. The studies review methodologies and data used in order to analyze the multiple aspects of wind energy integration: variability, balancing, transmission grid capacity and system stability. Holttinen et al. [
9] also present the major findings resulted from several studies concluded in collaboration with IEA Wind regarding Task 25. Authors describe and compare the methodologies and simulations regarding the reserve requirements, impact on other generation sources, balancing issues, reserve allocation, capacity value and transmission grid problems due to wind energy integration.
In addition, in [
10] authors describe different aspects regarding wind energy integration in Romania especially from operational point of view. They study and analyze the seasonal behavior of WPP generation in terms of full load hours (FLH), duration curves, sudden output variations and hourly average output of WPP during 2010 and 2011. It came out that in 10% of the time, the WPP generation was about 50% of the installed power and while in 70% of the time, the WPP generation was about only 4% of the installed power.
In [
11], the authors approach the reserve estimation in case of large-scale wind energy integration. Their work is based on several renewable integration studies, variability and uncertainties related to the wind fluctuations. The estimation envisions the contingency, primary, secondary and tertiary reserves, considering regulation and the specificities of the power system reserves.
The authors of [
12] underline the requirements related to reactive power at the system and substations level, analyzing the impact of wind energy on voltage considering a Danish case study. They propose the usage of local resources that should be rewarded for voltage regulation services instead of new infrastructure that lead to additional greenhouse gas (GHG) emissions.
In the Taiwanese power system, as a consequence of wind nature, wind energy integration has brought several challenges regarding transmission grid capacity and power reserves limitations [
13]. An economic dispatching model, including a direct search method for multiple-area coordination dispatching approach, is proposed for integrating large-scale wind capacities.
Paper [
14] analyses the flexible power system reserves that are able to handle the wind energy fluctuations and forecast errors. This approach is appropriate for power systems with little smoothing effect, especially when the tie-lines are weak or absent such as Cyprus power system. Under the current context, the authors envision severe WPP or/and demand curtailment; therefore, additional power system reserves are required to deal with the wind energy integration targets in Cyprus. They also analyze the integration impact of gas power plants that can balance the wind variations.
However, we have noticed while searching for related studies that there is no similar research regarding wind energy integration at SE regional level or with focus on Romania, considering power reserves. From this point of view, our study can be considered as an original research.
This paper is structured in five main sections: Introduction and literature review; European context in terms of RES policies and Transmission System Operators (TSO) coordination and balancing reserve sharing; Methods and models for power system reserves calculation at the regional level and Romanian Power System level; Results and Conclusions.
In section one, the structure of the paper and literature review are shown. In section two, the European RES policies, TSO coordination and balancing reserve sharing are depicted. According to RES Directive, the European Union (EU) aims to achieve 20% of the final energy consumption from renewables by 2020. In addition, at the EU level, for 2030 new targets were agreed upon in 2014 pertaining to RES integration, emissions reduction and energy efficiency, such as: 40% domestic reduction of GHG emissions, 27% consumption share of RES and 27% for improving energy efficiency. However, these targets require more measures that should envisage TSO coordination in order to handle fluctuations generated by wind energy and interconnections reinforcement to eliminate congestions and allow energy transmission from generation to consumption areas.
In section three, as a novelty, we propose a SE regional approach regarding wind energy integration from the power systems balancing resources point of view. Comparing the regional to the country-by-country approach, it reveals that the regional approach decreases total reserve requirements. In other words, the regional approach would increase the possibility for wind energy to replace more conventional resources.
Regarding the Romanian power system, its high level of wind energy integration in the SE region requires special attention. Thus, we propose a model for wind energy integration in Romania from the power system reserves point of view. In case wind speed rapidly decreases and WPP diminish their output, other generating units have to produce more in order to balance the system, since large amounts of electricity cannot be stored efficiently. While vice-versa, when wind speed rapidly increases, other generating units have to reduce their output. Based on the existing availability of the generating units, their notifications and technical limits, we propose a model that is able to calculate the installed power of WPP that could operate without considerable interruptions. Also, our model estimates the additional power reserves required for larger wind energy integration.
In section four, based on the methods and models described in previous section, we estimated the power system reserves that are required at the regional level compared with the country level. In addition, we estimated the available fast tertiary reserves for Romanian power system and the necessary reserves considering the actual installed power that can operate without significant curtailments.
In section five, the main conclusions of our findings are emphasized, pointing out the novelty of wind energy integration from the power reserves point of view.
4. Results
For computer simulations, the regional power system model in Power System Simulation for Engineers (PSS/E) software format has been used [
20]. It has been developed and regularly updated and verified by 12 regional TSO. The model consists of more than 5500 nodes, 2000 power plants, 2200 generators, 9000 lines and 2800 transformers. It is the most detailed SE European power system model ever prepared and it has been used for reserve, load flow and voltage analyses. On the other side, besides power system model, the SE regional context is analyzed through the WPP data collected and verified by 12 TSO (including Slovenia, Croatia, Bosnia-Herzegovina, Serbia, Montenegro, Macedonia, Bulgaria, Romania, Kosovo, Albania, Turkey and Greece) through a series of detailed questionnaires (324 inputs collected) and intensive regional cooperation supported by USAID and USEA since 2000. Besides that, large set of input data on hourly wind energy generation profiles for each power system for the 2020 planning horizon was employed from the Pan-European Market Database (PEMD). Also, historical data on wind energy generation was applied as a reference when such data was available, as well as data from the national wind energy integration studies.
In order to make computer simulations suitable for this analysis, South East European Regional Transmission System Models (RTSM) for 2020 have been upgraded in accordance to the updated national wind power plant development plans, including best knowledge of the national TSO. It includes grid connection points of the planned WPP and their installed capacity. Analyses on the RTSM with PSS/E software platform ensured clear view to transmission system adequacy under different wind power integration scenarios in this region. Special attention was given to the network overloading and voltage profiles in different wind power scenarios. Expected network bottlenecks and the role of new interconnection and internal lines under different future wind power integration scenarios has also been checked [
21]. Novelty of this analysis among mostly small regional systems is in the regional approach that has never been used in this region before and it is giving clear quantification of potential savings which was missing in this region. It is important to note that all power system regimes in which transmission lines are overloaded (beyond thermal limit), in full (n) topology or (n − 1) contingency analyses are treated and referenced as “insecure states”. So, operational security of the system was taken into account. Voltage values are also analyzed both in full (n) topology as well as in (n − 1) contingency scenarios. However, voltage values out of limits are not treated as limiting factor here, since usually these issues have local character.
To prepare scenarios for the 2020 planning horizon, this study [
22] also employed the ENTSO-E PEMD forecasts for demand, supply and interconnection assumptions used by ENTSO-E in its Ten-Year Network Development Plan (TYNDP) process. Also, the national wind energy forecasts were verified against National Renewable Energy Action Plans (NREAPs). In case the forecasted levels of wind energy production were lower than the production targets in the NREAPs, the NREAPs forecast prevailed.
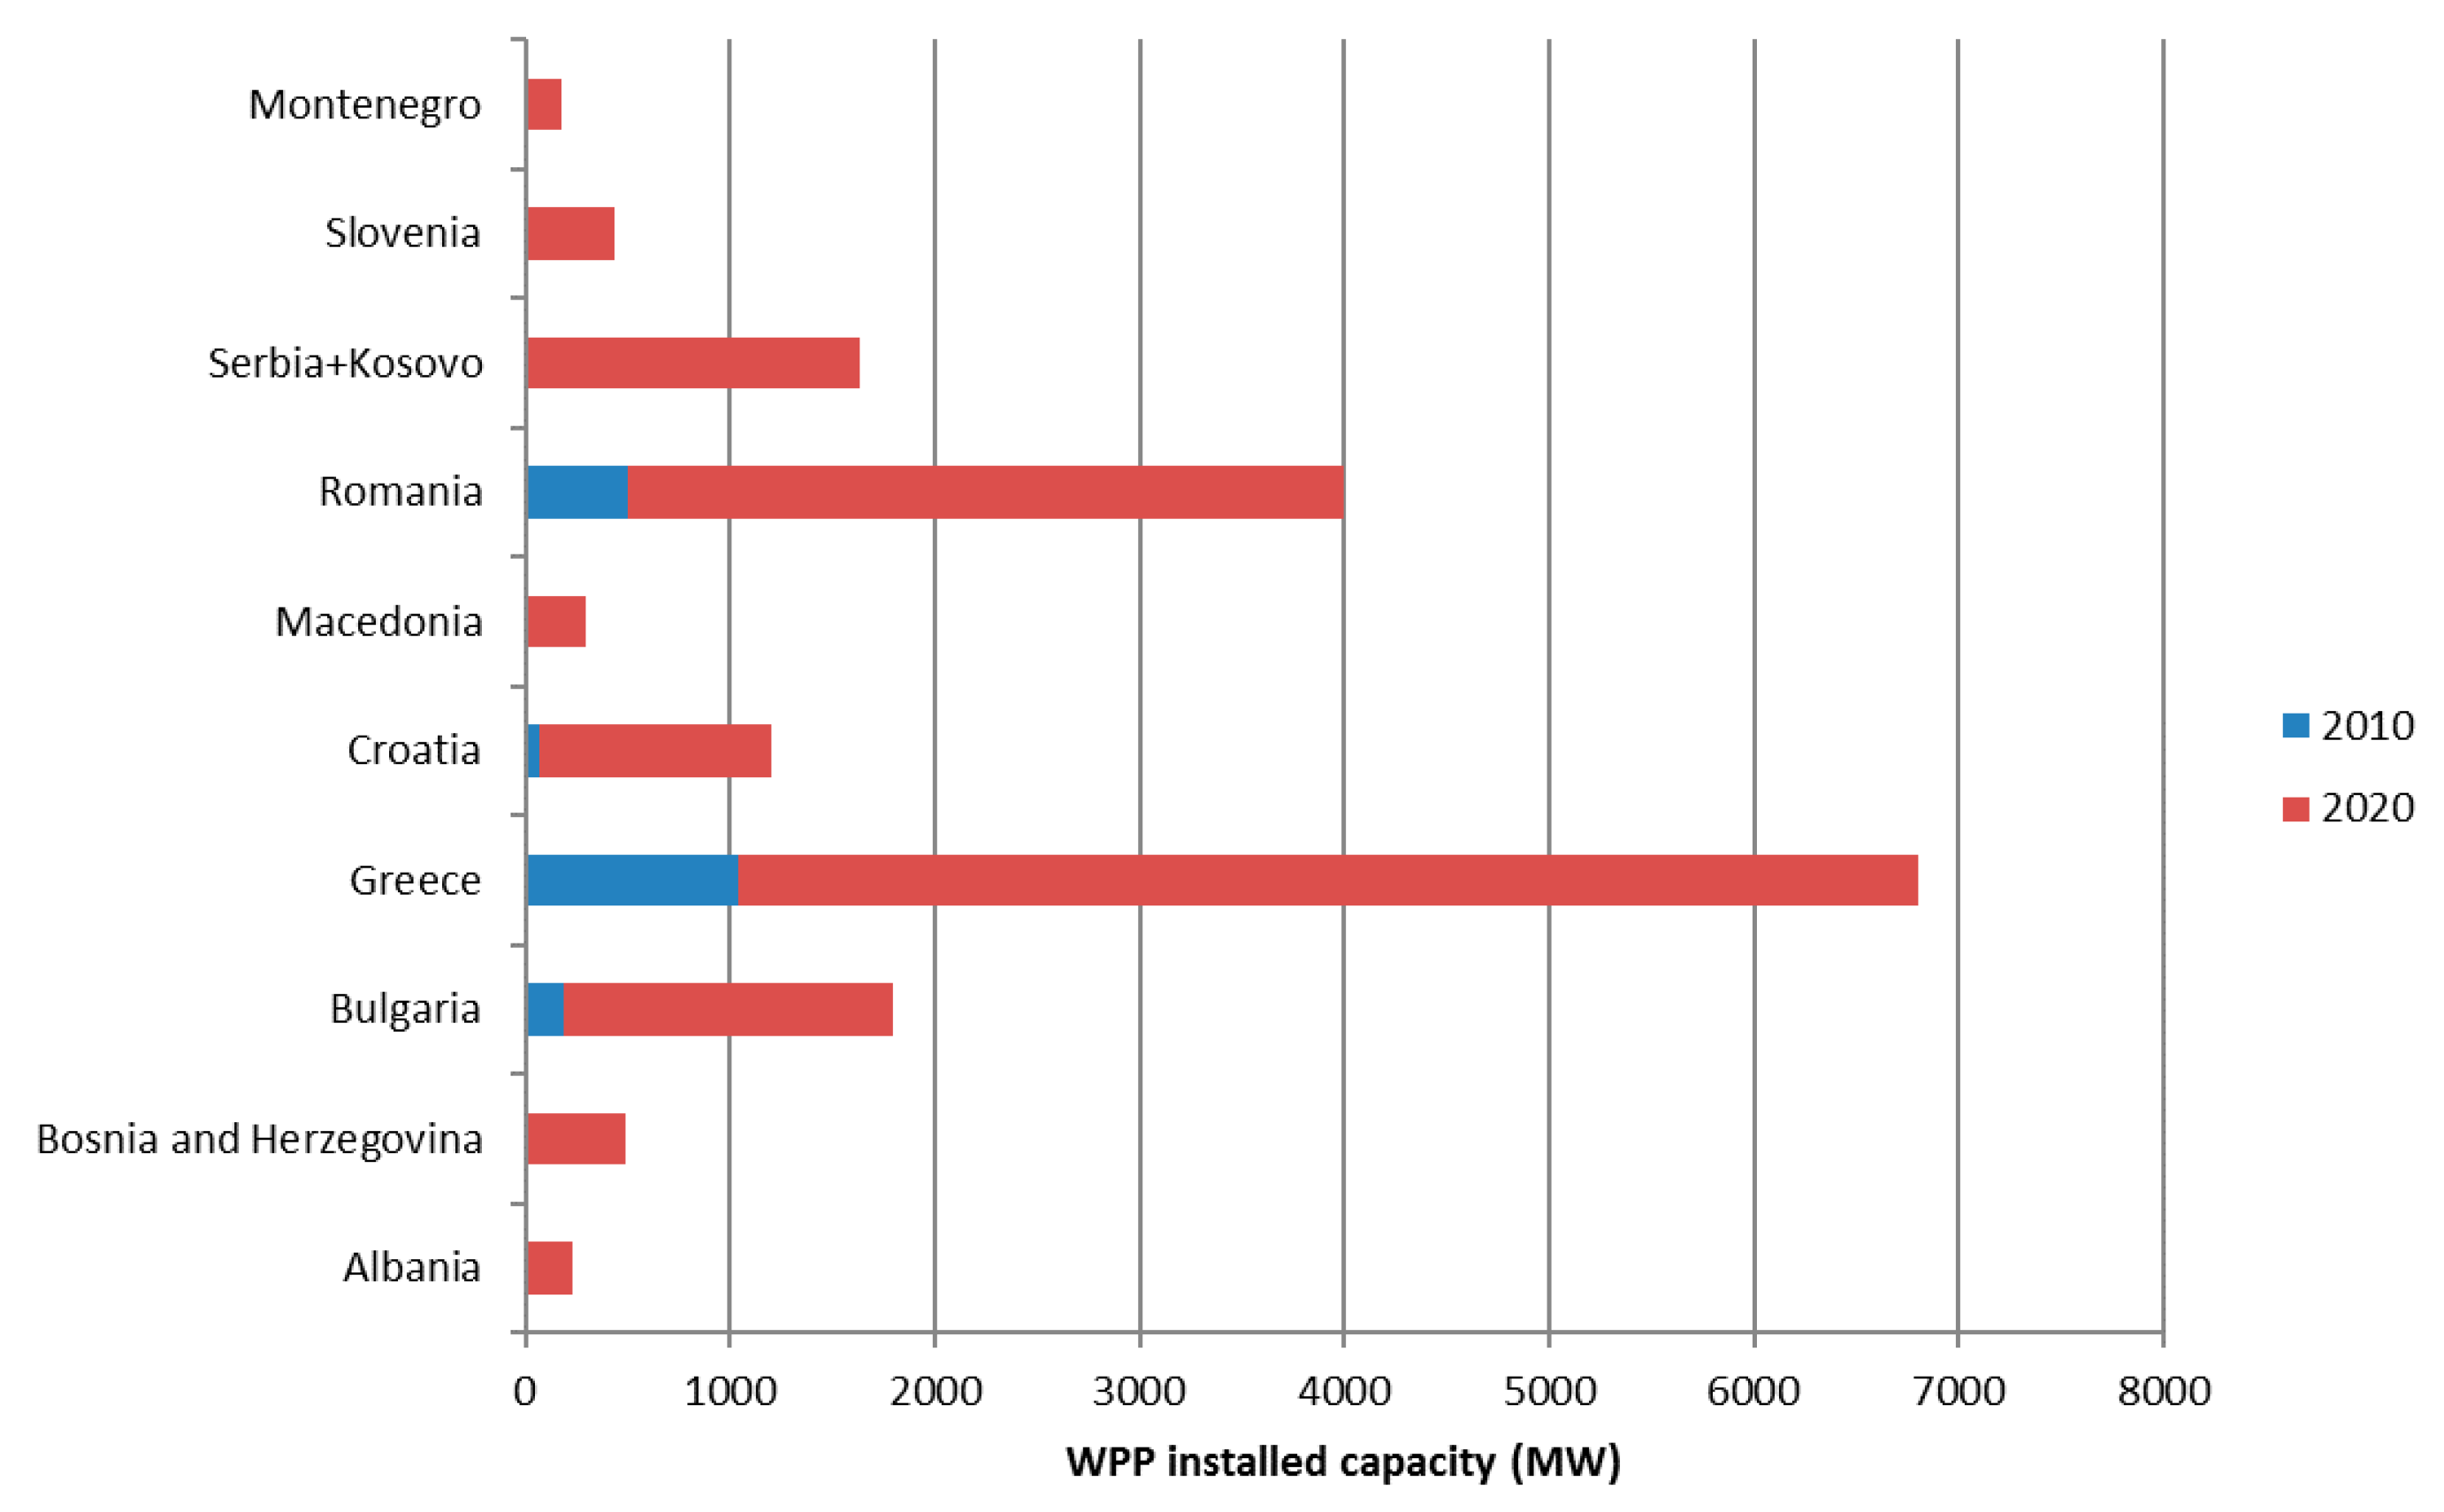
For countries that did not prepare a NREAP, our analysis employed strategic national documents, i.e., national energy policies, strategic goals, etc., to validate wind energy production forecasts. This approach assumed large volume of input data, resulting in WPP generation output forecasts for 10 national power systems in this region on hourly level: Slovenia, Croatia, Bosnia and Herzegovina, Montenegro, Macedonia, Albania, Serbia + Kosovo (input data for Serbia and Kosovo were common, while Turkish data were no relevant due to weak connection to the region), Bulgaria, Romania and Greece, assuming altogether 87,600 output data.
The largest wind energy installed capacity growth in 2020 is foreseen for Greece (from a base of 1039 MW in 2010 to 6800 MW in 2020). The values in
Figure 1 were further verified by each TSO by comparing them to existing and forecasted level of connection applications by wind energy investors.
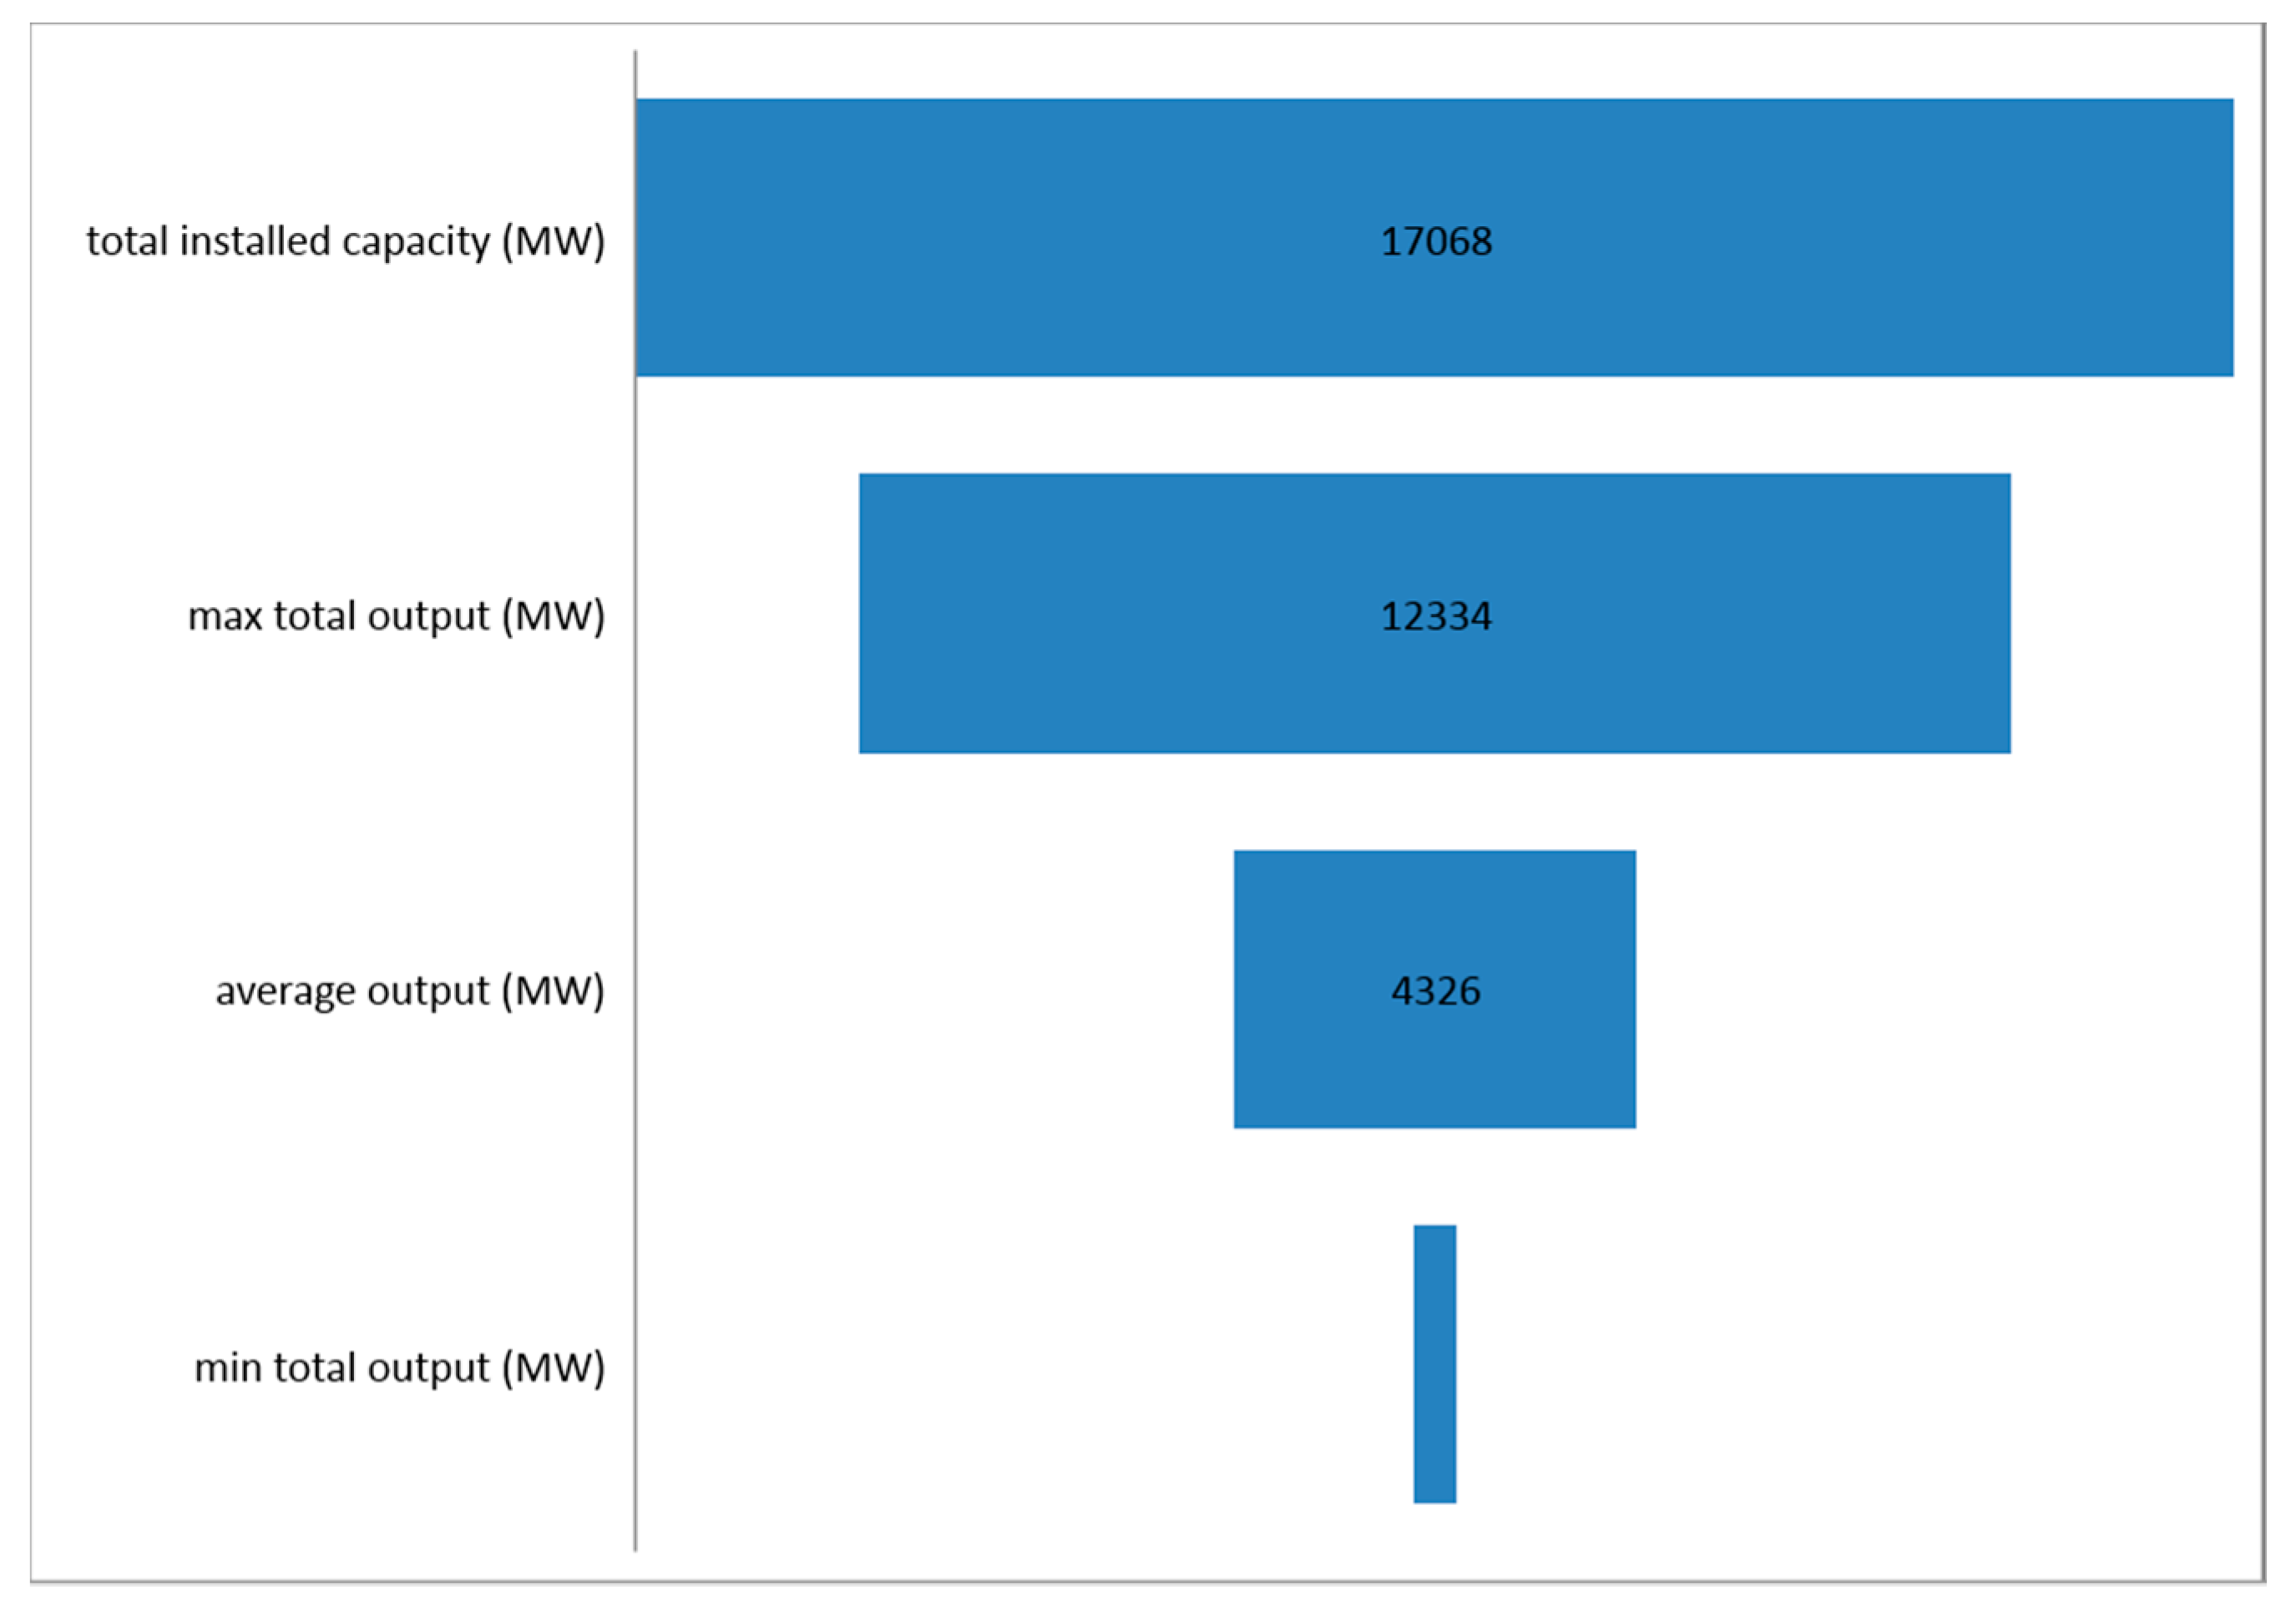
The total installed power of WPP by 2020 in SE region is forecasted to reach 17,000 MW (as in
Figure 2), as compared to 1800 MW of installed WPP capacity in 2010. This forecast indicates that within 10 years, wind energy production will increase by a factor of 9 times in SE region. This does not account for the growth of wind energy in Turkey, which is projected to have an increase of 13,000 MW by 2017. The large growth rate is already achieved in the first two years, having WPP capacity increase from 1800 MW in 2010 to 4500 MW in 2012.
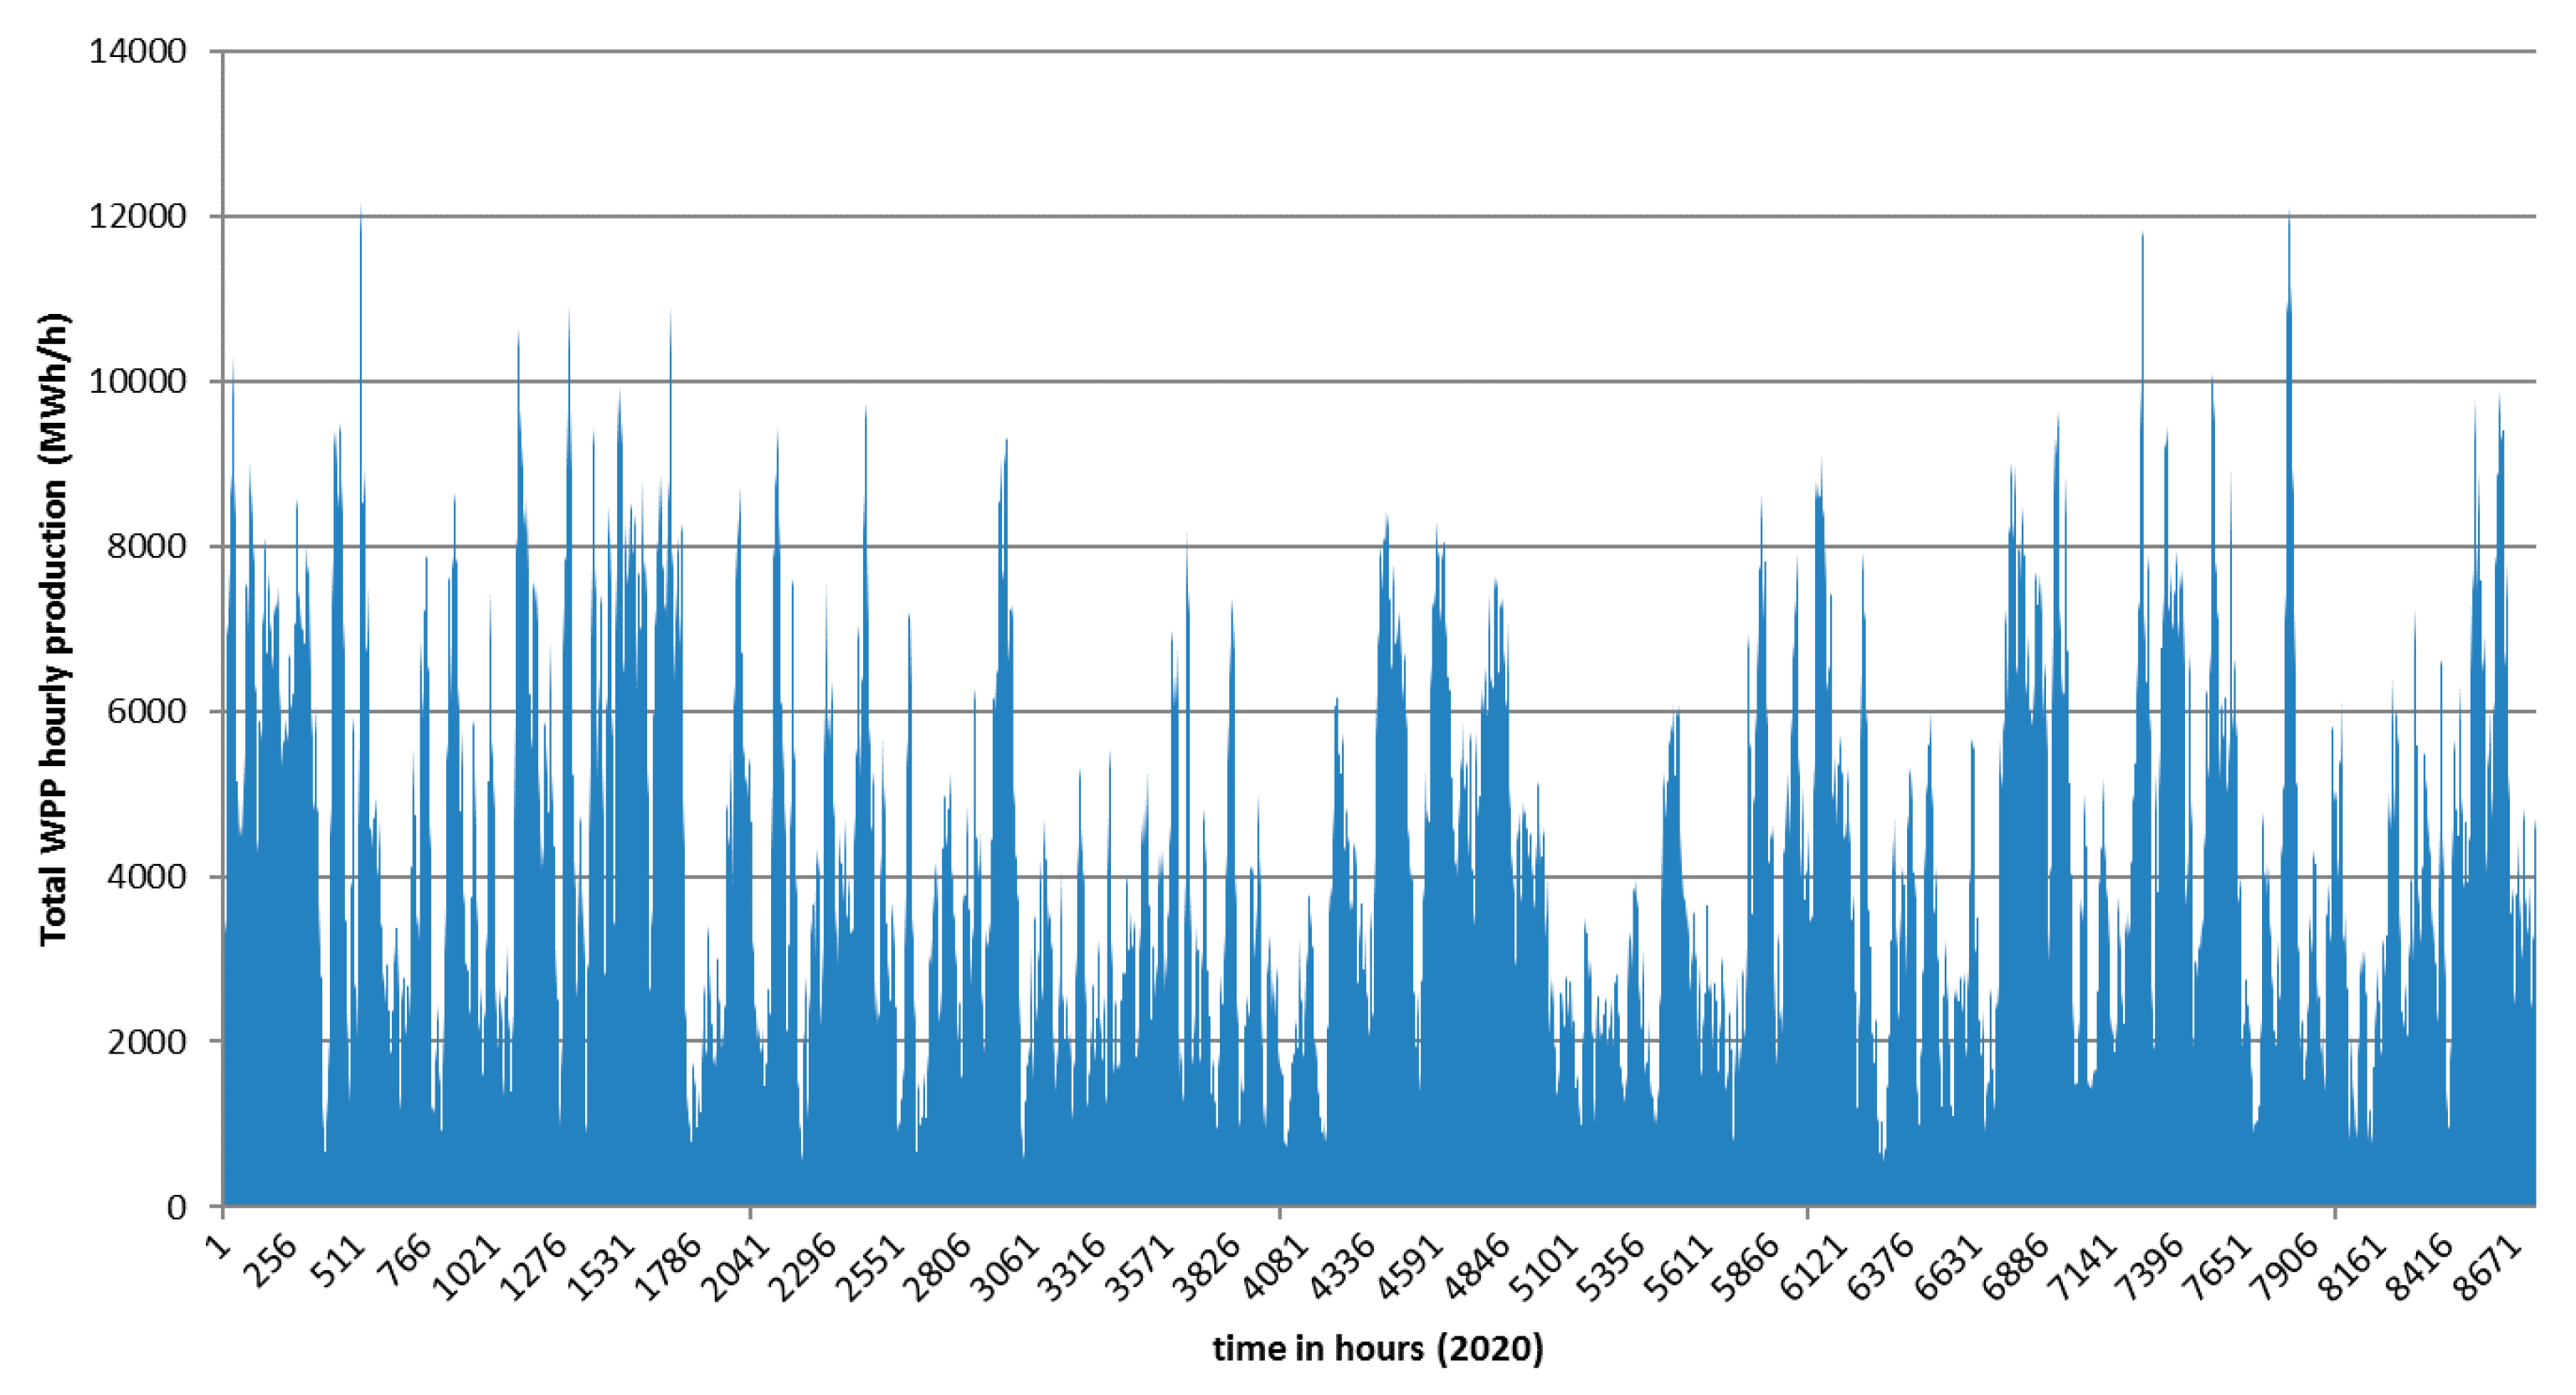
The WPP generation output forecast for a one year timeframe (2020) is provided in
Figure 3. The values were calculated based on the WPP generation curve deriving from an analysis of sub-regional wind patterns and the projected levels of installed power of WPP mentioned above. These values were also used to calculate the expected level of wind energy output fluctuations.
Collected wind energy inputs and existing wind studies clearly indicate that SE region has significant wind energy potential. Existing FLH (the estimated annual number of generation hours for a wind turbine to produce with its installed capacity) values for WPP in Croatia and Romania may go up to 3200 h/year. During the course of the study, the average number of FLH for WPP was estimated for each country. Within SE region, the number of planned country average FLH ranges from 1650–2400 h/year. Recognizing that the number of FLH depends on complex interactions between many factors including WPP location and spread, turbine type, wake effect, etc., the FLH are therefore presented for indicative purposes only.
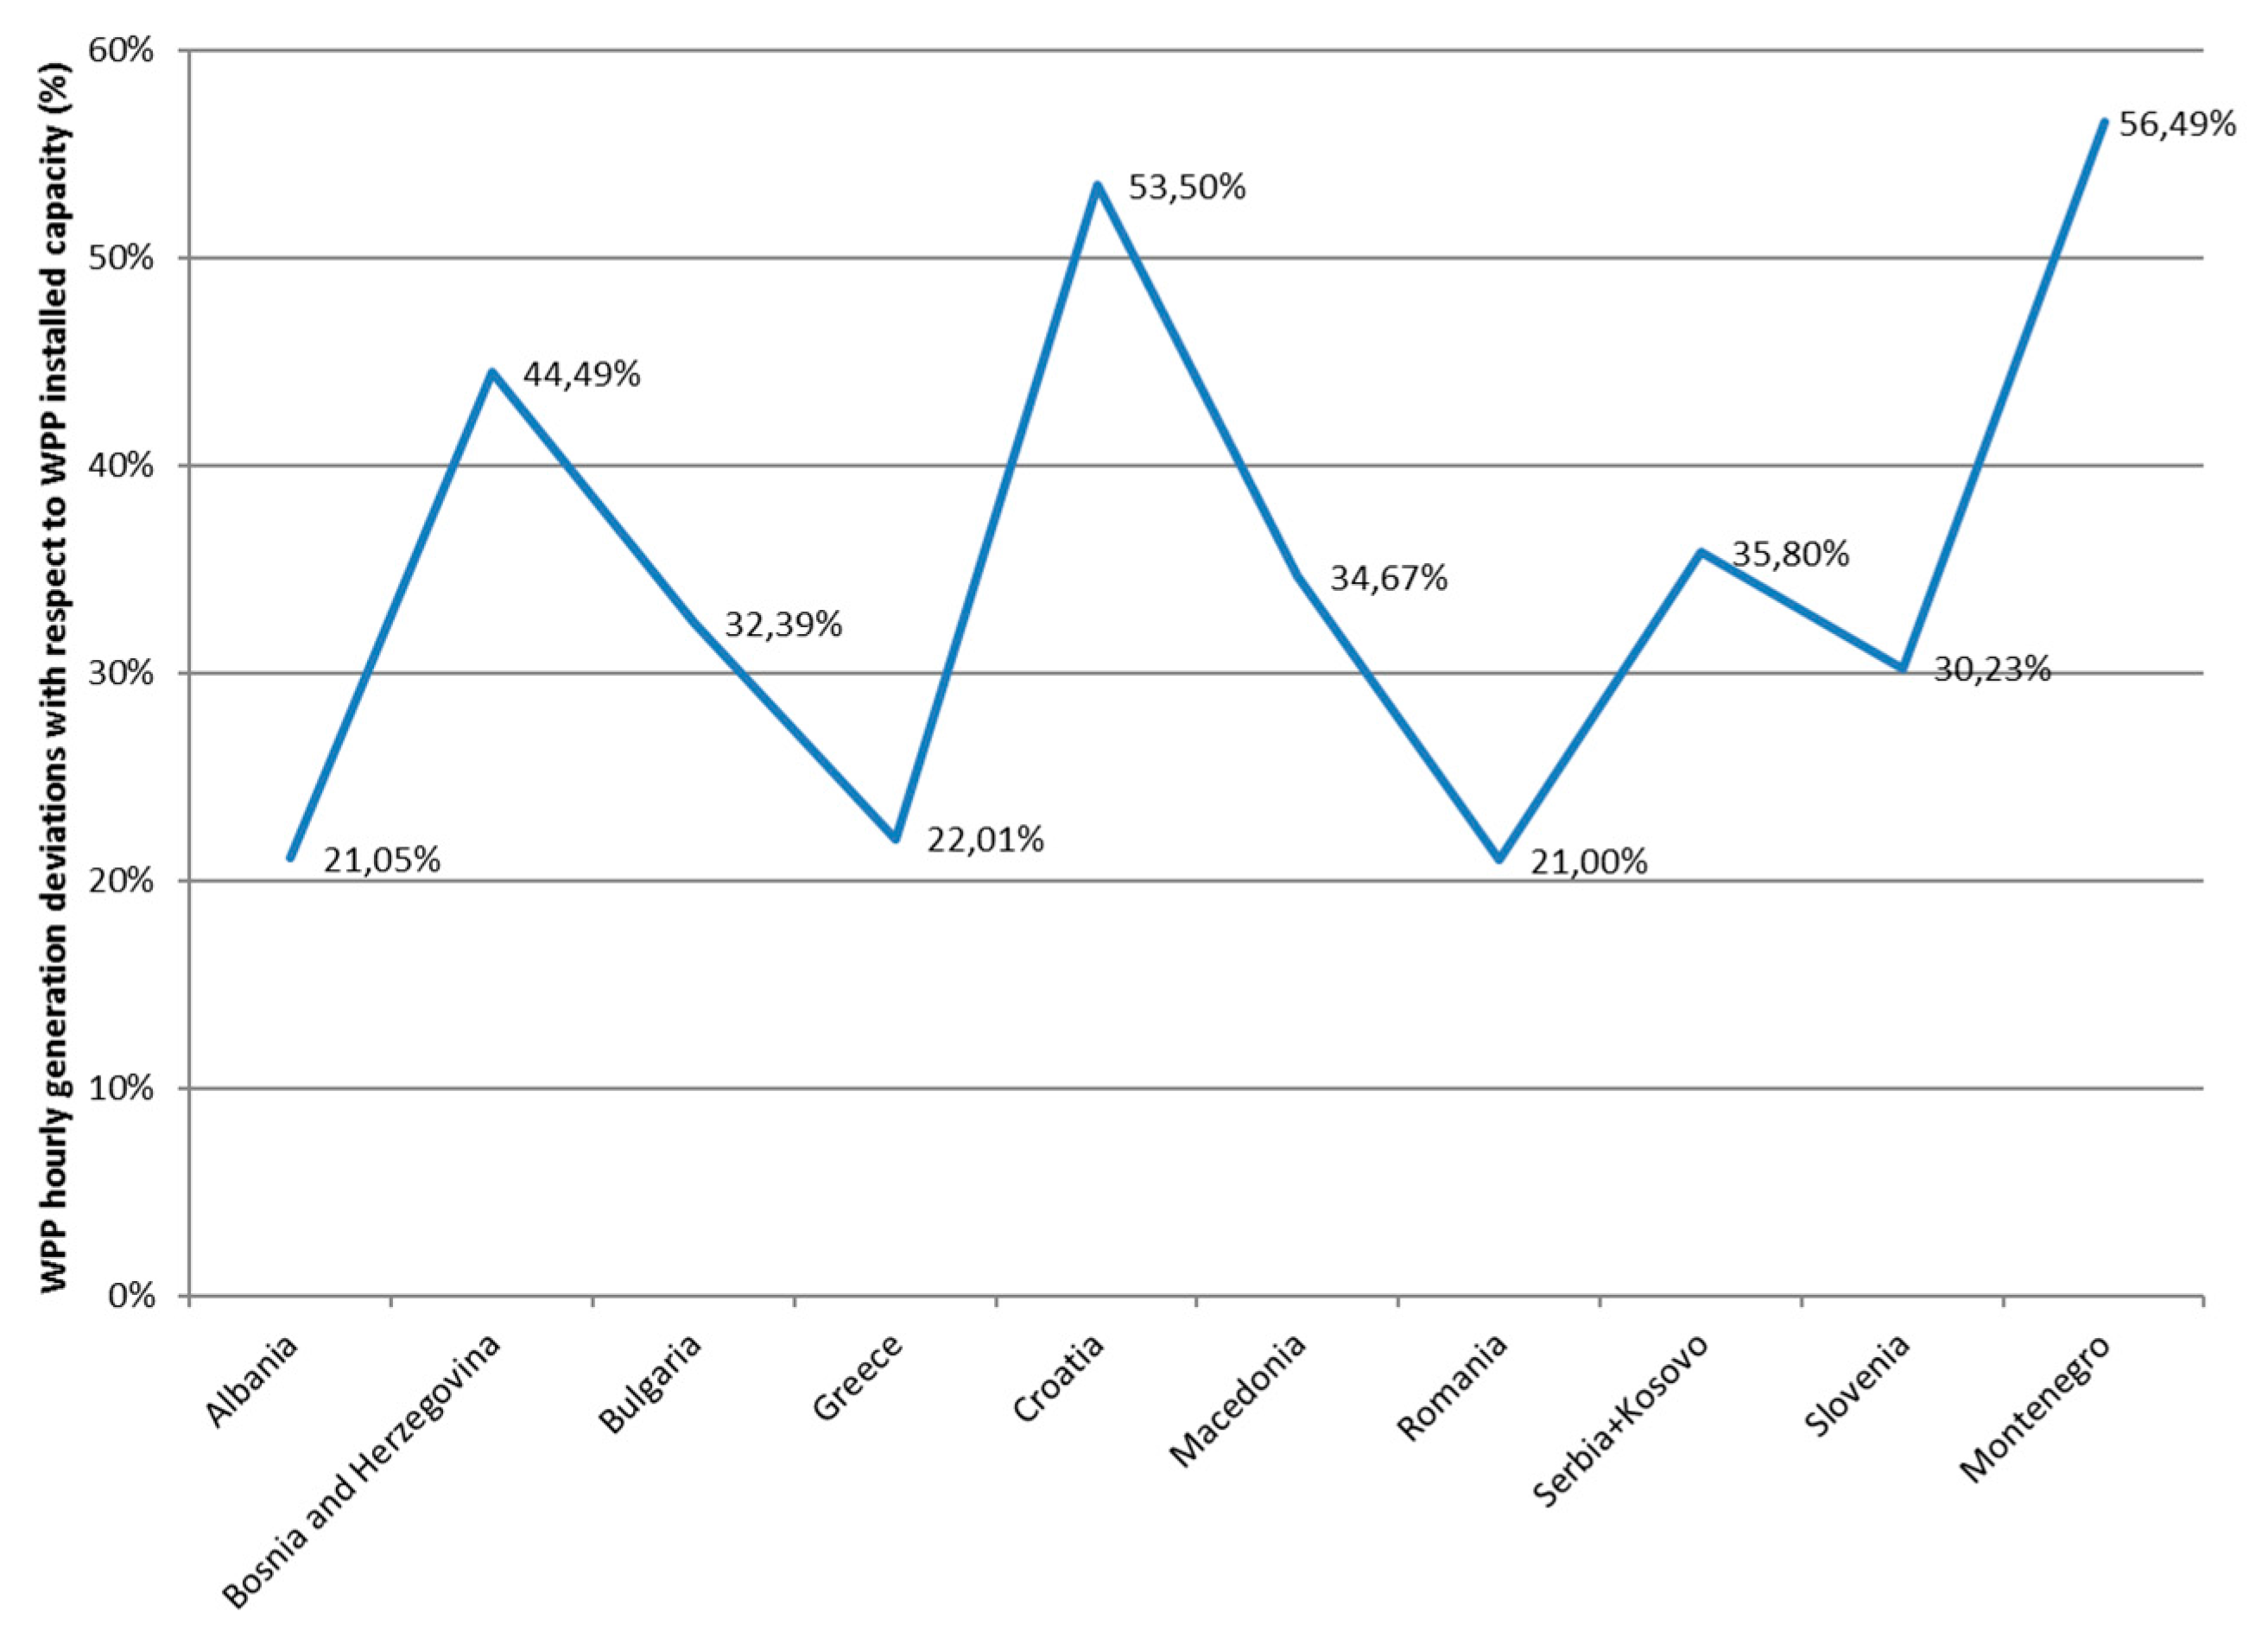
Although most of the SE power systems are not widely spread, the diverse WPP geographical locations in each country and across the region creates large variations in WPP production.
Figure 4 presents expected wind energy hourly generation fluctuations (as percent of total wind energy installed power) for each power system in SE region. The hourly variability of WPP production ranges from 21% in Romania to 56% of total WPP installed power in Montenegro.
Values provided by
Figure 4 are similar to the relevant operational experience in EU countries. As presented below, our analysis reveals that the geographical diversification of WPP in SE region provides an opportunity to integrate more WPP if regional approach of sharing balancing reserves is adopted. Therefore, these variations require to be forecasted in order to reduce the required power reserves to balance the deviation between forecasted and real WPP output (WPP forecasting error).
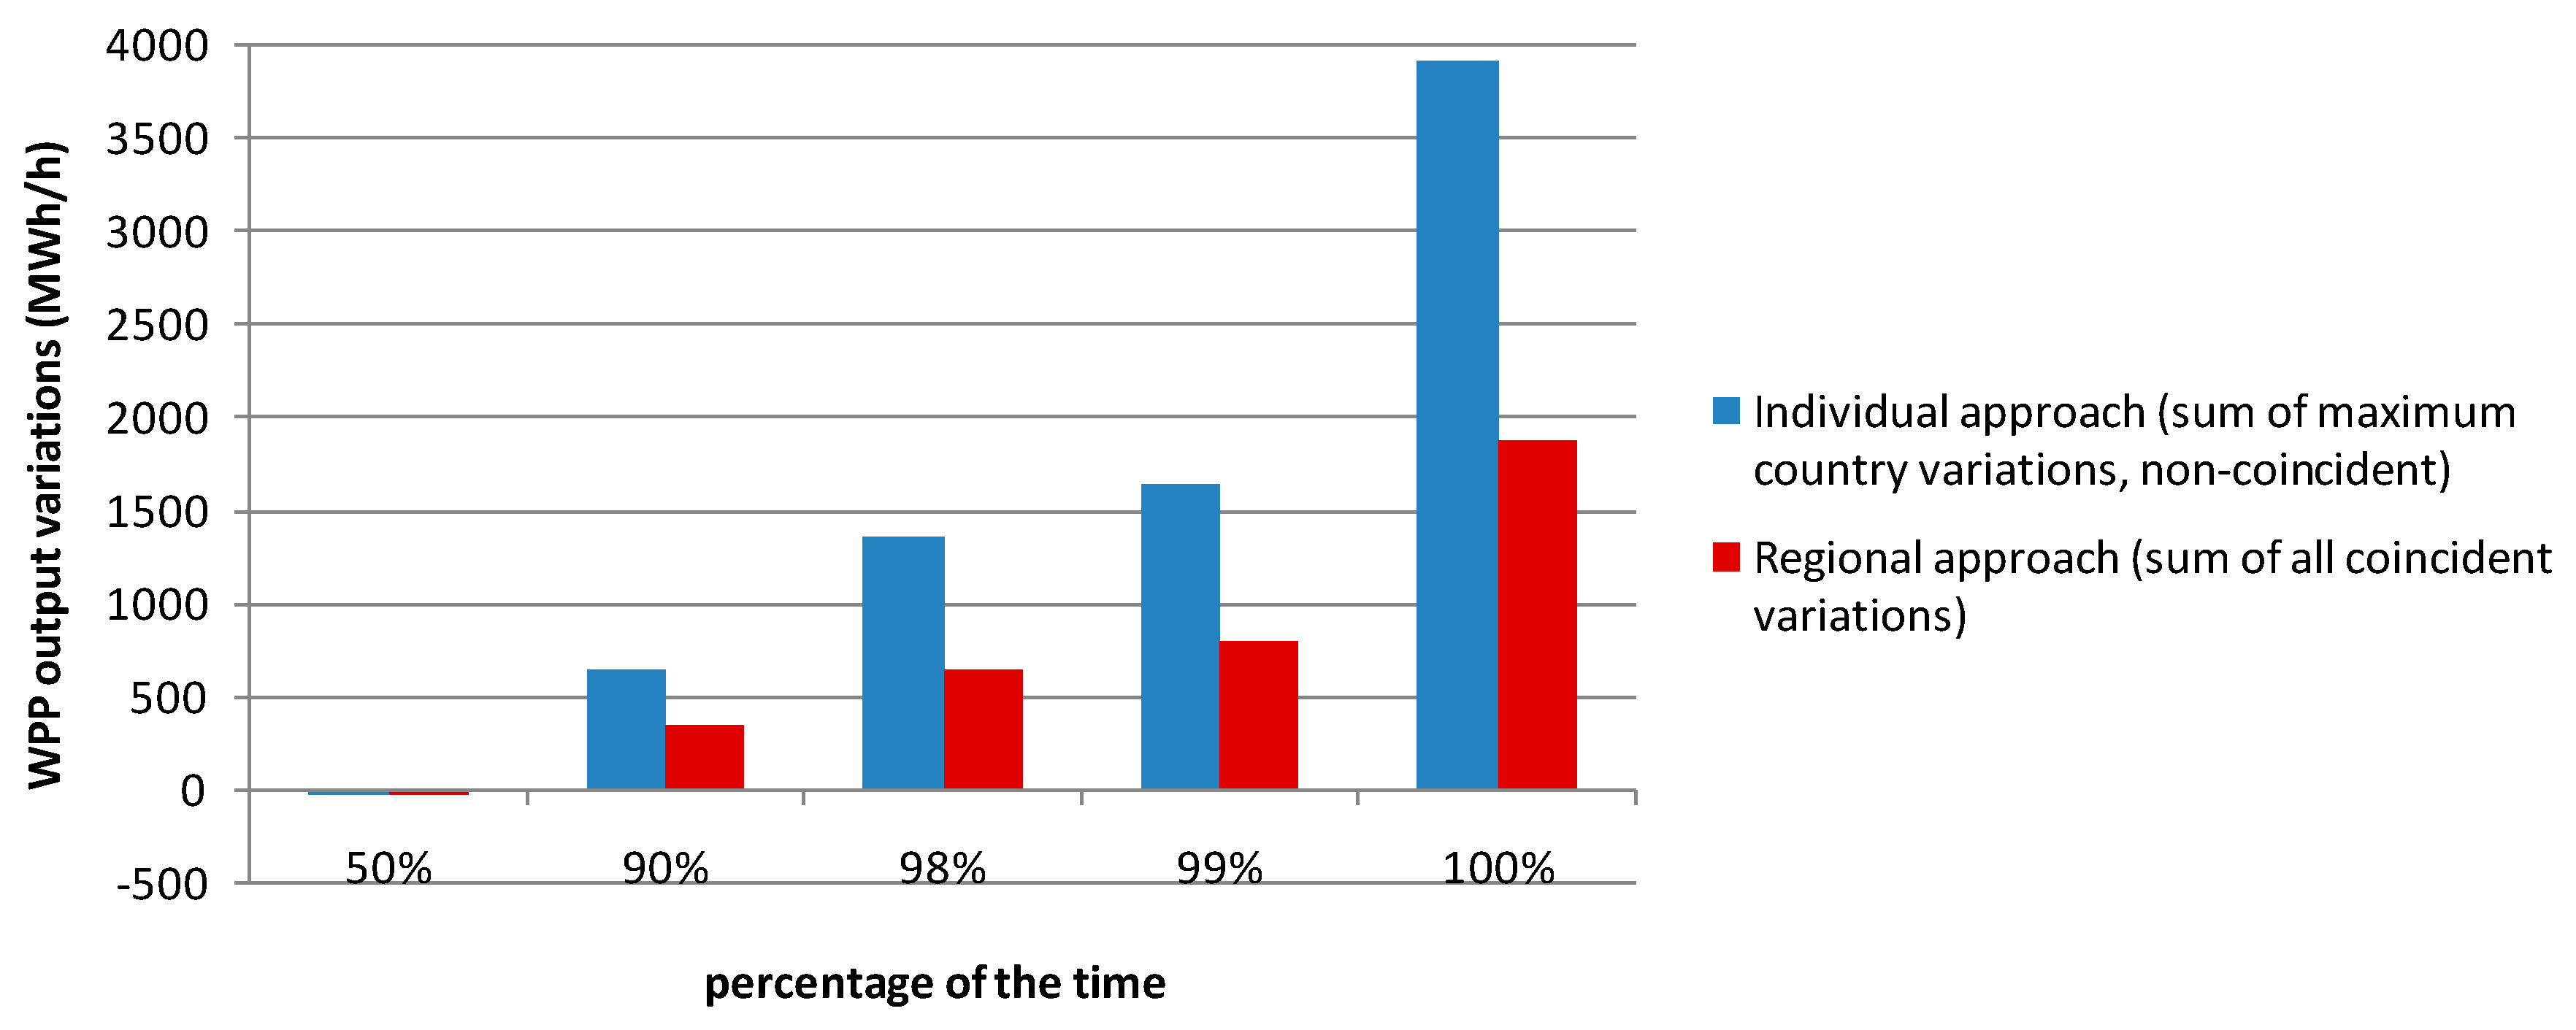
Regional approach is using coincident deviations in all countries, which eliminates the need to keep the full individual power reserve capacity whole year, but rather to keep lower individual power reserve capacity and share it among the countries when needed. The blue column (
Figure 5) presents the individual country approach to securing reserves. It represents the sum of the maximum WPP output hourly variations for each country on a non-coincident basis. In this scenario each country must maintain reserves equivalent to its maximum expected variation (deviation between forecasted and real WPP output), no matter when it occurs. The red column (
Figure 5) presents the regional approach, showing the sum of all coincident hourly variations as if the entire region is operated as a single system.
The horizontal axis in
Figure 5 shows the percentage of time per year that a given level of variations can be expected. To calculate this, we need to define an exceedance probability. It represents the probability that a certain value will be exceeded. For instance, a P90 value of 500 MW for the power reserve capacity means that there is a 90% likelihood that the total required power reserve capacity will be lower than 500 MW. Similarly, a P99 value of 1500 MW would mean that the total required power reserve capacity is likely to be up to 1500 MW for 99% of the time.
An empirical CDF is determined by arranging the data in ascending order and assigning each value an equal fraction of the total probability, which is equivalent to one. For this case, 90% of the time per year the level of hourly variations (reserve needed) would be less than 650 MW in the individual country-by-country approach to securing reserves and just 350 MW if the regional approach was employed. For 99% of the time, the variation would range from ±1600 MWh/h.
A more detailed representation of the
Figure 5 would present both positive and negative variations that are almost symmetric. The maximum variation informs the total power reserve capacity requirement. Therefore, considering that the variations in wind energy generation are calculated on a country-by-country basis, which is the current practice in SE region, expected variations range from −4600 MWh/h to +4000 MWh/h. This is equivalent to approximately 27% of total WPP projected to be installed capacity in the region.
This analysis reveals that a regional approach reduces the power reserves required to balance wind energy fluctuations. Maximum fluctuations of the total sum of regional wind energy output ranges from ±1900 MWh/h. This is equivalent to 11% of total WPP capacity projected to be installed in the region. As a result, the regional approach reduces the required power reserve capacity to less than a half of the power reserve capacity when compared to the current country-by-country individual approach. More precisely, with the regional approach we need only 1900 MW of the reserve capacity, which is 42–48% of the reserve requirements of the individual country-by-country approach (4600 or 4000 MW). Also under the regional approach, to managing WPP variation 99% of the time, the fluctuations will range from ±800 MWh/h.
By comparing the regional to country-by-country approach, TSO coordination balancing of power reserves decreases total reserve requirements by −2600 MWh/h, respectively +2000 MWh/h [
21]. Therefore, the regional approach would significantly decrease the power system reserve requirements for balancing wind energy fluctuations to less than half of that required by the current individual country approach. In addition, the calculation mechanism that determines the power reserve capacity for the regional approach as well as the benefits of TSO coordination of balancing power reserves as if it were a single power system could be extended to other interconnected regions.
Clearly, one of the largest and most developed country in wind energy integration in the SE region is Romania.
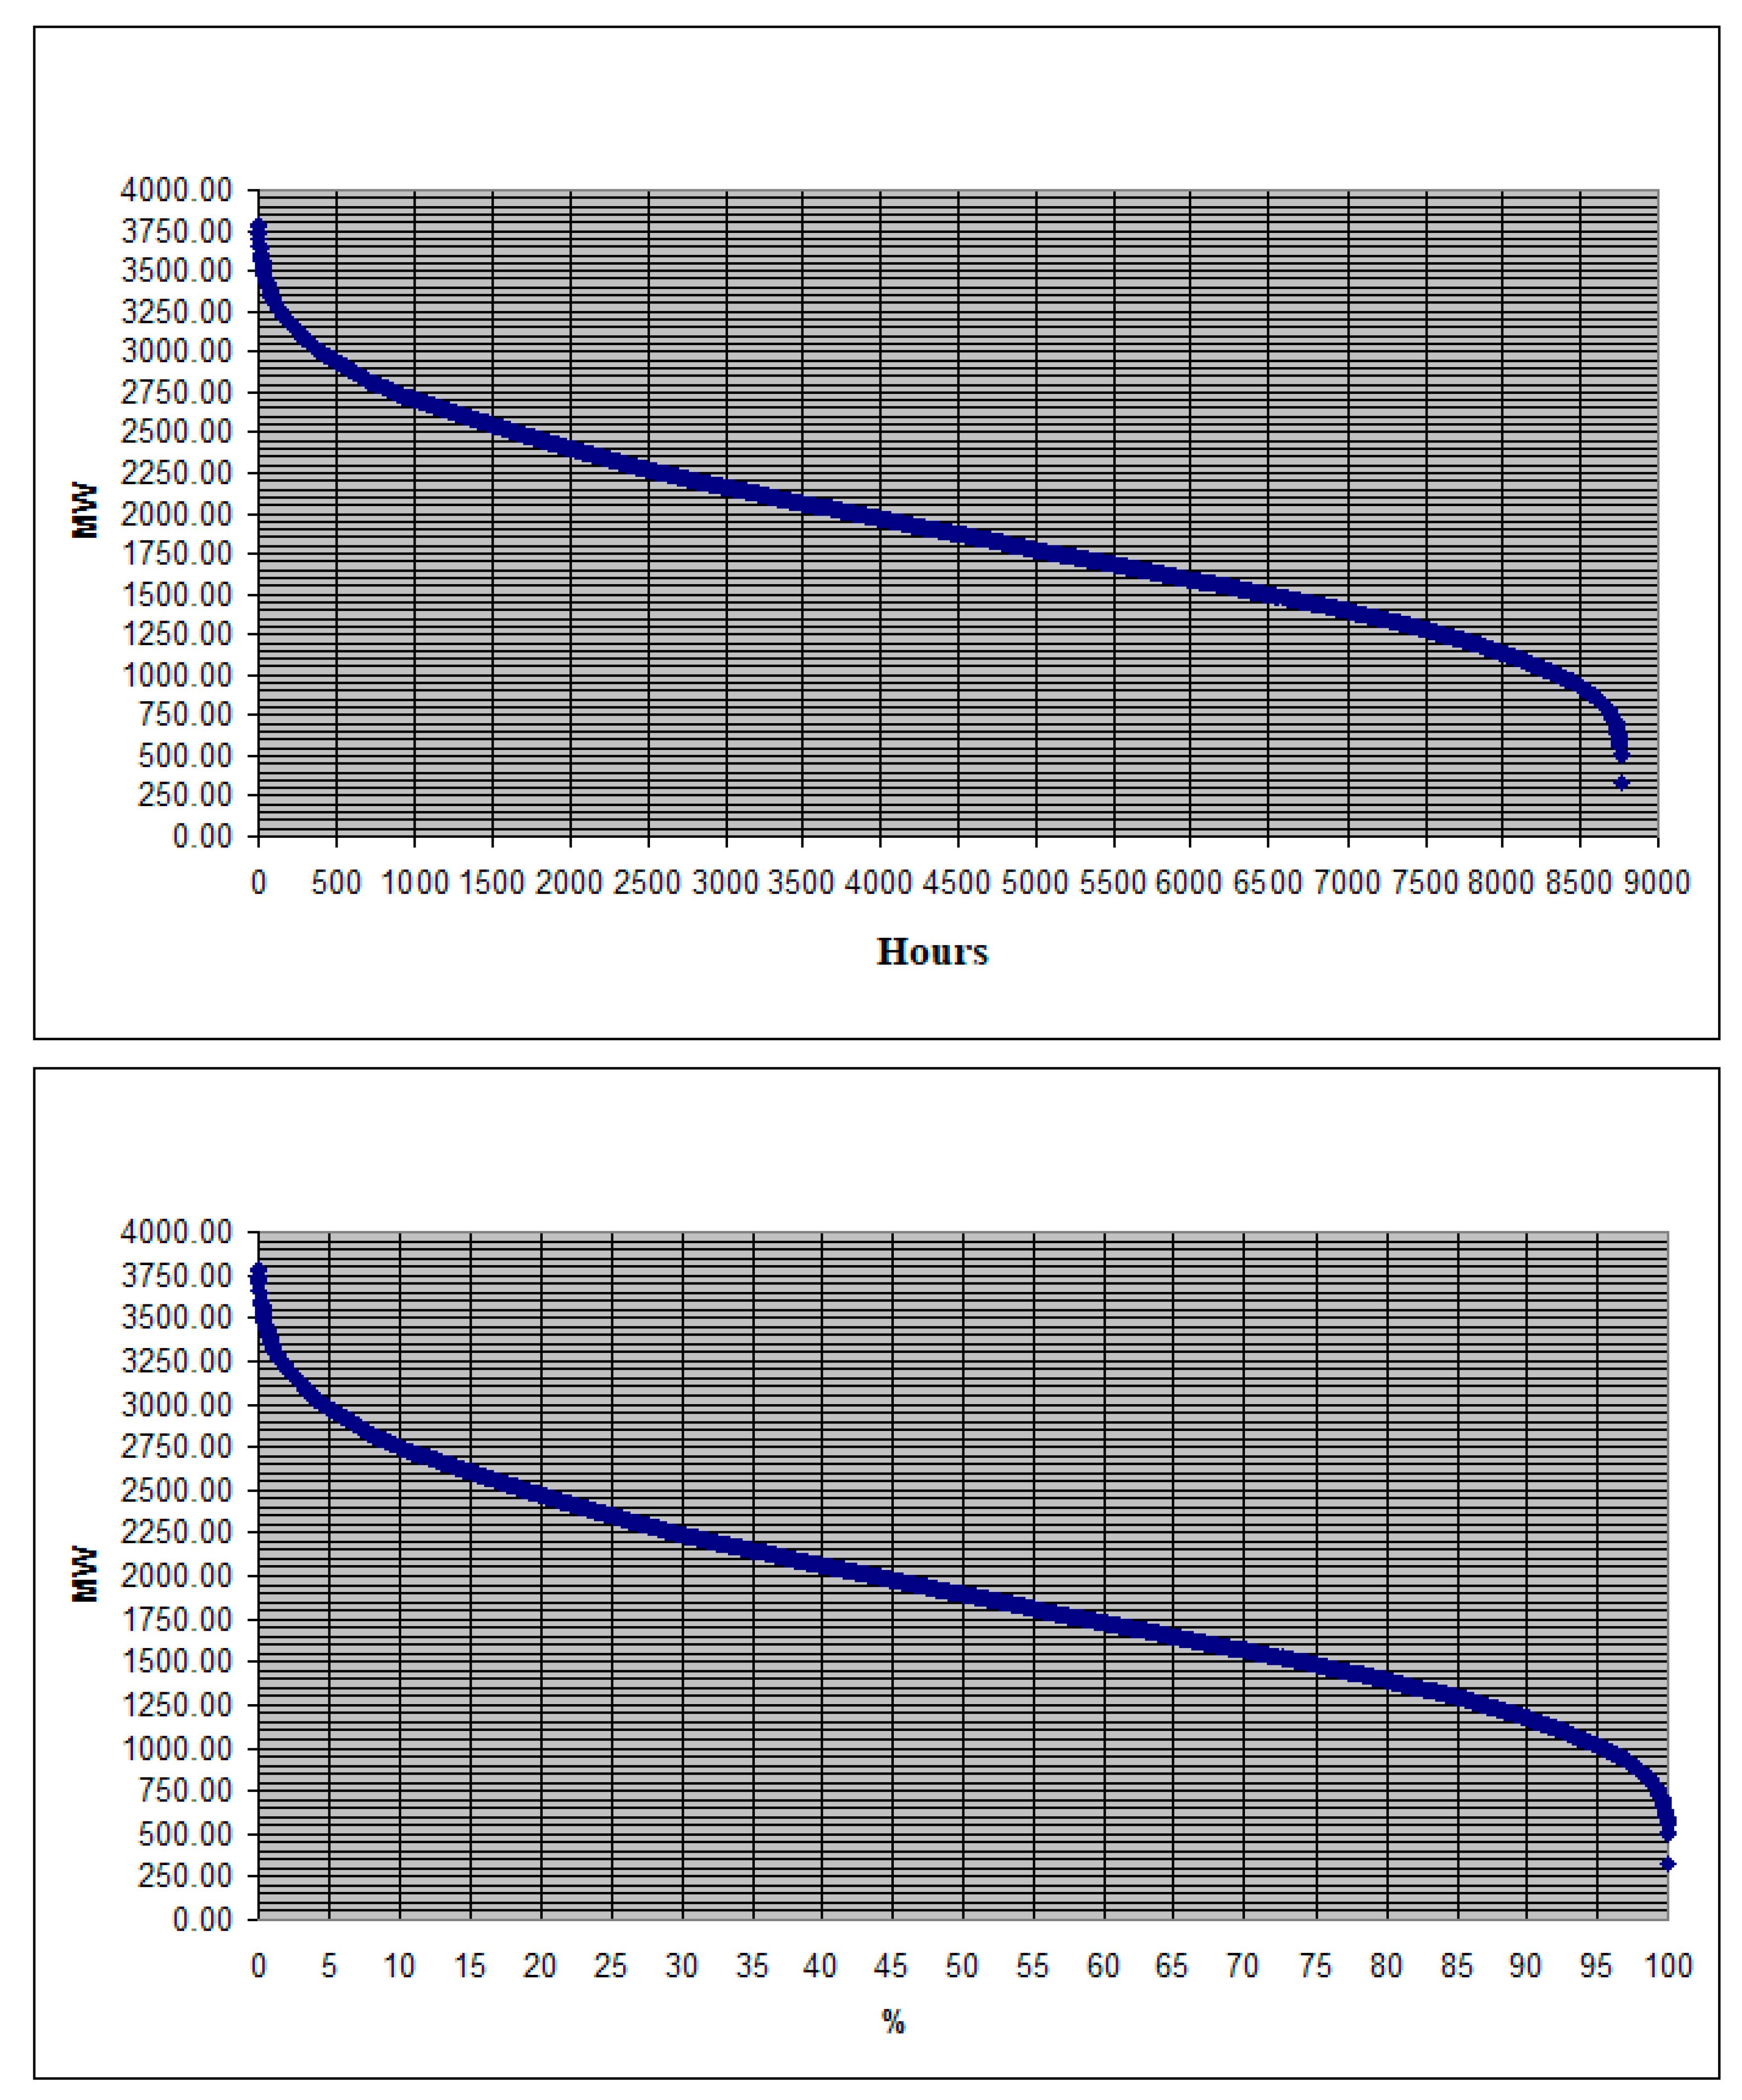
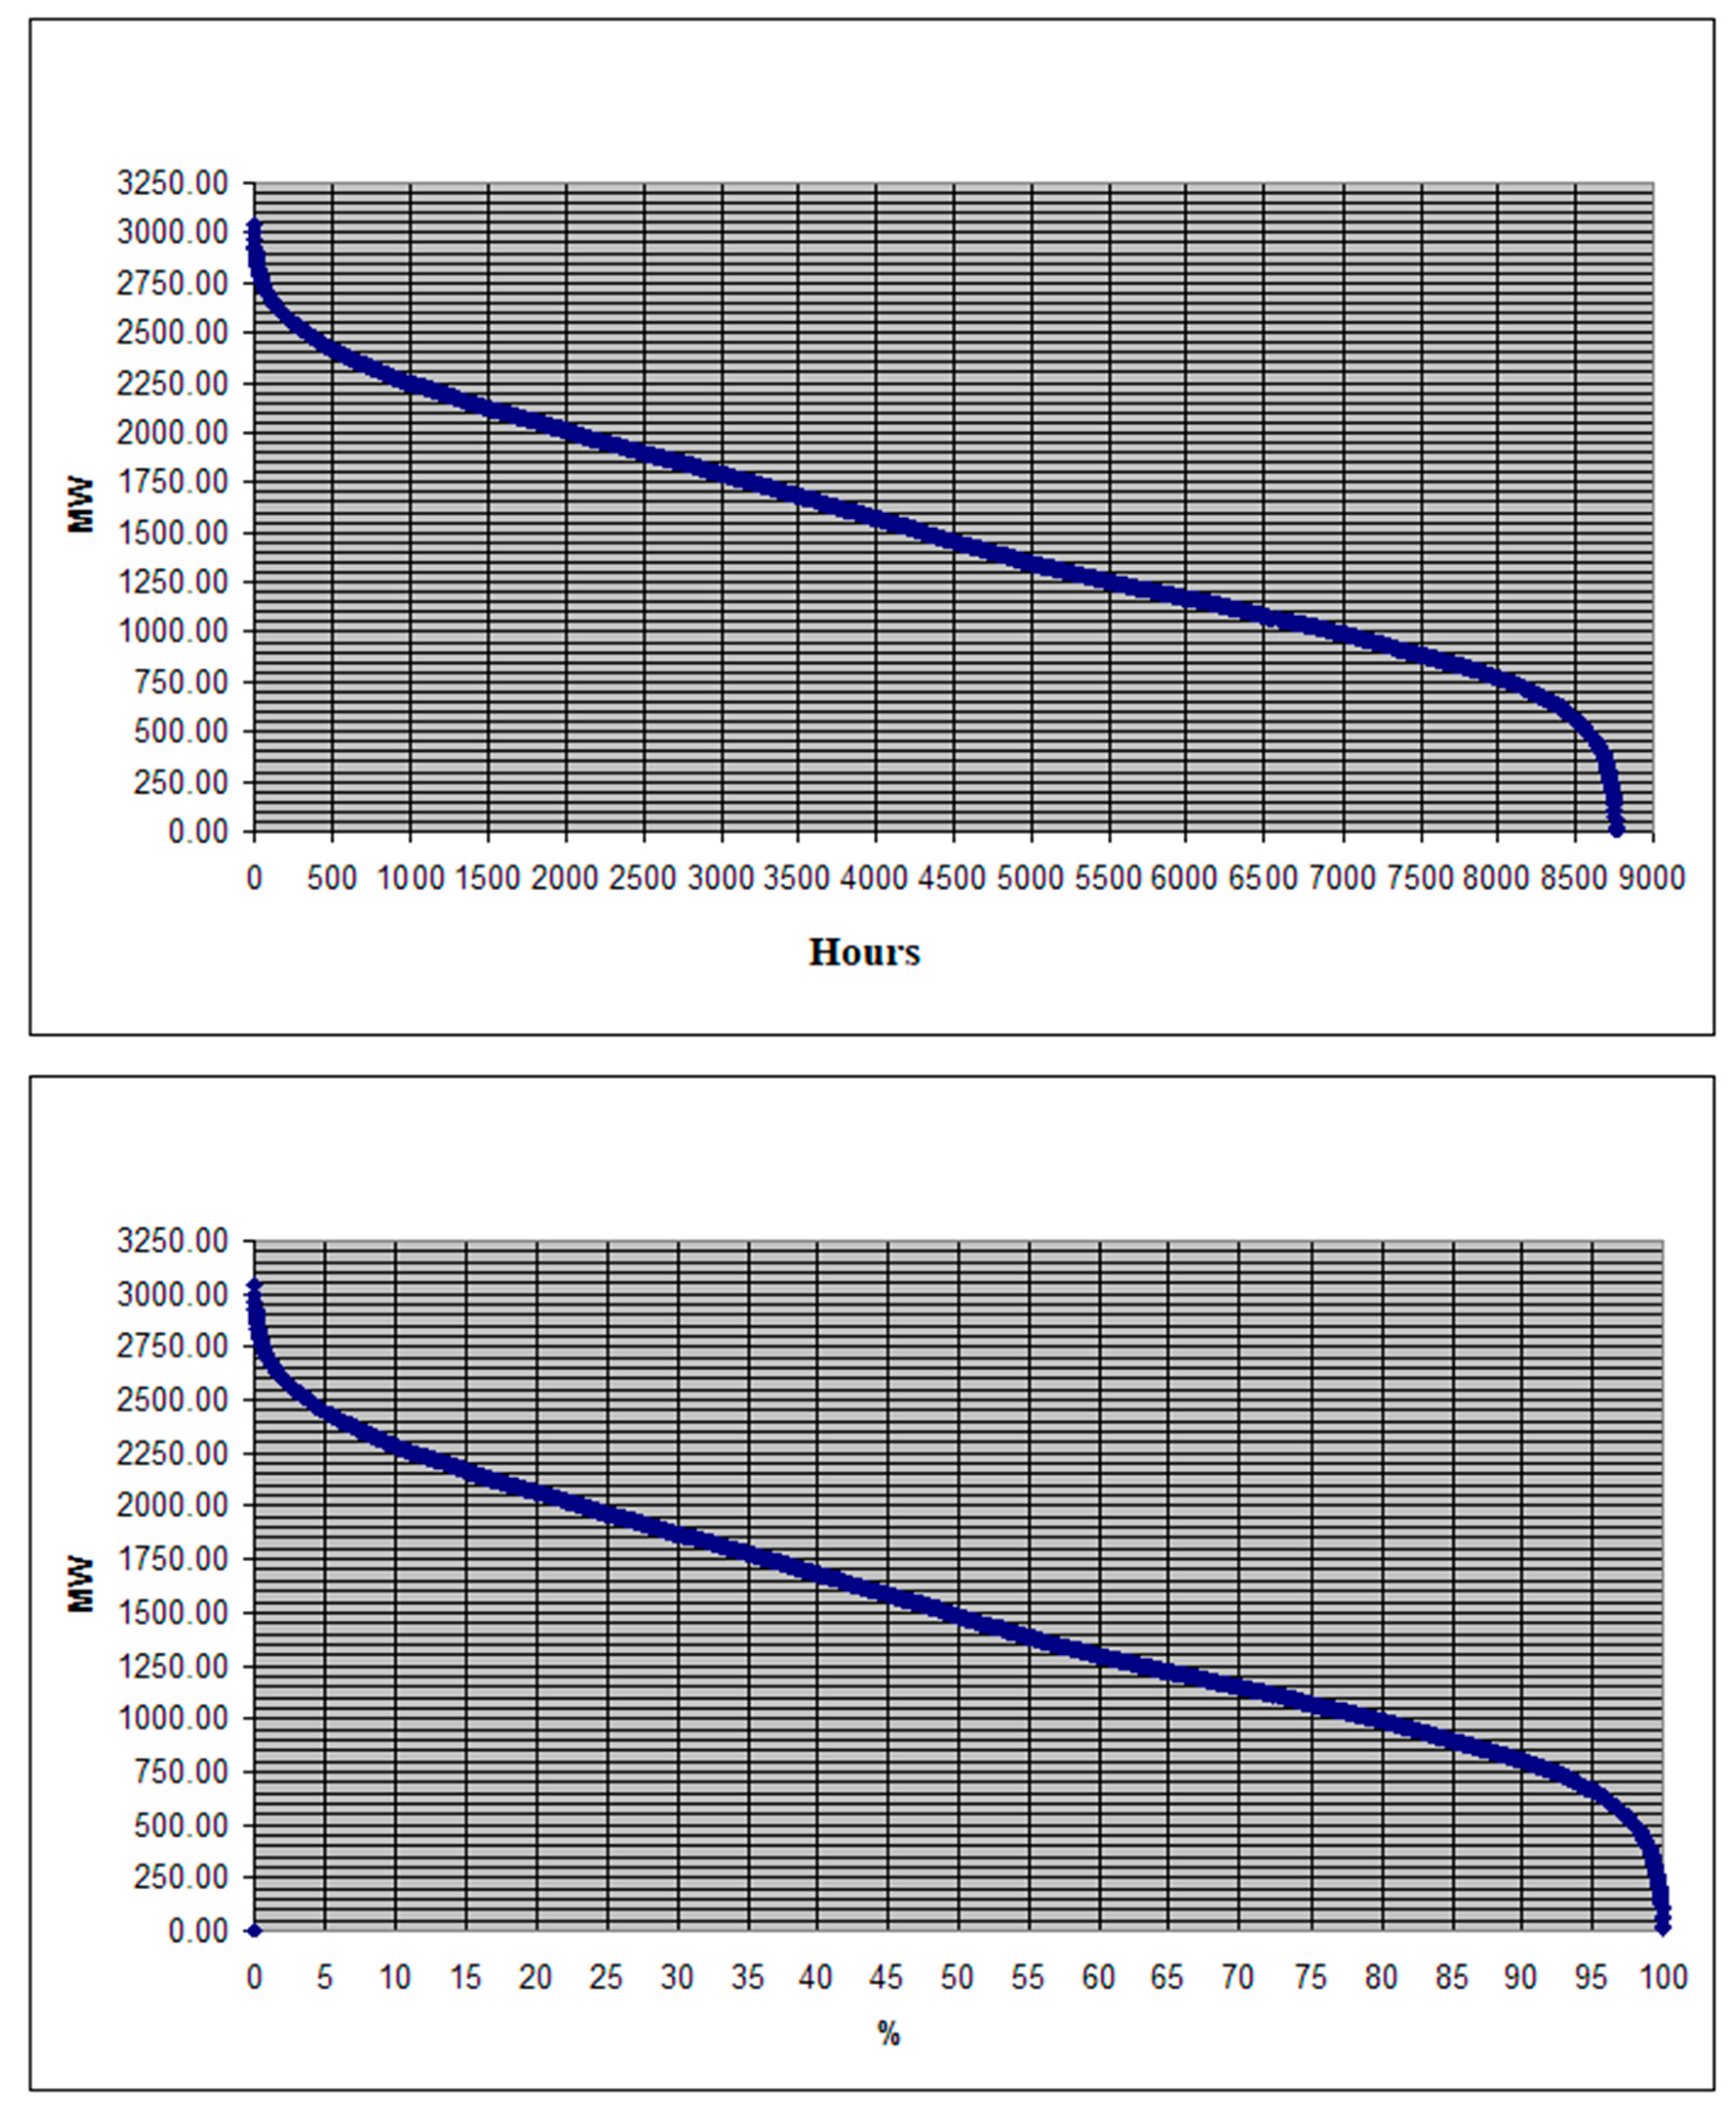
Based on previous year scheduled fast tertiary reserve for positive and negative increment (or variations), its duration curves can be drawn to show the availability of fast tertiary reserve. Hourly values of available fast tertiary reserve separately for positive and negative increment are sorted in descending order and charted using X Y (Scatter) chart type as in
Figure 6 and
Figure 7.
From
Figure 6 and
Figure 7, we determine that in 90% of the time the available fast tertiary reserve for positive increment is 1150 MW, while the available fast tertiary reserve for positive increment is 760 MW.
Although the available fast tertiary reserve for positive increment is significantly higher, the minimum value should be considered according to (7). Thus, based on (9), the installed power in WPP that can operate without interruption is around 2901 MW.
Nevertheless, in the next years it might happen that the available fast tertiary reserve is less than in the previous years as in [
23], therefore the installed power in WPP that can operate without operation may decrease and the risk of curtailment could not be avoided.
Considering that the actual installed power in WPP is 3027 MW (as of November 2017) [
23], according to (10), the necessary fast tertiary reserve for positive and negative increment should be 793 MW. Thus, in our case the curtailment of WPP operation is possible due to the fact that the necessary fast tertiary reserve is slightly higher than the available fast tertiary reserve.
Therefore, new power system reserves are needed. However, investing in such capacities should be motivated with proper incentives due to the fact that they facilitate larger volume of wind energy integration.
5. Conclusions
The European context in terms of RES related policies, SE regional approach regarding wind energy integration and modeling wind energy integration in Romania in terms of power system balancing reserves have been emphasized throughout the sections of this paper.
As a novelty, we introduced a SE regional approach regarding wind energy integration from the power systems balancing resources point of view. The total need for power reserves in the region is practically equal to the sum of forecasting errors. The regional approach is using coincident deviations in SE European countries, which eliminates the need to keep the full individual power reserve capacity whole year, but rather to keep lower individual power reserve capacity and share it among the countries when needed.
For the regional balancing mechanism, the P90 and P99 probabilities can both provide useful information for financial and technical analyses. Therefore, the first approach to analyze exceedance probabilities is to make original dataset to a standard probability distribution and to calculate the respective values P90, P99 and other values from the cumulative distribution function (CDF). This approach has been widely used and it is correct in the cases of the dataset normally distributed. When the data is not normally distributed, there is no particular statistical probability distribution function that can fit the original dataset. In this case empirical CDF of the dataset is used to calculate the P90, P99 and other relevant values.
By comparing regional approach to country-by-country approach, it reveals that the regional approach decreases total reserve requirements by −2600 MWh/h and +2000 MWh/h. Thus, the regional approach would significantly reduce the power system reserve requirements for balancing the wind energy variations to less than half of that required by the present individual country approach. This is a clear message to decision makers to establish the legal framework for a regional approach for balancing power reserves sharing.
In addition, we introduced a model for wind energy integration in Romania from the power system point of view. First, based on the existing availability of the generating units, their notifications and technical limits, we envisioned a model that is able to calculate the installed power of WPP that could operate without considerable curtailments. For instance, for 2011, the installed power in WPP that could securely be integrated into the power system is around 2901 MW.
Furthermore, the model identifies the additional power reserve required for more wind energy integration. New investment in power system reserves are required to ensure sustainable development of the power system.
Therefore, the proposed methods and models treat the wind energy integration from a perspective that can give a brief overview on what should be foreseen as reasonable behavior of policy makers and investors.


