1. Introduction
The world is facing great challenges from climate change and environmental pollution. On 30 November 2015, at the United Nations Conference on Climate Change, President Xi Jinping promised to the world that “China pledges to peak CO
2 emissions by around 2030”, “and by 2030, reduce CO
2 per unit of GDP by 60–65% over the 2005 level”. China is under great pressure to reduce carbon emissions. In recent years, numerous provinces have suffered serious haze, and the need to reduce air pollution is severe. These pressures have impelled China to develop an “energy saving and emission reduction” (ESER) strategy [
1]. ESER has become China’s basic national policy, and guidelines for China’s energy and environmental policies were issued in the 11th, 12th, and 13th Five Year Plans (FYPs) [
1,
2,
3,
4].
The special energy structure of China means that effective power management is critical to energy saving, air pollution abatement, and carbon reduction. First, consumption of electric power is a major form of energy consumption. Second, the structure of electricity generation capacity in China is dominated by coal-fired power generation. In addition, it is not easy to increase the share of renewable energy in the existing electricity network, for a number of challenges and technical problems need to be overcome [
5]. Consequently, China’s energy structure cannot be changed in the short term. This paper thus attempts to resolve the problem of energy saving from the perspective of electricity utilization.
In China, the current model of energy saving is as follows: the central government establishes the energy saving goals for the whole country and each province, and at the end of the performance period, which is a Five-Year Plan (FYP) period, the central government examines the energy saving performance of each province. For example, the overall goal for energy consumption per unit of GDP set by the Twelfth FYP is a 16% reduction over the 2010 level for the whole country. By province, for Shanghai, Jiangsu, it is 18%; for Shanxi, Sichuan, 16%; for Guizhou, Gansu, 15%; and for Hainan, Tibet, 10%. If the energy saving goal is not achieved, the leaders of the province will lose promotion opportunities or even their jobs [
1,
6].
While it appears that the current regulation model of energy saving has achieved good effects, this model has also led regional governments to take short-term measures to give the appearance of meeting goals. For example, in 2010, the last year of the 11th FYP, several provinces instituted mandatory power rationing to achieve energy saving goals. Consequently, factories were forced to shut down, and even some hospitals and traffic lights suffered power cuts. Although mandatory power rationing is now banned by the central government, an effective long-term incentive mechanism has not been established under the current regulation model of energy saving.
China has a vast territory, and different regions vary greatly in economic development, industrial structure, and energy efficiency. As a result, the capabilities of rewarding from utilization of energy vary greatly across provinces. This paper thus proposes an interprovincial cooperative energy saving model (CESM) for China from the perspective of electricity utilization. Hereafter electricity is regarded as equivalent to energy. Under the cooperative energy saving model, the central government examines the performance of energy saving of the union as a whole instead of each province. The energy saving union in this model is composed of a few provinces. Based on achieving the goal of energy saving as a whole, the energy saving union reallocates the quota of electricity consumption to each member to maximize the benefits of the union from electricity utilization. The benefits from electricity utilization are then allocated fairly and reasonably. The Shapley value method is used to determine the allocation of benefits to increase the members’ motivation to participate in the cooperative effort. Under the CESM, energy efficiency and benefits from electricity utilization will improve significantly. The improved benefits will be used to support industrial optimization and economic upgrade, which will fundamentally promote energy saving in the long run. In this paper, the current energy saving mode is referred to as the non-cooperative energy saving model (NCESM).
The remaining sections of this paper are organized as follows: the second section reviews the related literatures. The third section constructs the interprovincial cooperative energy saving model, which consists of two parts: (1) an optimization model that calculates the optimal quantities of electricity consumption for each participating province; and (2) a model that allocates the economic benefits of the cooperation based on the Shapley value method. Then, the fourth section presents the case study on a cooperative union of the provinces of Shanghai, Sichuan, Shanxi, and Gansu in China. To test the impact of parameter values on the calculation results of the CESM, a sensitivity analysis was conducted. The final section offers conclusions, summarizes the study, proposes prospects for future research, and provides policy recommendations.
2. Literature Review
Because of global warming and looming energy shortages, energy saving has become a popular research topic. A voluminous literature on energy saving now exists, which from the perspective of management and policy can be classified into five major groups as summarized below:
(1) National and regional energy saving policy and management. Nandi and Basu [
7] reviewed the energy conservation initiatives by the Government of India in the past three decades. Al-Ajlan and Al-Ibrahim et al. [
8] proposed strategies and major policy measures for energy conservation in Saudi Arabia based on analysis of the major challenges facing the Saudi electrical power sector in implementing sustainable development. Fukasaku [
9] discussed the integration of Energy and environment policy in Japan. Slingerland [
10] suggested measures to realize energy conservation in liberalized electricity markets. Supasa and Hsiau et al. [
11] investigated the effectiveness of energy conservation policy between 1995 and 2010 in Thailand. Dixon and McGowan [
12] summarized the history of US energy conservation and efficiency policies and outlined the key provisions of two important energy saving acts in US. Keay [
13] discussed the contradictions between centralized and market based energy saving policies. Rossi and Bonamente et al. proposed a method to assess the footprint and energy consumption in built areas for UHI-affected lighting systems [
14].
In recent years, an increasing number of researchers have focused on China’s energy saving management and policy. At first, several researchers have explored the performance and potential of energy saving in China. Zhang [
15] reviewed China’s energy conservation situation from an international perspective. He and Liu [
16] analyzed the effect and potential of energy conservation based on the database of energy intensity in the last two decades in China. Xu and Fan [
17] evaluated the national performance of energy conservation and emissions reduction in China at the national level, while Wang and Su [
18] and Zhou and Mao [
19] explored this performance at the city level, and Guo and Zhu et al. [
20] at the provincial level. Secondly, several researchers have studied energy saving policies in China, including their logic, effects, and implementation. A few studies reviewed energy saving policies in China and proposed further policy suggestions [
2,
3,
4,
21]. Hu [
22] discussed the mechanism of energy conservation assessment of fixed-asset investment projects in China. Zhao and Chang et al. [
23] discussed the Challenges that China is facing in energy conservation and emission reduction, as well as the latest state policies and plans to address them. Zhao and Li [
24] argued that local governments can assist industrial enterprises in achieving energy saving targets. Zhang and Feng [
25] and Zhao and Wu [
26] studied the problem of energy saving target location in China. In addition, some studies have investigated other issues on energy saving management and policy in China. Kostka and Shin [
27] analyzed the current situation of the energy service company market in China. Li and Zhao et al. [
28] analyzed China’s numerical management system for promoting national energy saving.
(2) Industrial energy saving policy and management. Al-Mofleh and Taib [
29] discussed the current status of energy conservation in different sectors in Malaysia. Ke et al. [
30] analyzed China’s industrial energy consumption trends from 1996 to 2010 with a focus on the impact of the Top 1000 Enterprises Energy Saving Program and the Ten Key Energy Saving Projects. Li and Lu [
31] constructed a framework on technology selection for energy conservation and PAHs control in the iron and steel industry. Liu et al. [
32] evaluated the total-factor energy efficiency of the thermal power industry in China at the national and provincial levels. Brunke and Johansson [
33] investigated the barriers to and drivers of the adoption of energy conservation measures in the Swedish iron and steel industry. Brunke and Blesl [
34,
35] assessed the potential of energy conservation measures and their ability to compensate for rising energy-related costs for the iron and steel and cement industry in Germany. Nikolaidis and Pilavachi [
36] evaluated energy saving measures in building sector in Greece from an economic point of view. Li et al. [
37] summarized the energy conservation and emission reduction policies for the electric power industry in China. Fromme [
38] analyzed the potentials and obstacles of energy conservation in the Russian manufacturing industry, while Özkara and Atak [
39] evaluated the electricity saving potential of the manufacturing industry in Turkey. Zhao et al. [
40] analyzed the energy consumption and efficiency of the Japanese and Chinese manufacturing industry. Boharb and Allouhi [
41] studied the energy conservation potential of an energy audit within the pulp and paper industry in Morocco. Ahiduzzaman and Islam [
42] discussed the energy utilization and environmental problems of the rice processing industries in Bangladesh. Using different approaches, several researches evaluated the performance and potential of energy conservation in industries in China, including the iron and steel, power, heating, and cement industries [
43,
44,
45,
46,
47,
48,
49,
50].
(3) Institutional and corporate Energy saving practice. Lo [
51] analyzed the energy conservation situation in China’s higher education institutions. Emeakaroha and Ang [
52] analyzed the implementation results of an energy conservation strategy known as Integration of Persuasive Technology and Energy Delegate, in University residential halls. Faghihi and Hessami [
53] investigated the feedback from designing campus energy improvement programs based on energy efficiency and conservation. Castleberry et al. [
54] assessed the drivers and barriers of energy saving measures in Oklahoma’s public schools. Barbatoet al. [
55] described the structure and optimization methods of an energy management framework for a smart campus. Agarwal et al. [
56] tested the effectiveness of school children nudges in influencing household behaviors to reduce electricity consumption, and indicate that school children could be used to drive home behavioral changes in electricity conservation by families.
(4) Household energy saving management and activity. Mullaly [
57] demonstrate that householder energy use behavior has an important influence on home energy saving. Goldblatt and Hartmann [
58] developed an approach that combines modeling and interviewing for communicating about energy use to promote household energy conservation. Shimoda and Asahi [
59] evaluated the city-scale impact of residential energy conservation policy. Leighty and Meier [
60] proposed a method for prioritizing household energy conservation actions. Ellegård and Palm [
61] demonstrated the problems arising from concepts confusion of household and individual when making policies to reduce household energy use. Jones and Leach [
62] studied the enormous variation in the quality of local authorities’ strategies for improving residential energy efficiency and discussed reasons for this variation, to determine the most effective approaches to Home Energy Conservation Act of UK. Sardianou [
63] investigate the main determinants of household energy conservation patterns in Greece. Thøgersen [
64] introduced an instrument for measuring housing-related lifestyle to provide new energy saving opportunities for households in Europe. Brounen and Kok [
65] examined the relationship between energy awareness, literacy and conversation behavior of households based on a detailed survey of 1721 Dutch households, while Sun and Zhang [
66] documented the association between household environmental ideology and energy conservation behavior in China. In Singapore, Kua and Wong [
67] conducted an intervention study to design integrated household energy conservation policies; in addition, Bhati and Hansen [
68] found that individual perceptions of using smart technology for energy saving remained in the concept stage, meaning that residents’ behavioral patterns of energy consuming were unchanged, and today’s smart technology design need to be improved based on the understanding of these patterns. Giraudet and Guivarc [
69] explored the potential for energy conservation in French households, and Guo and Kurdgelashvili [
70] analyzed achievable potential of residential energy savings in Xiamen, China. Zhang and Stern [
71] analyzed the costs of energy saving and CO
2 mitigation in rural households in China.
(5) The relationship between energy saving and economic development, environmental protection. Parfomak [
72] demonstrated that, due to lower fuel and plant construction costs, the economics of electricity conservation are much more dependent on the valuation of environmental externalities than they were in 1980. Niu and Ding [
73] evaluated the causality between energy consumption, GDP growth, and carbon emissions for eight Asia-Pacific countries from 1971 to 2005 and indicated that there are long-run equilibrium relationships between these variables; meanwhile, Chang and Carballo [
74] examined the same causality in twenty countries from Latin America and the Caribbean region and found that only four of these countries can implement energy conservation polices without affecting their economic growth, four others are not able to consider an energy conservation policy with economic growth, and the other twelve should focus on their economic growth before adopting any conservation policies. Lin and Liu [
75] discussed the dilemma between economic development and energy saving based on energy rebound effect analysis in China. Al-Mulali and Ozturk [
76] explored the relationship between energy conservation policies and economic growth in the six Gulf Cooperation Council countries, finding that energy conservation is not an ideal policy for the Bahrain, UAE, Oman, and Qatar because it will have negative consequences on their economic growth, while this policy can be implemented in Kuwait and Saudi Arabia since it will not harm their economy. Mirza and Bergland [
77] quantified the impact of different electricity conservation policies on the value-added of industrial and services sectors in Pakistan and indicate that policies aimed at enhancing energy efficiency had better performance than policies aimed at increasing electricity prices. Nevertheless, Raza and Shahbaz [
78] investigated the energy–growth–trade nexus in Pakistan and stated that energy conservation policies will reduce trade performance, leading to a decline in economic growth in Pakistan. Adom [
79] argued that, as long as industrial expansion in the country moves in tandem with investment in technological innovation, long-term sustainable growth and energy conservation targets are jointly feasible in Algeria. Ji and Chen [
80] evaluated the energy saving effect of China’s urbanization based on provincial panel data. Ringel and Schlomann et al. [
81] indicated that energy saving policies play a key role in transformation to a green economy in Germany.
It is worth noting that game theory has been applied to analyze the process of decision making on energy saving, to improve energy saving management and policy. On one hand, non-cooperative game theory has been used to design energy saving policy. Magirou [
82] constructed a nonzero sum, no-cooperative game model to describe the process of national decision making with respect to energy saving and fuel switching programs, which can be viewed as a Prisoner’s Dilemma paradigm. Liseet al. [
83] developed a game theoretic model of the Northwestern European electricity market to discover the relationship between electricity market structure and the environment, finding that a reduction in the market power of large producers may be beneficial for both the consumer (i.e., lower prices) and the environment (i.e., lower greenhouse gas permit price and lower acidifying and smog emissions). Long and Lan [
84] and Mu and Niu [
85] applied non-cooperative game theory to analyze the optimal strategy between the government and the enterprises in the process of implementing energy saving policy and offered suggestions for the government to improve the current energy saving policy. On the other hand, cooperative game theory has begun to be used to realize energy saving on the micro level. Based on cooperative game theory, Wu et al. [
86,
87,
88] developed models for optimization of distributed energy networks which were integrated with heating interchanges to realize cooperative energy saving and cost effectiveness. However, research exploring cooperative energy saving from the perspective of macro-management remains scant.
Despite the lack noted above, there is abundant research on cooperation in environment management, energy management, and green economy management. Twenty-one European Union (EU) countries, through the coordination of the Economic Commission for Europe, participated in the international joint efforts of the 1985 Helsinki Protocol to Reduce Sulfur Emissions. Taken as a whole, the 21 countries were able to reduce 1980 sulfur emissions by more than 50% by 1993 [
89,
90]. Based on the successful implementation of 1985 Protocol, the 1994 Oslo Protocol on Further Reduction of Sulphur Emission was signed [
89,
91]. Joint implementation of sulphur emission reductions offers the participating countries flexibility and cost savings in meeting the obligations contained in the Protocol [
91].
The gamelike nature of inter-regional pollution reduction has been well recognized in the literature. To deal with the transboundary nature of acid rain problem in Europe, Halkos [
92] proposed a static game model and got the cooperative and non-cooperative equilibria. His research results showed that cooperation can decrease the overall pollution reduction cost. Zhao [
93] developed a model of collective cooperation and reallocation of benefits (MCCRB), which seeks an optimal solution for water pollution reduction for the whole basin rather than a particular region, to solve transboundary water pollution conflicts. Zhao’s case study showed that MCCRB can decrease the total environmental cost and greatly increase resource utilization efficiency. Jia and Yokoyama [
94] discussed the cooperation of the independent power producers (IPPs) in the retail market of electricity and gave a formulation for the calculation of IPPs benefits. Their research results verified that cooperation among IPPs will generate more profits than competition. Carfì et al. [
95] proposed a coopetitive model for the Green Economy to address the issue of climate change policy and the creation and diffusion of low-carbon technologies. Xue [
90] and Xie [
96] studied cooperation between different provinces in a region for air pollution control and found that cooperative air pollution reduction can significantly reduce costs.
Whether cooperation benefits can be fairly allocated is critical to the success of cooperation. Though the cost gap allocation method [
97], the minimum-costs-remaining savings (MCRS) method [
98,
99], and the core method [
100] are often used to allocate benefits among cooperative partners [
90,
96], the Shapley value method, which allocates benefits among participants based on their contribution to the cooperation, is used in this paper. It has been found to be highly effective. As a result, the Shapley value method has been widely applied for allocating cooperation benefits among independent power producers [
94], allocating transmission costs and fixed costs in a power system [
101,
102], allocating pollution reduction costs among cooperative members [
90,
96,
103], and allocating profits and reduce costs in a supply chain [
104,
105,
106]. Considering the externality and gamelike nature of energy saving problem just like inter-regional pollution reduction problem, this paper construct the CESM based on optimization theory and cooperative game theory to improve the current energy saving model in China.
Considering the fundamental role of energy in economic development and the complex and systematic nature of energy saving management, all these groups of research on energy saving management and policy are necessary and significant. However, previous research paid little attention on how to realize energy saving through cooperation and joint effort, which is crucial to global optimization of energy resource distribution. Although a small number of studies discussed cooperative energy saving between different buildings from the micro and technological perspective [
84,
85,
86], research on cooperative energy saving from the macro and management perspective is in its infancy and needs more efforts. Furthermore, establishing an effective long-term incentive mechanism for energy saving in China is an important research topic.
In this context, this paper aims to construct an interprovincial cooperative energy saving model (CESM) from the perspective of electricity utilization, so that to maximize the benefits from electricity utilization of the cooperation union and improve the benefits from electricity utilization of each members. In the CESM, an optimization model that calculates the optimal quantities of electricity consumption for each participating province to meet the joint energy saving goal is constructed based on optimization theory, and a model that distributes the economic benefits of the cooperation among the provinces in the union is constructed based on the Shapley value method. This will contribute significantly to research on energy saving management models and mechanisms and enrich current literature on energy saving. Furthermore, in the short run, the CESM will provide incentives to motivate energy saving effectively; in the long run, implementing the CESM will promote optimization of the industrial structure and upgrade of economic development, which, in turn, will improve energy efficiency and promote energy saving fundamentally. The CESM provide the participating members not only a flexible and incentivizing solution to achieve short-term goals, but also a feasible and effective path to realize long-term energy saving strategies, if it is implemented in practice.
4. Results and Discussion
4.1. Case Study
Based on the economic development and natural resources endowments, this paper selected four provinces: Shanghai, Sichuan, Shanxi, and Gansu, as case study samples for the cooperative energy saving model (CESM).
Shanghai is located in East China. Its pillar industries include the information industry, the financial industry, the commercial circulation industry, and the automobile industry. While Shanghai is one of the most advanced provincial regions in economic development, it has few natural resources.
Sichuan is located in southwest China. Its key industries include metallurgical industry, chemical engineering industry, and hydropower industry. Sichuan is rich in natural resources especially in hydro power resource and is a major economic province with abundant natural resources.
Shanxi is located in North China. Its pillar industries are primarily heavy industries such as coal and metallurgical industries. It is weak in light industry. As one of the most important coal bases in China, Shanxi provides a large proportion of thermal power to the nation. Shanxi is a less developed province with abundant energy resources.
Gansu is located in northwest China. Its pillar industries include petrochemical industry and electricity. Gansu is rich in energy resources. In addition to coal, oil, and natural gas, Gansu has abundant renewable energy resources, including solar and wind energy. In general, Gansu is an economically backward province with abundant energy resources.
Here we denote Shanghai as SH, Sichuan as SC, Shanxi as SX, and Gansu as GS. To demonstrate CESM, we treat the four provinces as a cooperative energy saving union for the case study.
4.1.1. SH-SC-SX-GS Optimal Model of Benefits from Electricity Utilization
(1) Construction of the Function for the Cost of Electricity Consumption for Each Province
Firstly, we obtained the annual data of electricity price () and quantity of electricity consumption of each type of consumption terminal () in the four provinces during the period of 2001 to 2014 from China Energy Statistical Yearbook and the websites of the regional government, and calculated the annual total revenue of power grid enterprises () in each sample province.
Secondly, we obtained related data on the cost to revenue ratio of power grid enterprises in each province () from the China Electric Power Yearbook, and estimated the annual net cost of electricity consumption from 2001 to 2014 for each province ().
Finally, according to the data of the annual net cost of electricity consumption (
) and the annual quantity of electricity consumption (
) from 2001 to 2014 (
Table 2 and
Table 3), we found that the relationship between the annual net cost of electricity consumption (
) and the annual quantity of electricity consumption (
) in each sample province is linear based on the scatter plot. Therefore, we defined
as the independent variable and
as the dependent variable, and fitted the function for the cost of electricity consumption for the four provinces using linear regression analysis. The fitting results are shown in
Table 4 and
Table 5.
(2) Construction of Function of the Annual Gross Benefits from Utilization of Electricity for Each Province
First, we obtained the data on GDP, labor force, fixed capital stocks, and annual electricity consumption in SH, SC, SX, and GS from 2001 to 2014. The GDP of each province is defined as real GDP in 2000 prices, and fixed capital stocks are calculated using the perpetual inventory method in 2000 prices. Then, based on the Cobb-Douglas production function, multiple linear regression analyses were applied to obtain the electricity output elasticity coefficient for these provinces. The results of the regression analysis in
Table 6 show that the electricity output elasticity coefficients of the sample provinces are 0.381, 0.199, 0.330, and 0.207, respectively.
Second, according to data of the electricity output elasticity coefficient and GDP in these provinces from 2001 to 2014, we calculated the annual gross benefits from utilization of electricity
(
Table 7). We then applied the linear, quadratic, cubic, exponential, and power functions to fit the function between the annual gross benefits and the annual quantity of electricity consumption. Results showed that the exponential function is best. We thus applied the exponential function to fit the function of the annual gross benefits from electricity utilization. Based on the fitting results presented in
Table 8, we obtained the function of the annual gross benefits from electricity utilization for the four provinces.
| SH: |
| SC: |
| SX: |
| GS: |
(3) Construction and Solution of the Optimal Model of Benefits from Electricity Utilization
Plugging the functions of the annual gross benefits from electricity utilization and the functions of the cost of electricity consumption in the sample provinces into Formula (2), we obtained the functions of the annual actual benefits from utilization of electricity in the study provinces (
Table 9).
This paper used data of 2014 to calculate the optimal solution. Based on the energy saving target set by the central government and the GDP and electricity consumption data, we calculated the annual quotas of the maximum electricity consumption for SH, SC, SX, and GS. According to China’s actual situation,
and
are set to 0.85 and 1.2 respectively. Thus, the lower and upper limits of the electricity consumption were obtained (
Table 10).
Based on the above analysis, we established the optimal model of benefits from electricity utilization for SH-SC-SX-GS cooperative energy saving union:
s.t.
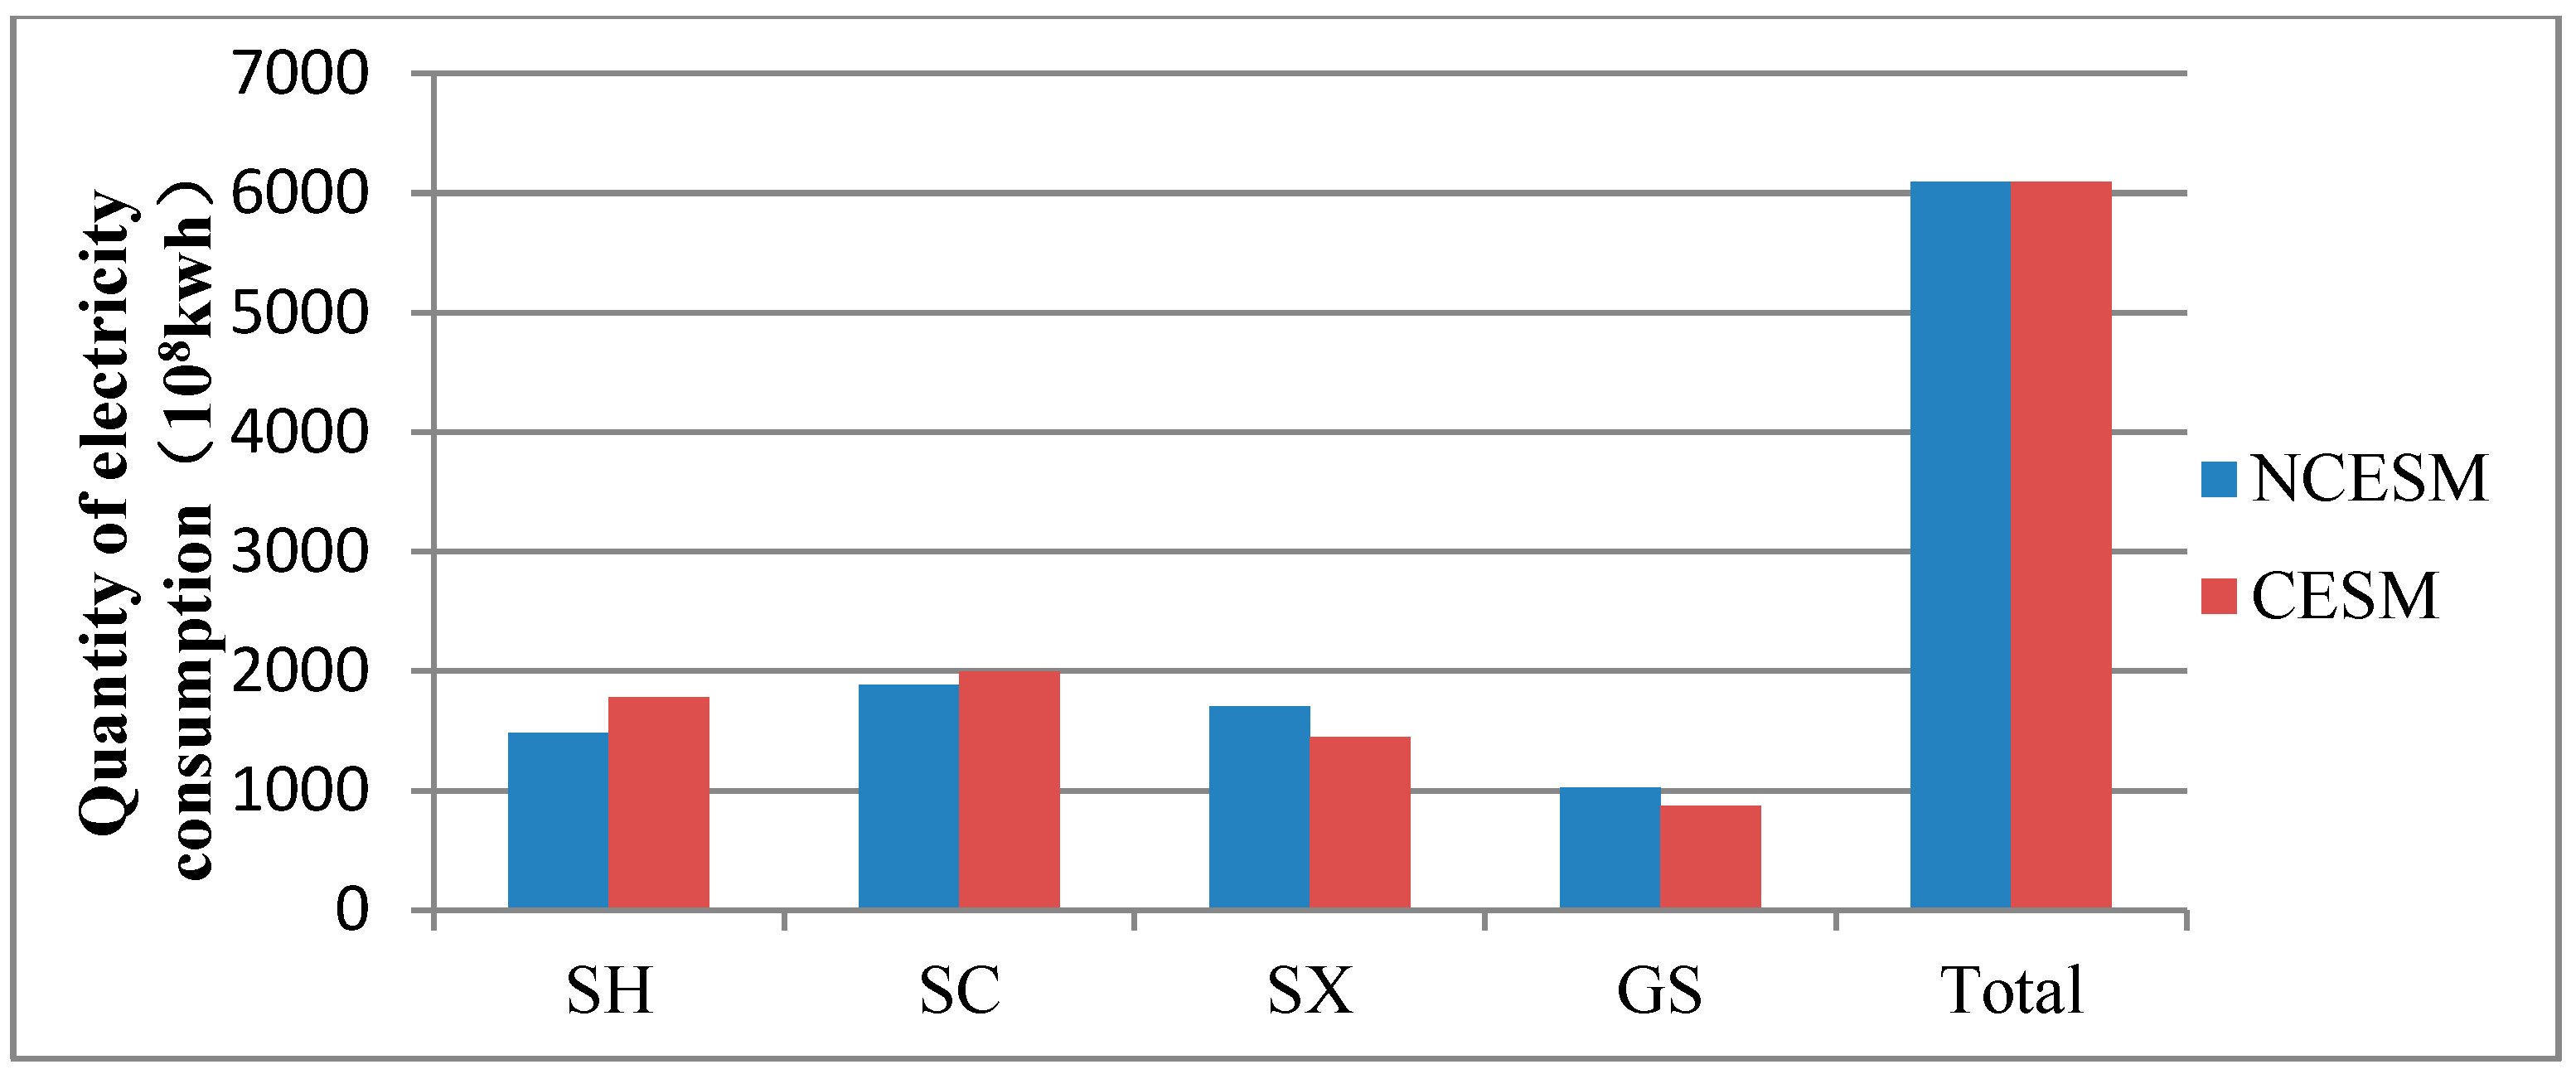
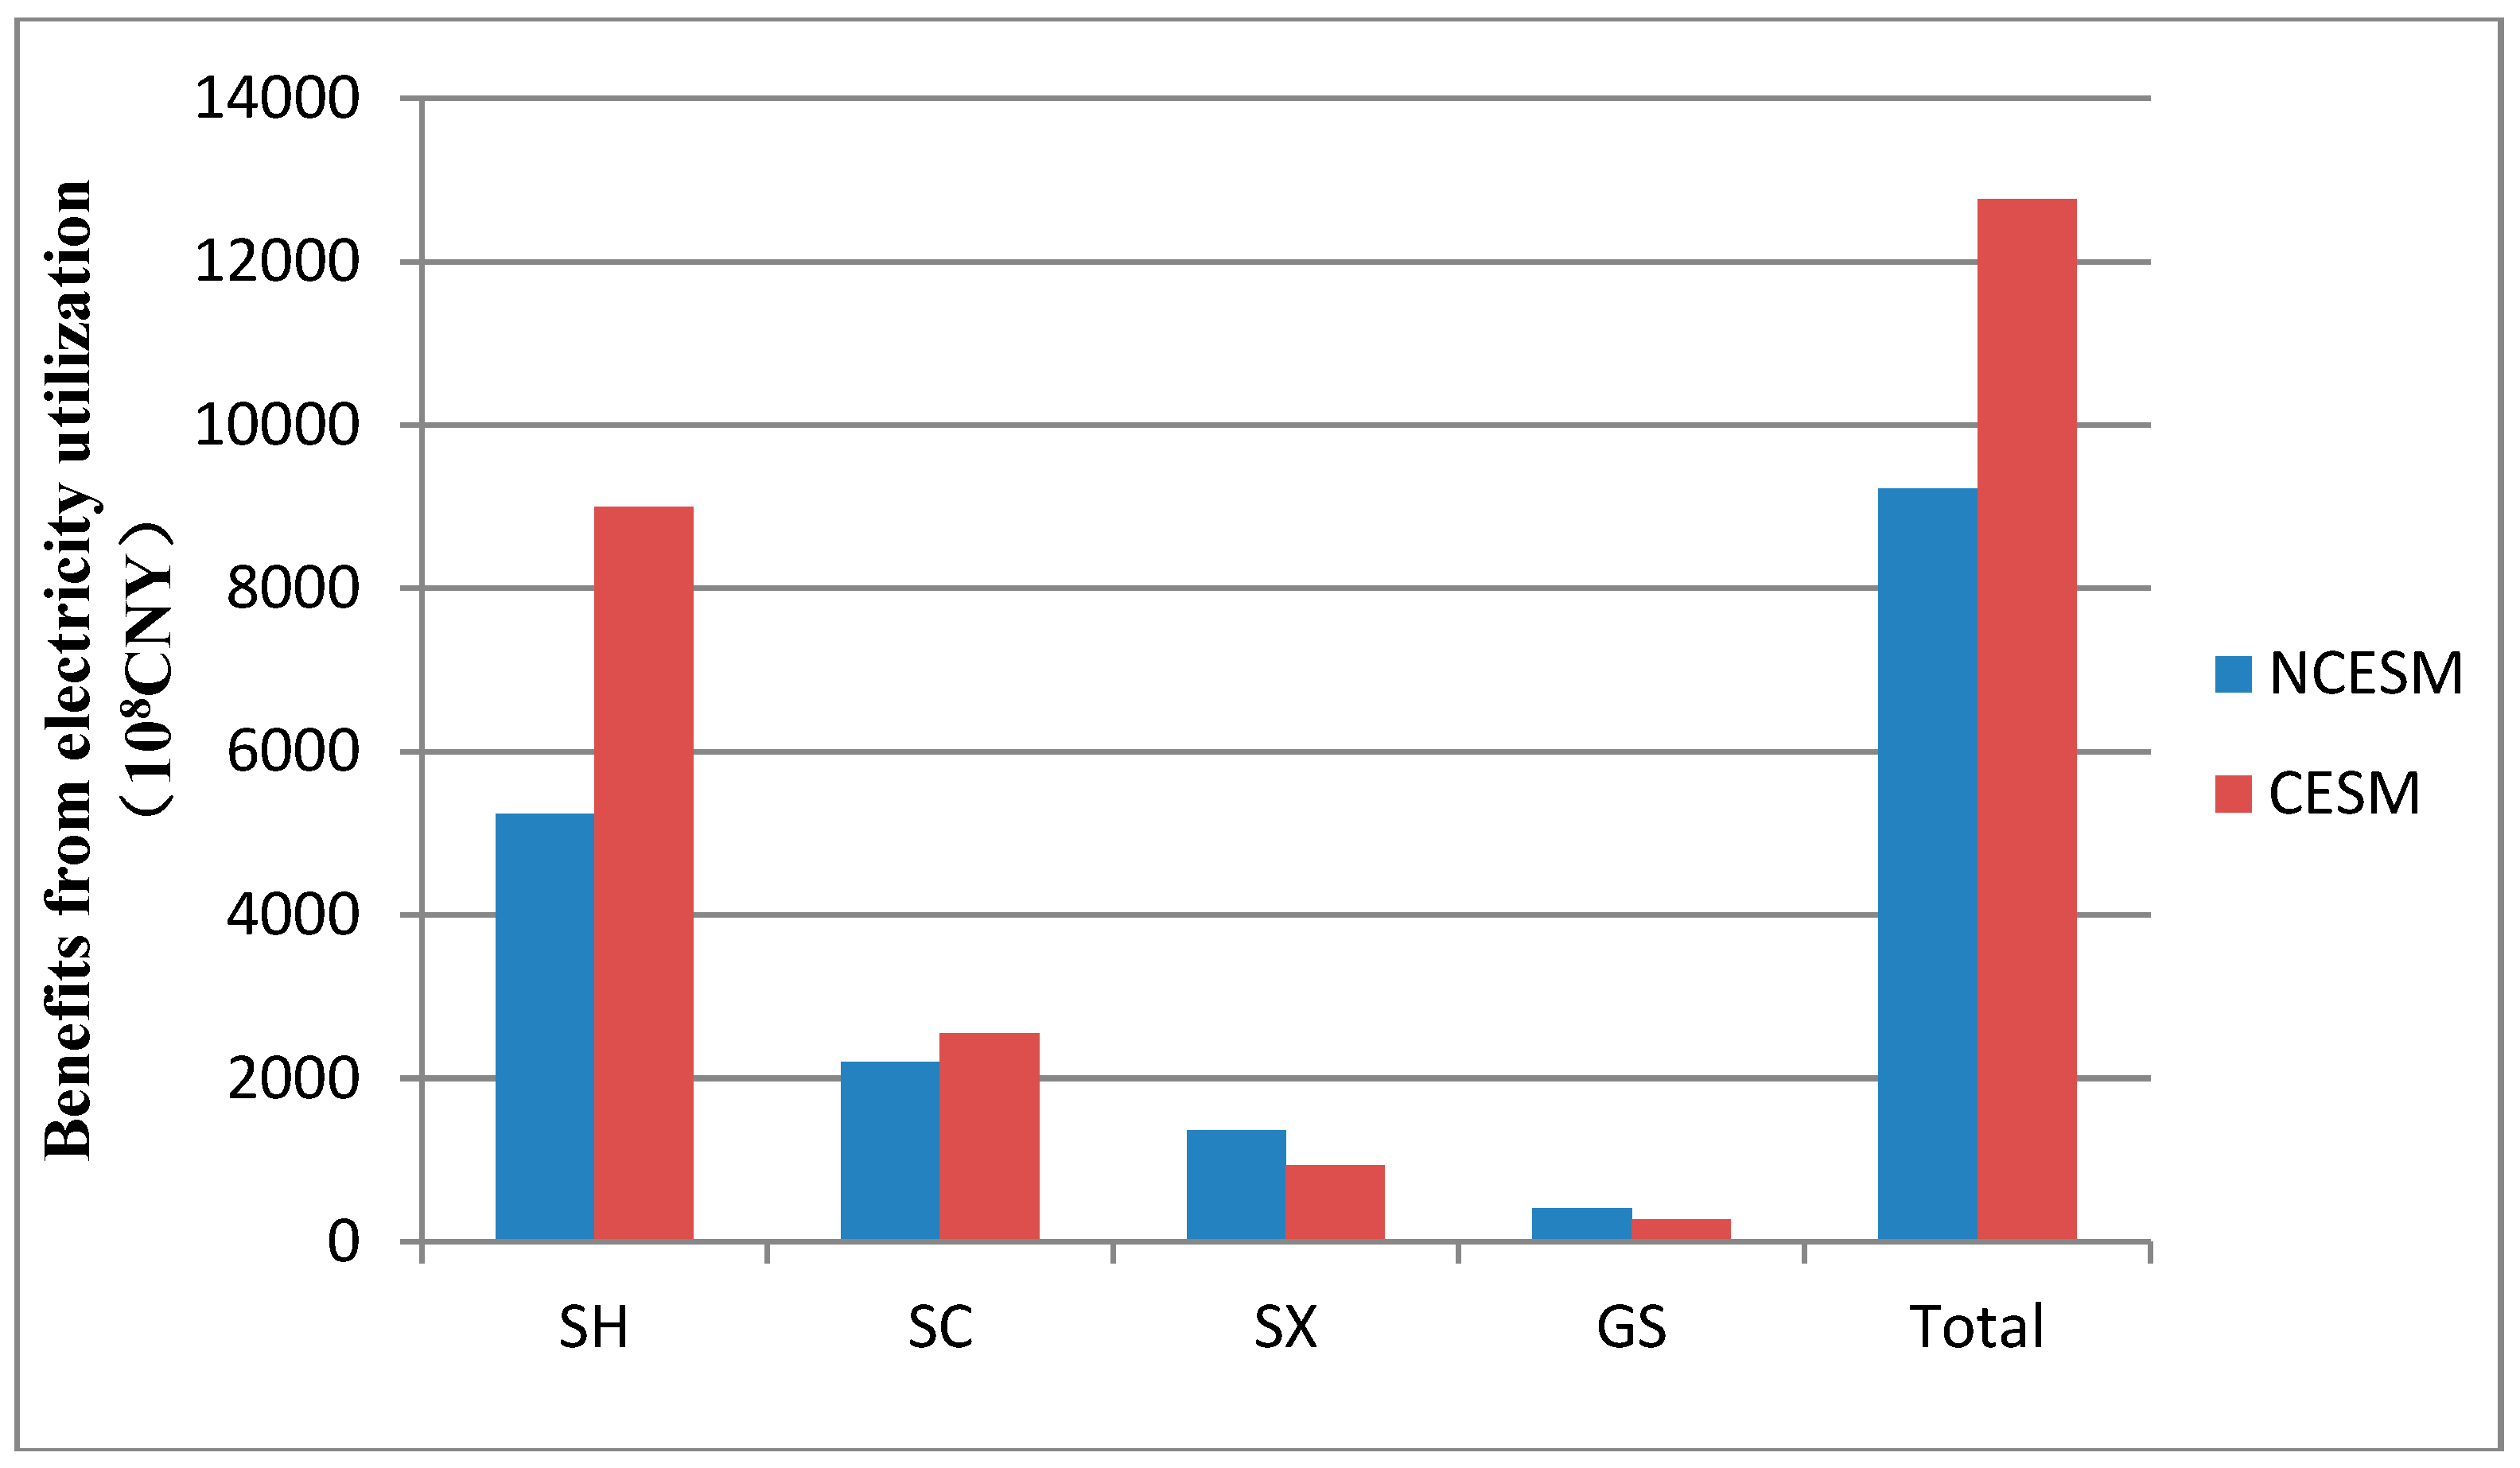
Using Lingo (Lindo System Inc., 16.0, Chicago, IL, USA) to solve the model, we obtained the optimal quantity of electricity consumption and the benefits from electricity utilization for each province in the union in 2014. The quantity of electricity consumption and the benefits from electricity utilization in these provinces under the NCESM and the CESM are shown in
Table 11 and
Figure 1 and
Figure 2.
Contrasting the electricity utilization benefits under two models, we found that the benefits to the union as a whole increase 353.979 billion CNY, a 38.38% increase. However, SX and GS obtain fewer benefits from the optimal model, and SH’s benefits increase much more than SC’s. Thus, if there is no further reasonable allocation of the benefits, other provinces, especially SX and GS, would not take part in the cooperation for their own interest, and the union could not be formed.
4.1.2. SH-SC-SX-GS Benefit Allocation Model of Cooperative Electricity Saving
Because the cooperative energy saving union consists of four provinces, there are 12 possible combinations for the cooperation. Using the Shapley value method, to obtain SH’s reward from the cooperation, we first calculated the values of
for all the combinations that involved SH, and then calculated
v(
S\{
SH}), the corresponding cooperation benefits if SH does not participate (
Table 12). Finally, based on the benefit allocation strategy in Equations (14) and (15), we obtained SH’s reward from the cooperation benefits:
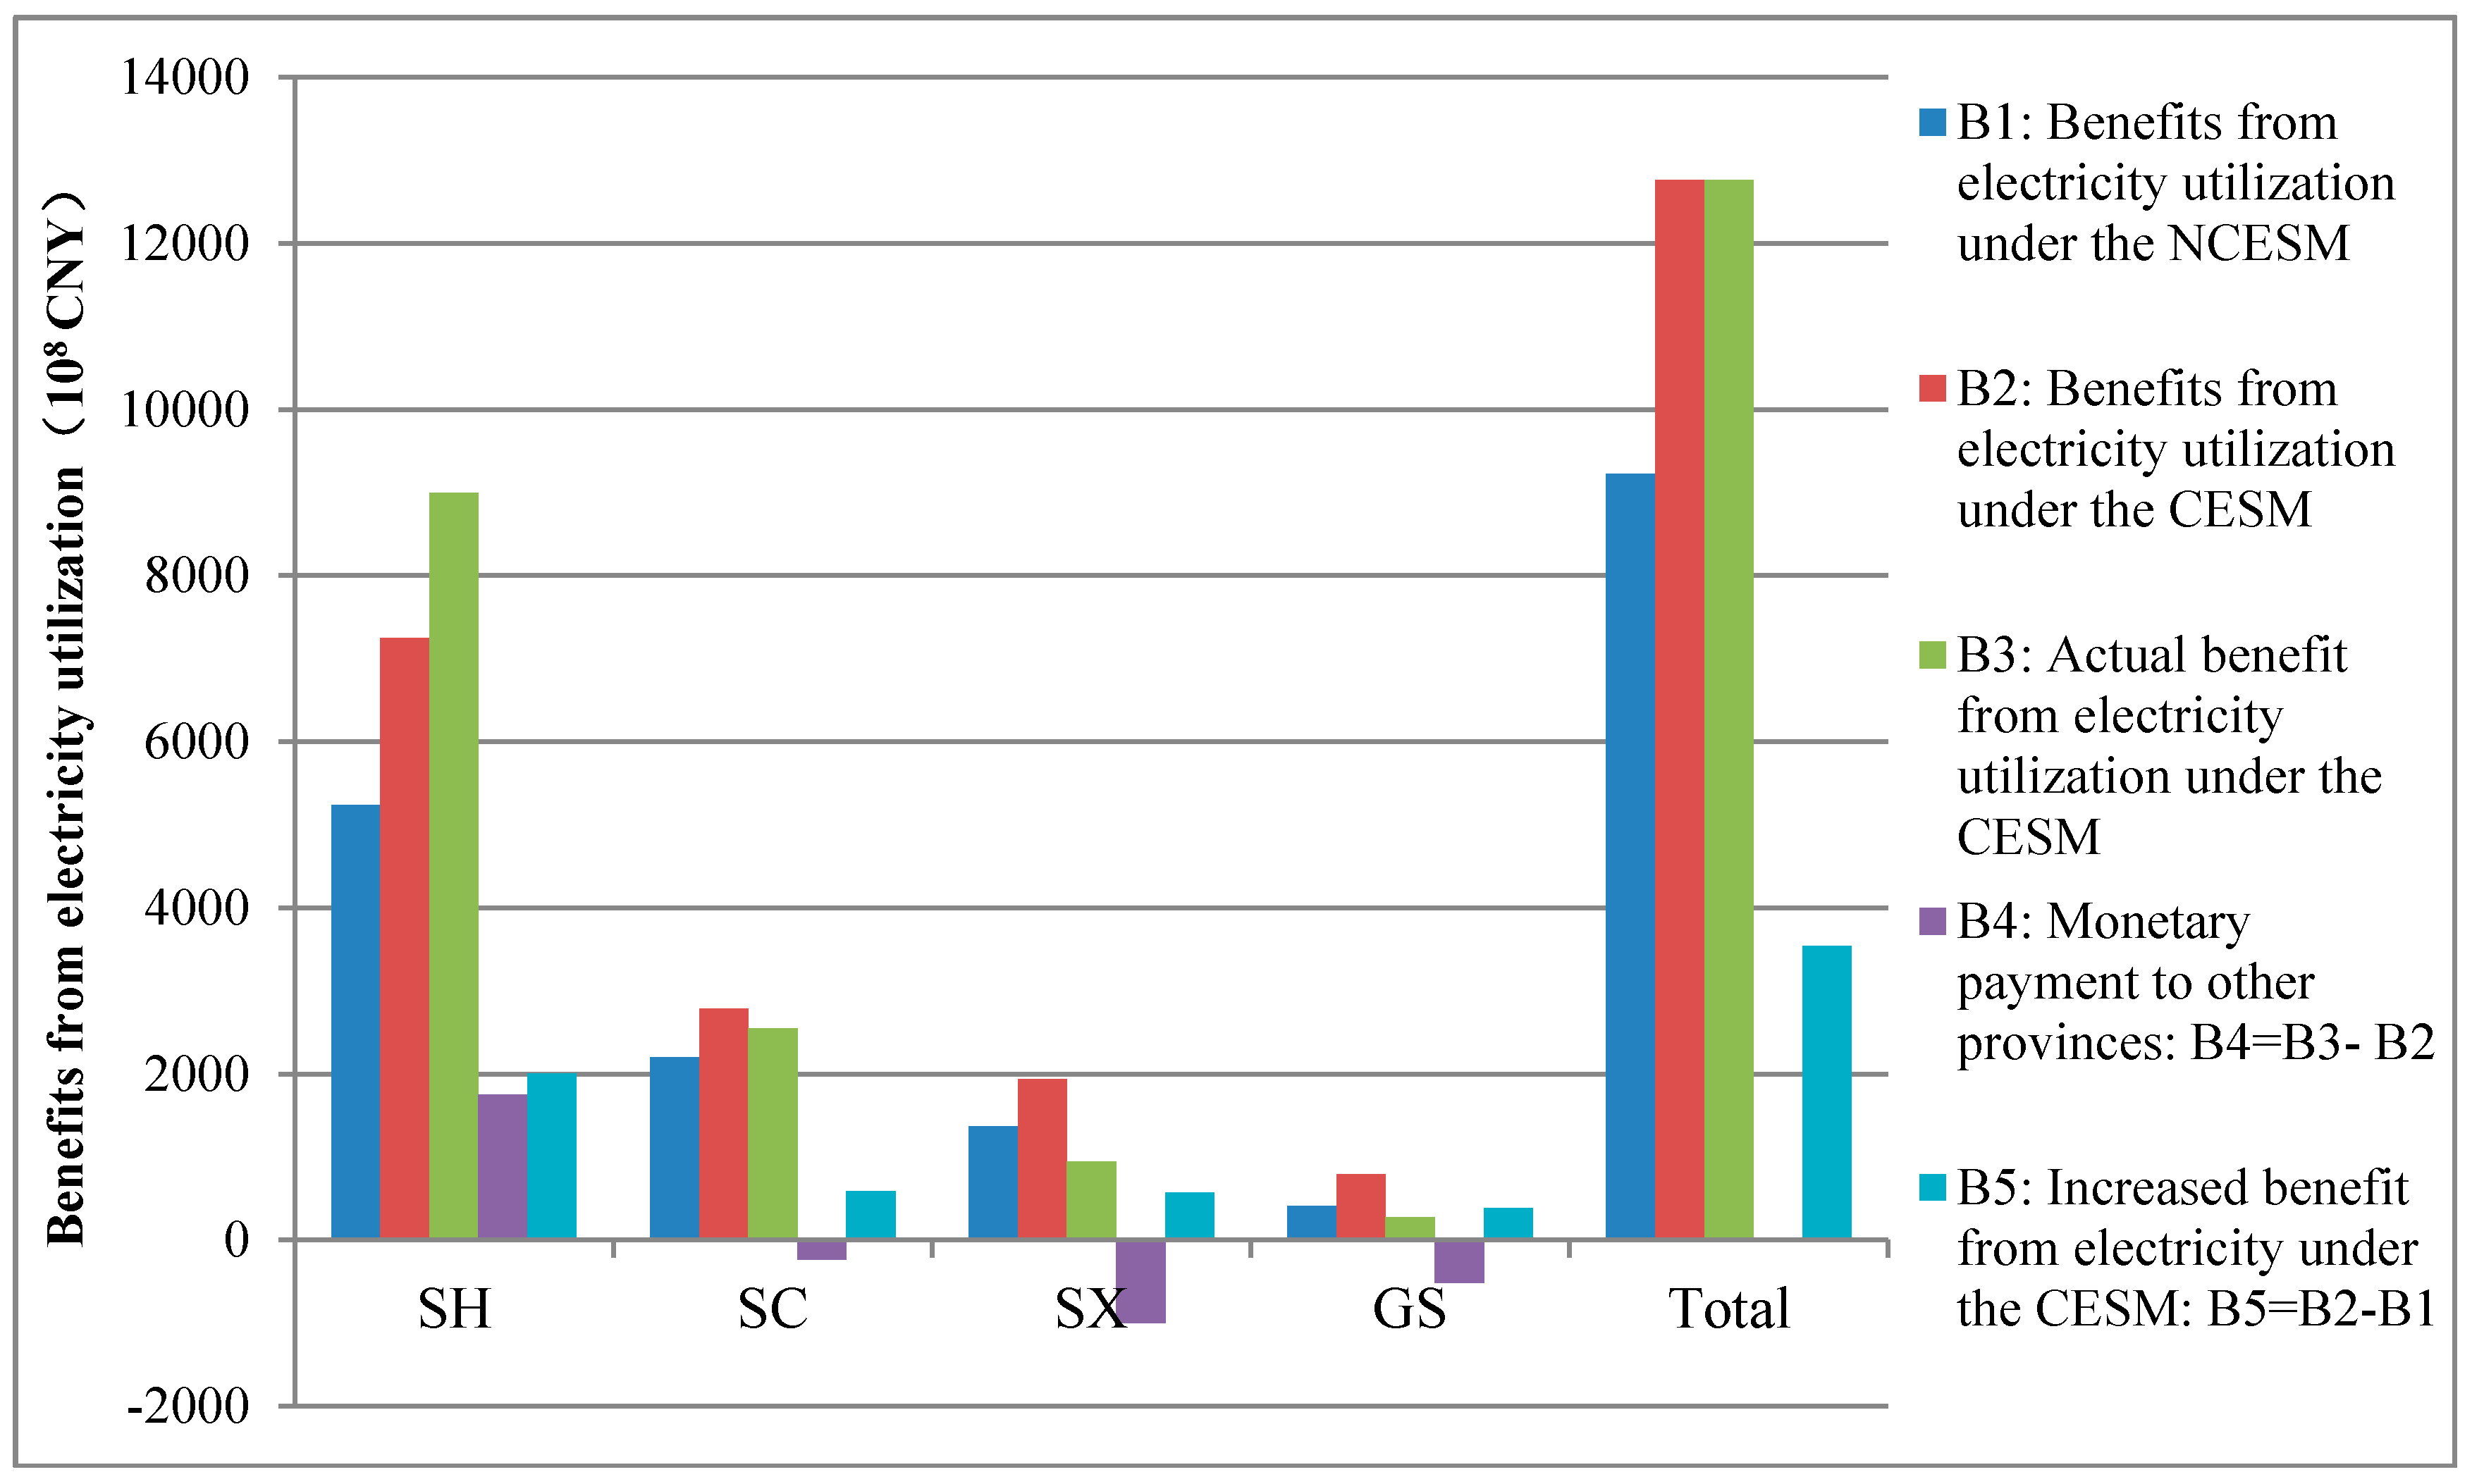
Shanghai would obtain CNY 7243.85 × 108 of benefits from electricity utilization by participating in the CESM. In the same way, we obtained the benefit allocation for SC, SX, and GS: CNY 2787.68 × 108, CNY 1940.98 × 108, and CNY 790.11 × 10⁸, respective.
Table 13 and
Figure 3 summarize the main results of the calculations of benefits from electricity utilization under the CESM and NCESM. First, it is obvious that the electricity utilization benefits of the union and each participant greatly increase under the CESM. The total benefits to the union from electricity utilization increase 353.98 billion CNY (38.38%). The benefits under the CESM to Shanghai, Sichuan, Shanxi, and Gansu increase 200.28, 58.37, 57.11, and 38.22 billion CNY respectively, increases of 38.21%, 26.49%, 41.69%, and 93.69%, respectively, over the NCESM. Second,
Table 13 and
Figure 3 show the money transferred among the four provinces based on their cooperation in 2014. Shanghai would need to pay 175.34 billion CNY to SC, SX, and GS together. SC, SX, and GS would obtain 23.83 billion CNY, 100.01 billion CNY, and 51.50 billion CNY from SH, respectively.
On the other hand, as we can see from
Table 11, with the same electricity consumption, the four provinces under the CESM create 38.8% more electricity utilization benefits than under the NCESM, which means the energy efficiency of the union as a whole improves greatly. In addition, electricity consumption per unit of electricity utilization benefits reduces 27.74%, which means the energy intensity of the union as a whole reduces greatly. Considering that energy intensity is the most important indicator to assess energy saving, CESM promote energy saving effectively.
From an implementation perspective, the differences in economic development and energy efficiency between SH and the other three provinces allow this cooperation. The economy of Shanghai is more developed and energy in Shanghai is more efficiently used than in the other provinces, which makes it feasible for SH to compensate them to obtain more electricity for economic activities, as SH can create more benefits with the electricity than the other provinces can. Given the incentive of economic compensation, the other provinces are willing to take part in cooperation and transfer electricity to Shanghai that they could be using themselves.
With the transferred electricity, SH has the possibility to support more advanced industries with high energy efficiency; with the economic compensation, SC, SX, and GS are able to implement or make policies to promote phasing out backward production capacity and developing and introducing advanced production capacity. As a result, in the long run, implementation of the CESM will promote optimization of the industrial structure and upgrade of economic development, which, in turn, will improve energy efficiency and facilitate energy saving fundamentally in the four provinces. By integrating economic incentives and implementary flexibilities into energy saving regulations, the CESM enables provincial governments to take the initiative and be proactive instead of passive and reactive. Hence, the CESM can promote energy saving more efficiently and fundamentally than the NCESM, a simple regulation mode.
4.2. Sensitivity Analysis
The parameters
and
in Formula (13) were set to 0.85 and 1.20 based on China’s situation.
and
denote the lower and upper bound coefficients of electricity consumption for province
i. To analyze the impact of changing the values of these parameters on the CESM calculation results, a sensitivity analysis was performed for the cooperation of the SH-SC-SX-GS union in 2014.
Table 14 presents calculation results (actual benefits from electricity utilization under the CESM) for each province and the union as a whole.
, is the lower bound coefficient of electricity consumption for province i. It determines the potential for province i to transfer electricity out to other provinces. The smaller is, the more potential province i has to transfer electricity out to other provinces, and the greater the cooperation benefits may be generated. Therefore, when fell from 0.85 to 0.8 and 0.7, the total benefits from utilization of electricity under the CESM increased moderately from 1276.26 billion CNY to 1310.68 billion CNY and 1355.77 billion CNY, and the benefits increase improved steadily from 38.38% to 42.11% and 47.00% greater than the NCESM. When decreased from 0.7 to 0.6, the total benefits and benefits increase were further optimized, rising slightly to 1364.98 billion CNY and 48.00%, which suggests that the calculation results are not sensitive to changes in in case of when < 0.7. As for the reason, when = 0.7, SH and SC both reach the upper bound of electricity consumption and the maximums of their benefits from electricity utilization, and reducing the value of further will not increase their electricity consumption and benefits. Consequently, the total benefits and benefits increase will not be sensitive to this change.
By comparison, when increased from 0.85 to 0.9 and 0.93, which meant less electricity could SX and GS transfer out, the total cooperation benefits from utilization of electricity decreased moderately from 1276.26 to 1251.44 and 1240.83 billion CNY, and the benefits increase went down steadily from 38.38% to 35.69% and 35.54%. Moreover, increasing from 0.93 to 0.95 resulted in a dramatic drop in the total benefits and the size of the benefits increase, decreasing from 1240.83 billion CNY and 34.54% to 1162.64 billion CNY and 26.06%, respectively. In fact, if is increased to 1, which means that there is no room for cooperation at all, the total benefits under CESM will be the same as NCESM and the benefits increase will be zero. Therefore, it is reasonable to draw the conclusion that when . ranges between 0.93 and 1, the optimization results of CESM are sensitive to changing the value of . This is because in this case SH does not reach the upper bound of electricity consumption, and the small changes in will lead to great changes in SH’s electricity consumption and greater changes in total benefits from utilization of electricity forthat electricity utilized in SH creates the largest yield in the union. Generally speaking, when ranges between 0 and 0.7, the optimization results of CESM are not sensitive to changes in ; when ranges between 0.7 and 0.93, the response of CESM to changes in is moderate; and when ranges between 0.93 and 1, the results of CESM become sensitive to changes in .
, as a parameter to calculate the upper limit of electricity consumption in province i determines the potential for province i to accept electricity from other provinces. The greater is, the more potential province i has to accept electricity from other provinces, and the greater the cooperation benefits may be generated. As a result, when rose from 1.2 to 1.30 and 1.40, the total benefits from utilization of electricity increased rapidly from 1276.26 to 1505.01 and 1819.56 billion CNY, and the benefits increase also improved sharply from 38.38% to 63.18% and 97.29%. When is increased to 1.5, the result of CESM reached the global optimization. Hence, increasing the value of further to 1.6 will no longer affect the model results, and total benefits and the benefits increase will remain at 2086.88 and 126.27%, respectively.
By contrast, when decreased from 1.2 to 1.15 and 1.1, which represented tightening the constraint in Formula (13) of the optimization model and less electricity being transferred to SH, the total cooperation benefits from utilization of electricity decreased substantially from 1276.26 to 1189.03 and 1100.93 billion CNY, and the benefits increase collapsed rapidly from 38.38% to 28.92% and 19.37%. When drops to 1, there is no possibility for cooperation at all and the CESM is identical to the NCESM. In sum, for the SH-SC-SX-GS union, the optimization results of the CESM are sensitive to changes in when it ranges from 1 to 1.5, and the CESM reaches the global optimization when = 1.5. The optimization results of CESM will not change when is greater than 1.5.
5. Conclusions and Policy Recommendations
In consideration of heterogeneity of industrial structure and ability of energy to create benefits in different provinces, as well as to motivate energy saving and reconcile contradictions between economic development and energy saving in the long run, this paper proposed a cooperative energy saving model (CESM), which offers greater incentives for cooperation, to help improving the current energy saving model in China. From the perspective of electricity utilization in this paper, by optimizing the quantity of electricity consumption in each province under cooperation and fairly allocating the benefits from cooperation among the member provinces based on the Shapley-value theory, the CESM can optimize the total benefits to the union from energy utilization. We applied the CESM to a case study of a union of Shanghai, Sichuan, Shanxi, and Gansu. Results showed that the total benefits to the union from electricity utilization increased 353.98 billion CNY and by 38.38% over the current model, and the benefits to Shanghai, Sichuan, Shanxi and Gansu increased 200.28 billion CNY, 58.37 billion CNY, 57.11 billion CNY, and 38.22 billion CNY, respectively over the NCESM.
The CESM developed in this paper can be broadly applied to other situations of cooperative energy saving: from electricity to other kinds of energy and even total energy use, from cooperation among different provinces to other administrative entities such as cities, counties, or individual enterprises. Since the models and methods in this paper are generally applicable, the CESM can easily be utilized in other situation by substituting the specific function of
and
into the optimal electricity utilization benefits model. As long as there are distinct differences between participants’ capability of rewarding from energy and energy saving is necessary, the CESM can be used to promote cooperative energy saving and optimize benefits from energy utilization. For example, just because that there are significant differences between the capability of rewarding from energy in SH and SC, SX, and GS, which stem from their different economic development, industrial structure, and energy efficiency, the four provinces have the cooperative space, and the CESM can be used to promote energy saving of the union. Similarly, the CESM can also be used to the cooperative energy saving union of Zhejiang, Inner Mongolia, and Guizhou. It is worth noting that, although the CESM is proposed to improve the NCESM in China, the CESM is also applicable to cooperation in energy saving among different countries and among different regions in other countries to cope with energy shortage and air pollution through joint efforts. It is applicable as long as participants have distinct differences in their capability of rewarding from energy utilization. Furthermore, the CESM is especially suitable for developing countries, which suffer from energy shortage, or face the dilemma of whether to develop the economy or implement energy saving, such as Pakistan, Brazil, and Chile [
72].
Furthermore, the implementation of CESM provides a way for the central government and regional government in China to investigate and understand the relationship between industrial structure, economic development and energy consumption, which is vital for optimization of industrial structure and formulation of industrial policy. By implementing the CESM, the provinces in a union with higher capability of rewarding from energy utilization will get more energy to support advanced industries with high energy efficiency, while the provinces with lower capability of rewarding from energy utilization will get economic compensation that can be used to promote phasing out backward production capacity and developing or introducing advanced equipment and technology. Consequently, implementation of the CESM will promote optimization of industrial structure and facilitate upgrade of economic development in the long run, which, in turn, will fundamentally improve energy efficiency and promote energy saving. The CESM does not only provide a flexible and incentivizing solution to achieve short-term energy saving goals for the participating members, but also a feasible and effective path to realize long-term energy saving strategies for the central government in China. By introducing economic incentives and integrating implementary flexibility into energy saving regulations, the CESM enables provincial governments to take the initiative and be proactive instead of passive and reactive. Hence, the CESM can promote more efficient and comprehensive energy saving.
To promote the implementation of interprovincial cooperative energy saving in China, policy recommendations for the central government and the provincial governments are proposed as follows:
(1) Policy recommendations for the central government
Firstly, the central government should allow and encourage cooperative energy saving among provinces. Under the current energy saving policy and management system in China, neither the central government nor the local governments have realized the importance of the CESM, despite knowing that the current energy saving model will lead to short-term orientation and having tried to develop policy to cope with it. For example, check the performance of energy saving yearly instead of every five years; but it will result in the soaring of administrative cost. The CESM helps not only the provinces achieve their energy saving goals and increase energy utilization benefits, but also both the central government and the provincial governments accomplish industrial optimization and thus realize long-term energy saving strategies. Consequently, the central government should develop policies and measures to encourage and implement the CESM in order to promote energy saving effectively and connect it to economy prosperity.
Secondly, it is essential to establish an authority or entitle a department of the central government to be responsible for the administration of cooperative energy saving including planning, implementing, coordinating and evaluating the application of CESM. Determining the members of the cooperation union, coordinating the allocation of cooperation benefits, evaluating the performance of the union and other such administrative issues require organizational support and a practical management system.
Thirdly, it is crucial to guarantee the authenticity and accuracy of the required data, such as GDP, labor force, and quantity of electricity consumption, to enable precise calculation of the CESM to obtain the optimal quantity of electricity consumption and the cooperation benefits for each union member. Transparent information and responsible data statistics contribute to enhancing the desire to collaboration and improving the efficiency of cooperation.
Fourthly, it is important to strengthen the energy conservation law enforcement. Although energy conservation law of People’s Republic of China is nearly 20 years old, energy waste remains common. Energy conservation law enforcement such as identification of responsibilities and rights, the institutional arrangements for energy conservation monitoring, and the development of executable reward and punishment rules is vital for implementation of cooperative energy saving, since it will expand the space for cooperation and increase the benefits of cooperation. This, in turn, will stimulate the energy conservation law enforcement.
(2) Policy recommendations for the provincial governments
Firstly, economically advanced provinces with high energy efficiency and capability of rewarding from energy utilization, such as Shanghai and Guangdong, should take the initiative to find cooperation partners. These advanced provinces depend on electricity and energy to take full advantage of their economic potential. Under the CESM, these provinces will be allocated more electricity to support their industrial development and realize higher benefits. Additionally, the transferred energy should be used to support advanced industries with high energy efficiency, such as advanced manufacturing industry and information industry, in order to guarantee the achievement of energy saving goal and increase of energy utilization benefits.
Secondly, less advanced provinces with low energy efficiency and capability of rewarding from energy utilization, such as Shanxi and Gansu, should make full use of the transferred economic compensation to support phasing out of backward production capacity, introduction of advanced production capacity, and research &development of advanced equipment and technology. To promote energy saving in the long run, optimizing industrial structure and upgrading economic development to improve energy efficiency is a fundamental and sustainable path. For example, the unsustainable industry structure in Shanxi and Gansu, which is characterized by high proportion of energy-intensive industries and backward production capacity, makes it difficult for these provinces to benefit from energy utilization. Consequently, to accomplish energy saving goals while maintaining economic development, the transferred economic compensation should be used to compensate the factories that are closed down for the sake of optimizing industry structure, to encourage technological innovation in the field of energy saving. In this way, the CESM can efficiently promote short-term energy saving and guarantee meaningful long-term energy saving.
Thirdly, the contribution-based Shapley value method, which is applied to allocate the cooperation benefits, provides a reference for determining the practical benefit distribution principals or compensation standards. In reality, the situation may be more complicated and more factors should be taken into account.


