Article

Internal Force Response of a Pile in an Inhomogeneous Temperature Field

1
School of Earth Sciences and Engineering, Nanjing University, Nanjing 210023, China
2
Nanjing University (Suzhou) High-Tech Institute, Suzhou 215123, China
*
Author to whom correspondence should be addressed.
Energies 2018, 11(1), 18; https://doi.org/10.3390/en11010018
Submission received: 16 November 2017 / Revised: 11 December 2017 / Accepted: 20 December 2017 / Published: 22 December 2017
(This article belongs to the Special Issue Geothermal Heating and Cooling)

Abstract

:
An inhomogeneous temperature field was built in an experimental model of sand with an embedded pile. The temperature of the soil, as well as the temperature and strain on opposite sides of the pile were investigated in the process of temperature balance. The effect of the inhomogeneous temperature field on the internal force of the pile was analyzed. The experimental results show that the inhomogeneous temperature field will cause a bending deformation in the pile body according to the FBG (fiber Bragg grating) strain sensors. The distribution of the bending moment along the length of the pile is related to the temperature difference. The maximum bending moments reached −25.7 N·m when the temperature difference was about 1.3 °C. Therefore, the influence of the inhomogeneous temperature field o· the internal force of the foundation pile should be taken into account in the applications of a ground source heat pump system.

1. Introduction

For the environmentally-friendly, energy efficient, and renewable advantages, the exploitation and utilization of shallow geothermal energy has aroused a great deal of attention. Ground source heat pumps (GSHP) have been utilized to provide sustainable heating and cooling energy for buildings for more than forty years [1]. In recent years, there has been a new utilization approach with respect to shallow geothermal energy which attempts to install heat exchange tubes in a pile foundation, which are also called energy/thermal piles. The approach has been extended to other energy geo-structures, such as diaphragm walls, tunnels, etc. [2]. These energy geo-structures are definitely used to support buildings (i.e., raft/mat foundations, piles) or the ground itself (i.e., retaining walls and tunnels) [3]. Potentially, energy geo-structures can reduce the installation costs and the land occupation compared with the normal GSHP.
During the operation of energy geo-structures and GSHP systems, the temperature of the underground structures and soil will change to different extents. Kramer et al. conducted a laboratory test to evaluate the thermal response of an energy pile in sand [4]. An experimental study of several types of ground heat exchangers (GHEs) installed in a steel pile foundation was carried out to investigate the performance of GHEs [5]. A computer model for these thermal process in the ground was presented in 1988 [6]. An annular cylinder heat source model was presented to simulate the heat transport of heat exchanger piles [7]. Ozudogru presents the development and validation of a 3D numerical model for simulating vertical U-tube geothermal heat exchangers (GHEs) [8]. Non-uniform thermally-induced strains and stresses develop in the cross-sections of energy piles as a result of the non-uniform temperature changes [9]. As a result of the thermal expansion and contraction, deformation and internal force will occur in energy geo-structures, adjacent underground structures, and soil [10].
Laloui et al. investigated the thermal load on bored piles 25.8 m in length and 88 cm in diameter [11]. The results indicated that the maximal axial thermal load was about 2000 kN and occurred at the lower part of the pile if there was no load applied on the pile head. The maximal axial thermal load increased to about 3000 kN and occurred in the middle of the pile if the pile was loaded on the head. Brandl et al. found that the maximal axial additional thermal load is about 300 kN in the middle of the pile when the pile temperature was increase 7 °C [12]. Ouyang et al. studied the settlement, friction resistance, and axial load distribution of the pile under the joint influence of the upper load and additional thermal load; an additional load of about 300 kN is obtained at the top of the pile during the heating process [13]. Gui et al. carried out field research on a loaded pile which was heated and cooled, respectively [14]. The maximal additional thermal stress appears in the middle part of the pile, which is related to the constraint condition of the pile. Sutman et al. indicated that the expansion of the pile was limited by the surrounding soil and the density of the soil at the tip of the pile, which resulted in axial compressive stress when the temperature of the pile increased [15]. Lu et al. have conducted load-temperature joint tests on a kind of friction energy pile [16], and the results showed that the distribution of the axial force and additional temperature stress are related to the load on the pile head and the constraint condition. It can be seen that the above research focused on the behavior of the energy pile under an even temperature load, including the settlement, friction resistance, the axial stress/load, etc., and the axial stress is related to the temperature changes. Actually, the temperature distribution of the energy geo-structures and the surrounding soil is inhomogeneous. However, there are few studies on the internal force in the inhomogeneous temperature field. In addition, if the groundwater flow is significant: a larger temperature increment at the back side of the heat source can be observed than at the front side [17], which will also lead to a temperature difference in the geo-structures. Consequently, the internal forces of the underground structure, such as the bending moment, will change because of the inhomogeneous temperature field.
In order to investigate the effects of the inhomogeneous temperature on the internal forces, a laboratory study was conducted on a small-sized model pile, which was installed in an experimental chamber filled with sand. An inhomogeneous temperature field was created in the chamber along the horizontal direction. The bending moment along the length of the pile was calculated according to the FBG strain sensors.

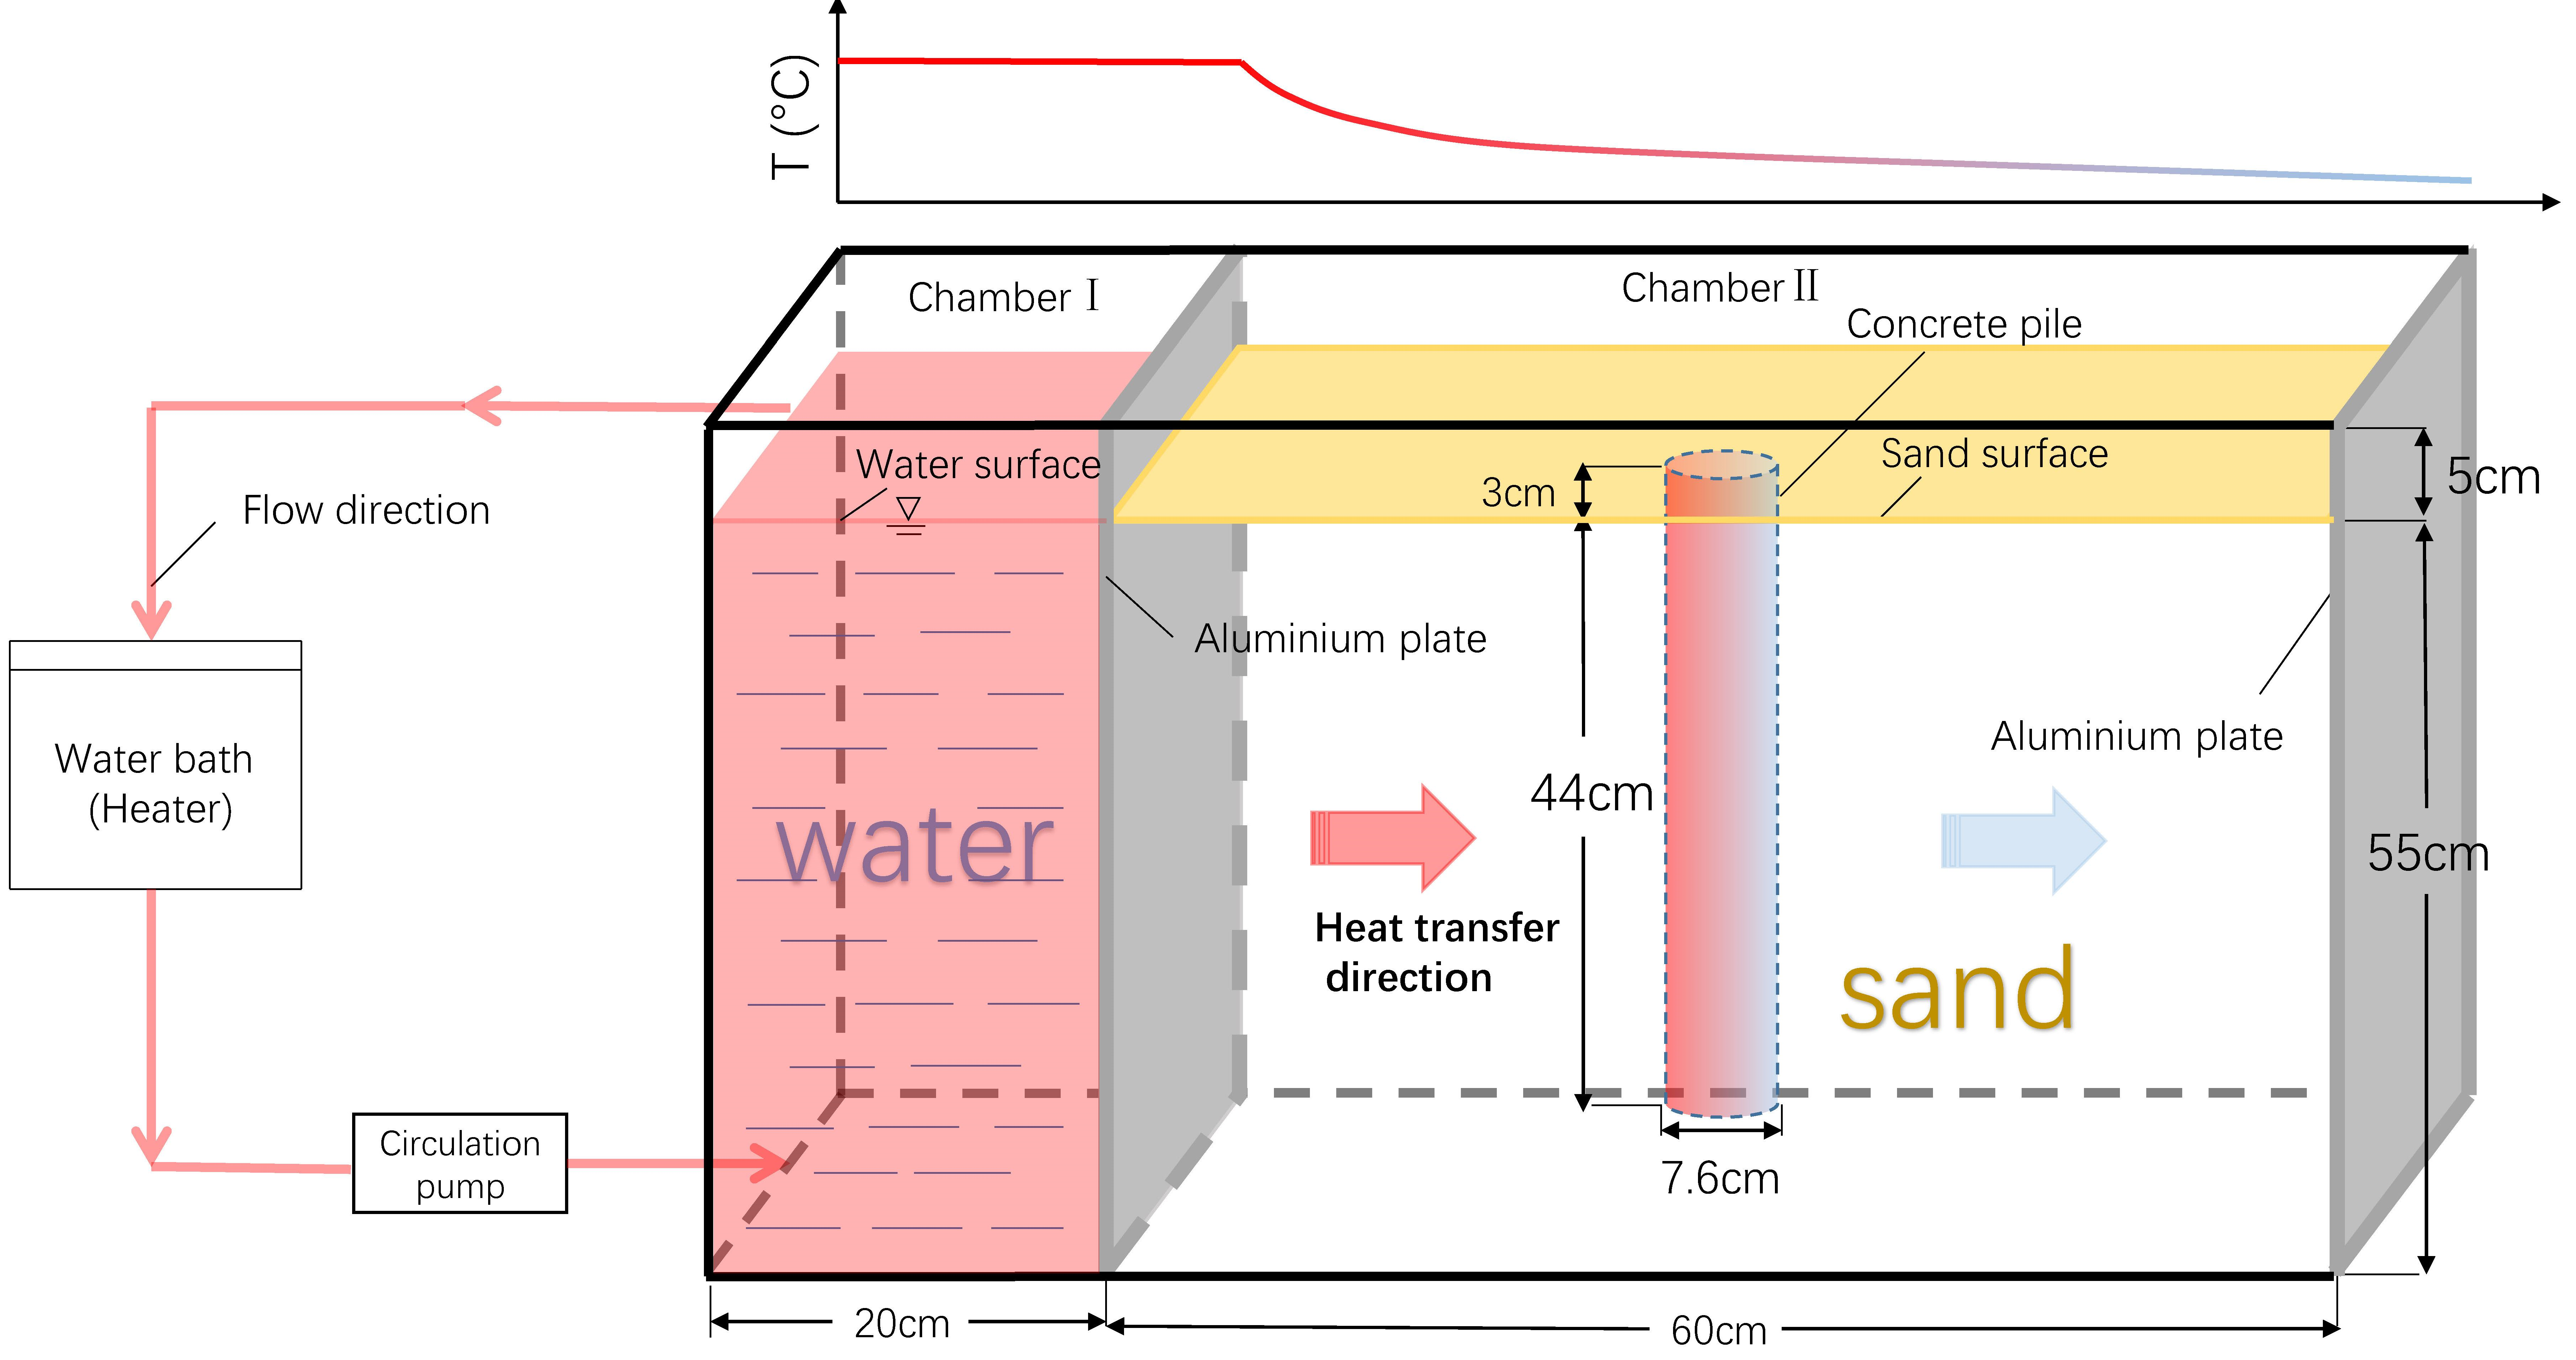
2. Model Test Design

2.1. Test Equipment

The size of the experimental chamber was 80 cm in length, 40 cm in width, and 60 cm in height, which was divided into two parts. Chamber I was used to simulate a stable heat source, such as an energy pile or heat exchanger. The length of Chamber I was 20 cm. Chamber II was used to fill the soil and model piles. The length of Chamber II was 60 cm, as shown in Figure 1. In order to keep the heat transferring mainly in the horizontal direction of the chamber, two highly conductive aluminum plates with thicknesses of 15 mm were installed between Chamber I and Chamber II, and the right side of Chamber II. The rest of the model chamber was made of low-conductivity plexiglass plate with a thickness of 15 mm and covered by heat insulating cotton with thickness of 20 mm. The top of Chamber I was also covered with heat insulating cotton to avoid the loss of heat in the tank and reduce the water evaporation. The R value, a measure of thermal resistance, for the top insulation is about 0.7 K·m2/W. The pile model was a scale concrete pile with a length of 47 cm and a diameter of 7.6 cm. The soil used for the test was a naturally-dried quartz sand. The water temperature of Chamber I was raised to 33 °C by means of a circulating heating system, which mainly includes a water bath, pump, and water pipe. The schematic diagram of the test equipment and the model chamber are shown in Figure 1.

2.2. Test Methods

Fiber Bragg grating (FBG) sensors (Suzhou NanZee Sensing Technology Co., Ltd, Suzhou, China) and Pt100 sensors (Suzhou NanZee Sensing Technology Co., Ltd, Suzhou, China) were utilized to monitor the strain and temperature, respectively. FBG is one of the most promising sensing technologies for structure and geo-engineering monitoring because of the advantage of multiplexing, small size, flexible installation, and immunity to electromagnetic interference [18]. As well as being sensitive to strain, the Bragg wavelength is also sensitive to temperature. Pt100 sensors were used for temperature monitoring and temperature compensation of the FBG strain sensors. According to the experimental design, epoxy resin was used to glue fiber Bragg grating (FBG) sensors and Pt100 sensors at corresponding positions of the concrete pile. In order to ensure the uniformity of the soil, a method of sand pouring was applied for stratified filling in Chamber II. The physical and thermal parameters of the sand are listed in Table 1. When the sand was filled to the designed height, the Pt100 sensors were placed at the designed position in the soil to monitor the soil temperature. The water temperature inside Chamber I was gradually increased to 33 °C by a circulating heating system. Since the right side of Chamber II was a heat dissipating aluminum plate, an inhomogeneous temperature field was generated in the soil of Chamber II along the horizontal direction. The distribution of internal force and its variation along the pile in the inhomogeneous temperature field were obtained by recording the strain and temperature changes of the pile at different times.

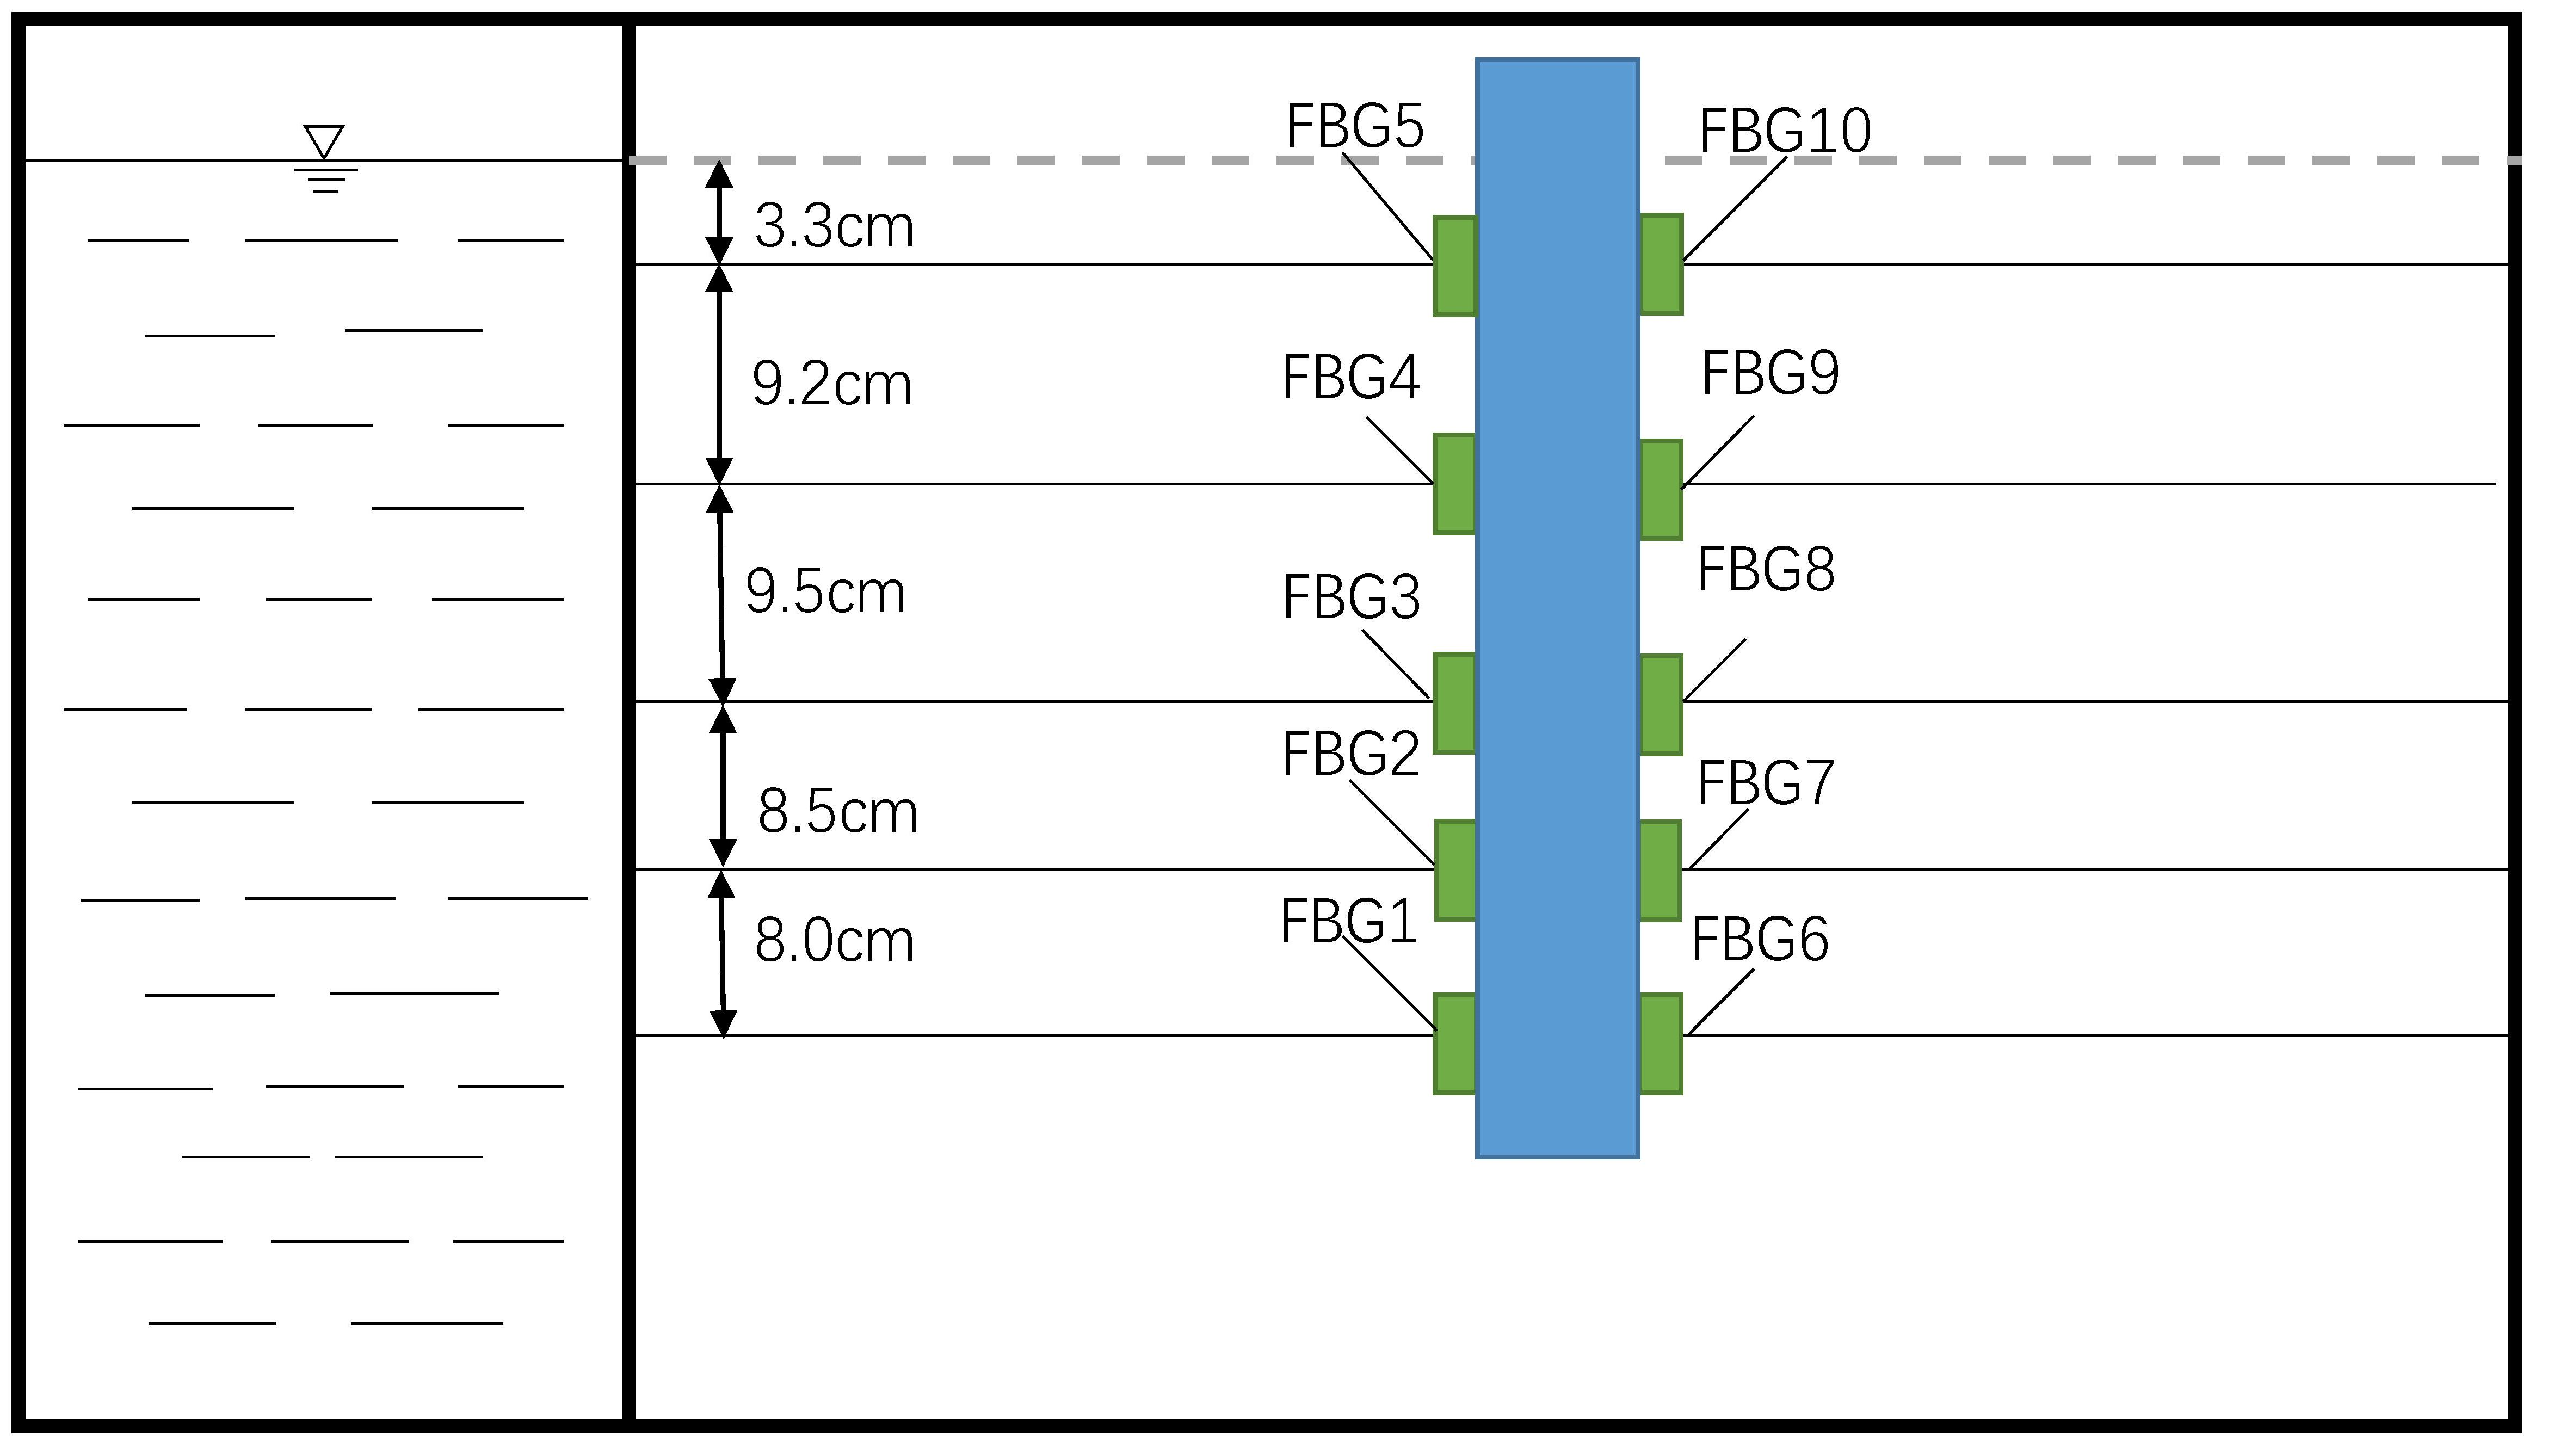
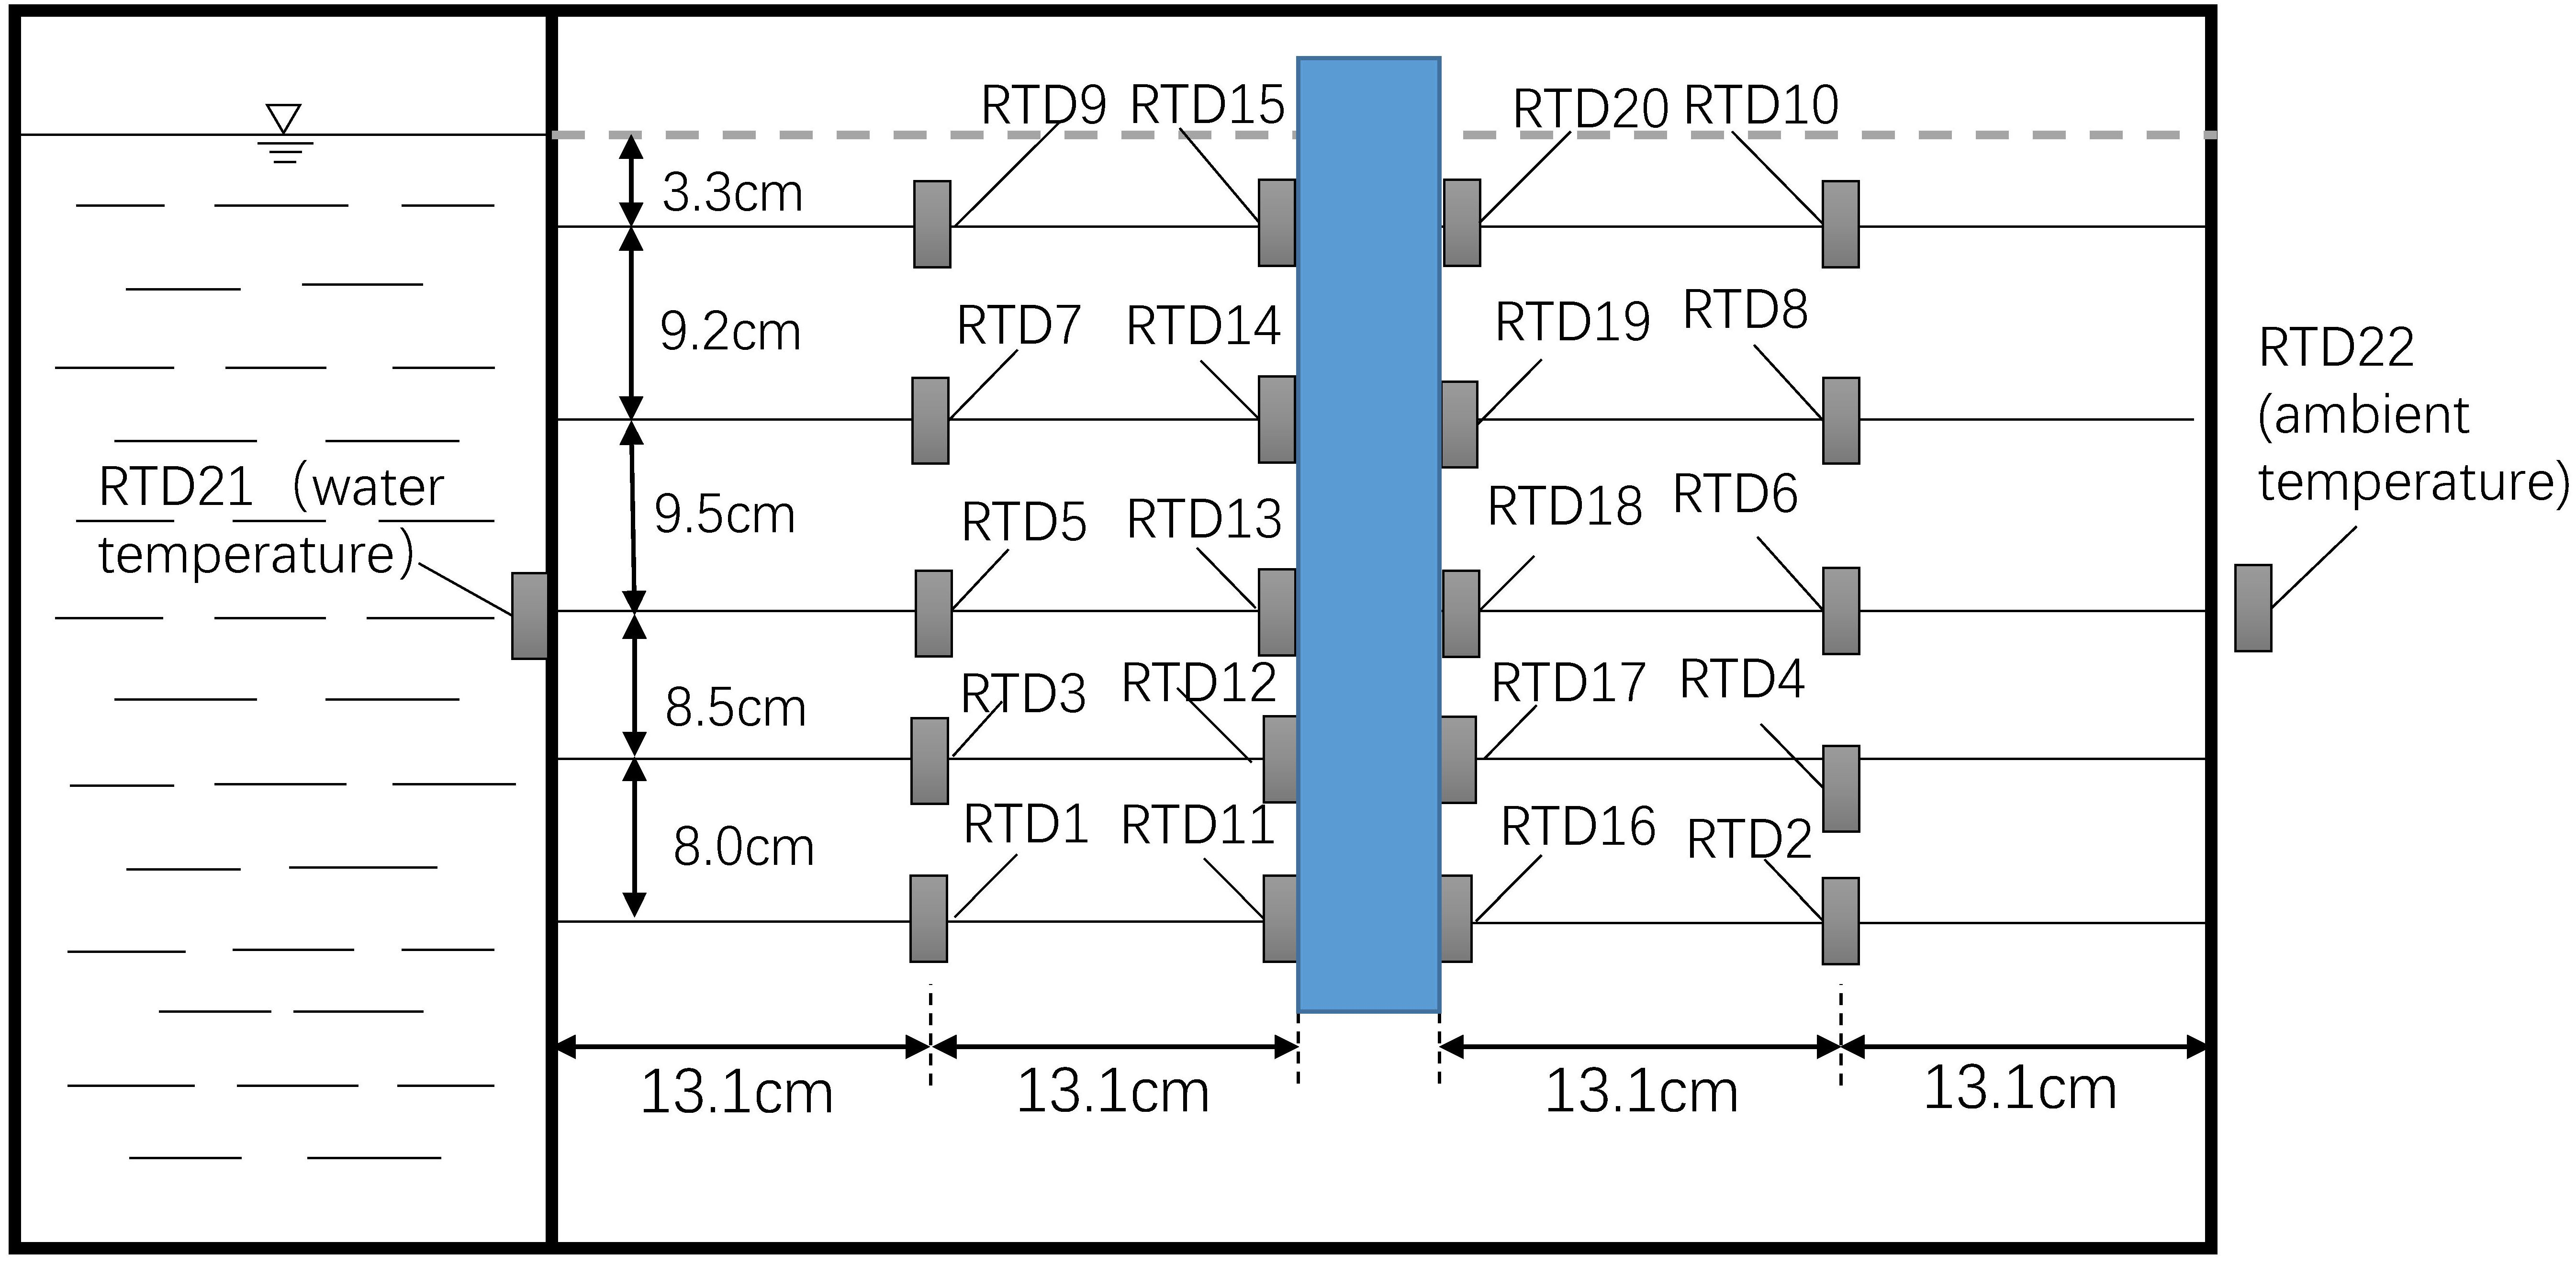
2.3. Layout of the FBG Sensors along the Pile

Five pairs of FBG sensors (FBG1–FBG10) were glued on opposite sides of the pile along the heat transfer direction. The depth of the FBGs was 3.3 cm, 12.5 cm, 22 cm, 30.5 cm, and 39 cm, respectively. The layout of the FBG sensors are shown in Figure 2. A multi-channel FBG demodulator was used to monitor of pile strain. The interval of data acquisition was 5 min.

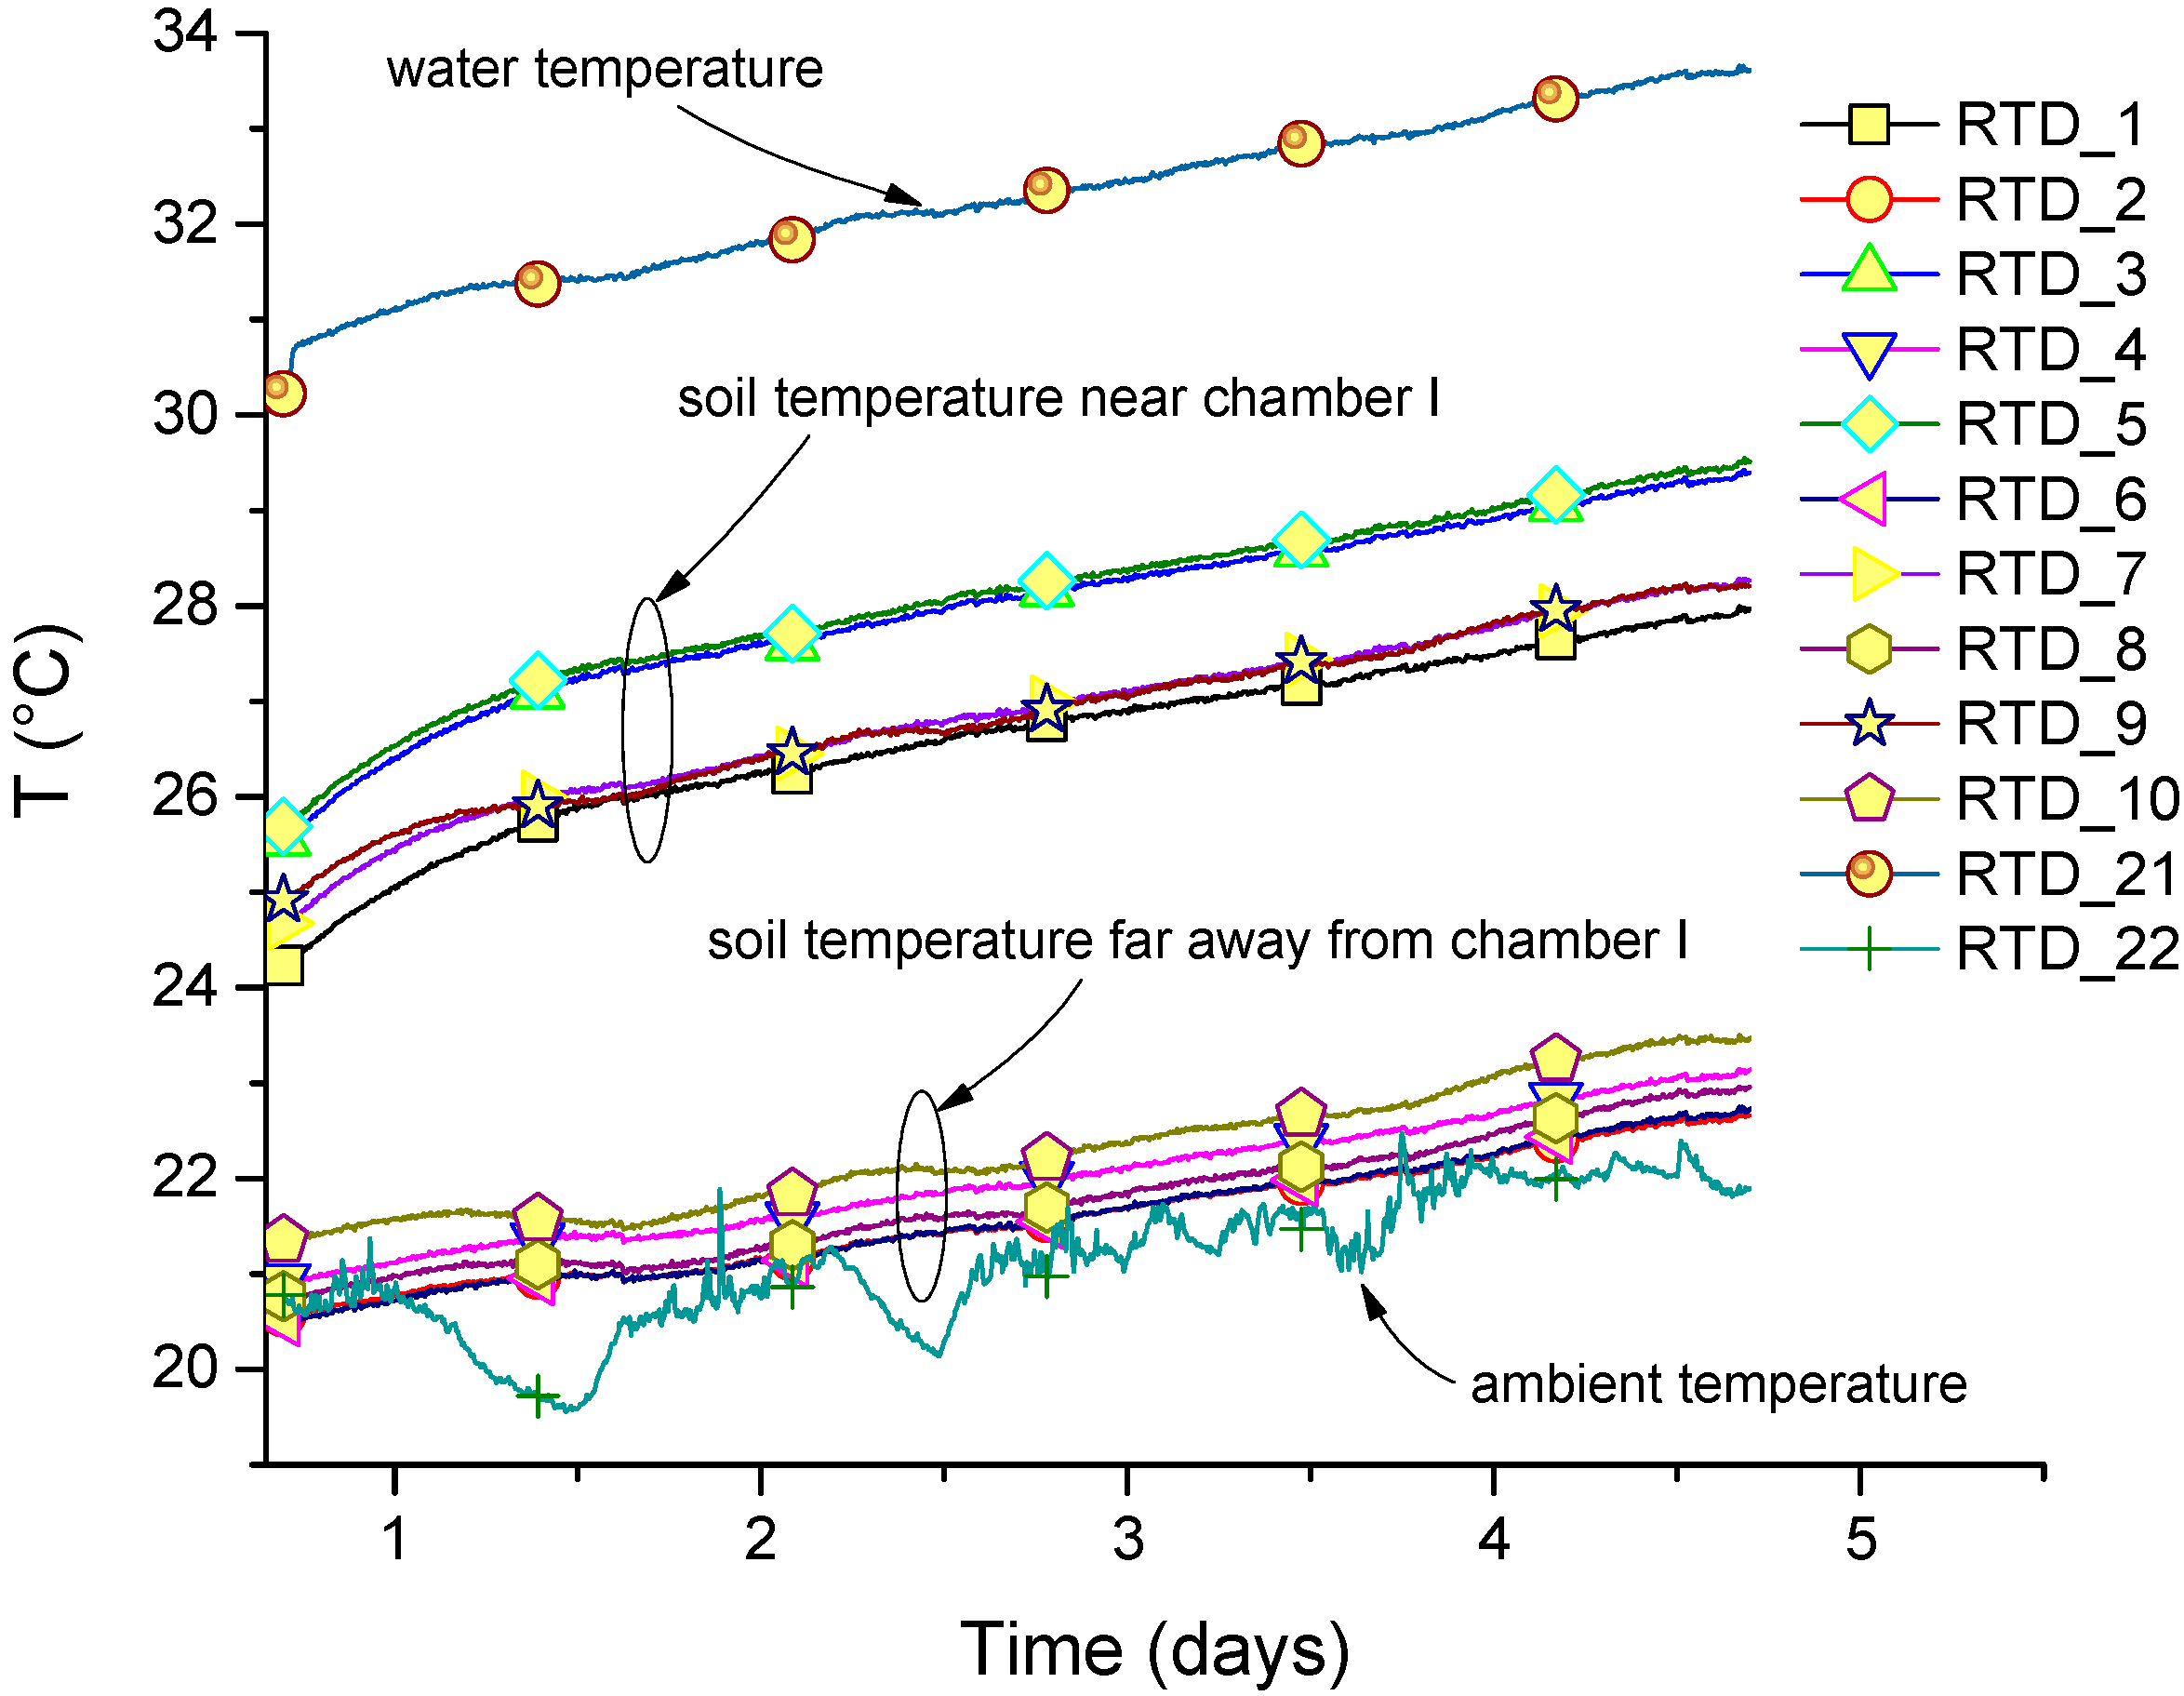
2.4. Layout of the Temperature Sensors

Ten Pt100 temperature sensors (RTD1–RTD10) were embedded in the sand along the model length, which was used to monitor the distribution of the soil temperature and their changes. Another ten temperature sensors (RTD11–RTD20) were attached to the pile surface to monitor the distribution of the pile temperature and their changes. A temperature sensor (RTD21) was installed in Chamber I to detect the temperature of the heat source. Another temperature sensor (RTD22) was used to monitor the ambient temperature. The depth of the pile temperature sensors in Cchamber II was the same as those of FBG sensors. The location of the temperature sensors is shown in Figure 3. A data logger of Datataker DT80 (Thermo Fisher Scientific Australia Pty Ltd, Scoresby, Australia) was utilized for temperature data collection.

3. Data Analysis

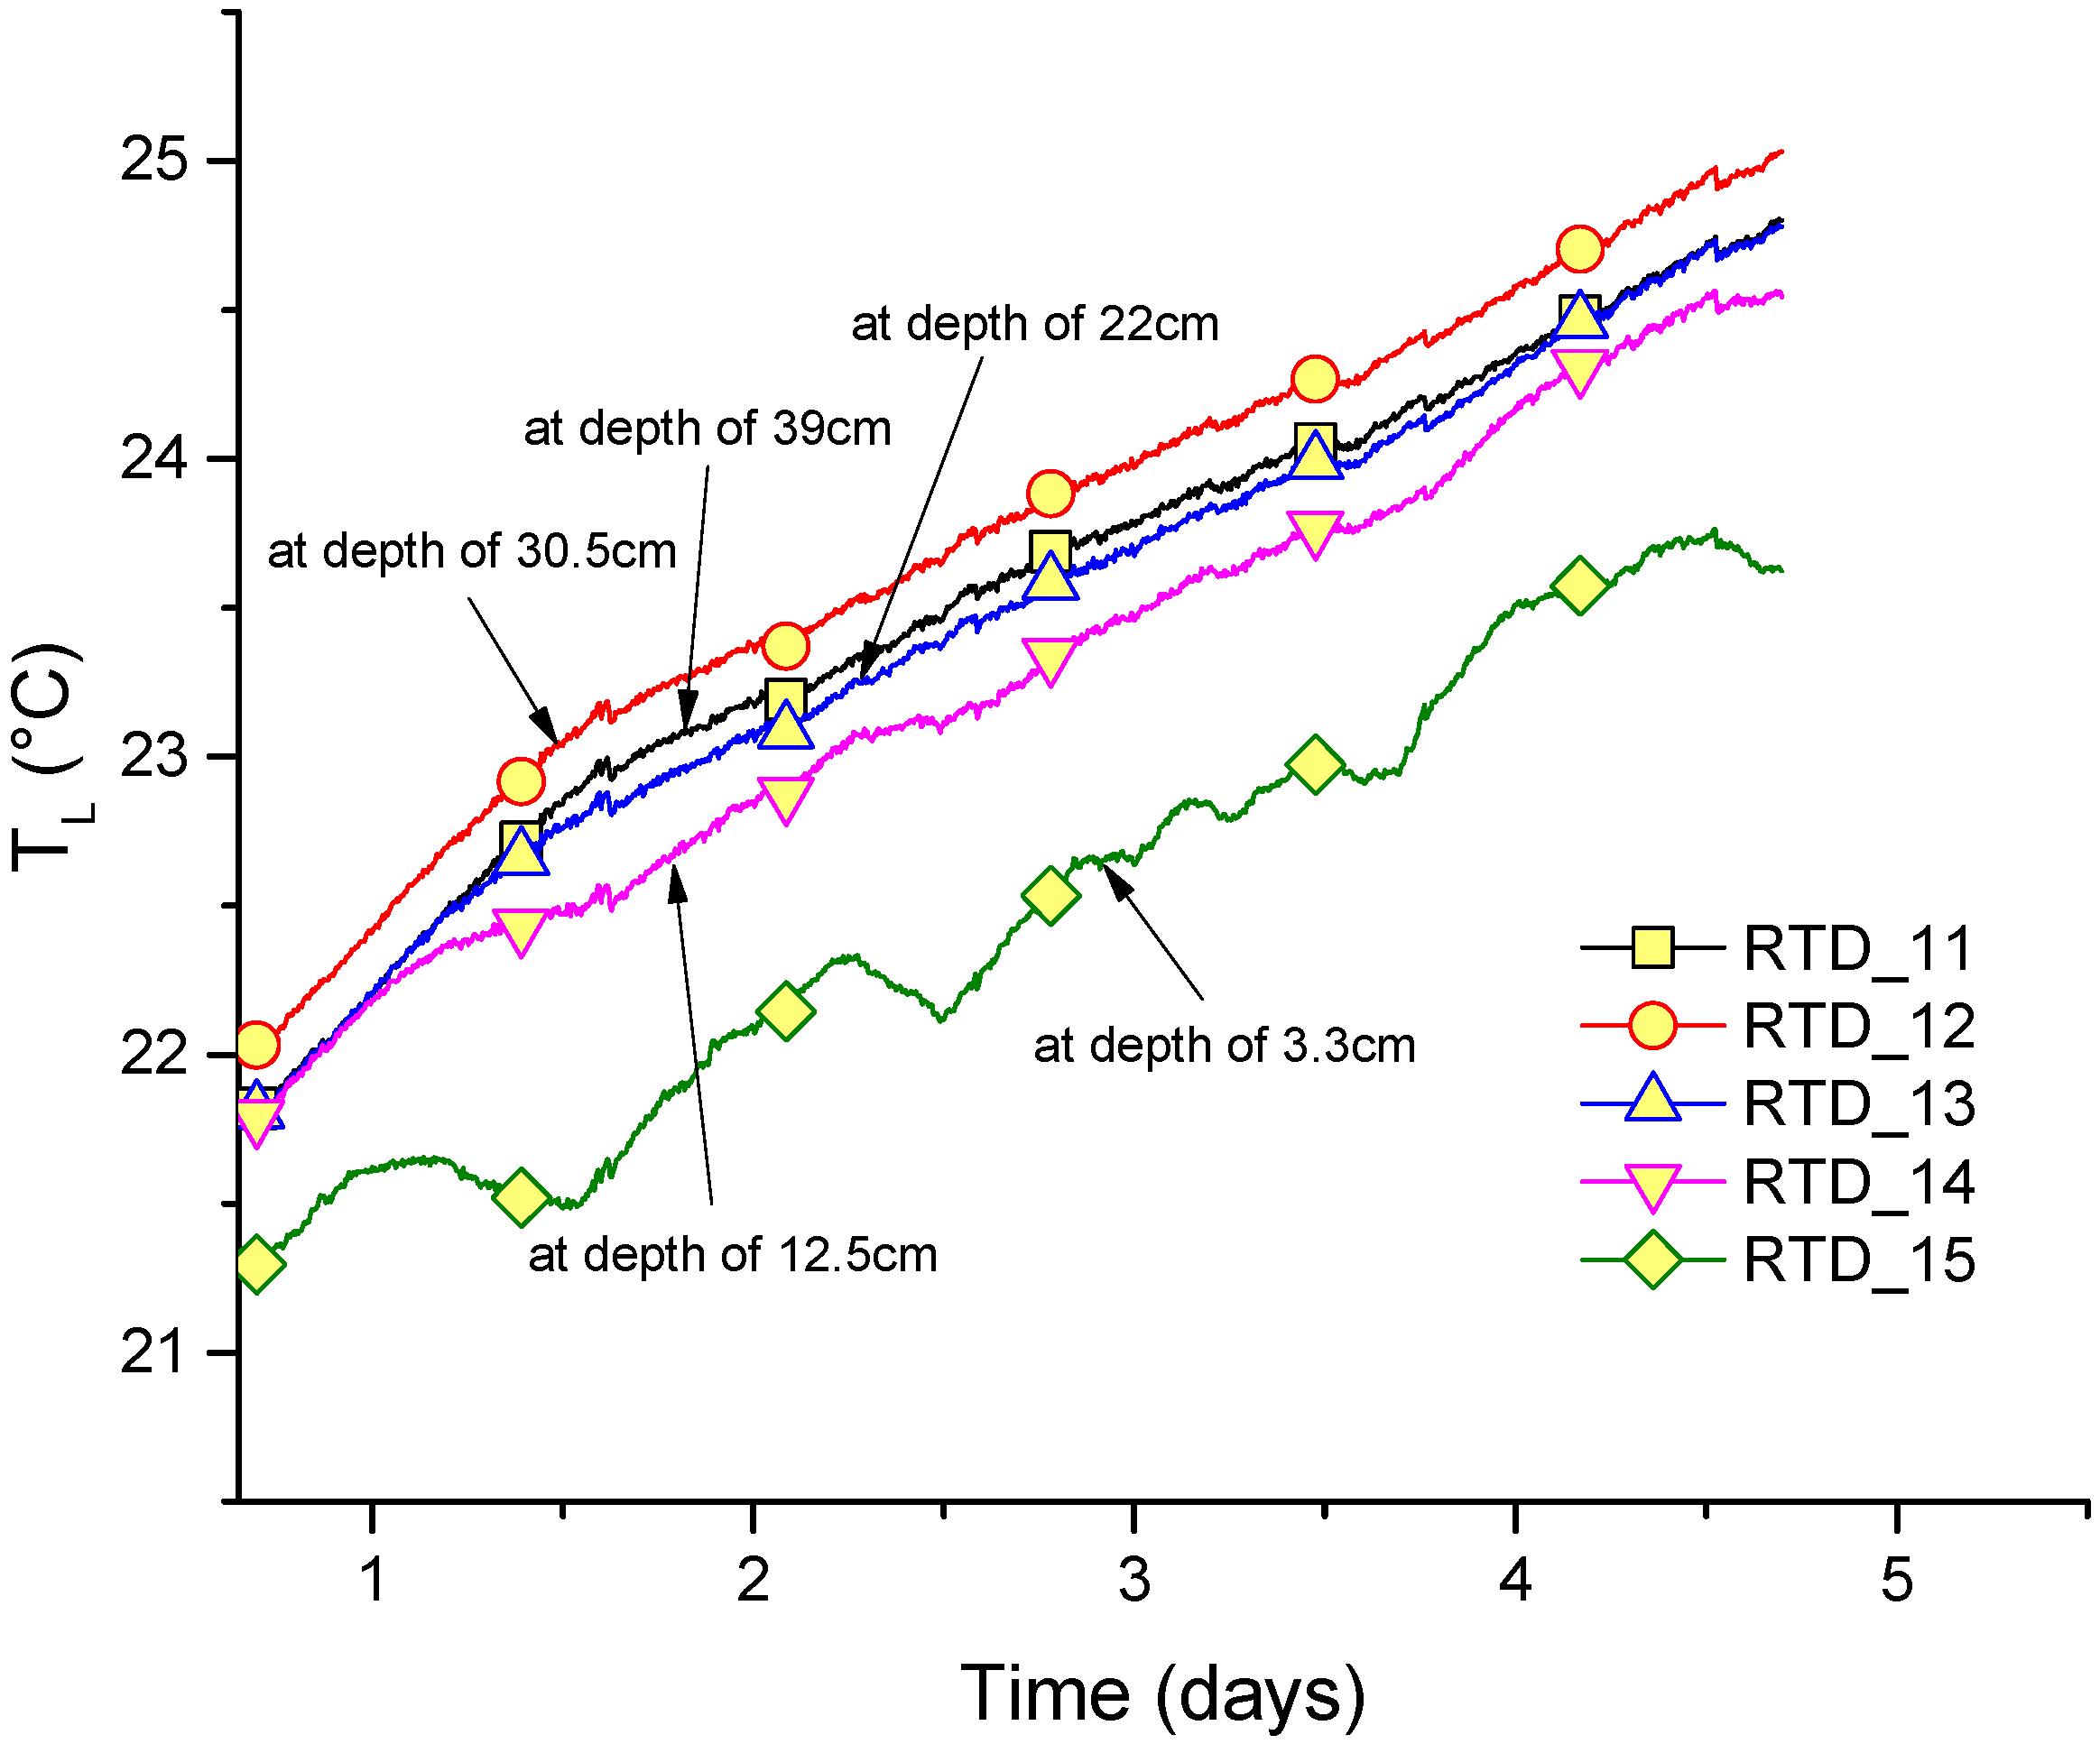
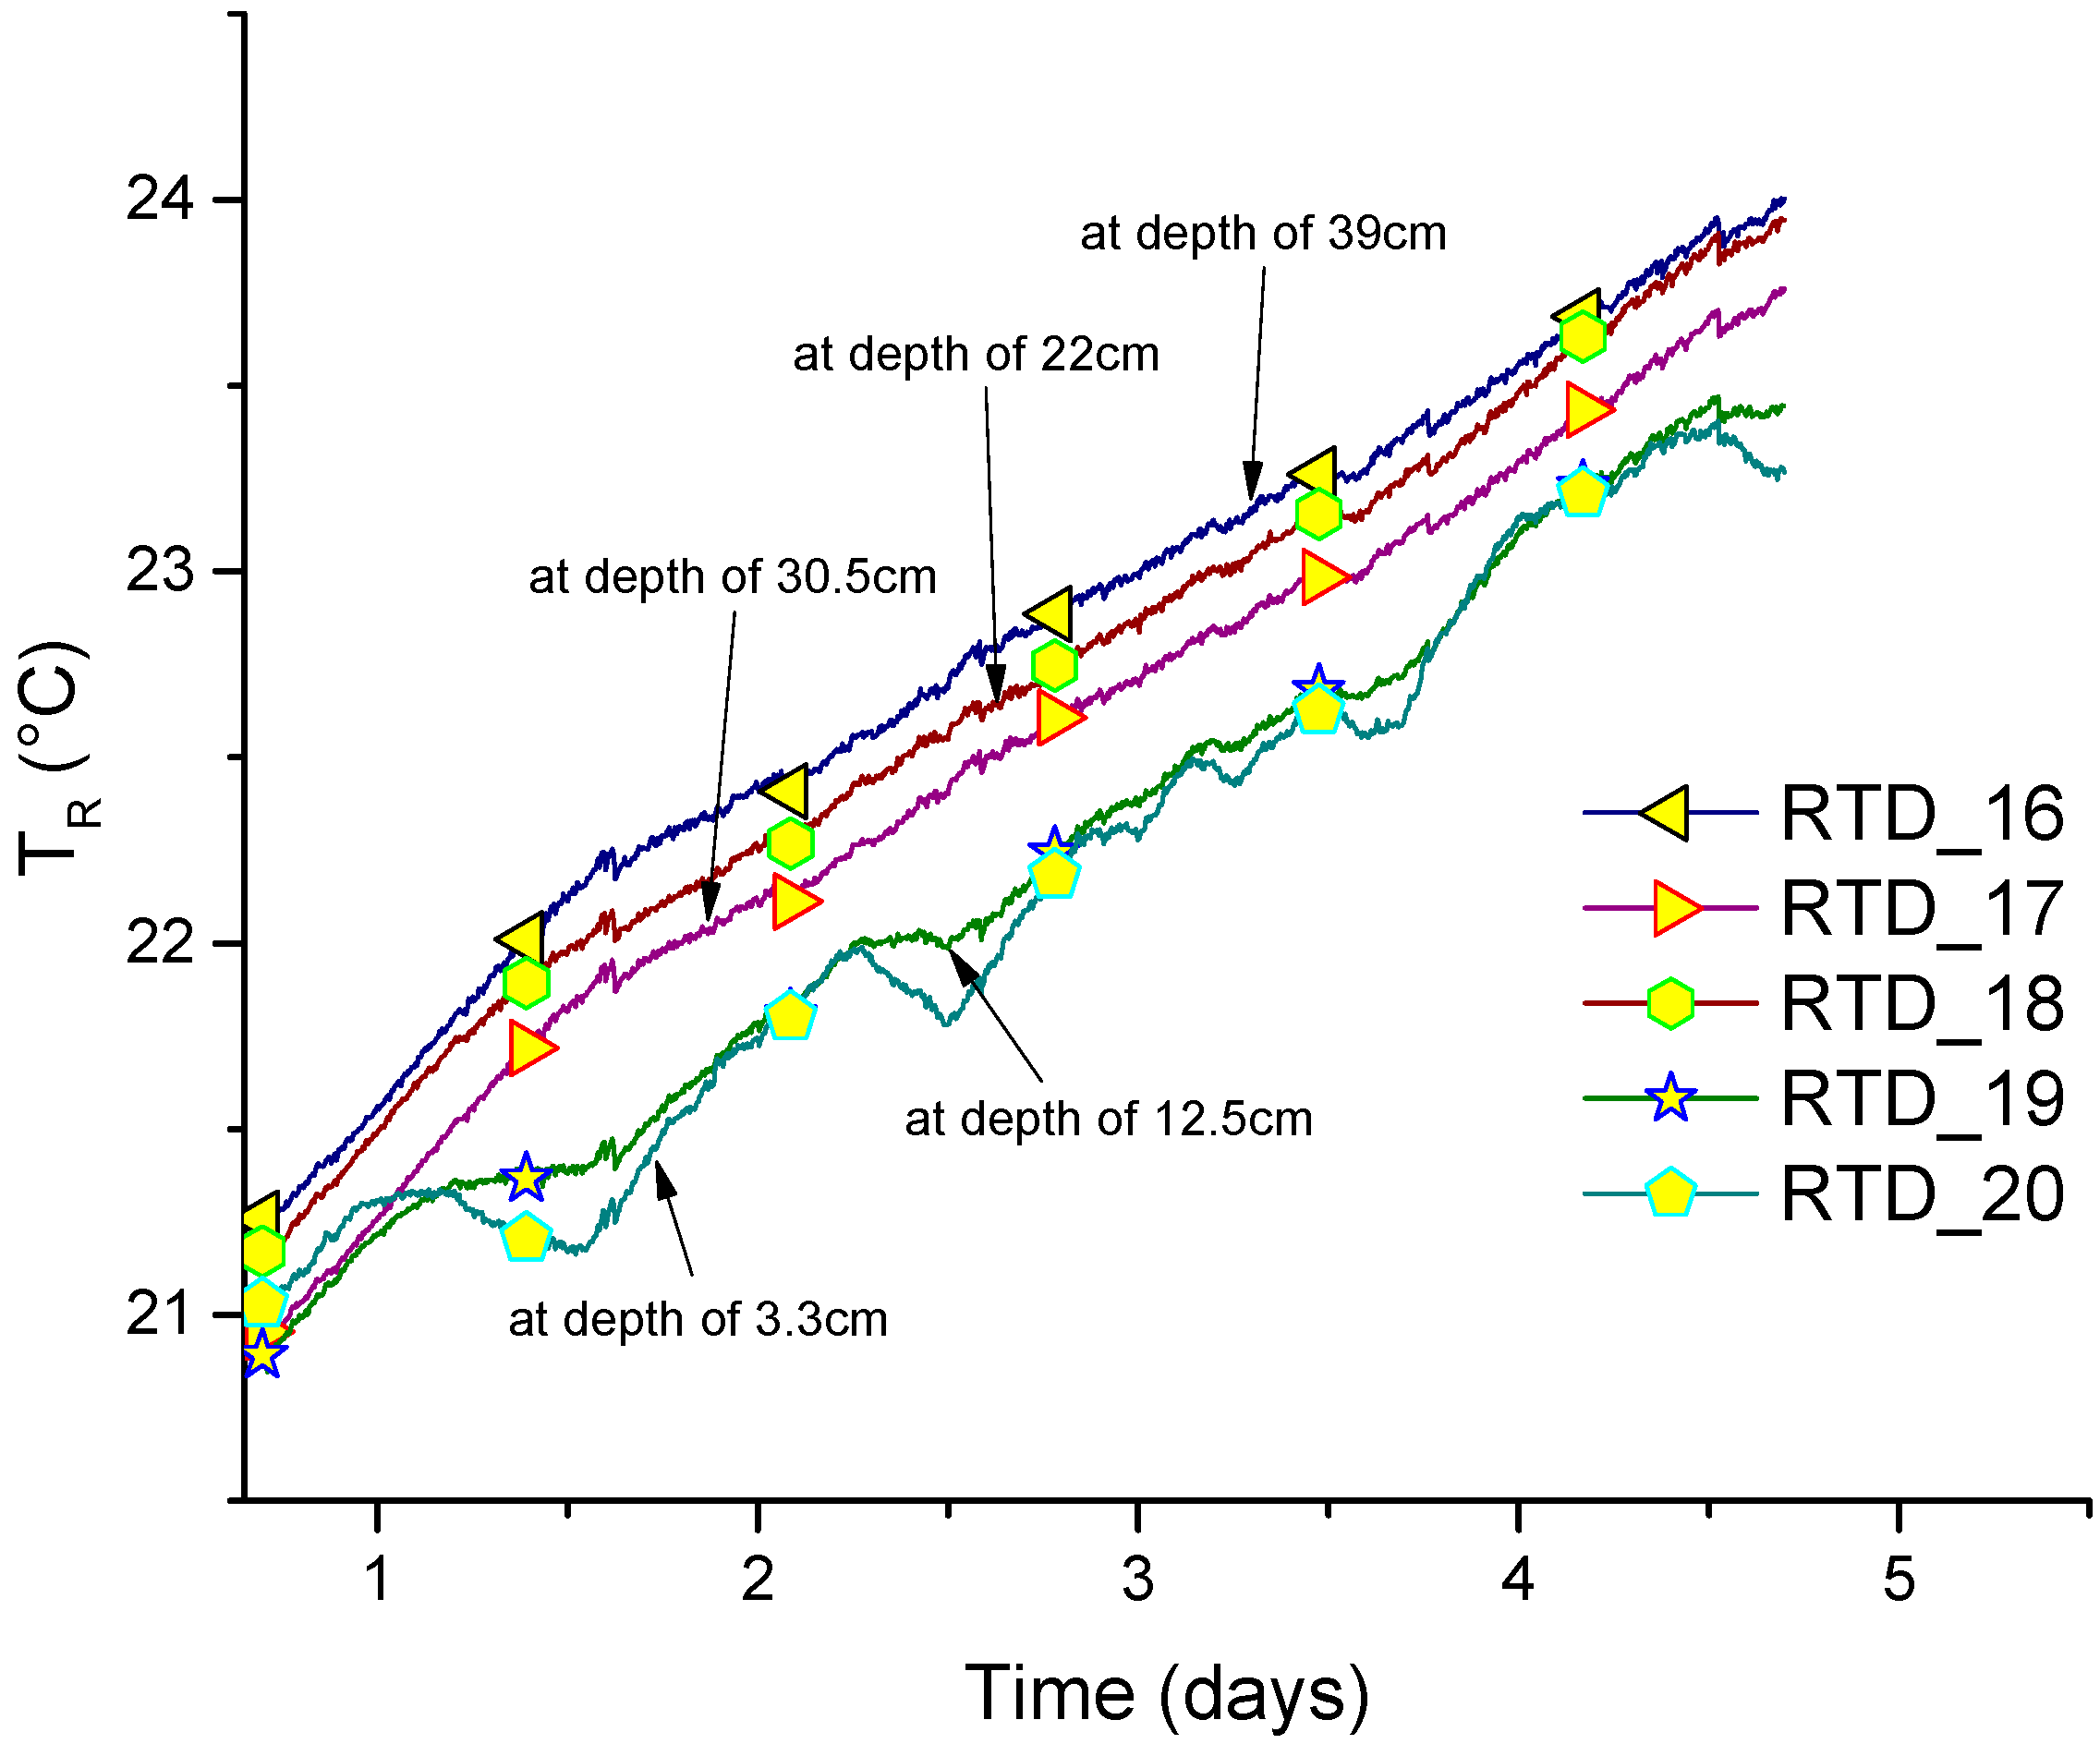
3.1. Time-Dependent Temperatures

Water temperature, ambient temperature, and soil temperature are shown in Figure 4. It can be seen that the water temperature (RTD21) increased gradually during heating. Due to the temperature difference between day and night, the ambient temperature measured by RTD22 fluctuated between 19.5 °C and 22.5 °C. The soil temperature near Chamber I increased rapidly, and the soil temperature far away from Chamber I rose slowly. Since the bottom of the model chamber was thermally insulted and the surface of the soil was exposed to the air, it can be found that there was a 1–1.5 °C variation at different depths for the temperature sensors at the same distance from Chamber I.
Figure 5 and Figure 6 are the history curves of temperature sensors on the left side of the pile (near Chamber I) and on the right side of the pile (away from Chamber I). It can be seen that the temperature gradually increased during the experiment. The temperature on the left side of the pile increased by 5 °C, maximally. The highest temperature change on the right side of the pile was up to 4 °C in 112 h. The temperature distribution on both sides of the pile were approximately the same. As RTD14, RTD15, RTD19, and RTD20 were close to the sand surface, the temperature variation was consistent with the ambient temperature to a certain extent. However, there was still an observable increase relative to the initial temperature.

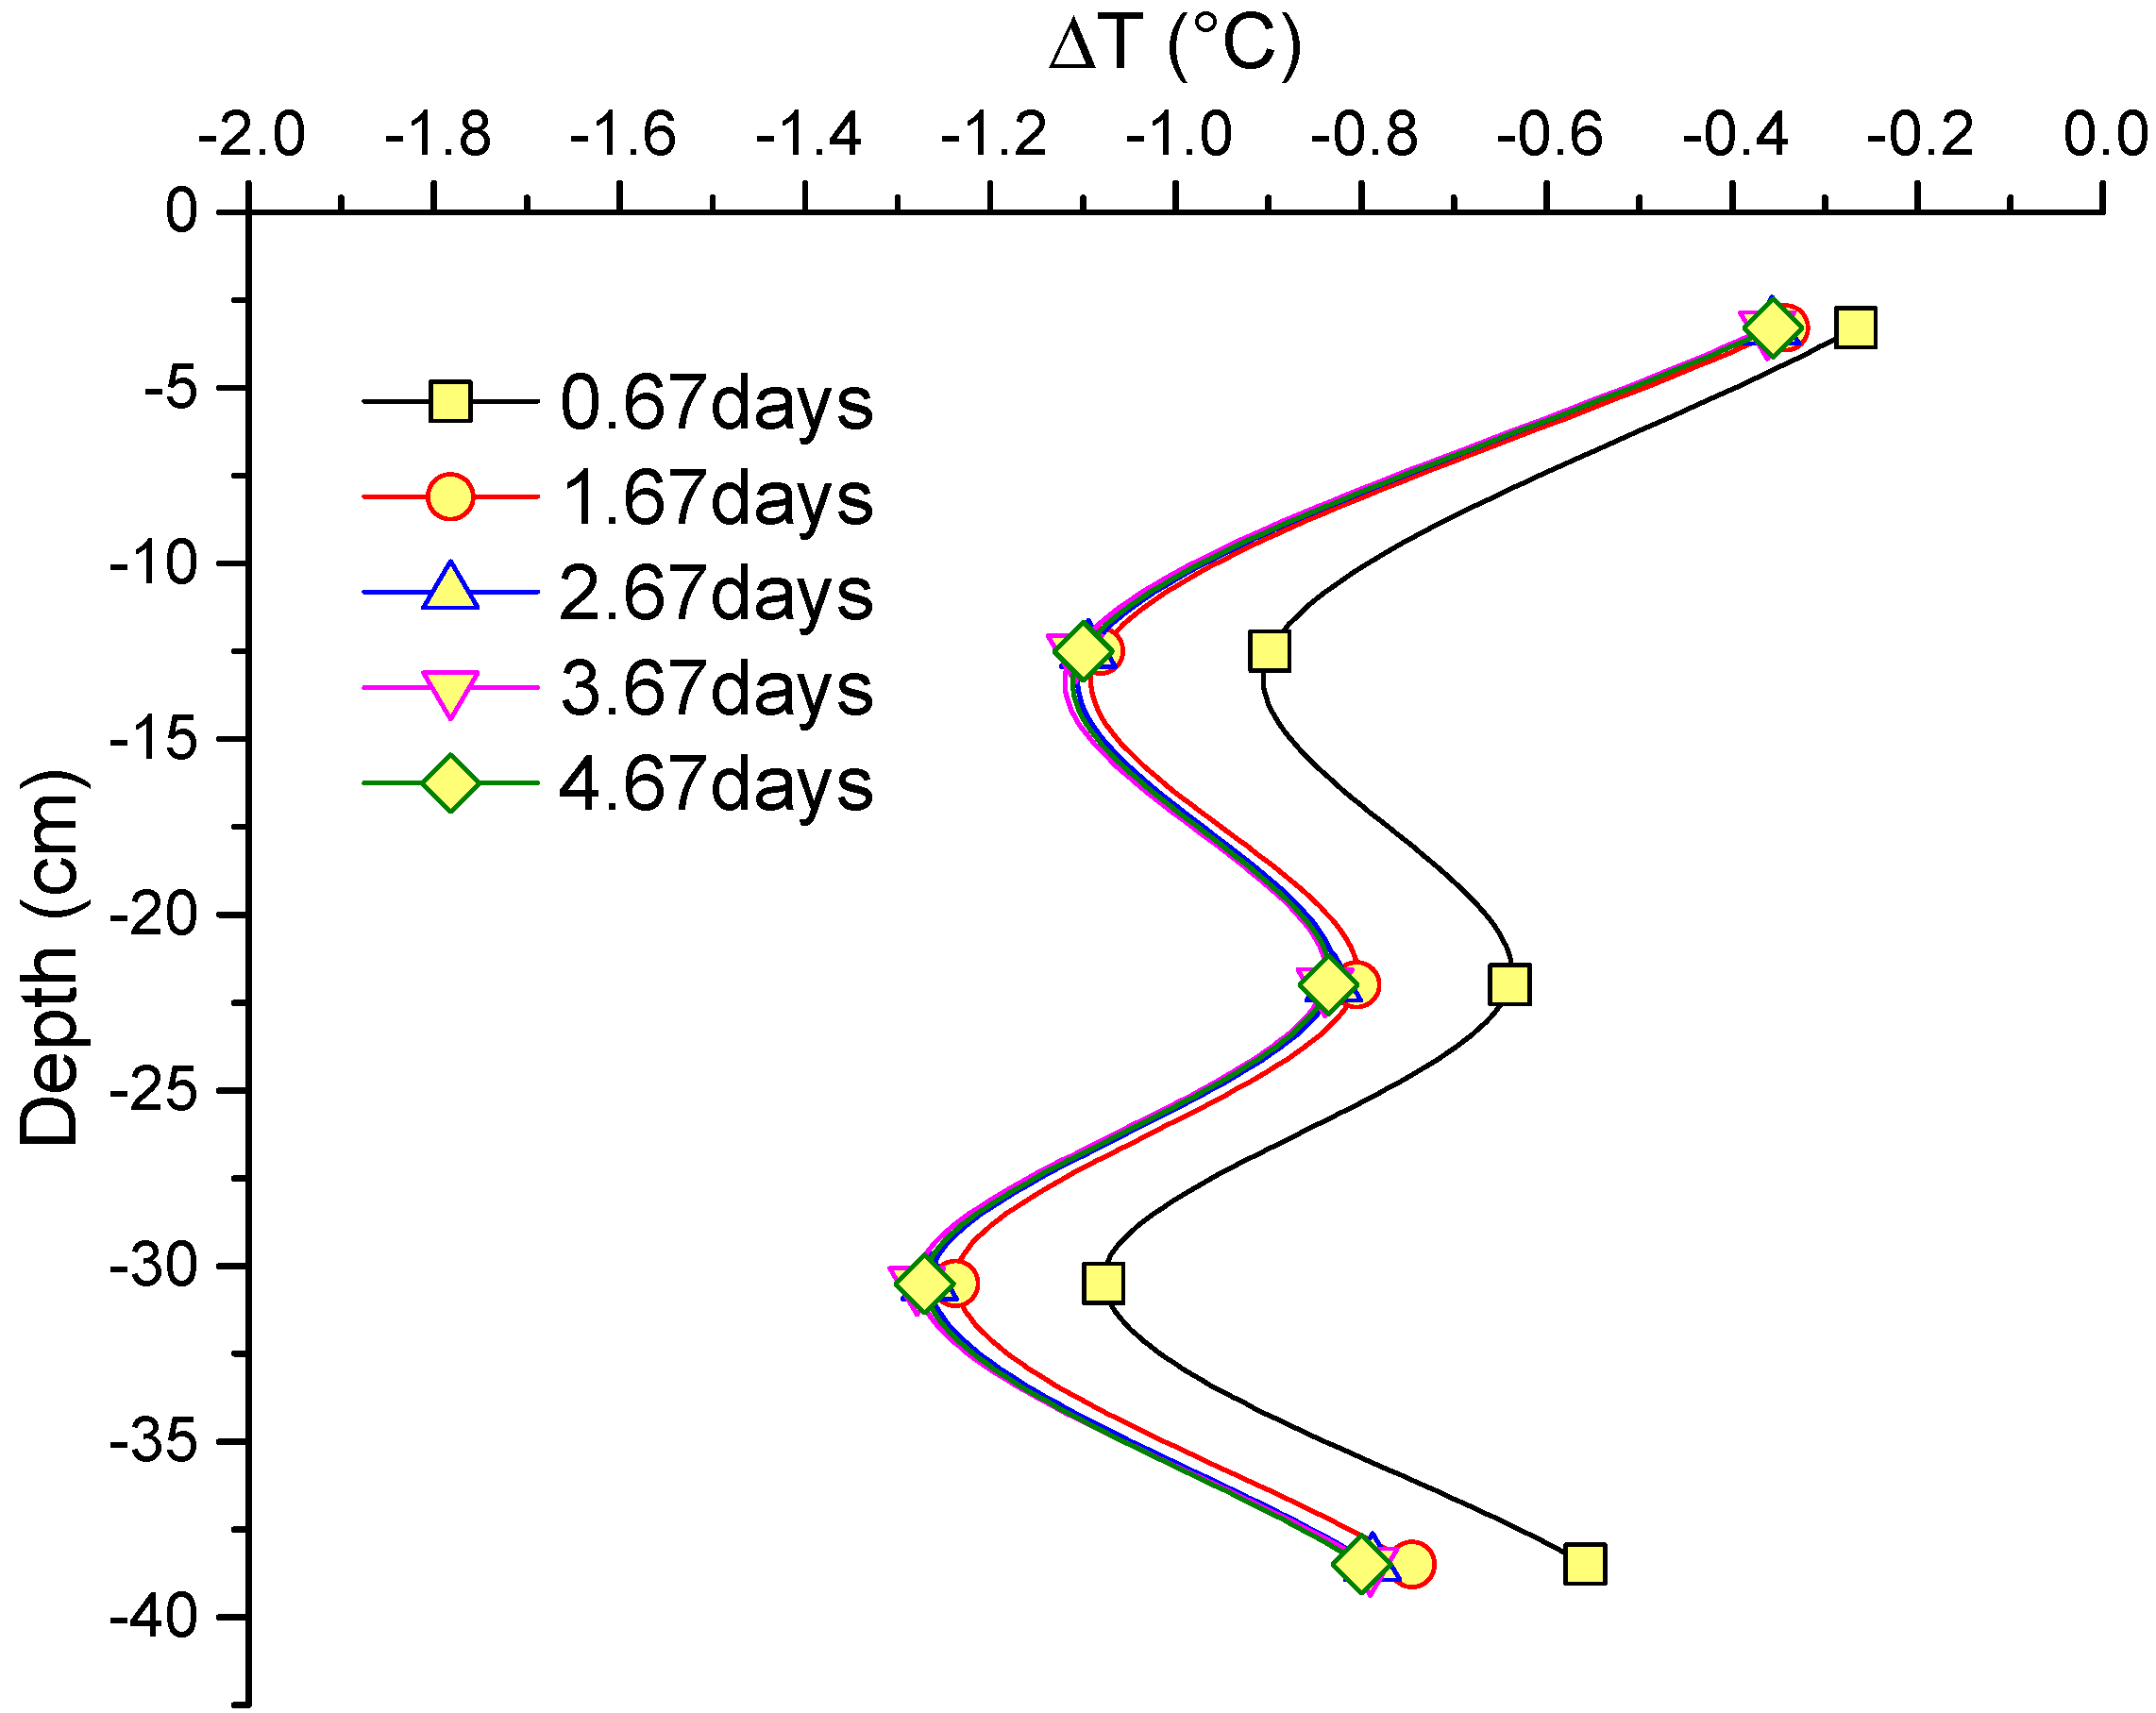
3.2. Temperature Difference between Two Opposite Sides of the Pile

According to the measured temperature of the pile, the temperature difference ∆T (°C) between two opposite sides of the pile can be obtained according to the following equation:
Δ T = T R T L
where TR (°C) is the temperature on the right side of the pile and TL (°C) is the temperature on the left side of the pile.
Figure 7 is the curve of the pile temperature difference with depth at different times. It can be seen that the temperature difference of the pile along the depth was not consistent. The temperature difference increases gradually with time, and the maximum temperature difference was about 1.3 °C in 112 h. The temperature difference of the upper part of the pile was minimum because of the influence of the ambient temperature. Meanwhile, a temperature valley can be found at the depth of 22 cm, which would be the results of the inhomogeneity of the soil, as well as the pile.

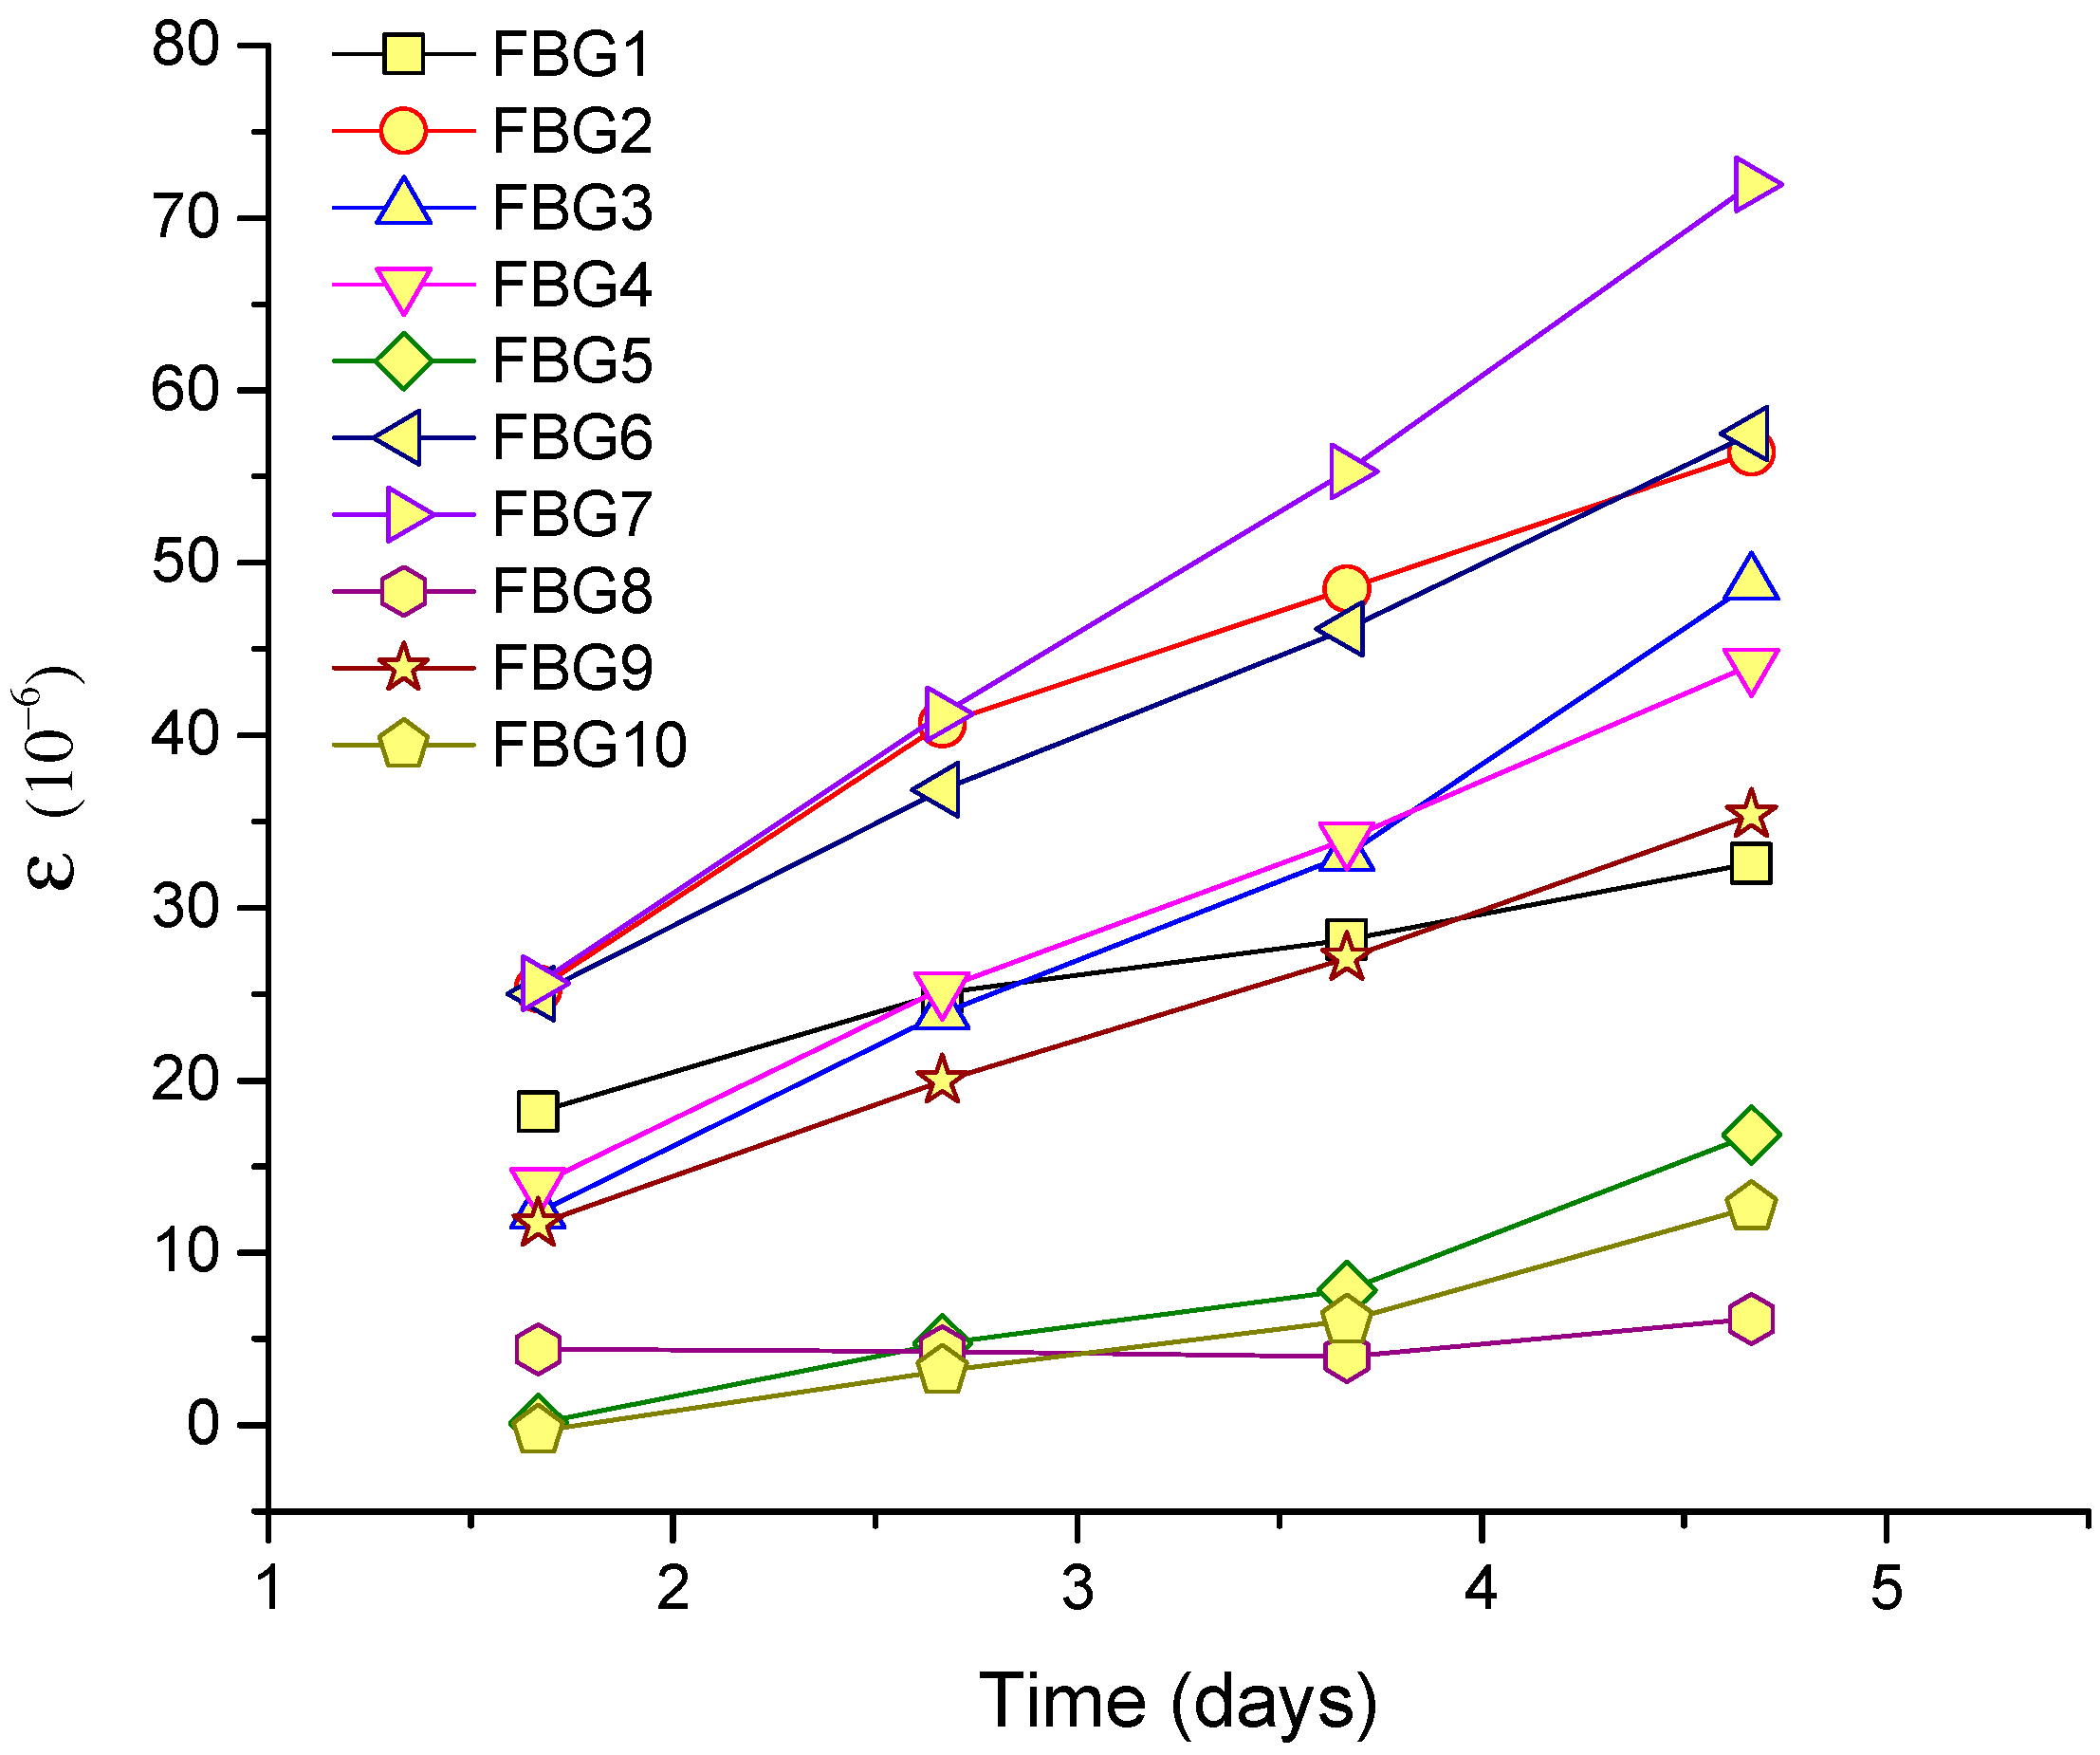
3.3. Strain Variation of the Pile

Considering the cross-sensitivity of the FBG sensors on strain and temperature, it is necessary to compensate the temperature for strain measurement according to Equation (2):
ΔλB = ∂λB/∂ε × δε + ∂λB/∂T × δT
where ΔλB, ∂λB/∂ε, ∂λB/∂T, δε, and δT are the shift of the wavelength of the FBGs (nm), the strain coefficient (nm/με), the temperature coefficient (nm/°C), the strain variation (με), and the temperature variation (°C), respectively. The strain coefficient and temperature coefficient can be obtained by calibration.
The variation of strain on two sides of the pile after temperature compensation is shown in Figure 8. The maximum strain reached 70 με due to the temperature-caused expansion of the concrete.

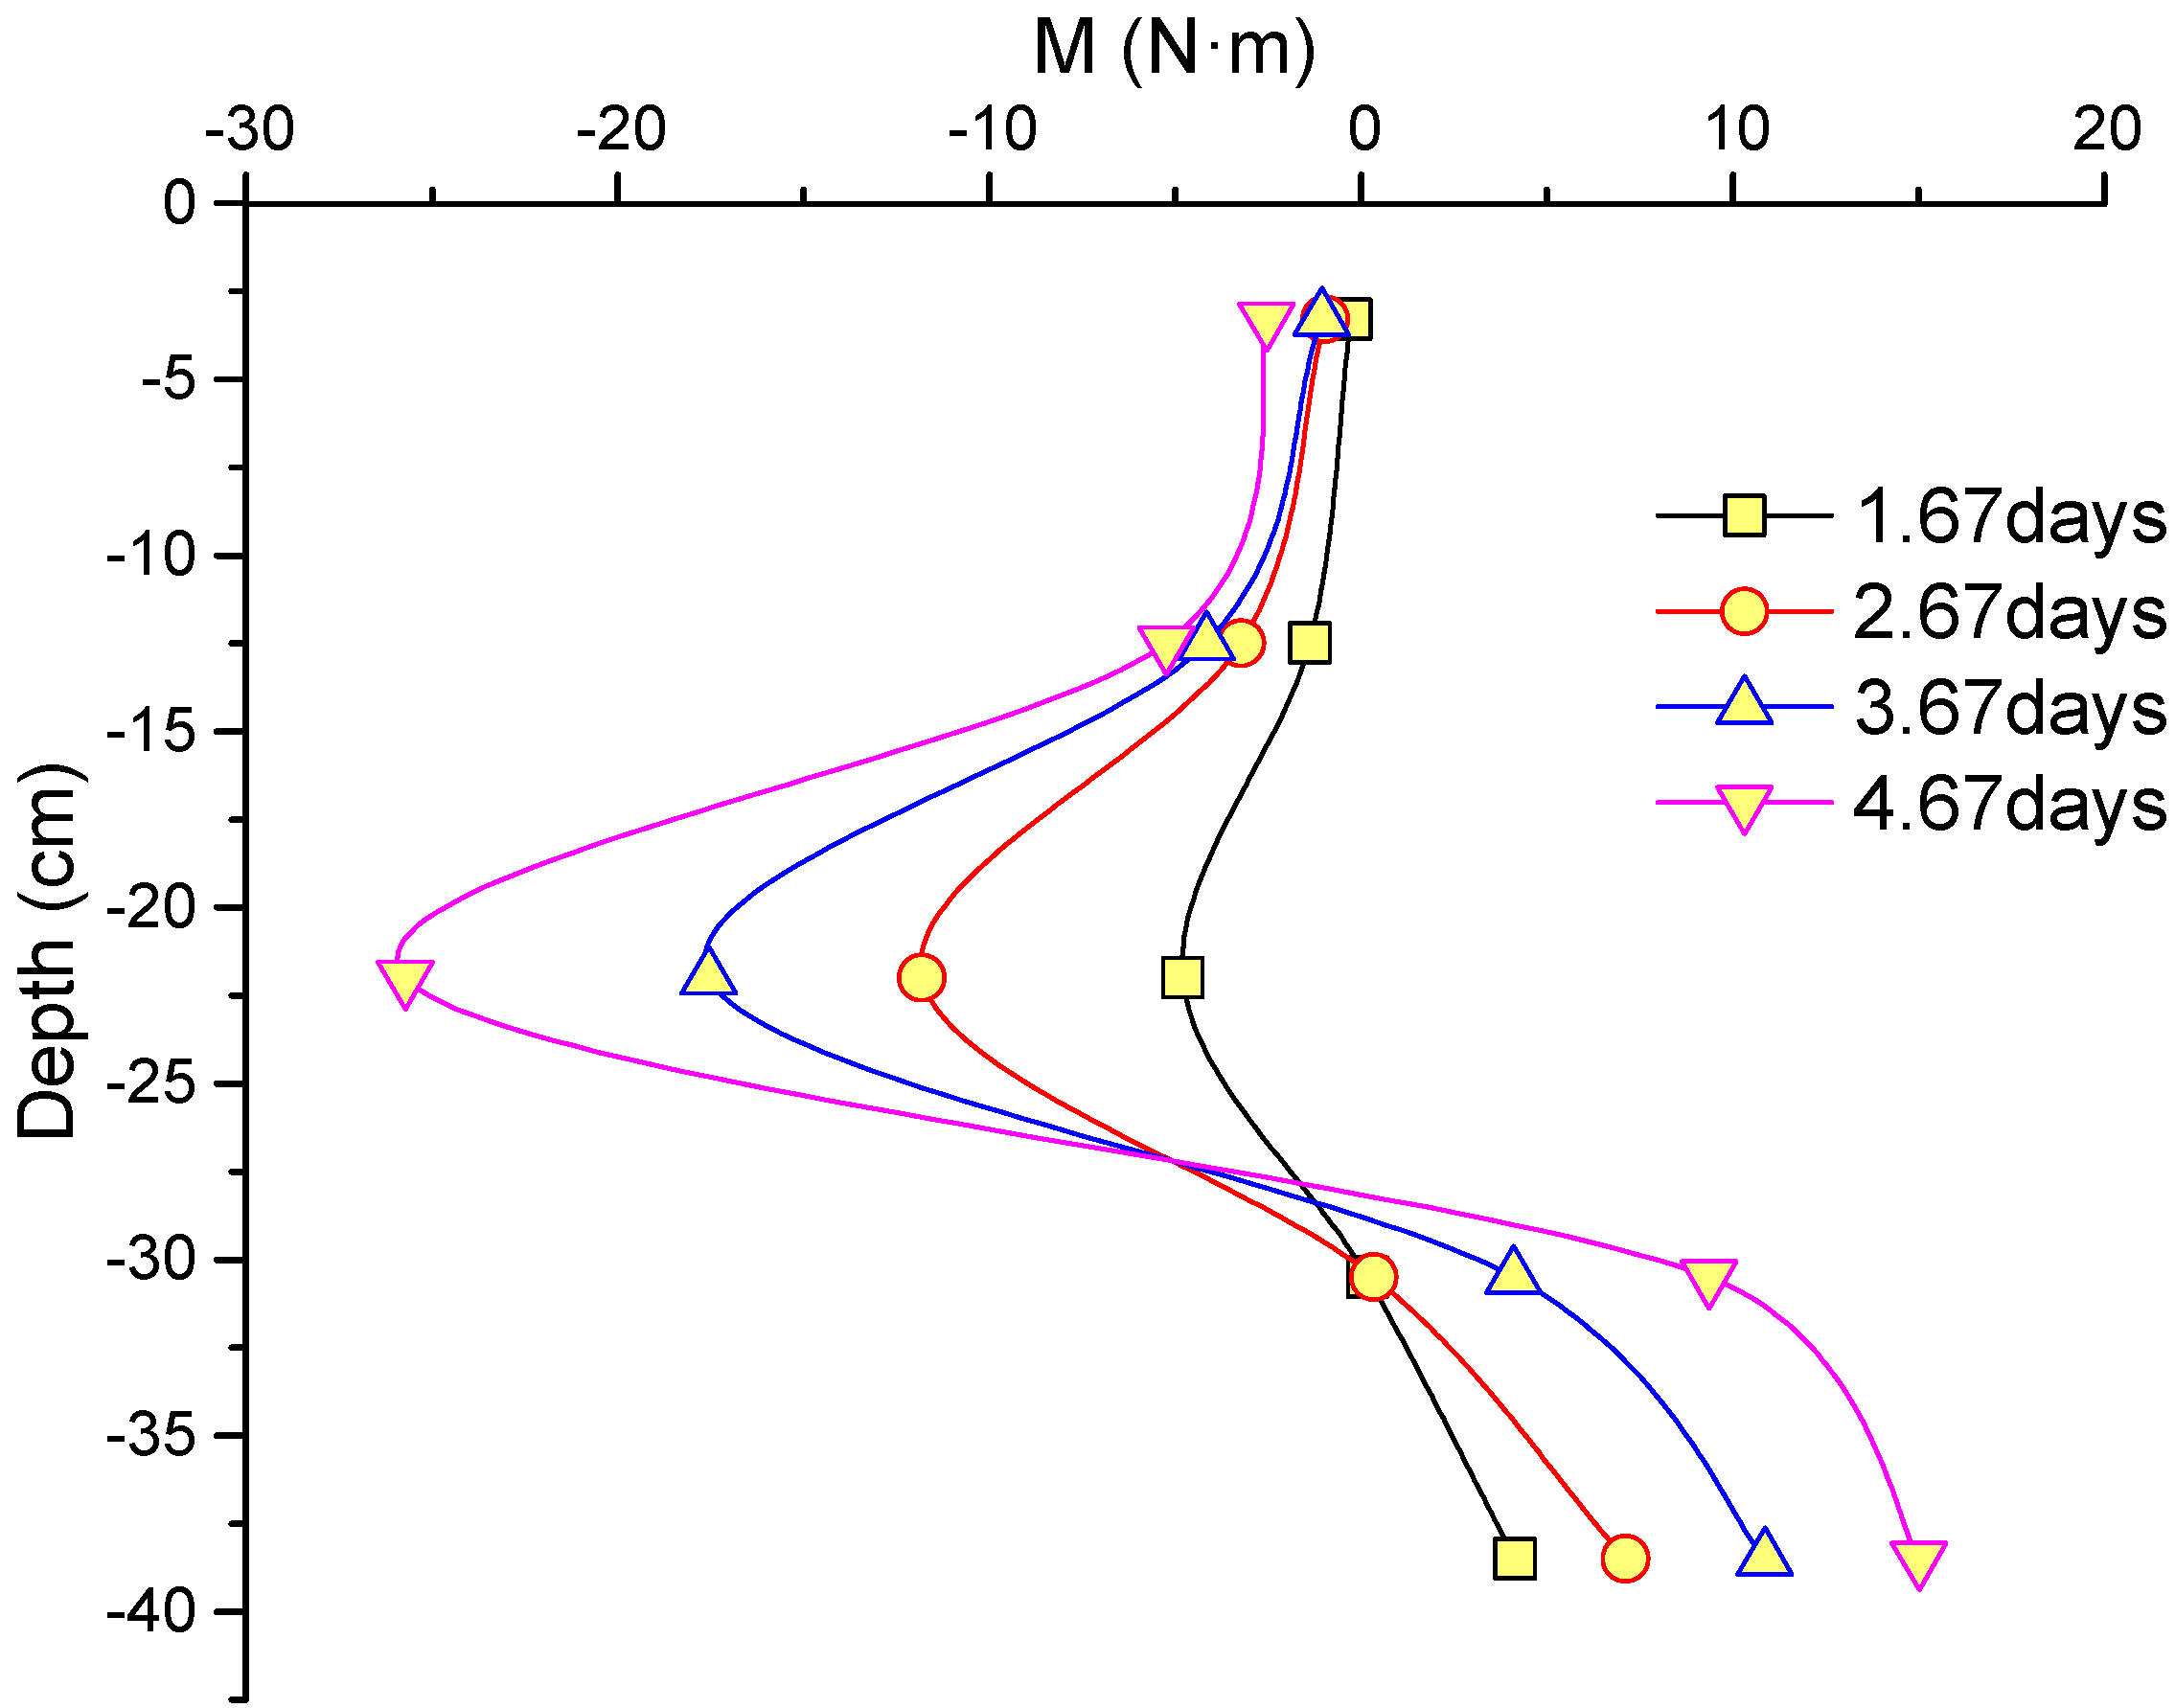
4. Bending Moment along the Pile Caused by Temperature Difference

The bending strain of the cross-section can be calculated by:
Δε = εL − εR
where εL and εR are the strain after temperature compensation on left and right sides of the pile, respectively.
The bending moment of the corresponding section M (N·m) can be calculated according to Equation (4):
M = E c I Δ ε b 0
where b0, I, and Ec are the diameter of the pile (m), the moment of inertia about the neutral axis (m4), and the elastic modulus of the concrete pile material (N/m2).
The bending moment along the pile at different times can be obtained by Equation (4), as shown in Figure 9. It can be seen that pile shows bending internal forces in an inhomogeneous temperature field. The bending moment of pile body increased with time and was different at different depths. The maximum bending moments were −25.7 N·m and +15.0 N·m, which can be observed in the middle and bottom of the pile, respectively. The internal forces increased with the temperature difference between the two opposite sides of the pile. It should be noted that the soil deformation in both horizontal and vertical directions was different because of the inhomogeneous temperature distribution in the soil. The pile cannot move freely due to the thermal expansion. There was a complicated interaction between the pile and the soil, which will result in the inconsistency between the pile temperature distribution and the bending strain distribution. Similar results were reported in the research on the thermal strains over the pile cross-section [9]. It can be concluded that the internal force along the pile is not uniform in the uneven temperature field.

5. Conclusions

It can be concluded that the bending moment occurs along the pile in the inhomogeneous temperature field. The distribution of the bending moment along the pile caused by the temperature is correlated with the distribution of the temperature difference. The bending moment of the pile in the experiment was between −25.7 N·m and +15.0 N·m. For the actual pile foundation, its diameter is far greater than that of model pile. It is estimated that the bending moment would be up to ±(10³–104) N·m. For the energy pile, the temperature distribution in the same cross section of pile is uneven also, which results in internal forces as well. Abdelaziz investigated the non-uniform thermal strains and stress by numerical simulation [9]. Moreover, when the energy pile or ground source heat pump is operating in the cold and hot cycles, the geothermal field will undergo significant heating and cooling, and the magnitude and direction of the bending moment of the pile also changes periodically. Therefore, the pile is not only affected by the surrounding soil, but also by the upper load and the end of the pile. The influence of inhomogeneous temperature field on the internal force of the pile and its long-term effects should be considered carefully in the development and utilization of shallow geothermal energy.

Acknowledgments

The authors acknowledge the supports of the National Natural Science Foundation of China (no. 41572271) and the Natural Science Foundation of Jiangsu Province (no. BK20161239).

Author Contributions

Dan Zhang conceived and designed the experiments; Yian Wang and Jian Cheng performed the experiments; Dan Zhang and Yian Wang analyzed the data. Dan Zhang wrote the paper with partial contribution of other authors.

Conflicts of Interest

The authors declare no conflict of interest.

References

  1. Rees, S.J. Advances in Ground-Source Heat Pump Systems; Woodhead Publishing: Duxford, UK, 2016. [Google Scholar]
  2. Brandl, H. Thermo-active ground-source structures for heating and cooling. Procedia Eng. 2013, 57, 9–18. [Google Scholar] [CrossRef]
  3. Bourne-Webb, P.; Burlon, S.; Javed, S.; Kürten, S.; Loveridge, F. Analysis and design methods for energy geostructures. Renew. Sustain. Energy Rev. 2016, 65, 402–419. [Google Scholar] [CrossRef]
  4. Kramer, C.A.; Ghasemi-Fare, O.; Basu, P. Laboratory thermal performance tests on a model heat exchanger pile in sand. Geotech. Geol. Eng. 2015, 33, 253–271. [Google Scholar] [CrossRef]
  5. Jalaluddin, A.M.; Tsubaki, K.; Inoue, S.; Yoshida, K. Experimental study of several types of ground heat exchanger using a steel pile foundation. Renew. Energy 2011, 36, 764–771. [Google Scholar] [CrossRef]
  6. Eskilson, P.; Claesson, J. Simulation model for thermally interacting heat extraction boreholes. Numer. Heat Transf. 1988, 13, 149–165. [Google Scholar] [CrossRef]
  7. Ghasemi-Fare, O.; Basu, P. A practical heat transfer model for geothermal piles. Energy Build. 2013, 66, 470–479. [Google Scholar] [CrossRef]
  8. Ozudogru, T.Y.; Olgun, C.G.; Senol, A. 3D numerical modeling of vertical geothermal heat exchangers. Geothermics 2014, 51, 312–324. [Google Scholar] [CrossRef]
  9. Abdelaziz, S.; Ozudogru, T.Y. Non-uniform thermal strains and stresses in energy piles. Environ. Geotech. 2016, 3, 237–252. [Google Scholar] [CrossRef]
  10. Hetnarski, R.B.; Eslami, M.R. Thermal Stresses—Advanced Theory and Applications; Springer: Dordrecht, The Netherlands, 2008. [Google Scholar]
  11. Laloui, L.; Nuth, M.; Vulliet, L. Experimental and numerical investigations of the behaviour of a heat exchanger pile. Int. J. Numer. Anal. Methods Geomech. 2006, 30, 763–781. [Google Scholar] [CrossRef]
  12. Brandl, H. Energy foundations and other thermo-active ground structures. Geotechnique 2006, 56, 81–122. [Google Scholar] [CrossRef]
  13. Ouyang, Y.; Soga, K.; Leung, Y.F. Numerical back-analysis of energy pile test at Lambeth College, London. Geo-Front. Congr. 2014, 211, 440–449. [Google Scholar]
  14. Gui, S.Q.; Cheng, X.H. In-Situ tests on structural responses of energy piles during heat exchanging process. Chin. J. Geotech. Eng. 2014, 36, 1087–1094. [Google Scholar]
  15. Sutman, M.; Olgun, C.; Brettmann, T. Full-Scale Field Testing of Energy Piles. In Proceedings of the International Foundations Congress and Equipment Expo 2015, San Antonio, TX, USA, 17–21 March 2015; Geotechnical Special Publication. ASCE: Reston, VA, USA, 2015; pp. 1638–1647. [Google Scholar]
  16. Lu, H.W.; Jiang, G.; Wang, H. In-Situ tests and thermo-mechanical bearing characteristics of friction geothermal energy piles. Chin. J. Geotech. Eng. 2017, 39, 334–342. [Google Scholar]
  17. Park, S.; Lee, S.; Lee, H.; Pham, K.; Choi, H. Effect of borehole material on analytical solutions of the heat transfer model of ground heat exchangers considering groundwater flow. Energies 2016, 9, 318. [Google Scholar] [CrossRef]
  18. Poloso, T. Fibre Bragg gratings optical sensing technology. Smart Mater. Bull. 2001, 2001, 7–10. [Google Scholar] [CrossRef]
Figure 1. Schematic diagram of the test equipment.
Energies 11 00018 g001
Figure 2. Layout of the fiber Bragg grating (FBG) sensors along the pile.
Energies 11 00018 g002
Figure 3. Layout of temperature sensors.
Energies 11 00018 g003
Figure 4. Time-history of soil, water, and ambient temperatures.
Energies 11 00018 g004
Figure 5. Time-history of the temperature on the left side of the pile.
Energies 11 00018 g005
Figure 6. Time-history of the temperature on the right side of the pile.
Energies 11 00018 g006
Figure 7. Distribution of the temperature difference along the pile at different times.
Energies 11 00018 g007
Figure 8. Time-history of pile strain after temperature compensation.
Energies 11 00018 g008
Figure 9. Distribution of the bending moment along the pile at different times.
Energies 11 00018 g009
Table 1. Physical and thermal parameters of the sand.
TypeMaximum Dry Density/(g·cm−3)Minimum Dry Density/(g·cm−3)Particle Size/mmThermal Conductivity/(W·m−1·K−1)Specific Heat Capacity/(J·kg−1·K−1)
Fine sand1.711.390.01–2.000.511100

