Article

Olive Mill Wastewater: From a Pollutant to Green Fuels, Agricultural Water Source and Bio-Fertilizer—Part 1. The Drying Kinetics

1
Institut de Sciences des Matériaux de Mulhouse, UMR 7661 CNRS, 15 rue Jean Starcky, 68057 Mulhouse, France
2
Faculty of Pure and Applied Sciences, Environmental Conservation and Management, Lab of Chemical Engineering and Engineering Sustainability, Cyprus Open University, Giannou Kranidioti 33, 2252 Latsia, Nicosia, Cyprus
*
Author to whom correspondence should be addressed.
Energies 2017, 10(9), 1423; https://doi.org/10.3390/en10091423
Submission received: 14 July 2017 / Revised: 11 September 2017 / Accepted: 14 September 2017 / Published: 16 September 2017

Abstract

:
Olive Mill Wastewater (OMWW) treatment is considered to be one of the main challenges that Mediterranean countries face. Although several procedures and technologies are mentioned in the literature, these techniques have several disadvantages or have been limited to laboratory pilot validation without posterior industrial projection. Recently, an advanced environmental friendly strategy for the recovery of OMWW was established involving the impregnation of OMWW on dry biomasses, drying of these impregnated samples, and finally green fuels and biochar production. This established strategy revealed that the drying step is crucial for the success of the entire recovery process. Hence, two impregnated samples were prepared through OMWW impregnation on sawdust (IS) and olive mill solid waste (ISW). The drying kinetics of OMWW and impregnated samples (IS and ISW) were examined in a convective dryer (air velocity range from 0.7–1.3 m/s and the temperature from 40–60 °C). The experimental results indicated that the drying of the impregnated samples occurred twice as fast as for the OMWW sample. Such behavior was attributed to the remaining thin layer of oil on the OMWW surface Furthermore, the Henderson and Pabis model showed the suitable fit of the drying curves with a determination coefficient R2 above 0.97. The drying rates were extracted from the mathematical models and the drying process was analyzed. The coefficient of effective diffusivity varied between 2.8 and 11.7 × 10⁻¹⁰ m2/s. In addition, the activation energy values ranged between 28.7 and 44.9 kJ/mol. These values were in the same range as those obtained during the drying of other agrifood byproducts. The final results could be very helpful to engineers aiming to improve and optimize the OMWW drying process.

1. Introduction

Olive oil production is considered as one of the oldest agricultural industries in the Mediterranean countries. It is estimated that some 1.8 × 10⁶ t of olive oil are produced annually worldwide, where 98% of this total quantity is extracted in the Mediterranean basin [1,2,3,4] with Spain, Italy, Greece being the three leading countries. The process of oil extraction generates large seasonal and centralized quantities of olive byproducts which needs significant attention. In particular, its dark colour, high organic content and toxicity due to the presence of phenolic compounds may cause significant environmental issues [3,4,5,6,7,8]. Chemical Oxidation Demand (COD) values of OMWW may reach 150 g/L while suspended solids could reach up to 190 g/L [3,4,5,6,7].
Nowadays, there three kinds of oil extraction systems are used around the world, namely: the pressure process (olive presses), 2-phases decanter separation and 3-phases decanter separation. Two-phase systems are fully implemented in Spain and in Cyprus, while Greece, Tunisia, and Italy still use both systems, but mainly 3-phase ones [3,4]. Two phase systems generatesa paste-like waste called “alperujo” or “2-phase pomace”. Two phase systems have a low polluting charge since they consume 15 kg water per 100 kg olive processed [6]. The 3-phase system generates two main residues: a solid residue named olive mill solid waste (OMSW) and a liquid effluent named olive mill wastewater (OMWW). The average amount of olive mill wastewater (OMWW) produced during the milling process is 1.2–1.8 m3/t of olives, thus generating over 30 million m3 of OMWW per year and in the Mediterranean region [1,2,3,4,6].
OMSW is considered a green energy source and has a special interest as a source of biofuels for energy production via combustion processes [5]. However, due to the fact that OMWW presents several negative environmental impacts [1], specific management aiming to minimize, valorize and reduce even more those impacts are needed. Several methods are applied such as land spreading and composting [3,4,9,10] as well as chemical, electrochemical oxidation and anaerobic treatment [11,12]. However, land spreading may cause groundwater contamination and bad odor. Currently, larger quantities of OMWW are generally discharged to natural aerated basins which take too long time to dry [9]. Indeed, as result of sun heating and airflow, a crust rapidly covers the exchange surface and reduces consequently the drying kinetics slowing down the drying step (Figure 1). Figure 1 shows two photographs of the OMWW sample used in this study before drying (Figure 1a) and the same sample after two hours of drying (Figure 1b). In particular, before storage in natural basins, OMWW is a homogeneous brown liquid as indicated in Figure 1a while after 2 hours of drying, a black thick and hard crust with a plastic consistency covering the liquid is present (Figure 1b).
Thermal treatment seems to be a promising technique due to the energy content of the OMWW [13]. Recently, a combined strategy for the treatment of OMWW has been developed [5,14]. This strategy includes the impregnation of the OMWW on low cost biomass such as sawdust or OMSW and the production of green pellets. The combustion of these green pellets in domestic boilers has demonstrated good efficiencies (>80%), higher than the values required by the European Standards [5]. However, some limitations were observed such as the increase in ash content and particulate emissions due to the high content of K, Cl and Na in OMWW.
Therefore, there is a need to adopt the same environmental friendly strategy for the recovery of OMWW and to replace the combustion step by a second thermochemical process such as pyrolysis [15,16], which has the advantage of producing solid, liquid and gaseous products that could be recovered in different manners [15,16]. The gaseous products have a high caloric value and could be used as fuel in the pyrolysis process. The liquid products are also useful as a biofuel and could be added to petroleum refinery feedstocks [15,16]. Finally, the solid product, named char, is rich in mineral contents and can be used as a biofertilizer [17]. However, the pyrolysis of the impregnated OMWW should be preceded by a drying step. In fact, higher moisture contents decrease the pyrolysis efficiency as well as the pyrolysis product quality. In addition, the drying step could be useful for the recovery of water which can be also used for irrigation. Therefore, the success of the whole environmental recovery strategy demands a study of the drying of impregnated samples for the process optimization.
Drying of agricultural and agrifood byproducts has been studied in the literature. Among the different methods of drying, natural drying [18], convective drying [19] and solar drying [20] are conventionally used. Natural drying has the lowest installation cost, but requires a high storage volume. Convective drying reduces considerably the drying times and storage volume, but requires expensive installations and high electric energy costs. Solar convective drying is considered as the most efficient technology but it is also the most expensive. The selection of the suitable technology depends on several factors, including the product categories, the available surface and the weather conditions.
Several studies [21,22,23,24,25,26,27,28] have examined the drying of olive mill wastes using different drying systems. The drying process is generally a complex phenomenon where convection and diffusion phenomena participate. Such complexity is due to the heterogeneity of the products like particles formed from pits and pulp of different size, vegetation water, the presences of sugars as well as variations in air velocity and temperature. Convective dryers are generally the most applied technique for the drying of olive mill wastes [21,22]. Doymaz et al. have examined the drying of olive cake by cabinet air drying at a constant air velocity of 1.2 m/s for different sample thicknesses and temperatures ranging between 80 and 110 °C [21]. Celma et al. [22] and Montero et al. [23] have studied the solar drying of the OMSW generated by the two-phase extraction system. Both studies compared different heat transfer configurations, including solar energy (coupled with heat from electrical resistances), natural convection and forced convection. In addition, Celma et al. [22] have examined the effect of several parameters such as temperature (20–80 °C), air velocity (1–7 m/s) and bed thickness (6–40 mm). Liebanes et al. [24] have tested the performance of fluidized beds for the drying of 2-phase olive waste. They have noted that fluidized bed techniques allow high drying rates at low temperature. However, the fluidized bed reactor was not adapted due to the high moisture content (>50%).
Previously investigations were basically dedicated to the determination of the drying kinetics derived from experimental tests for various operation conditions. Recently, Gomez de la Cruz et al. [27] have evaluated the different mathematical models of the drying curves presented in various investigations in literature. They have also analyzed the model parameters as well as the effective moisture diffusivity and activation energy values. Authors have highlighted the complexity of the physical process due to the heterogeneity of 2-phases-olive mill wastes which include skin, pulp, vegetation water, pits, residual olive oil and several organic compounds such as sugars and polyphenols.
As mentioned previously, the main results available in the literature are concerned the OMWW generated from 2-phase extraction systems. The absence of investigations on the OMWW (vegetation water) generated by 3-phase extraction systems may be attributed to its higher moisture content and also, as shown in Figure 1, to the black crust formation. Therefore, the OMWW impregnation on dry biomasses allows reducing the moisture content and also the adsorption of mineral contents and organic compounds. Hence, this work examines the drying of OMWW generated by a 3-phase system after impregnation on dry biomasses such as sawdust and olive solid waste. The main purpose is to determine for the first time the effect of the impregnation on the OWMM drying and to establish the drying kinetics required for the large-scale dryer design.

2. Experimental Procedure

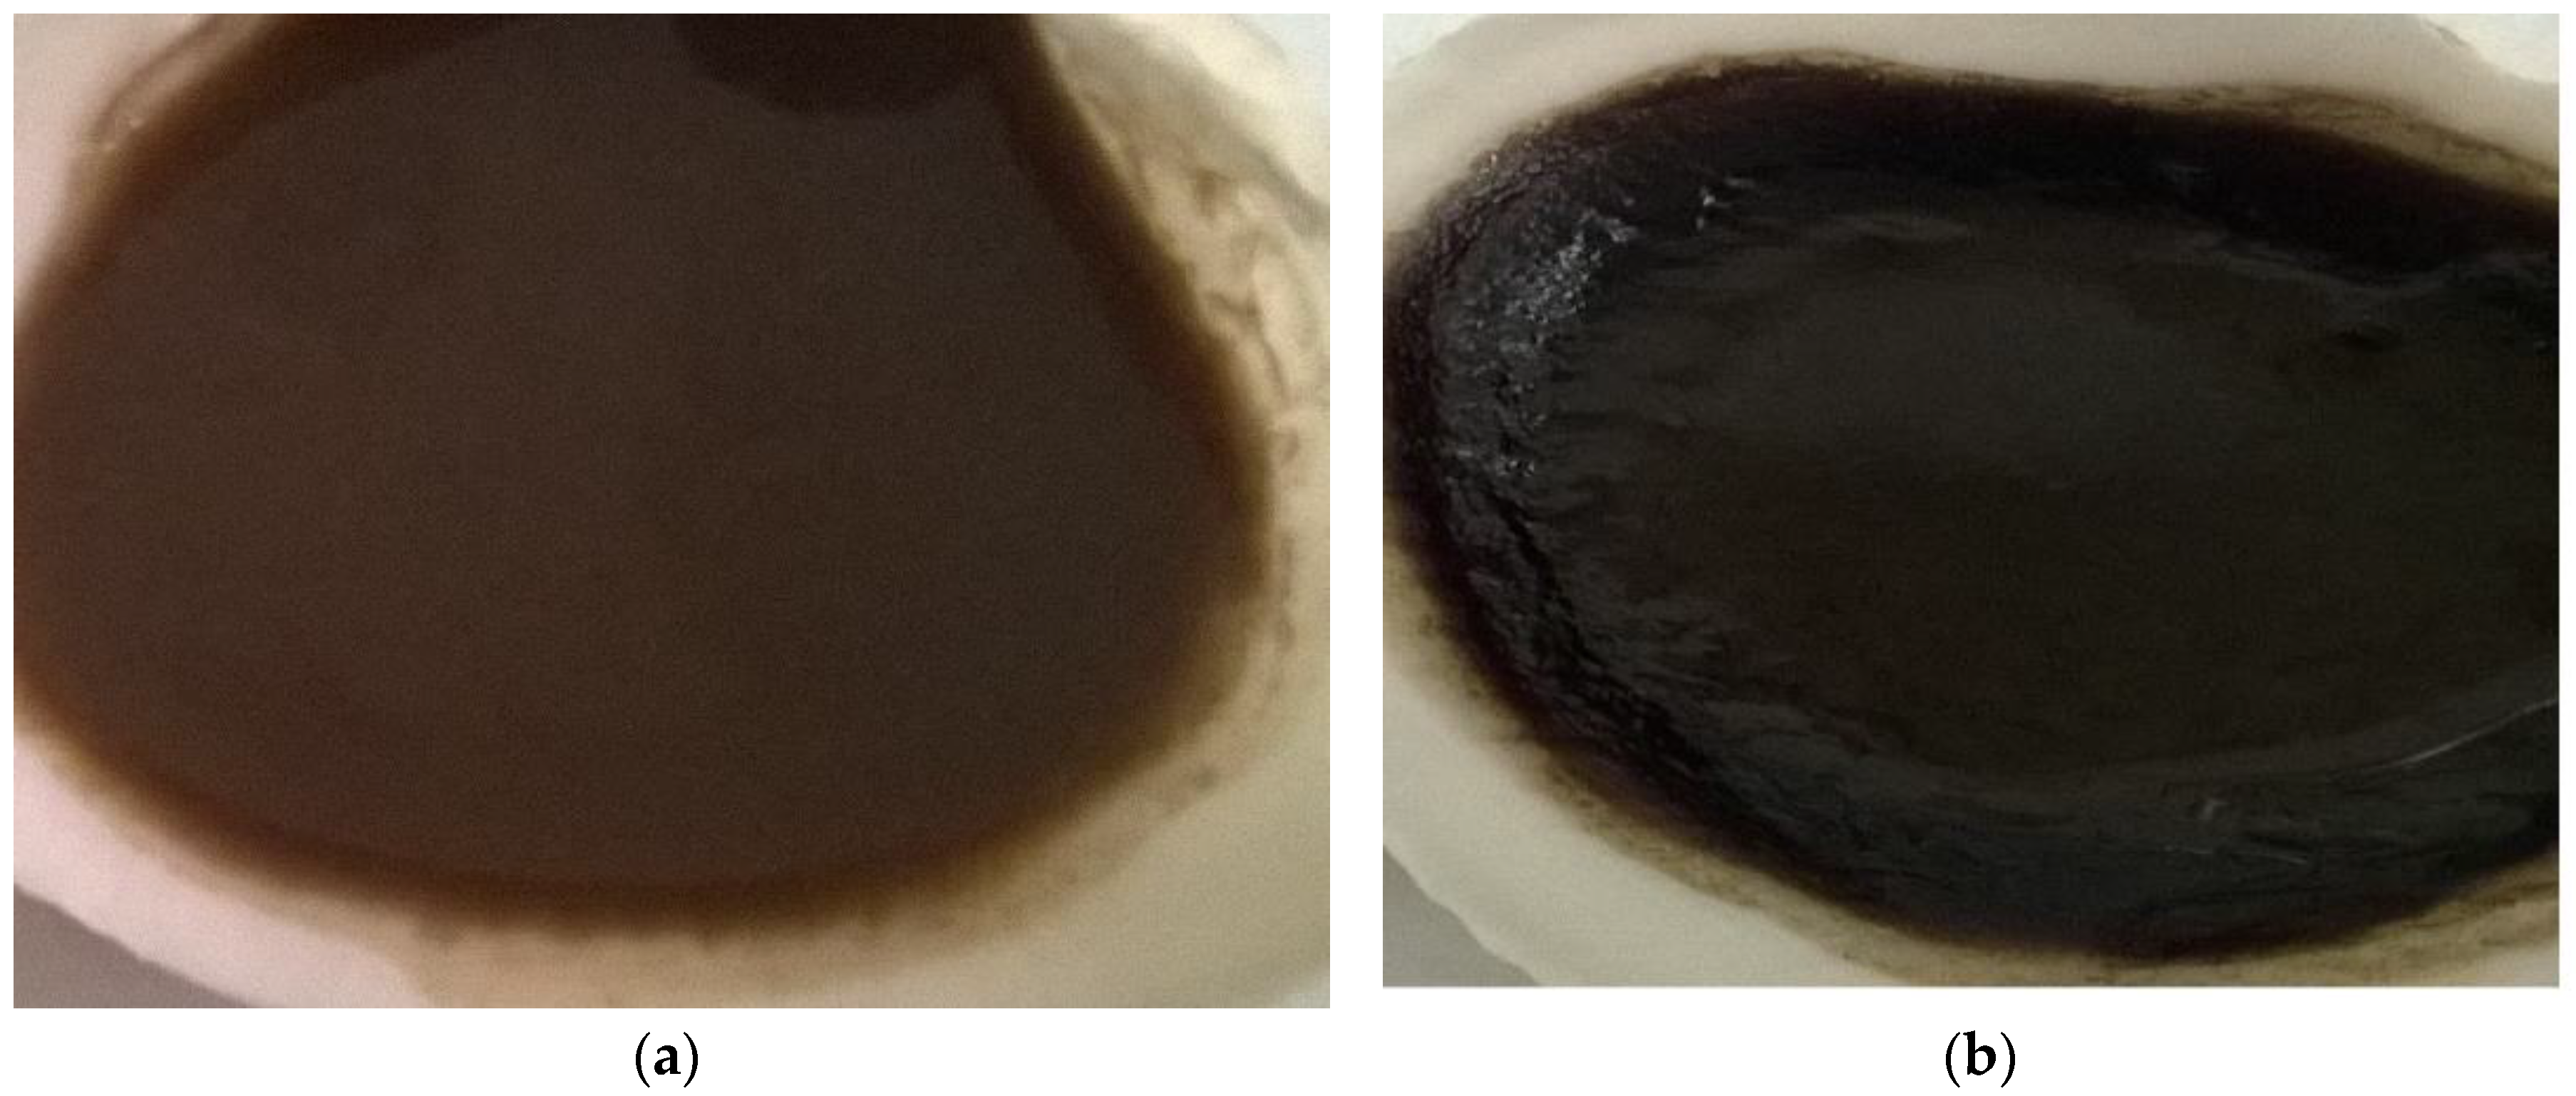
2.1. Samples Preparation

The OMWW and OMSW used in this study were collected from a typical 3-phase olive mill located in Tunisia. Sawdust was provided from a sawmill located in Illfurth, France (Nollinger Sawmill). The physico-chemical properties of the OMWW as well as the OMSW and sawdust proximate analyses are listed in Table 1 and Table 2, respectively.
The OMSW and sawdust biomasses were sieved using mechanical sieve shakers (Retsch, Haan, Germany). Only the fraction with particle diameters lower than 2 mm was selected for the impregnation tests. During these impregnation tests, 35 g of OMSW (10% db, dry basis) or 25 g of sawdust (10% db, dry basis) were slowly added to 100 g of OMWW (85% wb, wet basis) and were mixed during 2h. The impregnation ratio was defined in previous investigations [13]. The OMWW-OMSW blend was labelled Impregnated Solid Waste (ISW) while the OMWW-Sawdust blend was labelled Impregnated Sawdust (IS). The impregnation tests were performed in triplicate. The impregnated samples are stored in a waterproof plastic container of 2 L. The initial moisture contents of the studied biomasses are X wb = 0.85 (X db = 5.67) for OMWW, X wb = 0.64 (X db = 1.78) for ISW and X wb = 0.70 (X db = 2.33) for IS.

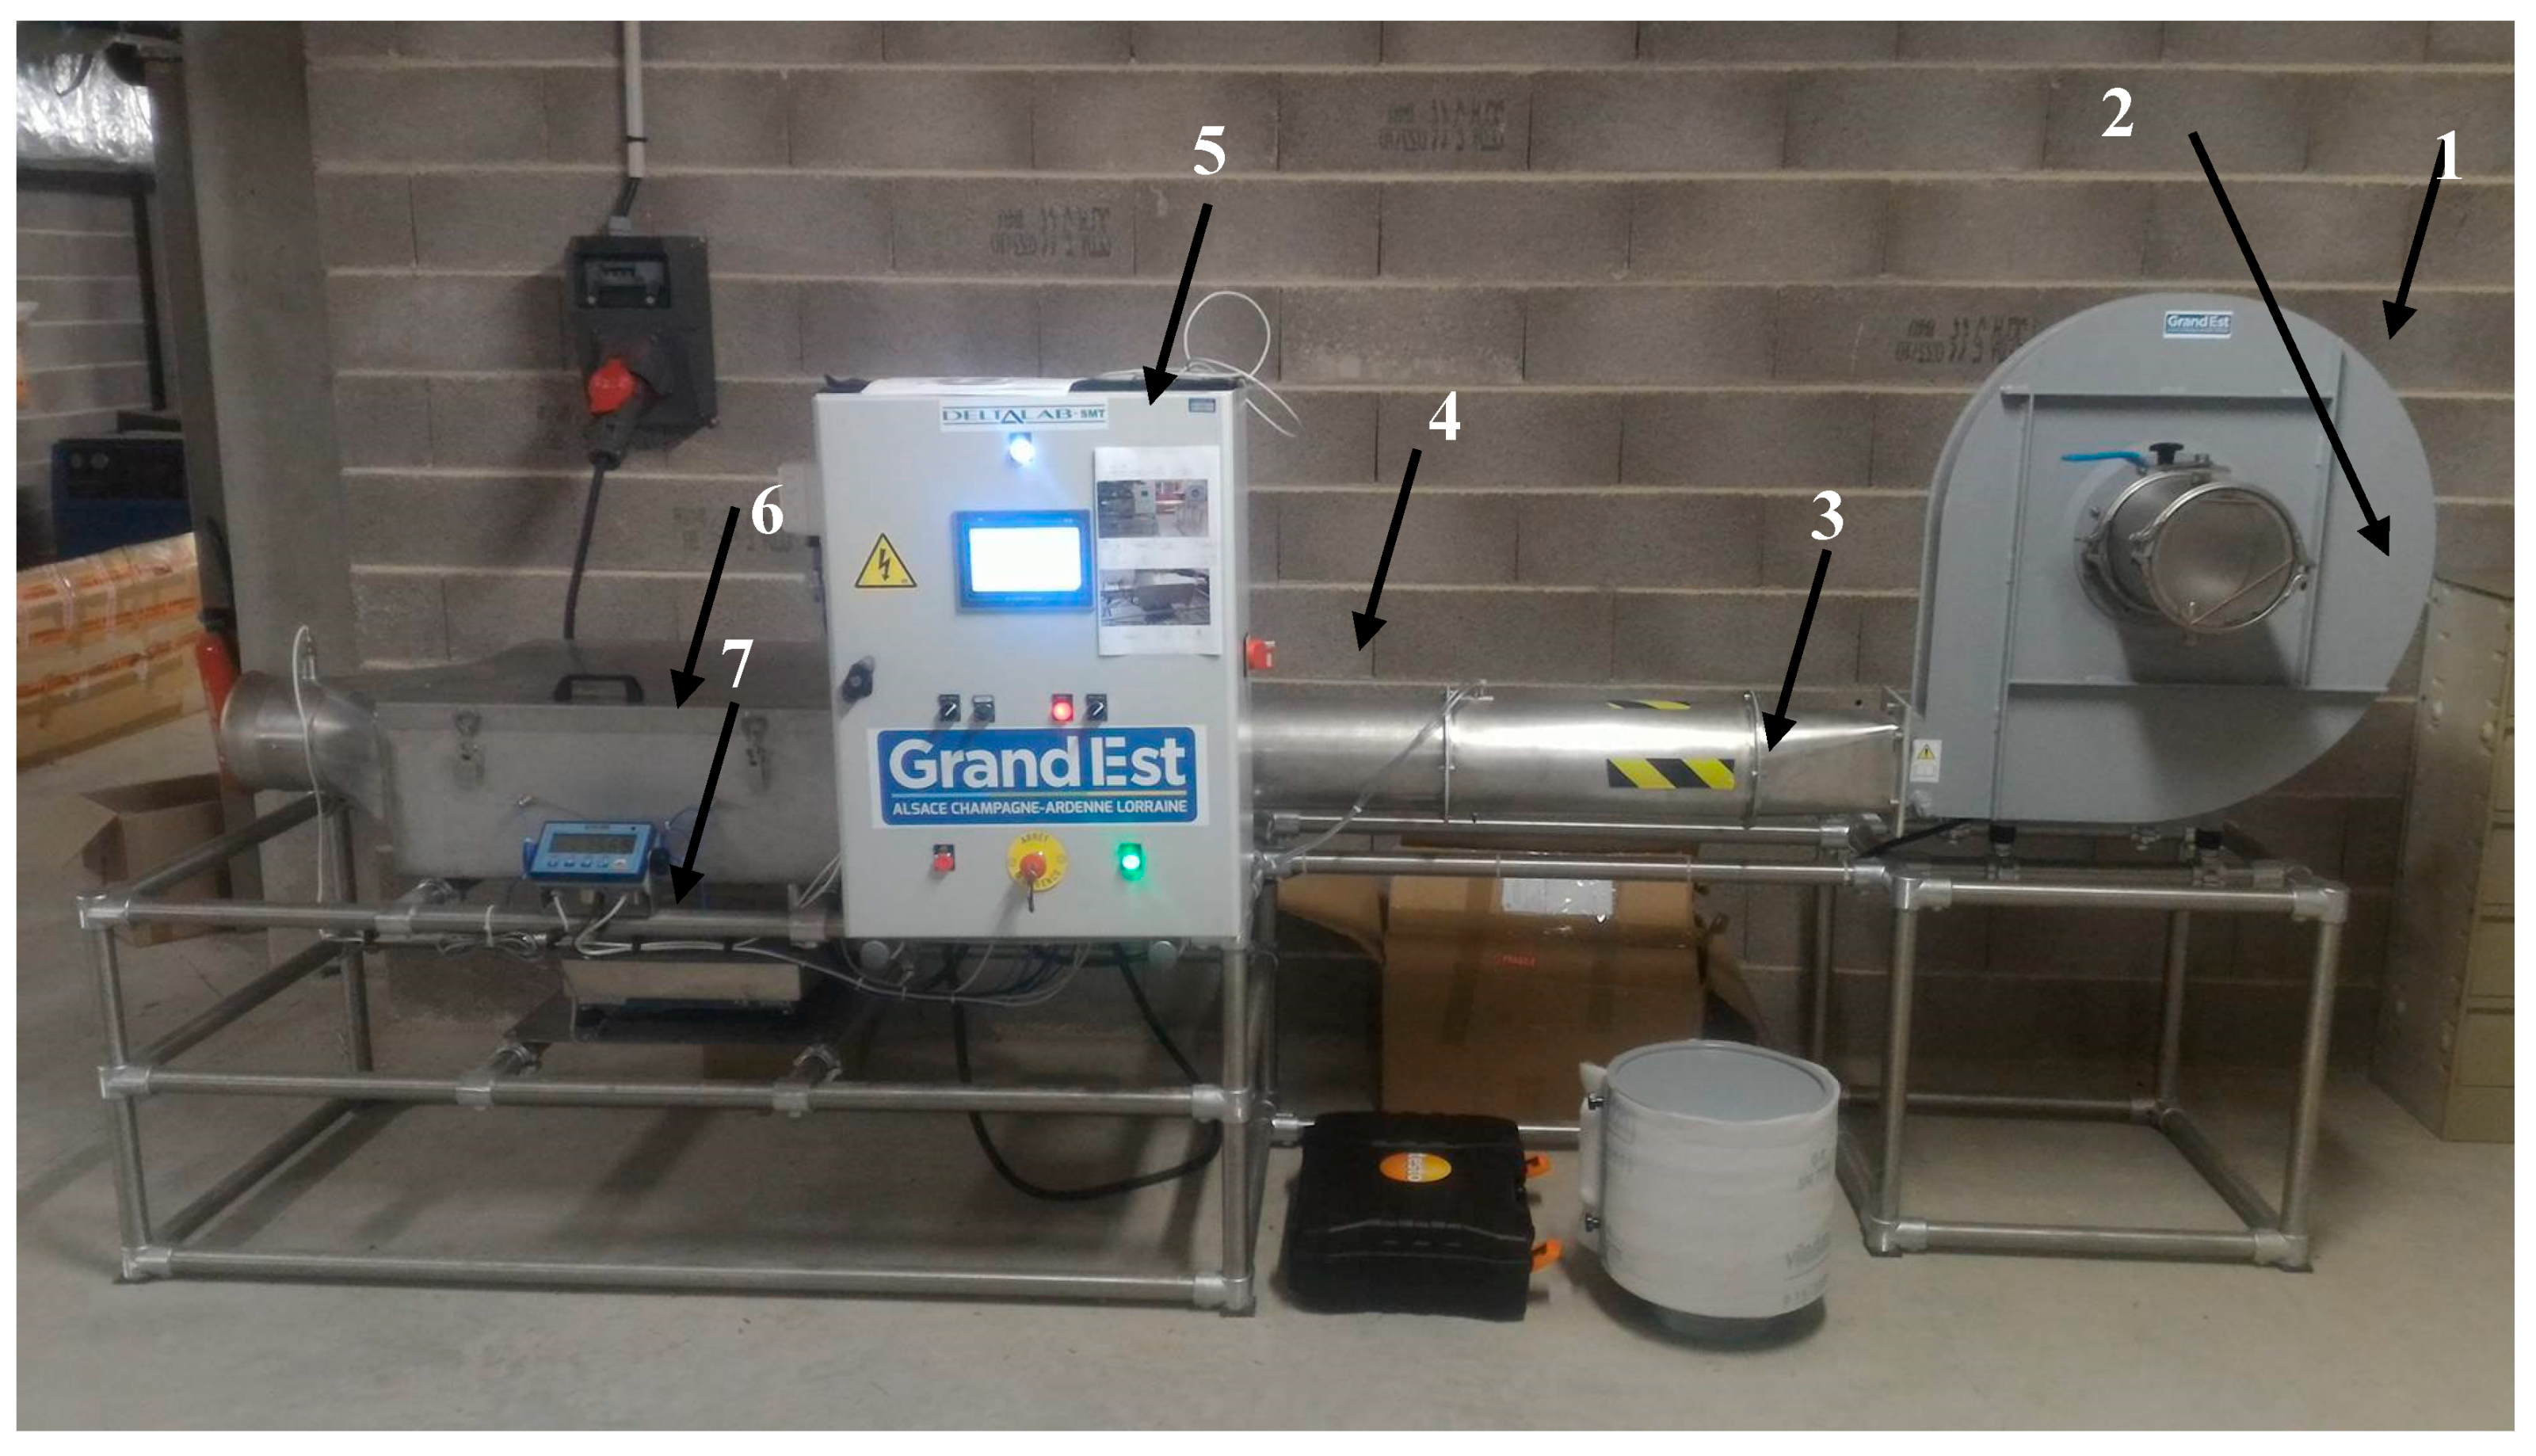
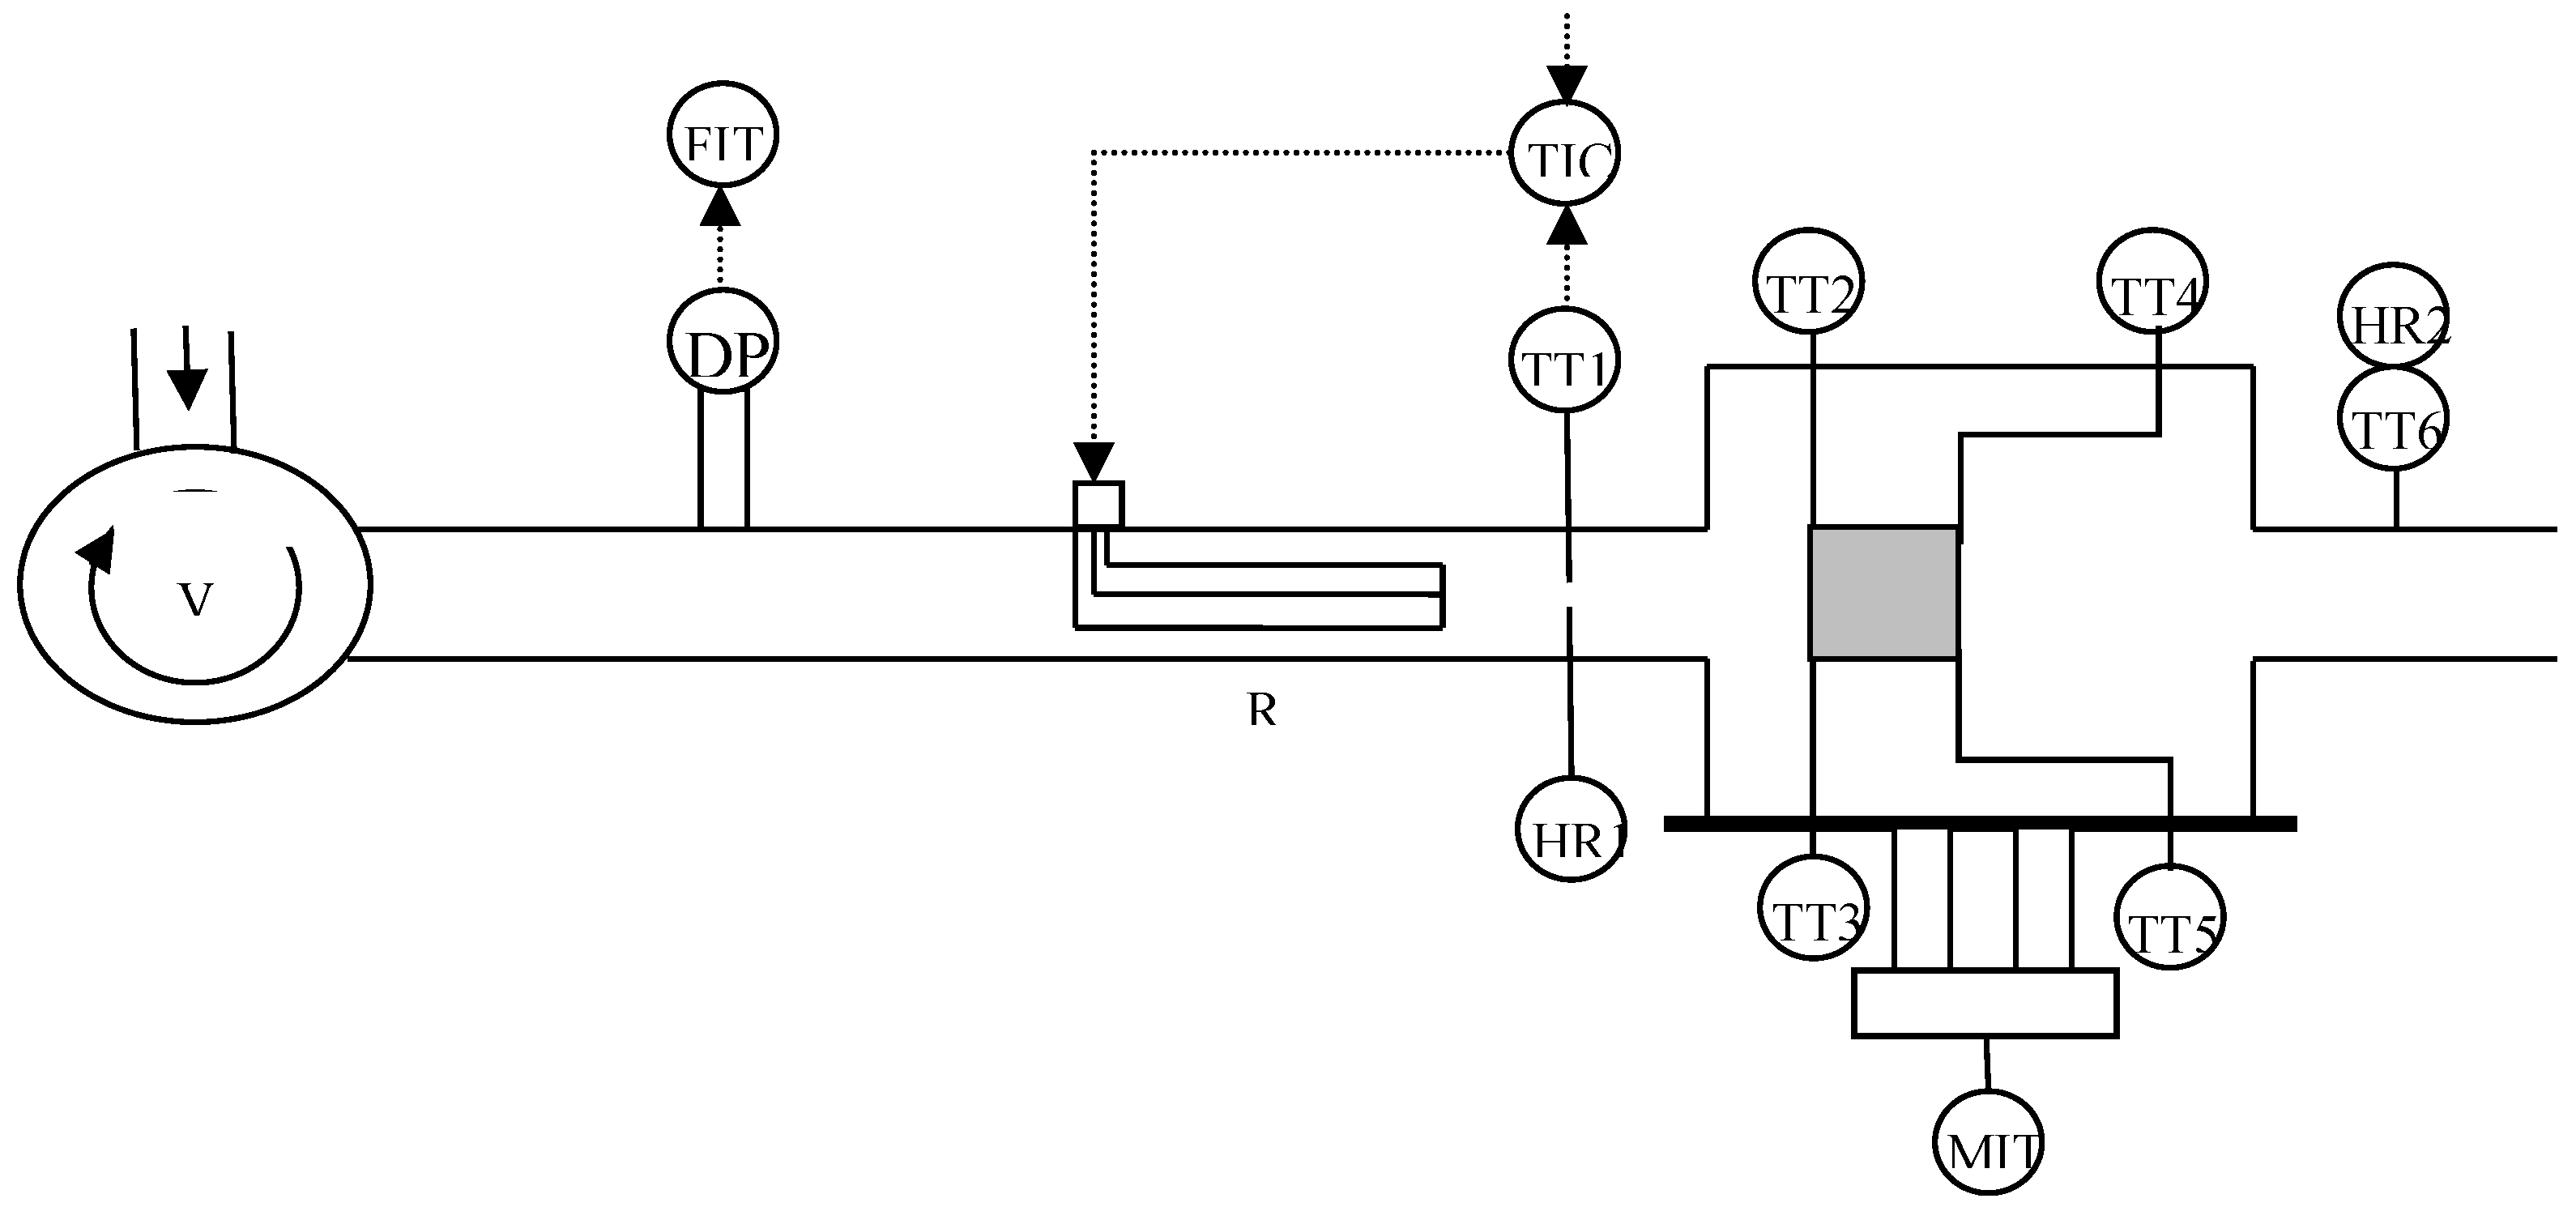
2.2. Drying Equipment

Experimental drying of OMWW, ISW and IS was performed using the forced convective dryer shown in Figure 2.
The pilot dryer used is manufactured from stainless steel, and includes a balance to monitor the sample mass with the drying time. Balance, temperature and velocity sensors are connected to a data acquisition system. The sample mass was recorded each 2 seconds allowing the determination of the moisture content evolution with time. During the drying test, a fan (1) introduces air in the dryer via a pipe (2) for low flows. Air is supplied in the drying chamber (6) via a cylindrical vein (3) and heated by electric resistances (4). The drying chamber is set on a balance (7).
Figure 3 presents the flowchart of the different sensors with their connections used in the system in order to provide more information on the drying process.
The fan (V) is a 400 V three phase, 7.5 kW centrifugal fan (FE SGI P4 ALG 132, Ferrari Industrial, Arzignano, Italy) controlled by the dialogue window and the air flow rate can range from 60 m3/h (0.53 m/s) to 700 m3/h (6.2 m/s). To measure the flow rate an air flow measuring blade (DP) is used (KIMO Debimo 150, Montpon Ménestérol, France) error between 3 to 5% depending of the installation). The heating system consists of three electrical heating resistances (three phase star connected) of 9 kW each. The control system can limit the output power from 5 to 100% of the maximal power. The air temperature control is carried out by PID adjustment loops from the air temperature TT1 by controlling with on/off energy input. The balance is a Argeo TQ 60 (Dini, Taunton, United Kingdom) with an on board weighting system (Dini Argeo DFWLB) connected with the data acquisition module and accessible via the dialogue window. The drying chamber is placed on a weighting pan to continuously measure the mass loss. Four thermal sensors (PT 100 sensors, class A (±0.15 + 0.002T, T (°C))) are located in the drying chamber to measure the temperature of the sample. Two thermal/relative humidity sensors are at the chamber inlet and outlet (KIMO SHDI-150 (±1.5% HR)). All these sensors are connected to a data acquisition module (D9 5150-0100, ASCON, Vigevano, Italy) and controlled by a dialogue window (touch screen) (ASCON OPMT 8070 iE). After each experiment, the data are transferred and saved with an USB drive.
During the drying tests, wet samples of around 0.3–0.5 cm thick (uneven surface) are placed on a plate in a rectangular slice (10 × 10 cm). The operating temperatures were 40, 50 and 60 °C while the air velocities were 0.7, 1.0 and 1.3 m/s respectively. These values were selected based on the drying temperature range (20–70 °C) used for food products [21]. Indeed, in previous studies [28] it was mentioned that a high drying temperature ≥70 °C may change agrifood byproducts’ quality. In our case, the low-grade temperature drying limits organic compound devolatilization. Air velocity values were selected in the same usual range of agrifood convective drying (0.5 to 1.5 m/s) in order to have the best efficiency/energy cost compromise [27,29]. The convective drying is currently well-known as an efficient solution and the thermohydric behavior of thin layer is chosen for this research. The drying time is defined as the time needed to reach a final moisture of X db = 0.2 (X wb = 0.18) corresponding to a moisture content compatible with an outside storage (under shelter) without moisture adsorption.

3. Theoretical Approach

3.1. Moisture Content

The moisture content (X) of the samples is calculated by the following equation:
X = m ( t ) m s m ( t )
where, X is the moisture content of sample at time t (kg/kg, wb), m is the mass of sample (g) and ms is the mass of dried sample (g).

3.2. Drying Kinetic Models

Table 3 presents the kinetic models for thin layer drying. These models are often used for biomass and agrifood products since they assume that mass transfer during drying is mainly controlled by diffusion into the product [30,31,32,33,34,35].

3.3. Diffusion Coefficient

Several authors have used Fick’s second diffusion law to investigate the drying of different products [38,39,40,41]. Senadeera et al. [41] have studied the drying of vegetable materials by using Fick equations. Montero et al. [40] have used Fick diffusion theory to investigate drying of byproducts from olive oil processing. Celma et al. [26] have also used the same law for the thin layer infrared drying of wet olive husks. During this investigation, they assumed that the water mass transfer is diffusive in the material with negligible shrinking.
According to this hypothesis, mass balance can be expressed as:
X t = D e f f Δ X
With Δ is the differential operator Laplacian and Deff the effective diffusivity coefficient of water in the medium. Crank [42] has developed an analytical solution of the partial differential equation. During the equation resolution, he assumed that the mass transfer is mono-dimensional and the initial moisture content is uniform. He has solved the partial differential equation (homogeneous case) by the classical Fourier method (i.e. separation of variables). This method can be used for a variety of regular forms of wet products (rectangular, cylindrical, spherical). The analytical solution is applicable for food products having a uniform initial distribution of moisture:
X = 8 π 2 n = 0 1 ( 2 n + 1 ) 2 exp ( ( 2 n + 1 ) 2 π 2 D e f f t e 2 )
with e being the thickness of a product slice (m).
For long drying periods, the series can be approximated to his first term. This approximated equation is a linear curve in logarithmic form:
ln X = ln 8 π 2 π 2 D e f f e 2   t

3.4. Activation Energy

The activation energy during the drying of samples could be also determined. This parameter concerns the energy required to start mass diffusion phenomenon in the products. This equation is generally assumed as an Arrhenius low. It is used to model the effect of temperature on diffusion coefficient:
D e f f = D 0 exp ( E a R g T )
where D0 is the pre-exponential factor of the Arrhenius law (m2/s), Ea is the activation energy (KJ/mol), Rg is the perfect gas constant (8.314 J/mol·K) and T is the absolute temperature (K) in the material which is assumed to equal the air temperature.

4. Results and Discussions

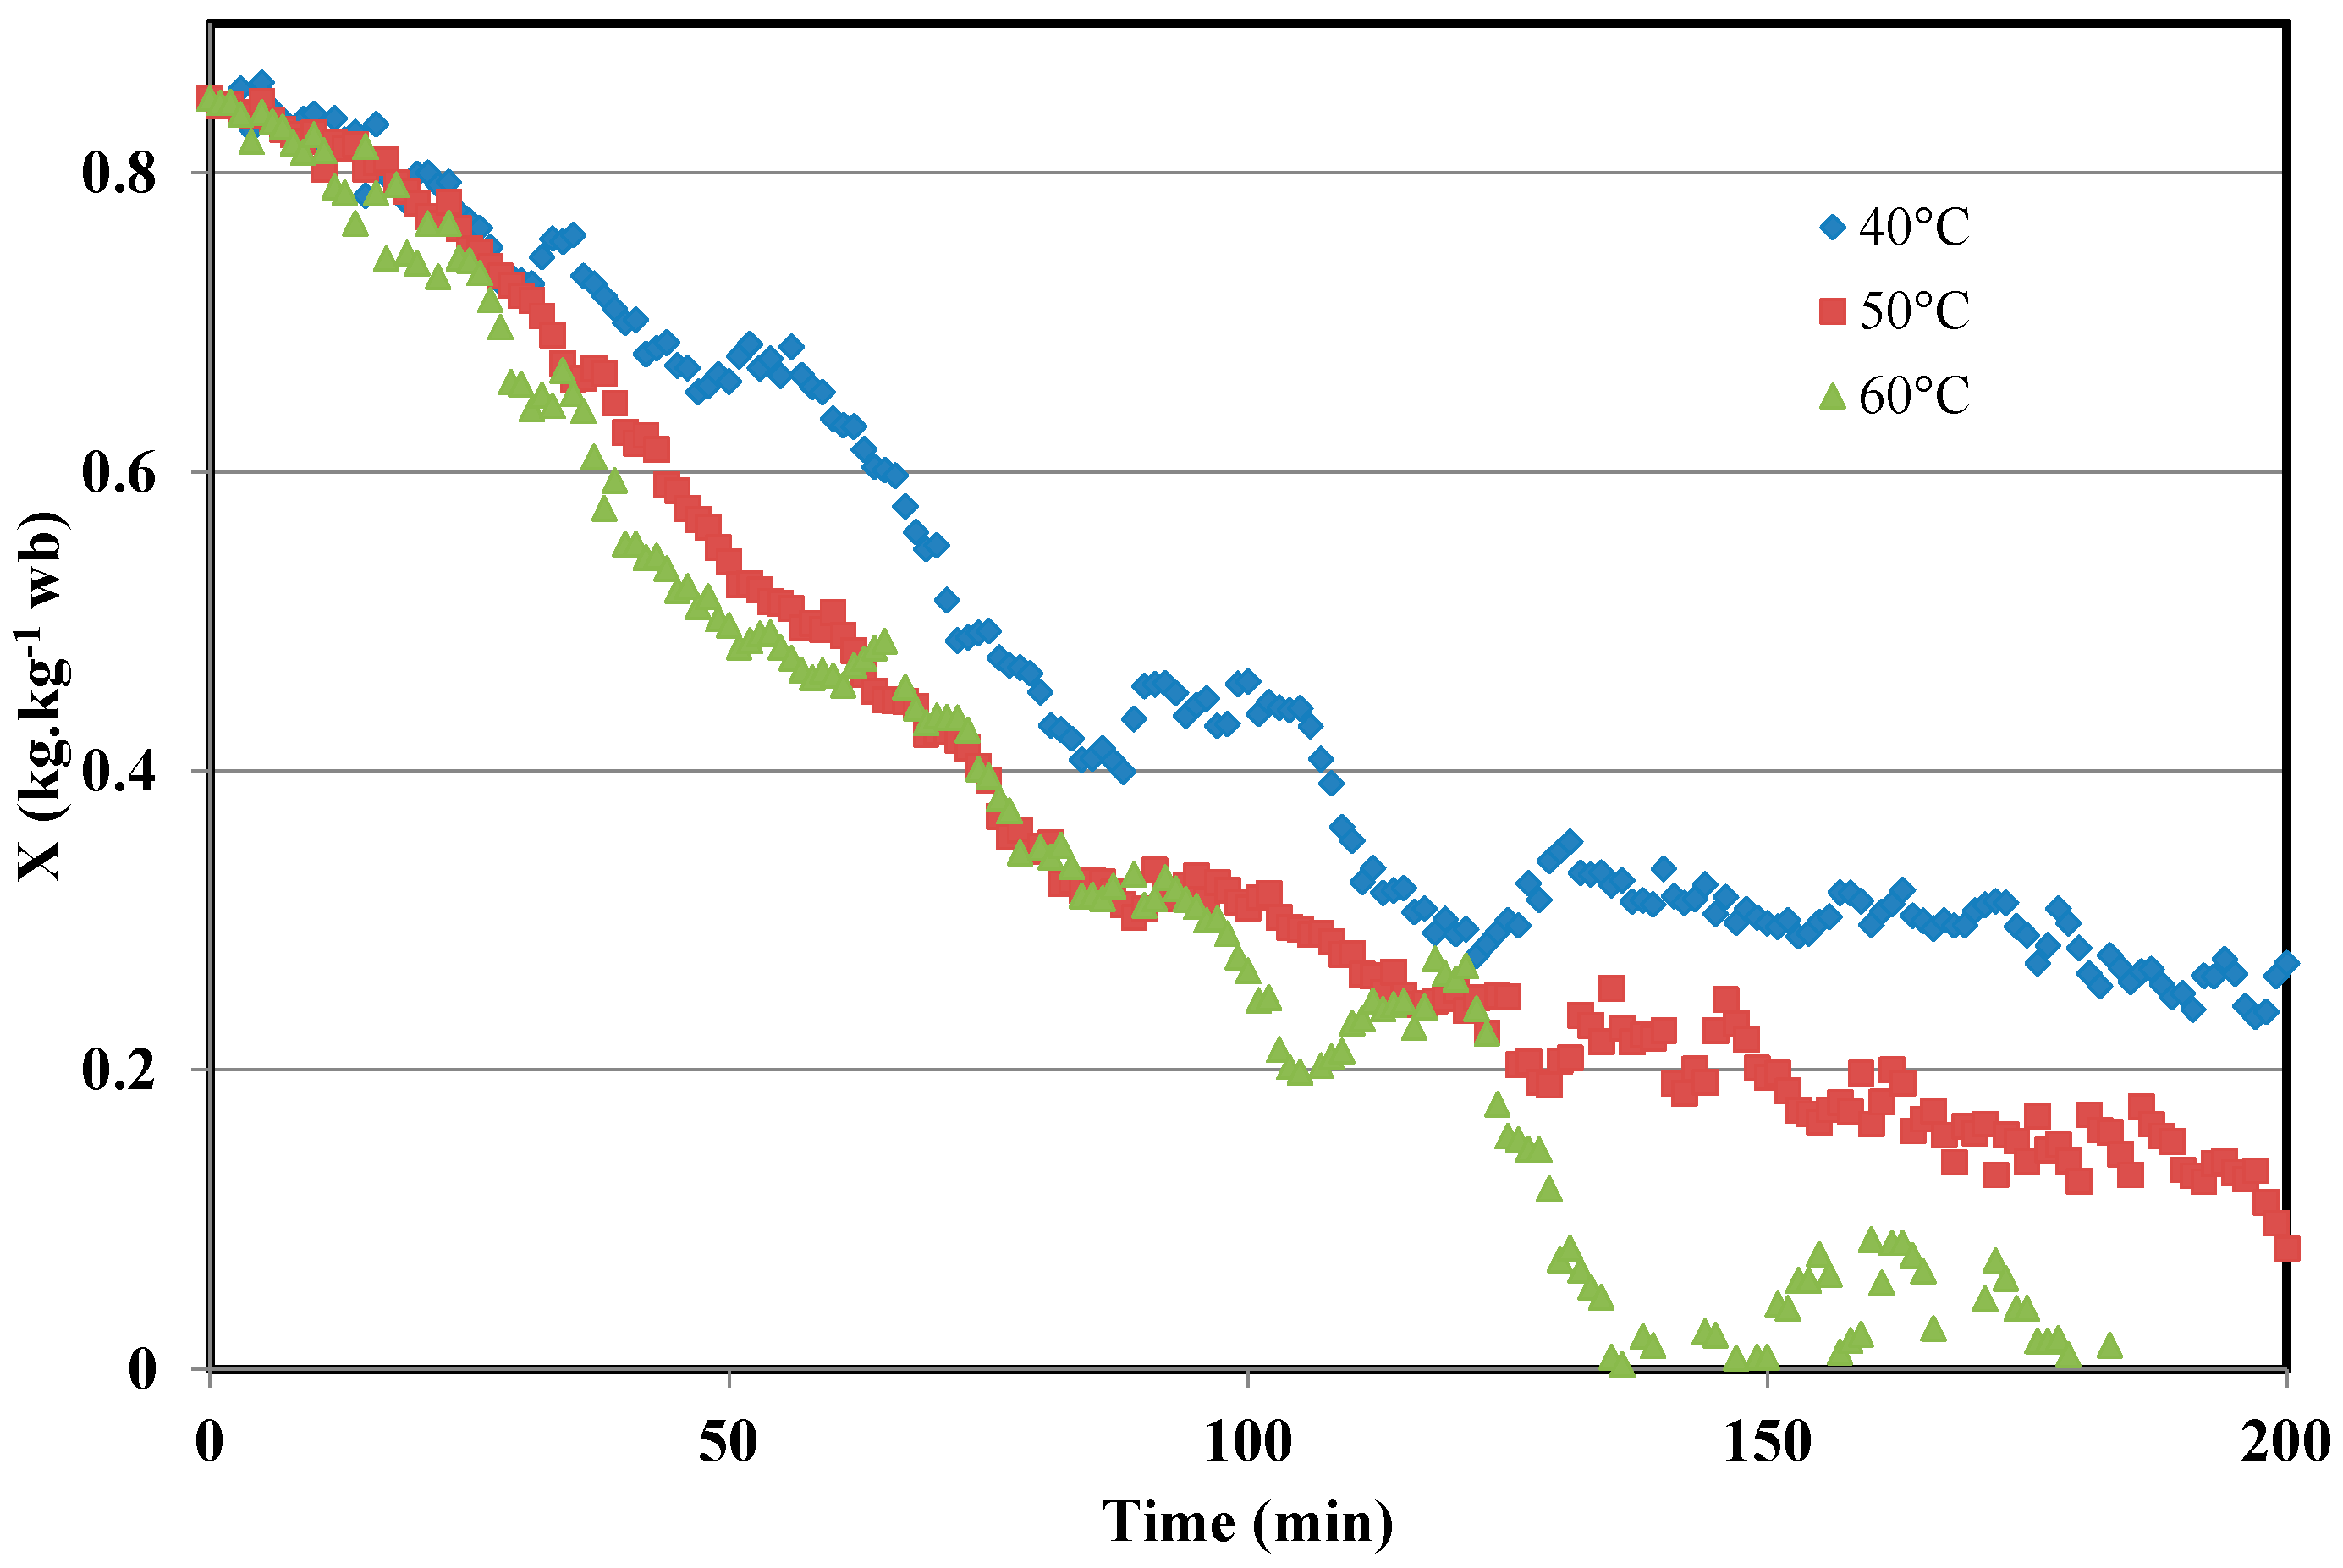
4.1. Experimental Drying Tests

Table 4 shows that the drying time for OMWW is higher than ISW and IS for the different operating conditions. The obtained results indicated the drying of the impregnated samples is twice as fast as that of the OMWW sample. The analysis of the operating conditions effect shows that, as expected, the higher the temperature is, the faster the drying is. However, the influence of air velocity is more complex. In fact, at low temperature (40 °C) and low and medium air velocities (0.7–1.0 m/s), the IS sample drying occurs faster than ISW and OMWW. On the contrary, drying times for velocities of 1.0 m/s to 1.3 m/s are close, especially for drying of IS and ISW at high temperatures. Indeed, the air velocity is a limiting factor when the airflow is unable to evaporate and transport water at the product surface.
Figure 4 shows an example of moisture content evolution versus time for OMWW, ISW and IS samples (operating conditions: T = 60 °C and V = 0.7 m/s). It is clearly shown that drying of OMWW requires more time than the impregnated samples. This behavior may be attributed to the remaining thin layer of oil which rises to the surface and inhibits moisture evaporation. Indeed, there is formation of a crust, as shown in Figure 1, due to the oil fraction on the surface during OMWW drying which consequently reduces mass transfer.
Regarding OMWW drying (Table 4), air temperature and velocity have significant influence on drying time. Figure 5 presents the evolution of moisture ratio versus time for OMWW for three operating temperatures and for a fixed drying air velocity equal to 1 m/s.
The obtained results indicate that the drying kinetics are similar during the first 30 min for the three different samples. This time corresponds to the formation of a thin layer (smooth and shiny). From 30 to 120 min, a second step of drying is observed where an influence of air temperature is measured and the layer is thickening and browning to form a black crust. After this step, the impact of temperature on drying kinetics is more significant. Such impact could be explained by crack formation that becomes important with increasing temperature. The same steps were observed for the different air velocities.

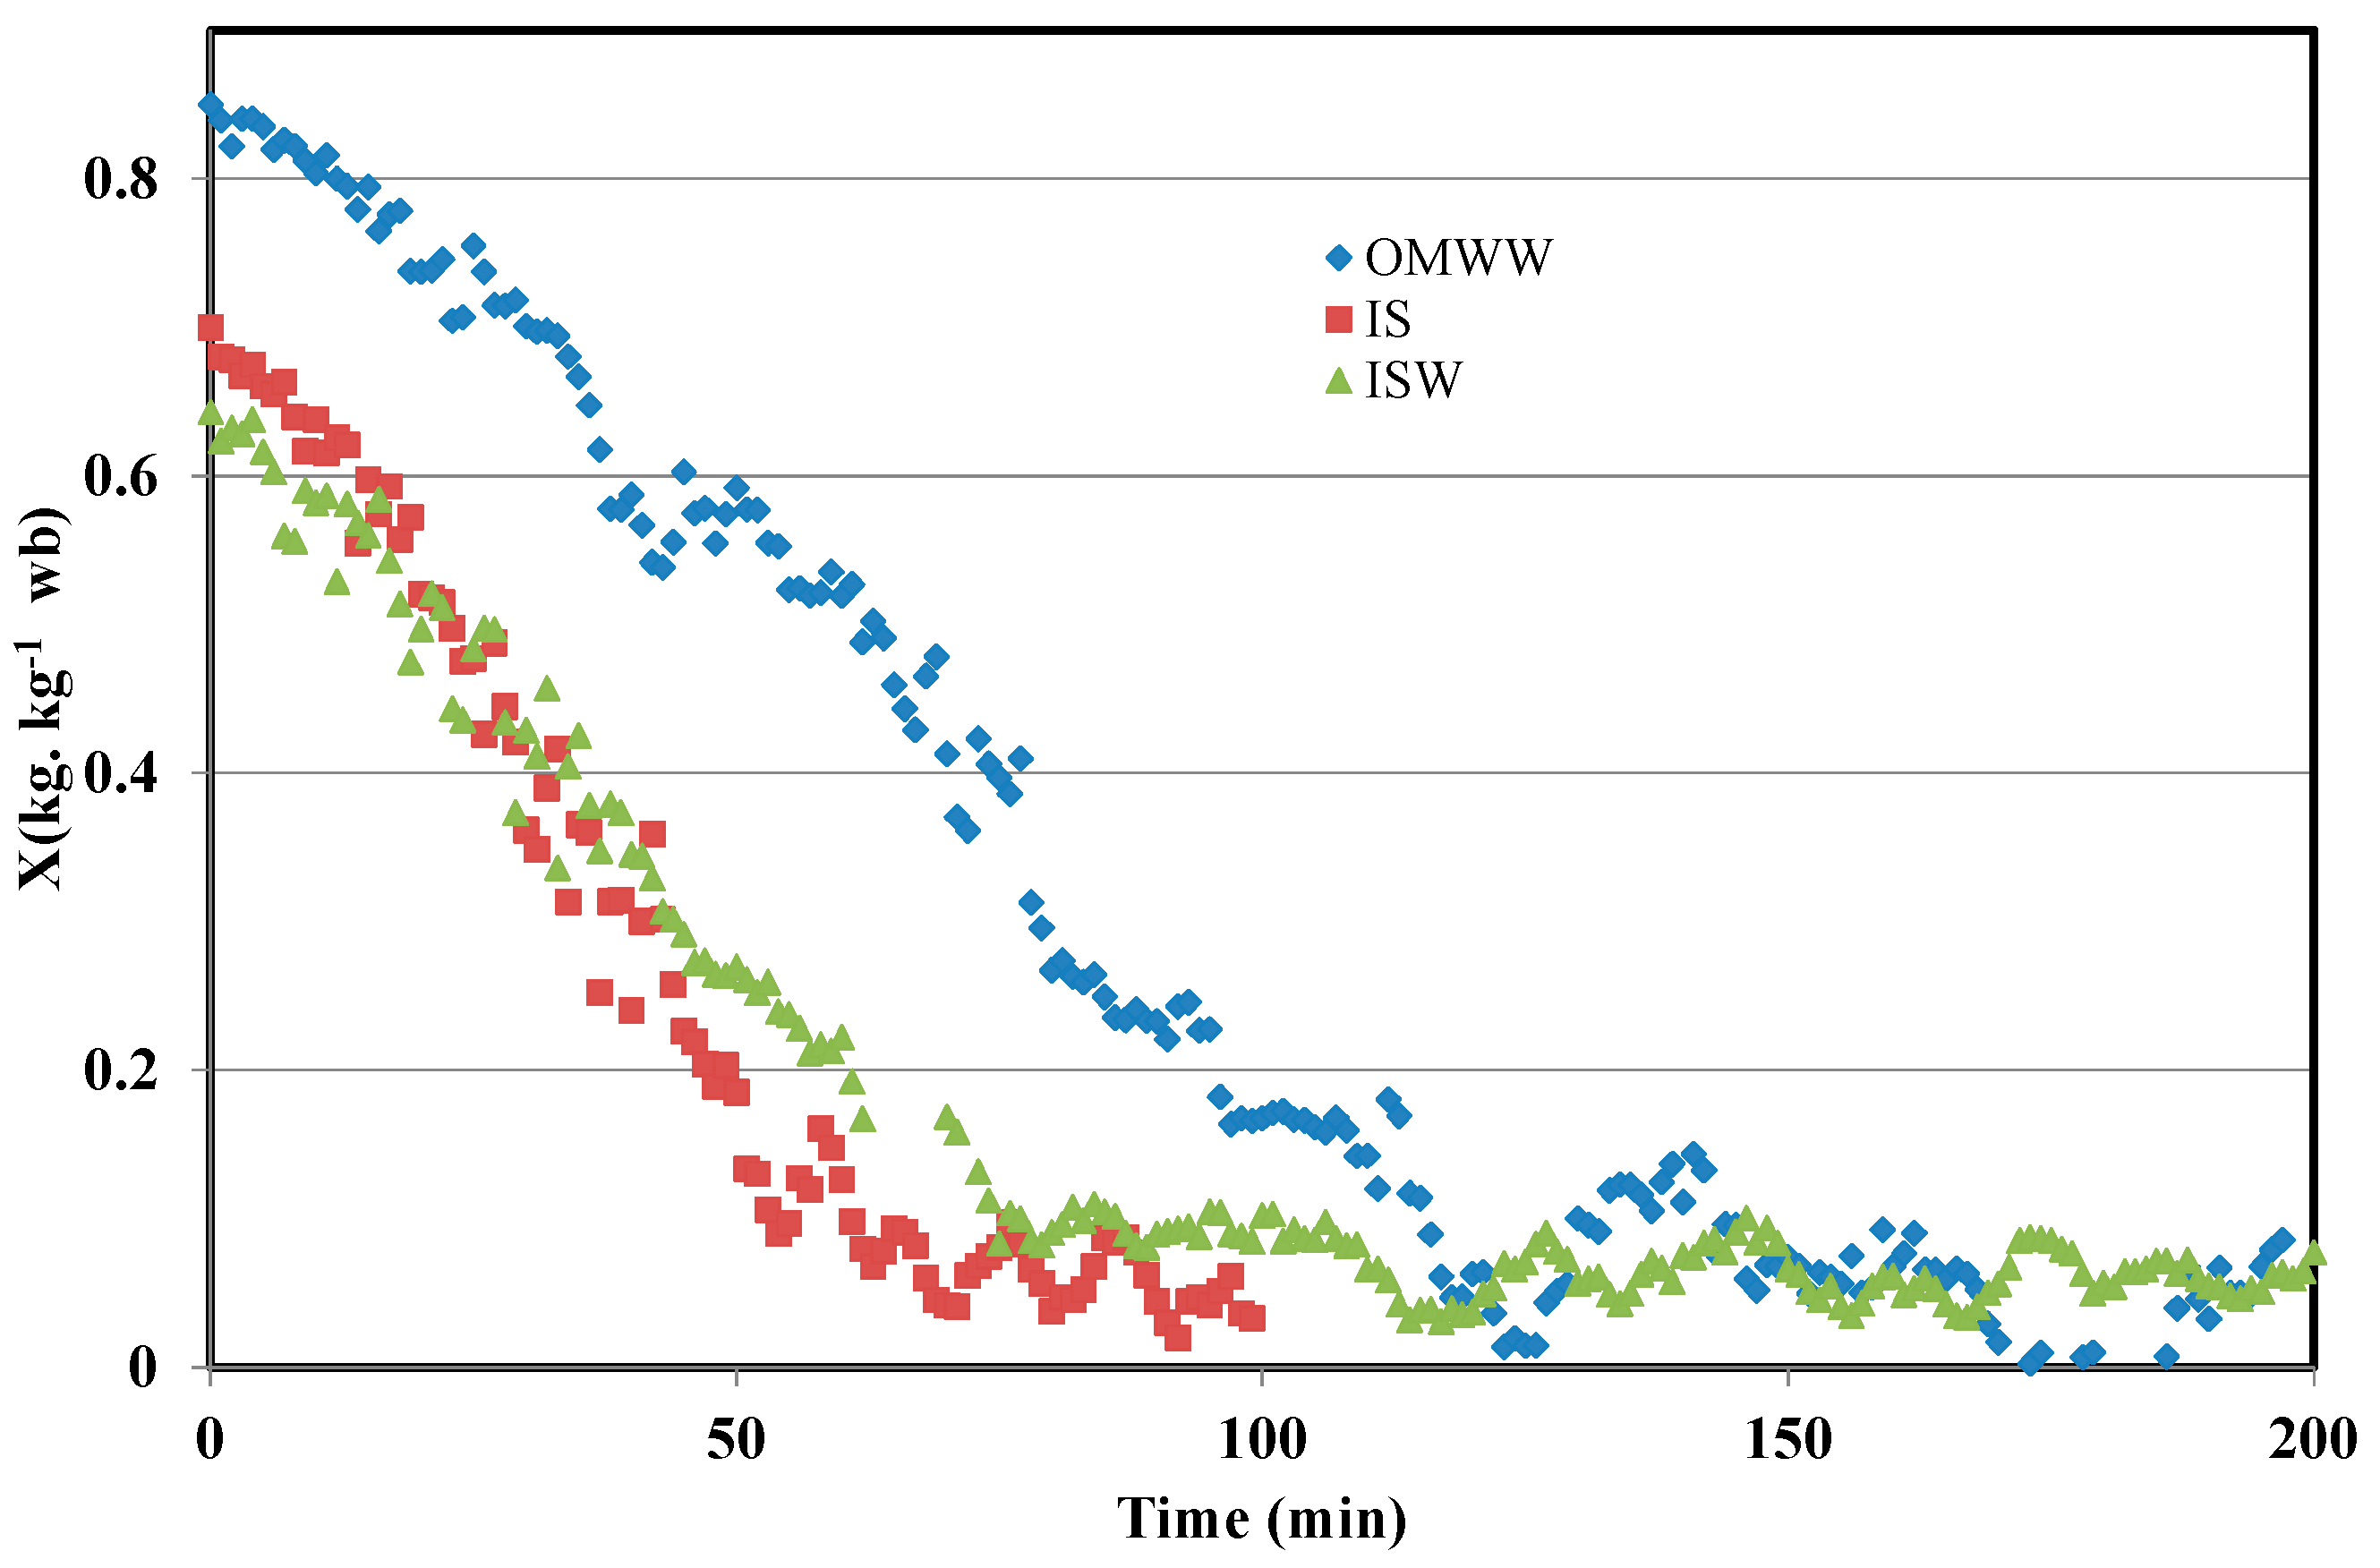
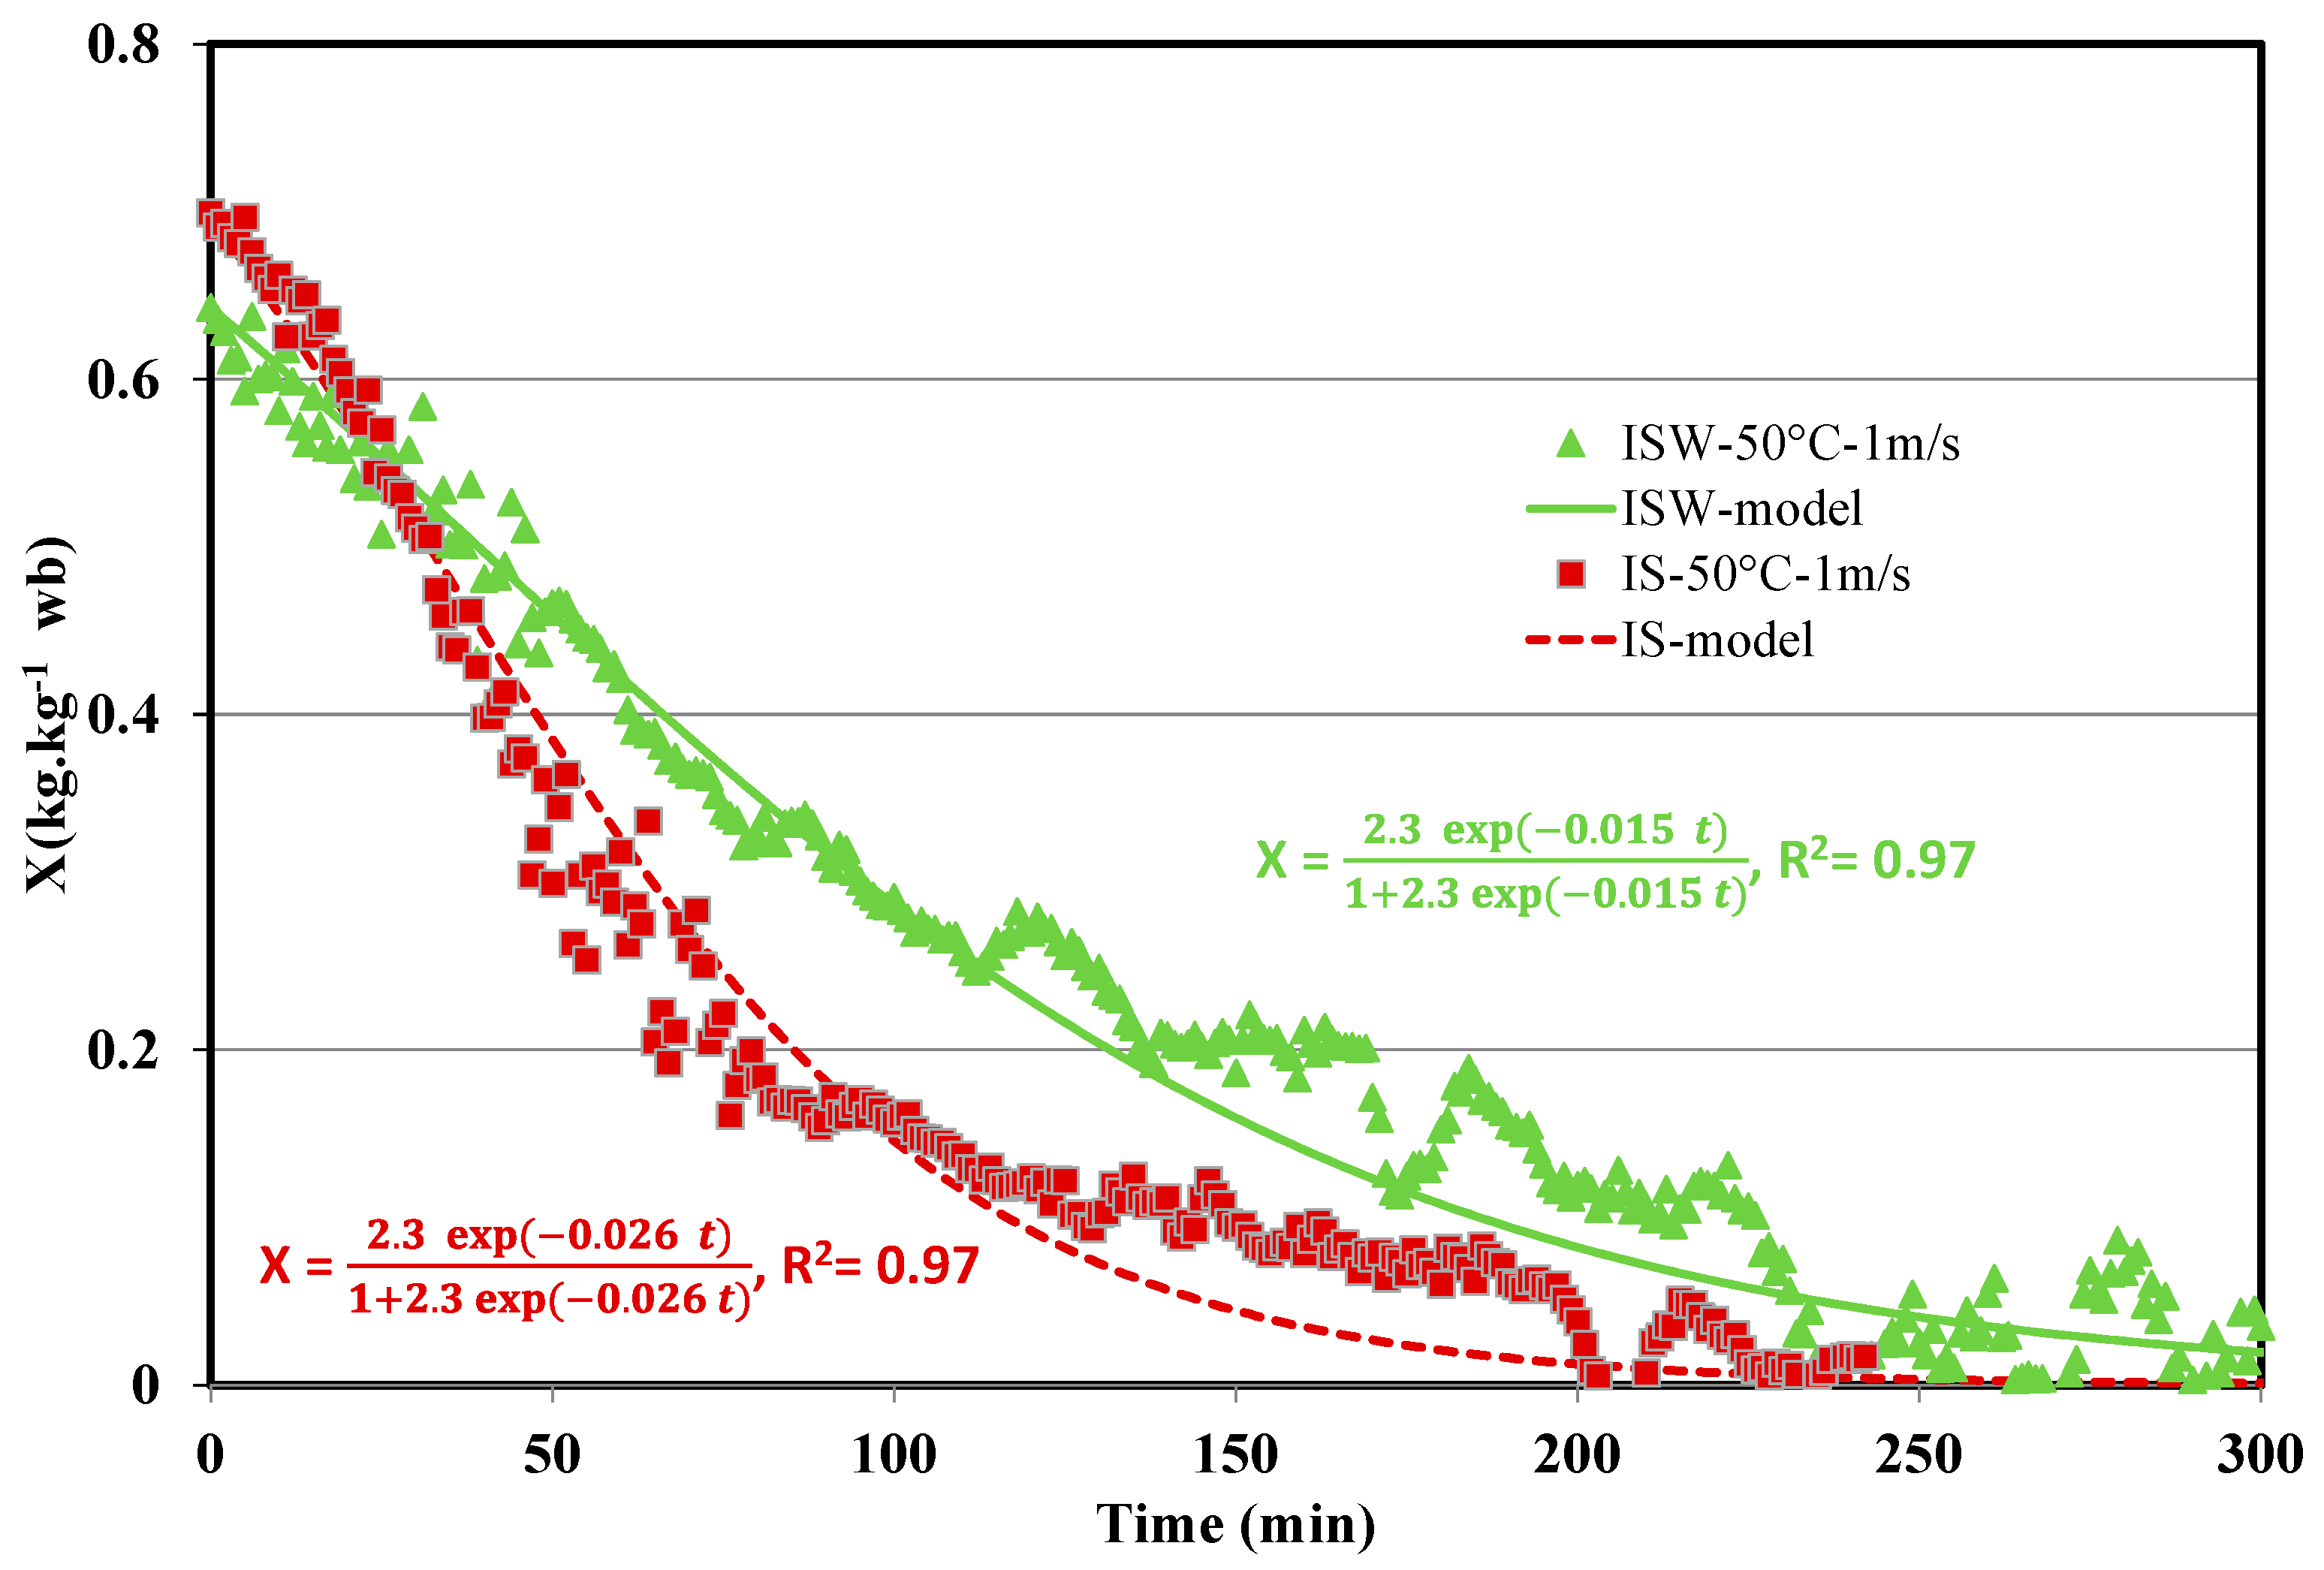
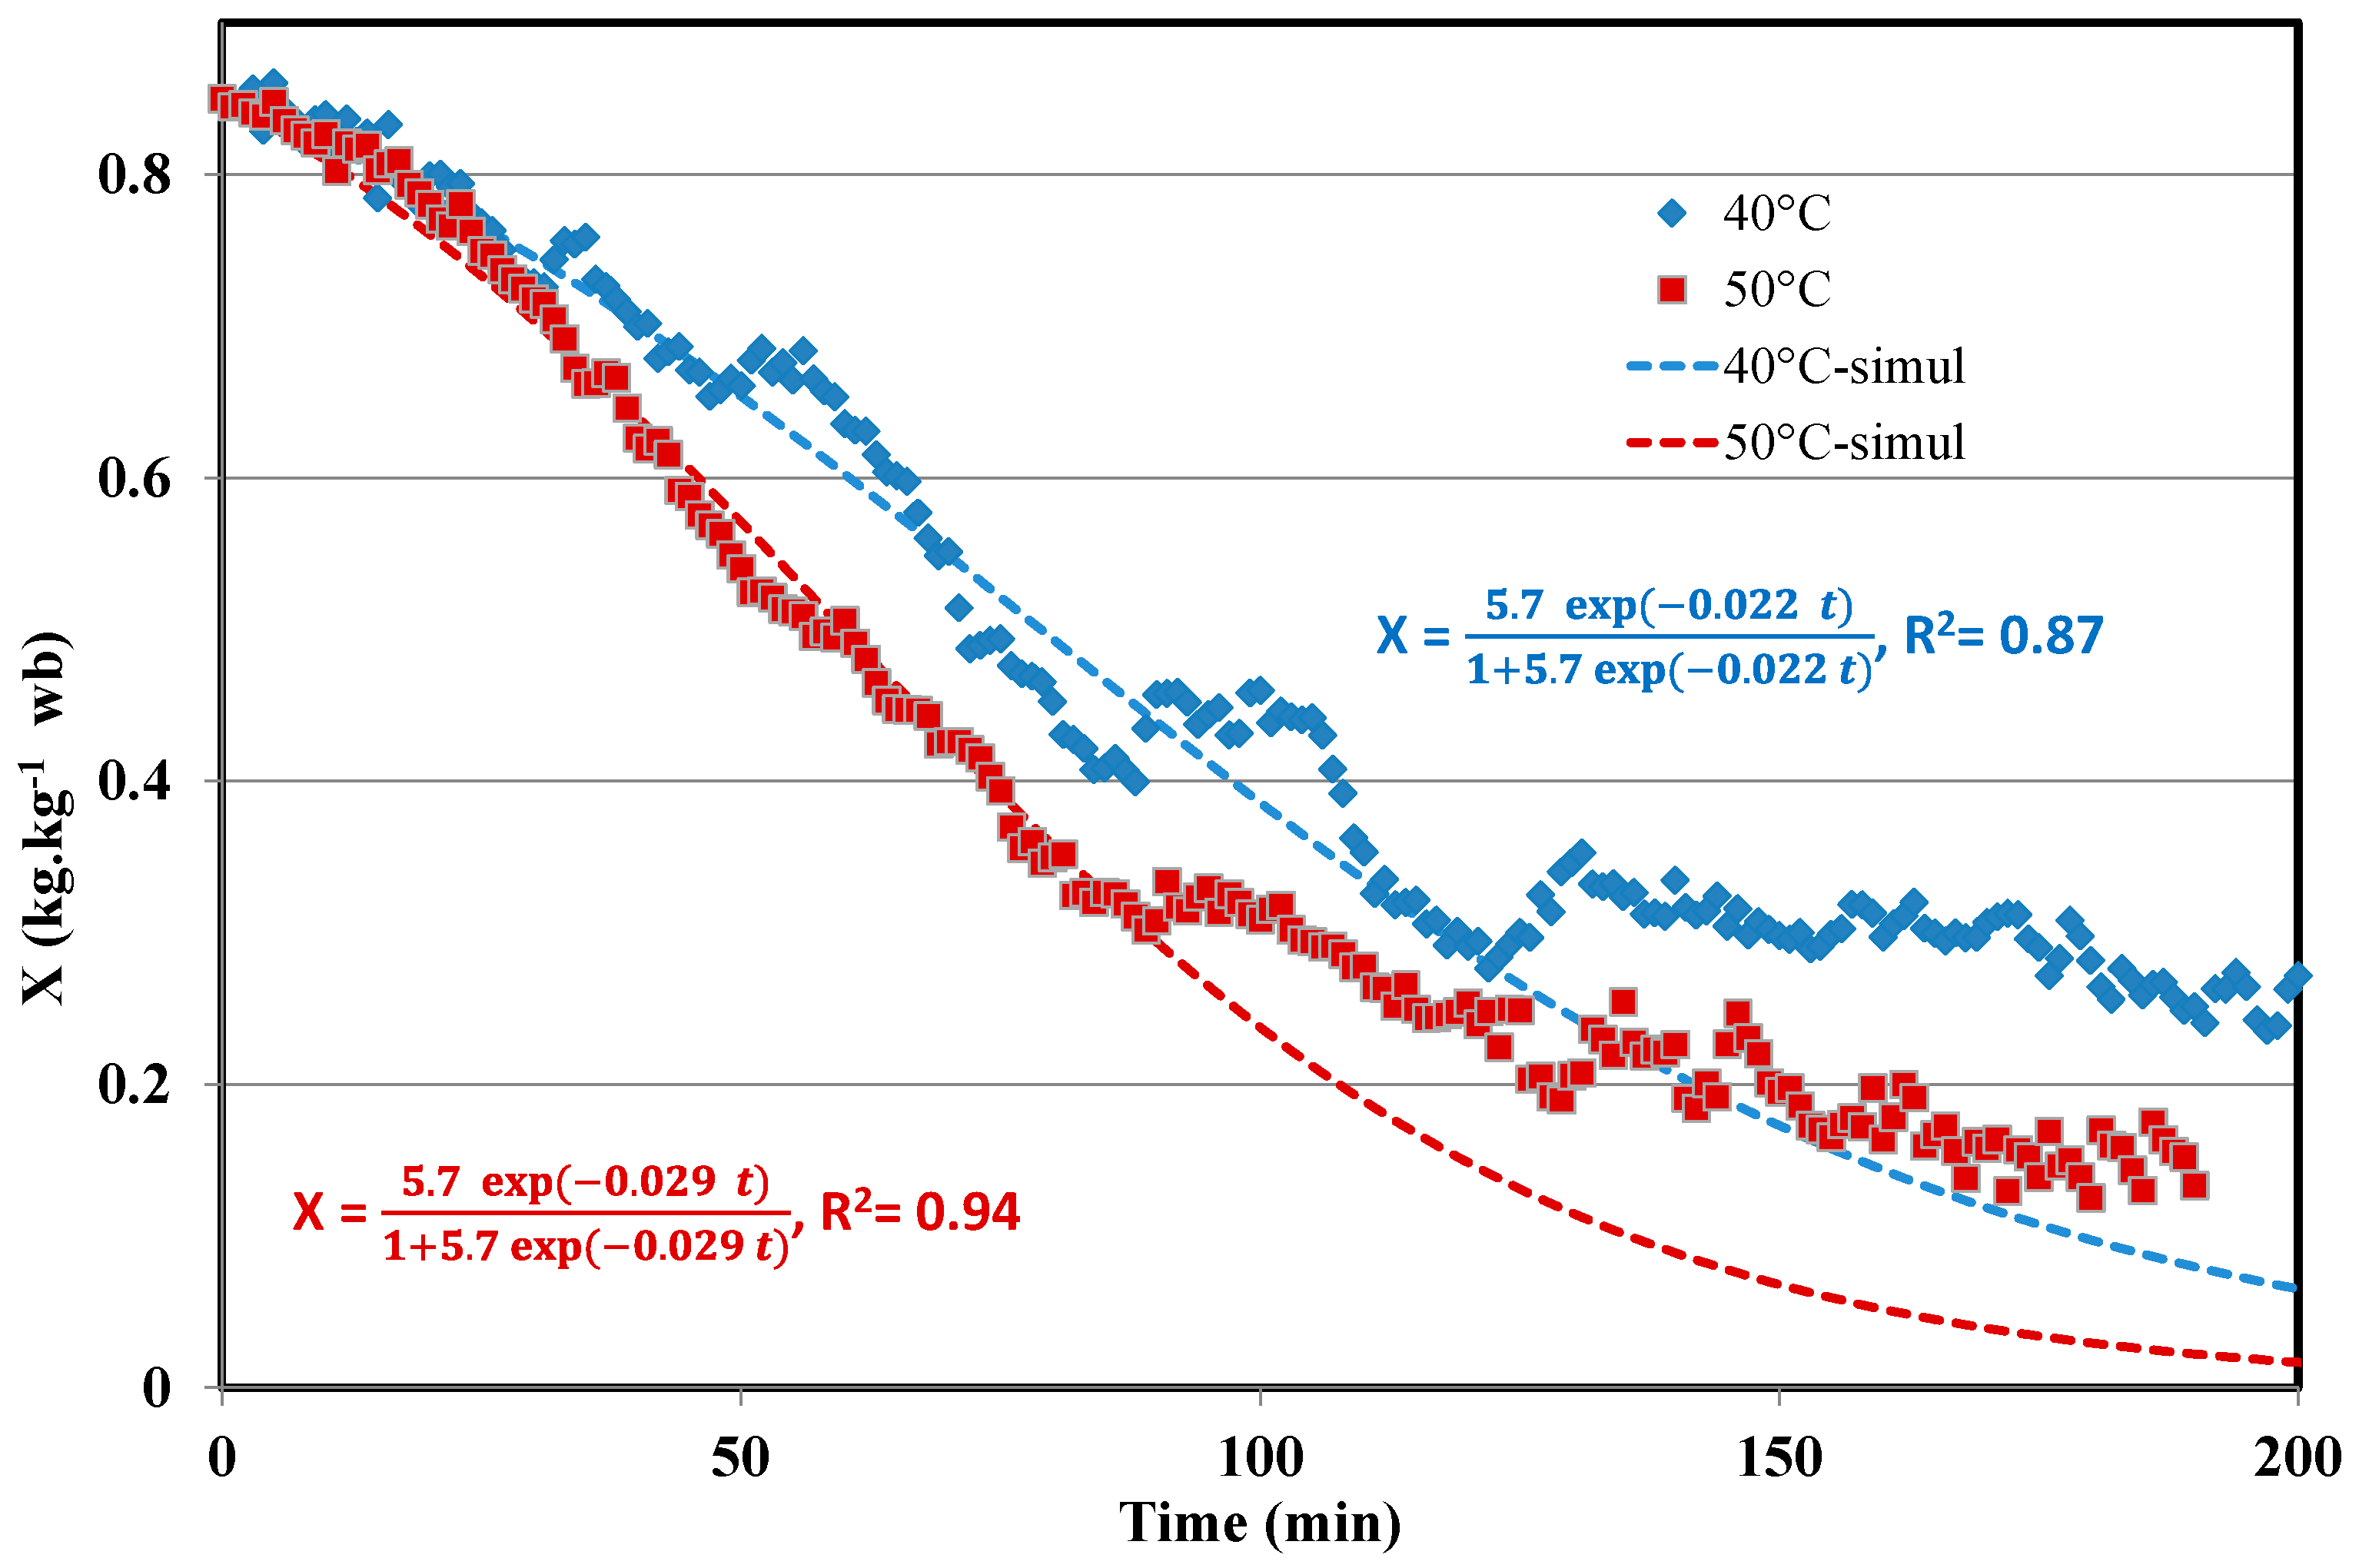
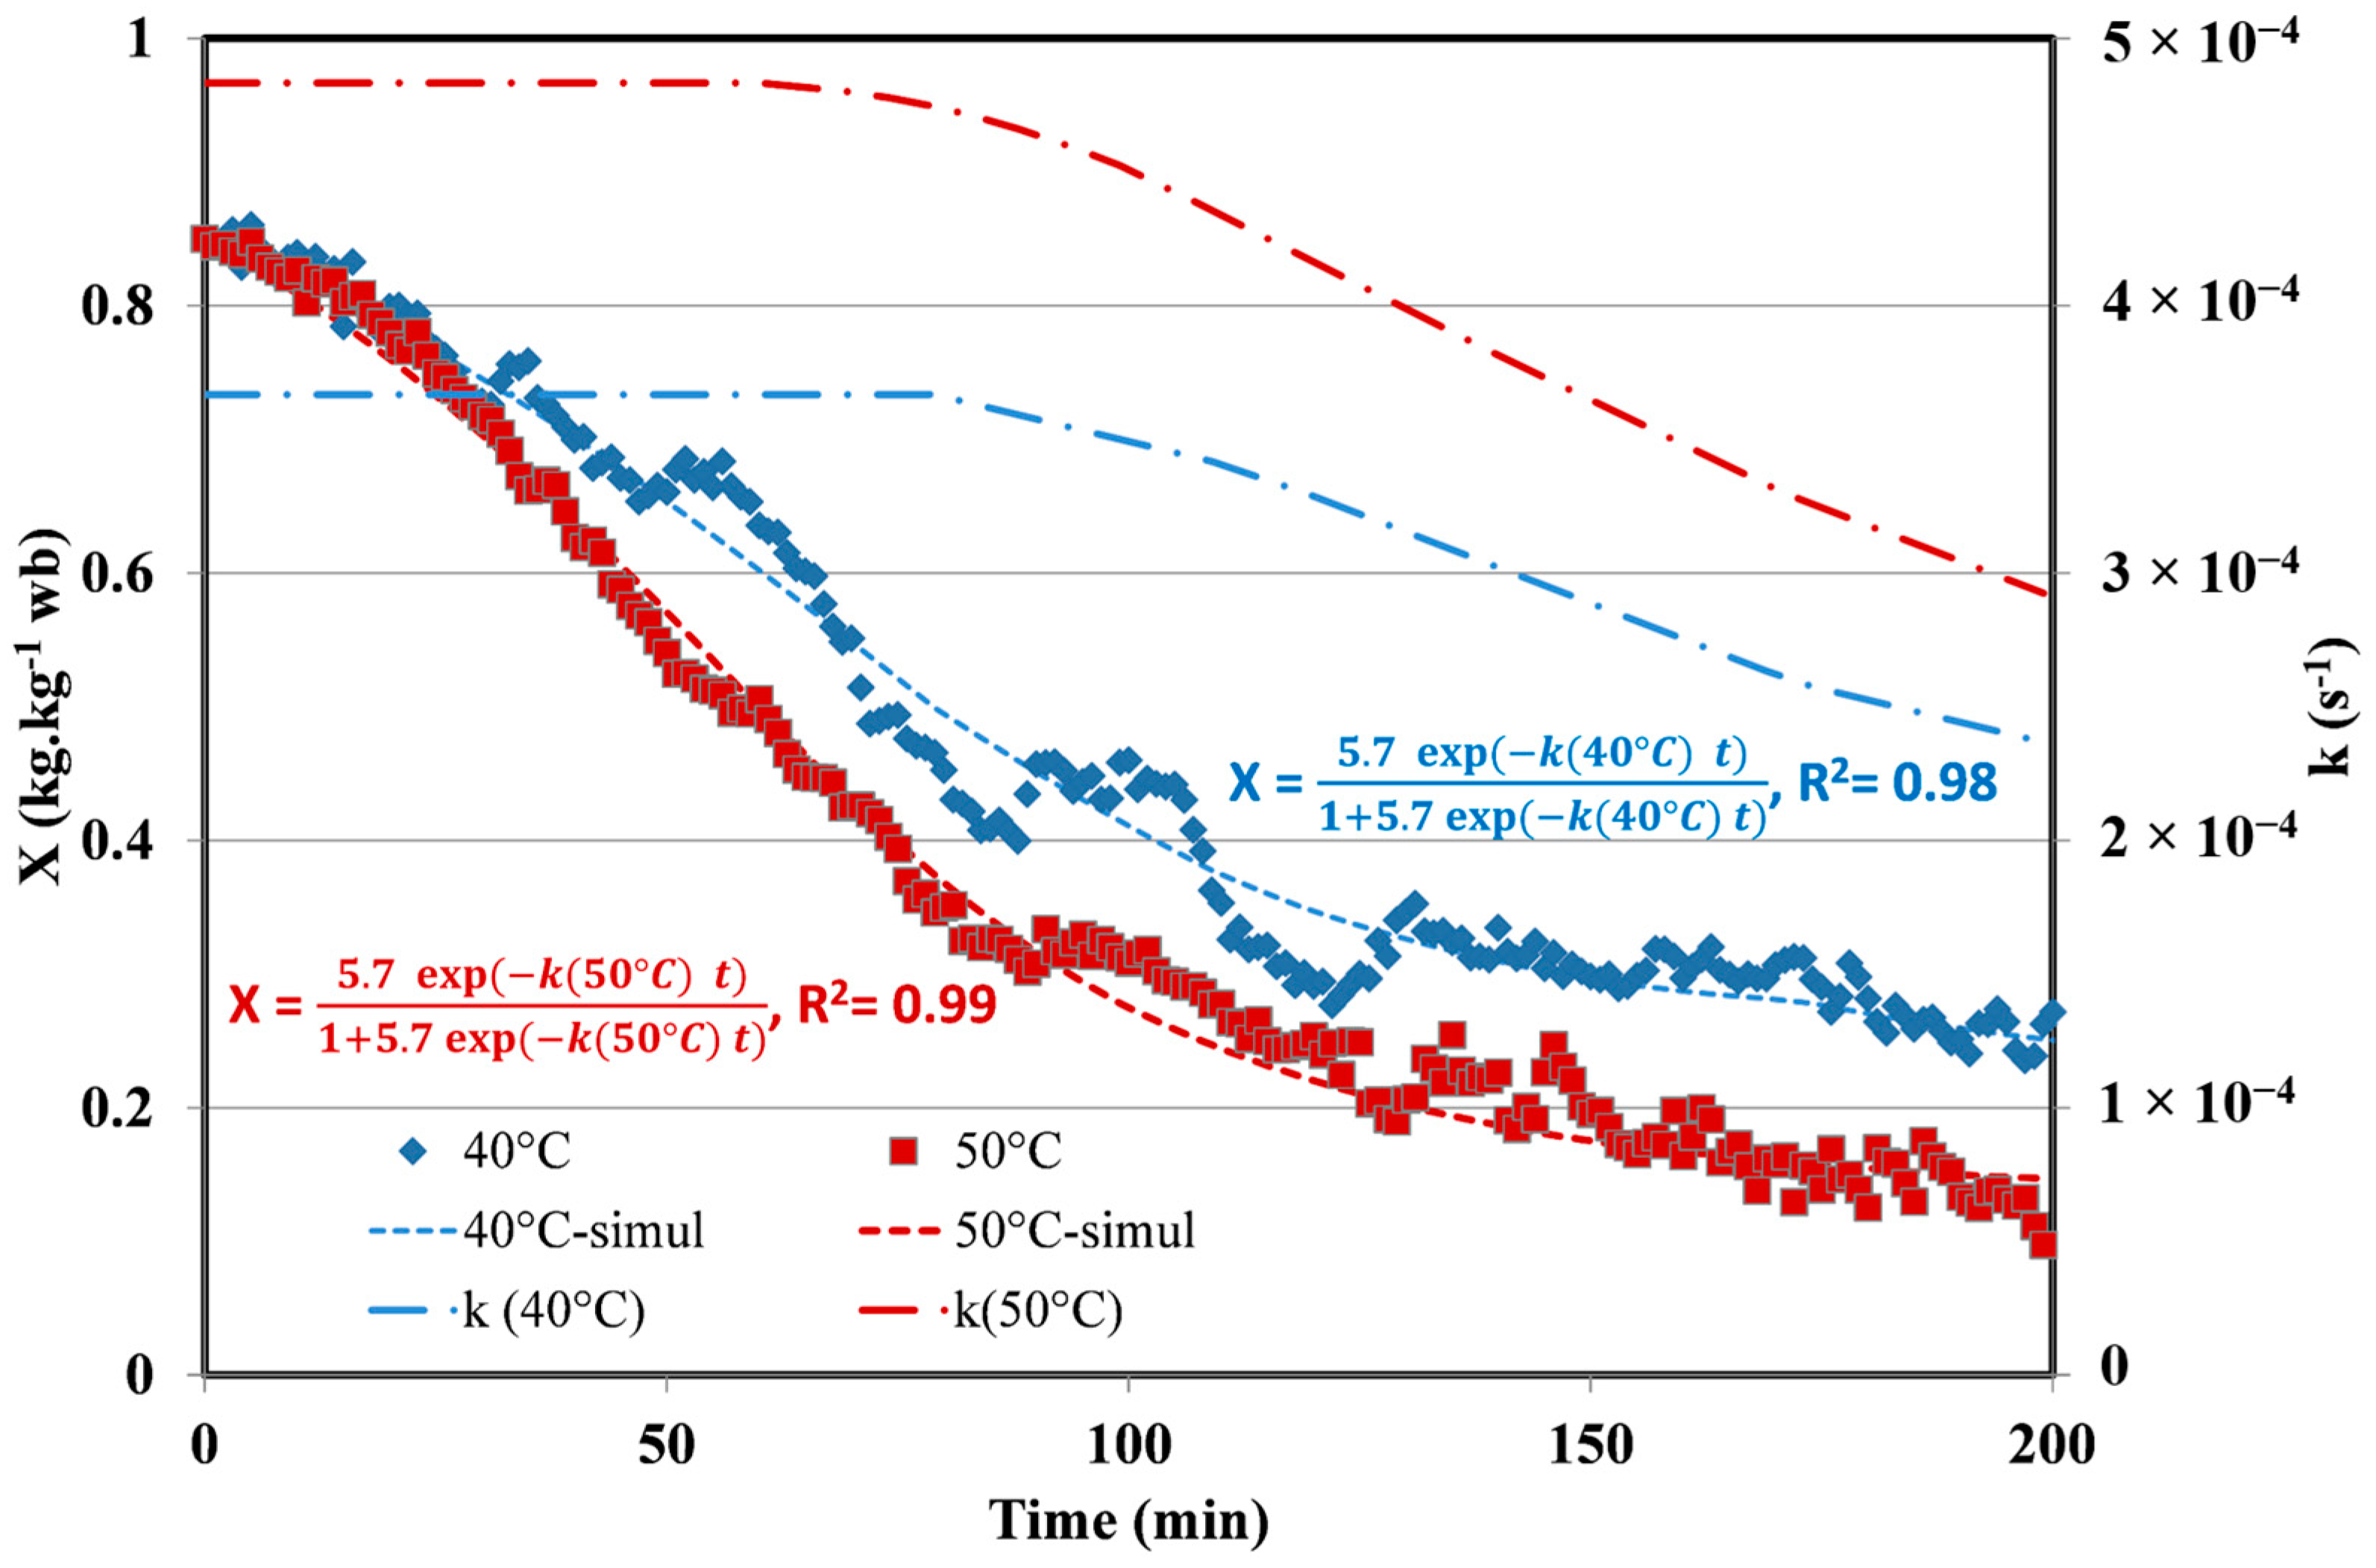
4.2. Drying Kinetics

Different kinetic models were used to fit the experimental curves obtained during the drying tests. All the studied models except the Wang and Sing model are able to approximate well the experimental drying curves. The model with the minimum of adjustable parameters, which allows fitting well the experimental data is Henderson and Pabis. Indeed, the other models have three or more adjustable coefficients and can be equal to the Henderson and Pabis model with simplification (For example, the Henderson and Pabis model is a simplification of the logarithmic model for parameter c = 0).
This model is considered to be one of the most commonly used to describe the drying of agrifood products. Nadhari et al. [39] have used this model to describe the drying of olive solid waste. They have found that experimental results are almost equal to the results calculated from the specific model. Figure 6 indicates typical experimental and predi cted (Henderson and Pabis model) curves for ISW and IS drying (operating conditions: 50 °C and 1 m/s).
The kinetic model fits well the experimental results except the drying kinetics of OMWW carried out at low temperatures (40 and 50 °C) as well as for tests performed at 60 °C. The determination coefficient (R2) was higher than 0.97. Indeed, the form of the curves is different and cannot be described by the model. In particular, the model fits well during the beginning of the drying (up to X (wb) = 0.40) as observed in Figure 7. Below X (wb) = 0.40, a discrepancy between experimental and predicted curves is observed. Such behavior may be attributed to the crust formation.
In order to take into account the crust formation, the model of Henderson and Pabis was used with a variable coefficient k (apparent kinetic constant) according to the formation and thickening of the crust (see Table 5). Figure 8 shows the experimental and calculated results of the moisture content (wet basis) and the apparent kinetic constant values evolution with time.
As Figure 8 indicates, the apparent kinetic constant is decreasing as the crust gradually thickens. For all the tests, k is constant within the first 60–70 min and then decreases linearly. In particular, it decreases about 50% (x = 0.5) for drying test carried out at 40 °C and about 25% (x = 0.25) for drying test at 50 °C. Hence, we can assume that k(t) can be expressed according to the following equation (Equation (5)):
k ( t ) = k 0   i f   t <   τ 60 70   min k 0 ( 1 x ( t τ ) ( t d τ ) )   i f   t >   τ 60 70   min
with x = 0.5 at 40 °C and 0.25 at 50 °C and td is the drying time (Table 4). For the drying tests at 60 °C, the kinetic constant according to time is closed to 0.

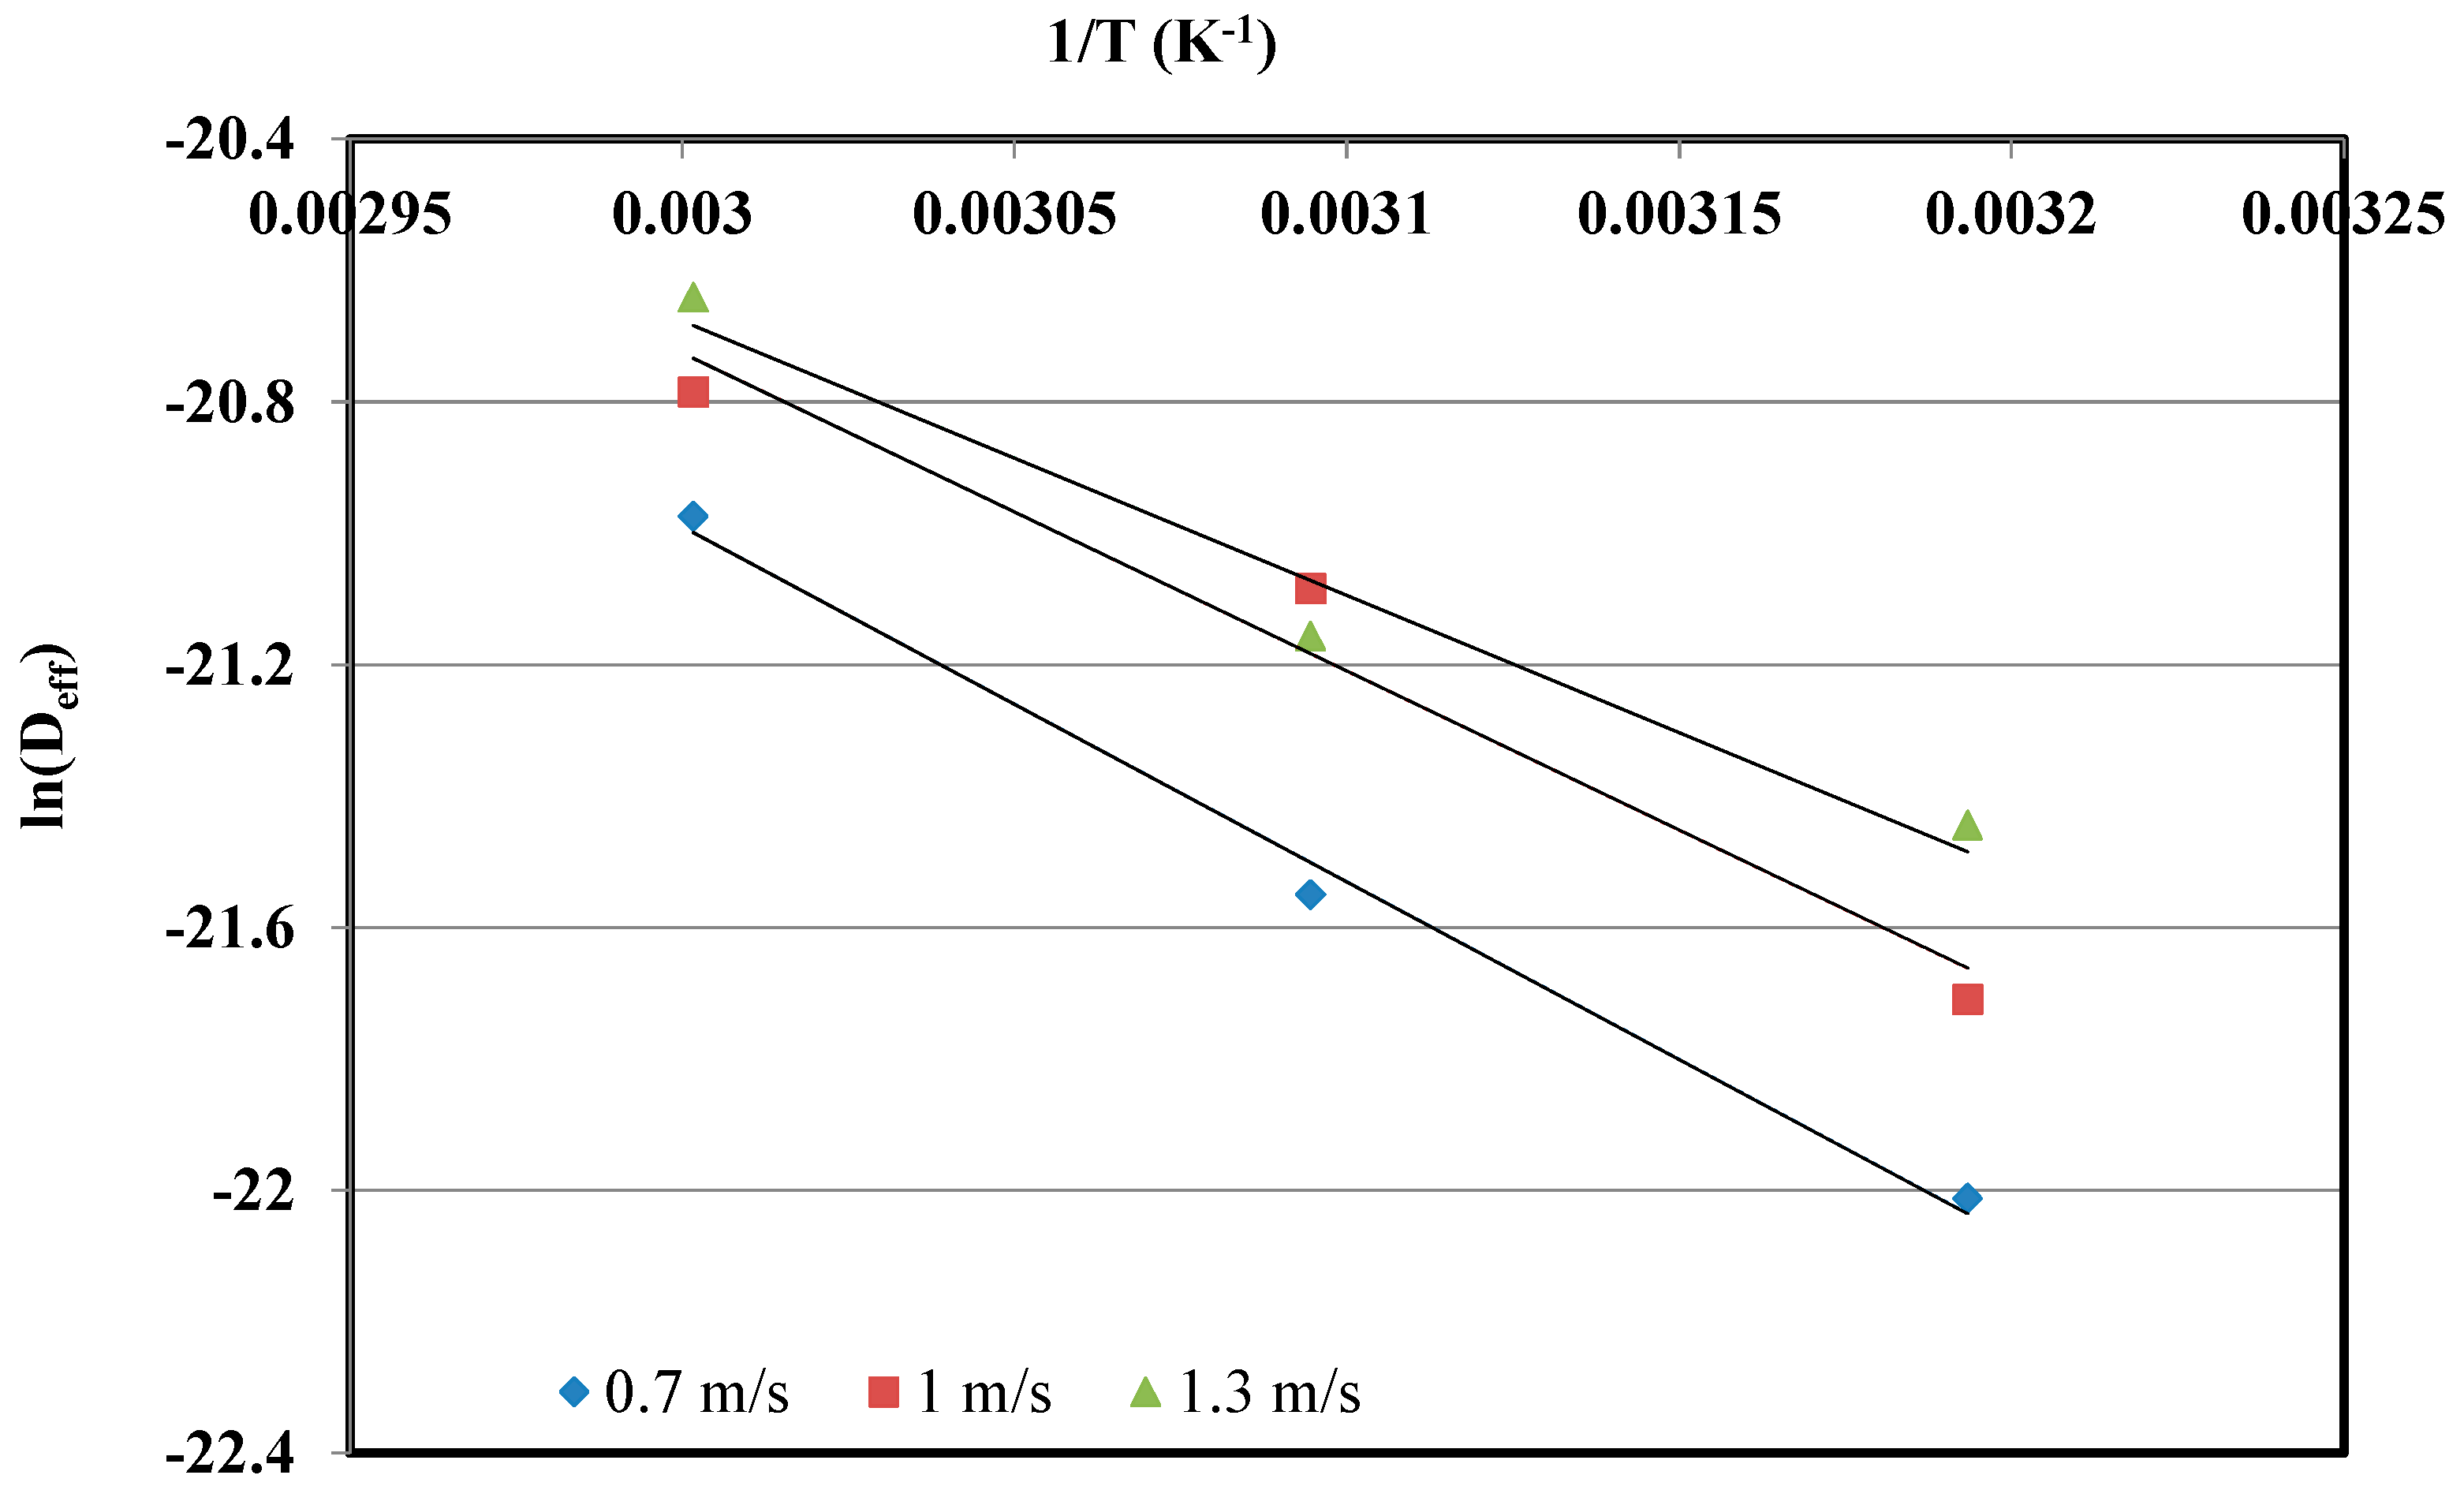
4.3. Diffusion Coefficient and Activation Energy Determination

The effective diffusion coefficient values can be estimated by plotting experimental curves of lnX according to Equation.4 as function of time. In the particular case of OMWW drying at low grade temperature, the curve is linear at the beginning and becomes a quadratic form.
Values of the diffusion coefficient of various studied cases are determined and reported in Table 6.
Table 6 shows that, diffusion coefficient increases with air temperature and velocity during drying. It ranges from 2.8 × 10⁻¹⁰ m2/s for ISW drying (0.7 m/s at 40 °C) and 1.17 × 10⁻⁹ m2/s for IS (1.3 m/s and 60 °C). The obtained values in the present study are in the same range to the ones obtained in previous studies [41,42,43,44,45]. For example, Doymaz [45] obtained effective diffusion coefficient in the range (2.6–5.7 × 10⁻⁹ m²/s) for convective drying of green beans in the temperature range of 50–70 °C. For wet olive husk drying at 80 °C, Celma et al. [26] obtained Deff ≈ 6 × 10⁻⁹ m²/s. The estimated diffusion coefficient of impregnated sawdust is higher than ISW and OMWW (for results at 60 °C). The diffusion coefficients for impregnated biomasses increase slightly with the air velocity and significantly with temperature. This phenomenon, well-known in drying processes, is due to the competition between diffusive mass transfer into the material and the transfer with air at the interface [46,47]. The comparison of the OMWW results with impregnated biomasses shows that the initial effective diffusivity is higher than the ones for ISW and IS and close to the value of theoretical diffusivity. Indeed, the diffusivity of pure water in OMWW calculated according to Stokes-Einstein equation is around 5 × 10⁻¹⁰ at 40 °C. This value strongly depends on the fluid viscosity and consequently on the temperature.
The activation energies during the drying of the different samples were also determined. Figure 9 is the plot of ln(Deff) values obtained for ISW drying versus 1/T for the three studied air velocities. The activation energy is deduced from the slope of the line (−Ea/Rg).
The calculated values of the activation energy and pre-exponential coefficient are given in Table 7 for ISW and IS drying tests. The results show that activation energy and pre-exponential factor decrease with air velocities, especially for high air velocities.
Estimated values of Ea and D0 obtained vary between 28.7 and 44.9 KJ/mol and 0.00848 and 3.0 × 10⁻⁵ m2/s, respectively. Except for OMWW, which is not a granular medium, an increase of drying air velocity leads to a slight decrease in the activation energy of both IS and ISW. Activation energy and pre-exponential constant obtained with ISW are higher than IS. This can be partially explained by the higher porosity of sawdust facilitating the mass transfer. An increase in the effective diffusion coefficient is observed according to the air temperature and also with the velocity. Nevertheless, Ea and D0 values do not always follow a direct proportional dependence with velocity of drying air. Babalis et al. have observed this phenomenon [44]. They have explained by the temperature effect, which acts in the biomass bed and at the interface (air / biomass bed) while the air velocity facilitates the mass transfer exclusively at the surface.
To the best of our knowledge, there are no available results for biomasses impregnated with OMWW in the scientific literature, but some of them present results for olive oil residues. For example, Gomez de la Cruz et al. [27] summarized different results (from several studies) for the convective drying of olive solid wastes (pomace). The activation energies ranged between 18 and 27 kJ/mol for similar operating drying conditions. The pre-exponential constants are very different since they are 10−9–10−7 range. A major result obtained during this study is the significant increase of this coefficient when the experimental tests are performed with slim samples (from 10−9 for 8 mm thick to 10−7 for 6 mm thick). Moreover, the samples were between 3 and 5 mm thick. Although no results exist for impregnated biomasses in the literature, many works have studied agri-food products. Table 8 summarizes the existing references regarding the corresponding activation energies.
It can be noted that the activation energy values obtained from this study are in the same order of magnitude as those published in literature for several food products (Ea estimated values range between 28.7 KJ/mol and 44.9 KJ/mol).

5. Conclusions

OMWW, an aqueous effluent generated by the industry of olive oil, represents a major environmental concern in the Mediterranean countries. An encouraging strategy includes OMWW impregnation on lignocellulosic biomass, followed by drying and pyrolysis steps. The drying step was examined in this Part 1 of a paper series detailing a promising strategy for the conversion of OMWW from a pollutant into other products with high added value.
During this investigation, two dry biomasses, namely sawdust and olive solid waste, were used for the OMWW impregnation. Drying tests were performed in a convective dryer. Experimental results showed that the drying time of OMWW is slowed down by the formation of a crust at the top of the liquid. However, the impregnation of OMWW on a well-calibrated and selected solid biomass accelerates the drying process. The drying kinetics of the impregnated biomasses were well fitted by the Henderson and Pabis model. However, the dying kinetics should be adjusted in order to take into account the crust thickness. The proposed method for OMWW impregnation is a promising route in order to limit the cost of the drying step. Nevertheless, particular attention should be paid to the scale up since large masses of olive mill wastewater are handled and similar surface/volume ratios should be respected.

Acknowledgments

This work was financially supported by the “PHC Utique” program of the French Ministry of Foreign Affairs and Ministry of higher education and research and the Tunisian Ministry of higher education and scientific research in the GEDURE Project (N° 34863VB; 16G1119) and the authors gratefully acknowledge the “Comité Mixte Franco-Tunisien pour la Coopération Universitaire (CMCU)” for their support. Authors would like also to thank the Region Alsace (now Grand Est) for its financial support concerning the drying unit pilot. This funding was given in the frame of the SEBASTE project (n° 131280).

Author Contributions

All authors contributed equally to the work done.

Conflicts of Interest

The authors declare no conflict of interest.

References

  1. Roig, A.; Cayuela, M.L.; Sanchez-Monedero, M.A. An overview on olive mill wastes and their valorisation methods. Waste Manag. 2006, 26, 960–969. [Google Scholar] [CrossRef] [PubMed]
  2. Souilem, S.; El-Abbassi, A.; Kiai, H.; Hafidi, A.; Sayadi, S.; Galanakis, C.M. Chapter 1—Olive oil production sector: Environmental effects and sustainability challenges. In Olive Mill Waste: Recent Advances for Sustainable Management; Galanakis, C.M., Ed.; Elsevier-Academic Press: London, United Kingdom, 2017; pp. 1–28. [Google Scholar]
  3. Zorpas, A.A.; Costa, N.C. Combination of Fenton Oxidation and Composting for the Treatment of the Olive Solid Residue and the Olive Mile Wastewater from the Olive Oil Industry in Cyprus. Biores. Technol. 2010, 101, 7984–7987. [Google Scholar] [CrossRef] [PubMed]
  4. Zorpas, A.A.; Inglezakis, J.V. Intergraded Applied Methodology for the Treatment of Heavy Polluted Waste Waters from the Olive Oil Industries. Appl. Environ. Soil Sci. 2011, 2011, 537814. [Google Scholar] [CrossRef]
  5. Kraiem, N.; Jeguirim, M.; Limousy, L.; Lajili, M.; Dorge, S.; Michelin, L.; Said, R. Impregnation of olive mill wastewater on dry biomasses: Impact on chemical properties and combustion performances. Energy 2014, 78, 479–489. [Google Scholar] [CrossRef]
  6. Del Buono, D.; Said-Pullicino, D.; Proietti, P.; Nasini, L.; Gigliotti, G. Utilization of olive husks as plant growing substrates: Phytotoxicity and plant biochemical responses. Compost Sci. Utili. 2011, 19, 52–60. [Google Scholar] [CrossRef]
  7. Peri, C.; Proietti, P. Olive mill waste and by-products. Chapter 22. In The Extra-Virgin Olive Oil Handbook; John Wiley & Sons: Hoboken, NJ, USA, 2014. [Google Scholar]
  8. Vlyssides, A.G.; Loizidou, M.; Gimouhopoulos, K.; Zorpas, A. Olive Oil Processing Wastes Production and Their Characteristics in Relation to Olive Oil Extraction Methods. Fresen. Environ. Bul. 1988, 7, 308–313. [Google Scholar]
  9. Regni, L.; Gigliotti, G.; Nasini, L.; Proietti, P. Reuse of olive mill waste as soil amendment. In Olive Mill Waste: Recent Advances for Sustainable Management; Galanakis, C.M., Ed.; Elsevier-Academic Press: London, United Kingdom, 2016; Chapter 5; pp. 97–117. [Google Scholar]
  10. Vlyssides, A.G.; Loizidou, M.; Zorpas, A.A. Characteristics of solid residues from olive oil processing as a bulking material for co-composting with industrial wastewater. J. Environ. Sci. Health Part A 1999, 34, 737–748. [Google Scholar] [CrossRef]
  11. Gotsi, M.; Kalogerakis, N.; Psillakis, E.; Samaras, P.; Mantzavinos, D. Electrochemical oxidation of olive oil mill wastewaters. Water Res. 2015, 39, 4117–4187. [Google Scholar] [CrossRef] [PubMed]
  12. El-Gohary, F.A.; Badawy, M.I.; El-Khateeb, M.A.; El-Kalliny, A.S. Integrated treatment of olive mill wastewater (OMW) by the combination of Fenton’s reaction and anaerobic treatment. J. Hazard. Mater. 2009, 162, 1536–1541. [Google Scholar] [CrossRef] [PubMed]
  13. Christoforou, E.; Fokaides, P.A. A review of olive mill solid wastes to energy utilization techniques. Waste Manag. 2016, 49, 346–363. [Google Scholar] [CrossRef] [PubMed]
  14. Jeguirim, M.; Chouchène, A.; Réguillon, A.F.; Trouvé, G.; Le Buzit, G. A new valorisation strategy of olive mill wastewater: Impregnation on sawdust and combustion. Resour. Conserv. Recycl. 2012, 59, 4–8. [Google Scholar] [CrossRef]
  15. McKendry, P. Energy production from biomass (part 2): Conversion technologies. Bioresour. Technol. 2002, 83, 47–54. [Google Scholar] [CrossRef]
  16. Goyal, H.B.; Seal, D.; Saxena, R.C. Biofuels from thermo-chemical conversion of renewable resources. Renew. Sust. Energy Rev. 2008, 12, 504–517. [Google Scholar] [CrossRef]
  17. Manyà, J.J. Pyrolysis for biochar purposes: A review to establish current knowledge gaps and research needs. Environ. Sci. Technol. 2012, 46, 7939–7954. [Google Scholar] [CrossRef] [PubMed]
  18. Röser, D.; Mola-Yudego, B.; Sikanen, L.; Prinz, R.; Gritten, D.; Emer, B.; Väätainen, K.; Erkkilä, A. Natural drying treatments during seasonal storage of wood for bioenergy in different European locations. Biomass Bioenergy 2011, 35, 4238–4247. [Google Scholar] [CrossRef]
  19. Ertekin, C.; Firat, M.Z. A comprehensive review of thin-layer drying models used in agricultural products. Crit. Rev. Food Sci. Nutr. 2017, 57, 701–717. [Google Scholar] [CrossRef] [PubMed]
  20. Koukouch, A.; Idlimam, A.; Asbik, M.; Sarh, B.; Izrar, B.; Bostyn, S.; Bah, A.; Ansari, O.; Zegaoui, O.E.; Amine, A. Experimental determination of the effective moisture diffusivity and activation energy during convective solar drying of olive pomace waste. Renew. Energy 2017, 101, 565–574. [Google Scholar] [CrossRef]
  21. Doymaz, I.; Gorel, O.; Akgun, N.A. Drying Characteristics of the Solid By-Product of Olive Oil Extraction. Biosyst. Eng. 2004, 88, 213–219. [Google Scholar] [CrossRef]
  22. Celma, A.R.; Rojas, S.; López, F.; Montero, I.; Miranda, T. Thin-layer drying behaviour of sludge of olive oil extraction. J. Food Eng. 2007, 80, 1261–1271. [Google Scholar] [CrossRef]
  23. Montero, I.; Miranda, M.T.; Sepúlveda, F.J.; Arranz, J.I.; Rojas, C.V.; Nogales, S. Solar Dryer Application for Olive Oil Mill Wastes. Energies 2015, 8, 14049–14063. [Google Scholar] [CrossRef]
  24. Liébanes, M.D.; Aragón, J.M.; Palancar, M.C.; Arévalo, G.; Jiménez, D. Fluidized bed drying of 2-phase olive oil mill by-products. Dry. Technol. 2006, 24, 1609–1618. [Google Scholar] [CrossRef]
  25. Göǧüş, F.; Maskan, M. Air drying characteristics of solid waste (pomace) of olive oil processing. J. Food Eng. 2016, 72, 378–382. [Google Scholar] [CrossRef]
  26. Celma, A.R.; Rojas, S.; Lopez-Rodriguez, F. Mathematical modelling of thin layer infrared drying of wet olive husk. Chem. Eng. Process. Process Intens. 2009, 47, 1810–1818. [Google Scholar] [CrossRef]
  27. Gómez-de la Cruz, F.J.; Casanova-Peláez, P.J.; López-García, R.; Cruz-Peragón, F. Review of the drying kinetics of olive oil mill wastes: Biomass recovery. BioResources 2015, 10, 6055–6080. [Google Scholar] [CrossRef]
  28. Ratti, C. Hot air and freeze-drying of high-value foods: A review. J. Food Eng. 2001, 4, 311–319. [Google Scholar] [CrossRef]
  29. Nourhène, B.; Mohammed, K.; Nabil, K. Experimental and mathematical investigations of convective solar drying of four varieties of olive leaves. Food Bioprod. Process. 2008, 86, 176–184. [Google Scholar] [CrossRef]
  30. Celma, A.R.; Cuadros, F.; López-Rodríguez, F. Convective drying characteristics of sludge from treatment plants in tomato processing industries. Food Bioprod. Process. 2012, 90, 224–234. [Google Scholar] [CrossRef]
  31. Meisami-Asl, E.; Rafiee, S.; Keyhani, A.; Tabatabaee, A. Mathematical Modeling of Moisture Content of Apple Slices (Var. Golab) During Drying. Pak. J. Nutr. 2009, 8, 804–809. [Google Scholar] [CrossRef]
  32. Jayas, D.S.; Cenkowski, S.; Pabis, S.; Muir, W.E. Review of Thin-Layer Drying and Wetting Equations. Dry Technol. 1991, 9, 551–588. [Google Scholar] [CrossRef]
  33. Wang, C.; Wang, F.; Yang, Q.; Liang, R. Thermogravimetric studies of the behavior of wheat straw with added coal during combustion. Biomass Bioenergy 2009, 33, 50–56. [Google Scholar] [CrossRef]
  34. Yaldýz, O.; Ertekýn, C. Thin Layer Solar Drying of Some Vegetables. Dry Technol. 2001, 19, 583–597. [Google Scholar] [CrossRef]
  35. Diamante, L.M.; Munro, P.A. Mathematical modelling of the thin layer solar drying of sweet potato slices. Sol Energy 1993, 51, 271–276. [Google Scholar] [CrossRef]
  36. Midilli, A.; Kucuk, H.; Yapar, Z.A. New Model for Single-Layer Drying. Dry Technol. 2002, 20, 1503–1513. [Google Scholar] [CrossRef]
  37. Zhang, Q.; Litchfield, J.B. An Optimization of Intermittent Corn Drying in a Laboratory Scale Thin Layer Dryer. Dry Technol. 1991, 9, 383–395. [Google Scholar] [CrossRef]
  38. Overhults, D.G.; White, G.M.; Hamilton, H.E.; Ross, I.J. Drying Soybeans with Heated Air. Trans ASAE 1973, 16, 0112–0113. [Google Scholar] [CrossRef]
  39. Nadhari, W.N.A.W.; Hashim, R.; Sulaiman, O.; Jumhuri, N. Drying kinetics of oil palm trunk waste in control atmosphere and open air convection drying. Int. J. Heat Mass Transf. 2014, 68, 14–20. [Google Scholar] [CrossRef]
  40. Montero, I.; Miranda, T.; Arranz, J.I.; Rojas, C.V. Thin layer drying kinetics of by-products from olive oil processing. Int. J. Mol. Sci. 2011, 12, 7885–7897. [Google Scholar] [CrossRef] [PubMed]
  41. Senadeera, W.; Bhandari, B.R.; Young, G.; Wijesinghe, B. Influence of shapes of selected vegetable materials on drying kinetics during fluidized bed drying. J. Food Eng. 2003, 58, 277–283. [Google Scholar] [CrossRef]
  42. Crank, J. The Mathematics of Diffusion; Oxford University Press: London, United Kingdom, 1975. [Google Scholar]
  43. Zogzas, N.P.; Maroulis, Z.B.; Marinos-Kouris, D. Moisture Diffusivity Data Compilation in Foodstuffs. Dry Technol. 1996, 14, 2225–2253. [Google Scholar] [CrossRef]
  44. Babalis, S.J.; Belessiotis, V.G. Influence of the drying conditions on the drying constants and moisture diffusivity during the thin-layer drying of figs. J Food Eng. 2004, 65, 449–458. [Google Scholar] [CrossRef]
  45. Doymaz, I. Drying behaviour of green beans. J. Food Eng. 2005, 69, 161–165. [Google Scholar] [CrossRef]
  46. Dinçer, I.; Zanfirescu, C. Drying Phenomena: Theory and Applications; John Wiley & Sons: Chichester, UK, 2015. [Google Scholar]
  47. Ichikawa, Y.; Selvadura, A.P. Transport Phenomena in Porous Media: Aspects of Micro/Macro Behaviour; Springer Science & Business Media: New York, NY, USA, 2012. [Google Scholar]
  48. Doymaz, İ. Convective air drying characteristics of thin layer carrots. J. Food Eng. 2004, 61, 359–364. [Google Scholar] [CrossRef]
  49. Falade, K.O.; Abbo, E.S. Air-drying and rehydration characteristics of date palm (Phoenix dactylifera L.) fruits. J. Food Eng. 2007, 79, 724–730. [Google Scholar] [CrossRef]
  50. Gupta, P.; Ahmed, J.; Shivhare, U.S.; Raghavan, G.S.V. Drying Characteristics of Red Chilli. Dry Technol. 2002, 20, 1975–1987. [Google Scholar] [CrossRef]
  51. Bon, J.; Simal, S.; Rosselló, C.; Mulet, A. Drying characteristics of hemispherical solids. J. Food Eng. 1997, 34, 109–122. [Google Scholar] [CrossRef]
  52. Doymaz, İ. Air-drying characteristics of tomatoes. J. Food Eng. 2007, 78, 1291–1297. [Google Scholar] [CrossRef]
Figure 1. (a) OMWW before treatment in room temperature and (b) after 2 h in an oven at 80 °C.
Energies 10 01423 g001
Figure 2. Experimental procedure of the dryer.
Energies 10 01423 g002
Figure 3. Sensor positioning flowchart.
Energies 10 01423 g003
Figure 4. Moisture ratio (X wb) evolution for airflow conditions 60 °C and 0.7 m/s.
Energies 10 01423 g004
Figure 5. Moisture ratio (X) evolution of OMWW for 1 m/s of air velocity.
Energies 10 01423 g005
Figure 6. Examples of experimental evolution and predicted moisture ratio X (wb) with the model of Henderson and Pabis for ISW and IS with drying conditions: T = 50 °C and V = 1 m/s.
Energies 10 01423 g006
Figure 7. Experimental evolution and predicted moisture ratio X (wb) with the model of Henderson and Pabis for OMWW with drying conditions: T = 40 and 50 °C and V = 1 m/s.
Energies 10 01423 g007
Figure 8. Simulated moisture ratio X (wb) and apparent kinetic constant (k) for OMWW with drying conditions: T = 40 and 50 °C and V = 1 m/s.
Energies 10 01423 g008
Figure 9. Effective diffusivity of ISW versus temperature at various air velocities (Arrhenius-type relationship).
Energies 10 01423 g009
Table 1. OMWW physicochemical properties.
ParameterValue
pH4.80
Electrical conductivity (ms/cm)9.20
Water content (%)78.99
Total Dissolved salts (g/L)16.5
Biological oxygen demand in 5 days (g/L)37.5
Chemical oxygen demand (g/L)197
Potassium (g/L)5.9
Calcium (g/L)0.71
Magnesium (g/L)2.6
Sodium (g/L)1.7
Ammonium: N-NH4+ (g/L)1.8
Table 2. Proximate analysis of OMSW and sawdust (wet basis).
Sample CharacteristicSawdustOMSW
Moisture (%)9.710
Bulk density (kg·m−3)103529
Low Heating Value (MJ·kg−1)16.416.9
Fixed Carbon (%)14.525.5
Volatile matter (%)75.261.5
Ashwb (%)0.63
Table 3. Kinetic models for thin layer drying.
Model Name and ReferencesEquation (X (db))
Henderson and Pabis [31]X = aexp(−kt)
Logarithmic [30]X = aexp(−kt) + c
Wang and Singh [32]X = 1 + at + bt2
Diffusion approach [33]X = aexp(−kt) + (1 − a)exp(−kbt)
Simplified Fick diffusion [34]X = aexp(−c(t/L2))
Midilli–Kucuk [35]X = aexp(−ktn) + bt
Page [36,37]X = aexp(−ktn)
Table 4. Drying time versus drying air conditions.
ConditionsBiomasses Drying Time (min)
Temperature (°C)Velocity (m/s)OMWWISWIS
400.7353221188
1.0313167122
1.3274121121
500.7238140136
1.01639295
1.313110597
600.71246051
1.01165248
1.31075149
Table 5. Results of drying curve parameters described by Henderson and Pabis model.
T (°C)V (m/s)OMWWISWIS
40 °C0.7a = 5.67 (r2 = 0.99)
k0 = 3.0 × 10⁻⁴ s−1
td = 353 min, x = 0.51
a = 1.80 (r2 = 0.99)
k = 1.7 × 10⁻⁴ s−1
 
a = 2.30 (r2 = 0.96)
k = 2.7 × 10⁻⁴ s−1
 
1.0a = 5.67 (r2 = 0.98)
k0 = 3.5 × 10⁻⁴ s−1
td = 313 min, x = 0.49
a = 1.80 (r2 = 0.96)
k = 2.3 × 10⁻⁴ s−1
 
a = 2.30 (r2 = 0.95)
k = 3.5 × 10⁻⁴ s−1
 
1.3a = 5.67 (r2 = 0.98)
k0 = 3.7 × 10⁻⁴ s−1
td = 274 min, x = 0.51
a = 1.80 (r2 = 0.94)
k = 3.0 × 10⁻⁴ s−1
 
a = 2.30 (r2 = 0.98)
k = 3.7 × 10⁻⁴ s−1
 
50 °C0.7a = 5.67 (r2 = 0.98)
k0 = 3.2 × 10⁻⁴ s−1
td = 238 min, x = 0.80
a = 1.80 (r2 = 0.98)
k = 2.7 × 10⁻⁴ s−1
 
a = 2.30 (r2 = 0.95)
k = 3.0 × 10⁻⁴ s−1
 
1.0a = 5.67 (r2 = 0.99)
k0 = 4.7 × 10⁻⁴ s−1
td = 238 min, x = 0.72
a = 1.80 (r2 = 0.97)
k = 4.3 × 10⁻⁴ s−1
 
a = 2.30 (r2 = 0.97)
k = 4.5 × 10⁻⁴ s−1
 
1.3a = 5.67 (r2 = 0.99)
k0 = 5.0 × 10⁻⁴ s−1
td = 238 min, x = 0.83
a = 1.80 (r2 = 0.92)
k = 4.0 × 10⁻⁴ s−1
 
a = 2.30 (r2 = 0.97)
k = 4.2 × 10⁻⁴ s−1
 
60°C0.7a = 5.67 (r2 = 0.97)
k = 5.0 × 10⁻⁴ s−1
 
a = 1.80 (r2 = 0.97)
k = 4.8 × 10⁻⁴ s−1
 
a = 2.30 (r2 = 0.95)
k = 5.8 × 10⁻⁴ s−1
 
1.0a = 5.67 (r2 = 0.95)
k = 5.2 × 10⁻⁴ s−1
 
a = 1.80 (r2 = 0.91)
k = 5.8 × 10⁻⁴ s−1
 
a = 2.30 (r2 = 0.99)
k = 7.2 × 10⁻⁴ s−1
 
1.3a = 5.67 (r2 = 0.92)
k = 5.3 × 10⁻⁴ s−1
 
a = 1.80 (r2 = 0.93)
k = 6.7 × 10⁻⁴ s−1
 
a = 2.30 (r2 = 0.97)
k = 7.2 × 10⁻⁴ s−1
 
Table 6. Effective diffusion coefficients for different drying conditions Deff × 1010 m2/s.
T (°C)V (m/s)OMWWISWIS
40 °C0.74.82.84.4
1.05.73.75.7
1.36.04.96.0
50 °C0.75.24.44.9
1.07.67.07.3
1.38.16.56.8
60 °C0.78.17.89.4
1.08.49.411.7
1.38.610.911.7
For comparison, the initial values are given in italic.
Table 7. Activation energy and pre-exponential constant.
ISWIS
V (m/s)0.71.01.30.71.01.3
Ea (KJ/mol)44.940.234.732.931.228.7
104D0 (m2/s)84.820.22.91.20.90.3
Table 8. Activation energy for various products drying.
ProductEa (KJ/mol)Reference
Carott28.36[48]
Red Date 35.17[49]
Chilli pepper41.95[50]
Potatoes20.00[51]
Tomatoes32.94[52]

