4.1. Case Study: Italian Electricity Market
As a case study, we have used our approach to define a model of the Italian energy market. ToU-based tariffs in Italy are defined over three standard price bands, roughly corresponding to office hours, evenings-and-Saturdays and nights-and-Sundays. The total amount of hours for the three bands is
,
and
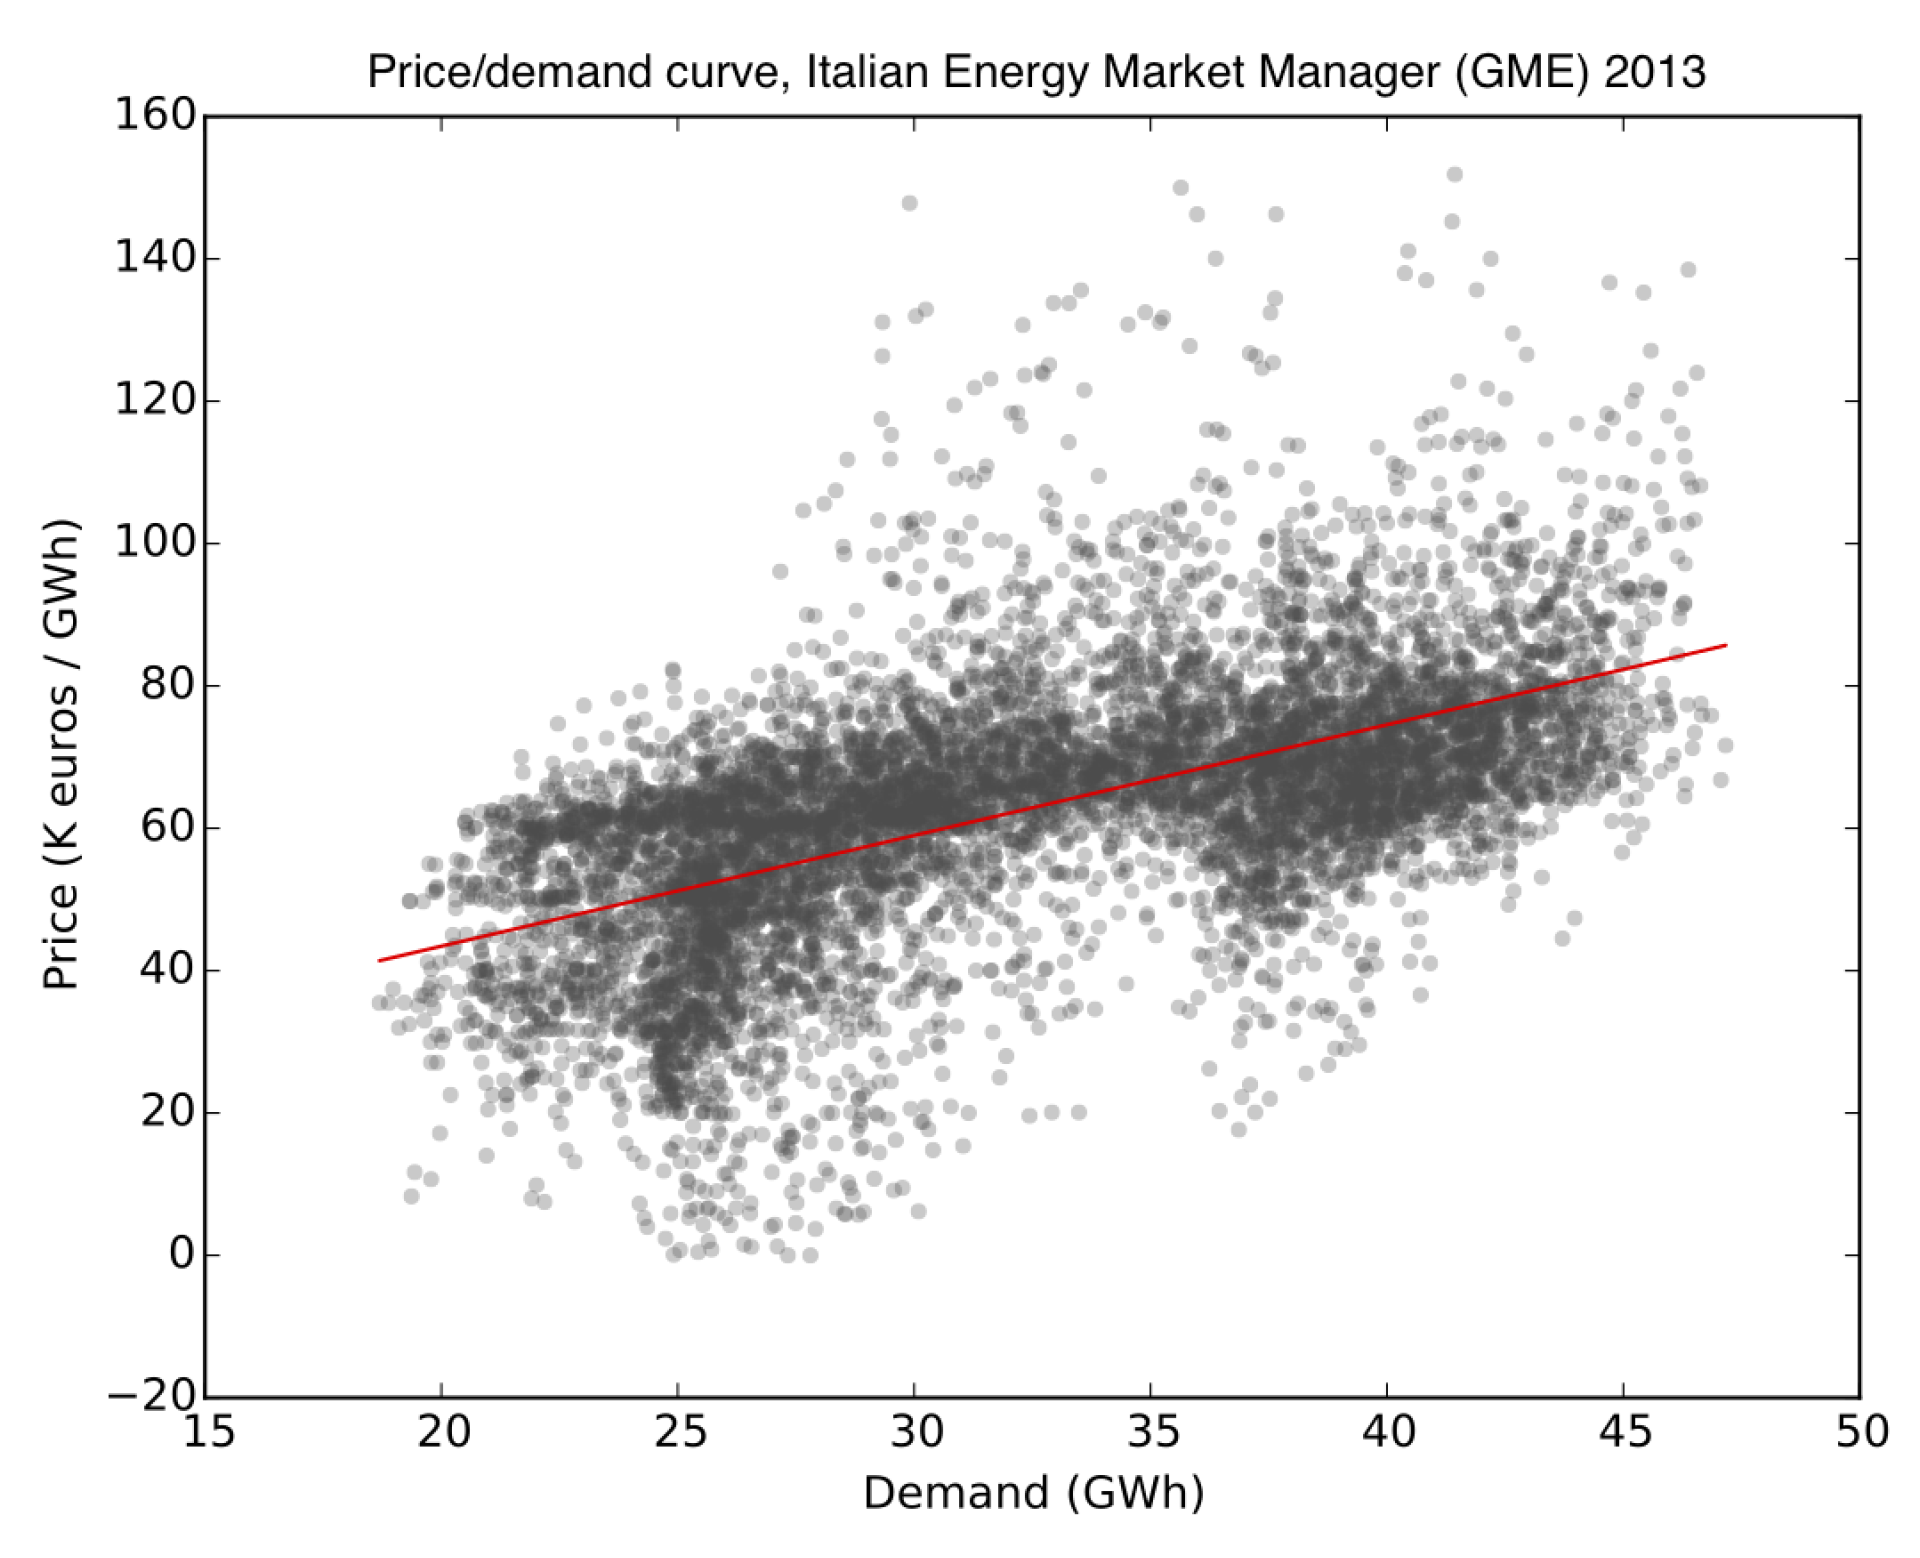
. The coefficients for the wholesale demand-price relation have been obtained based on data from the national energy market management corporation (see
http://www.mercatoelettrico.org/En/Default.aspx, GME): in particular, we have
~1.39 K€/GWh
2 and
K€/GWh.
There are no standard and well-accepted values for the risk aversion coefficients of customers. For this reason, in our model, the risk aversion coefficient
has been estimated based on data from [
25,
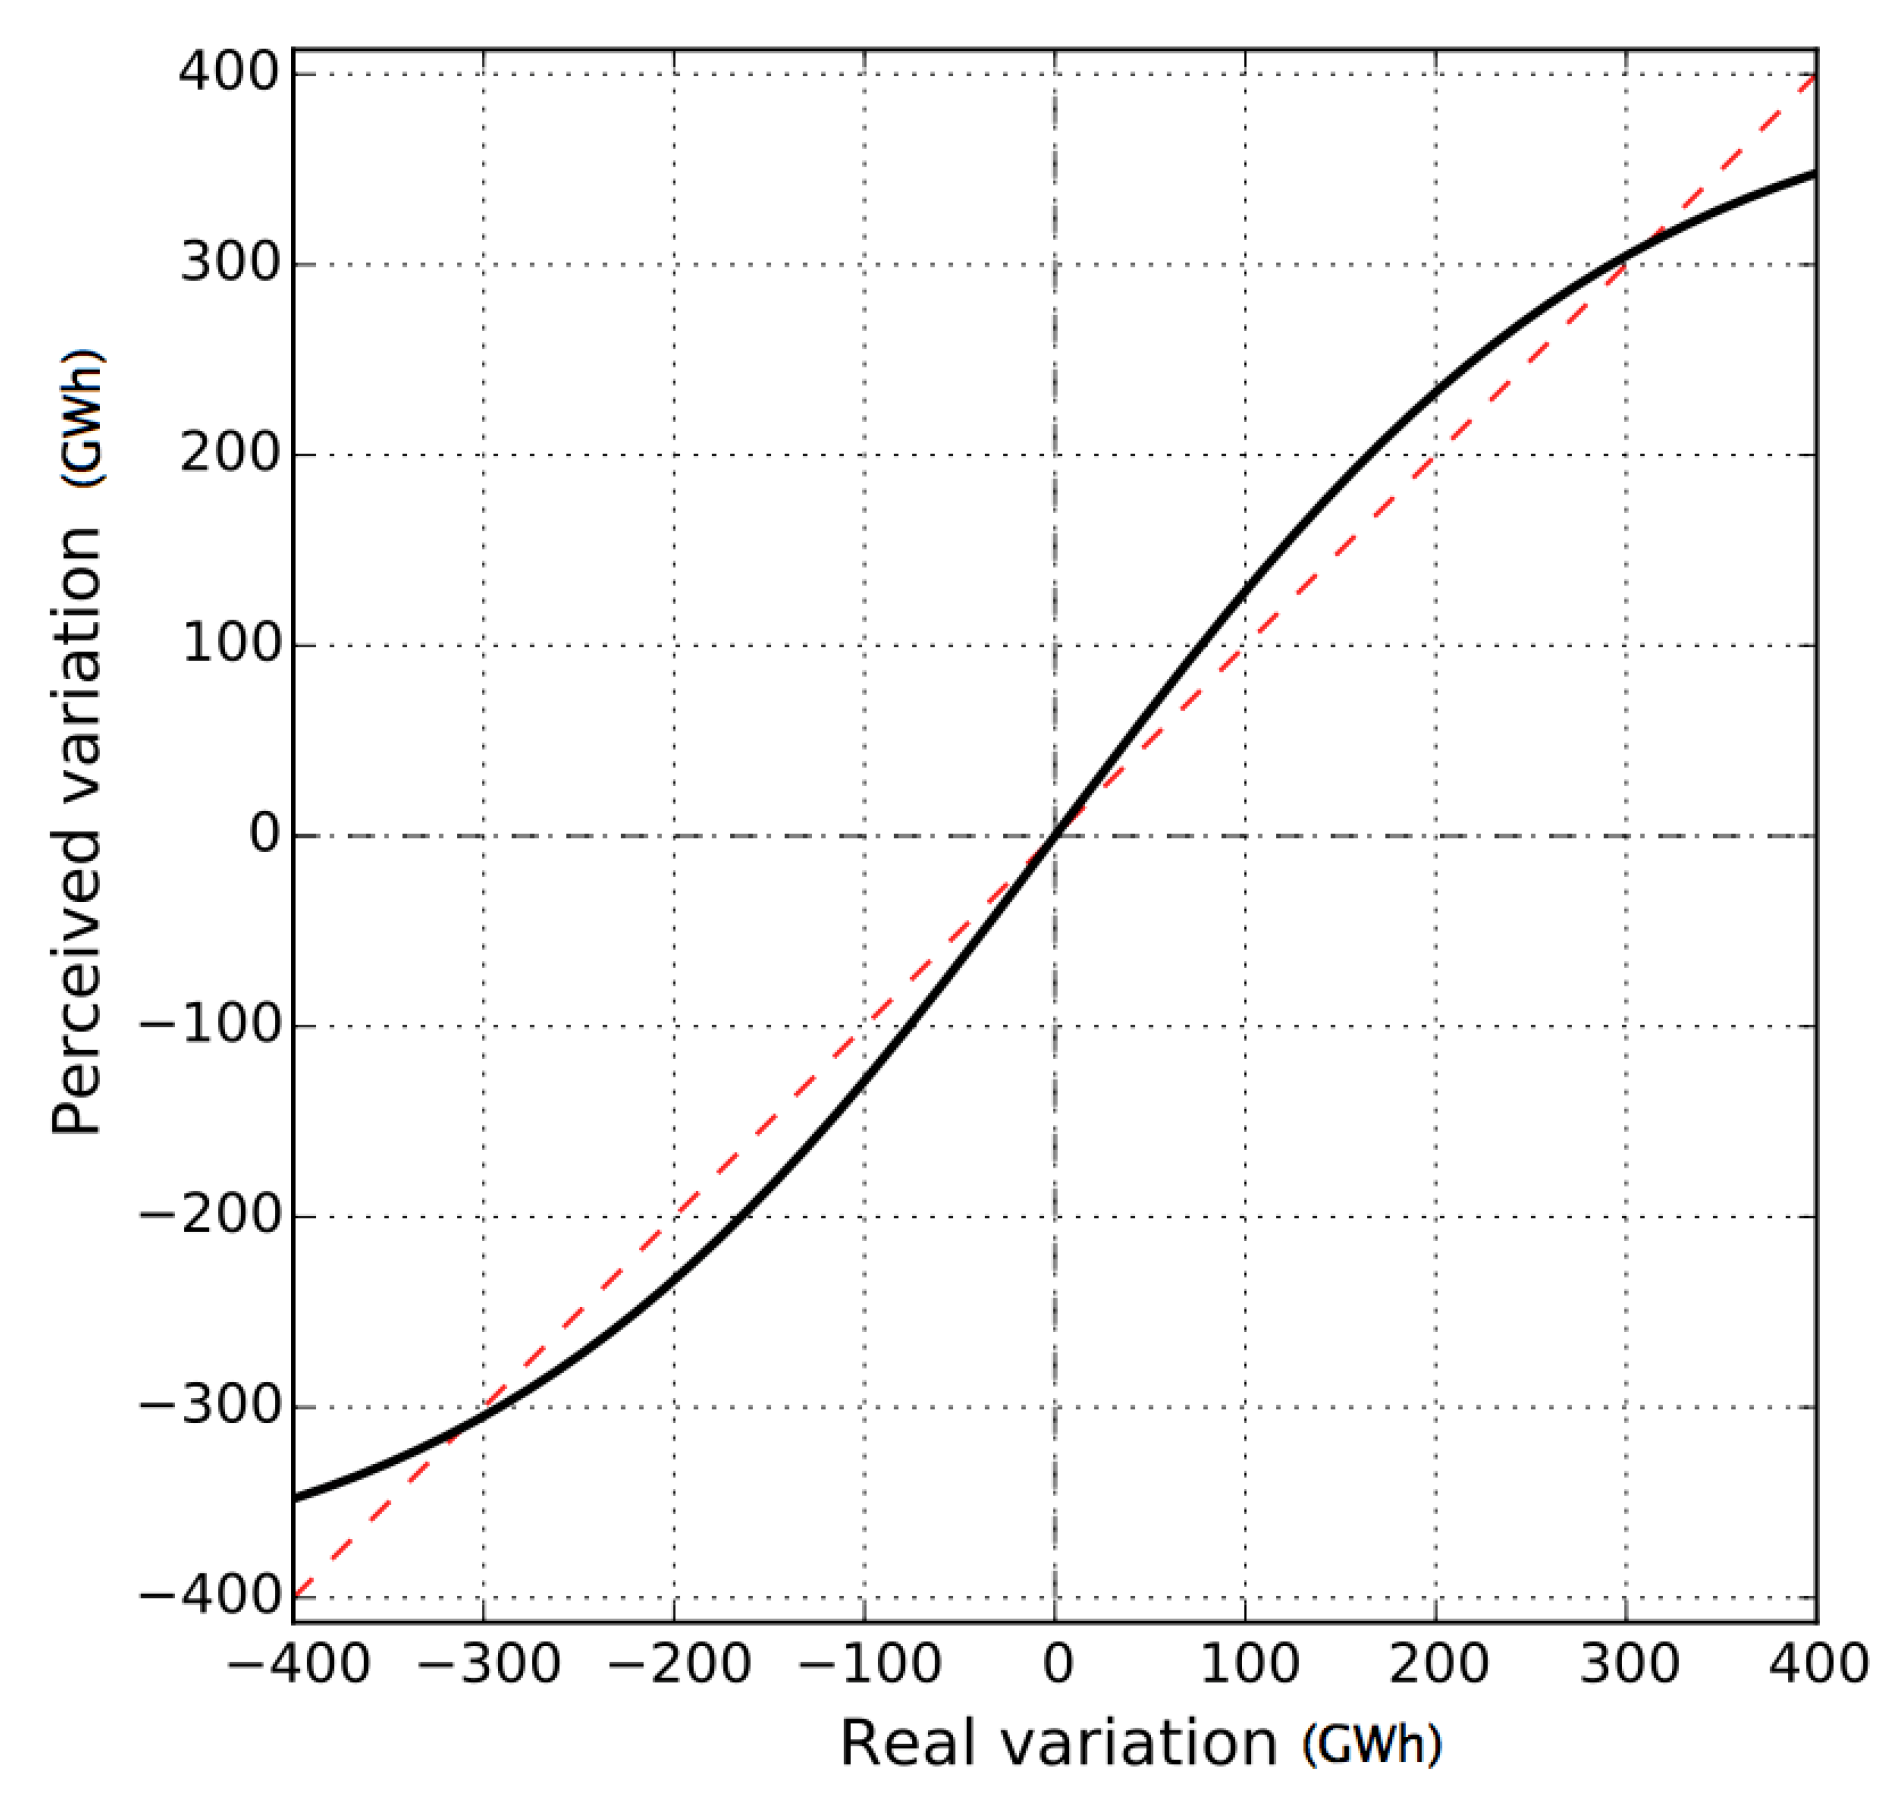
30], and it is equal to 0.95 for all customers. For the perception model, we have
and
for all classes: intuitively, this means that an average consumption of 400 W on a price band is considered large and that customers tend to over-estimate demand variations (i.e., the real variation is typically smaller than expected). We model the relation using a different function (i.e., sigmoid), since the approach from [
23] had poor predictive performance outside of the range considered in the original experiments. However, we took care of choosing the parameters of our sigmoid function to approximate the behavior observed in [
23] on real data.
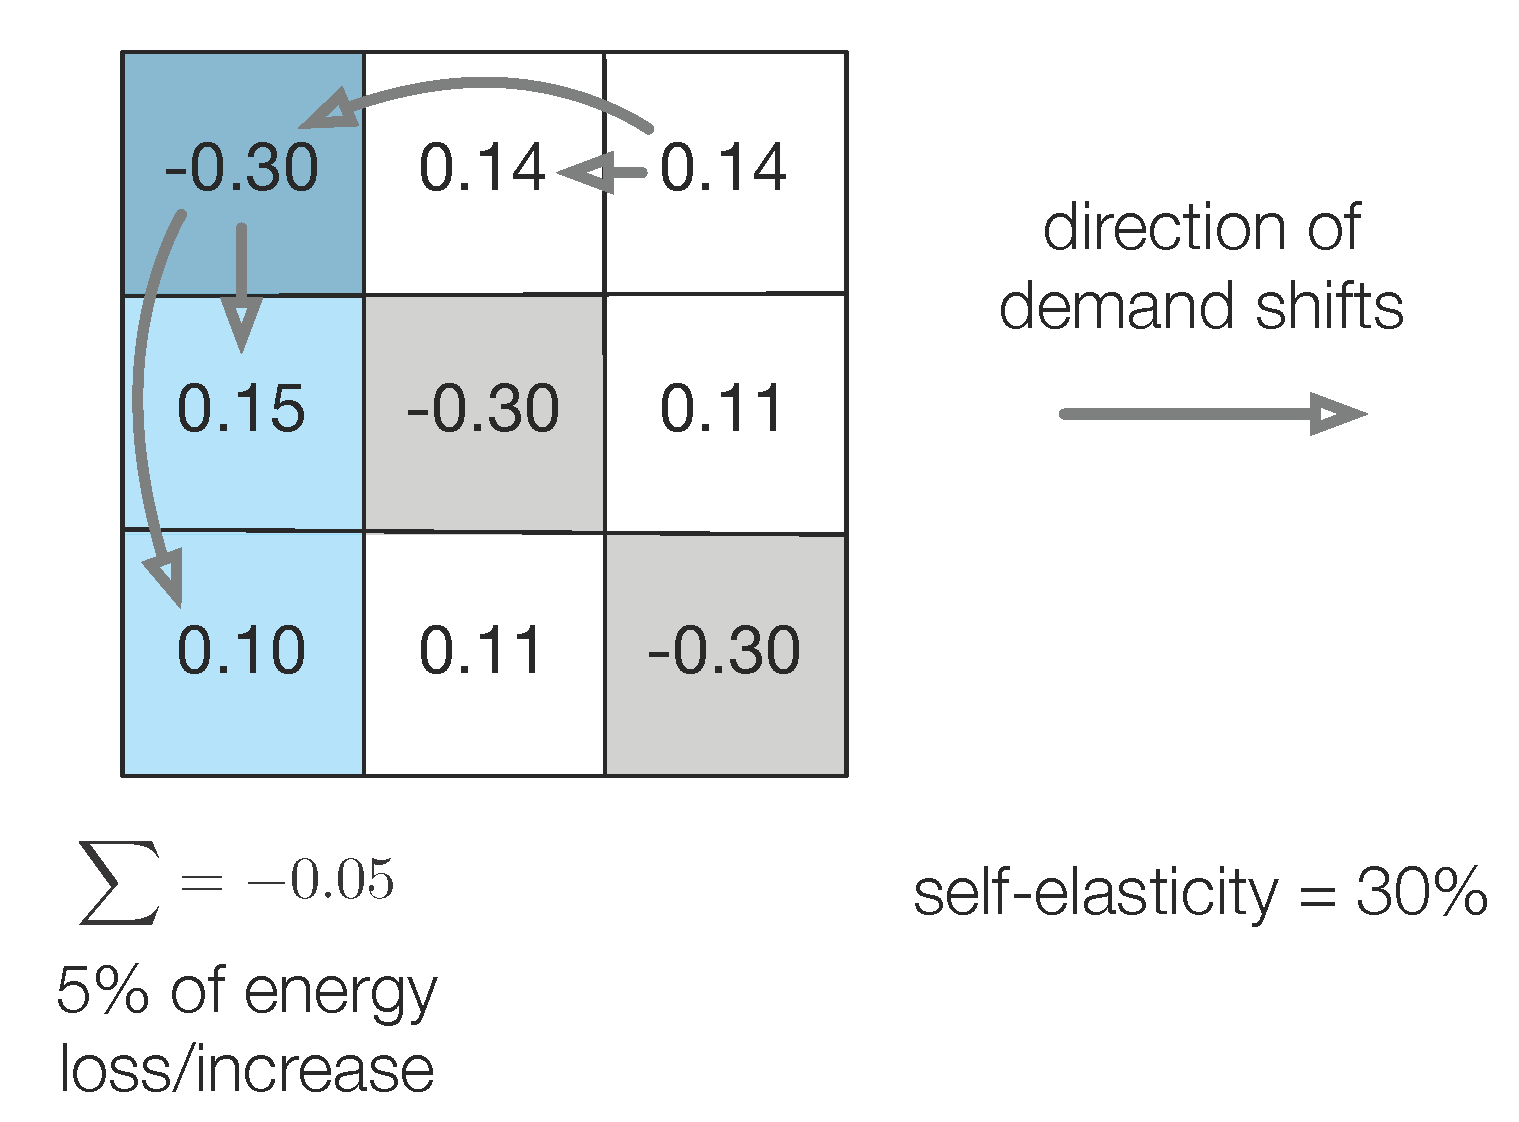
The coefficients of the cross-elasticity matrix have been defined based on previous cited literature [
15] and data and parameters from the National Institute of Statistics (ISTAT) census: in particular, families with fewer members are assumed to be more flexible and more prone to change their net consumption in the case of price changes, i.e., to have a more significant loss factor. By having access to real individual data, it would in principle be possible to derive more precise cross-elasticity coefficients for the matrix through empirical model learning [
29]. We have differentiated the deterministic and stochastic cases by using different coefficients of the cross-elasticity matrix and the loss factor for each class of users.
For the residential stochastic model, we focus on residential energy consumption, which represents ~22% of the national energy demand from GME and the (Italian) National Transmission Network TERNA (available at
http://www.terna.it/it-it/sistemaelettrico/statisticheeprevisioni/datistorici.aspx) data. The baseline consumption has been obtained by subtracting the residential consumption from the national consumption reported in the GME data. The non-residential consumption has a peak in
, while residential consumption is more relevant in
and
. For the experiments, we consider five customer classes corresponding to families with varying number of members, namely 1 (single persons), 2 (couples), 3, 4 and 5 or more. The number of customers per class and their total consumption come from public data from the Italian national institute for statistics (available at
http://dati-censimentopopolazione.istat.it, ISTAT). ISTAT data show the distribution of families, according to their number, on the total number of Italian families. The correlation between family size and annual consumption is calculated in [
31] starting from the ISTAT census data. In this way, the GME annual residential consumption data were first distributed on the five macro classes according to the distribution of consumption in the three time slots. The subdivision of consumption for the different types of users is estimated based on the convenience of consumption displacement in the least expensive bands. Based on residential data from the Authority for Electricity, Gas and Water System (available at
http://www.autorita.energia.it/allegati/seminari/141006.pdf), it is possible to observe that the distribution is more diversified in small families than in the more numerous families. Therefore, we have estimated the consumption distribution over the price bands based on public data, with larger families having flatter profiles.
For the deterministic model, we use data from the Italian Confederation of Enterprises, Professional Activities and Self-employment Confcommercio-REF estimates based on the Authorities for electricity gas and water system AEEGinvestigations data (available at
http://www.confcommercio.it/documents/10180/4298586/ICET+n.+4-2014/). We consider five macro-users, which were obtained by aggregating the characteristics of consumption data from enterprises in Italy during one year (2014). The research identifies five types of activity profiles: hotel, restaurant, bar, food retail, non-food retail. The weights are estimated by Confcommercio and REF based on the distribution of the annual consumption of the five classes on total consumption. These weights are also applied to calculate the average consumption profile per time slot in relation to the electricity price in the same time slot. We calibrate also different coefficients of elasticity by using literature data and realistic data of consumption flexibility. The risk aversion coefficient corresponds always to a saving factor, but in this case, when it is reached, the consumer changes the rate in a deterministic way, rather than in a stochastic one. We do not use, in this case, the perception accuracy from residential model. The macro-users of the deterministic model have a total conservation of demand consumption (i.e., loss factor = 0%).
All of the customer consumption and elasticity parameters are summarized in
Table 2 for the stochastic model and in
Table 3 for the deterministic model.
The overhead electricity costs are assumed to be 250 K€/GWh for all price bands, and they have been estimated based on data from the Authority for Electricity, Gas and Water System (available at
http://www.autorita.energia.it/it/prezzi.htm).
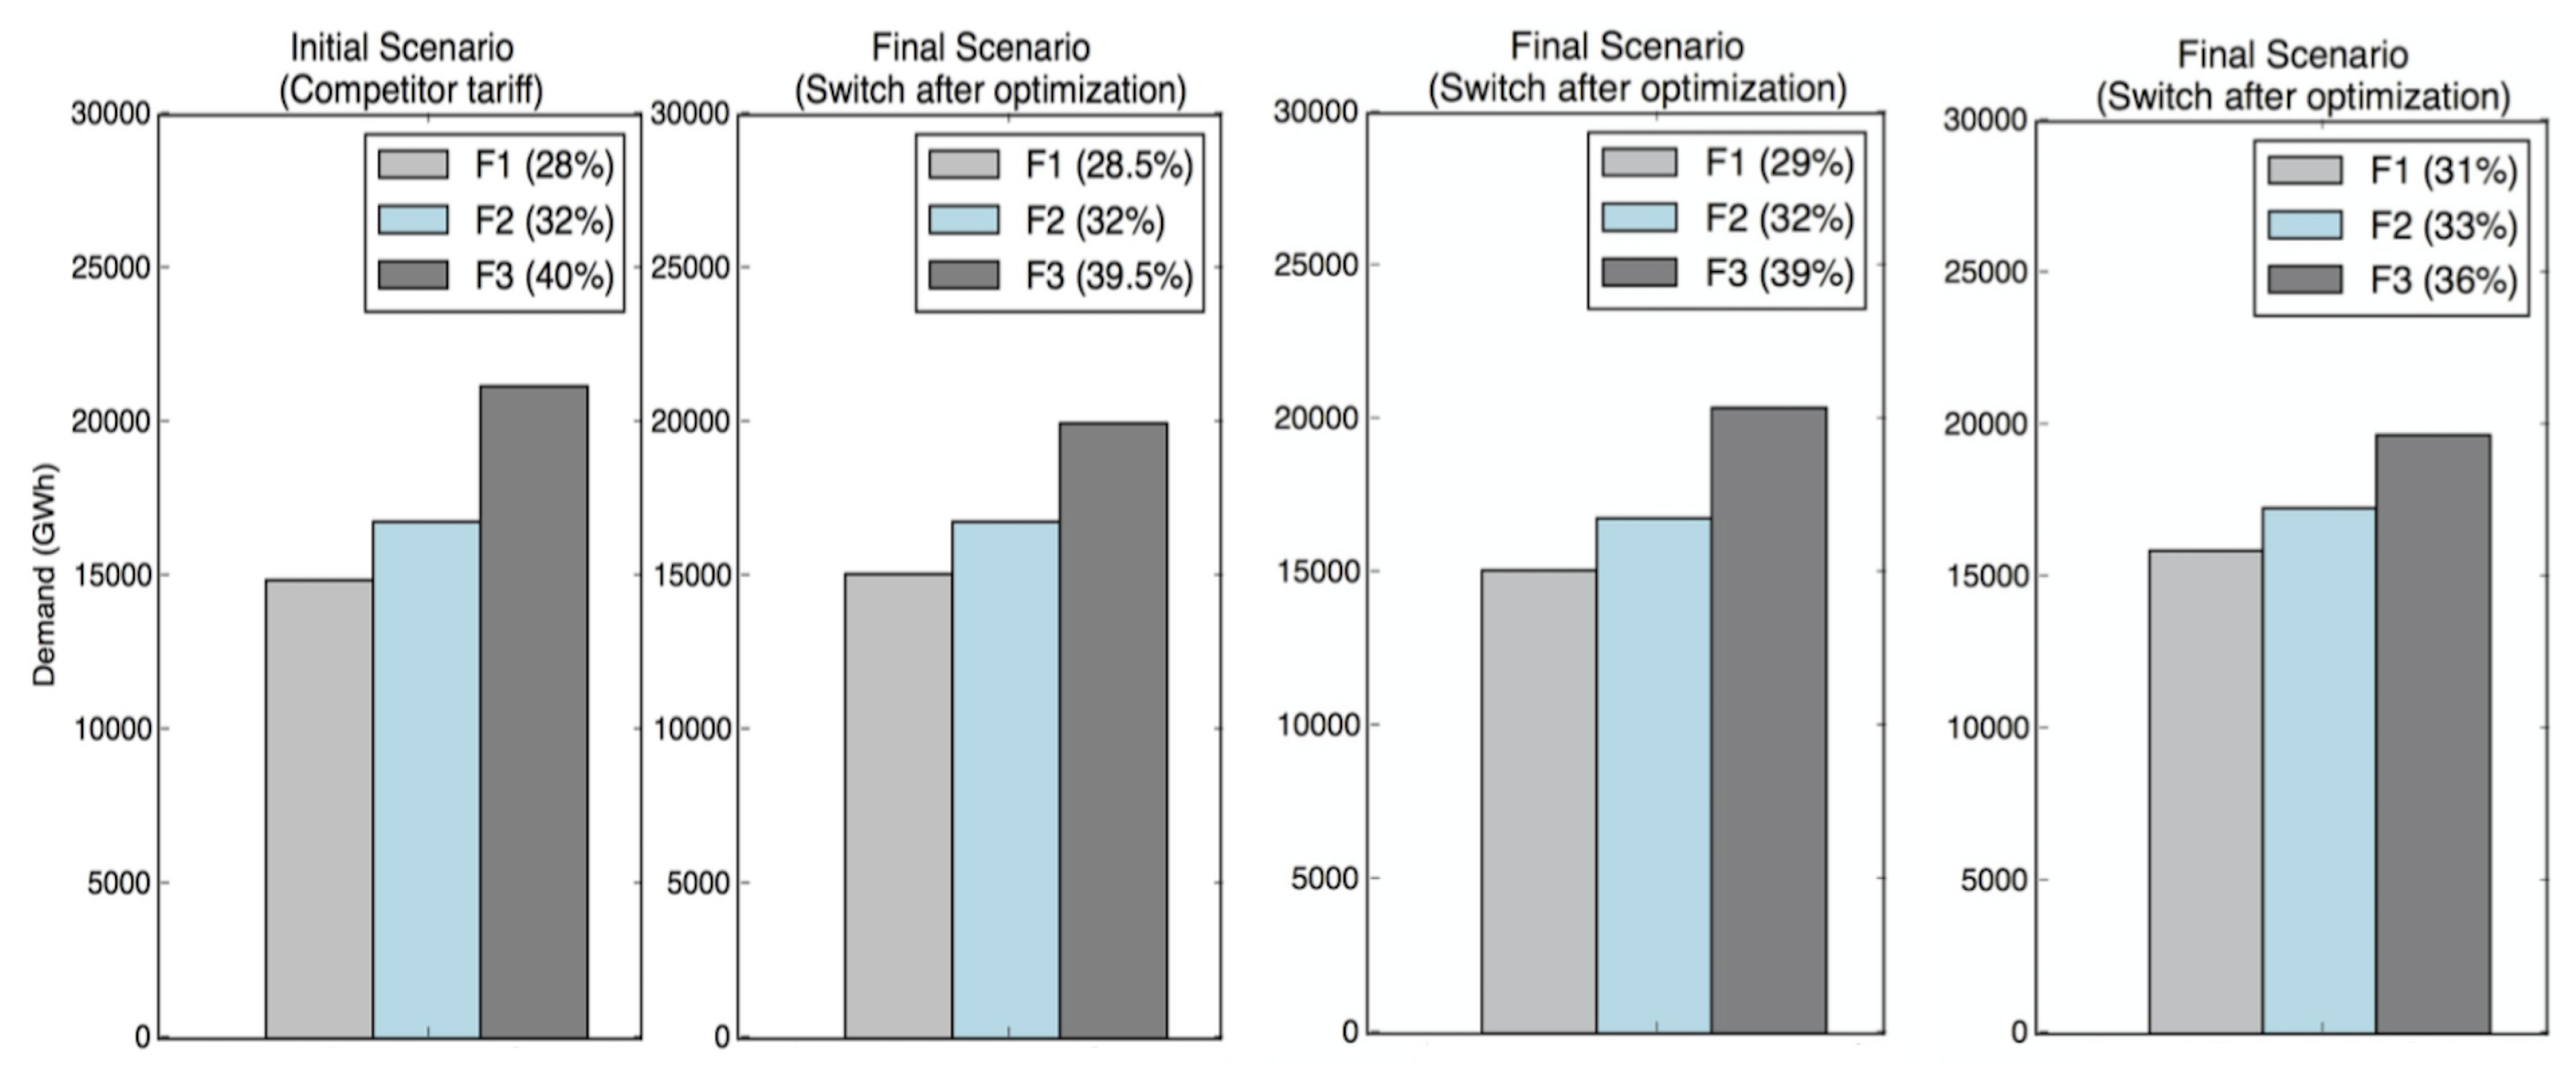
We consider two market scenarios in different parameter settings: in the first scenario, we assume that all customers start with a fixed tariff offered by a competitor utility. We distinguish two sub-cases for this competitor tariff in the residential stochastic model: in the flat rate sub-case, the price is 361 K€/GWh (i.e., 0.361 €/kWh) for each band; the price is 375 K€/GWh for band and 350 K€/GWh for bands and in the two-price rate sub-case. For the deterministic model, we add a third case with a band price with price of 355 K€/GWh for band , 350 K€/GWh for band and 365 K€/GWh for band . There is a single variable tariff with and respectively equal to 1/10 and twice the price of the fixed tariff. In the second scenario, the situation is identical, except that the initial tariff is now owned by the provider.
In both scenarios, our approach tries to define a new tariff that is beneficial for both the provider (because the profit is the problem objective) and the customers (so that they switch tariff).
4.3. Analysis and Comparison of Previous Methods
Most of the discussion in this section is devoted to Scenario 1 for both models, since for Scenario 2, we currently have only a negative, but relevant, result. The results is negative in the sense that it seems that no equilibrium is possible under reasonable assignments of all of the parameters in our model. This result is consistent with other analyses of the Italian market independently performed by ENEL [
33], the main Italian electricity company. The main reason for this lack of equilibrium points seems to be the weak, linear, correlation between the wholesale energy prices and the demand, which offers limited opportunities to exploit demand shifting. In this situation, competition (which is captured by Scenario 1) is the most reliable approach to yield benefits for the customers. We discuss and report in the next section the results on Scenario 1.
Our experimental evaluation is organized to assess what the effect of changing model parameters would be by testing the model in different scenarios. It is very difficult to compare our results with previous work because we consider a holistic model with many cognitive user aspects, multiple customers and multiple tariffs. In particular, we have some aspects of: (1) the elasticity model for comparison with [
11,
15], (2) the perception accuracy for comparison with [
23] and (3) risk aversion for comparison with [
25]. All of these parts in our model were enriched and developed compared to previous works and were tuned based on real data by using fitting functions and data analysis.
There is little point comparing individual parts of our model with the corresponding related works for these reasons: a direct comparison with the approaches that offer models of perception or elasticity is not actually possible. The reason is that these works propose models, but did not use them to optimize prices. The only alternative would be to compare our model with other approaches that optimize prices. However, all works in this context are limited to modeling a single user, a single tariff and a very short time frame (24 h). In fact, the aim of these works is to compare the effectiveness of different patterns of DR mechanism; we instead restrict ourselves to a single DR mechanism (ToU prices), but we consider more aspects of the energy market. For these differences, applying one of the two approaches in the other context would not lead to significant results.
4.5. Experimental Results of the Deterministic Model
We focused on the first scenario, and we have investigated the effect of changing the elasticity factor and the value of the fixed overhead costs from 250 K€/GWh (see
Section 3.6) down to 100 and up to 340. We consider also a third tariff case (referred to as the band rate), which is a close match for tariffs employed for industrial electricity contracts in the Italian market. Optimal prices for flat rate, two-price rate and band rate are reported in
Table 8, which shows also the user switch to the new optimal tariff (i.e.,
if the user
k switches to the new tariff). The most interesting case is the experiment with large overheads (i.e., 280 and 340): there is no economic advantage in attracting all customers to the new tariff. In these cases, we can also see a relation between users that remain in the competitor tariff and their self-elasticity (i.e., the amount of consumption to distribute among the other bands).
For the elasticity factor, it is important to underline that we consider a loss factor of 0% for all users (i.e., we have only a shift of total consumption among the bands without a loss as in the residential model). We show in
Table 9 the new optimal prices by changing the elasticity factor
. We do not report the value of (
) for user tariff switch because in the considered case (i.e., with
), the new optimal tariff attracts all of the users.
To underline the importance of the elasticity factor, we also show in
Figure 6 the shift of aggregate consumption among the bands by changing
with the two-price rate (the most common rate in the Italian market). With
, there is a very small change in the distribution of consumption among the bands. The consumption shifts grow proportionally with the growth of the elasticity factor as expected. It is interesting to notice that the industrial consumption peak is located in the first band, and it decreases with larger elasticity. In this deterministic case, we assume implicitly that consumers are more rational and that they shift their consumption if they have economic benefits.
4.6. A Real-World Case Study
The optimization model presented in the paper provides the basis for some of the decision support tools implemented in the DAREED online platform. DAREED was a FP7 project aiming at the definition and implementation of a comprehensive web-based system to coordinate the efforts of citizens, policy makers and energy providers for improving the energy efficiency of a district. During its validation stage, a prototype of the platform had been used by more than 200 users, including 34 energy providers and 13 policy makers.
The DAREED platform included (A working prototype is still running and available at the moment of writing this paper, but it may be discontinued in the following months. The prototype can be accessed at:
http://demo.dareed.eu) three tools that were based on our model: two of them were addressed to energy providers and one to local policy makers. In detail, energy providers had access to:
A tool for suggesting tariffs for districts, which could provide price recommendation for ToU-based tariffs, via the stochastic version of our optimization model.
A similar tool for suggesting tariffs for buildings, which could be used to define tailored tariffs for large electricity consumers and was based on the deterministic version of our model.
Policy makers could instead access a tool for identifying the optimal values of the behavioral parameters of citizens in a district, i.e., their cross-elasticity matrix, their perception accuracy and their risk aversion. In this latter case, our model was optimized over fixed prices, and the decision variables were the , , parameters.
For a whole description of the three decision support tools, we refer to Deliverable 5.3 (
http://www.dareed.eu/251). In the remainder of this section, we focus on the first tool (i.e., obtaining tariff recommendations at district level), and we discuss how it has been used to obtain valuable results in the context of the project.
From the perspective of our model, providing this kind of recommendation required obtaining information about: (1) the available prices bands, (2) yearly consumption over the considered district, (3) behavioral parameters for all customer classes and (4) prices for pre-existing tariffs. The definition of price bands is usually subject to national regulations, and the DAREED platform supported a sample of the existing ones in Italy, England and Spain. All decision support systems were connected with a hub for collecting real-time electricity monitoring data, which was integrated with statistical considerations to estimate consumption figures for all customer classes in a district. The platform also featured a market place section to exchange requests and offers between citizens, energy providers and policy makers: this market place represented an excellent source of information to obtain a proper configuration of the customer elasticity, perception accuracy and risk aversion parameters. Finally, prices for the existing tariffs had to be specified manually by the user. Once all relevant information had been obtained, the decision support tool would solve our optimization model and provide solutions. The user could then inspect the outcomes, which contained the price recommendations for the new tariff, an indication of whether the tariff was attractive enough for the customers and an estimate of how the users’ energy demand was likely to shift due to the new prices.
The described tool has been employed in the final stage of the project by staff at ENEL [
34] to perform a case study and assess how to design an attractive tariff for an Italian town that was one of the project pilots. More in detail, in the period between 1 January 2017 and 30 June 2018, twenty million Italian households and small businesses were required to switch their electricity tariff, as the last stage of a market liberalization process that spanned multiple years. This massive transition represented a huge opportunity for energy providers, but also one that was very difficult to exploit, since competition and taxes had progressively cut the profit margin. In this context, a model such as the one we have presented could provide a significant advantage.
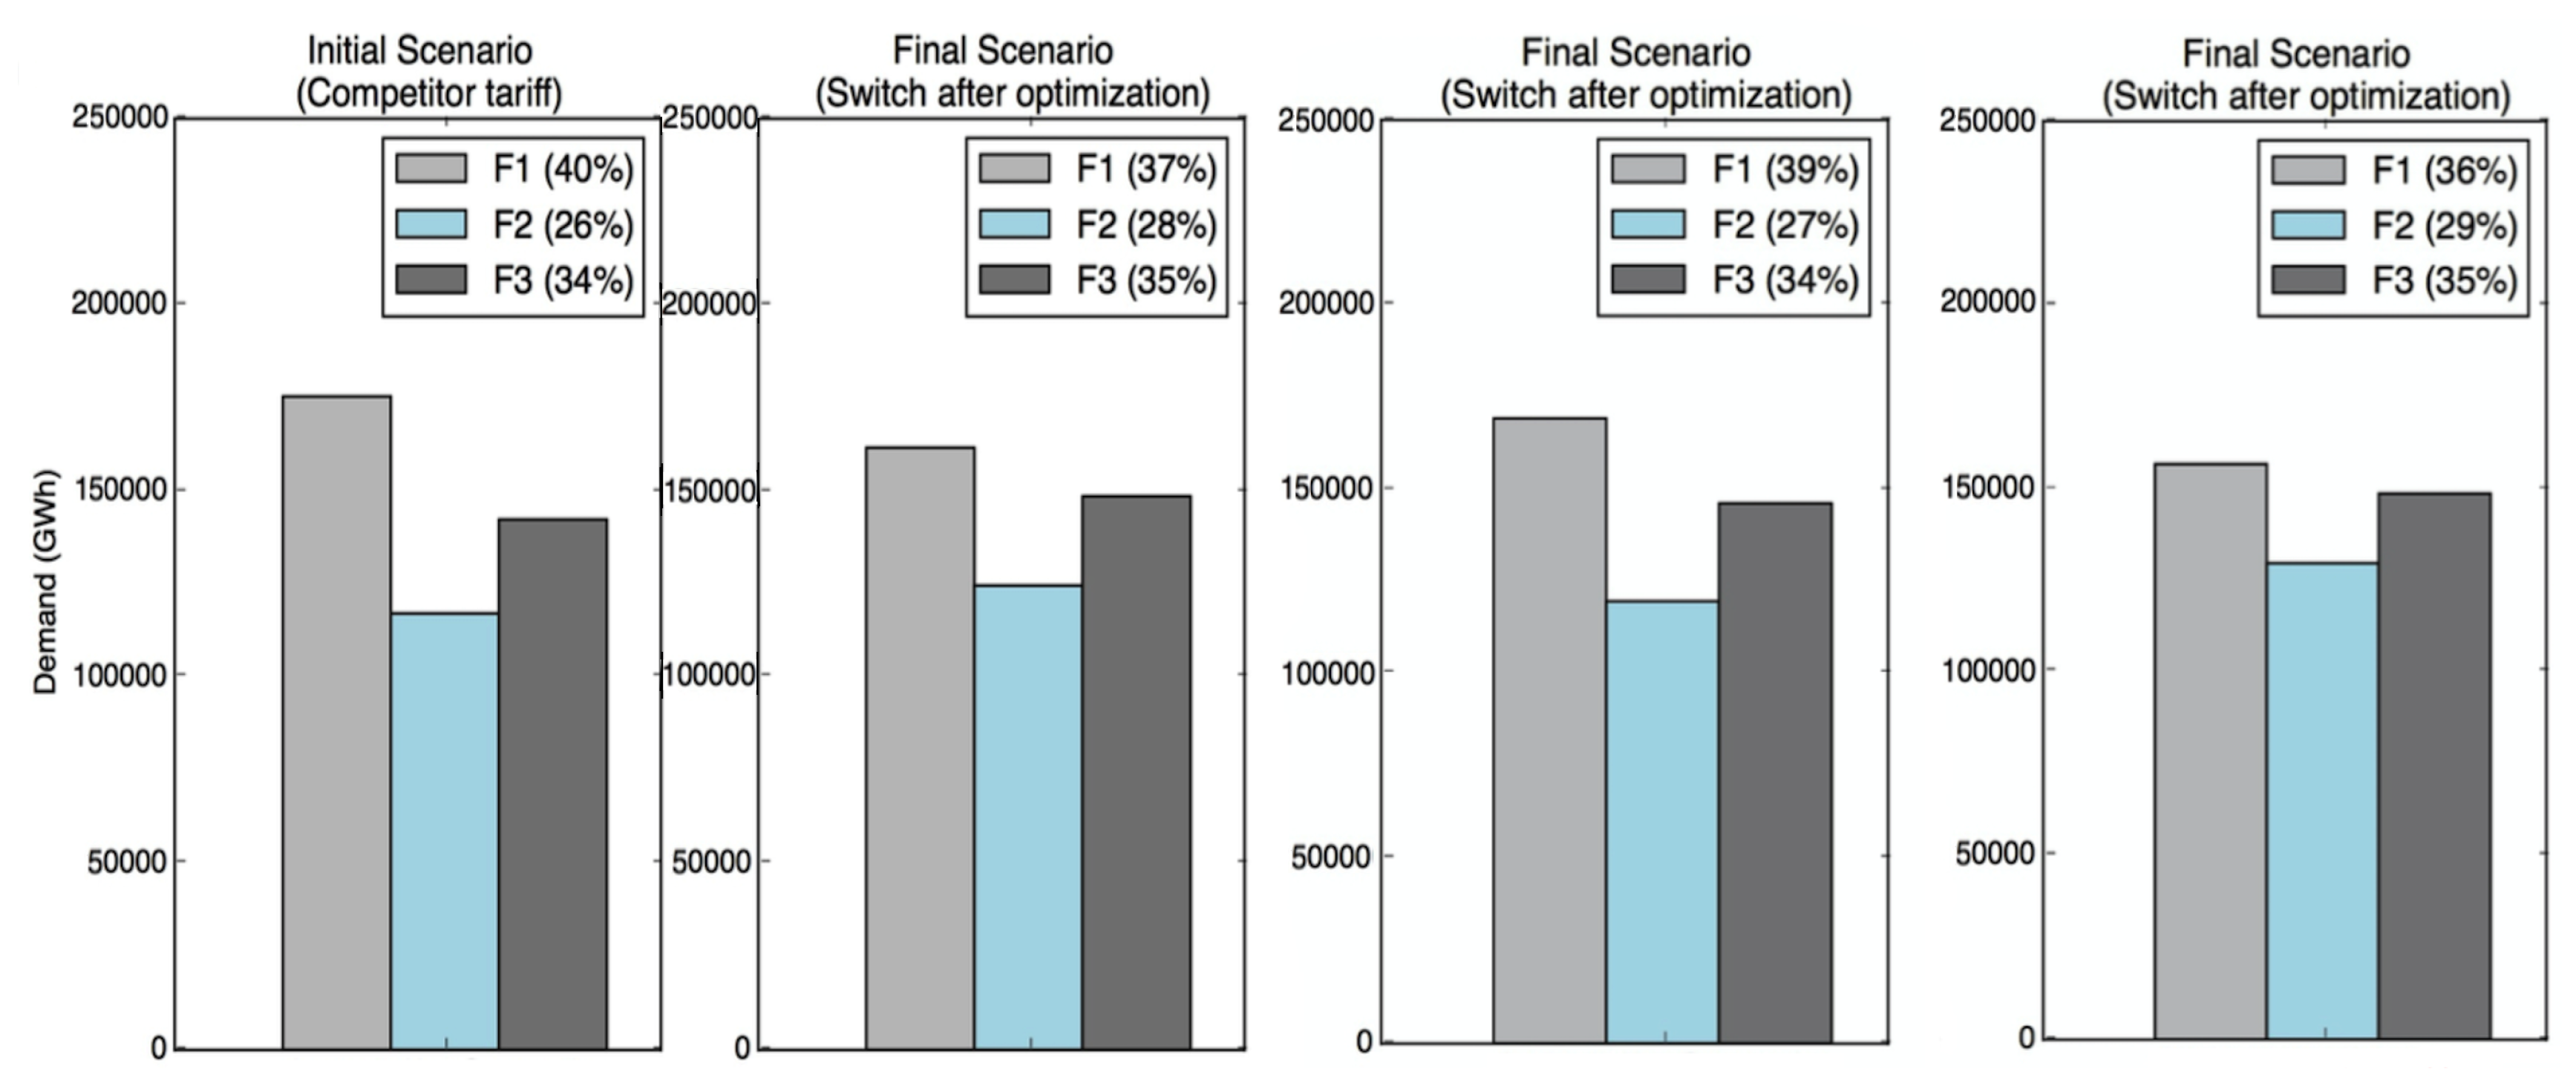
Specifically, project participants from ENEL employed the decision support tool that we have described to obtain tariff recommendations for the municipality of Lizzanello, in southern Italy. The use of the tool allowed them to understand how to define the prices so as to beat the most representative tariffs offered by competitors and to assess the share of new customers that were likely to make switch: in this case, from 22% to 75%, depending on how much profit they were willing to sacrifice in order to obtain new customers. Even in the lowest-prices, largest-number-of-customers scenario (i.e., the 75% switch), the estimated profit per customer was of 75 €/year: a small budget, but enough to support marketing efforts for (more profitable) added value services.


