New Design of a CNG-H2-AIR Mixer for Internal Combustion Engines: An Experimental and Numerical Study


Abstract
:1. Introduction
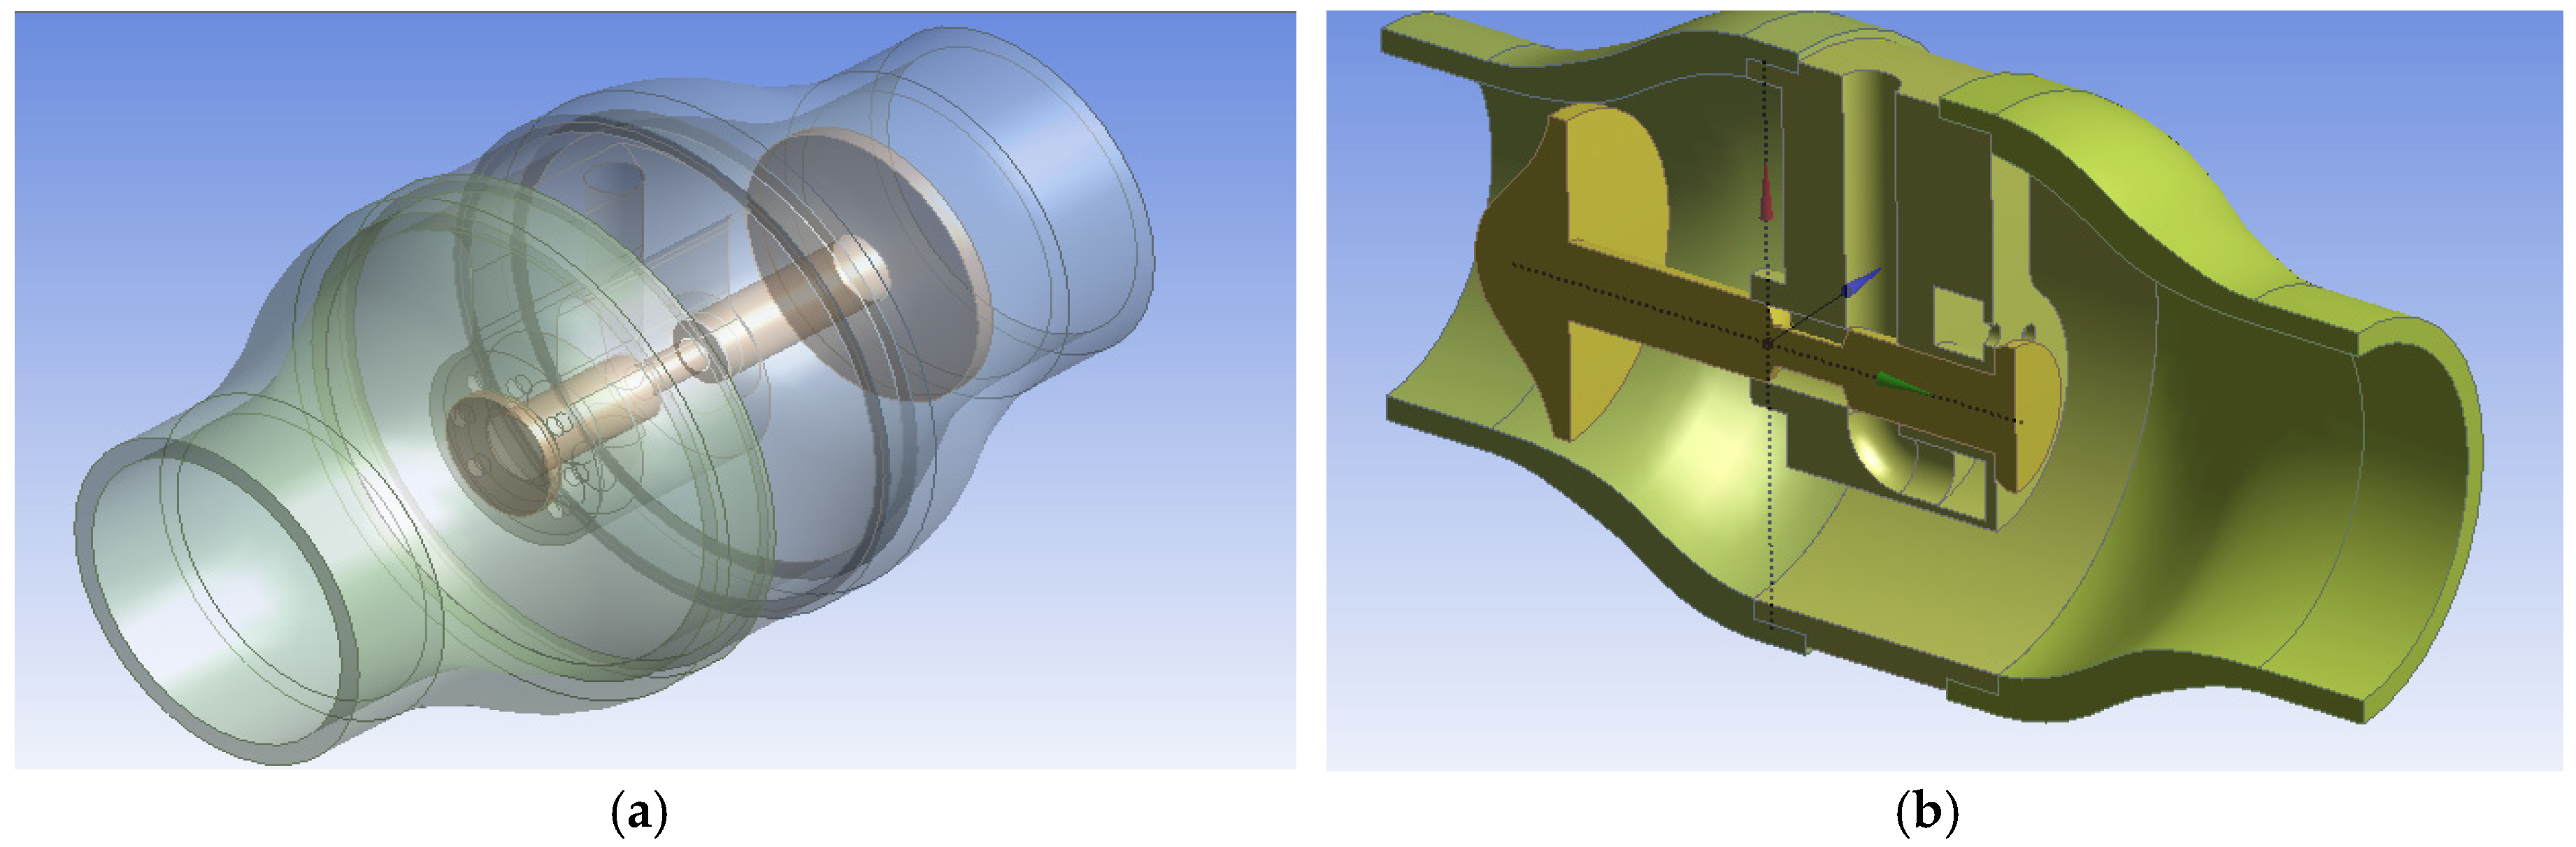
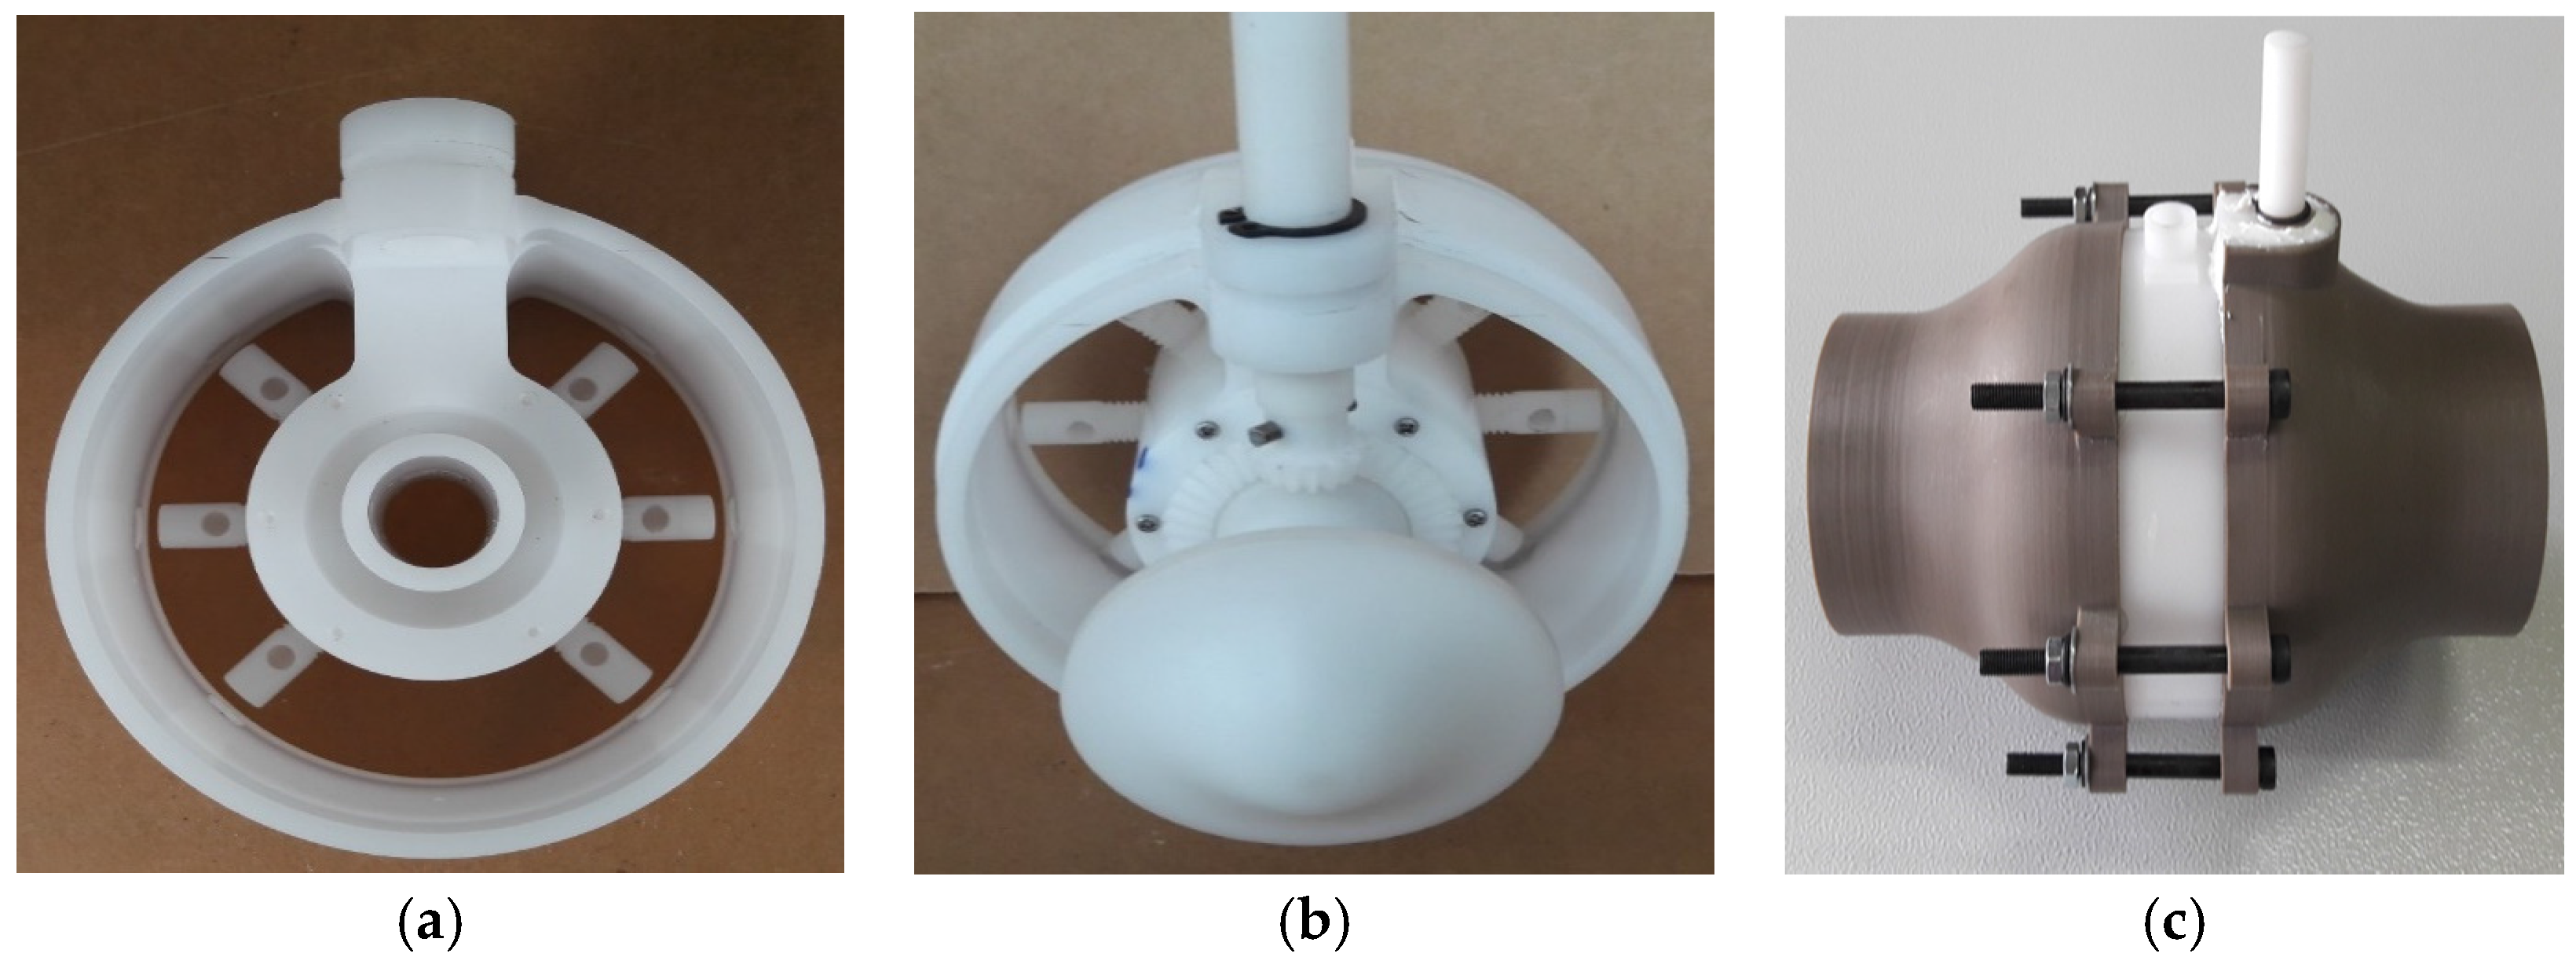
2. The New Mixer Design
- •
- Stationary parts: these include the air inlet, fuel inlet, mixing outlet, fuel manifold, bolts, nuts, covers, groove pin, and the main body of mixer and seals.
- •
- Moveable mechanical parts: these consist of the valve, bevel gears, large nut, shafts, and the dual direction stepper motor.
3. Optimization the Homogeneity of the Mixture inside the New Mixer
4. Computational Fluid Dynamics Analysis (CFD)
4.1. Drawing the Mixer
4.2. Model of Turbulence
- •
- Generally, performs poorly for flows with larger pressure gradient, strong separation, high swirling component and large streamline curvature.
- •
- Inaccurate prediction of the spreading rate of round jets.
- •
- The ε equation contains a term which cannot be calculated at the wall. Therefore, wall functions must be used.
4.3. Numerical Diffusion
- (1)
- If a higher order discretization scheme is used in ANSYS Fluent, such as QUICK or second order upwind, the effect of numerical diffusion will be reduced. In this study, second order upwind discretization for momentum, turbulence equations, energy equations, and all equations for gases (species equation) was used [69].
- (2)
- The amount of numerical diffusion is inversely related to the resolution of the mesh, therefore, one way of minimizing the numerical diffusion is to refine the mesh [67].
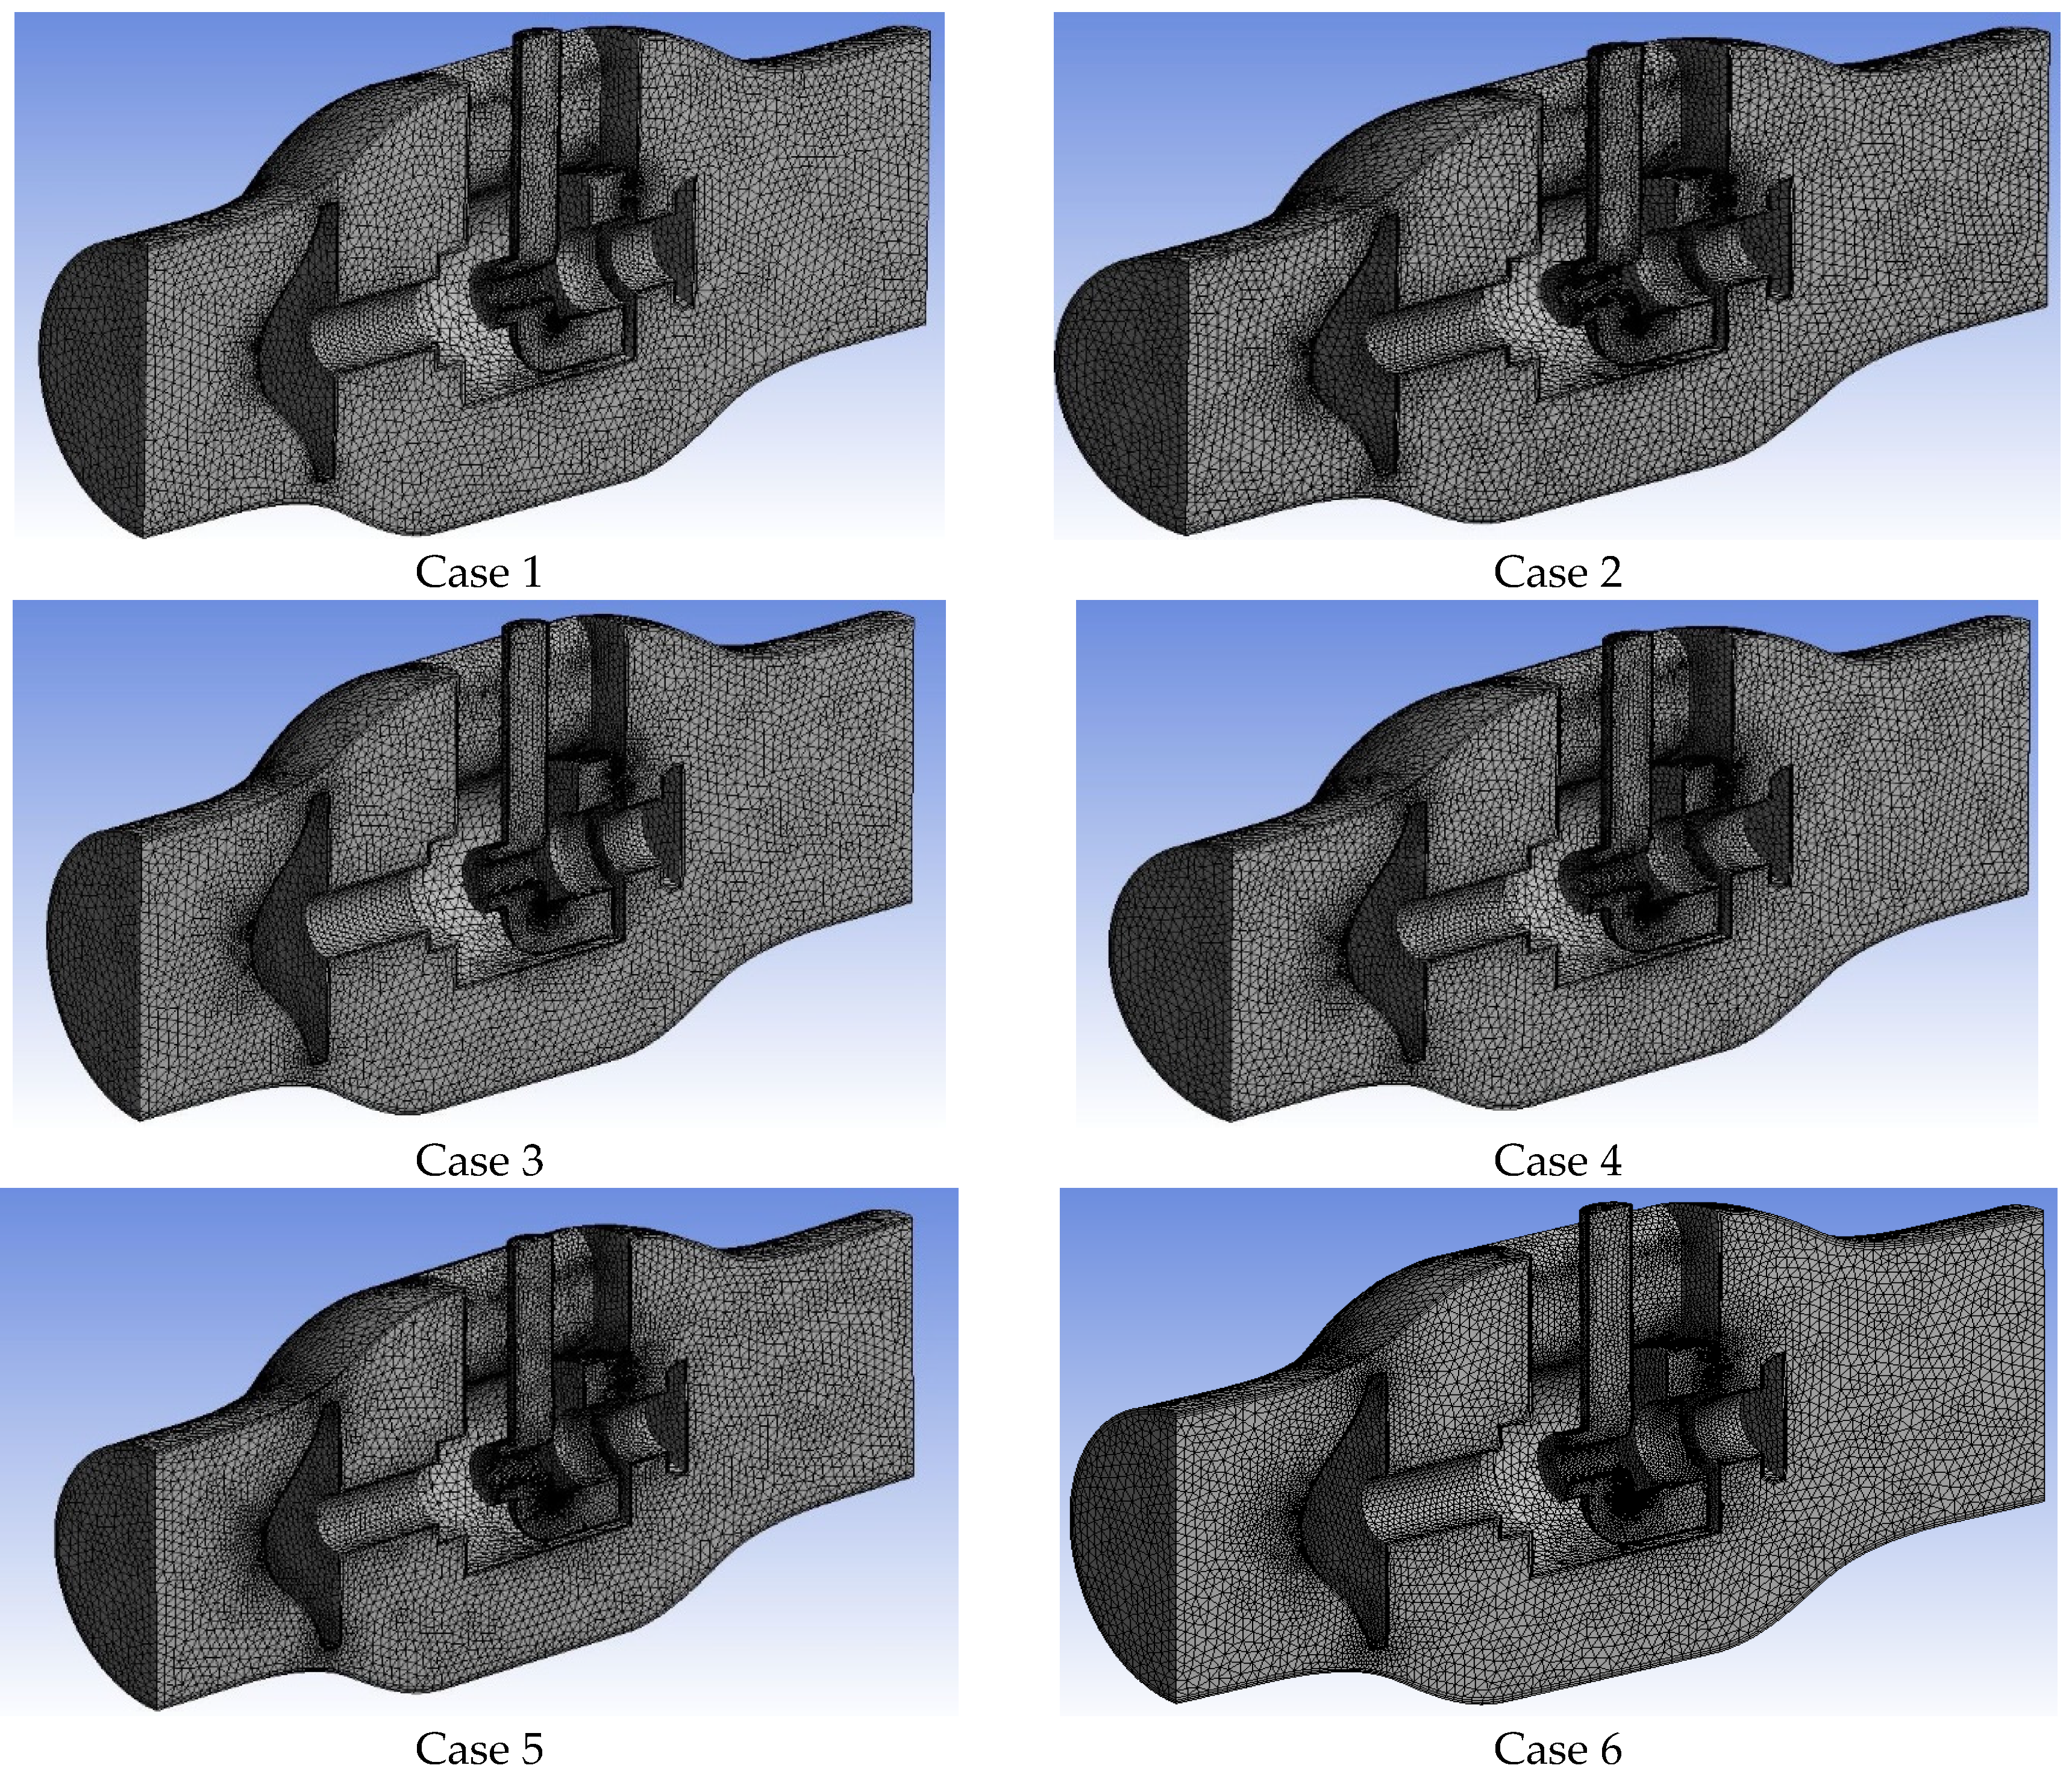
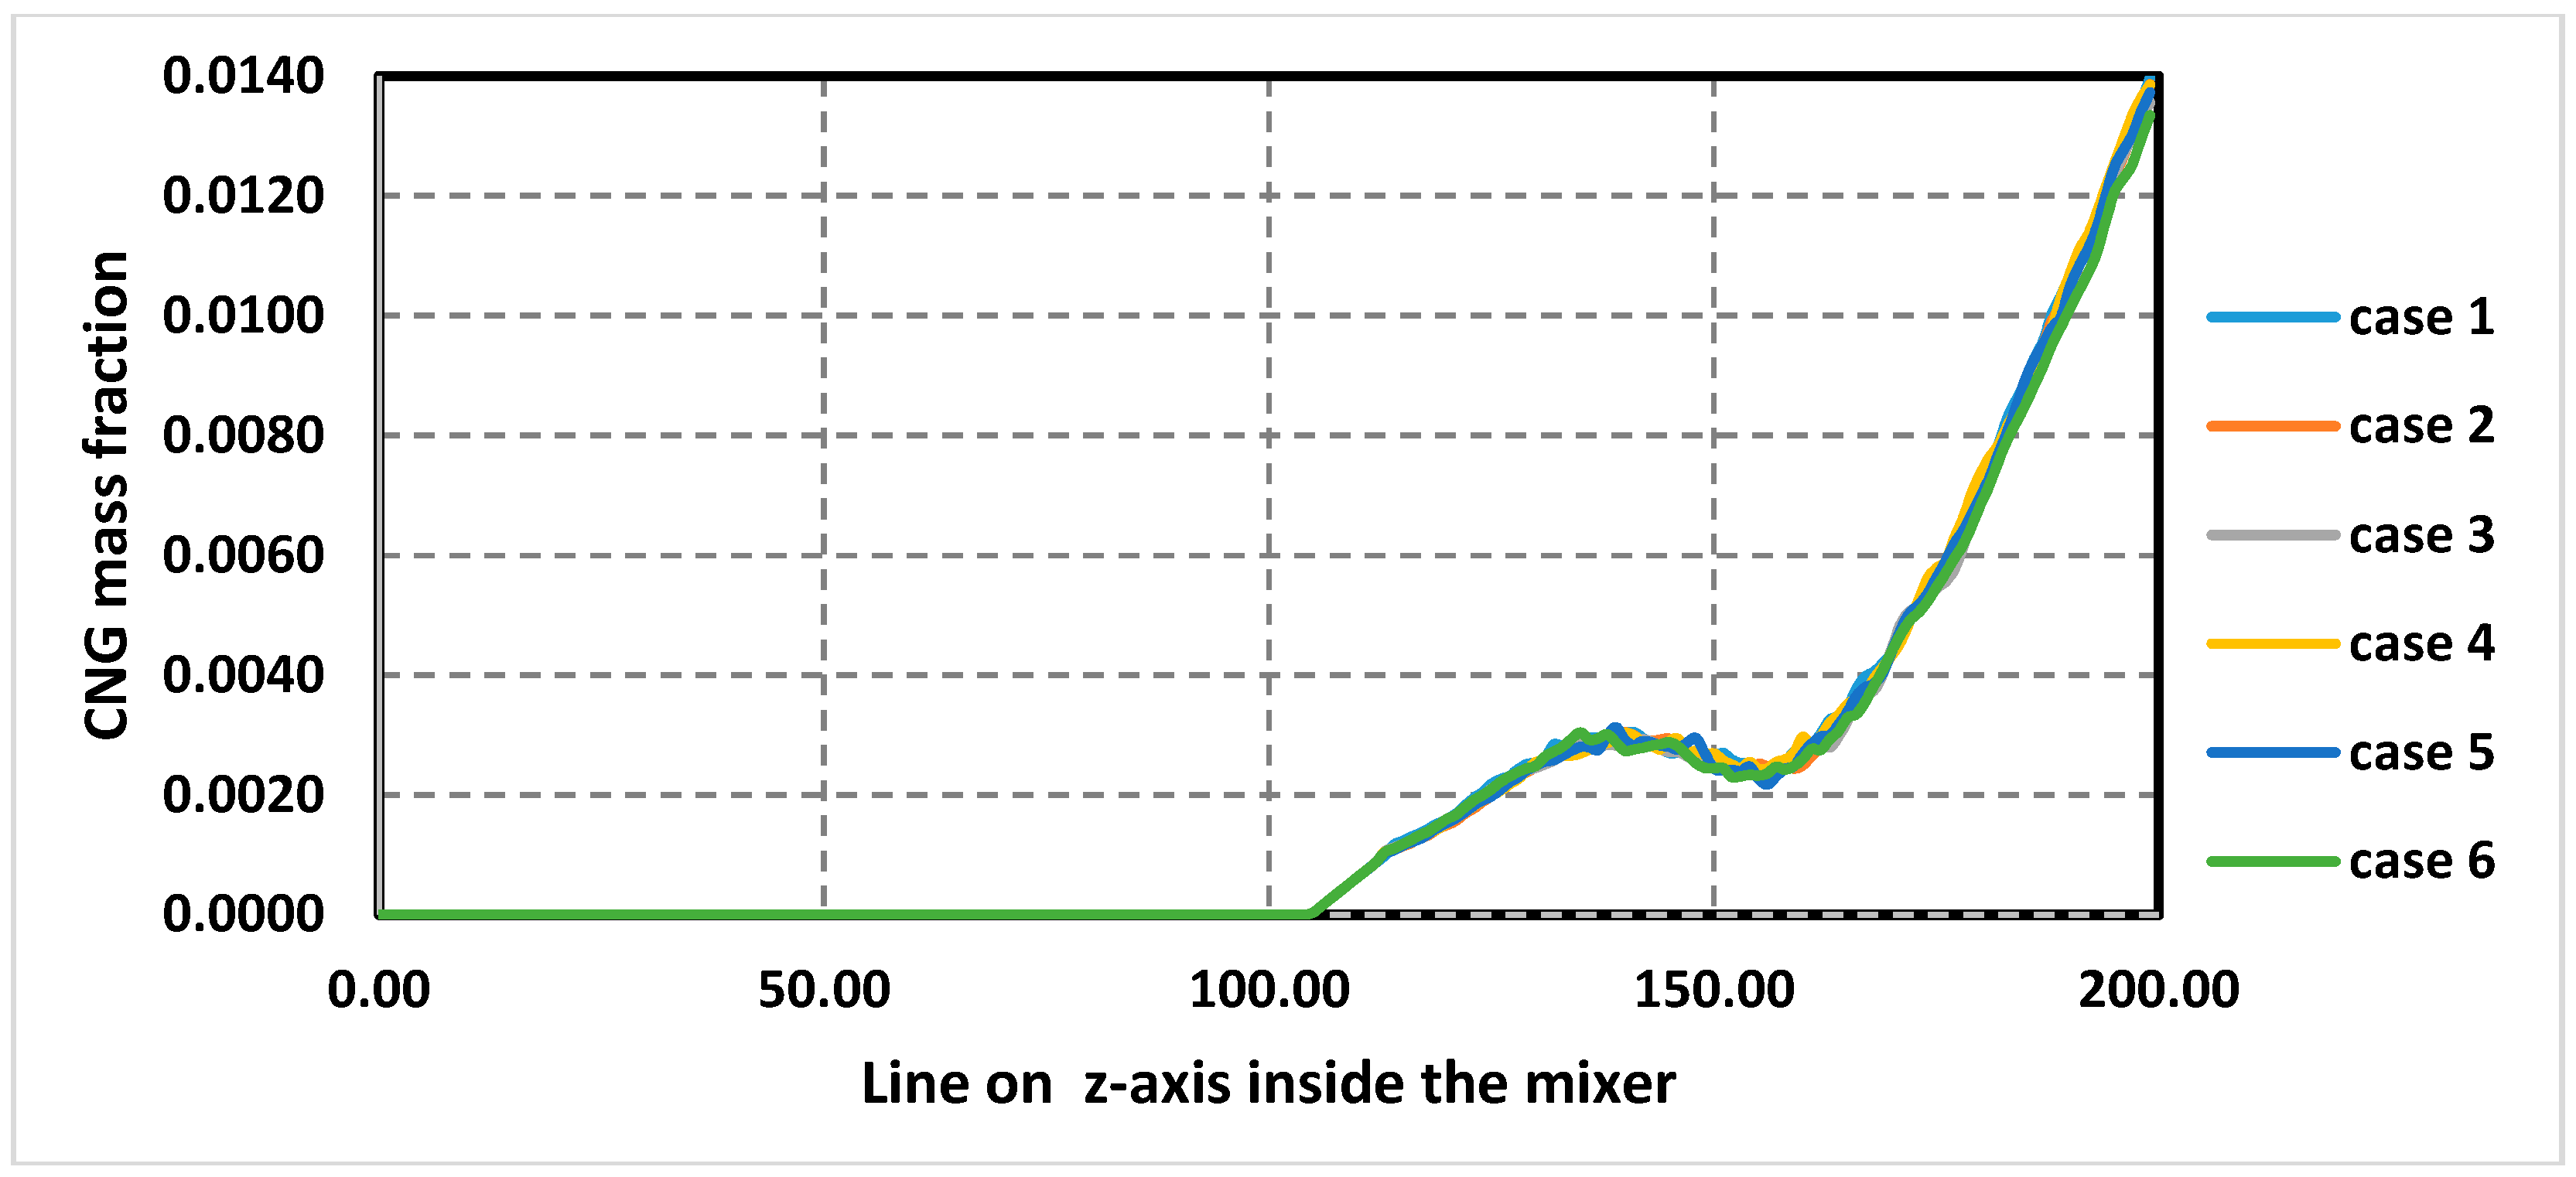
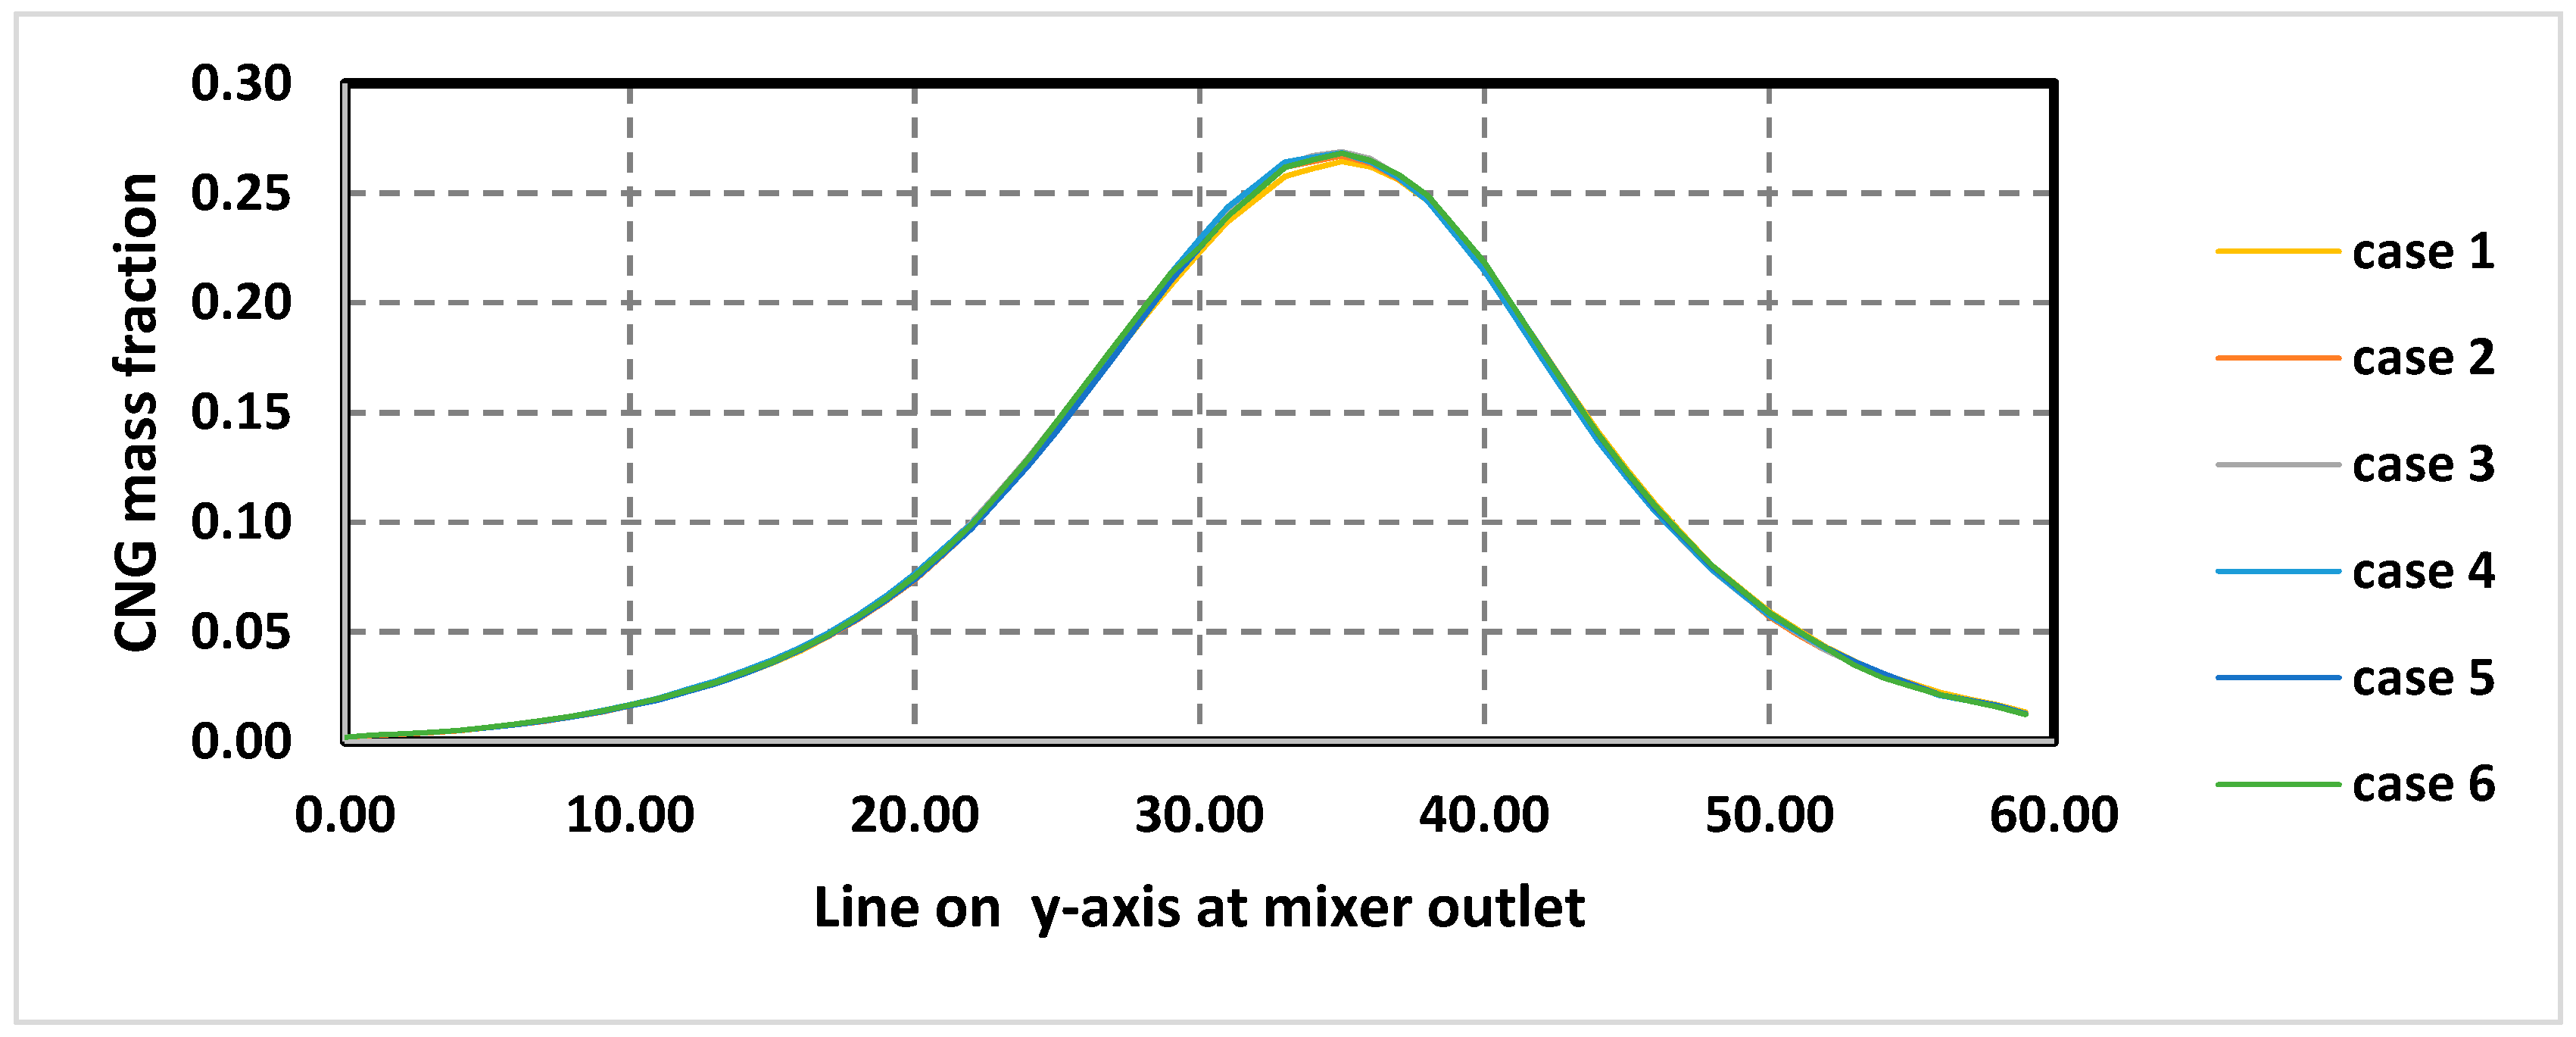
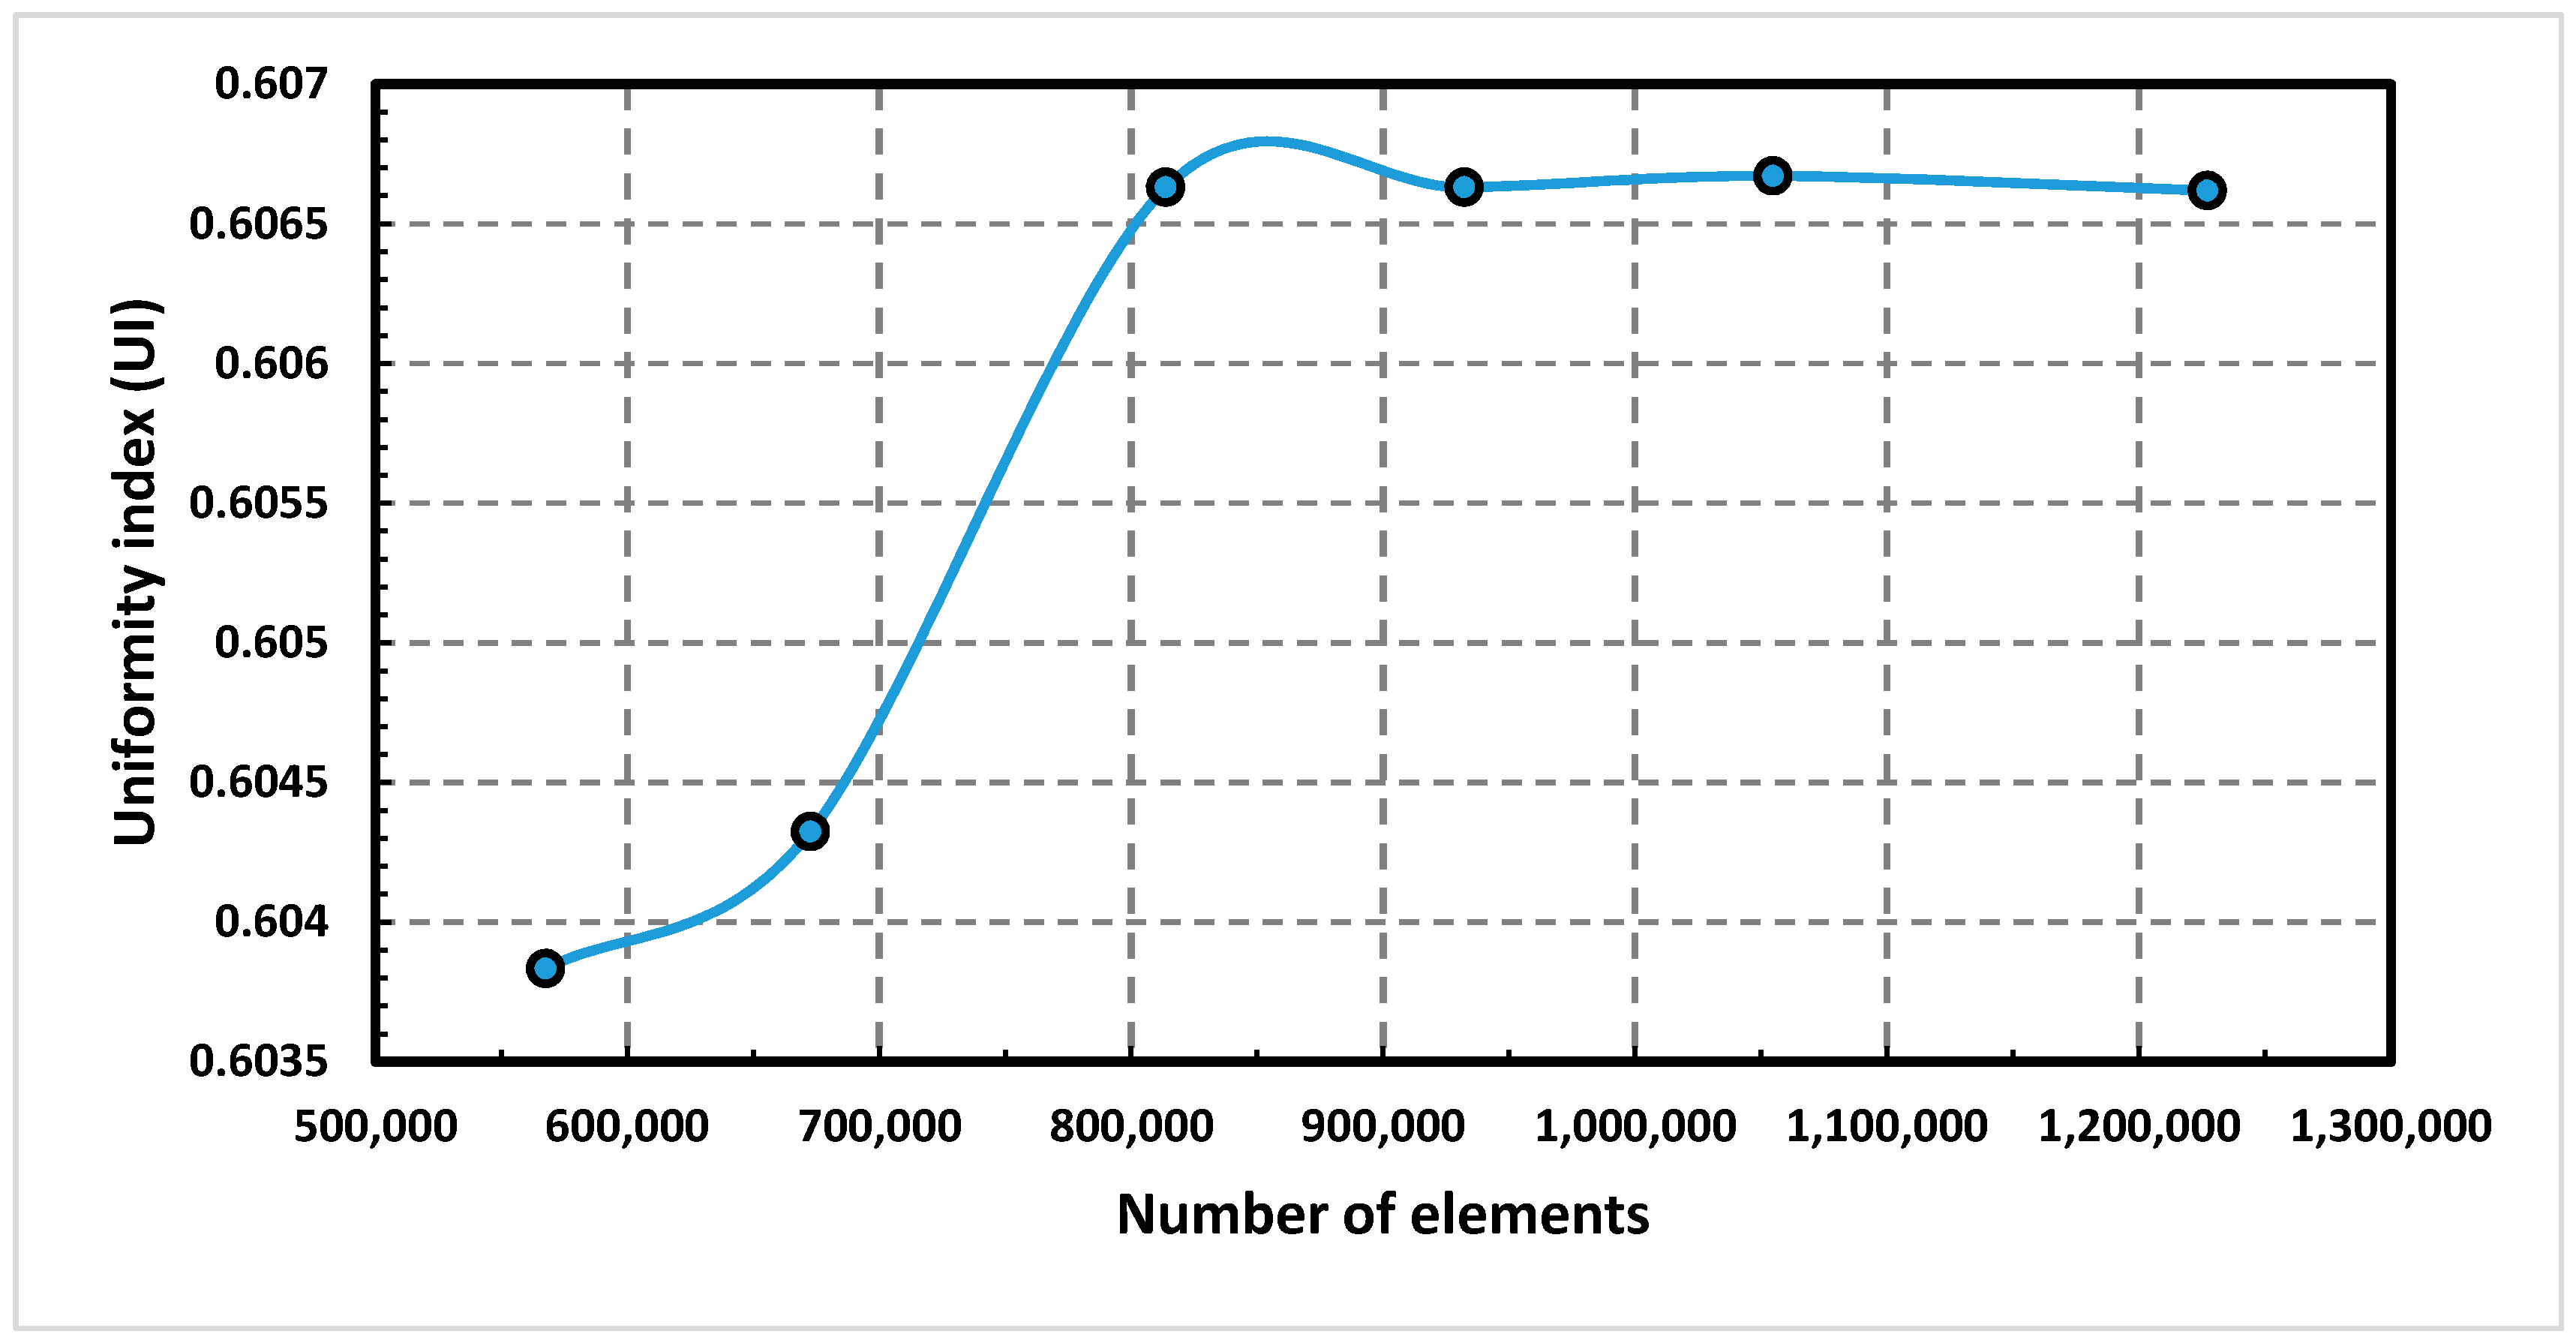
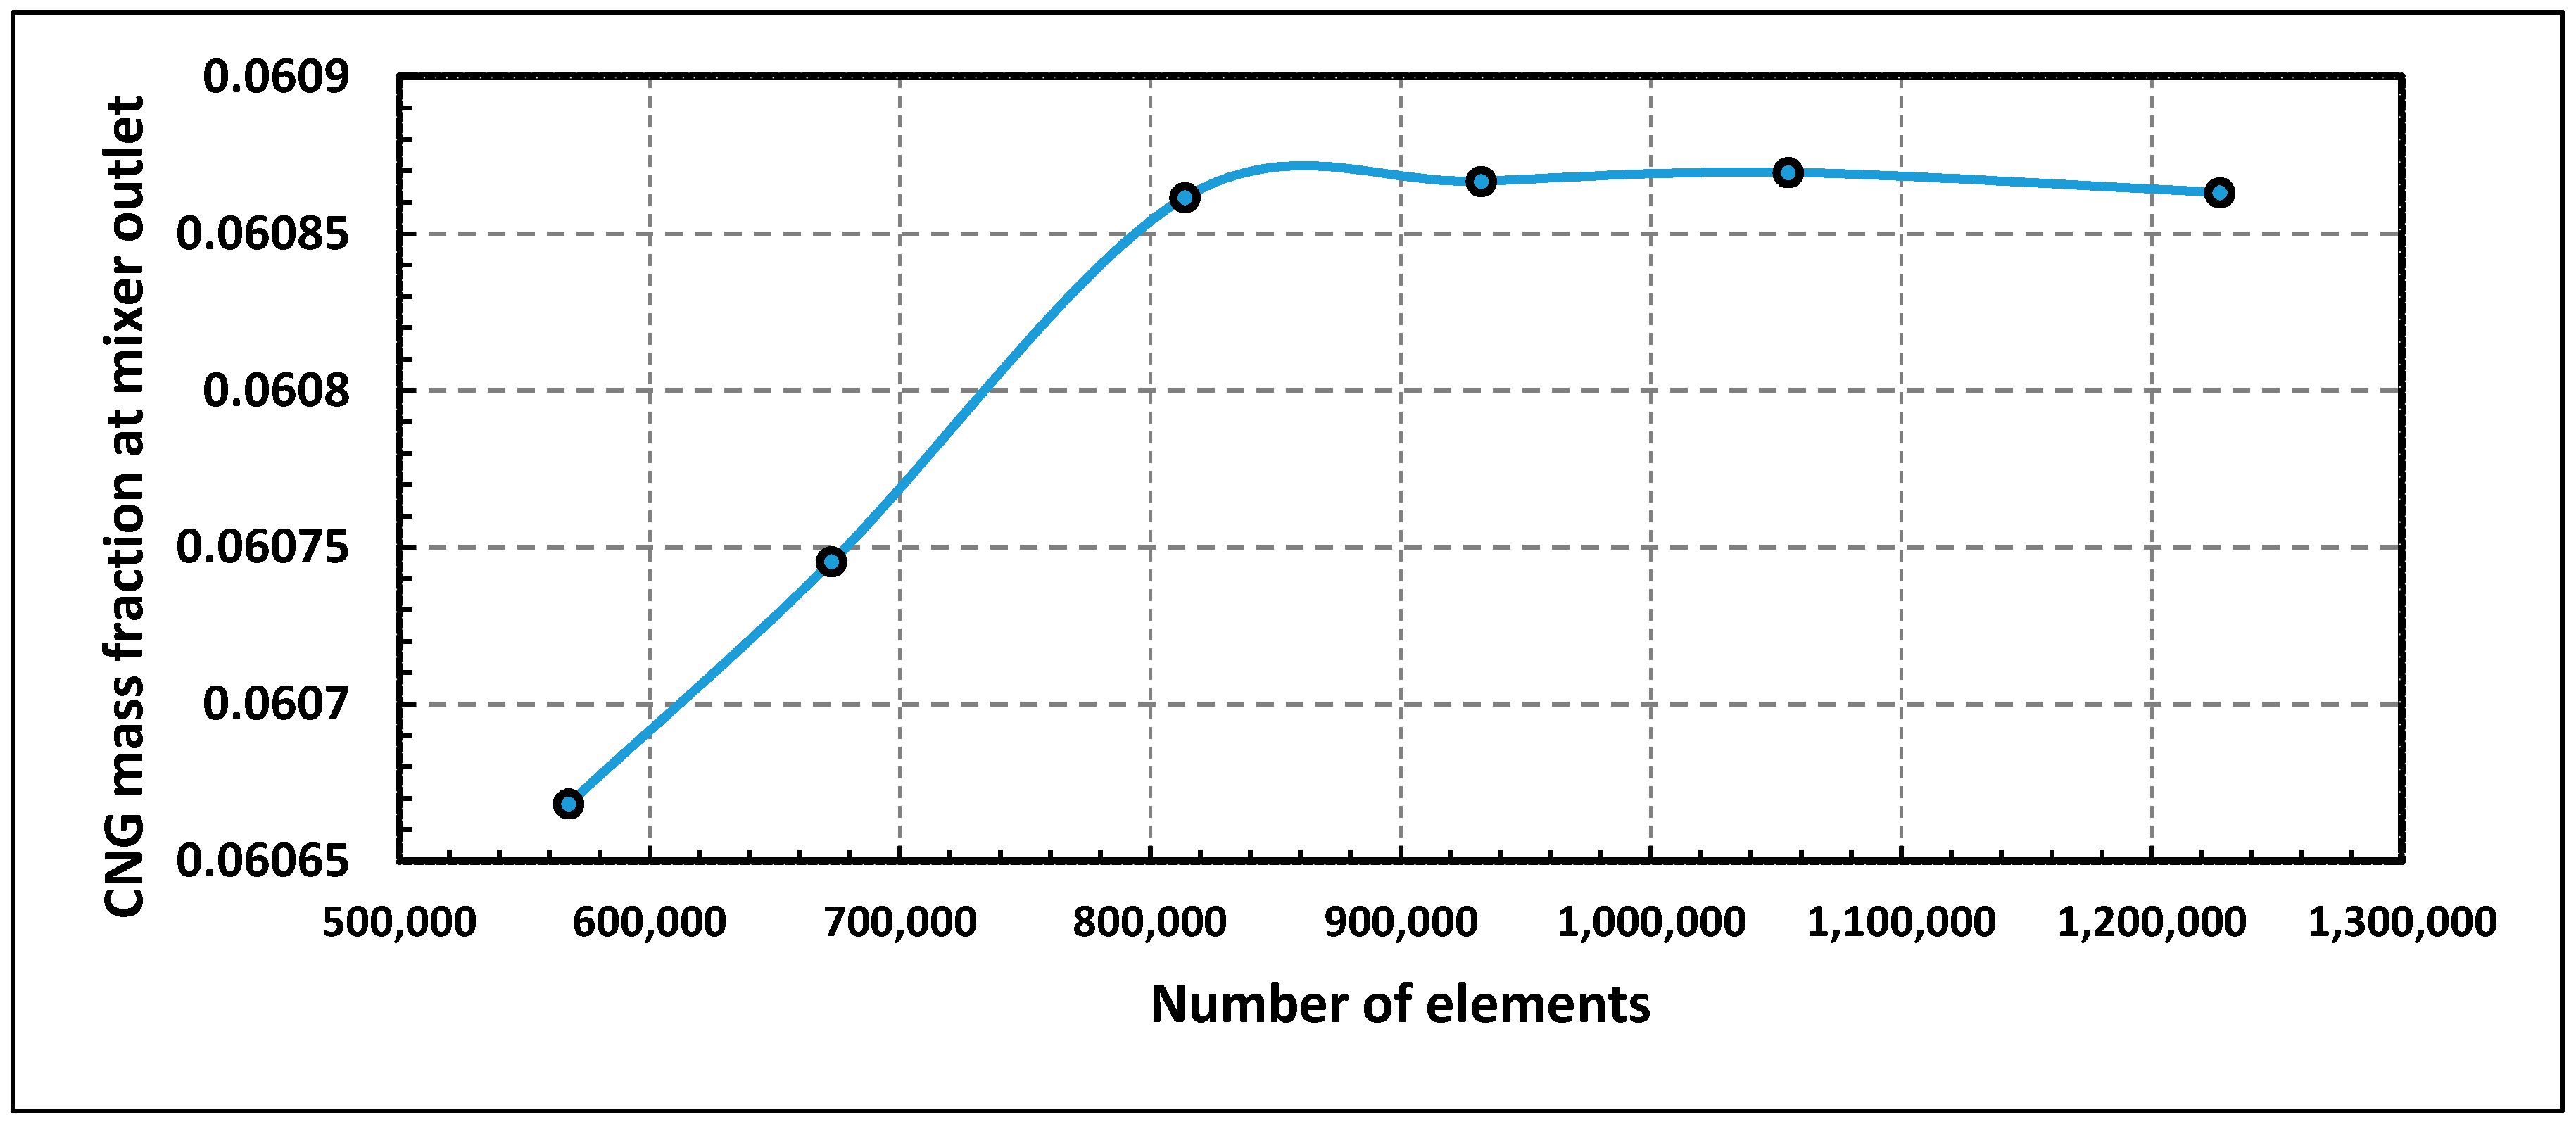
4.4. Grid Generation and Grid Independence Test
4.5. Evaluation of Flow Uniformity
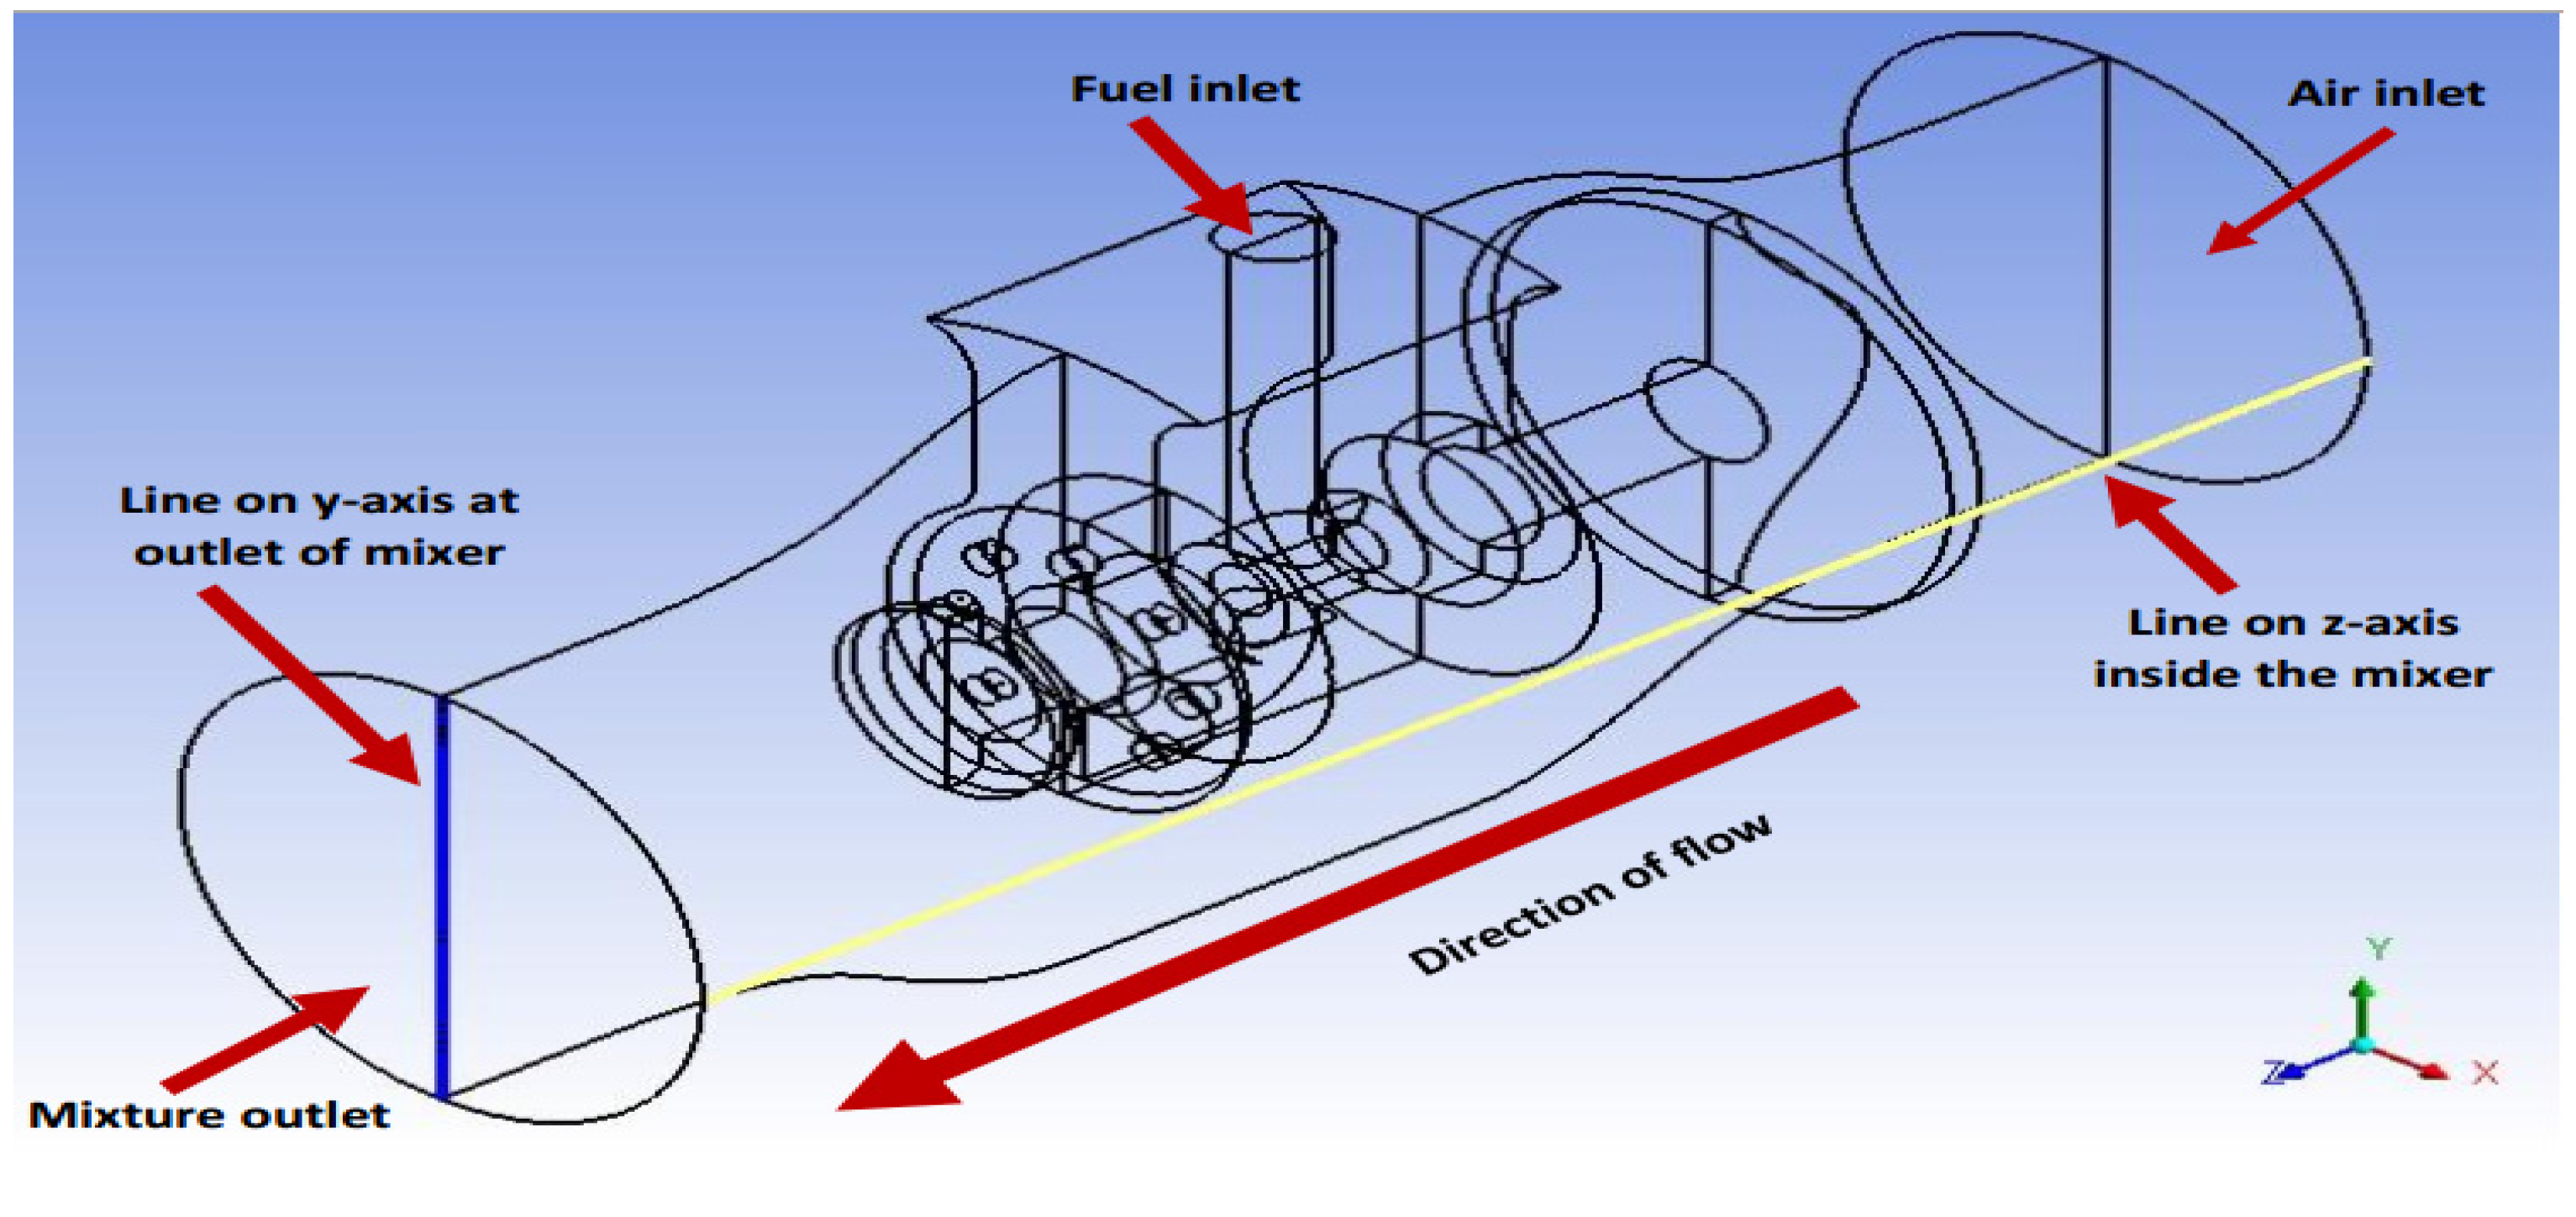
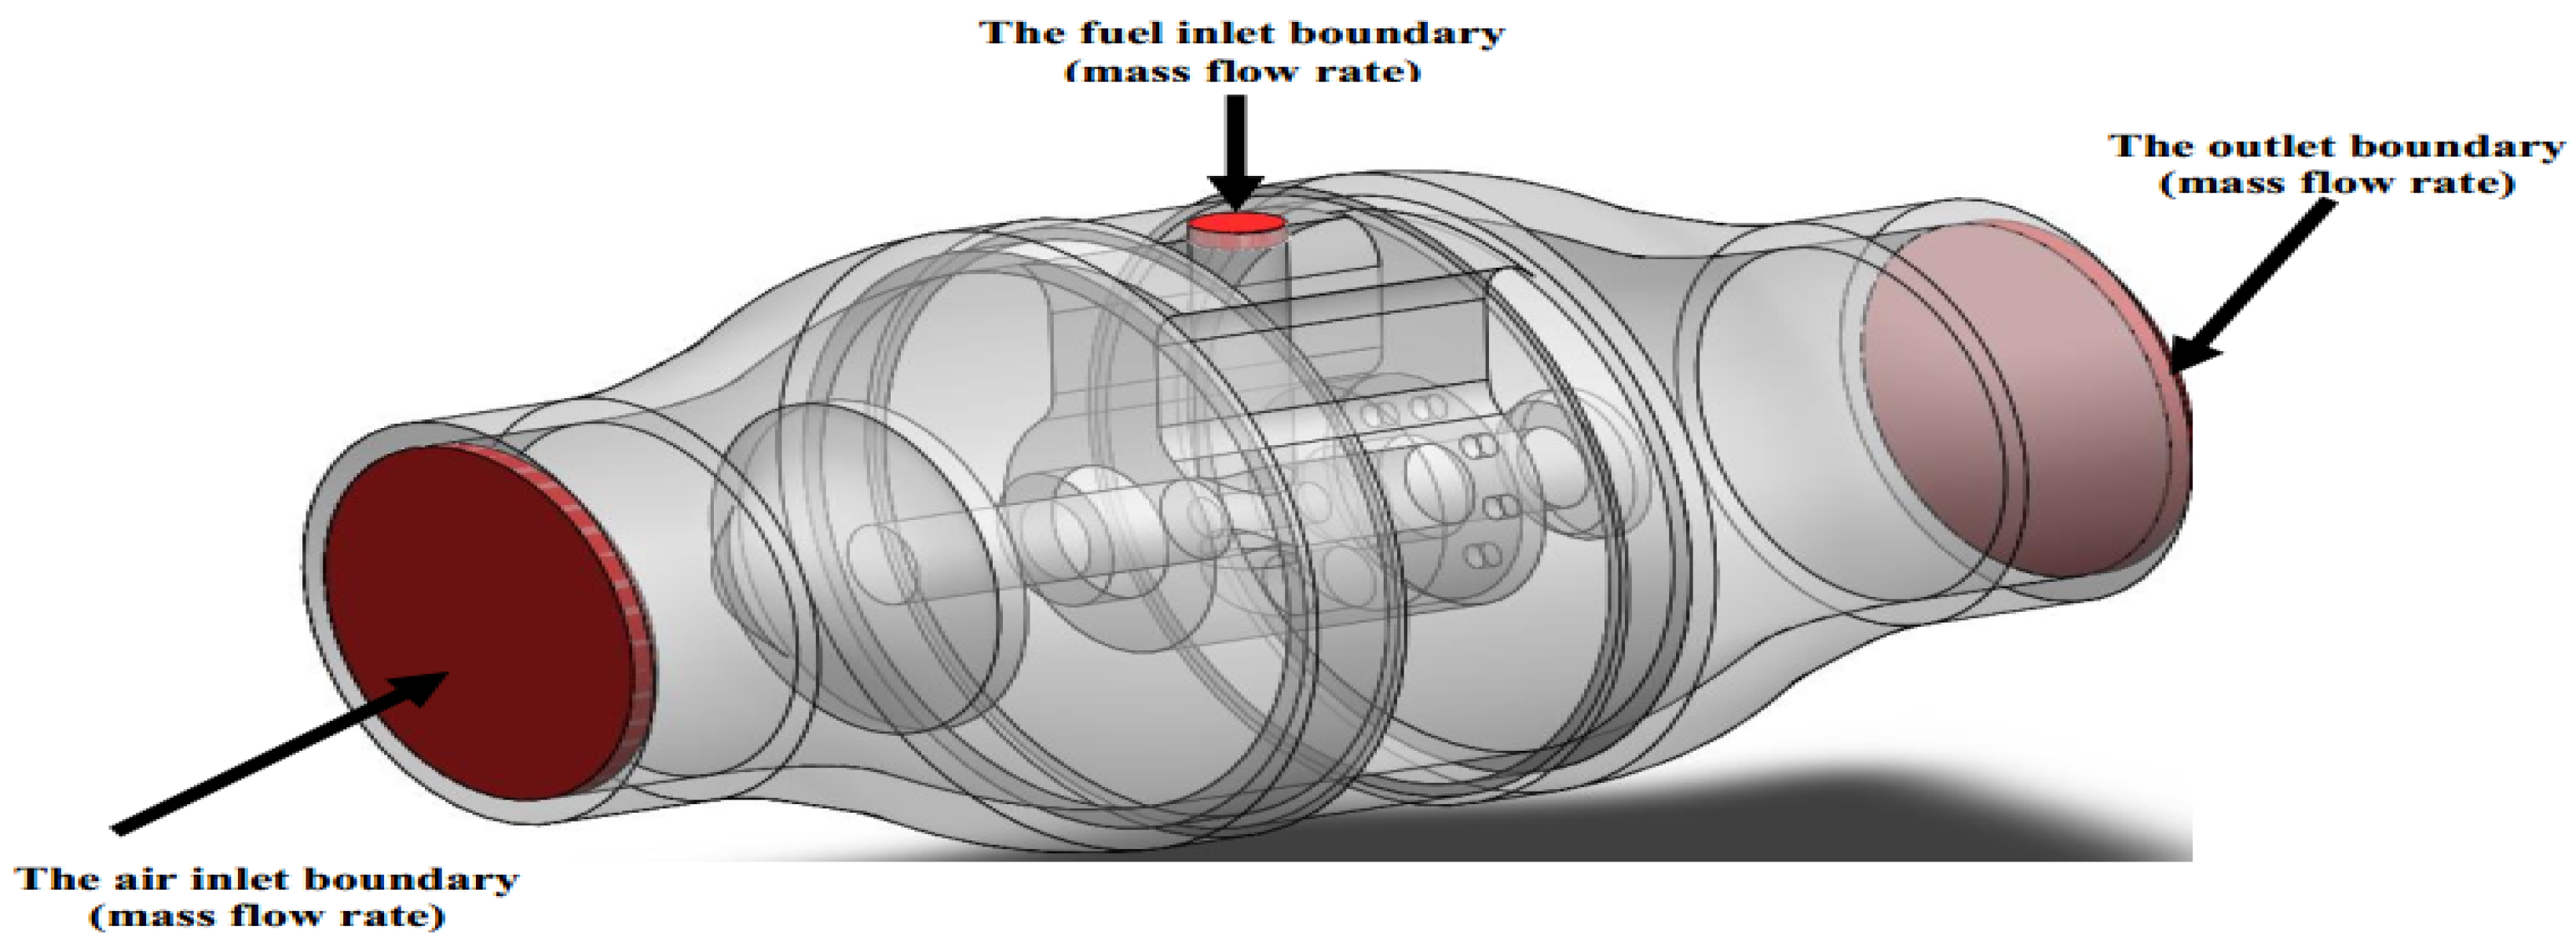
4.6. Boundary Condition for the New Mixer Models
- (1)
- The air inlet boundary—The mass flow rate was considered constant at the air inlet. The values of mass fraction were (1) for air and (0) for gaseous fuel. Air consists of oxygen (0.23%) and Nitrogen (0.77%) by mass fractions (Figure 11).
- (2)
4.7. Air-Gaseous Fuel Ratio
5. Results
5.1. Uniformity Index of Gaseous Fuel inside the New Mixer Models
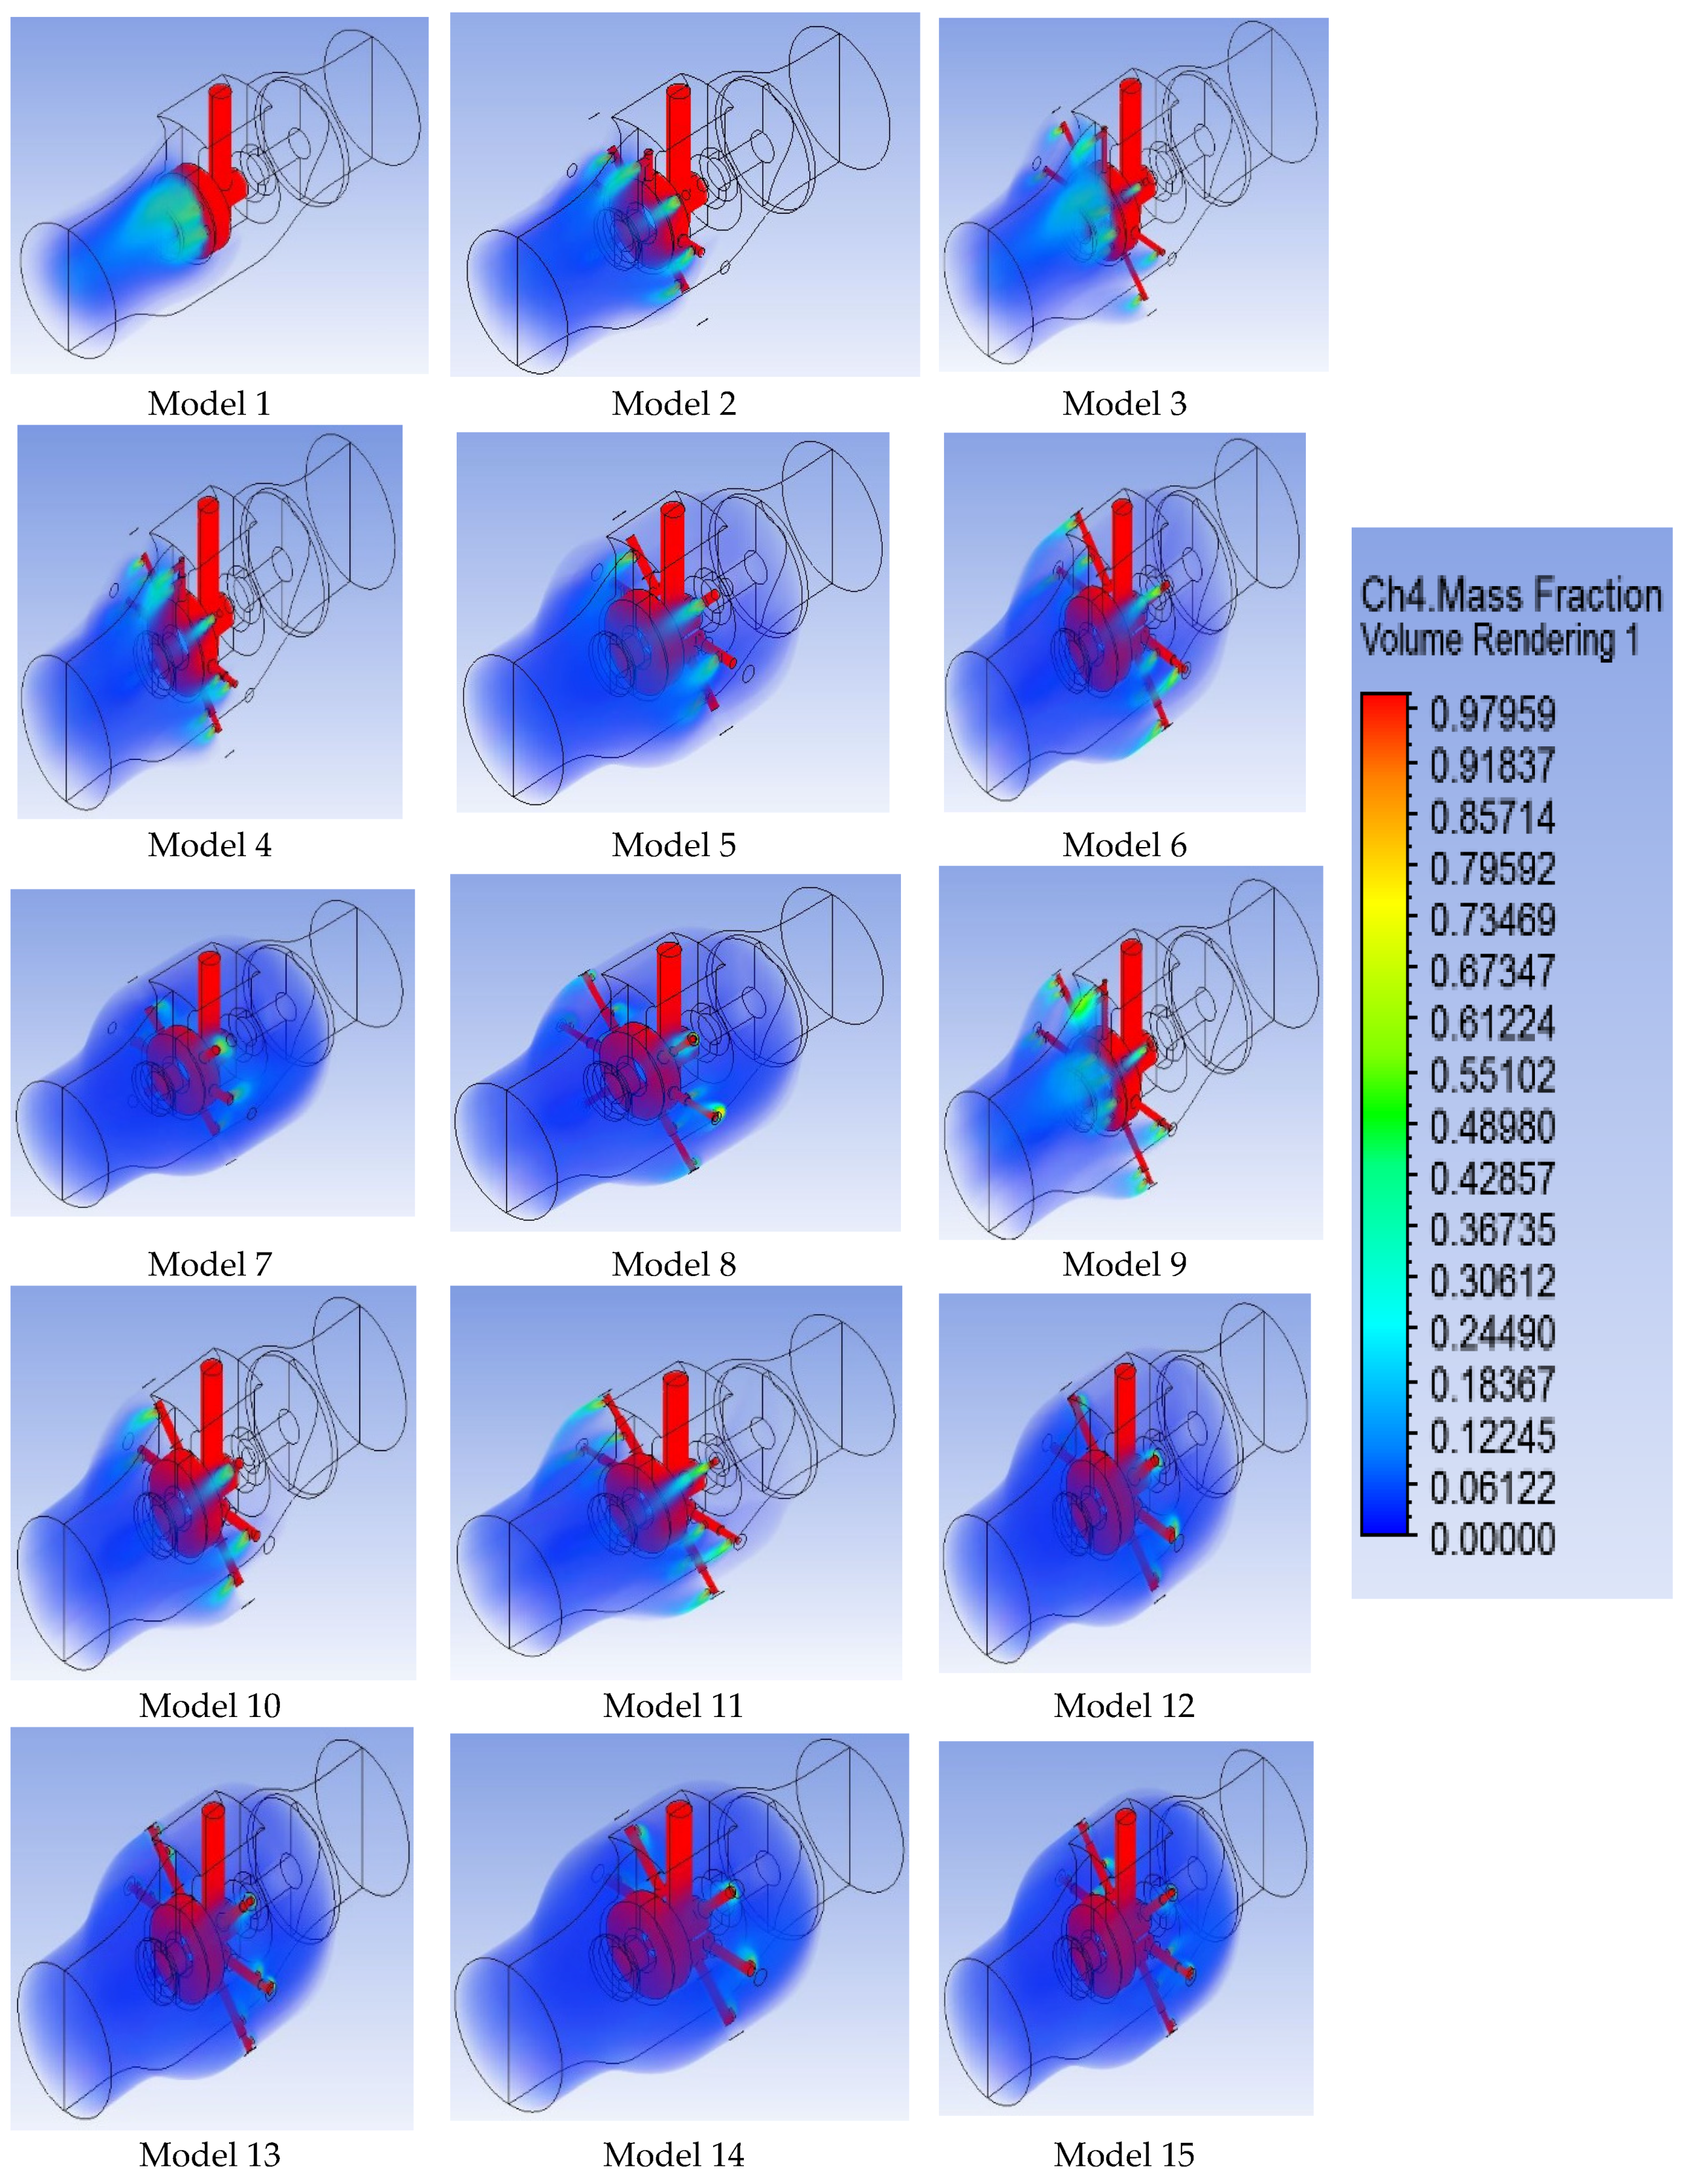
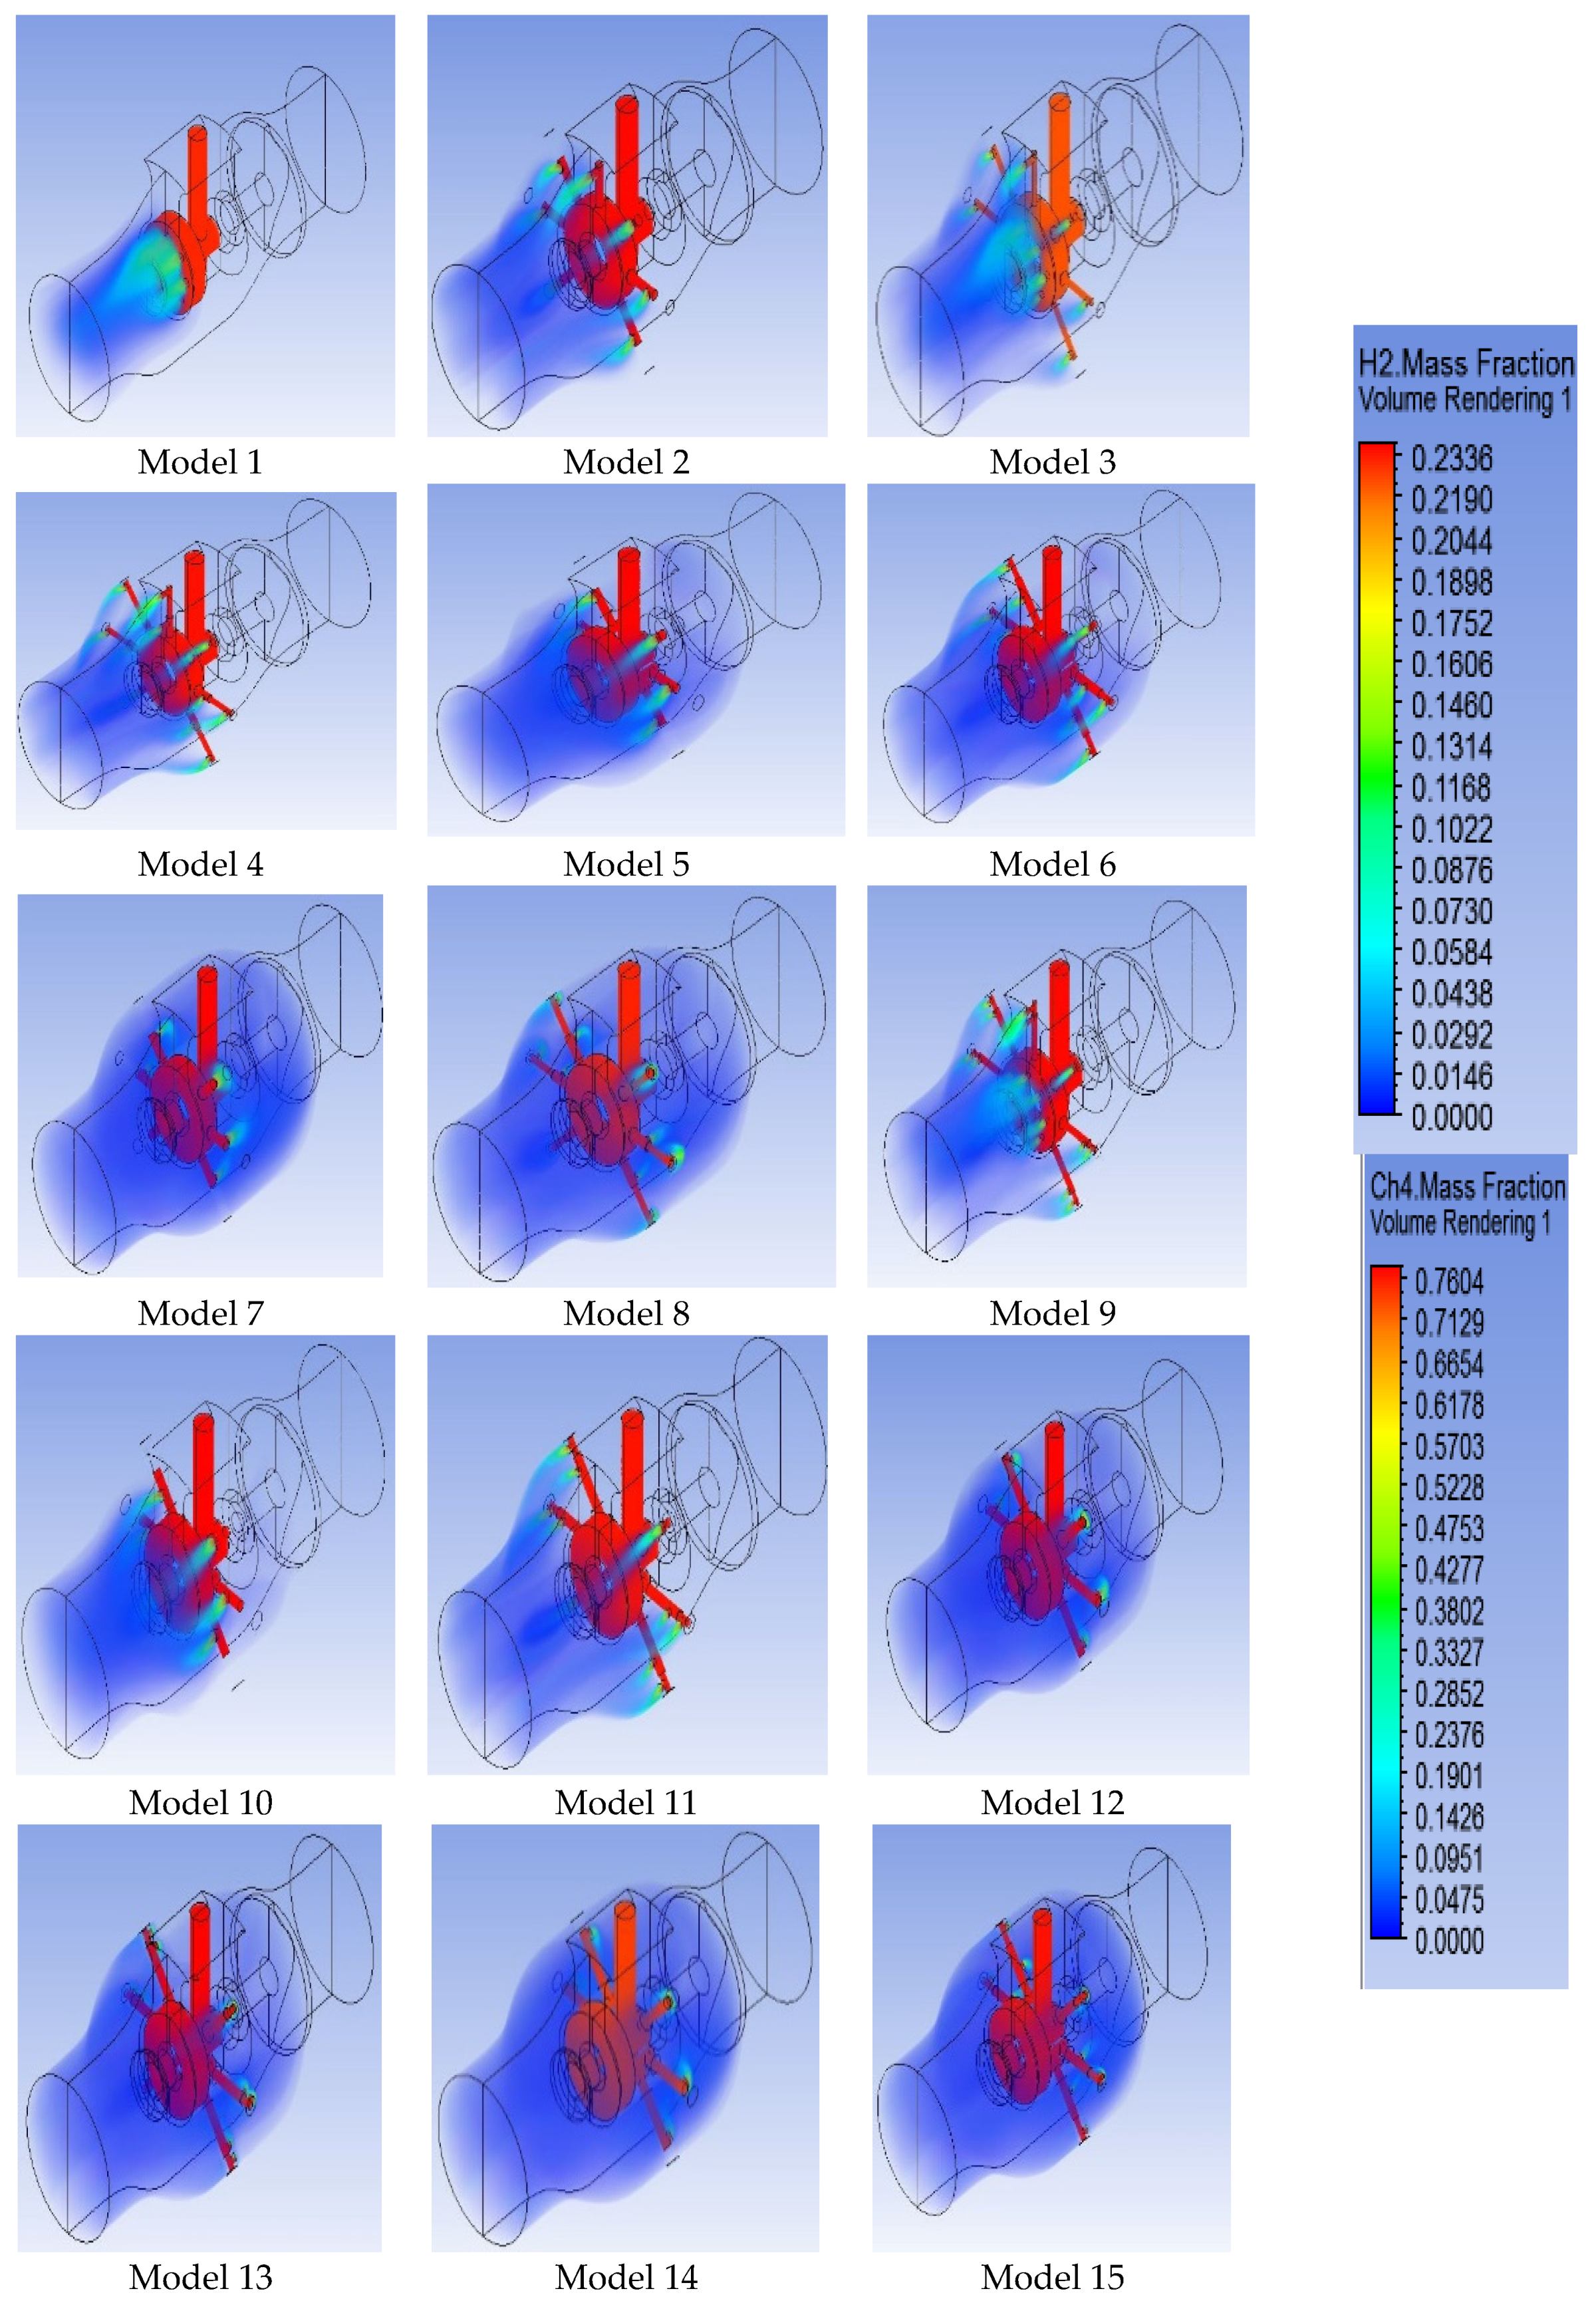
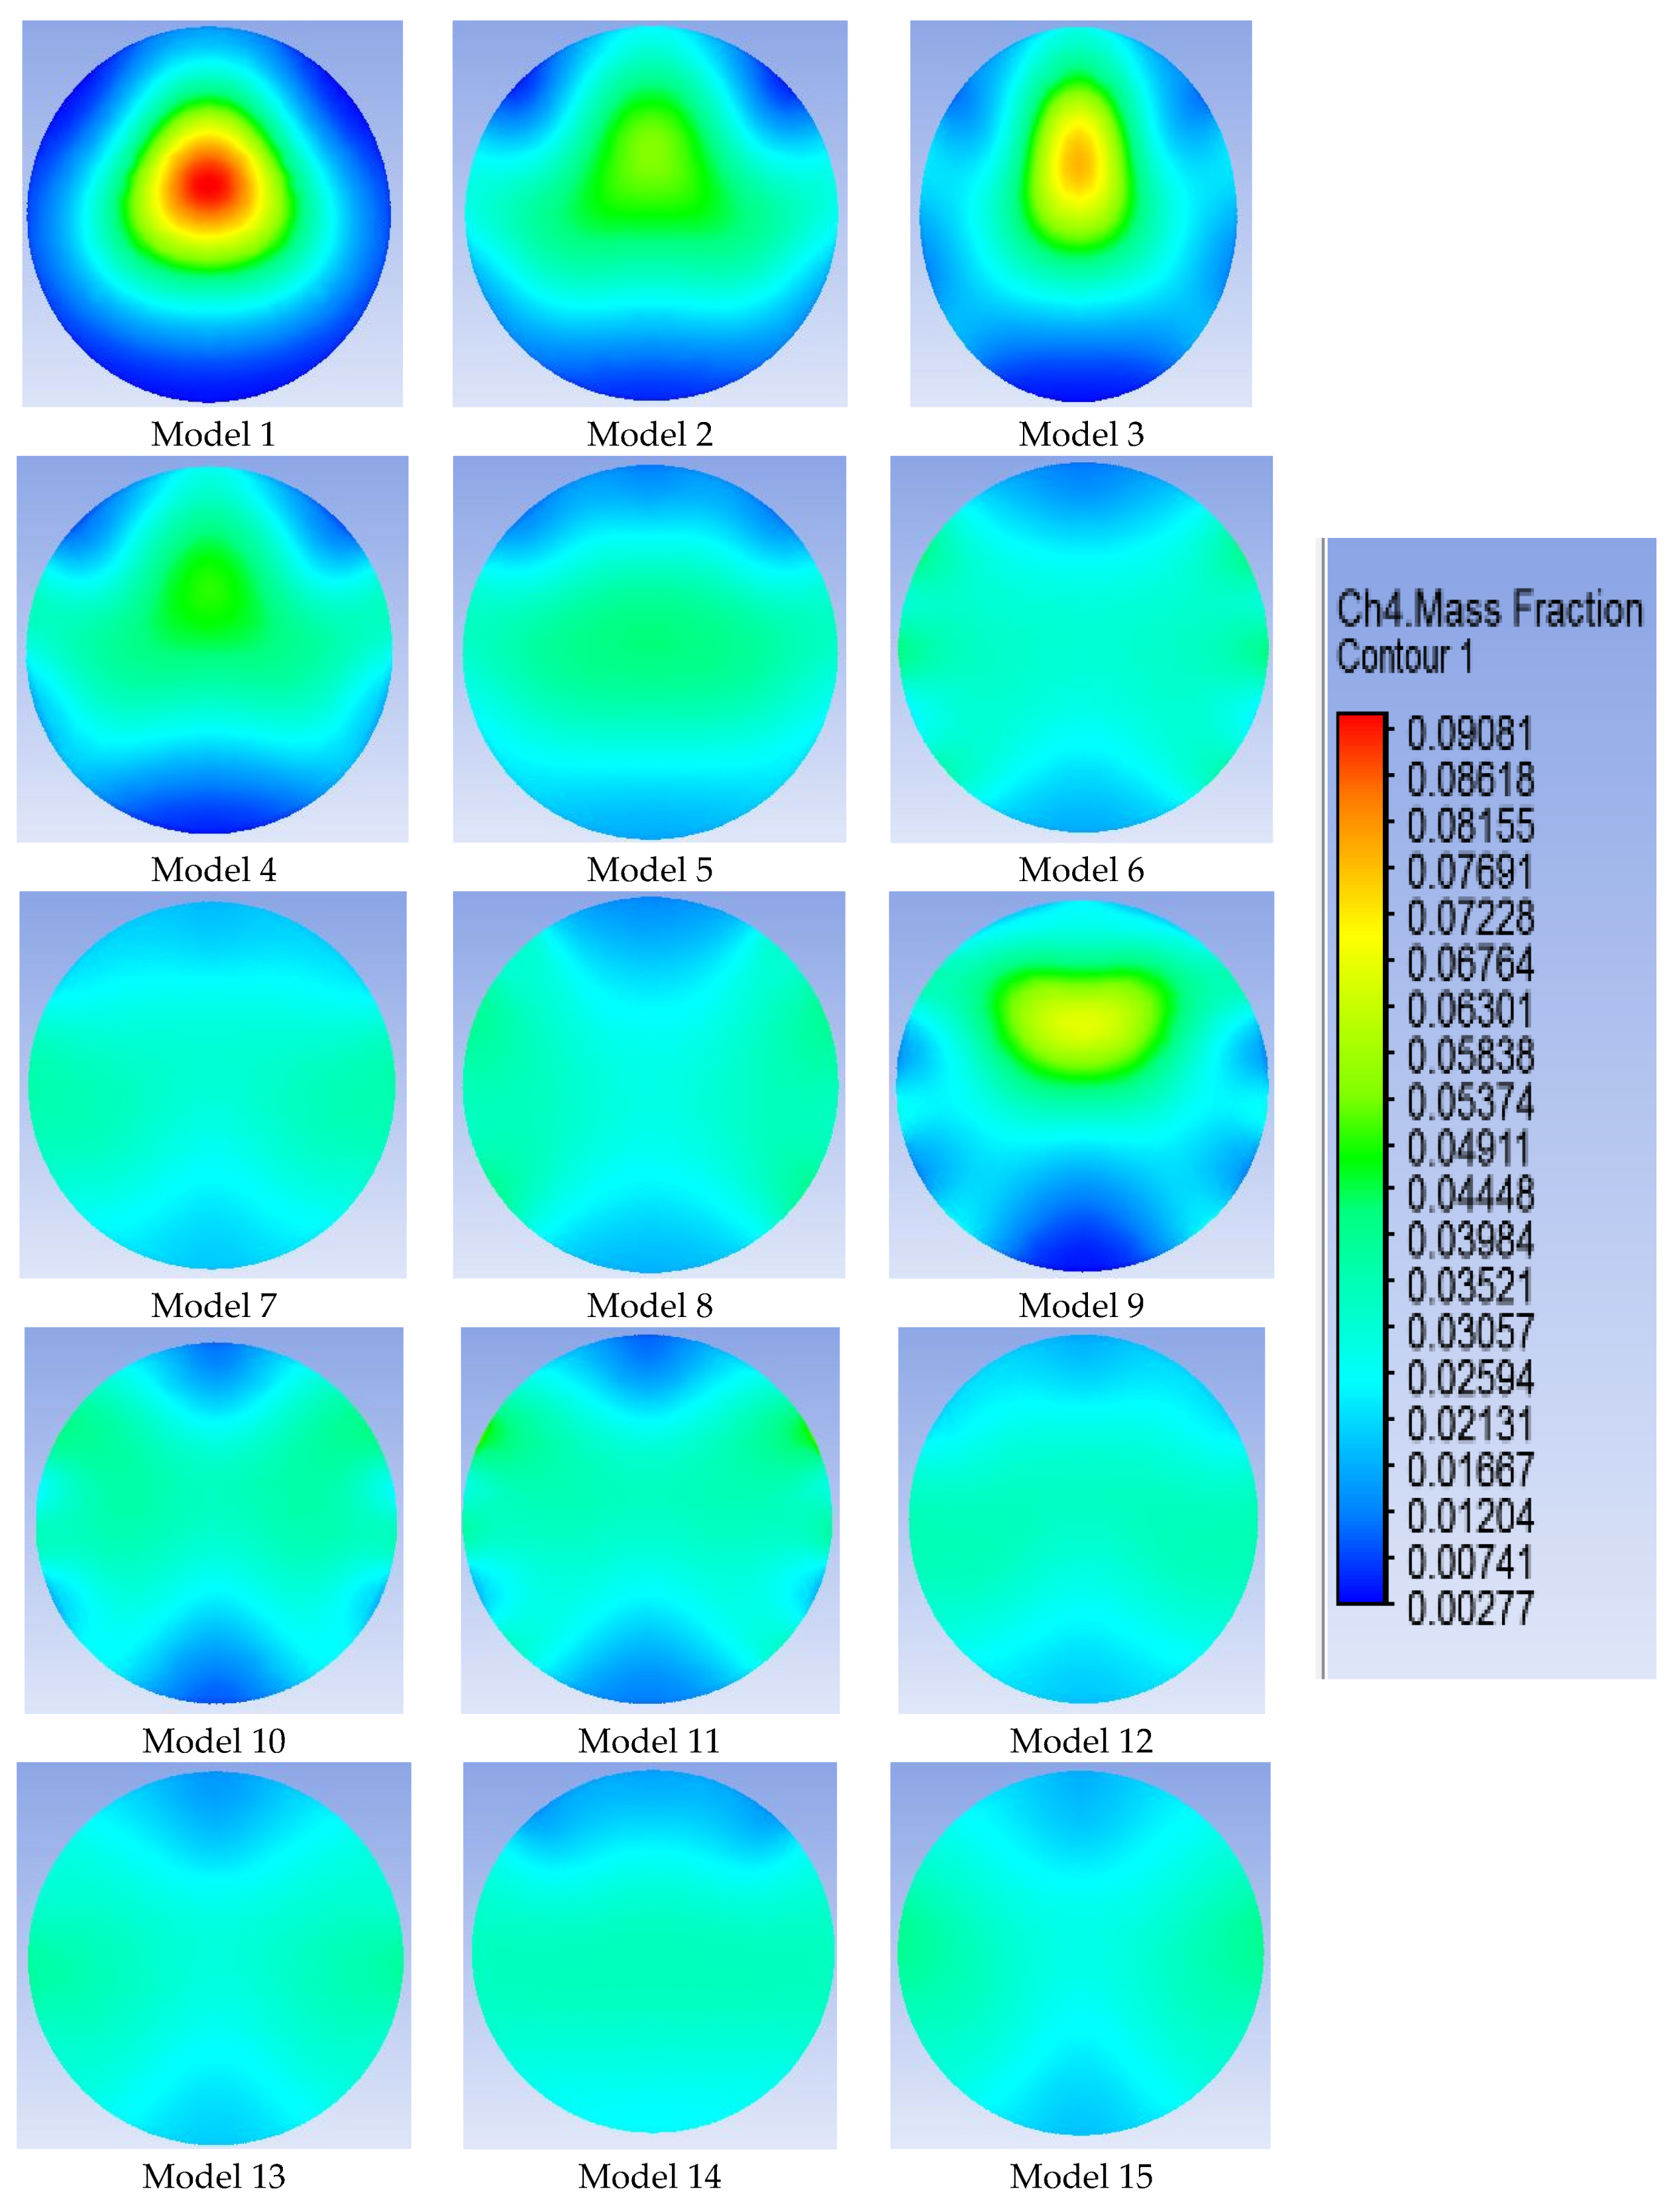
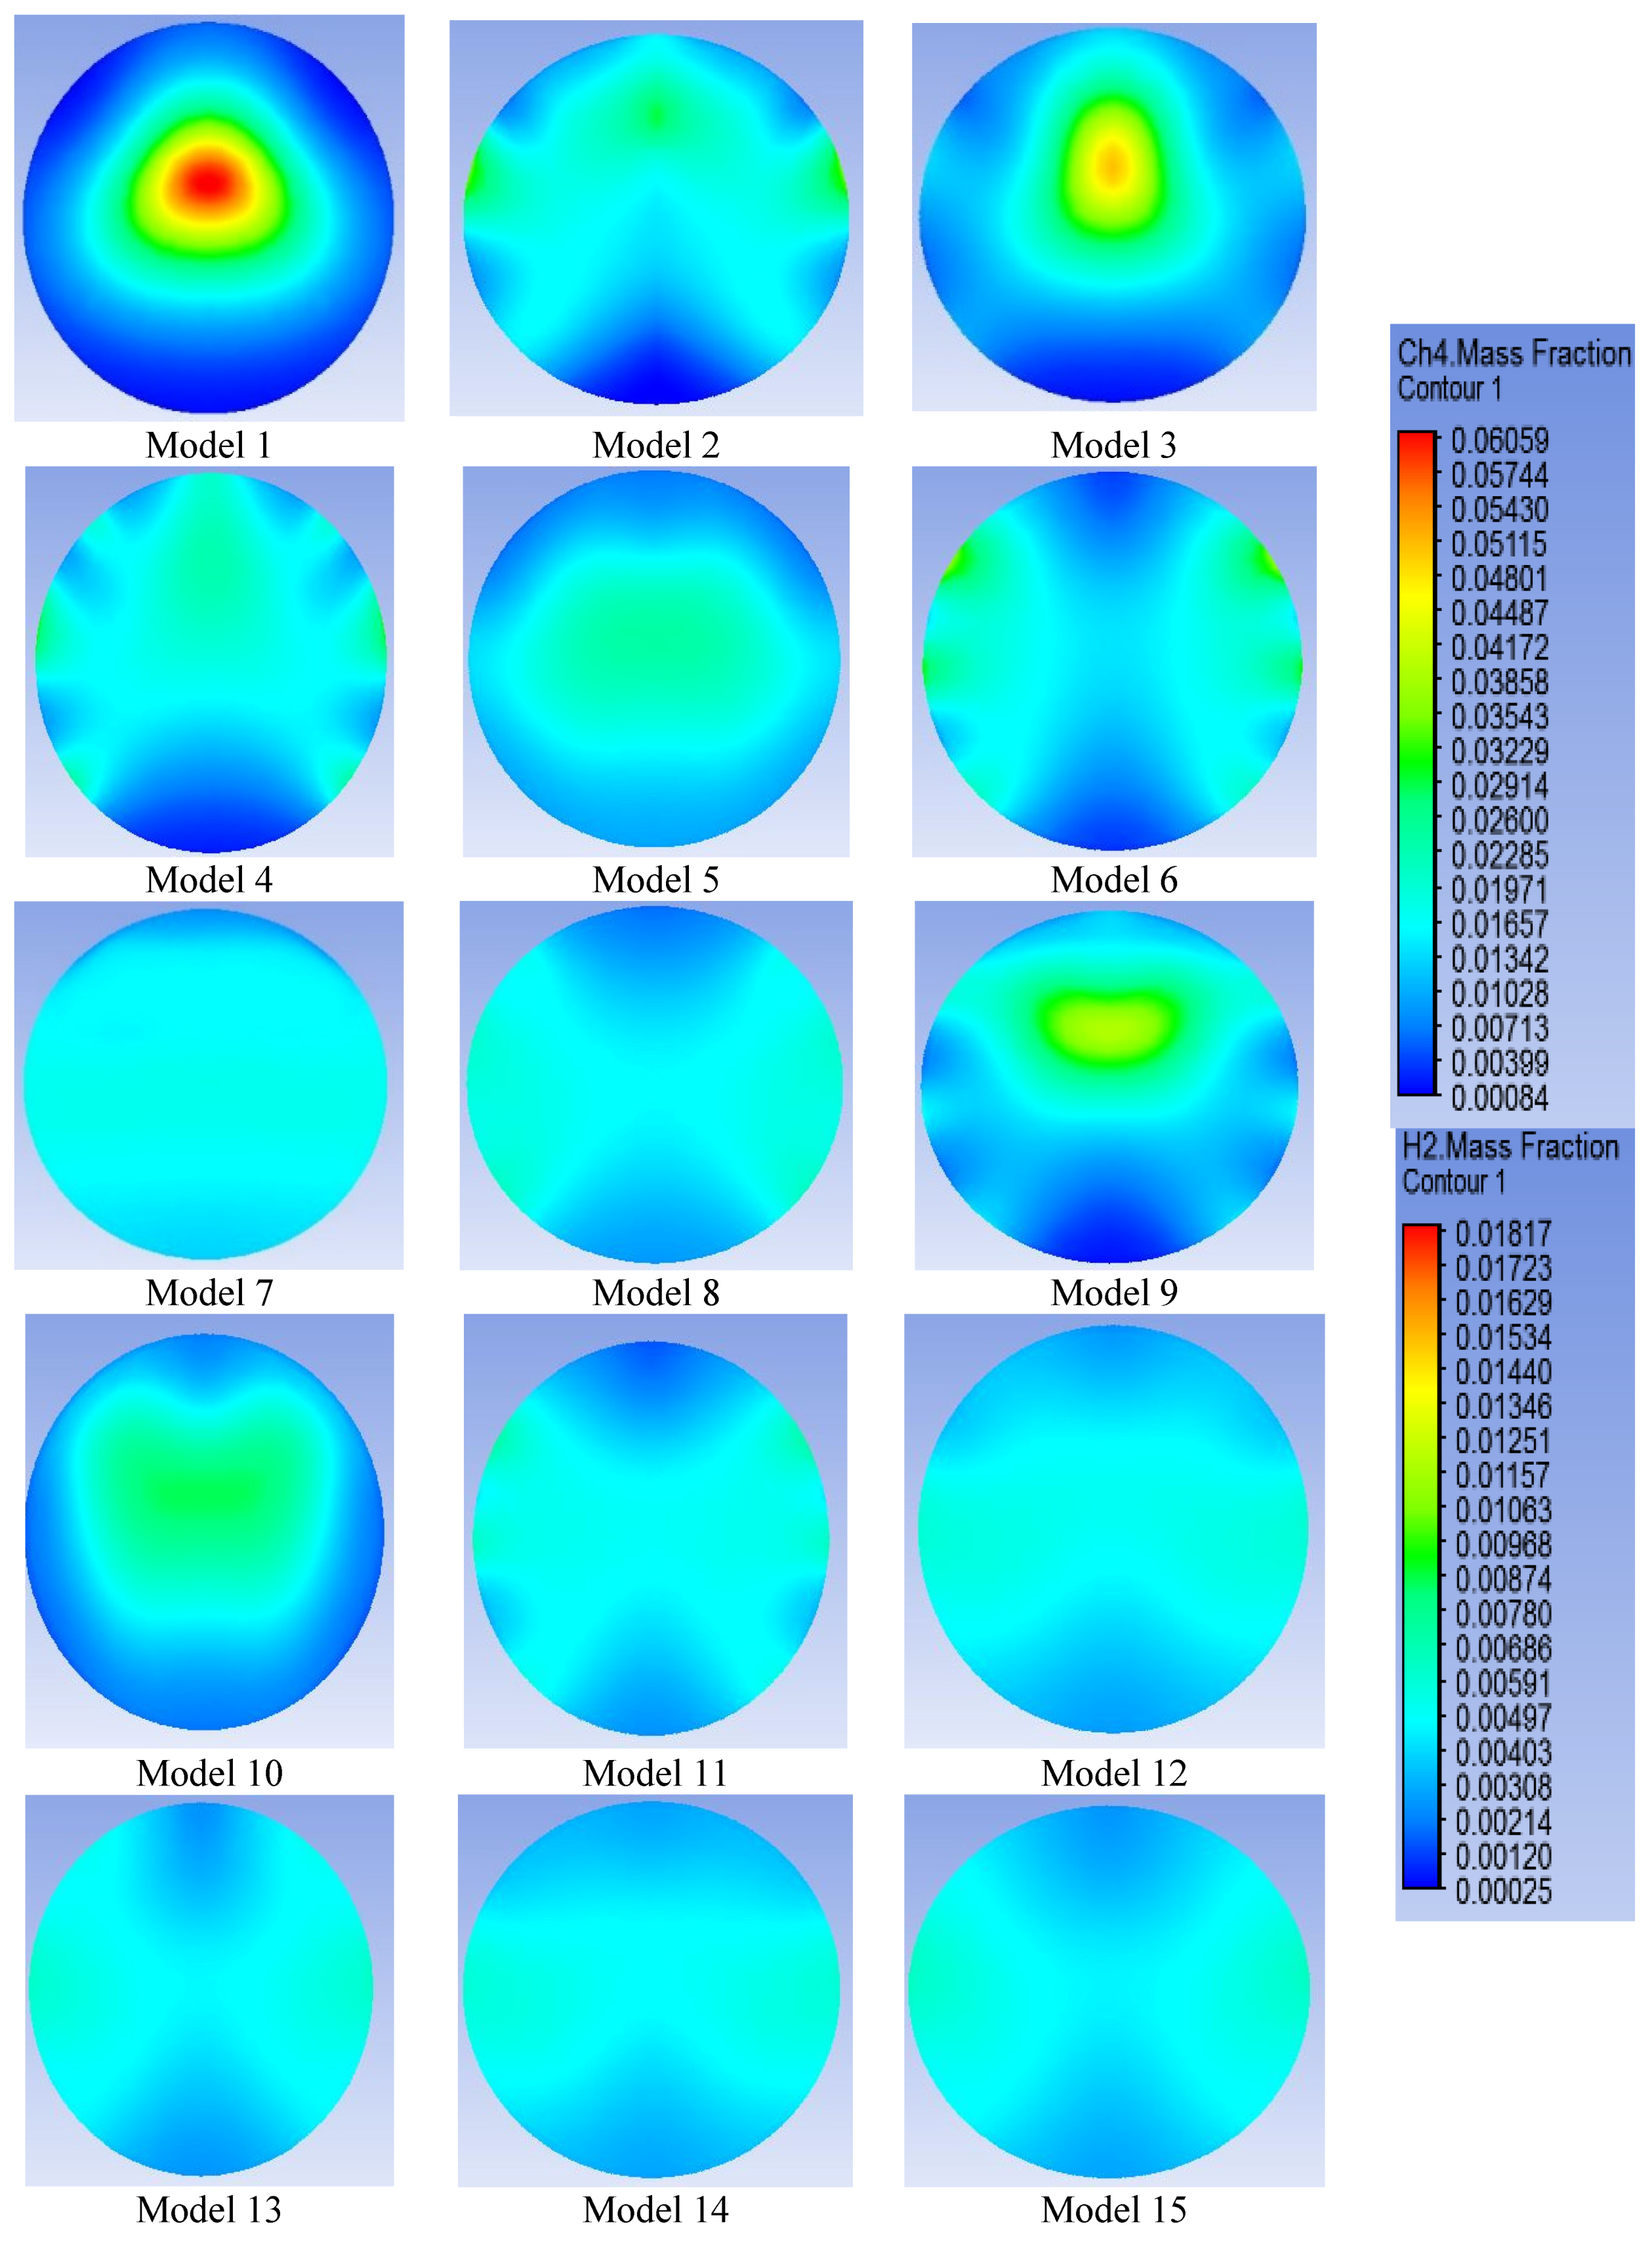
5.2. Distribution of Mass Fraction for Gaseous Fuel inside the New Mixer Models
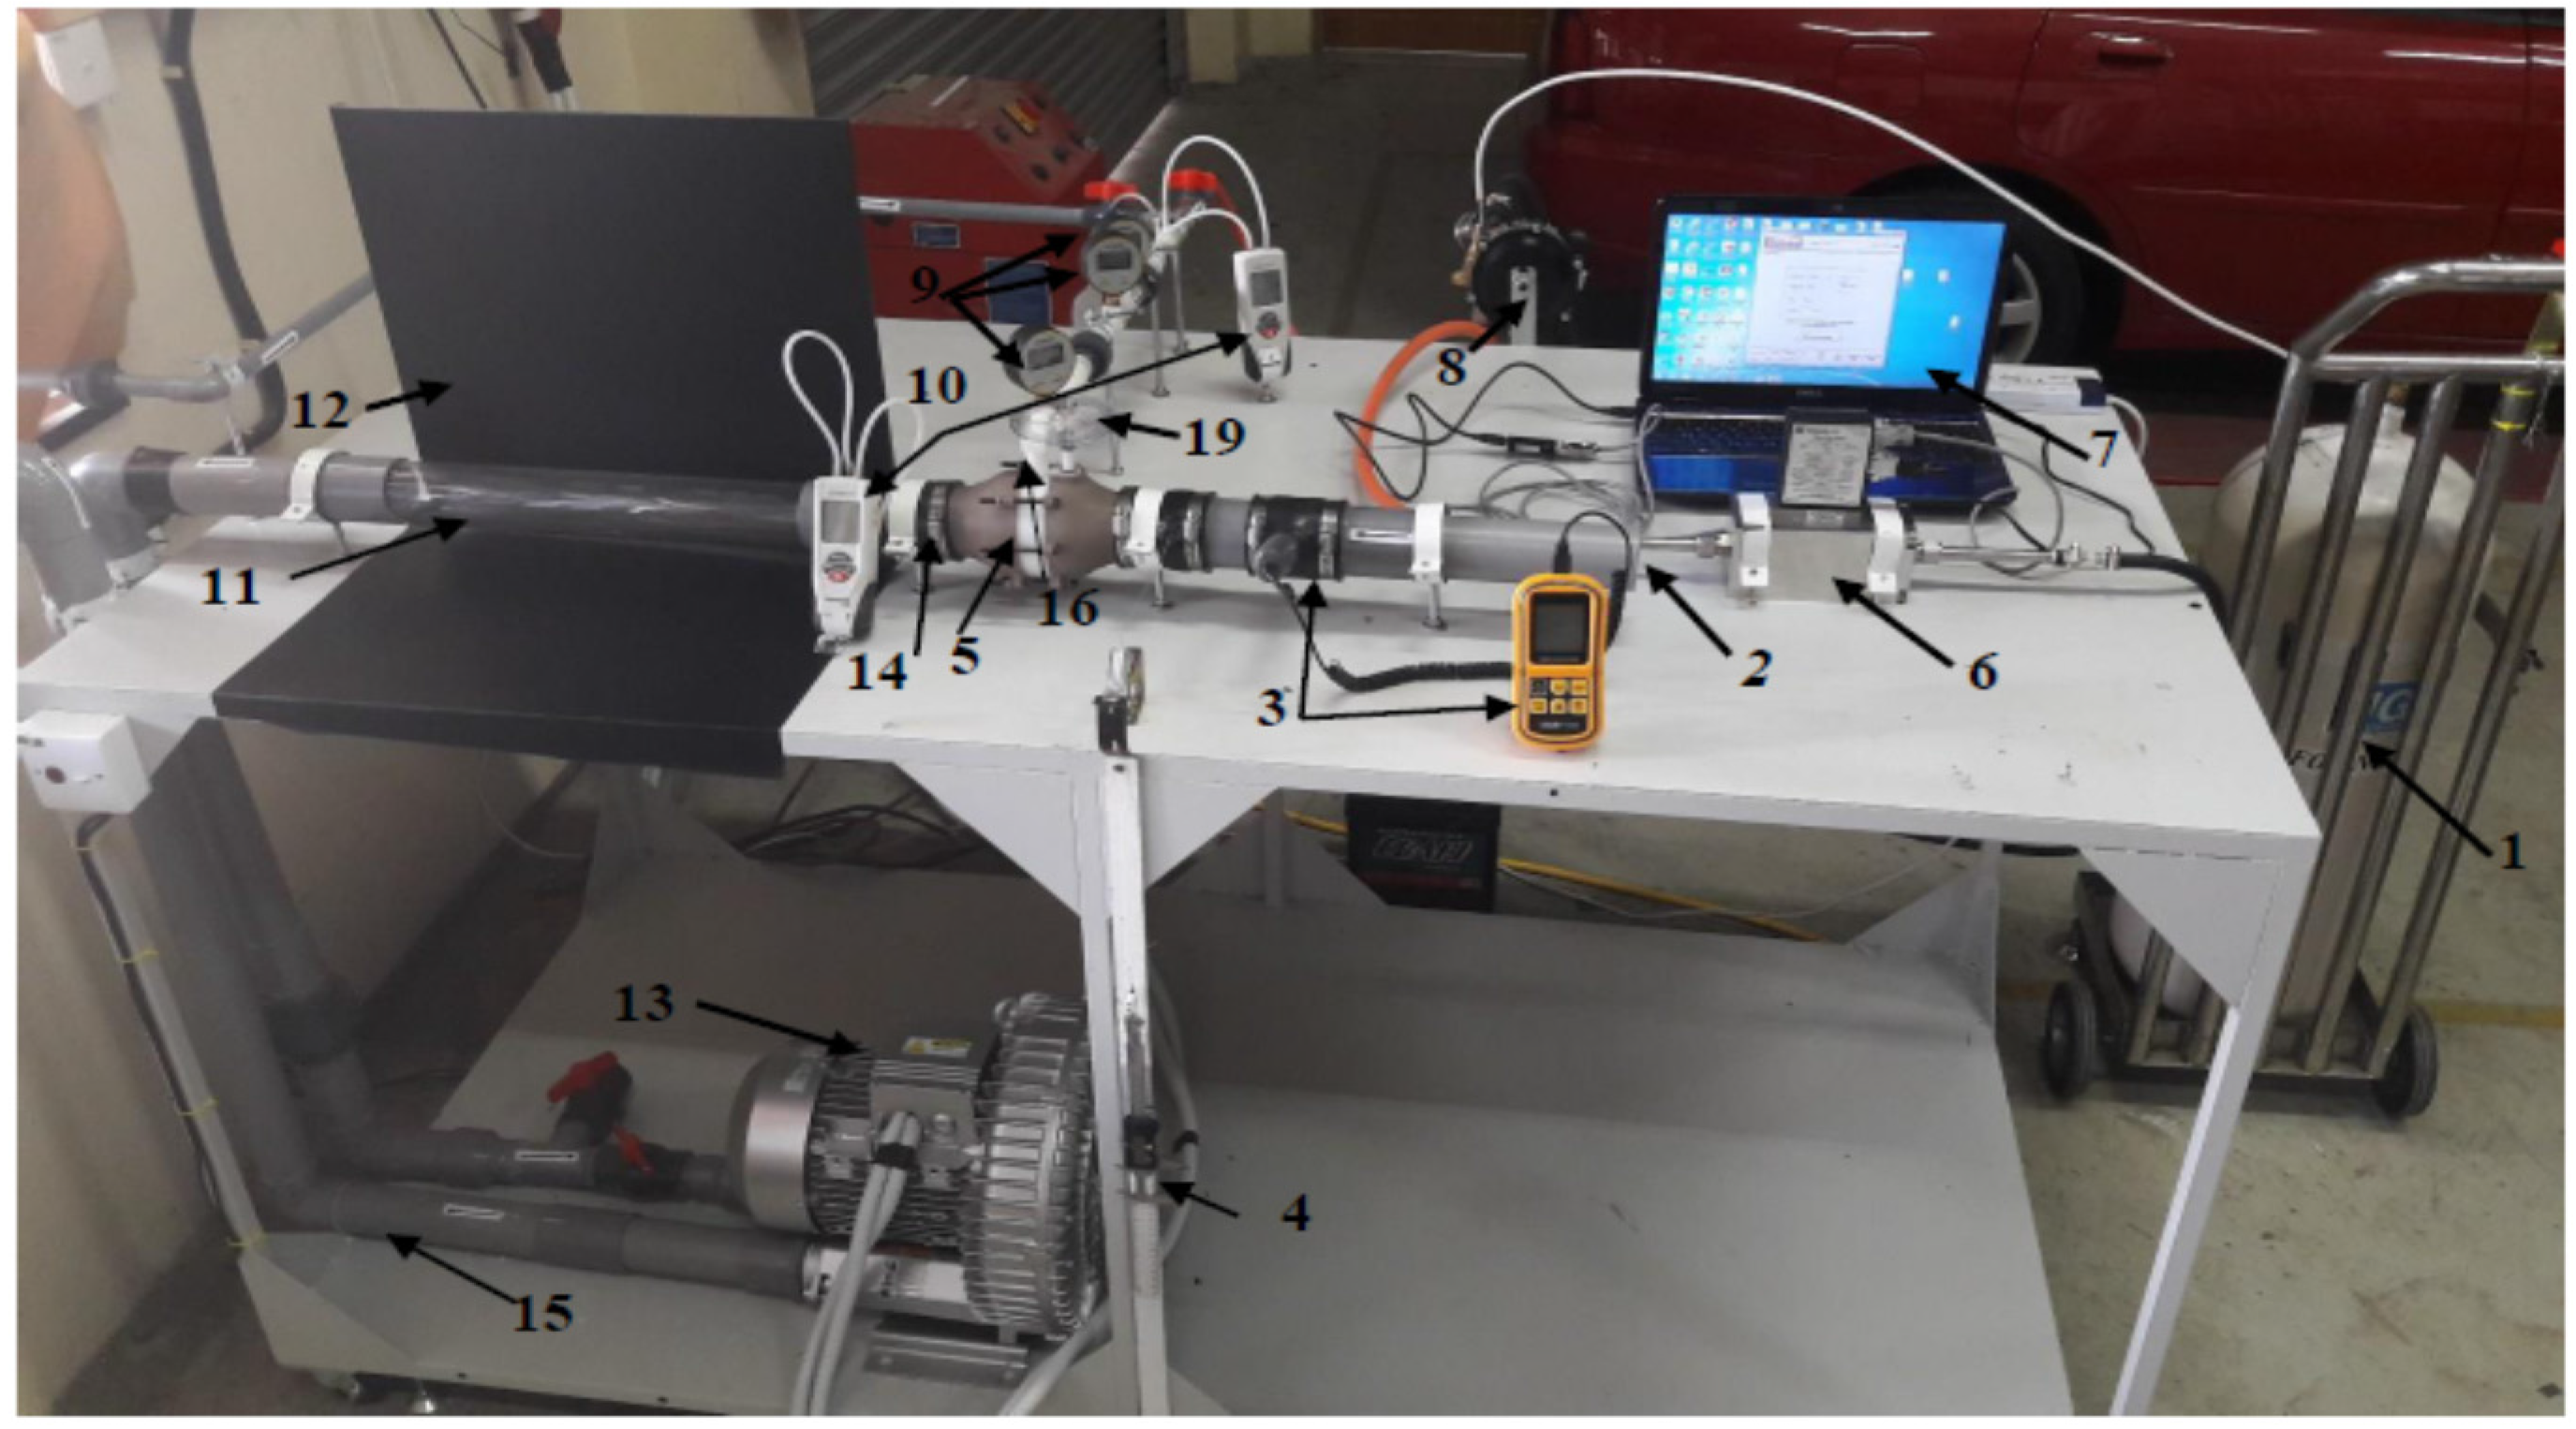
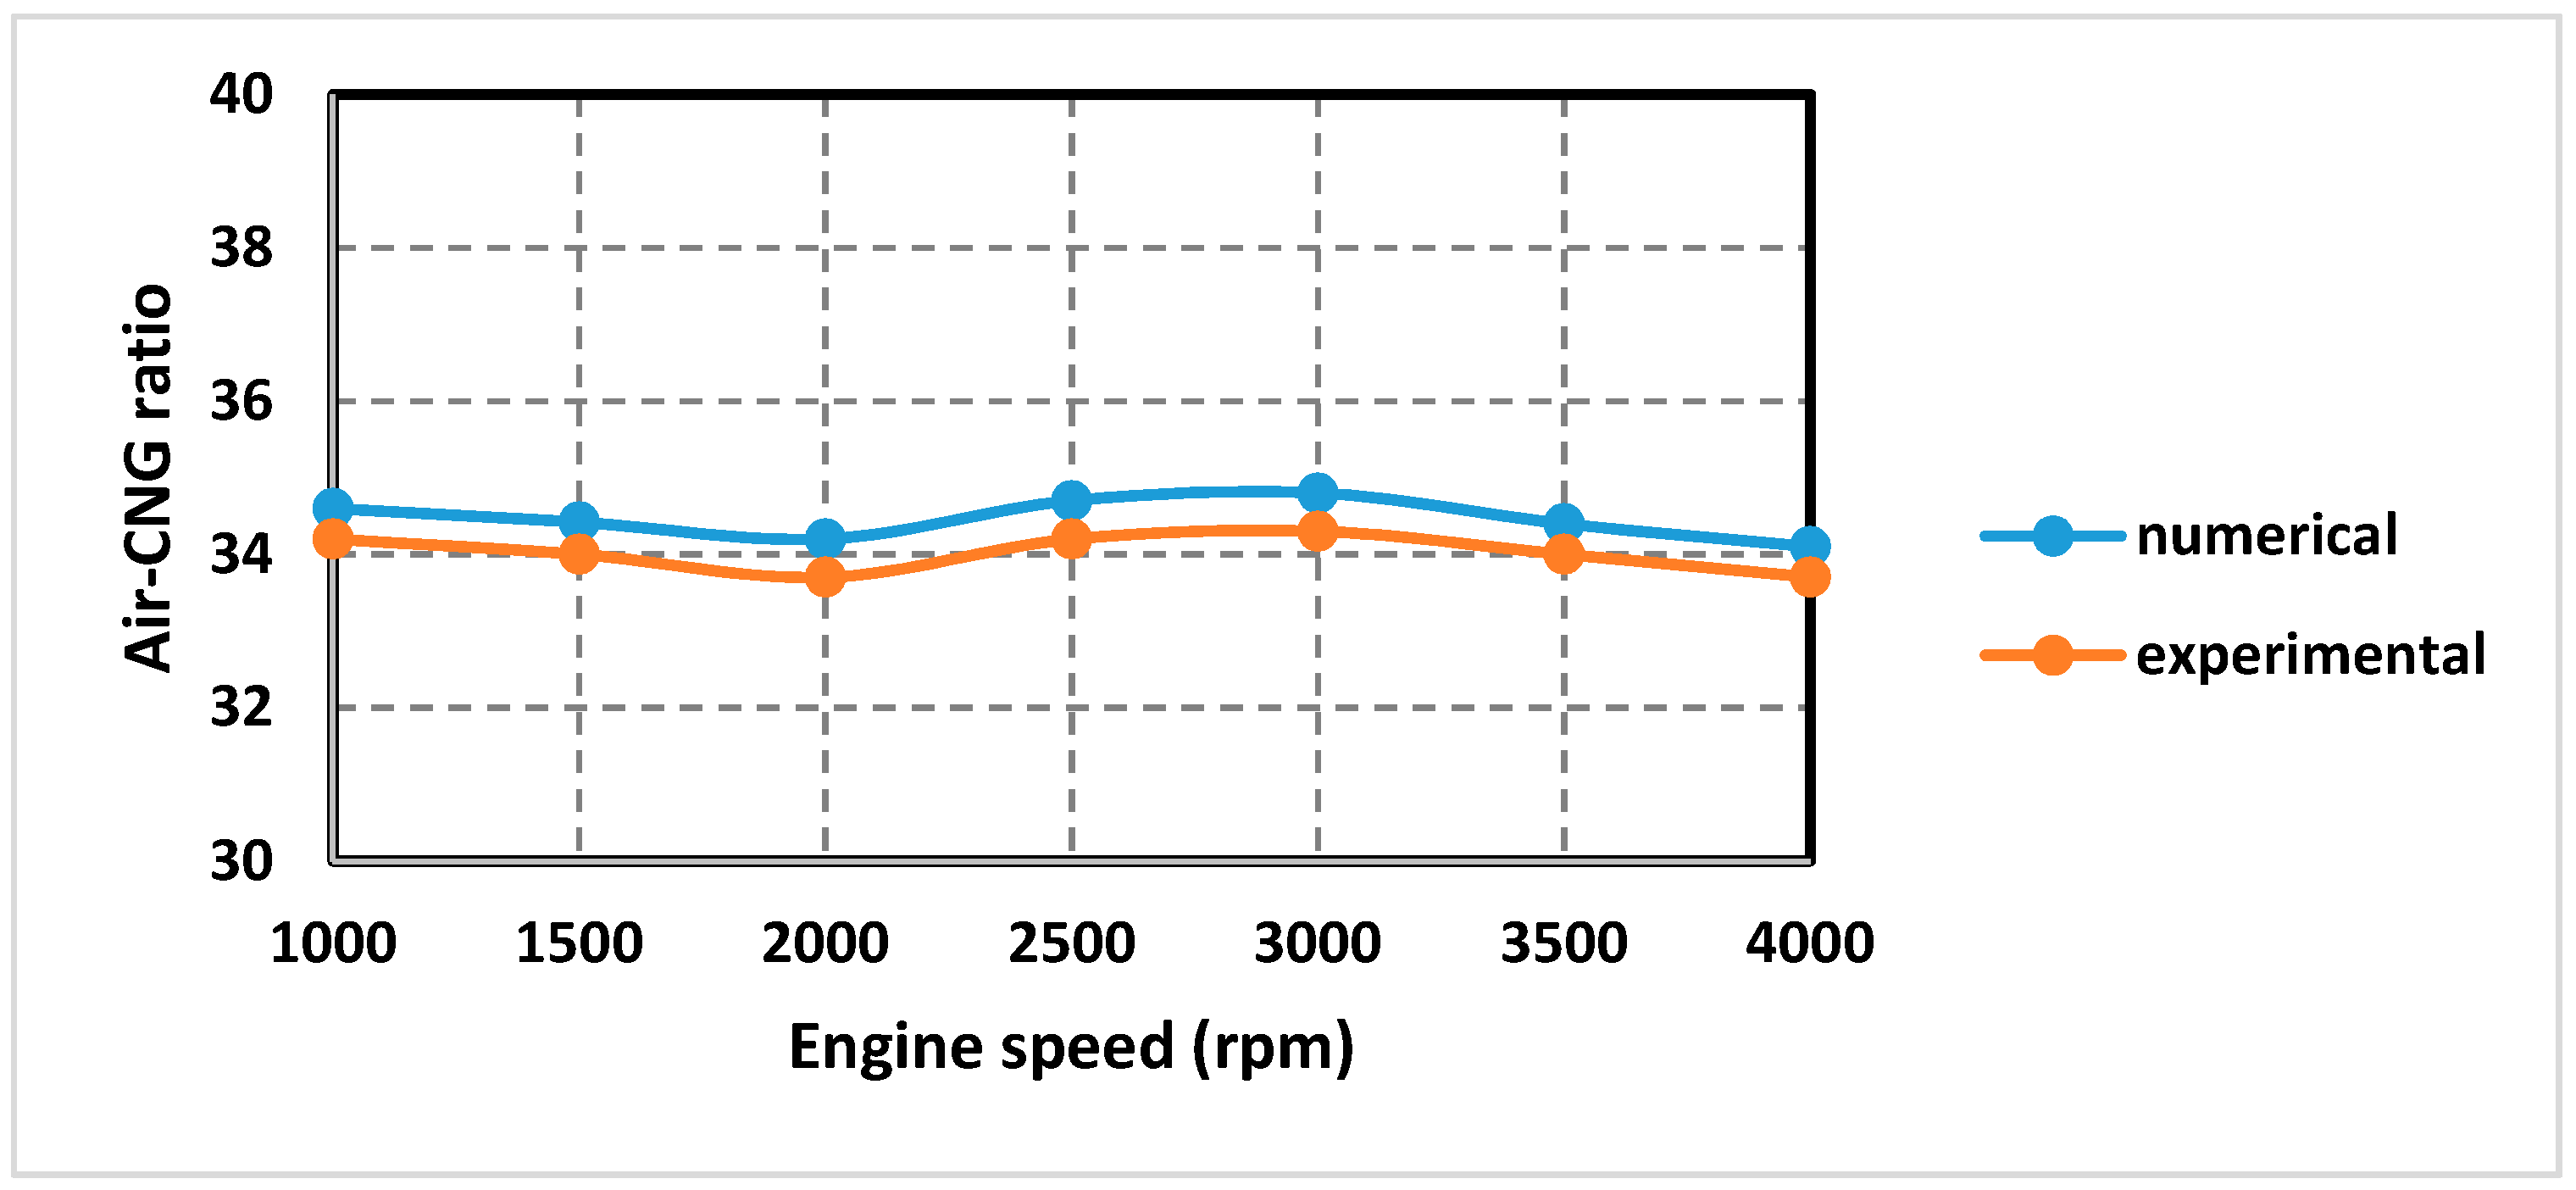
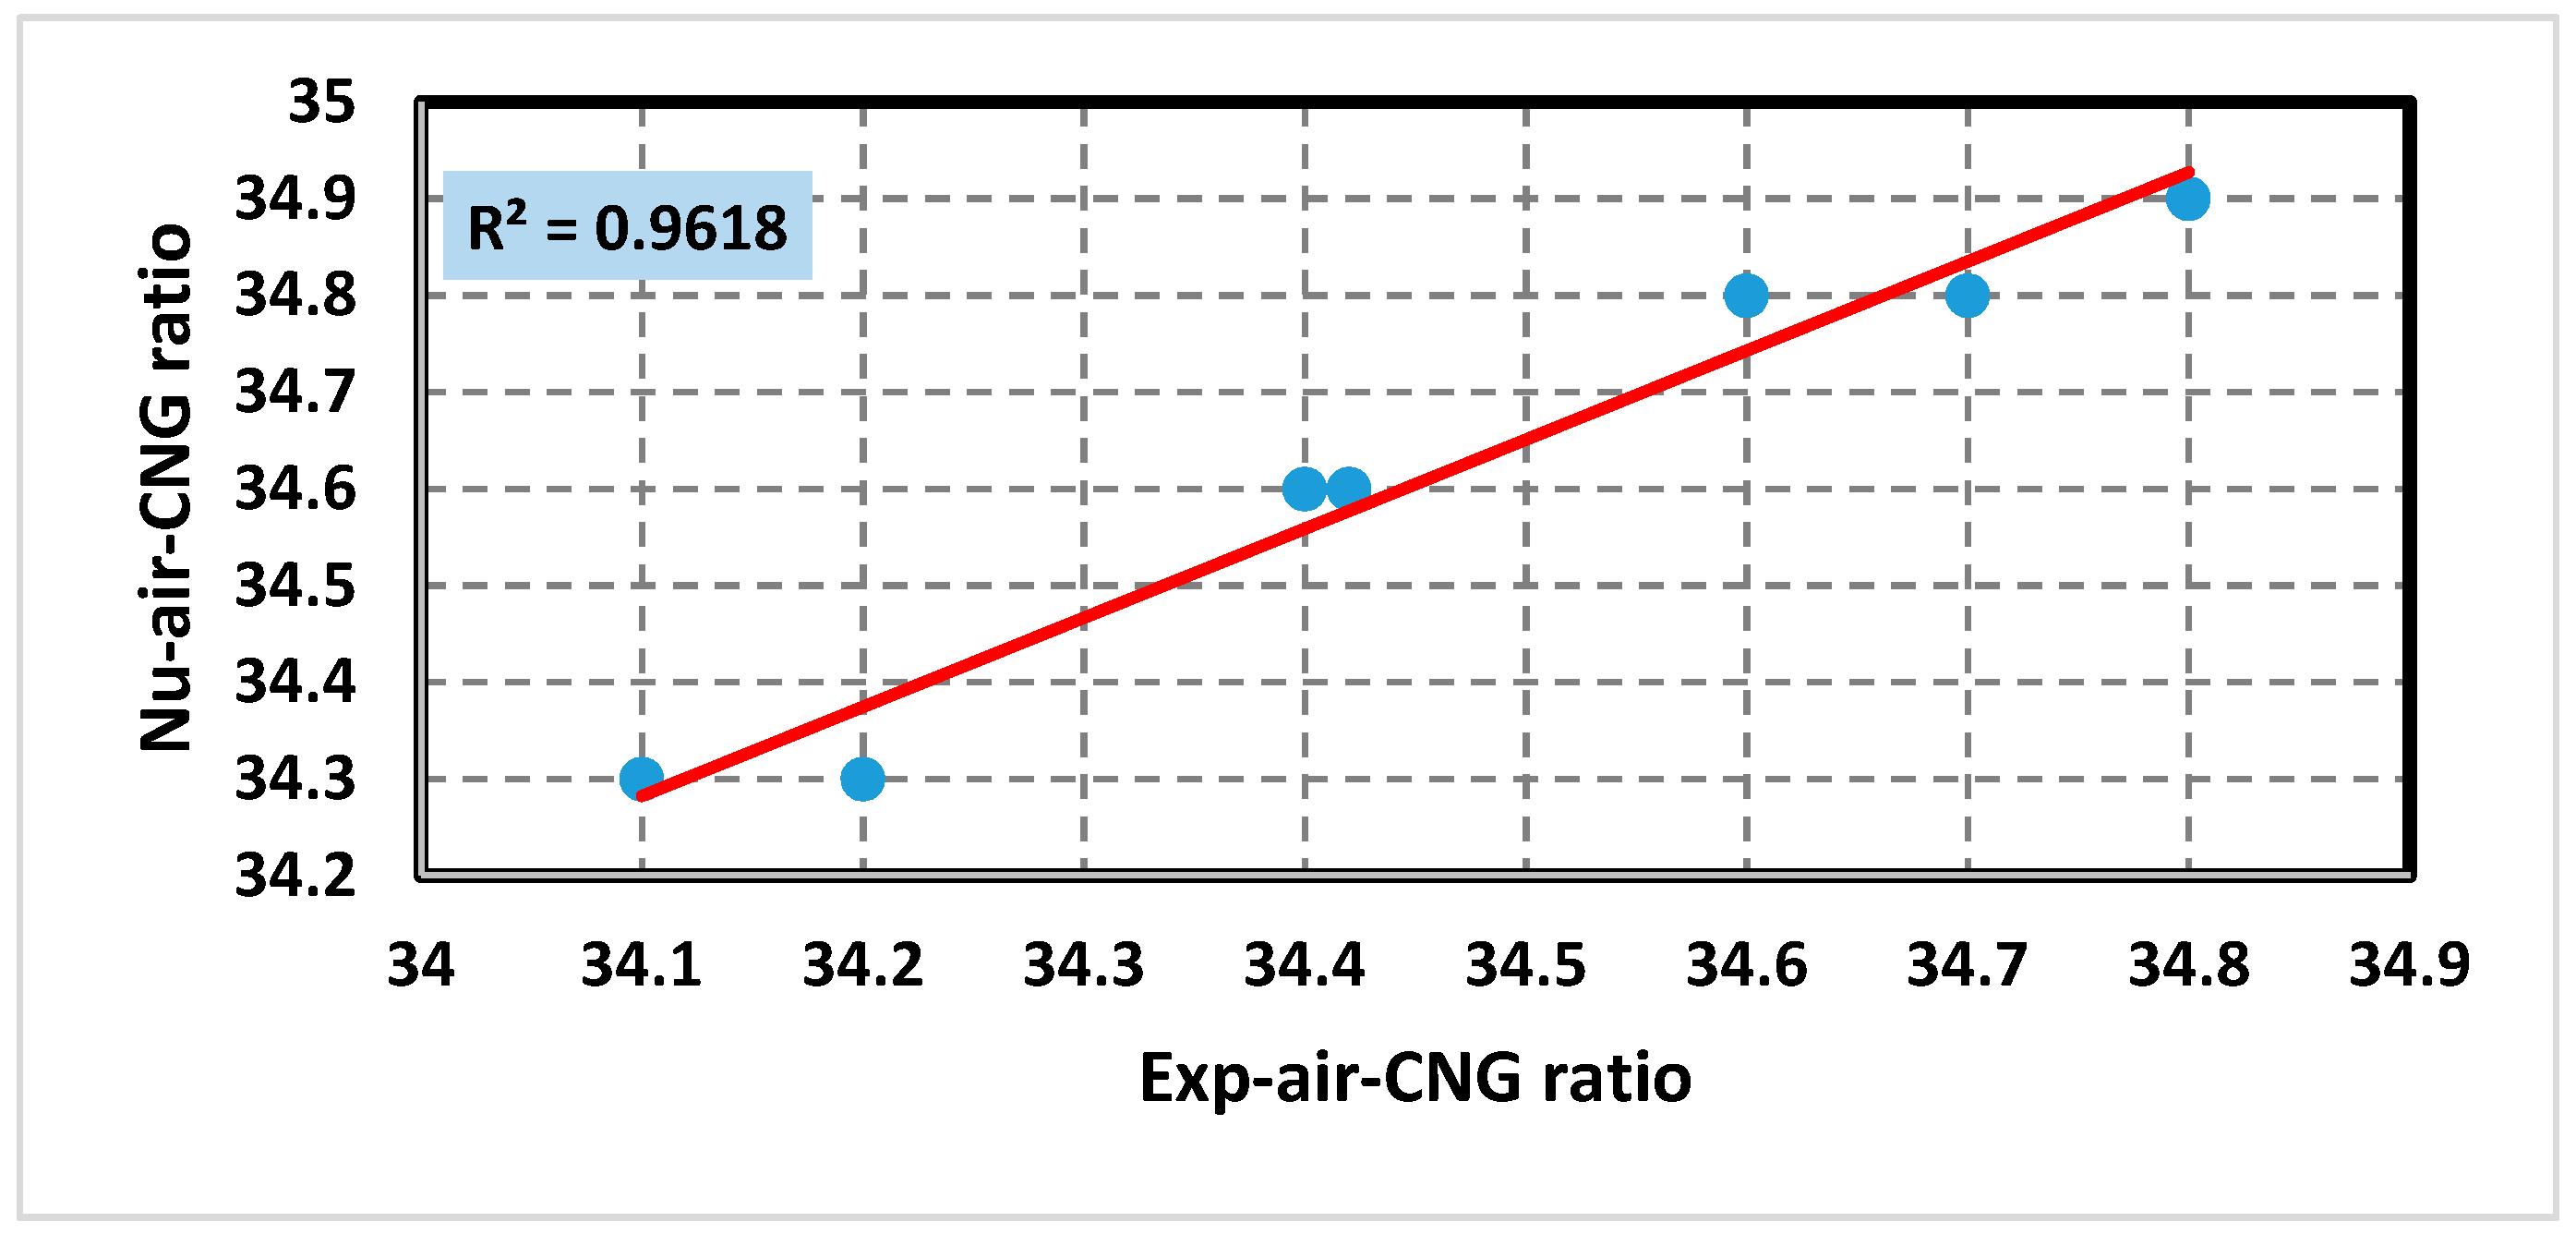
5.3. Verification of the CFD Results
6. Conclusions
Acknowledgments
Author Contributions
Conflicts of Interest
References
- Yaliwal, V.; Banapurmath, N.; Gireesh, N.; Hosmath, R.; Donateo, T.; Tewari, P. Effect of nozzle and combustion chamber geometry on the performance of a diesel engine operated on dual fuel mode using renewable fuels. Renew. Energy 2016, 93, 483–501. [Google Scholar] [CrossRef]
- Paul, A.; Panua, R.S.; Debroy, D.; Bose, P.K. An experimental study of the performance, combustion and emission characteristics of a CI engine under dual fuel mode using CNG and oxygenated pilot fuel blends. Energy 2015, 86, 560–573. [Google Scholar] [CrossRef]
- Liu, J.; Zhang, X.; Wang, T.; Zhang, J.; Wang, H. Experimental and numerical study of the pollution formation in a diesel/CNG dual fuel engine. Fuel 2015, 159, 418–429. [Google Scholar] [CrossRef]
- Wei, L.; Geng, P. A review on natural gas/diesel dual fuel combustion, emissions and performance. Fuel Process. Technol. 2016, 142, 264–278. [Google Scholar] [CrossRef]
- Abagnale, C.; Cameretti, M.; De Simio, L.; Gambino, M.; Iannaccone, S.; Tuccillo, R. Numerical simulation and experimental test of dual fuel operated diesel engines. Appl. Therm. Eng. 2014, 65, 403–417. [Google Scholar] [CrossRef]
- Zhang, C.-H.; Song, J.-T. Experimental study of co-combustion ratio on fuel consumption and emissions of NG-diesel dual-fuel heavy-duty engine equipped with a common rail injection system. J. Energy Inst. 2015, 89, 578–585. [Google Scholar] [CrossRef]
- Chintala, V.; Subramanian, K. CFD analysis on effect of localized in-cylinder temperature on nitric oxide (NO) emission in a compression ignition engine under hydrogen-diesel dual-fuel mode. Energy 2016, 116, 470–488. [Google Scholar] [CrossRef]
- Yang, Z.; Chu, C.; Wang, L.; Huang, Y. Effects of H2 addition on combustion and exhaust emissions in a diesel engine. Fuel 2015, 139, 190–197. [Google Scholar] [CrossRef]
- Sancho Casarrubios, D. Modelling and CNG Distribution Study of a Natural Gas-Diesel Dual Fuel Engine. Master’ Thesis, Lund University, Skane, Sweden, 2015. [Google Scholar]
- Yang, B.; Xi, C.; Wei, X.; Zeng, K.; Lai, M.-C. Parametric investigation of natural gas port injection and diesel pilot injection on the combustion and emissions of a turbocharged common rail dual-fuel engine at low load. Appl. Energy 2015, 143, 130–137. [Google Scholar] [CrossRef]
- Li, W.; Liu, Z.; Wang, Z. Experimental and theoretical analysis of the combustion process at low loads of a diesel natural gas dual-fuel engine. Energy 2016, 94, 728–741. [Google Scholar] [CrossRef]
- Papagiannakis, R.; Kotsiopoulos, P.; Zannis, T.; Yfantis, E.; Hountalas, D.; Rakopoulos, C. Theoretical study of the effects of engine parameters on performance and emissions of a pilot ignited natural gas diesel engine. Energy 2010, 35, 1129–1138. [Google Scholar] [CrossRef]
- Maghbouli, A.; Saray, R.K.; Shafee, S.; Ghafouri, J. Numerical study of combustion and emission characteristics of dual-fuel engines using 3D-CFD models coupled with chemical kinetics. Fuel 2013, 106, 98–105. [Google Scholar] [CrossRef]
- Mattarelli, E.; Rinaldini, C.A.; Golovitchev, V.I. CFD-3D analysis of a light duty Dual Fuel (Diesel/Natural Gas) combustion engine. Energy Procedia 2014, 45, 929–937. [Google Scholar] [CrossRef]
- Egúsquiza, J.; Braga, S.; Braga, C. Performance and gaseous emissions characteristics of a natural gas/diesel dual fuel turbocharged and aftercooled engine. J. Braz. Soc. Mech. Sci. Eng. 2009, 31, 142–150. [Google Scholar] [CrossRef]
- Papagiannakis, R.; Rakopoulos, C.; Hountalas, D.; Rakopoulos, D. Emission characteristics of high speed, dual fuel, compression ignition engine operating in a wide range of natural gas/diesel fuel proportions. Fuel 2010, 89, 1397–1406. [Google Scholar] [CrossRef]
- Ott, T.; Onder, C.; Guzzella, L. Hybrid-electric vehicle with natural gas-diesel engine. Energies 2013, 6, 3571–3592. [Google Scholar] [CrossRef]
- Arat, H.T.; Baltacioglu, M.K.; Özcanli, M.; Aydin, K. Effect of using Hydroxy–CNG fuel mixtures in a non-modified diesel engine by substitution of diesel fuel. Int. J. Hydrogen Energy 2016, 41, 8354–8363. [Google Scholar] [CrossRef]
- Song, H.; Liu, C.; Li, F.; Wang, Z.; He, X.; Shuai, S.; Wang, J. A comparative study of using diesel and PODEn as pilot fuels for natural gas dual-fuel combustion. Fuel 2017, 188, 418–426. [Google Scholar] [CrossRef]
- Wang, Z.; Zhao, Z.; Wang, D.; Tan, M.; Han, Y.; Liu, Z.; Dou, H. Impact of pilot diesel ignition mode on combustion and emissions characteristics of a diesel/natural gas dual fuel heavy-duty engine. Fuel 2016, 167, 248–256. [Google Scholar] [CrossRef]
- Abdullah, S.; Kurniawan, W.H.; Shamsudeen, A. Numerical analysis of the combustion process in a compressed natural gas direct injection engine. J. Appl. Fluid Mech. 2008, 1, 65–86. [Google Scholar]
- Semin, R.A.B. A technical review of compressed natural gas as an alternative fuel for internal combustion engines. Am. J. Eng. Appl. Sci 2008, 1, 302–311. [Google Scholar]
- Demirbas, A. Methane Gas Hydrate; Springer Science & Business Media: Londen, UK, 2010. [Google Scholar]
- Khan, M.I.; Yasmin, T.; Shakoor, A. Technical overview of compressed natural gas (CNG) as a transportation fuel. Renew. Sustain. Energy Rev. 2015, 51, 785–797. [Google Scholar] [CrossRef]
- Khan, M.I.; Yasmeen, T.; Khan, M.I.; Farooq, M.; Wakeel, M. Research progress in the development of natural gas as fuel for road vehicles: A bibliographic review (1991–2016). Renew. Sustain. Energy Rev. 2016, 66, 702–741. [Google Scholar] [CrossRef]
- Bae, C.; Kim, J. Alternative fuels for internal combustion engines. Proc. Combust. Inst. 2017, 36, 3389–3413. [Google Scholar] [CrossRef]
- Jia, Z.; Denbratt, I. Effects of Natural Gas Percentage on Performance and Emissions of a Natural Gas/Diesel Dual-Fuel Engine. In Sustainable Automotive Technologies 2014; Springer Nature: New York, NY, USA, 2014; pp. 181–188. [Google Scholar]
- Khan, M.I.; Yasmin, T.; Shakoor, A. International experience with compressed natural gas (CNG) as environmental friendly fuel. Energy Syst. 2015, 6, 507–531. [Google Scholar] [CrossRef]
- Nithyanandan, K.; Lin, Y.; Donahue, R.; Meng, X.; Zhang, J.; Chia-fon, F.L. Characterization of soot from diesel-CNG dual-fuel combustion in a CI engine. Fuel 2016, 184, 145–152. [Google Scholar] [CrossRef]
- Carlucci, A.; de Risi, A.D.; Laforgia, D.; Naccarato, F. Experimental investigation and combustion analysis of a direct injection dual-fuel diesel-natural gas engine. Energy 2008, 33, 256–263. [Google Scholar] [CrossRef]
- Abdelaal, M.; Hegab, A. Combustion and emission characteristics of a natural gas-fueled diesel engine with EGR. Energy Convers. Manag. 2012, 64, 301–312. [Google Scholar] [CrossRef]
- Zurbriggen, F.; Hutter, R.; Onder, C. Diesel-minimal combustion control of a natural gas-diesel engine. Energies 2016, 9, 58. [Google Scholar] [CrossRef]
- De Morais, A.M.; Justino, M.A.M.; Valente, O.S.; de Morais Hanriot, S.; Sodré, J.R. Hydrogen impacts on performance and CO2 emissions from a diesel power generator. Int. J. Hydrogen Energy 2013, 38, 6857–6864. [Google Scholar] [CrossRef]
- Szwaja, S.; Grab-Rogalinski, K. Hydrogen combustion in a compression ignition diesel engine. Int. J. Hydrogen Energy 2009, 34, 4413–4421. [Google Scholar] [CrossRef]
- Alrazen, H.A.; Talib, A.A.; Adnan, R.; Ahmad, K. A review of the effect of hydrogen addition on the performance and emissions of the compression–Ignition engine. Renew. Sustain. Energy Rev. 2016, 54, 785–796. [Google Scholar] [CrossRef]
- Ghazal, O.H. Performance and combustion characteristic of CI engine fueled with hydrogen enriched diesel. Int. J. Hydrogen Energy 2013, 38, 15469–15476. [Google Scholar] [CrossRef]
- Sandalcı, T.; Karagöz, Y. Experimental investigation of the combustion characteristics, emissions and performance of hydrogen port fuel injection in a diesel engine. Int. J. Hydrogen Energy 2014, 39, 18480–18489. [Google Scholar] [CrossRef]
- Karagöz, Y.; Sandalcı, T.; Yüksek, L.; Dalkılıç, A. Engine performance and emission effects of diesel burns enriched by hydrogen on different engine loads. Int. J. Hydrogen Energy 2015, 40, 6702–6713. [Google Scholar] [CrossRef]
- Deb, M.; Sastry, G.; Bose, P.; Banerjee, R. An experimental study on combustion, performance and emission analysis of a single cylinder, 4-stroke DI-diesel engine using hydrogen in dual fuel mode of operation. Int. J. Hydrogen Energy 2015, 40, 8586–8598. [Google Scholar] [CrossRef]
- Karagöz, Y.; Güler, İ.; Sandalcı, T.; Yüksek, L.; Dalkılıç, A.S. Effect of hydrogen enrichment on combustion characteristics, emissions and performance of a diesel engine. Int. J. Hydrogen Energy 2016, 41, 656–665. [Google Scholar] [CrossRef]
- Yadav, V.S.; Soni, S.; Sharma, D. Engine performance of optimized hydrogen-fueled direct injection engine. Energy 2014, 65, 116–122. [Google Scholar] [CrossRef]
- Zhou, J.; Cheung, C.; Zhao, W.; Leung, C. Diesel-hydrogen dual-fuel combustion and its impact on unregulated gaseous emissions and particulate emissions under different engine loads and engine speeds. Energy 2016, 94, 110–123. [Google Scholar] [CrossRef]
- Köse, H.; Ciniviz, M. An experimental investigation of effect on diesel engine performance and exhaust emissions of addition at dual fuel mode of hydrogen. Fuel Process. Technol. 2013, 114, 26–34. [Google Scholar] [CrossRef]
- Zhou, J.; Cheung, C.; Leung, C. Combustion, performance and emissions of a diesel engine with H2, CH4 and H2–CH4 addition. Int. J. Hydrogen Energy 2014, 39, 4611–4621. [Google Scholar] [CrossRef]
- Choi, G.H.; Chung, Y.J.; Han, S.B. Performance and emissions characteristics of a hydrogen enriched LPG internal combustion engine at 1400rpm. Int. J. Hydrogen Energy 2005, 30, 77–82. [Google Scholar] [CrossRef]
- Saravanan, N.; Nagarajan, G. An experimental investigation of hydrogen-enriched air induction in a diesel engine system. Int. J. Hydrogen Energy 2008, 33, 1769–1775. [Google Scholar] [CrossRef]
- Alrazen, H.A.; Talib, A.A.; Ahmad, K. A two-component CFD studies of the effects of H2, CNG, and diesel blend on combustion characteristics and emissions of a diesel engine. Int. J. Hydrogen Energy 2016, 41, 10483–10495. [Google Scholar] [CrossRef]
- Zhou, J.; Cheung, C.; Leung, C. Combustion and emission of a compression ignition engine fueled with diesel and hydrogen-methane mixture. In Proceedings of the World Academy of Science, Engineering and Technology Conference, Amsterdam, The Netherlands, 8–9 August 2013; pp. 107–112. [Google Scholar]
- Karagöz, Y.; Güler, İ.; Sandalcı, T.; Yüksek, L.; Dalkılıç, A.S.; Wongwises, S. Effects of hydrogen and methane addition on combustion characteristics, emissions, and performance of a CI engine. Int. J. Hydrogen Energy 2016, 41, 1313–1325. [Google Scholar] [CrossRef]
- Pichayapat, K.; Sukchai, S.; Thongsan, S.; Pongtornkulpanich, A. Emission characteristics of using HCNG in the internal combustion engine with minimum pilot diesel injection for greater fuel economy. Int. J. Hydrogen Energy 2014, 39, 12182–12186. [Google Scholar] [CrossRef]
- Yusaf, T.; Yusoff, M.Z. Development of a 3D CFD Model to Investigate the Effect of the Mixing Quality on the CNG-Diesel Engine Performance. In Proceedings of the International Conference and Exhibition and Natural Gas Vehicles, Yokohama, Japan, 17–19 October 2000; International Association of Natural Gas Vehicles (IANGV): Yokohama, Japan. [Google Scholar]
- Gorjibandpy, M.; Sangsereki, M.K. Computational investigation of air-gas venturi mixer for powered bi-fuel diesel engine. World Acad. Sci. Eng. Technol. 2010, 4, 1197–1201. [Google Scholar]
- Dahake, M.; Patil, S.; Patil, S. Performance and Emission Improvement through Optimization of Venturi Type Gas Mixer for CNG Engines. Int. Res. J. Eng. Technol. 2016, 3, 994–999. [Google Scholar]
- Chintala, V.; Subramanian, K. A CFD (computational fluid dynamics) study for optimization of gas injector orientation for performance improvement of a dual-fuel diesel engine. Energy 2013, 57, 709–721. [Google Scholar] [CrossRef]
- Supee, A.; Shafeez, M.; Mohsin, R.; Majid, Z. Performance of Diesel-Compressed Natural Gas (CNG) Dual Fuel (DDF) Engine via CNG-Air Venturi Mixjector Application. Arab. J. Sci. Eng. 2014, 39, 7335–7344. [Google Scholar] [CrossRef]
- Wong, W.L. Compressed Natural Gas as an Alternative Fuel in Diesel Engines. Bachelor’s Thesis, University of Southern Queensland, Toowoomba, Queensland, Australia, 2005. [Google Scholar]
- Hussain, J.; Palaniradja, K.; Algumurthic, N.; Manimarana, R. Diesel Engine Emissions and After Treatment Techniques—A Review. J. Eng. Res. Stud. 2012, 3, 34–44. [Google Scholar]
- Reşitoğlu, İ.A.; Altinişik, K.; Keskin, A. The pollutant emissions from diesel-engine vehicles and exhaust aftertreatment systems. Clean Technol. Environ. Policy 2015, 17, 15–27. [Google Scholar] [CrossRef]
- Mohsin, R.; Yaacob, Z.; Chang, Y. Review of mixture formation unit for CNG motorcycle. J. Chem. Nat. Resour. Eng. 2008, 2, 1–7. [Google Scholar]
- Mohsin, R.; Yaacob, Z.; Chang, Y. Computational fluid dynamics analysis of an injection mixer for CNG engines simulation. J. Teknol. 2008, 49, 297–310. [Google Scholar]
- Chang, Y.S.; Yaacob, Z.; Mohsin, R. Computational Fluid Dynamics Simulation of Injection Mixer for CNG Engines. In Proceedings of the World Congress on Engineering and Computer Science (WCECS 2007), San Francisco, CA, USA, 24–26 October 2007. [Google Scholar]
- Kadirgama, K.; Noor, M.; Rahim, A.; Devarajan, R.; Rejab, M.; NM, N.Z. Design and Simulate Mixing of Compressed Natural Gas with Air in a Mixing Device. In Proceedings of the MUCET2008, Malaysian Technical Universities Conference on Engineeringand Technology, Putra Palace, Perlis, Malaysia, 15–16 March 2008; ISBN 978-983-42358-4-0. [Google Scholar]
- Danardono, D.; Kim, K.-S.; Lee, S.-Y.; Lee, J.-H. Optimization the design of venturi gas mixer for syngas engine using three-dimensional CFD modeling. J. Mech. Sci. Technol. 2011, 25, 2285–2296. [Google Scholar] [CrossRef]
- Noor, M.; Wandel, A.P.; Yusaf, T. Detail guide for CFD on the simulation of biogas combustion in bluff-body mild burner. In Proceedings of the 2nd International Conference of Mechanical Engineering Research (ICMER 2013), Bukit Gambang Resort City, Kuantan, Pahang, Malaysia, 1–3 July 2013; pp. 1–25. [Google Scholar]
- Sumner, J.; Watters, C.S.; Masson, C. CFD in wind energy: The virtual, multiscale wind tunnel. Energies 2010, 3, 989–1013. [Google Scholar] [CrossRef]
- Bora, B.J.; Debnath, B.K.; Gupta, N.; Sahoo, N.; Saha, U. Investigation on the flow behaviour of a venturi type gas mixer designed for dual fuel diesel engines. Int. J. Emerg. Technol. Adv. Eng. 2013, 3, 202–209. [Google Scholar]
- Johansson, K. Numerical Simulation of Fuel Filling with Volume of Fluid. Master’s Thesis, Chalmers University Of Technology, Gothenburg, Sweden, 2011. [Google Scholar]
- Ekaterinaris, J.A. High-order accurate, low numerical diffusion methods for aerodynamics. Prog. Aerosp. Sci. 2005, 41, 192–300. [Google Scholar] [CrossRef]
- Fluent Inc. FLUENT 6.3 User’s Guide; Fluent Inc.: Canonsburg, PA, USA, 2006. [Google Scholar]
- Martínez-Martínez, S.; Leal-Garza, R.D.; Sánchez-Cruz, F.A.; Villarreal, E.B.; Amado-Covarrubias, M. CFD analysis of the effect of the exhaust manifold design on the close-coupled catalytic converter performance. J. KONES 2010, 17, 303–311. [Google Scholar]
- Abo-Serie, E.; Özgur, M.; Altinsik, K. Computational analysis of methane-air venturi mixer for optimum design, In Proceedings of the 13th International Combustion Symposium, Bursa, Turkey, 9–11 September 2015.
- Kim, J.; Kim, H.; Yoon, S.; Sa, S. Effect of intake valve swirl on fuel-gas mixing and subsequent combustion in a CAI engine. Int. J. Automot. Technol. 2008, 9, 649–657. [Google Scholar] [CrossRef]
- Singh, R.; Maji, S. Dual fueling of a twin-cylinder compression ignition engine with diesel and CNG. J. Eng. Appl. Sci. 2012, 7, 90–99. [Google Scholar] [CrossRef]
- Ramasamy, D.; Samykano, M.; Kadirgama, K. Design Of Compressed Natural Gas Mixer Using Computational Fluid Dynamics. In Proceedings of the National Conference in Mechanical Engineering Research and Postgraduate Students, UMP, Kuantan, Pahang, Malaysia, 26–27 May 2010; pp. 614–620. [Google Scholar]


| XL1 (mm) | XL2 (mm) | XL3 (mm) | XL4 (mm) | Angle of Hole | Number of Holes | Diameter of Holes (d) mm | Position of Holes | Model |
|---|---|---|---|---|---|---|---|---|
| 0 | 0 | 13.64 | 0 | 0 | 7 | 3.866 | In the center of mixer | Model 1 |
| 32.804 | 0 | 0 | 0 | 0 | 7 | 3.8273 | In edges of mixer (E) | Model 2 |
| 37.51 | 0 | 13.64 | 0 | 0 | 14 | 2.730728 | In the center and edges of mixer | Model 3 |
| 27.28 | 42.28 | 0 | 0 | 0 | 14 | 2.730728 | In the edges of mixer | Model 4 |
| 37.51 | 0 | 0 | 23.87 | 0 | 6 | 4.176377 | In edges of mixer (E) | Model 5 |
| 27.28 | 42.28 | 0 | 23.87 | 0 | 12 | 2.95306 | In edges of mixer (E) | Model 6 |
| 29.441 | 0 | 0 | 0 | 180 | 6 | 4.176377 | In edges of mixer (E) | Model 7 |
| 27.28 | 42.28 | 0 | 0 | 180 | 12 | 2.95306 | In edges of mixer (E) | Model 8 |
| 37.51 | 42.28 | 13.64 | 0 | 0 | 21 | 2.23014 | In the center and edges of mixer | Model 9 |
| 25.91 | 0 | 0 | 15.40 | 0 | 6 | 4.176377 | In edges of mixer (E) | Model 10 |
| 34.1 | 42.28 | 0 | 15.40 | 0 | 12 | 2.95306 | In edges of mixer (E) | Model 11 |
| 37.51 | 0 | 0 | 15.40 | 180 | 6 | 4.176377 | In edges of mixer (E) | Model 12 |
| 37.51 | 42.28 | 0 | 15.40 | 180 | 12 | 2.95306 | In edges of mixer (E) | Model 13 |
| 37.51 | 0 | 0 | 23.87 | 180 | 6 | 4.176377 | In edges of mixer (E) | Model 14 |
| 25.916 | 42.28 | 0 | 23.87 | 180 | 12 | 2.95306 | In edges of mixer (E) | Model 15 |
| Cases | Elements | Nodes |
|---|---|---|
| Case 1 | 672,690 | 153,813 |
| Case 2 | 707,664 | 167,052 |
| Case 3 | 813,774 | 179,236 |
| Case 4 | 932,208 | 201,231 |
| Case 5 | 1054,756 | 223,744 |
| Case 6 | 1227,136 | 265,304 |
| The Case | Mass Fraction of Air | Mass Fraction for Hydrogen | Mass Fraction for CNG |
|---|---|---|---|
| CNG-Air | 0 | 0 | 1 |
| HCNG-Air (H70%-CNG 30%) | 0 | 0.052300514 | 0.947699486 |
| Methane | H30-M70 | H50-M50 | H70-M30 | Hydrogen | Diesel | |
|---|---|---|---|---|---|---|
| Density (Kg/m3) | 0.65 | 0.48 | 0.37 | 0.25 | 8.36 × 10⁻² | 833–881 |
| LHV (MJ/Kg) | 50.02 | 53.57 | 57.79 | 65.81 | 119.93 | 42.8 |
| Stoichiometric AFR (Kg/Kg) | 17.25 | 22.39 | 25.82 | 29.25 | 34.39 | 14.5 |
| Flammability limits (Vol % in air) | 5–15 | - | - | - | 4–75 | 0.7–5 |
| Auto ignition temperature | 813 | - | - | - | 858 | 477–533 |
| Type of Mixing | Air/Gaseous Fuel inside the Mixer | Air/Gaseous Fuel inside the Engine | Gaseous fuels Substitution Ratio by Energy with Diesel Fuel | Content CNG in Gaseous Fuel that Enters inside the Mixer | Content Hydrogen in Gaseous Fuel that Enters inside the Mixer |
|---|---|---|---|---|---|
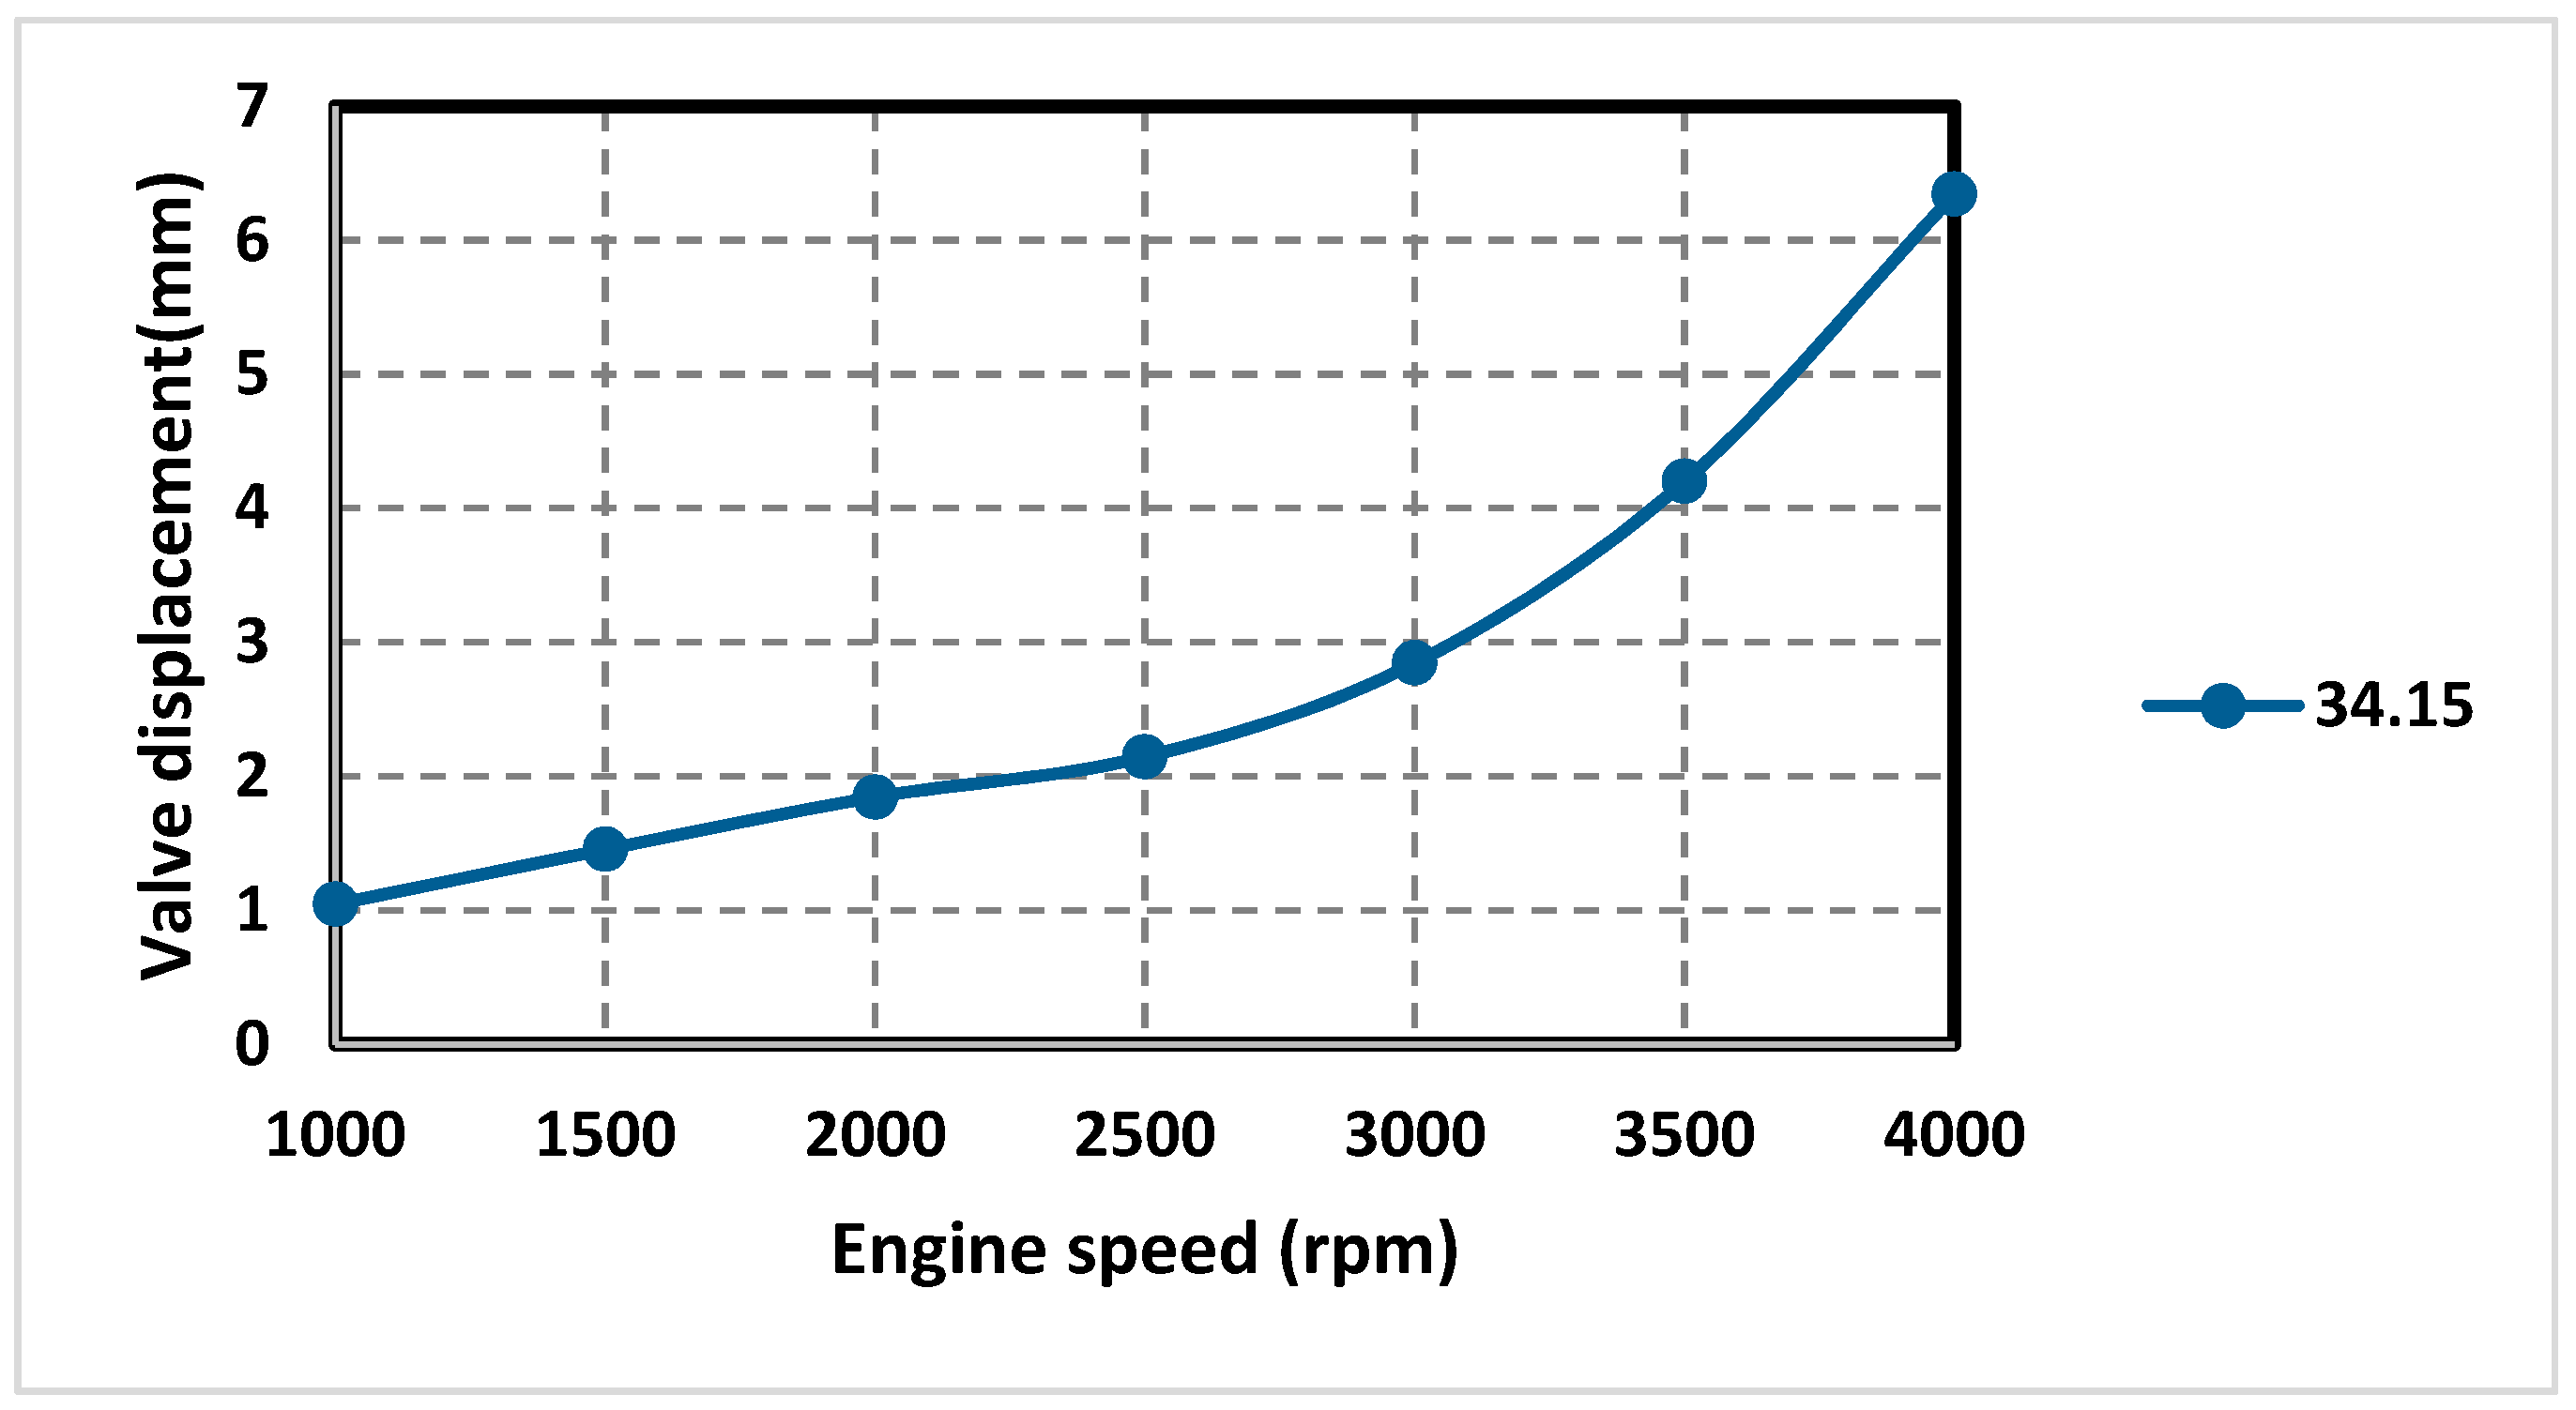
| CNG-Air | 34.15 | 15.76 | 50% | 100 | NA * |
| HCNG-Air | 51.31 | 20.34 | 50% | 30 | 70 |
| The Models | The UI Value Under Air-HCNG Ratio 51.315 | The UI Value Under Air-CNG Ratio 34.15 |
|---|---|---|
| Model 1 | 0.646 | 0.606 |
| Model 2 | 0.859715 | 0.824727 |
| Model 3 | 0.751899 | 0.798 |
| Model 4 | 0.8912 | 0.8855 |
| Model 5 | 0.889061 | 0.892846 |
| Model 6 | 0.911697 | 0.909 |
| Model 7 | 0.939 | 0.937 |
| Model 8 | 0.912487 | 0.911825 |
| Model 9 | 0.796095 | 0.809 |
| Model 10 | 0.883703 | 0.834379 |
| Model 11 | 0.884979 | 0.875965 |
| Model 12 | 0.91904 | 0.923 |
| Model 13 | 0.919954 | 0.920503 |
| Model 14 | 0.9199822 | 0.922 |
| Model 15 | 0.9185988 | 0.921 |
| Statistical Parameters | Nu-Air-CNG Ratio | Exp-Air-CNG Ratio | Nu/Exp Ratio |
|---|---|---|---|
| 34.6 | 34.8 | 0.994252874 | |
| 34.42 | 34.6 | 0.994797688 | |
| 34.2 | 34.3 | 0.997084548 | |
| 34.7 | 34.8 | 0.997126437 | |
| 34.8 | 34.9 | 0.99713467 | |
| 34.4 | 34.6 | 0.994219653 | |
| 34.1 | 34.3 | 0.994169096 | |
| 34.6 | 34.8 | 0.994252874 | |
| Mean | 0.995540709 | ||
| Standard Deviation | 0.001487492 | ||
| Coefficient Of Variation | 0.001494155 |
© 2017 by the authors. Licensee MDPI, Basel, Switzerland. This article is an open access article distributed under the terms and conditions of the Creative Commons Attribution (CC BY) license (http://creativecommons.org/licenses/by/4.0/).
Share and Cite
Mahmood, H.A.; Adam, N.M.; Sahari, B.B.; Masuri, S.U. New Design of a CNG-H2-AIR Mixer for Internal Combustion Engines: An Experimental and Numerical Study. Energies 2017, 10, 1373. https://doi.org/10.3390/en10091373
Mahmood HA, Adam NM, Sahari BB, Masuri SU. New Design of a CNG-H2-AIR Mixer for Internal Combustion Engines: An Experimental and Numerical Study. Energies. 2017; 10(9):1373. https://doi.org/10.3390/en10091373
Chicago/Turabian StyleMahmood, Hussein A., Nor Mariah. Adam, B. B. Sahari, and S. U. Masuri. 2017. "New Design of a CNG-H2-AIR Mixer for Internal Combustion Engines: An Experimental and Numerical Study" Energies 10, no. 9: 1373. https://doi.org/10.3390/en10091373
APA StyleMahmood, H. A., Adam, N. M., Sahari, B. B., & Masuri, S. U. (2017). New Design of a CNG-H2-AIR Mixer for Internal Combustion Engines: An Experimental and Numerical Study. Energies, 10(9), 1373. https://doi.org/10.3390/en10091373