Feasibility Study of a Heating, Cooling and Domestic Hot Water System Combining a Photovoltaic-Thermal System and a Ground Source Heat Pump

Abstract
:1. Introduction
2. Analysis Model
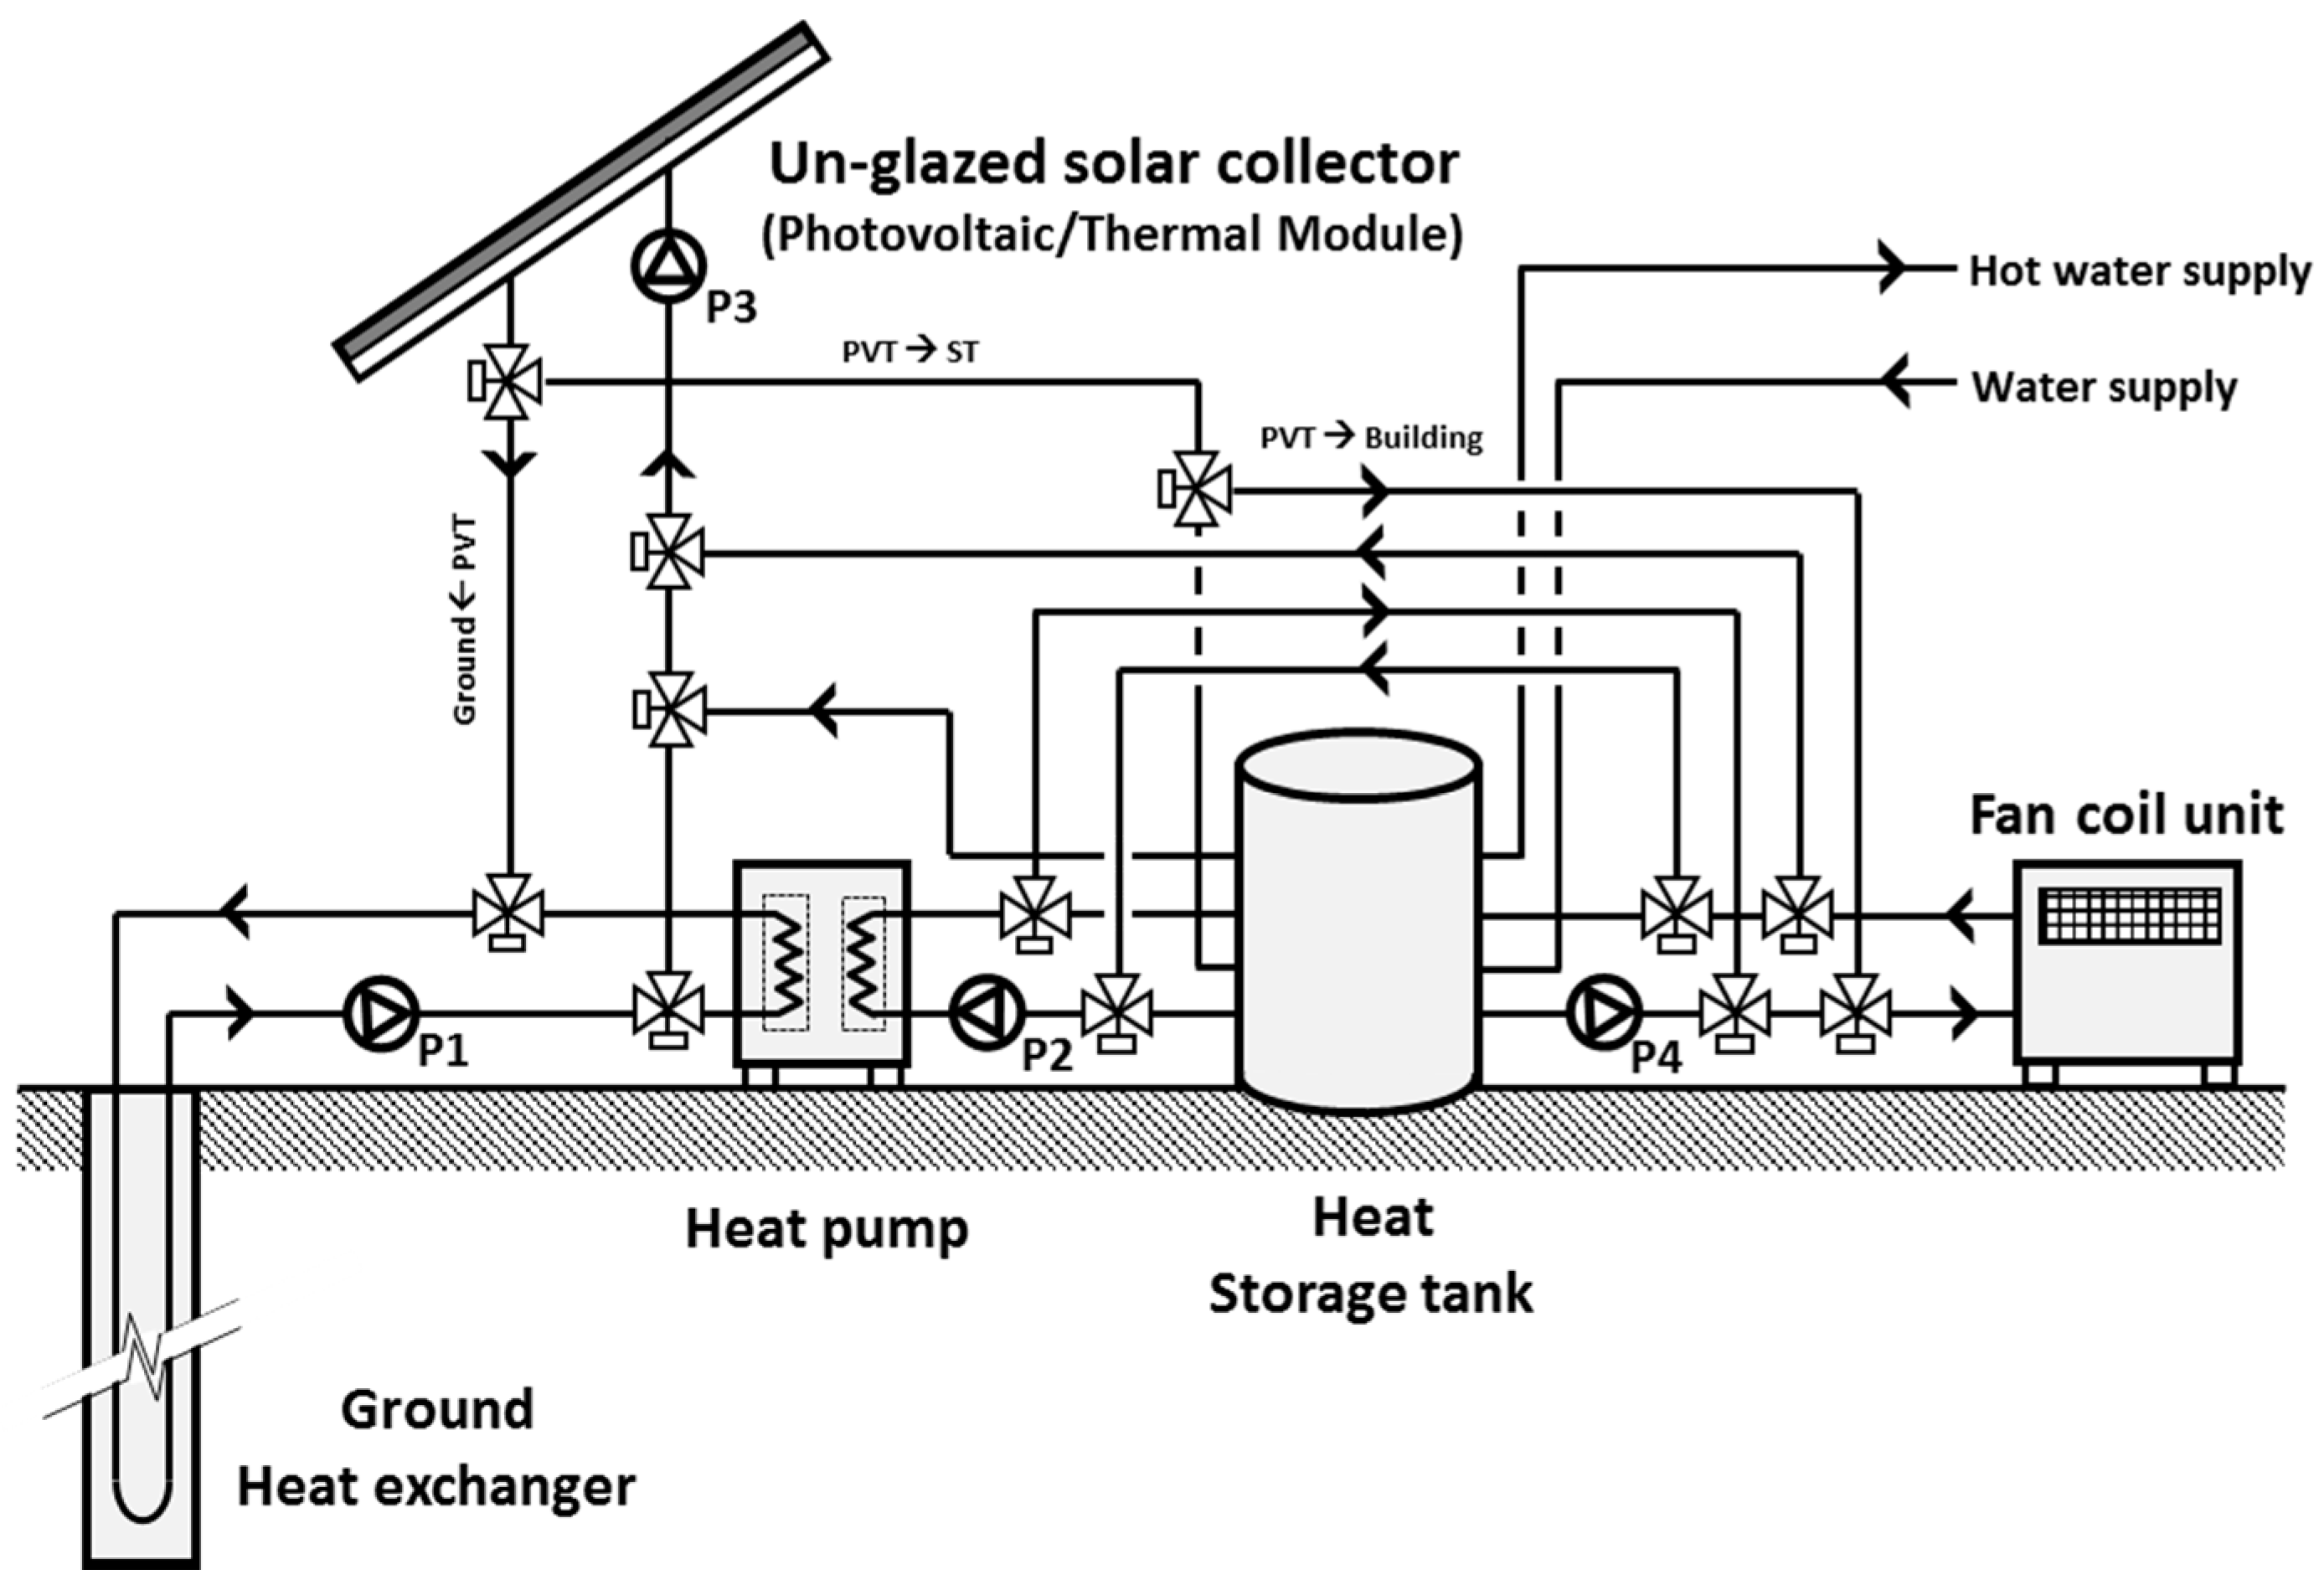
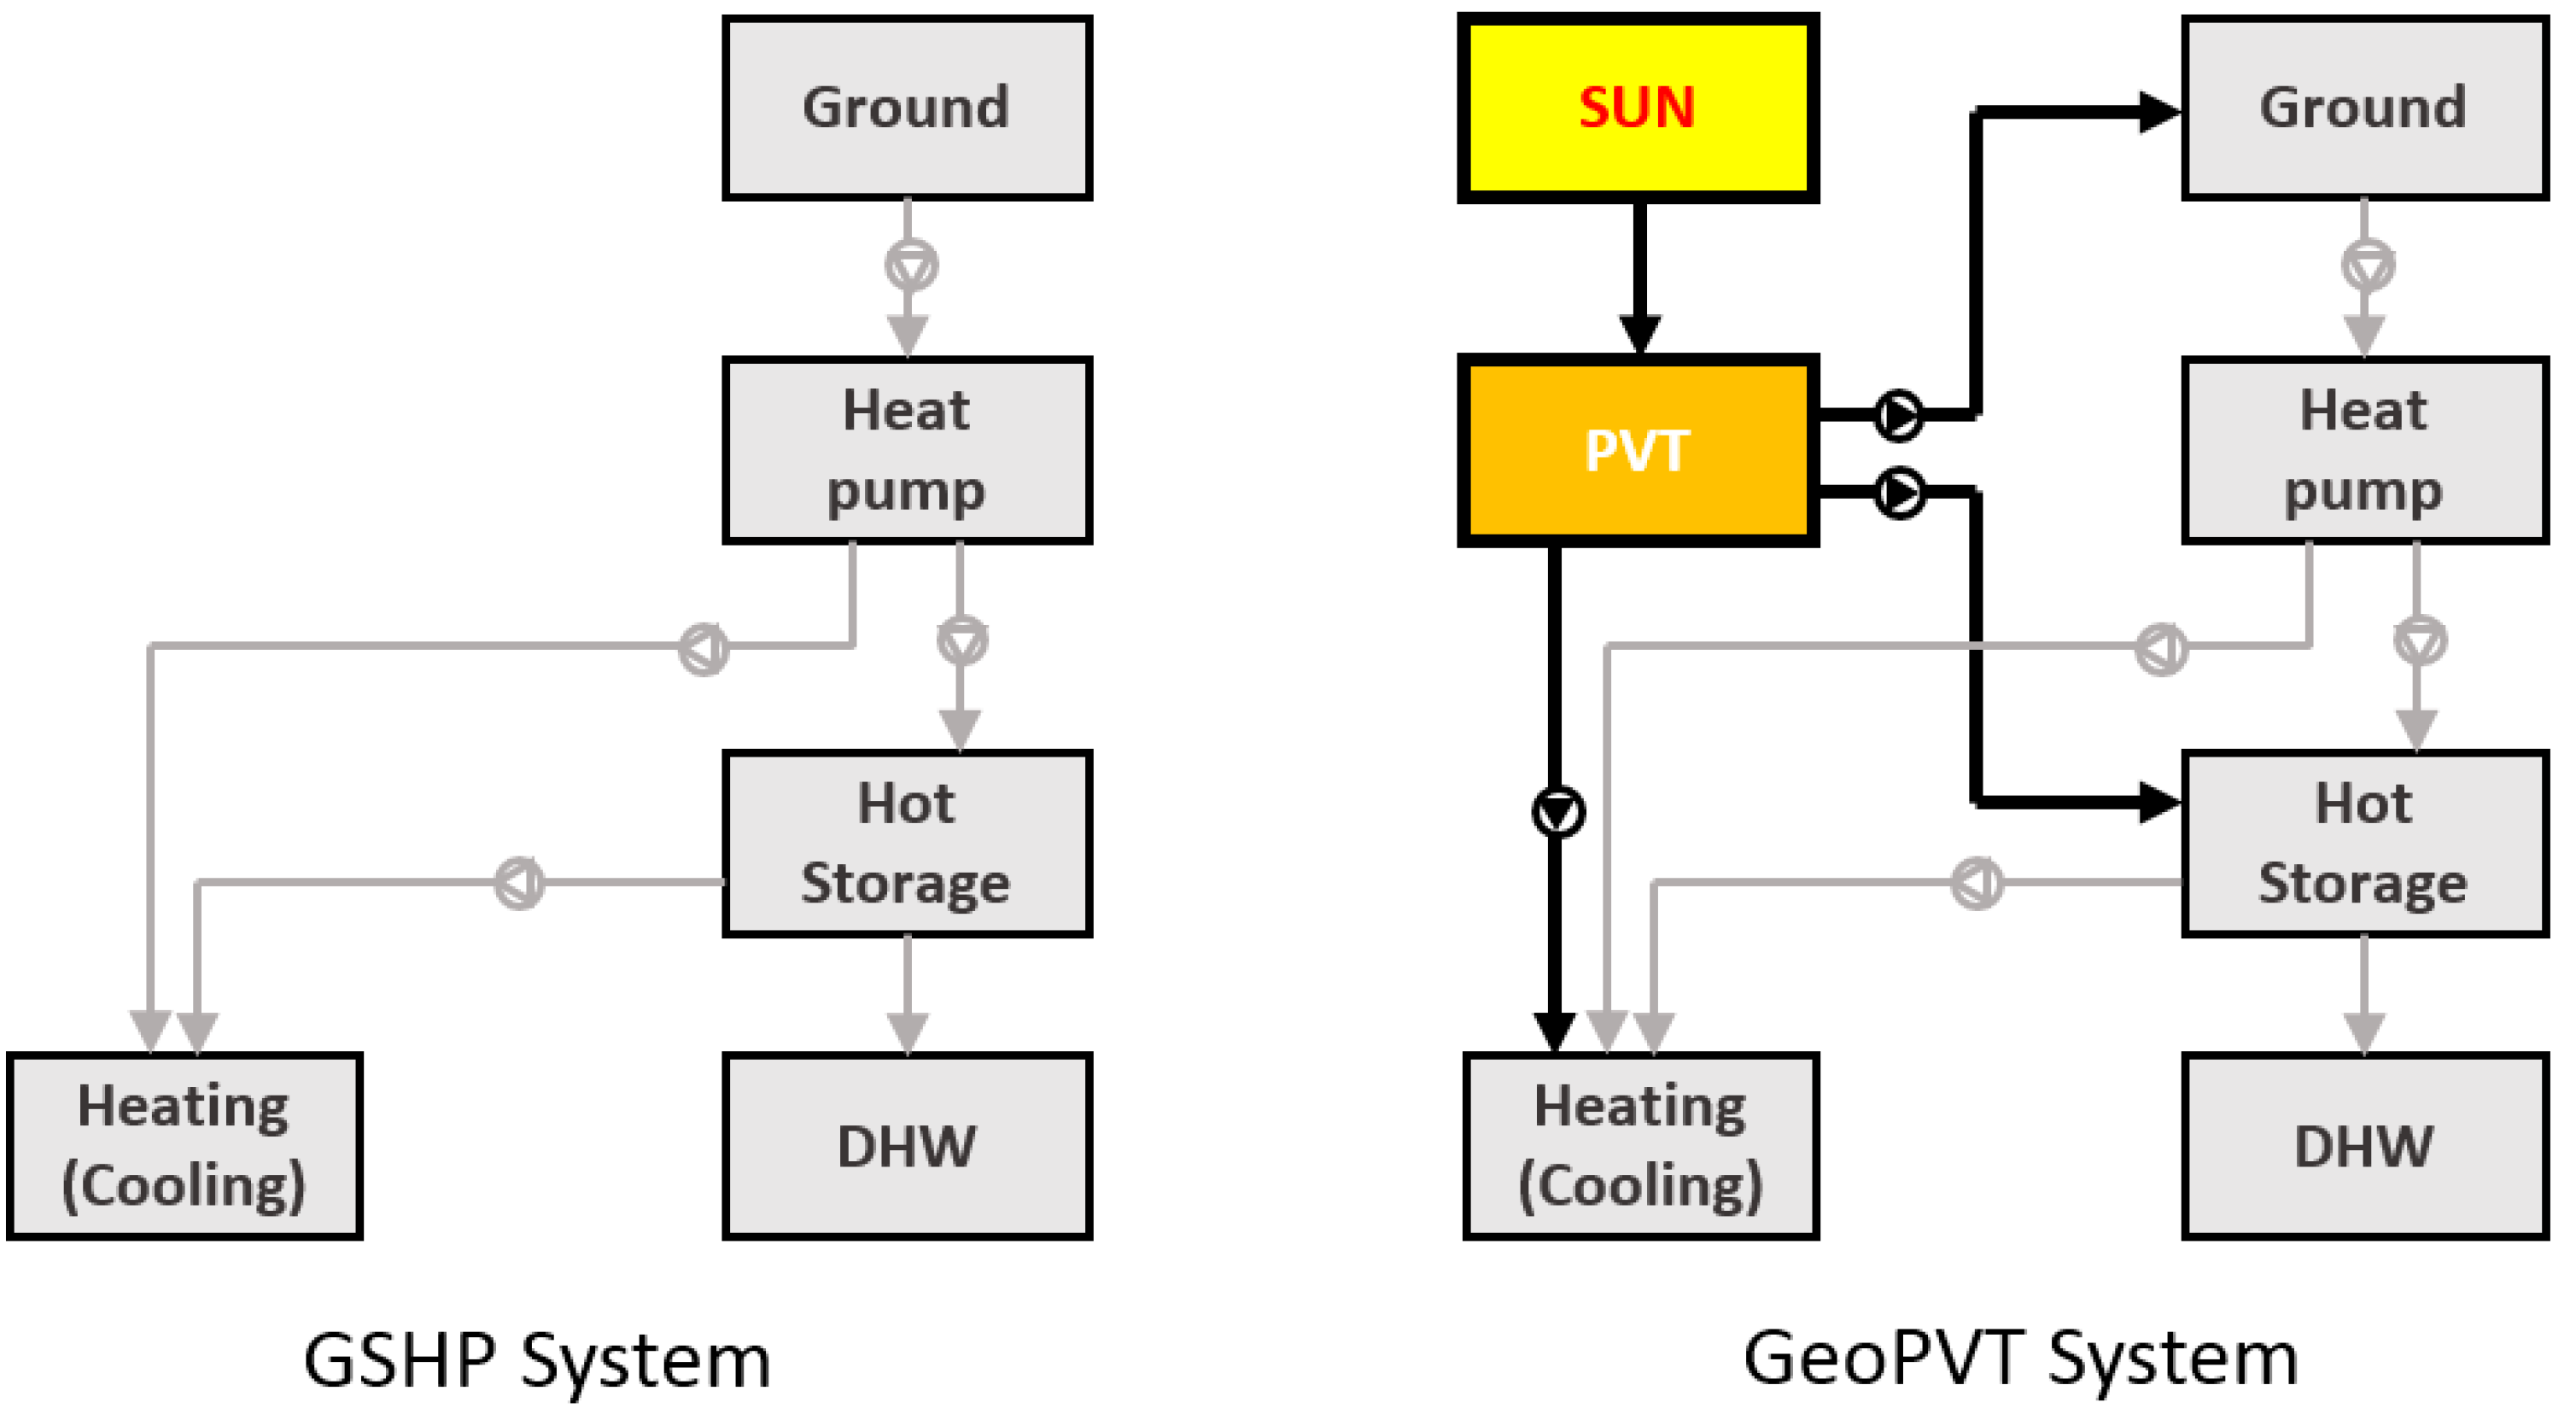
2.1. System Summary
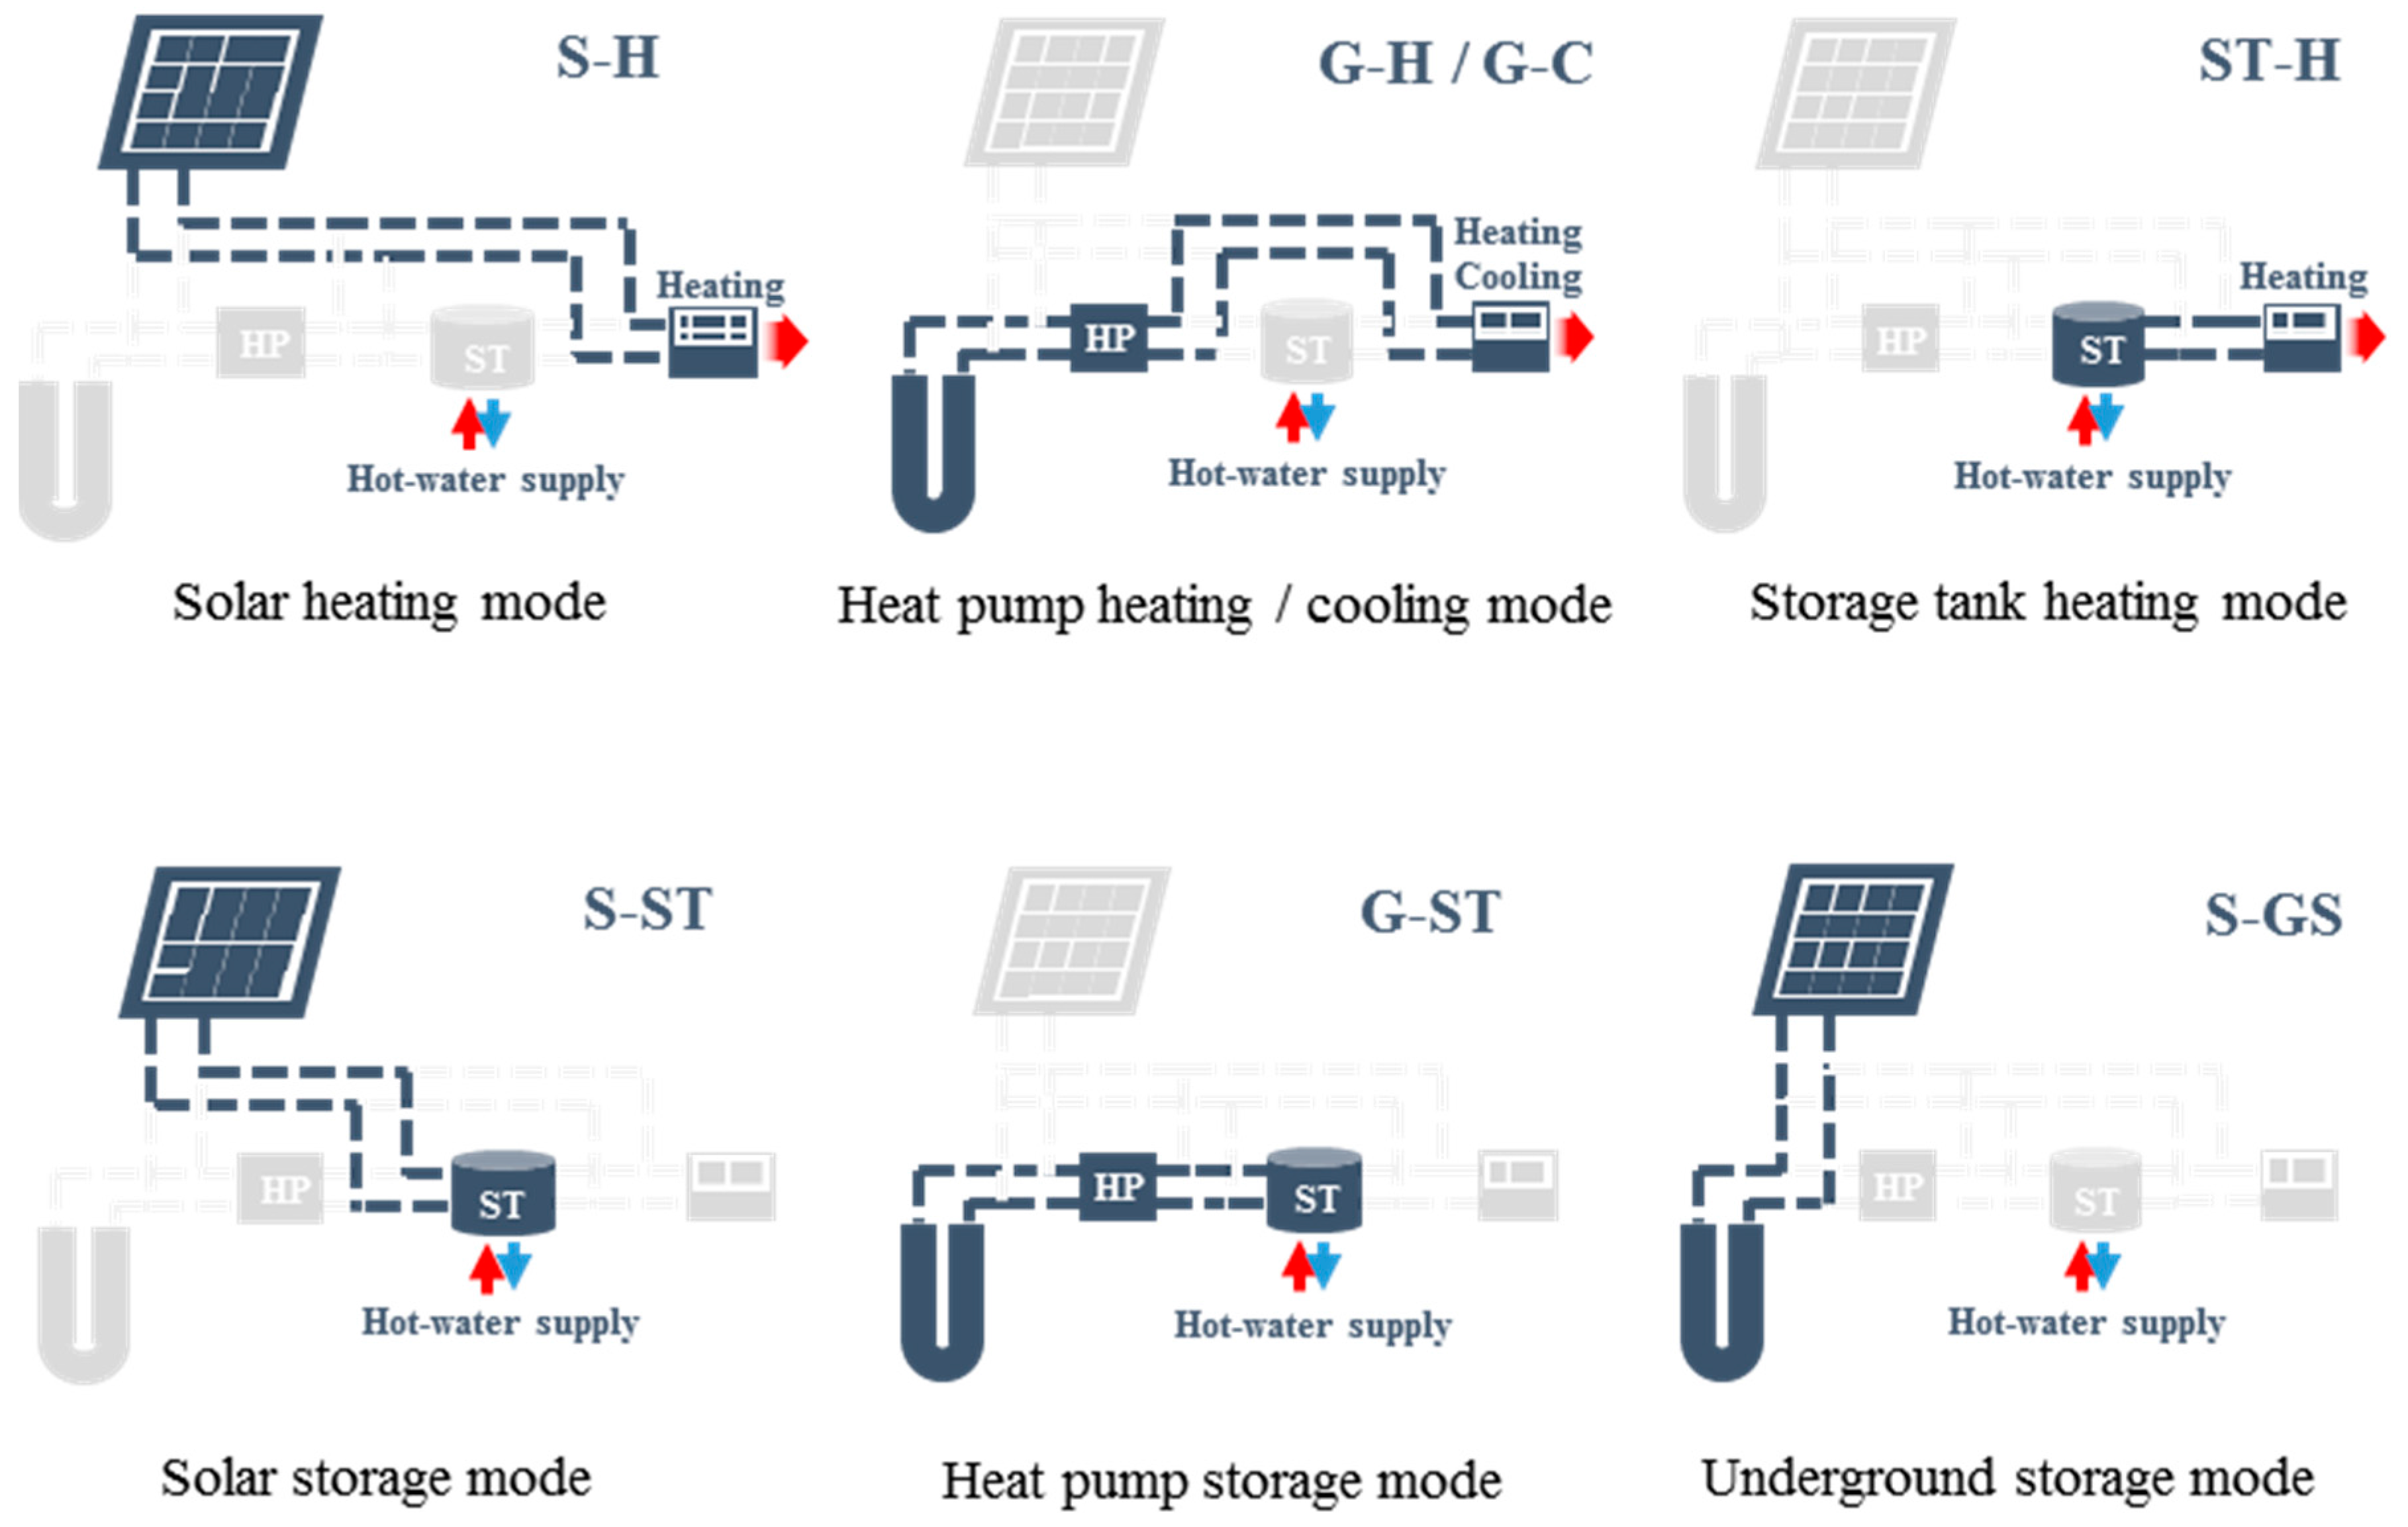
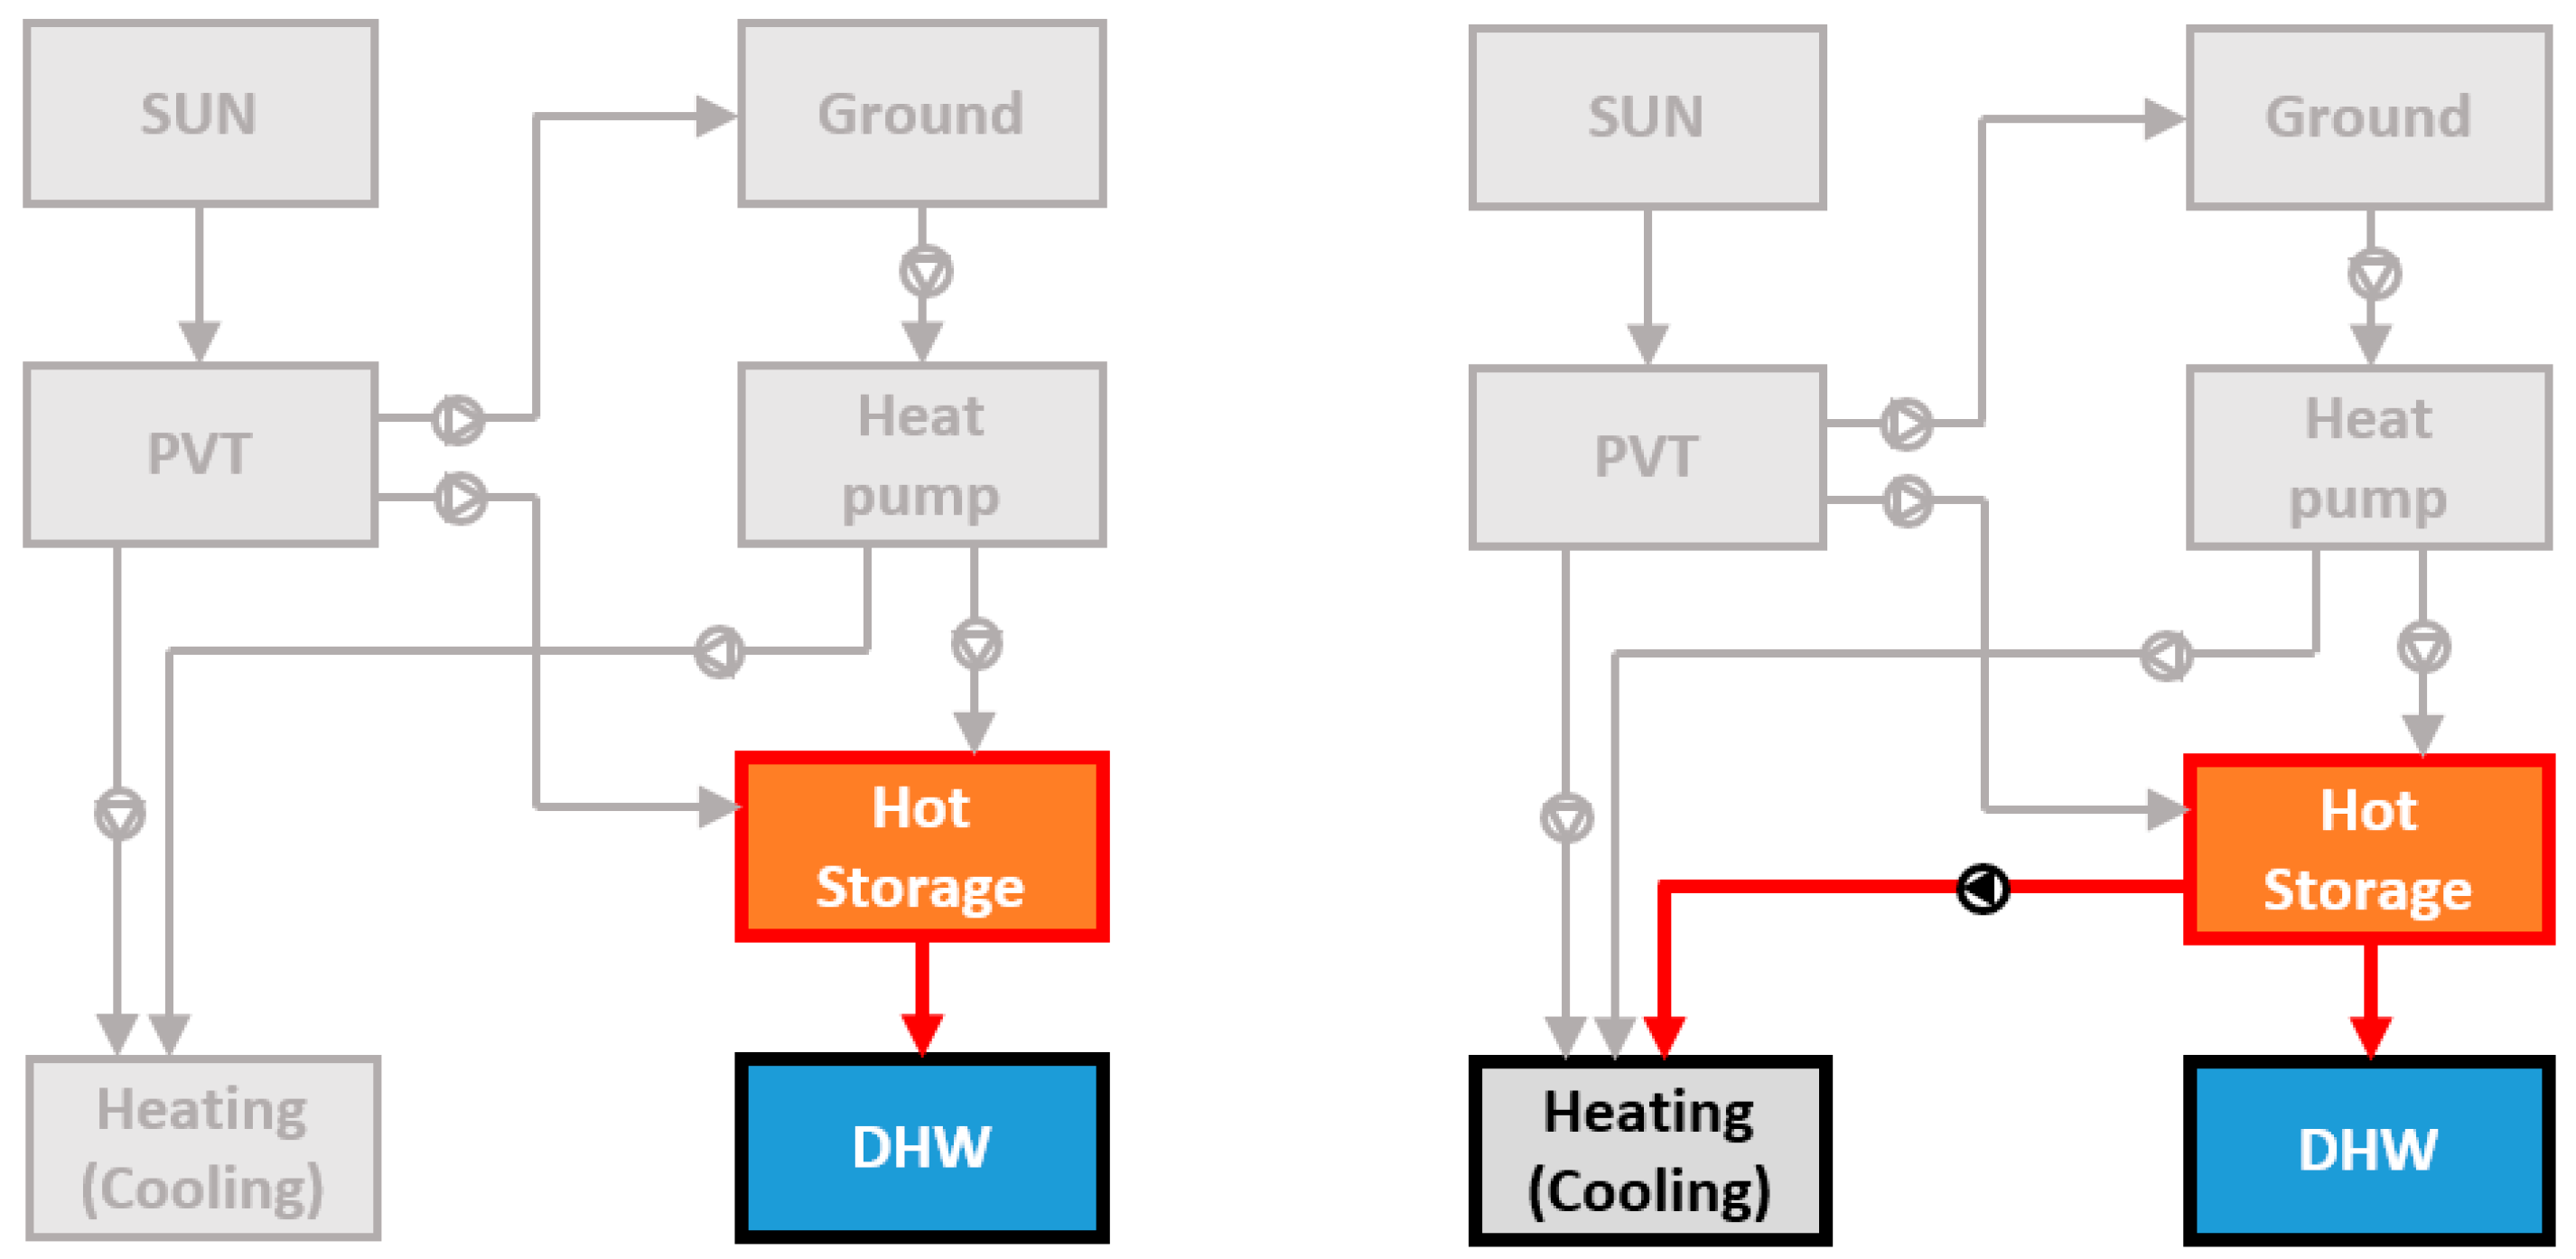
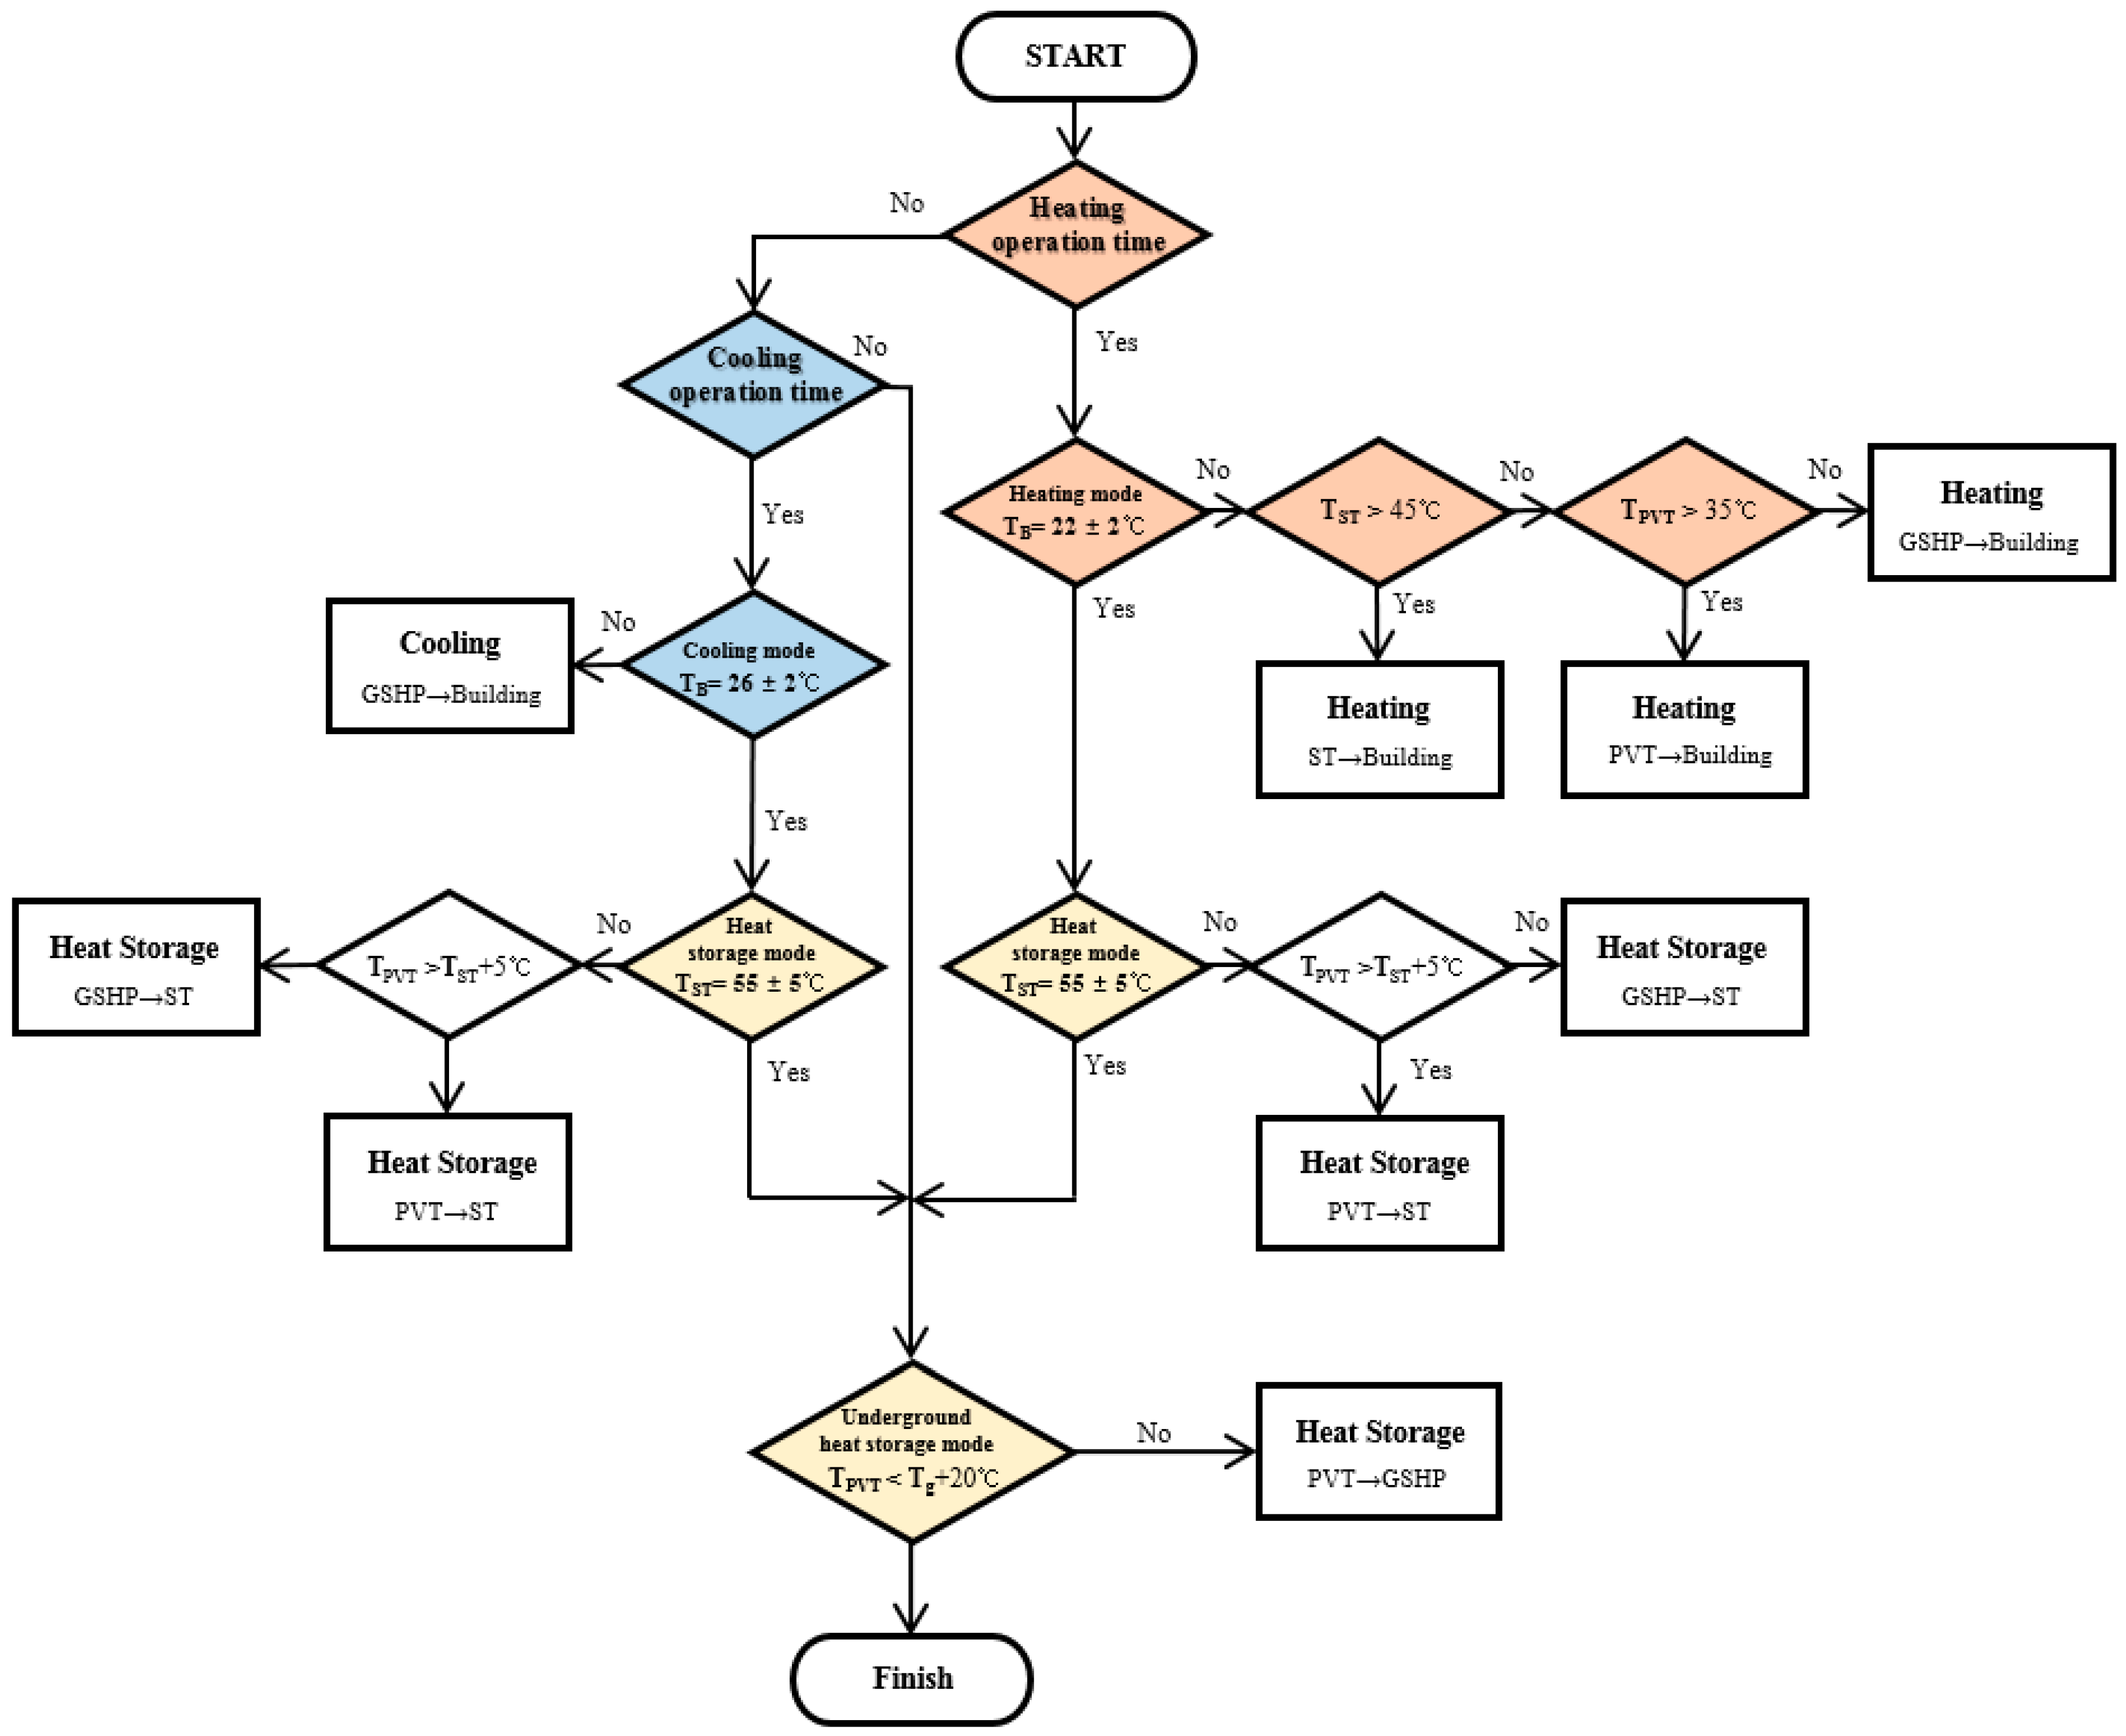
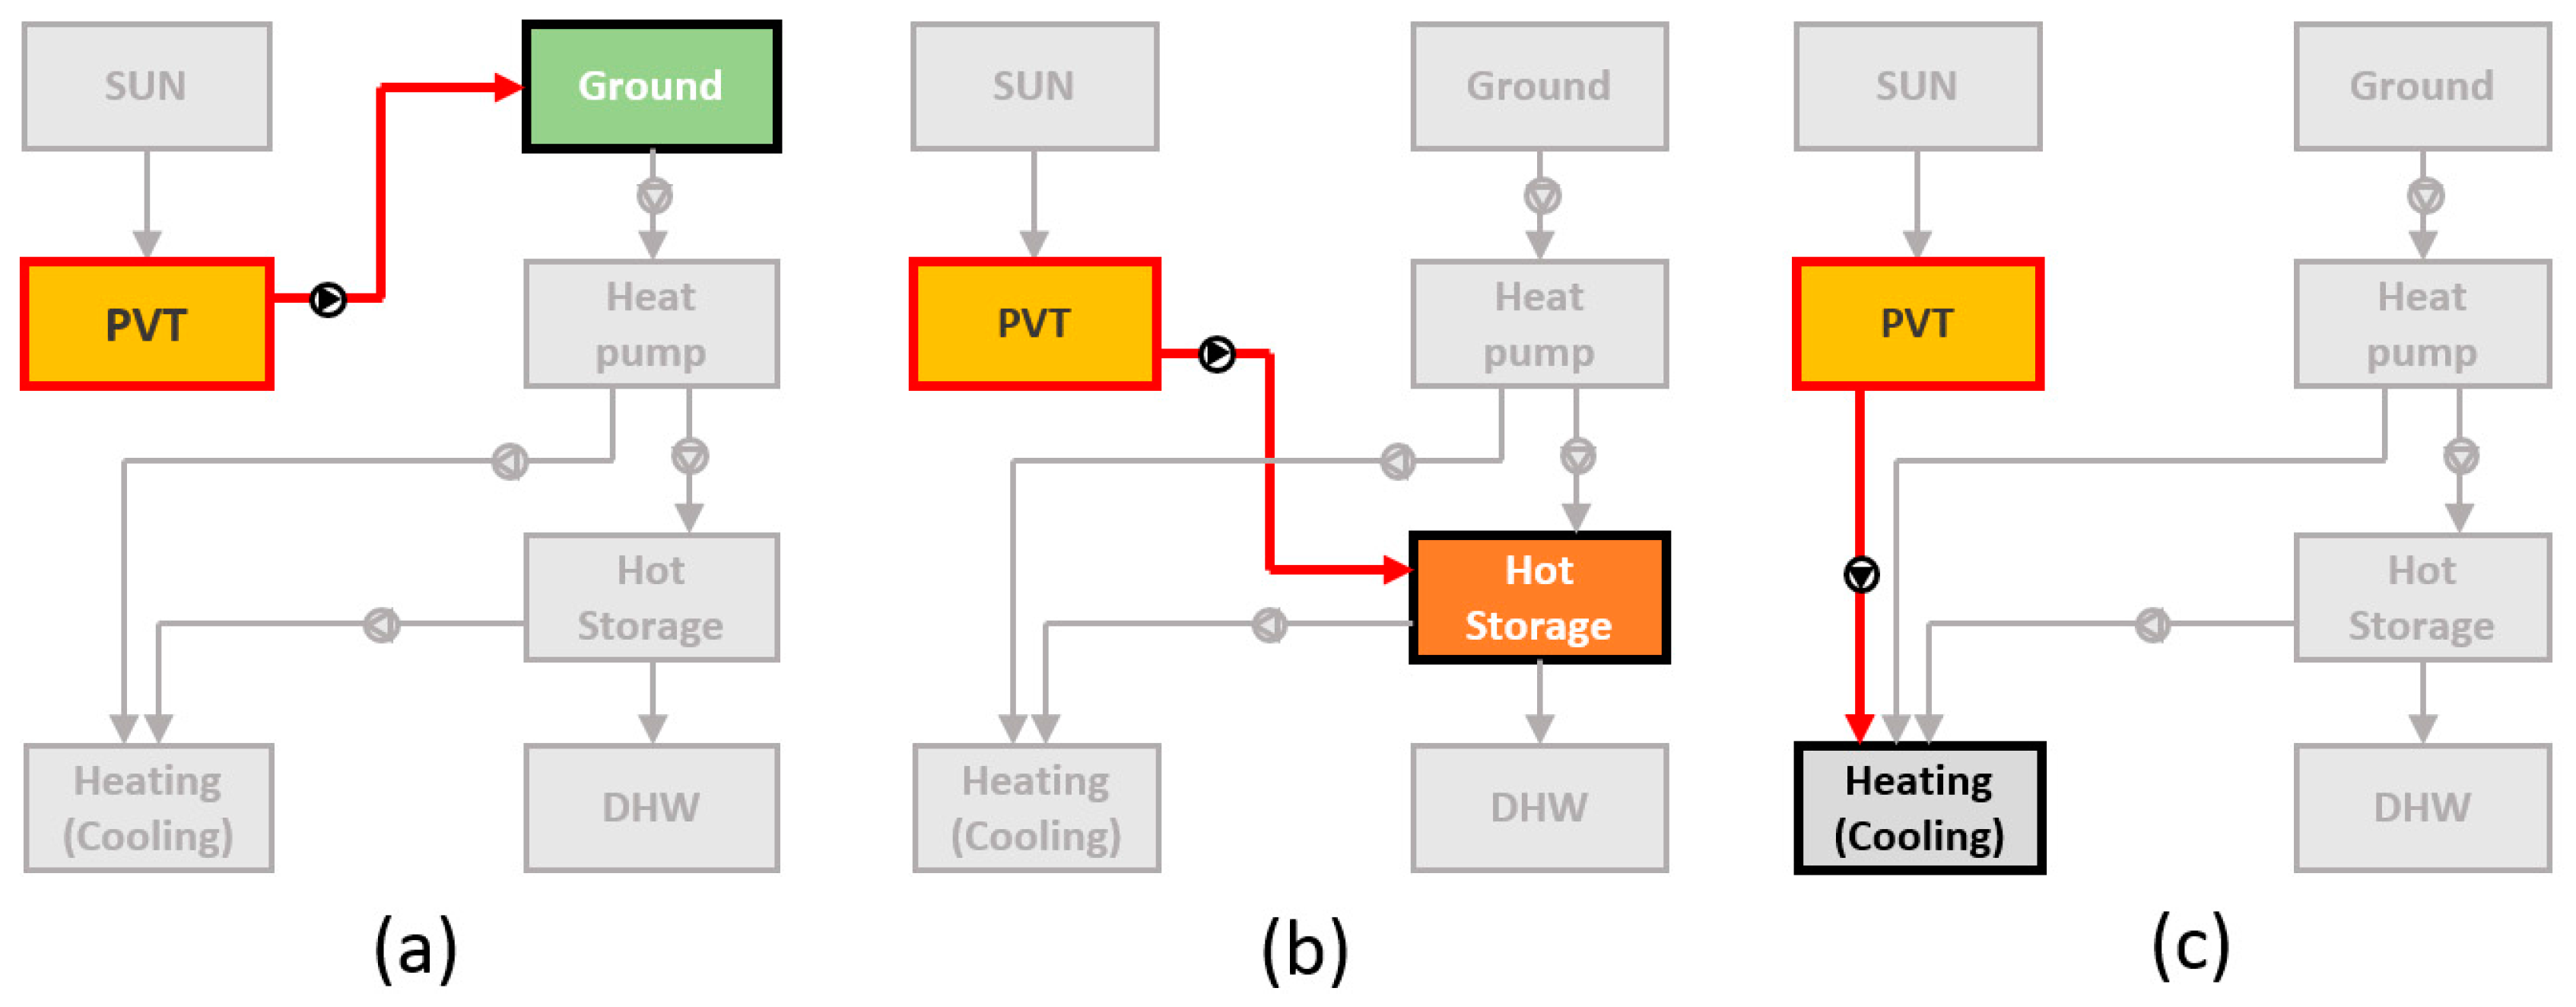
2.2. System Operation Modes
2.3. Calculation Method for the System Performance
2.4. Economic Evaluation Model of Geo-Photovoltaic/Thermal System
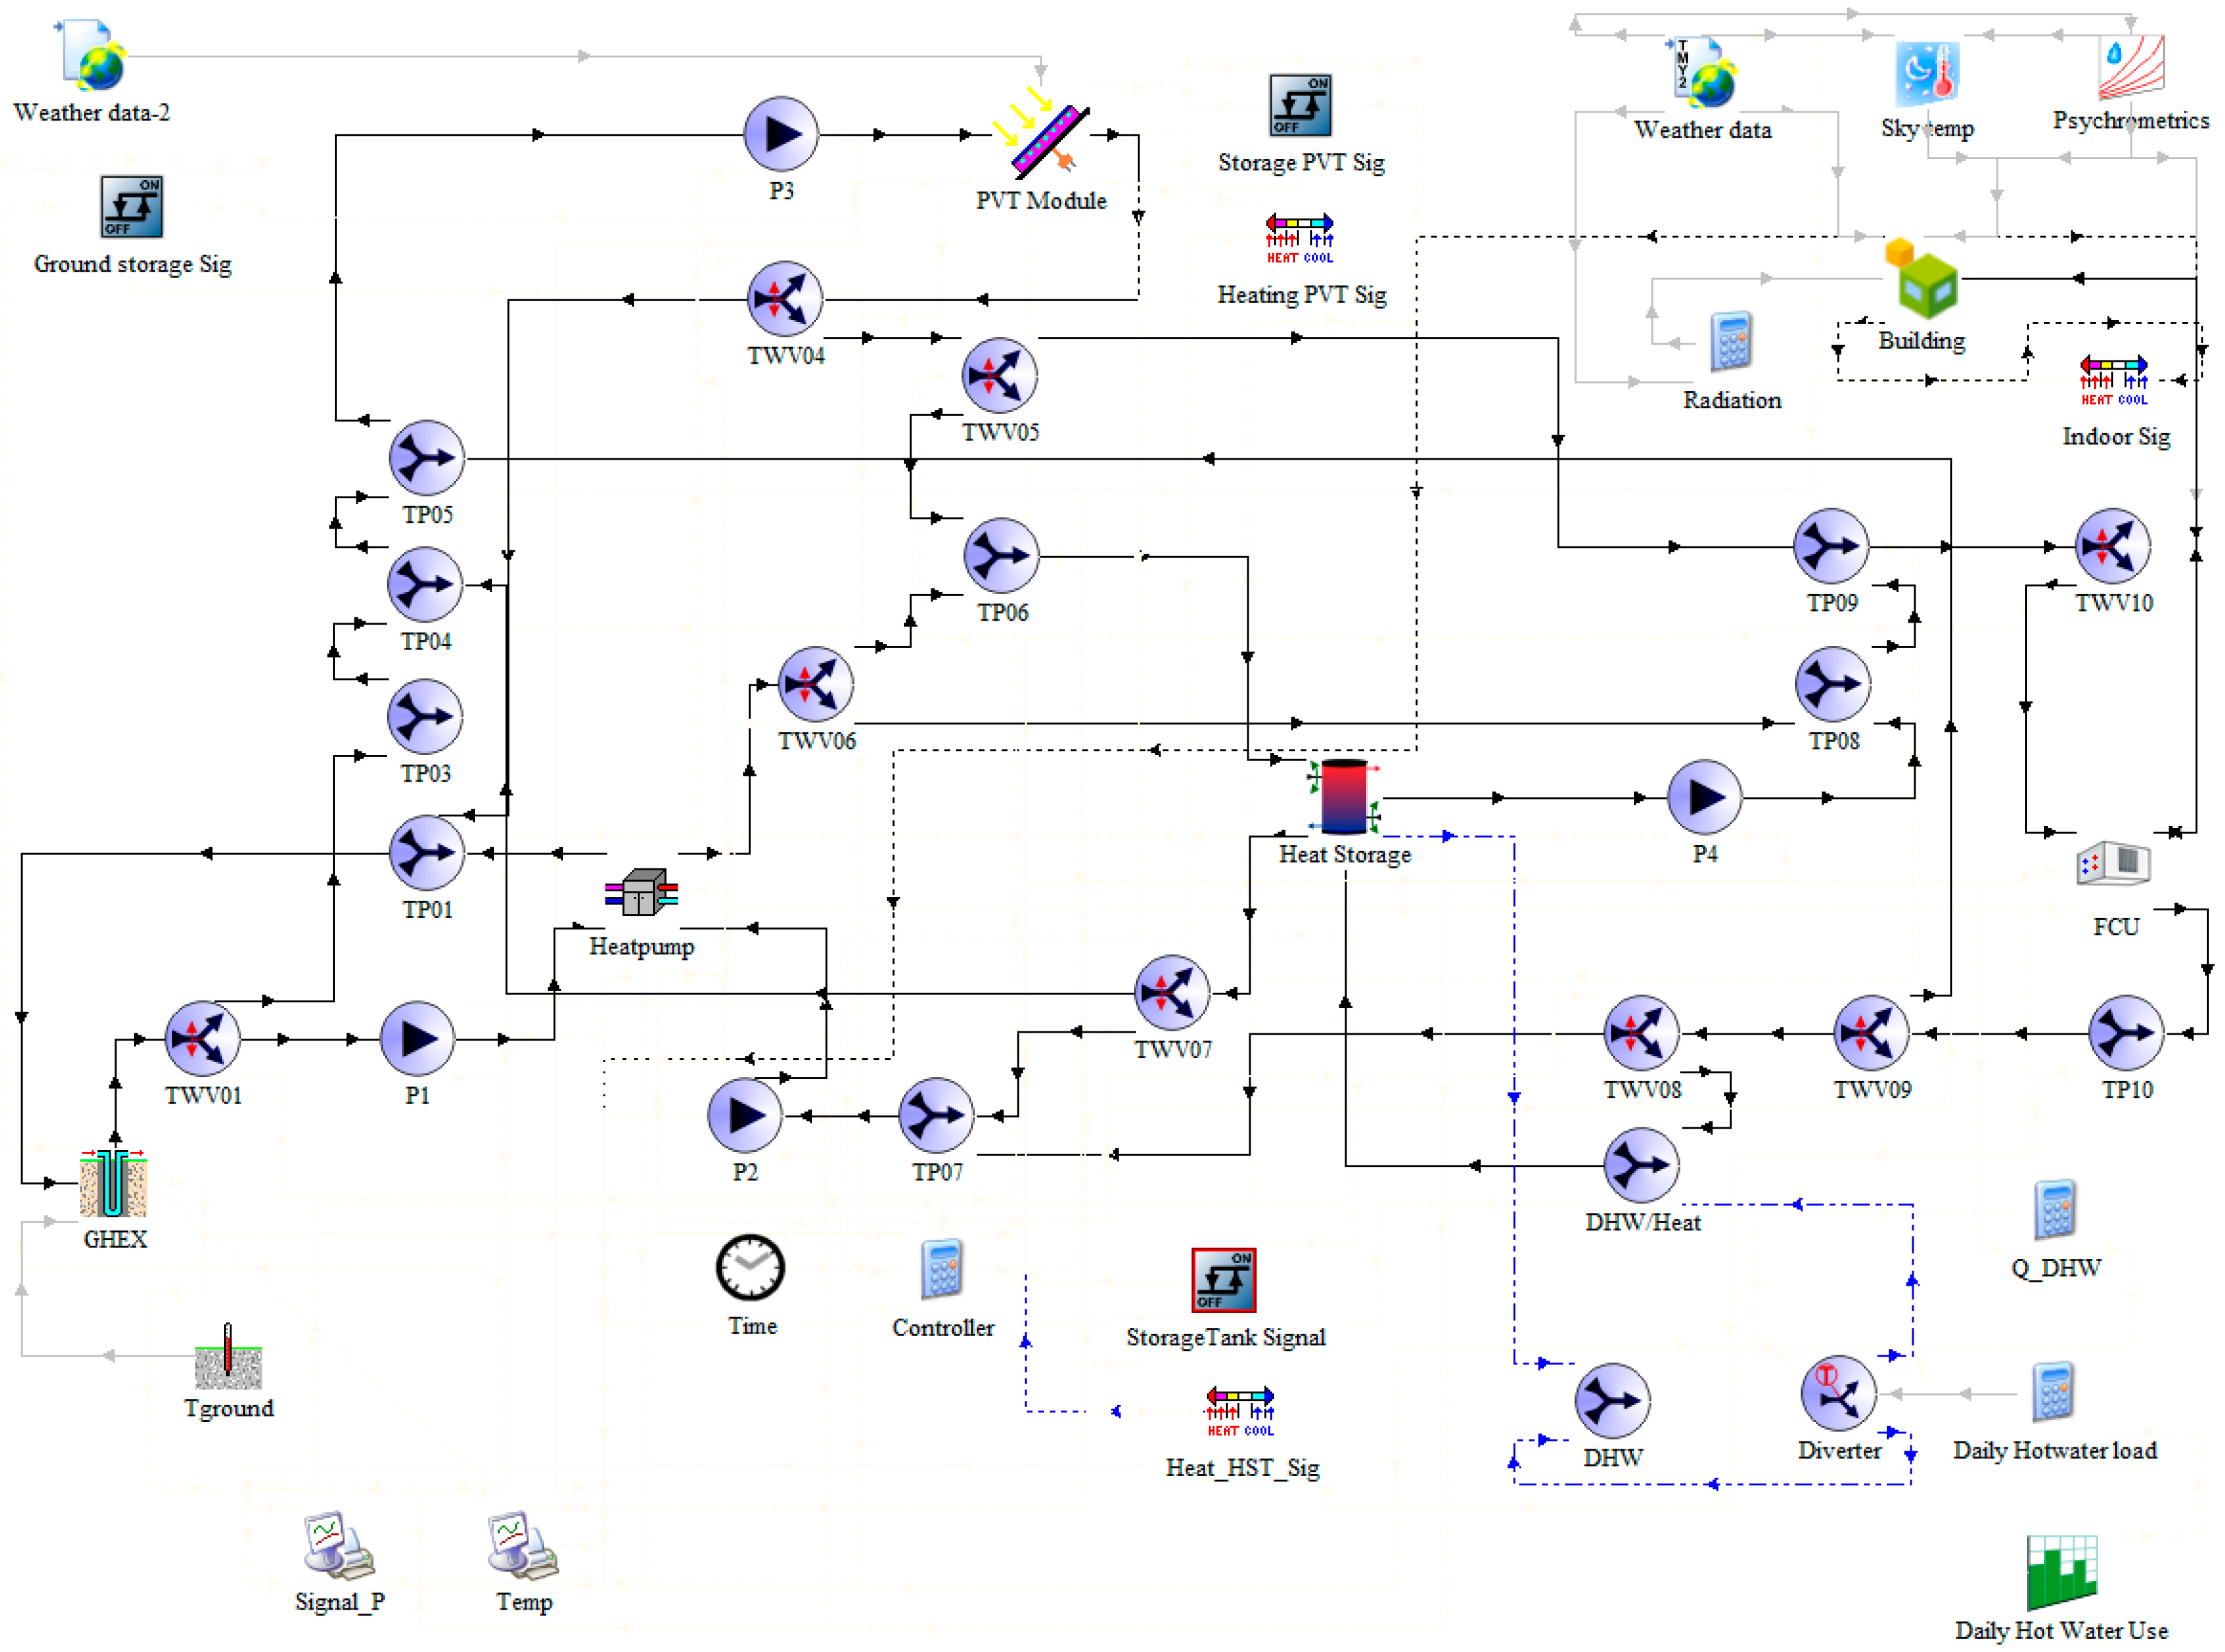
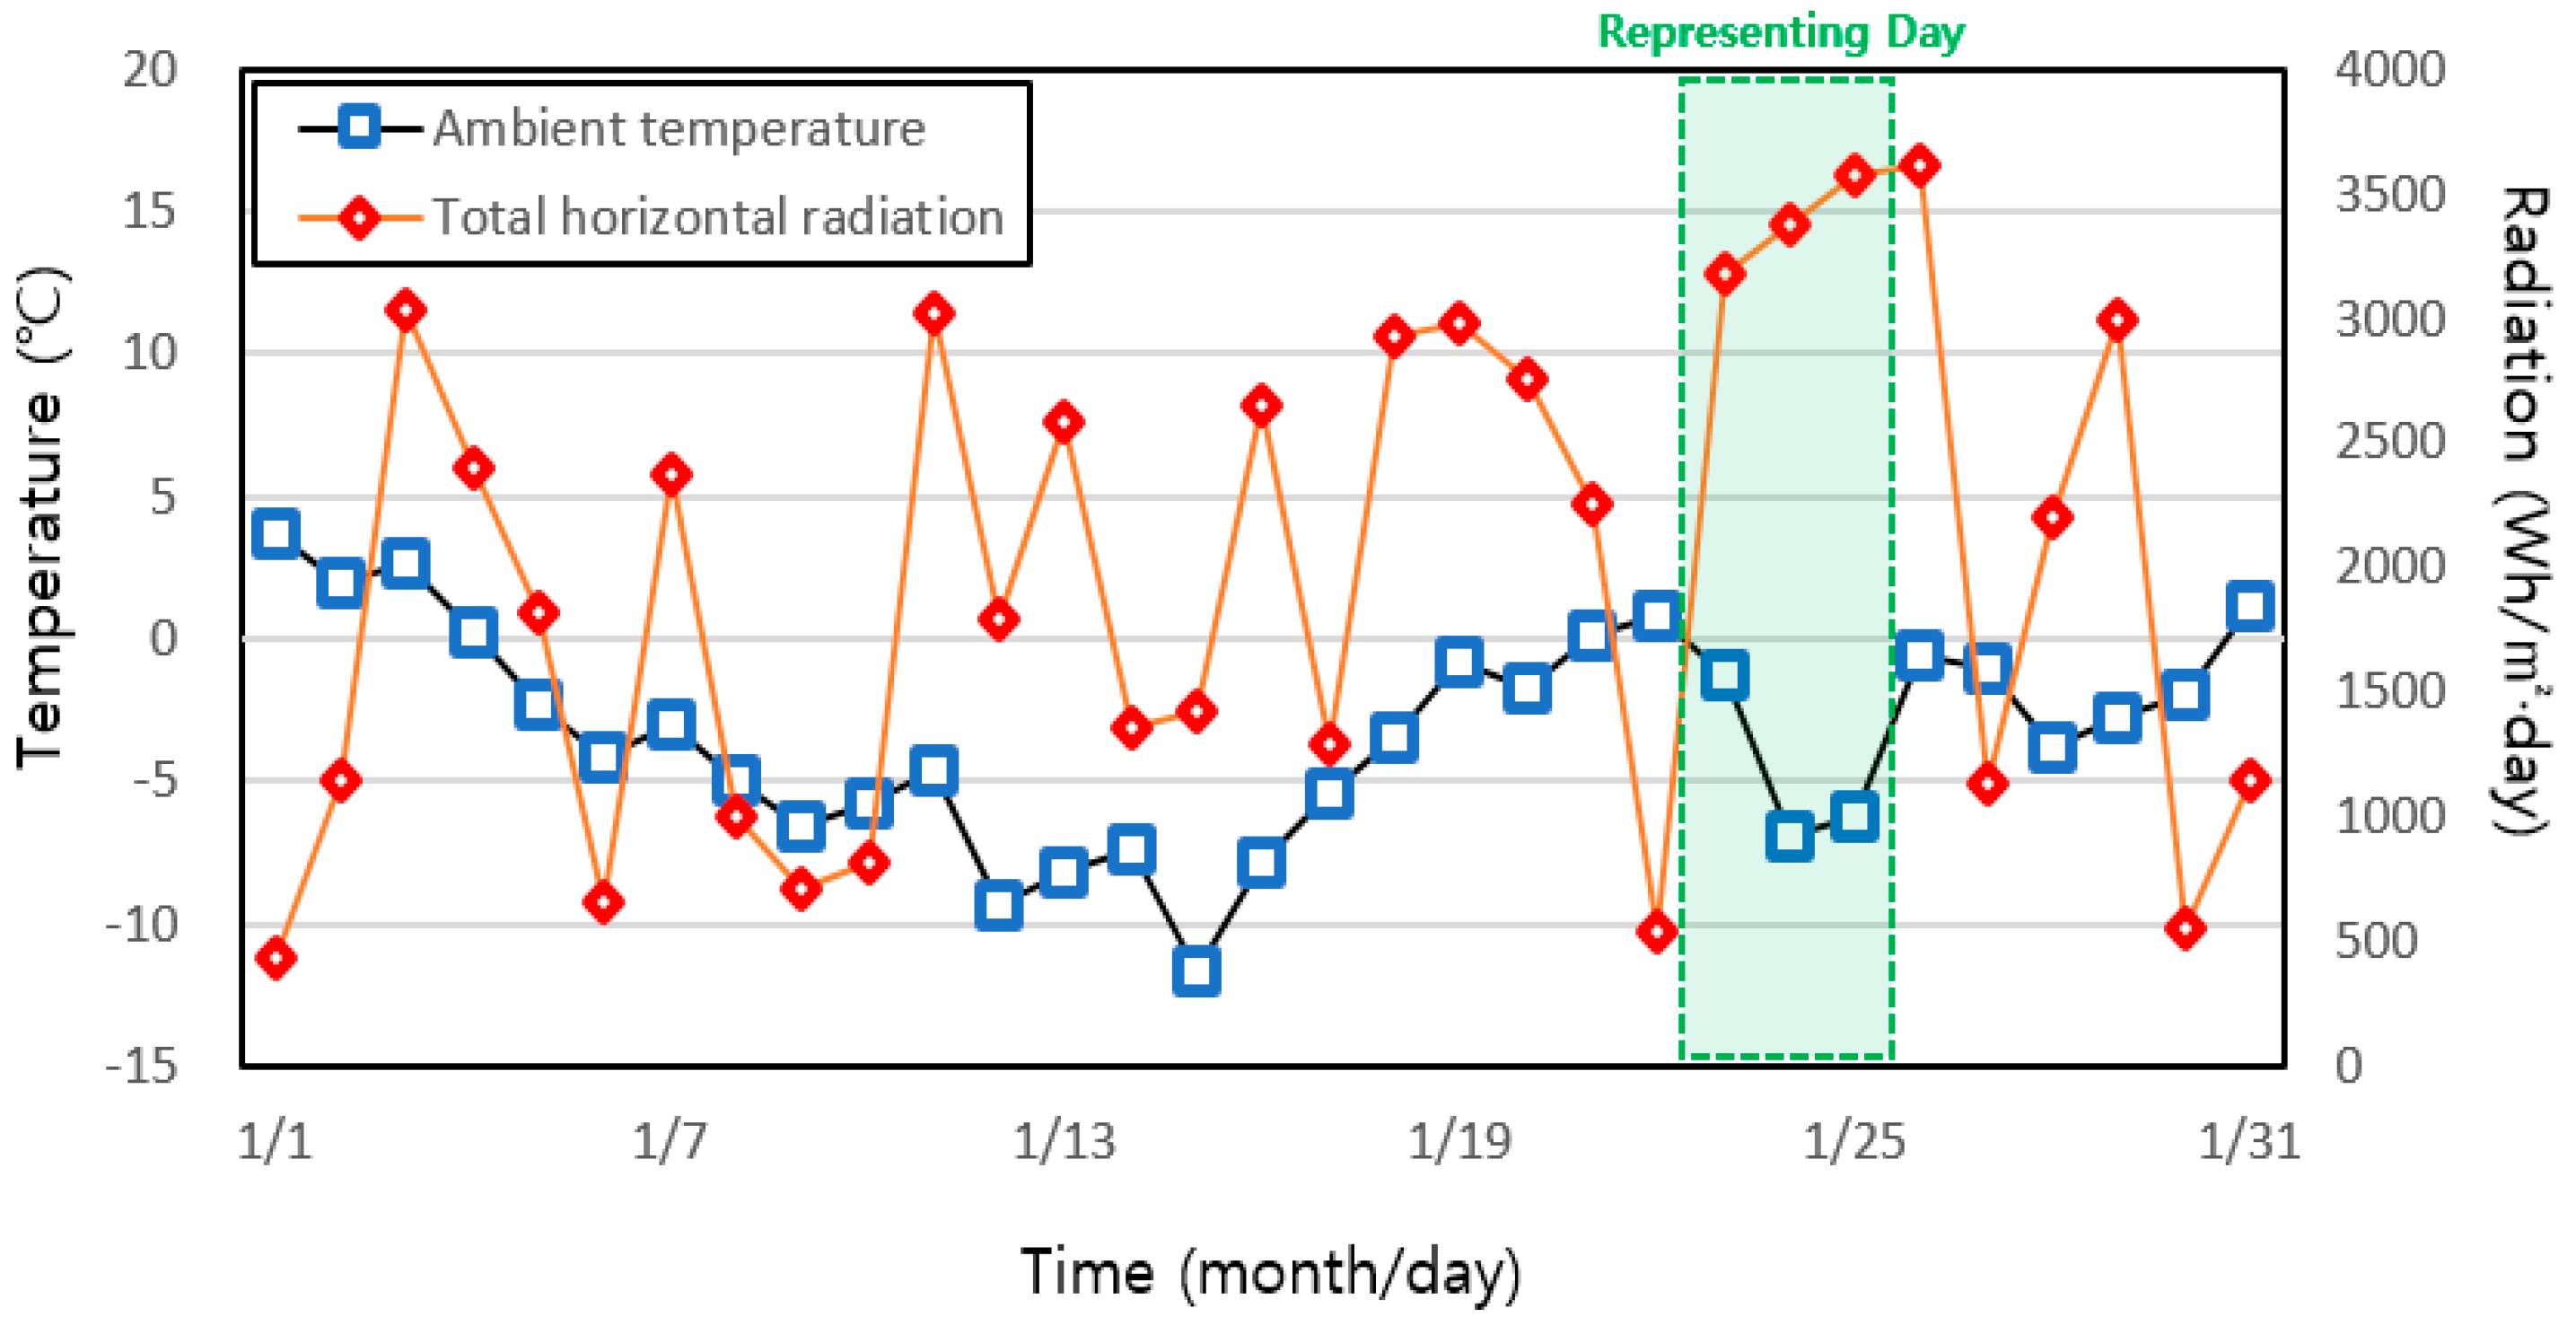
2.5. Case Study
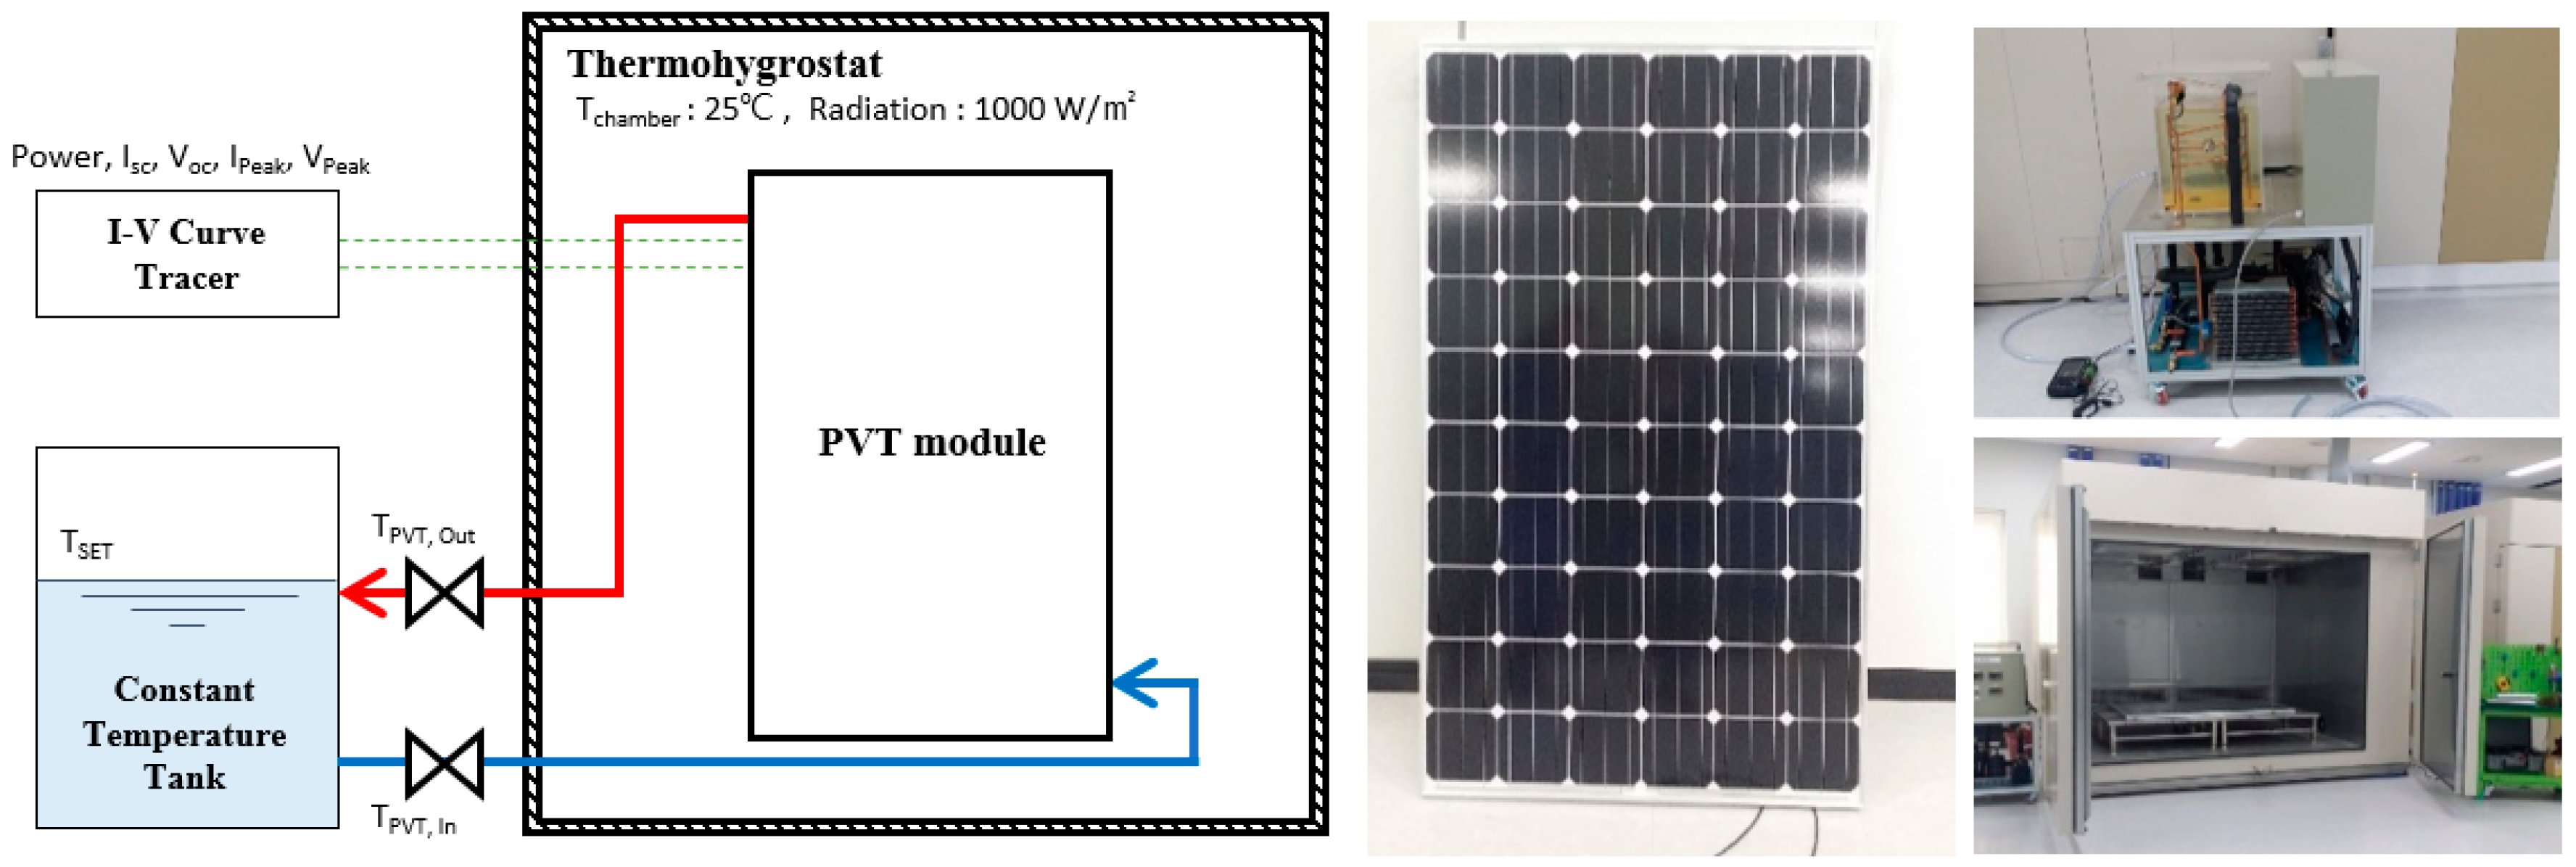
3. Validity of the Simulation Model
4. Simulation Results
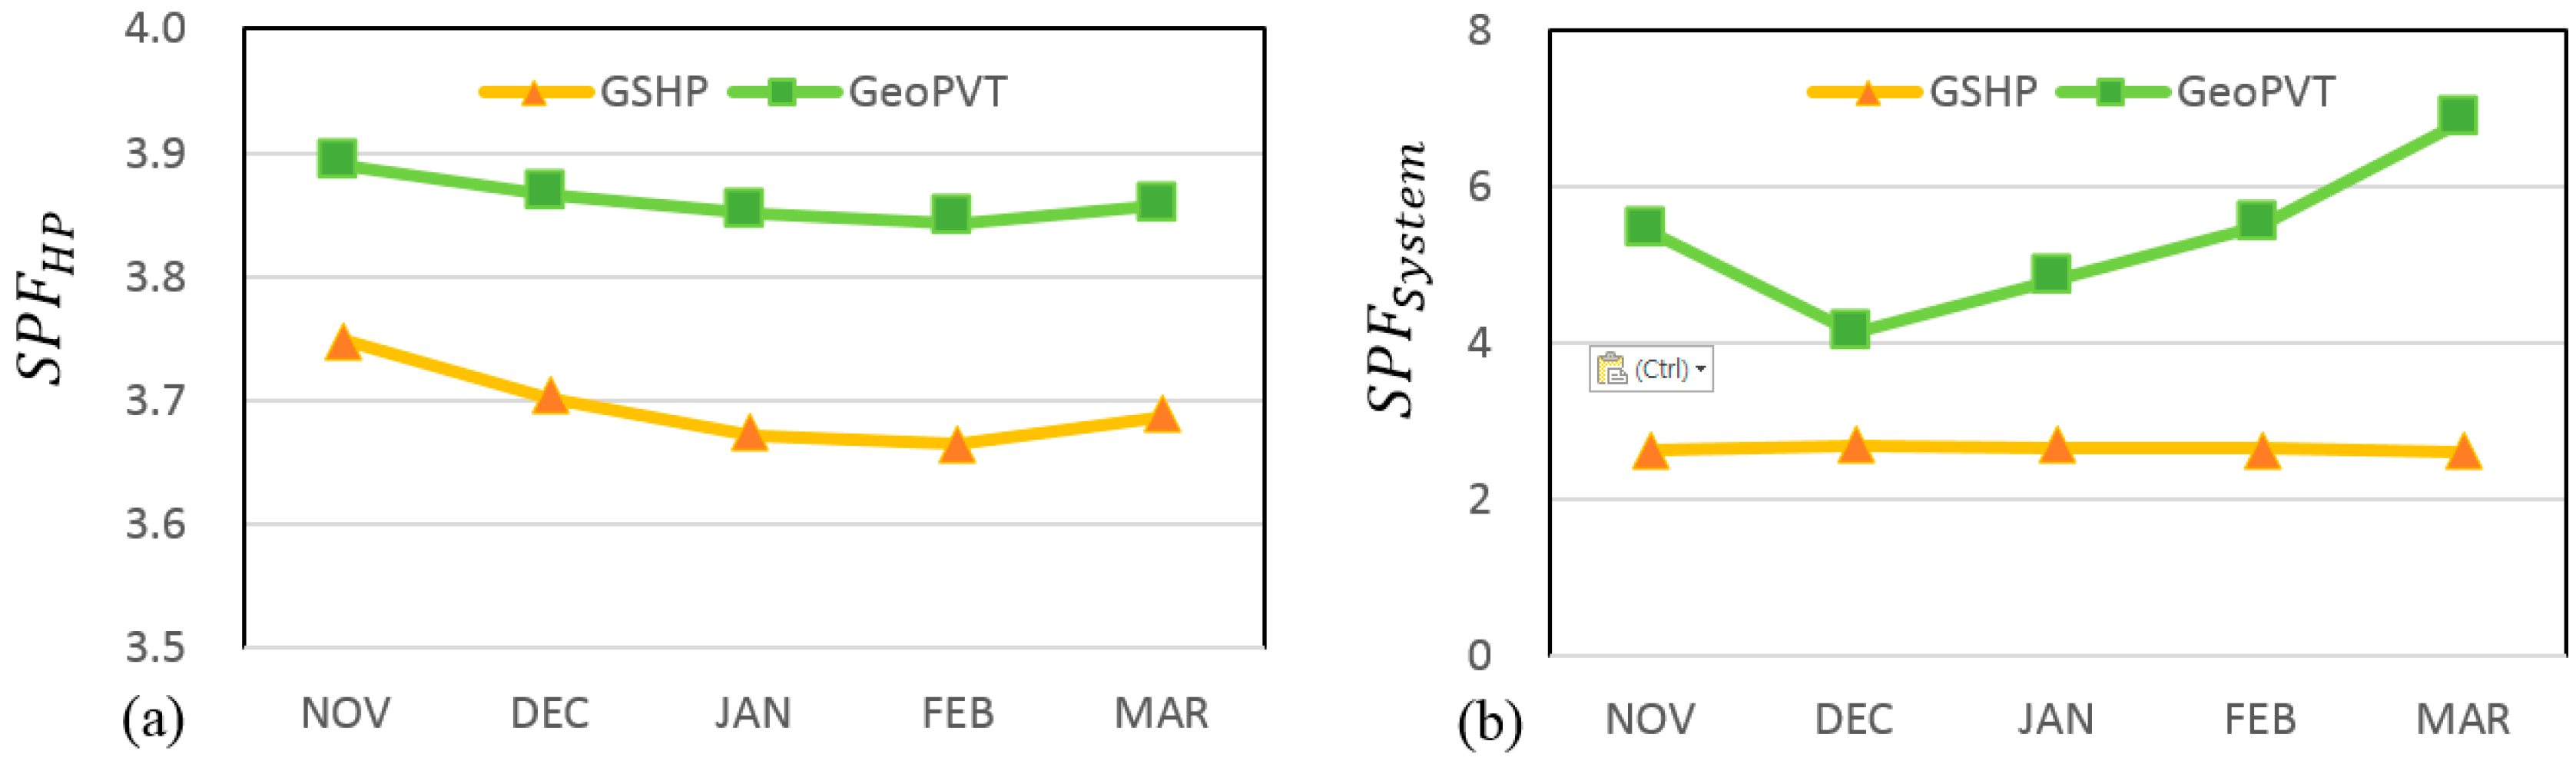
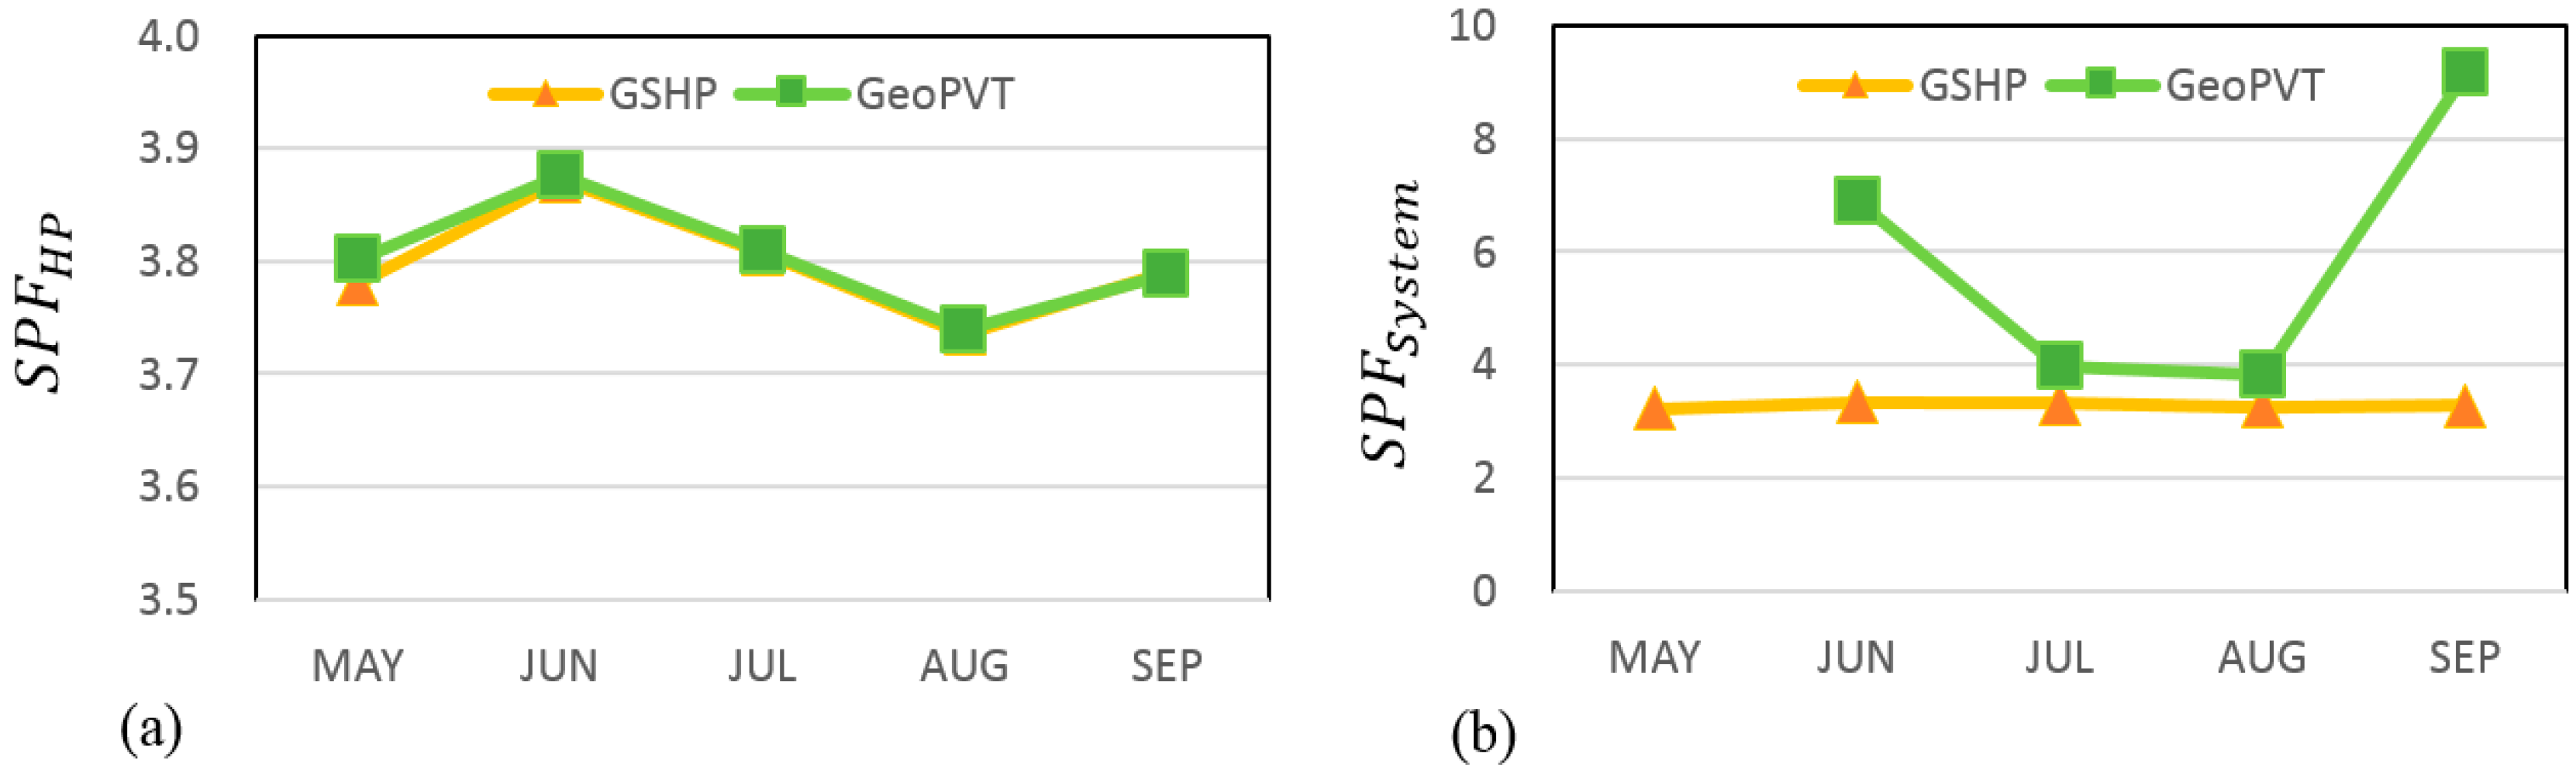
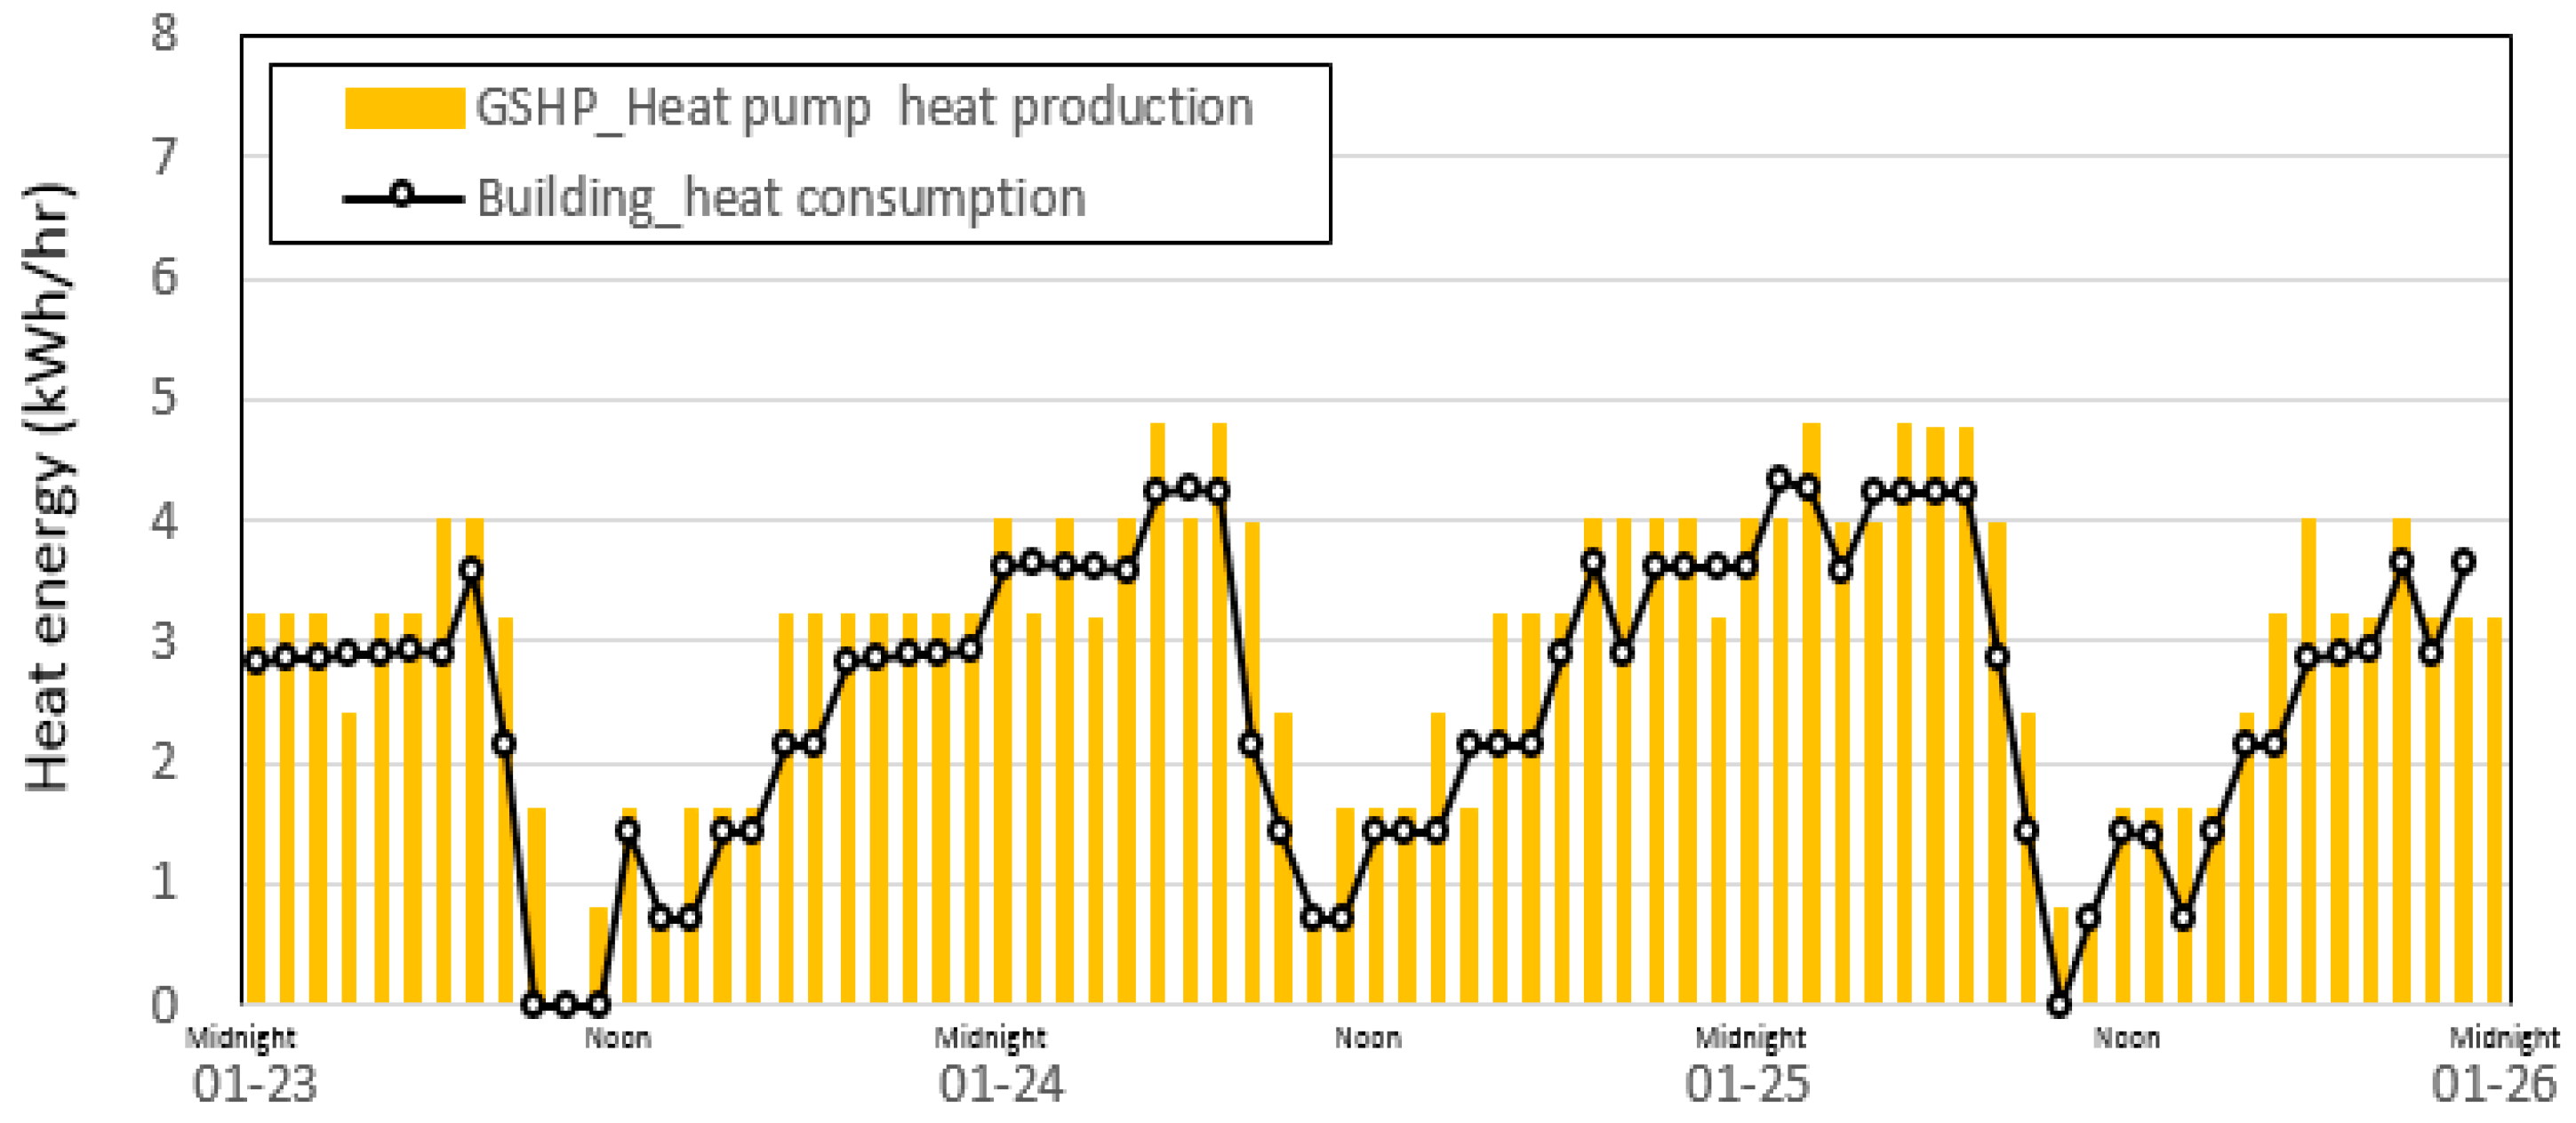
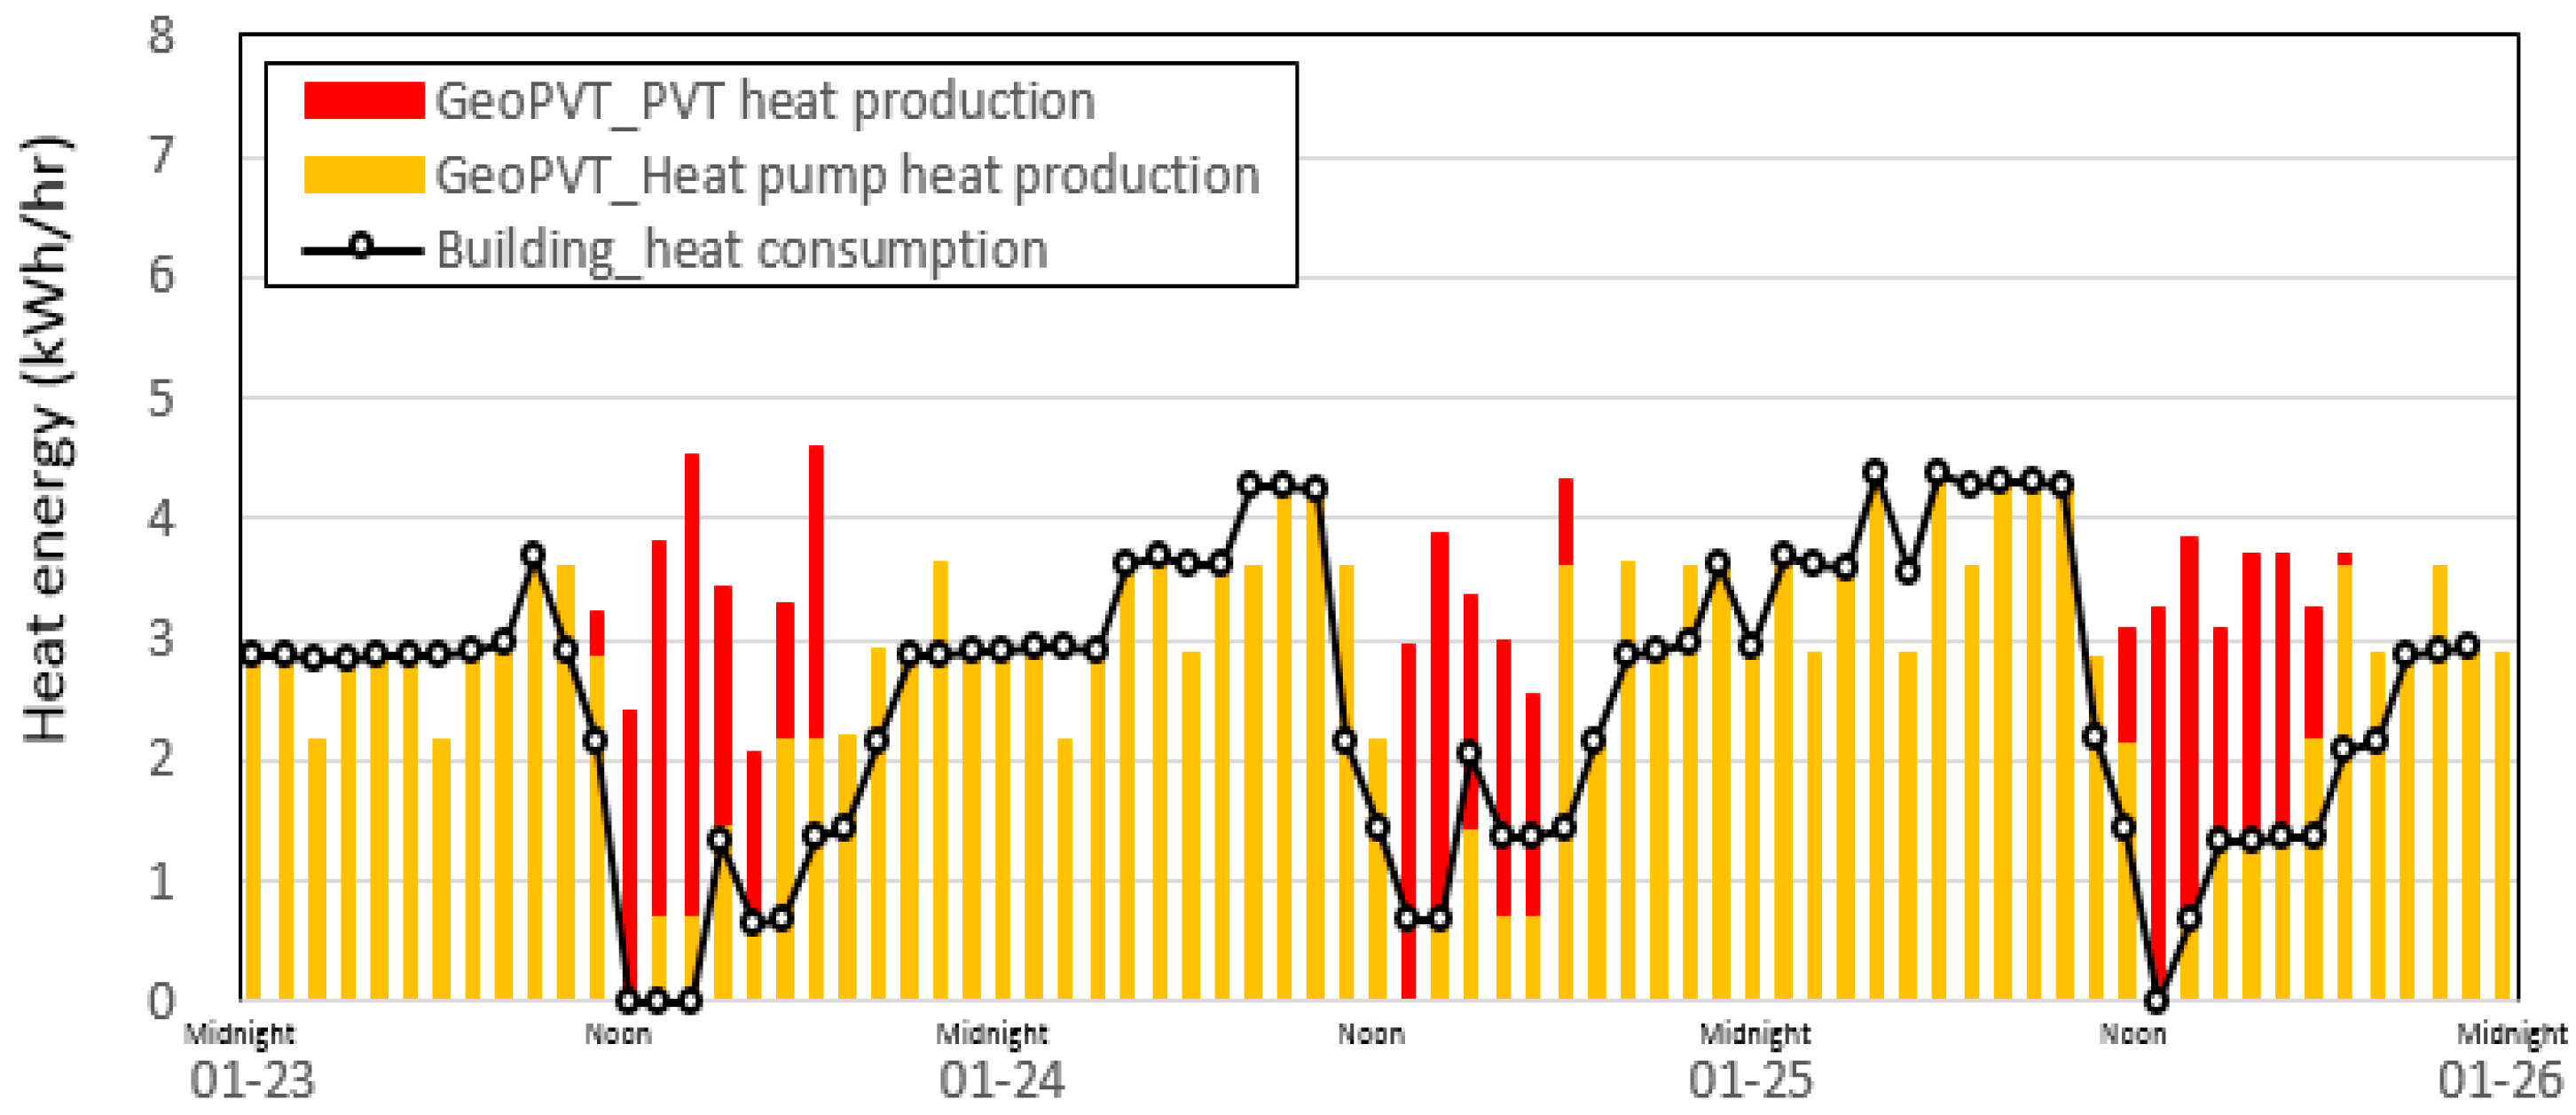
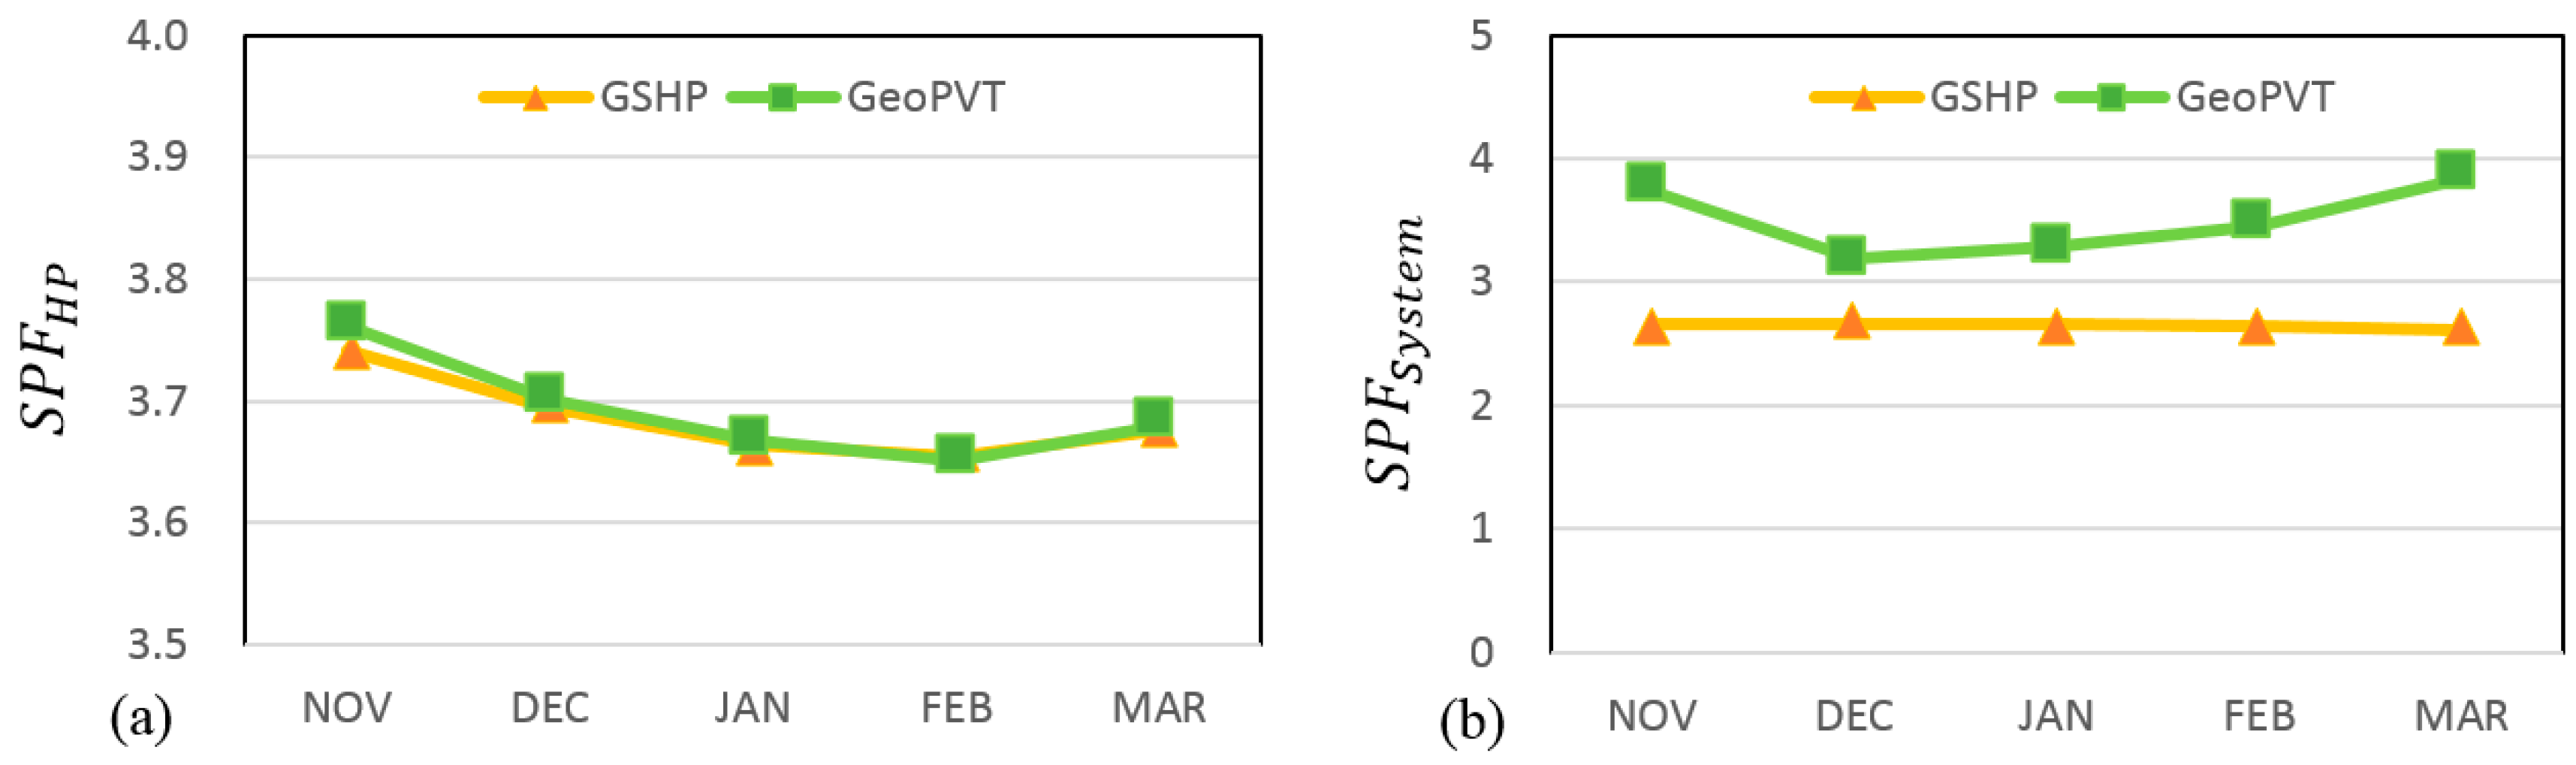
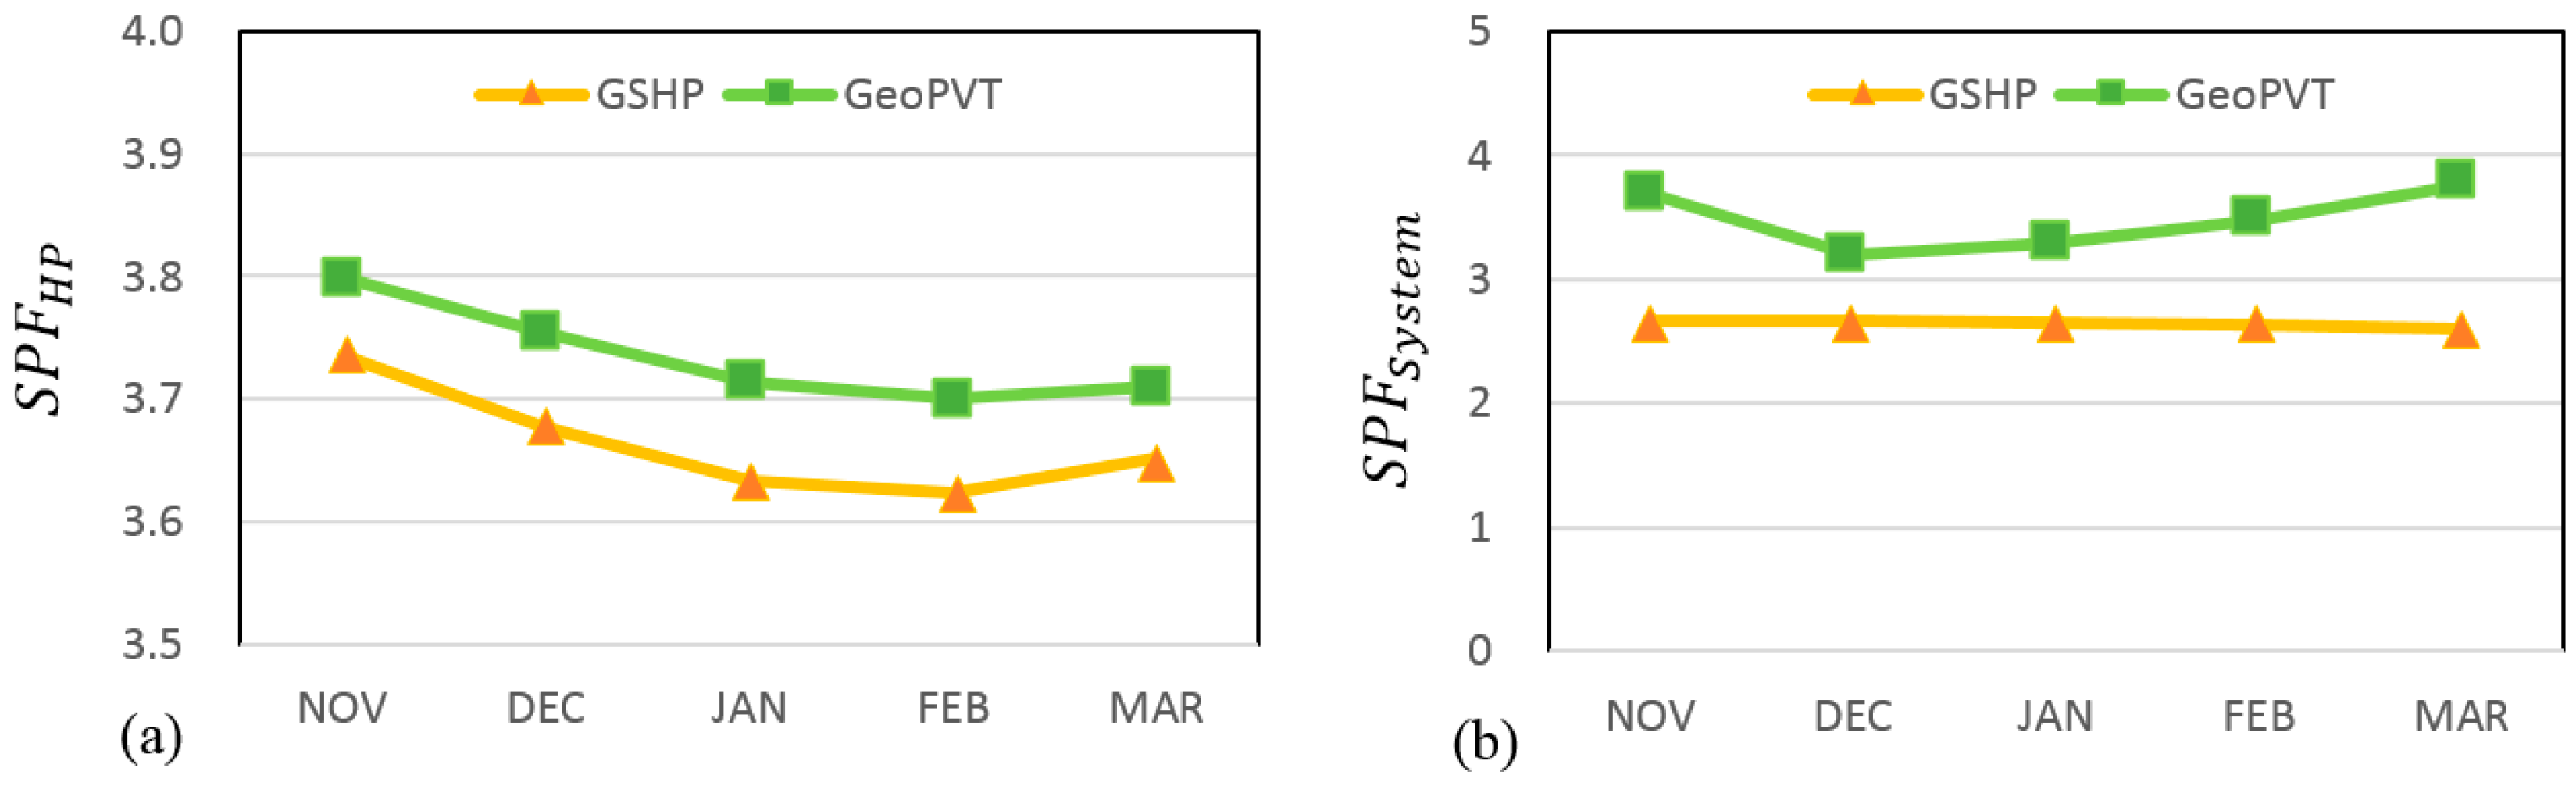
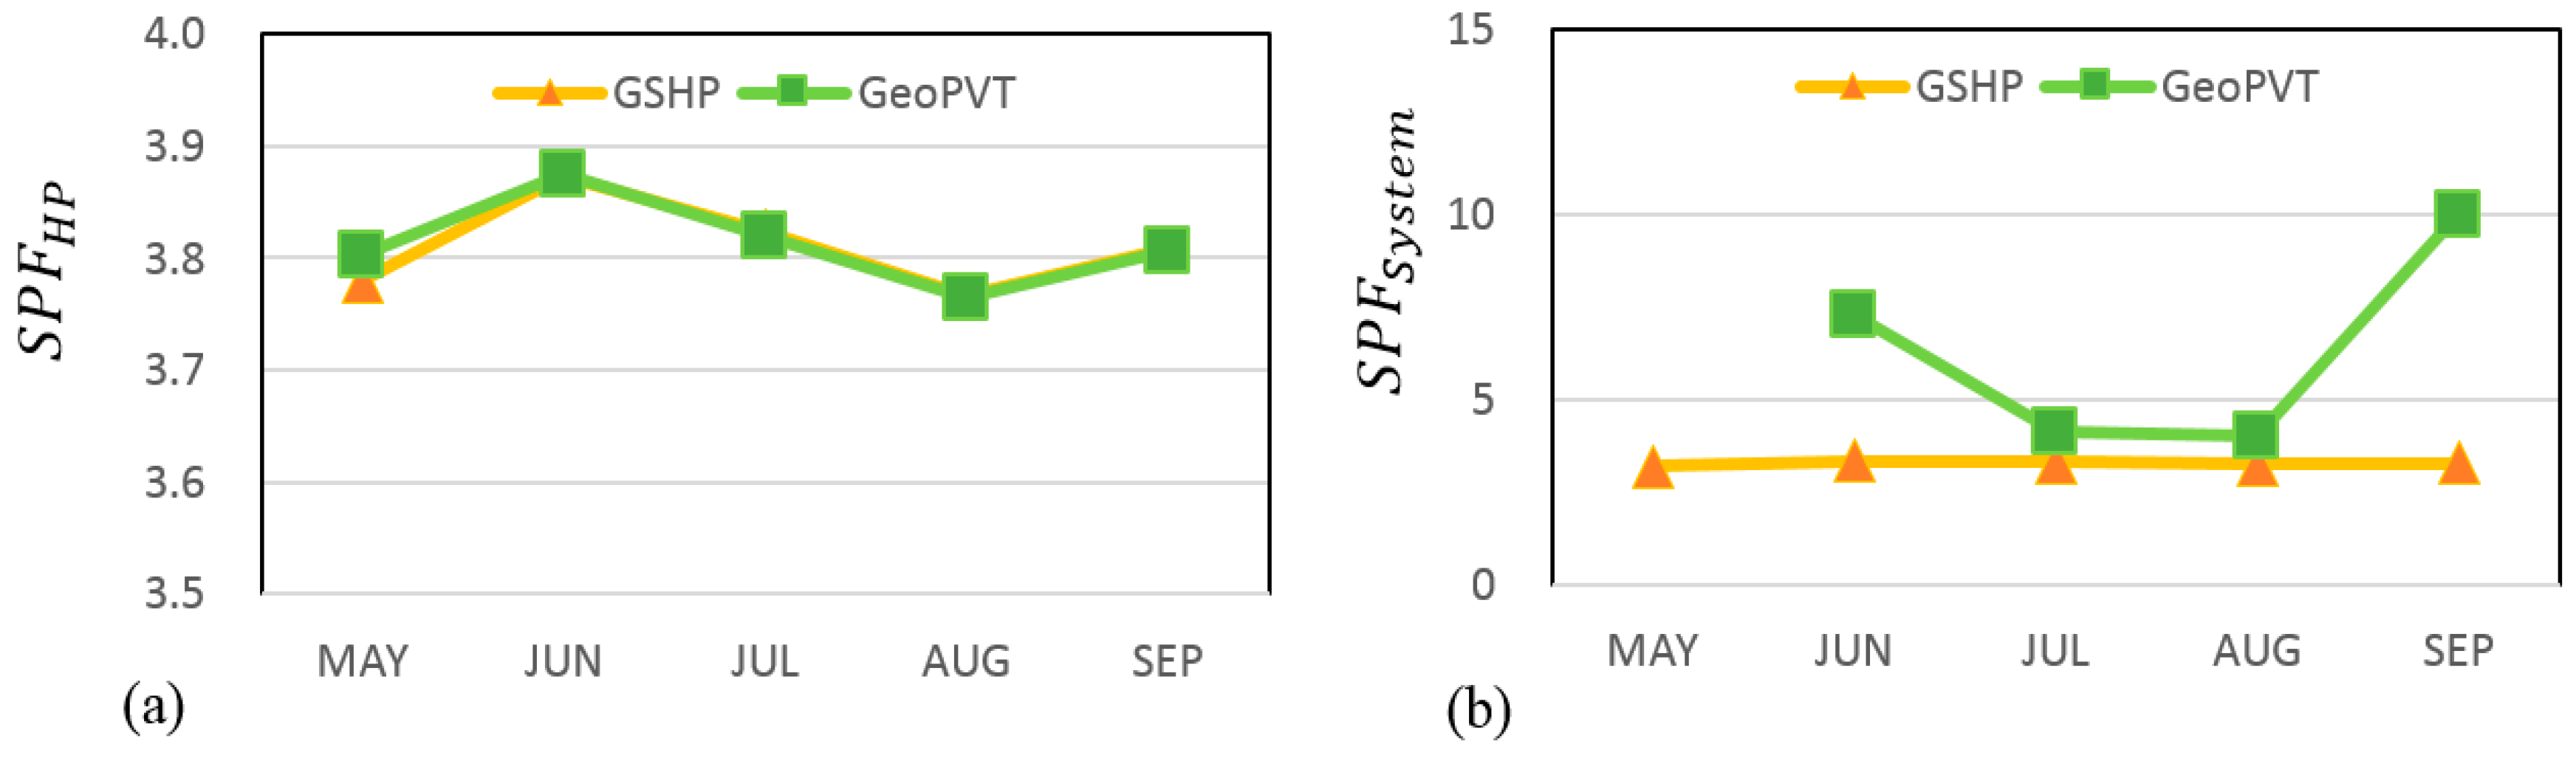
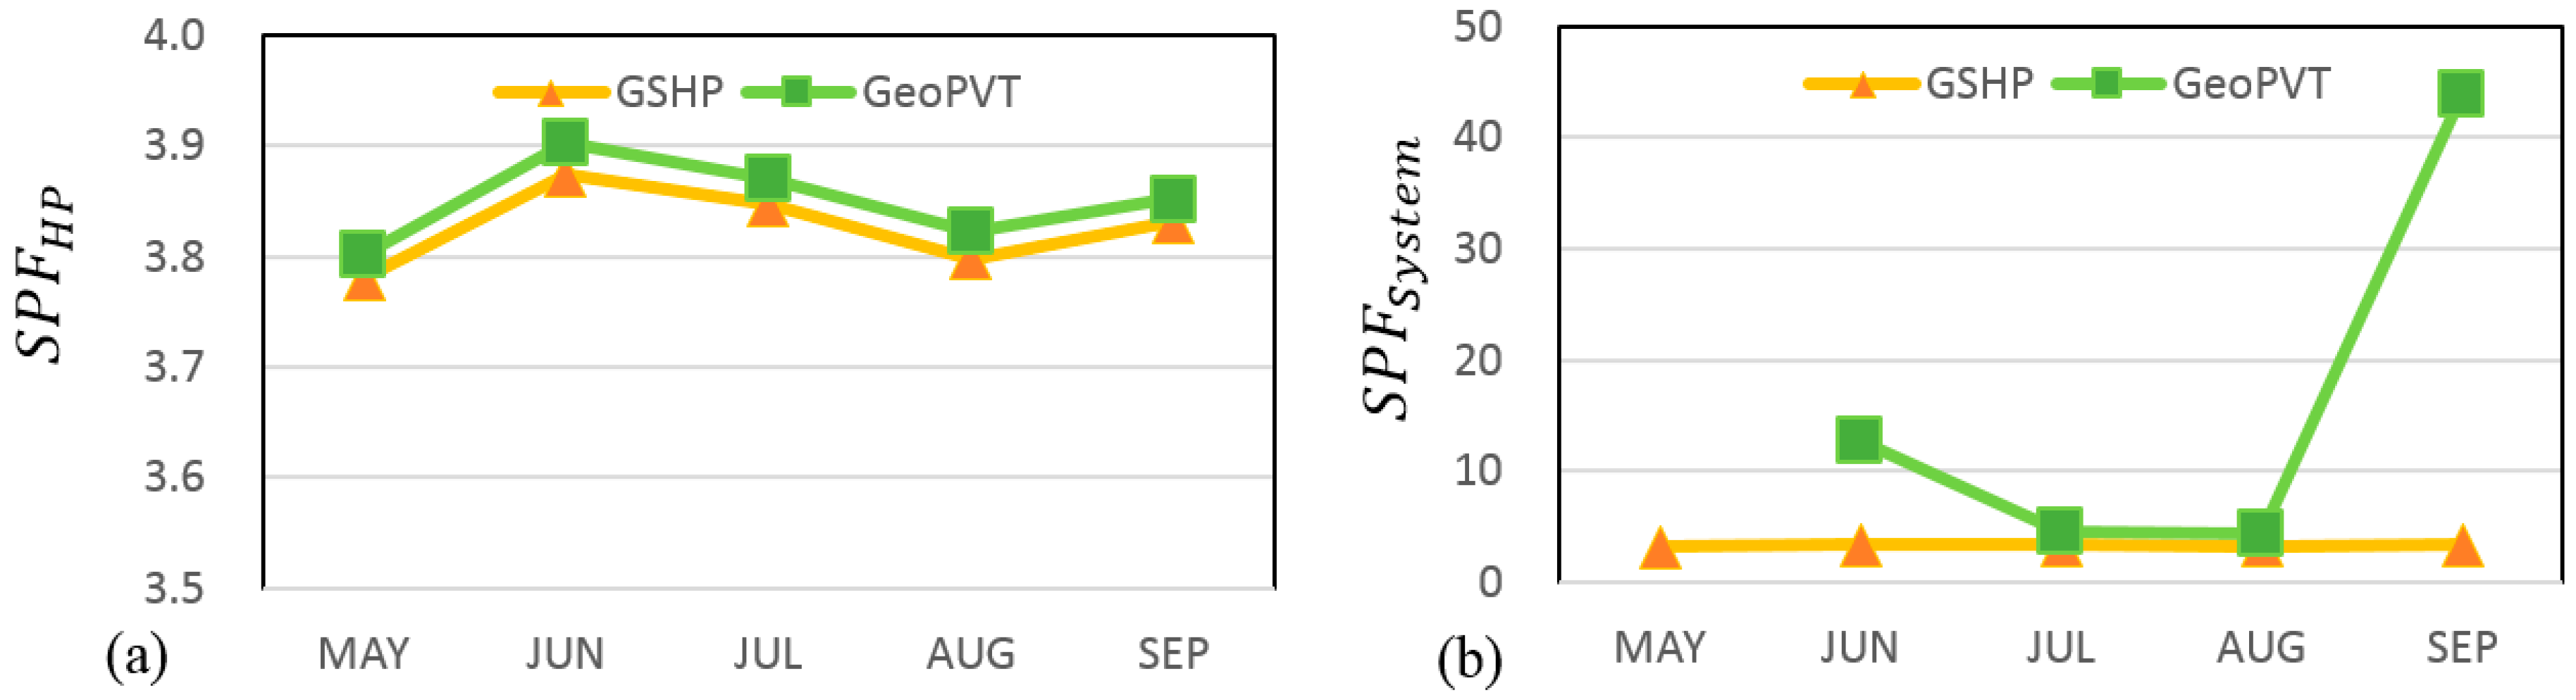
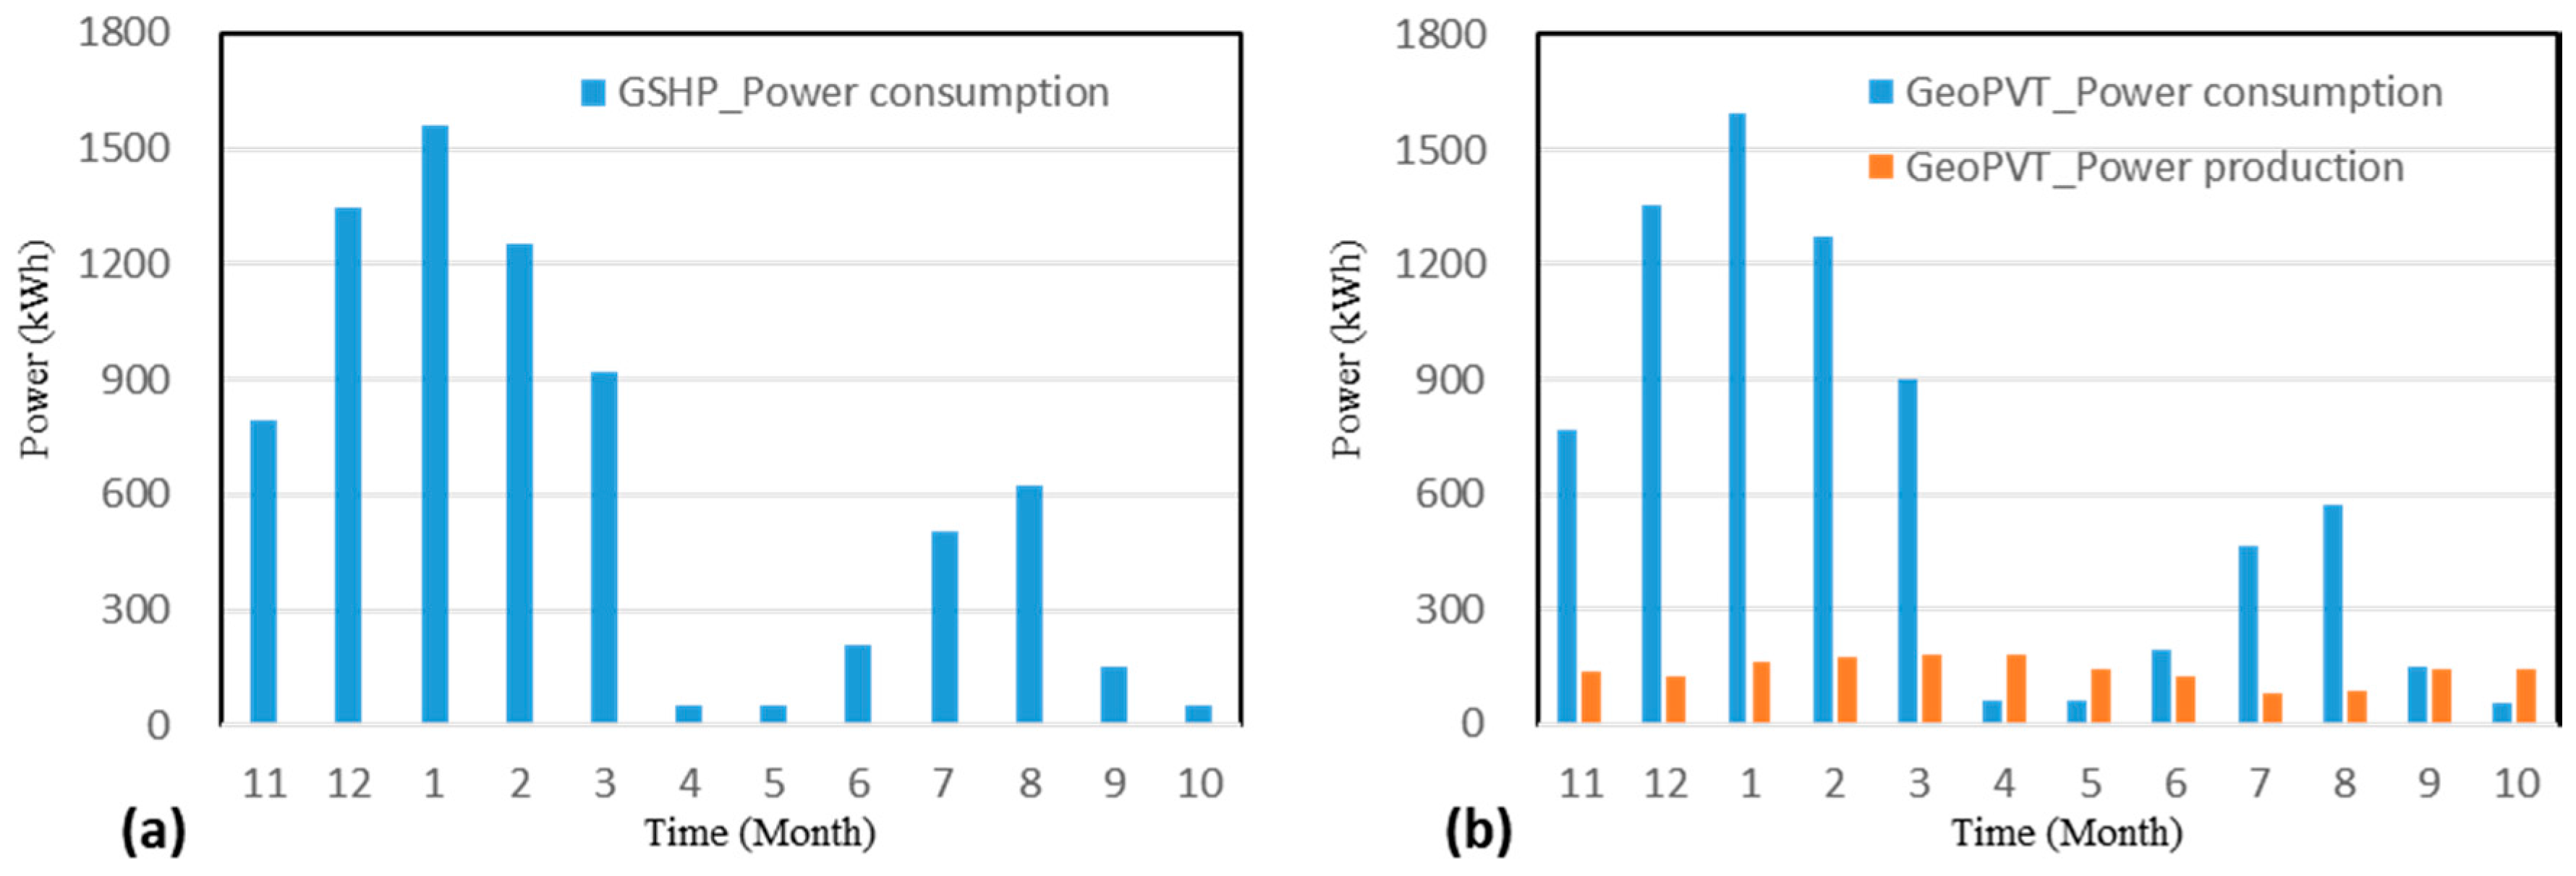
4.1. Performance Comparison between Geo-Photovoltaic/Thermal and Ground Source Heat Pump
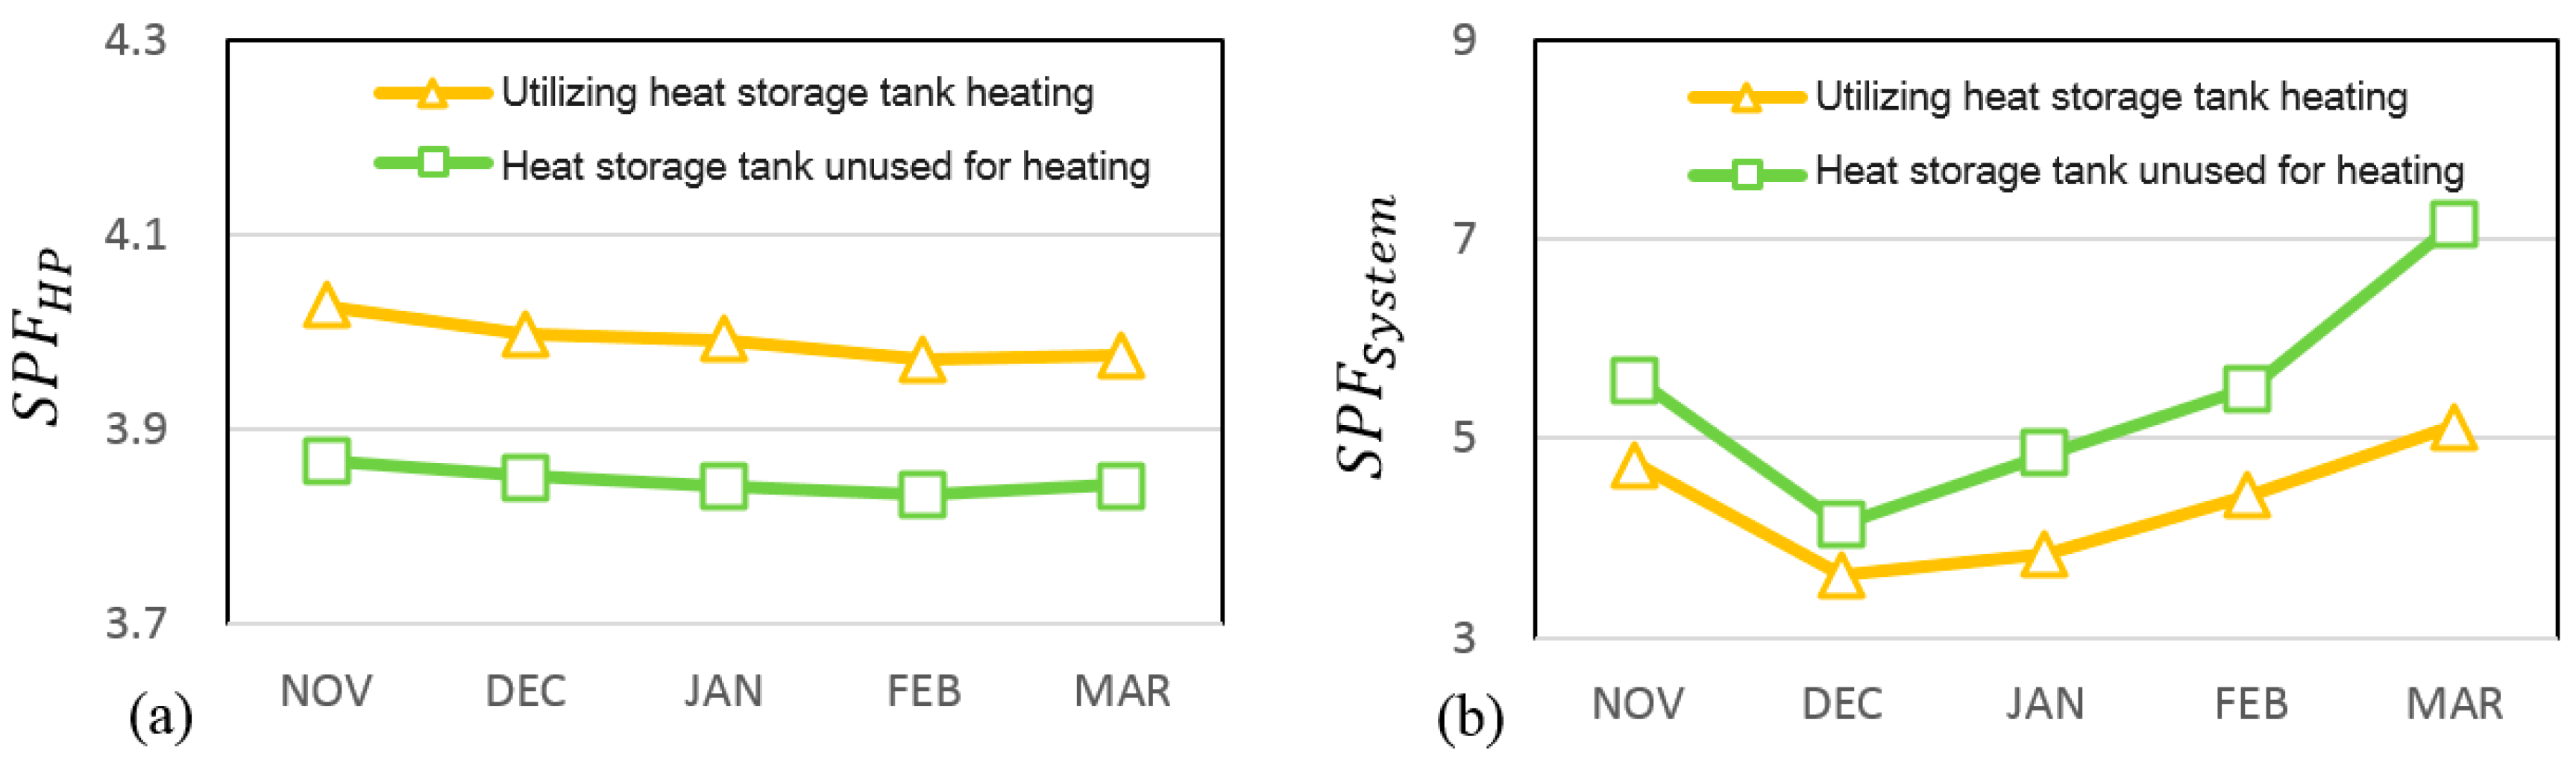
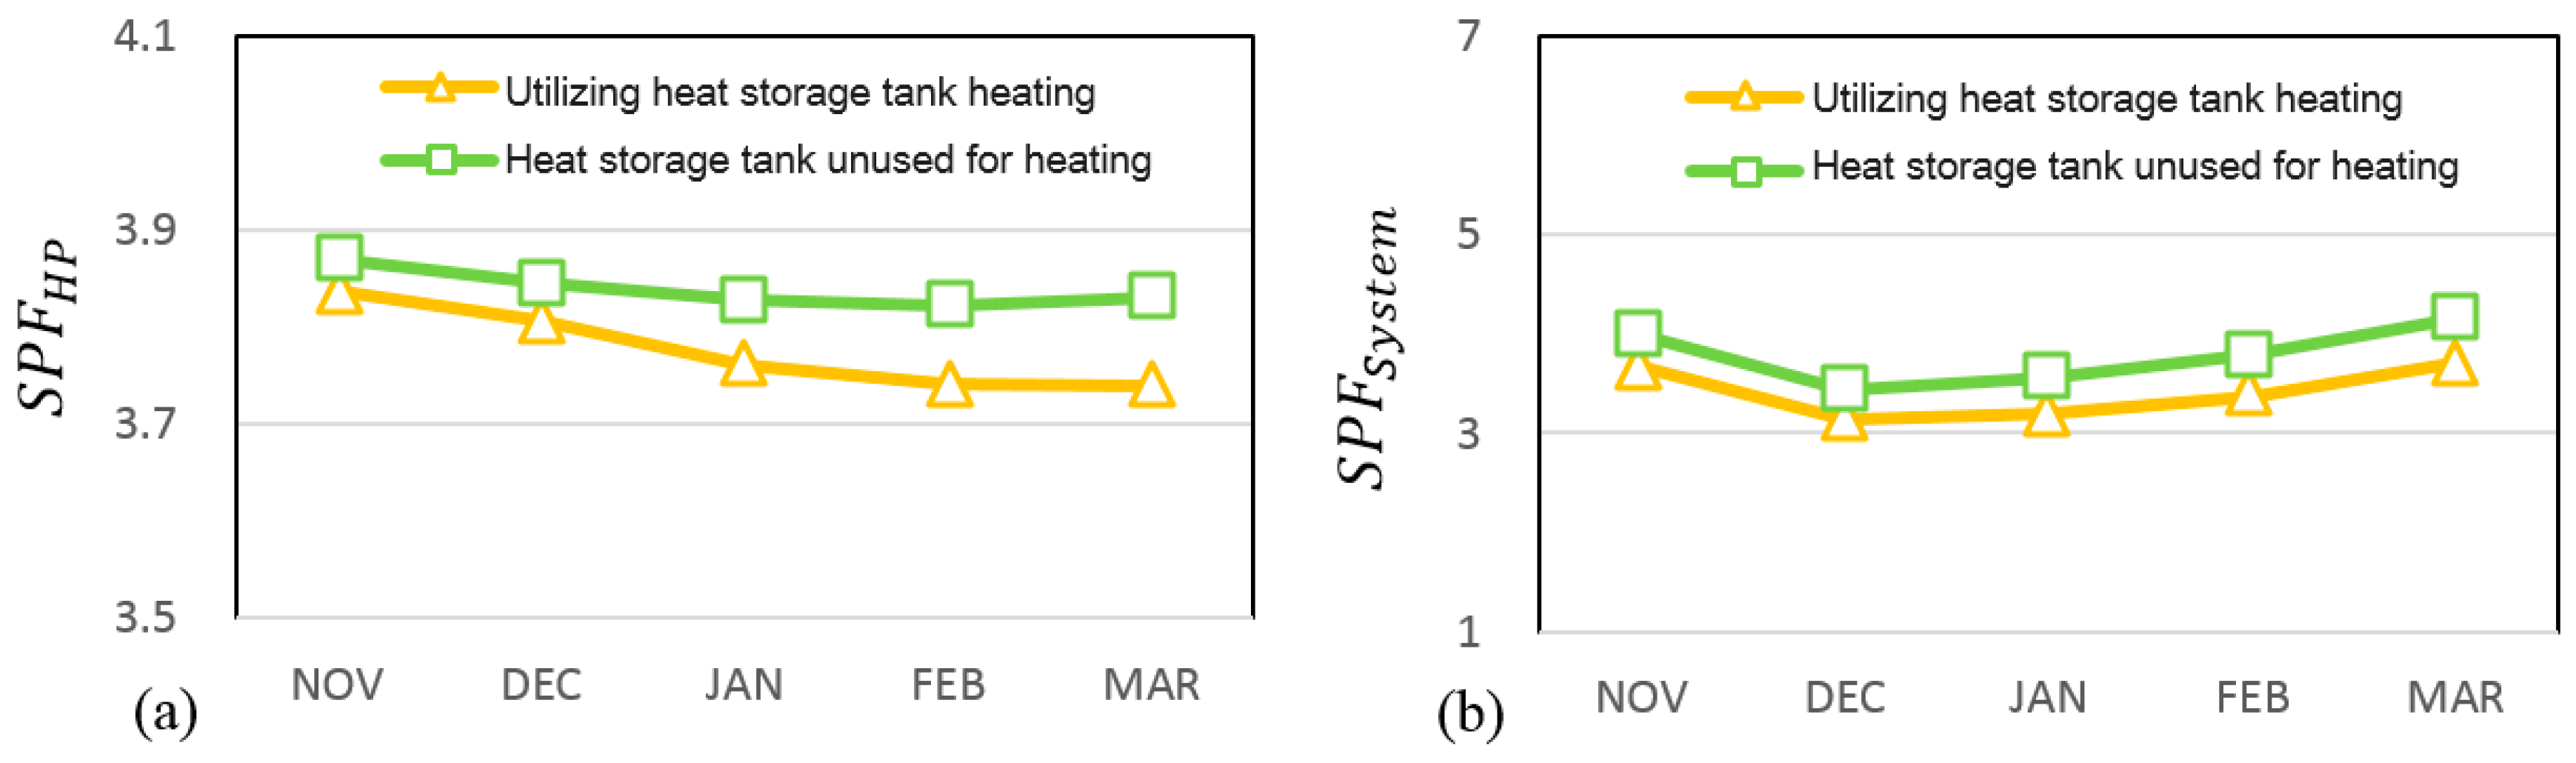
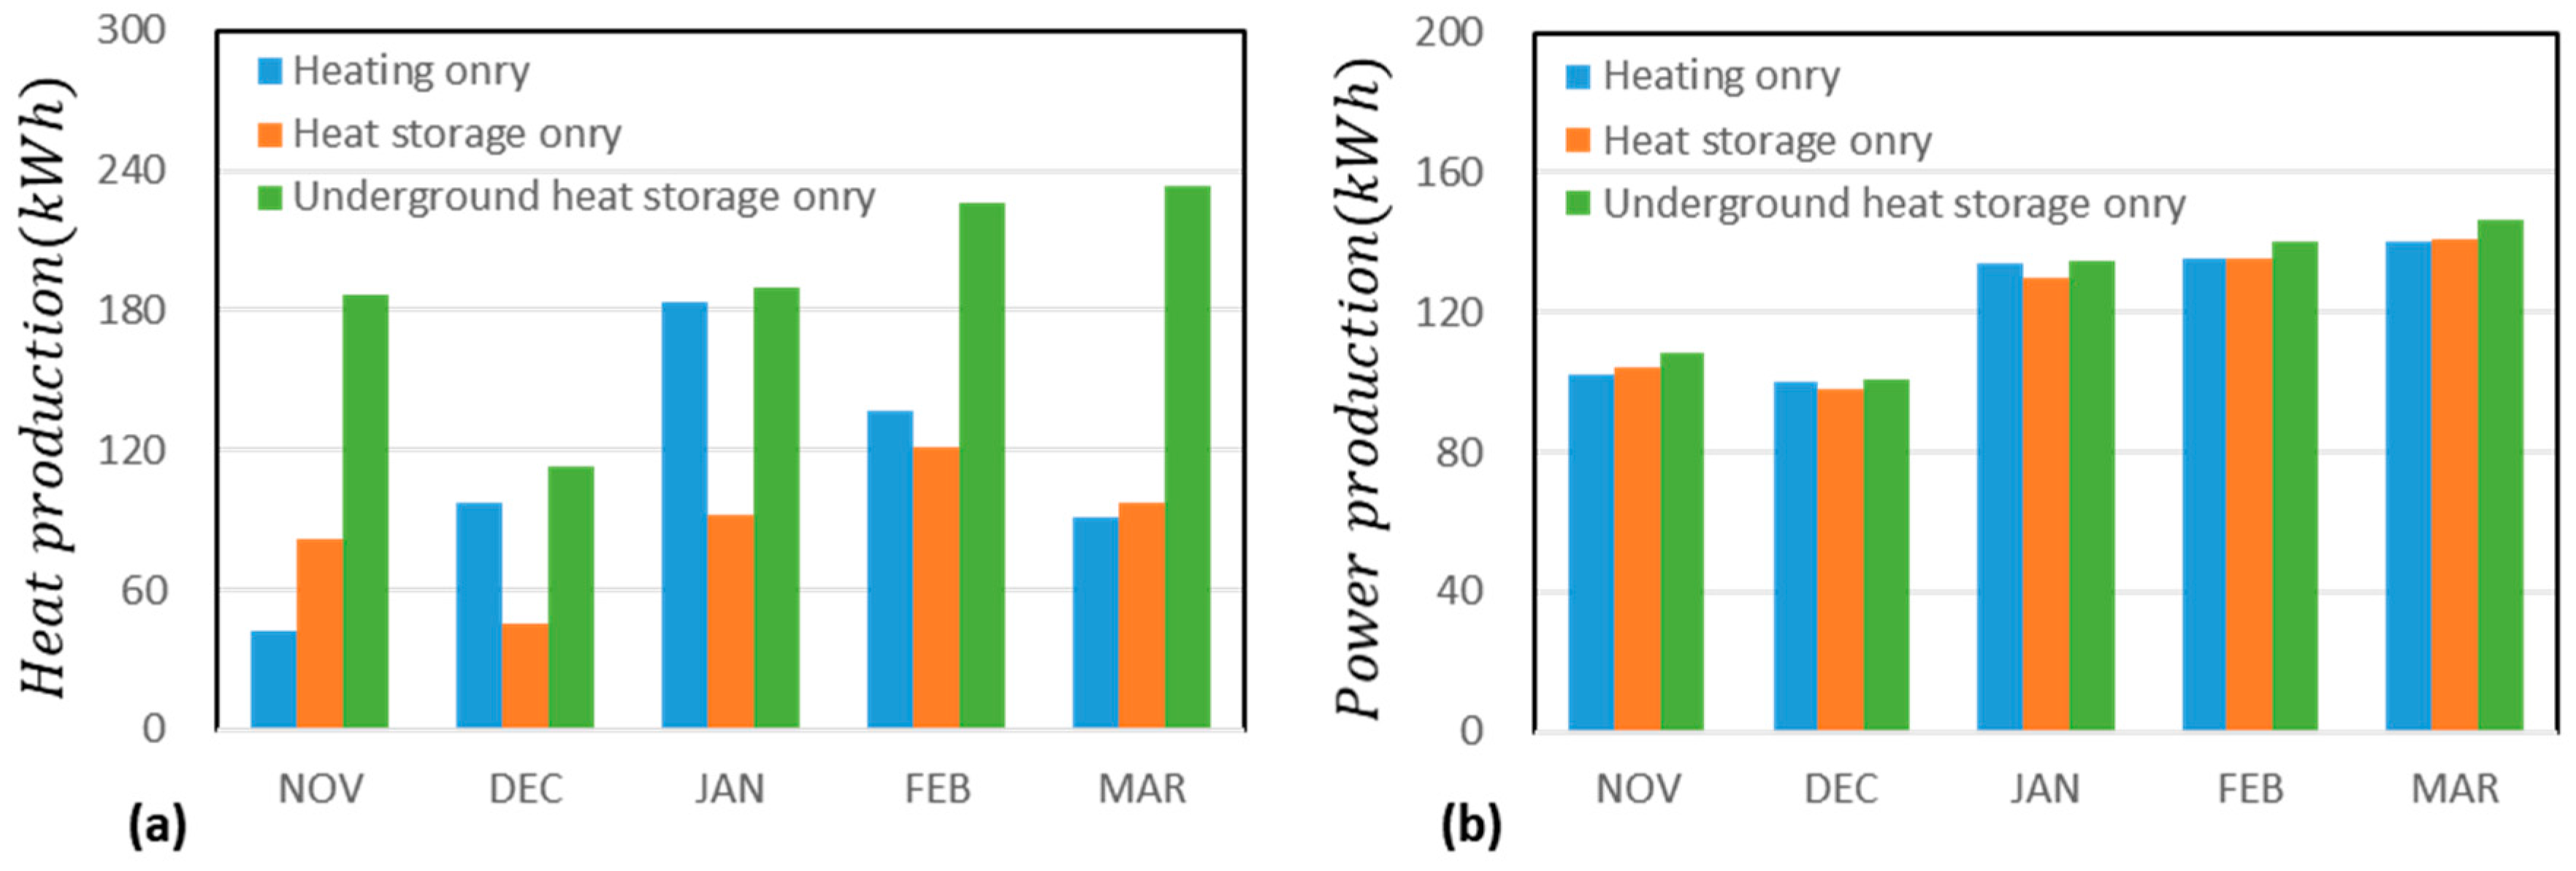
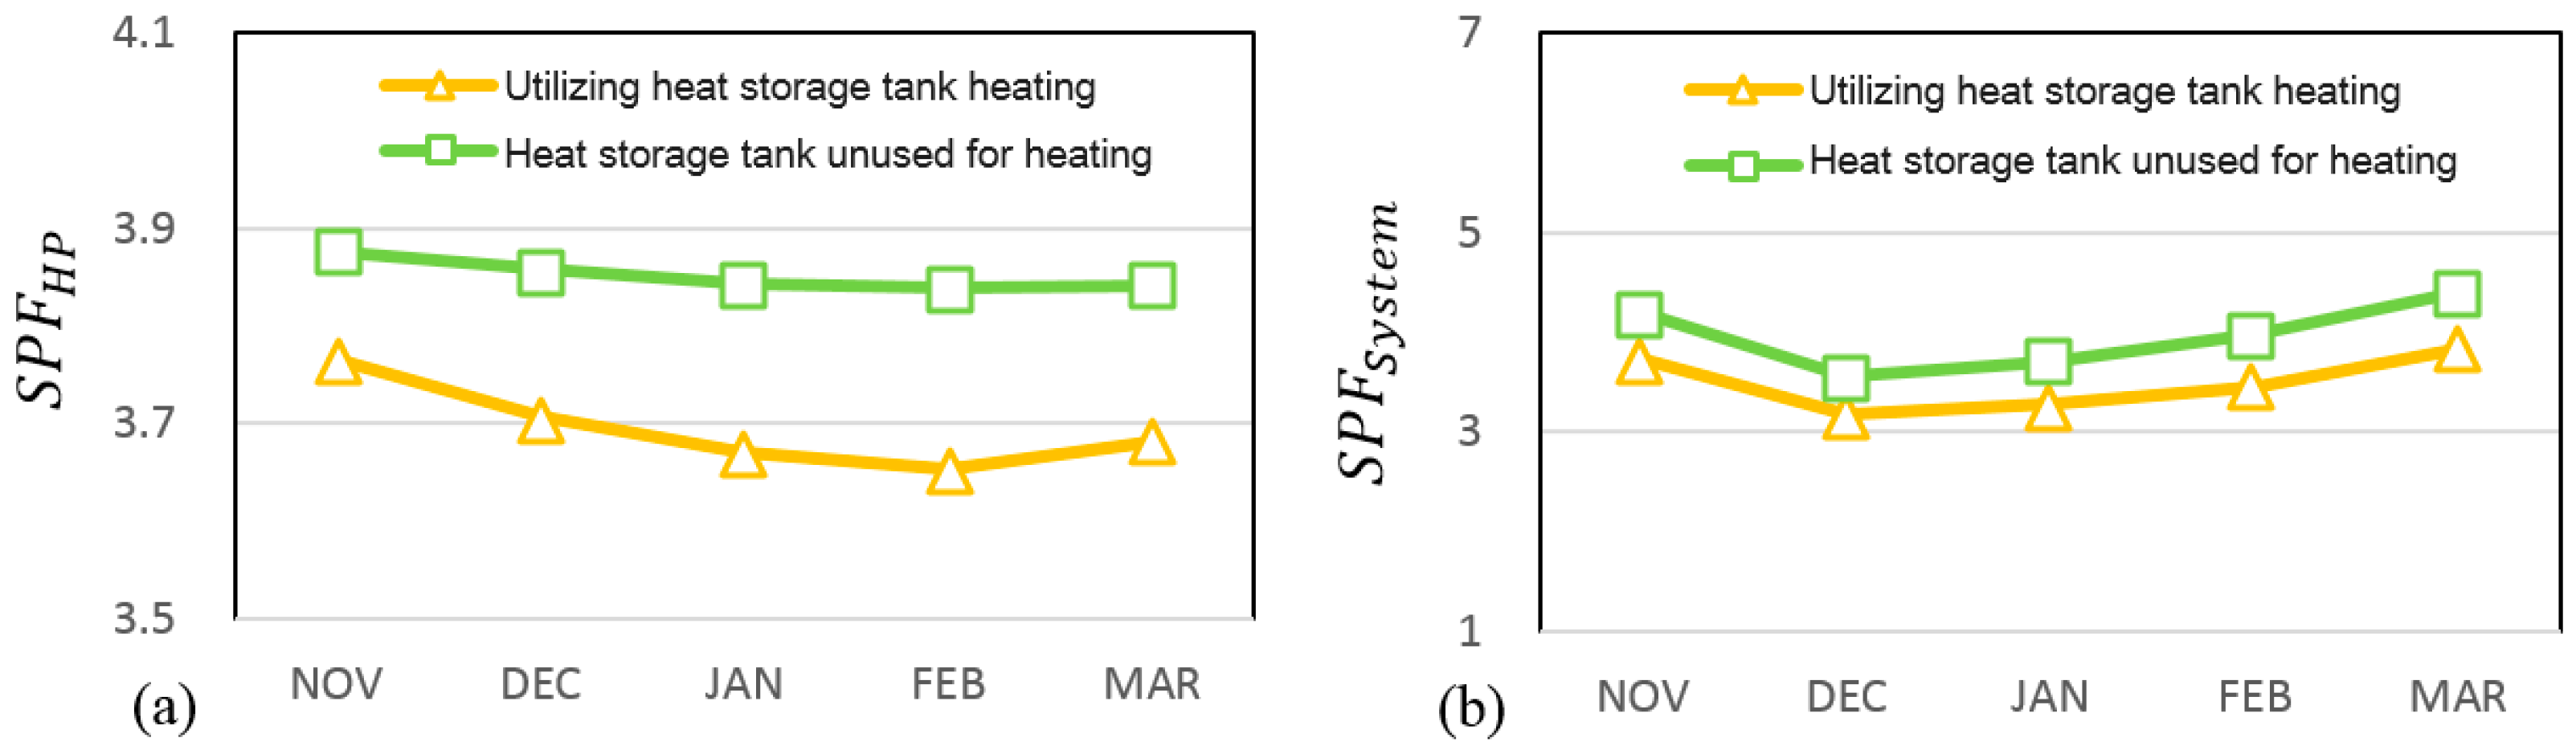
4.2. Performance Analysis According to the Presence of Storage-Tank Heating
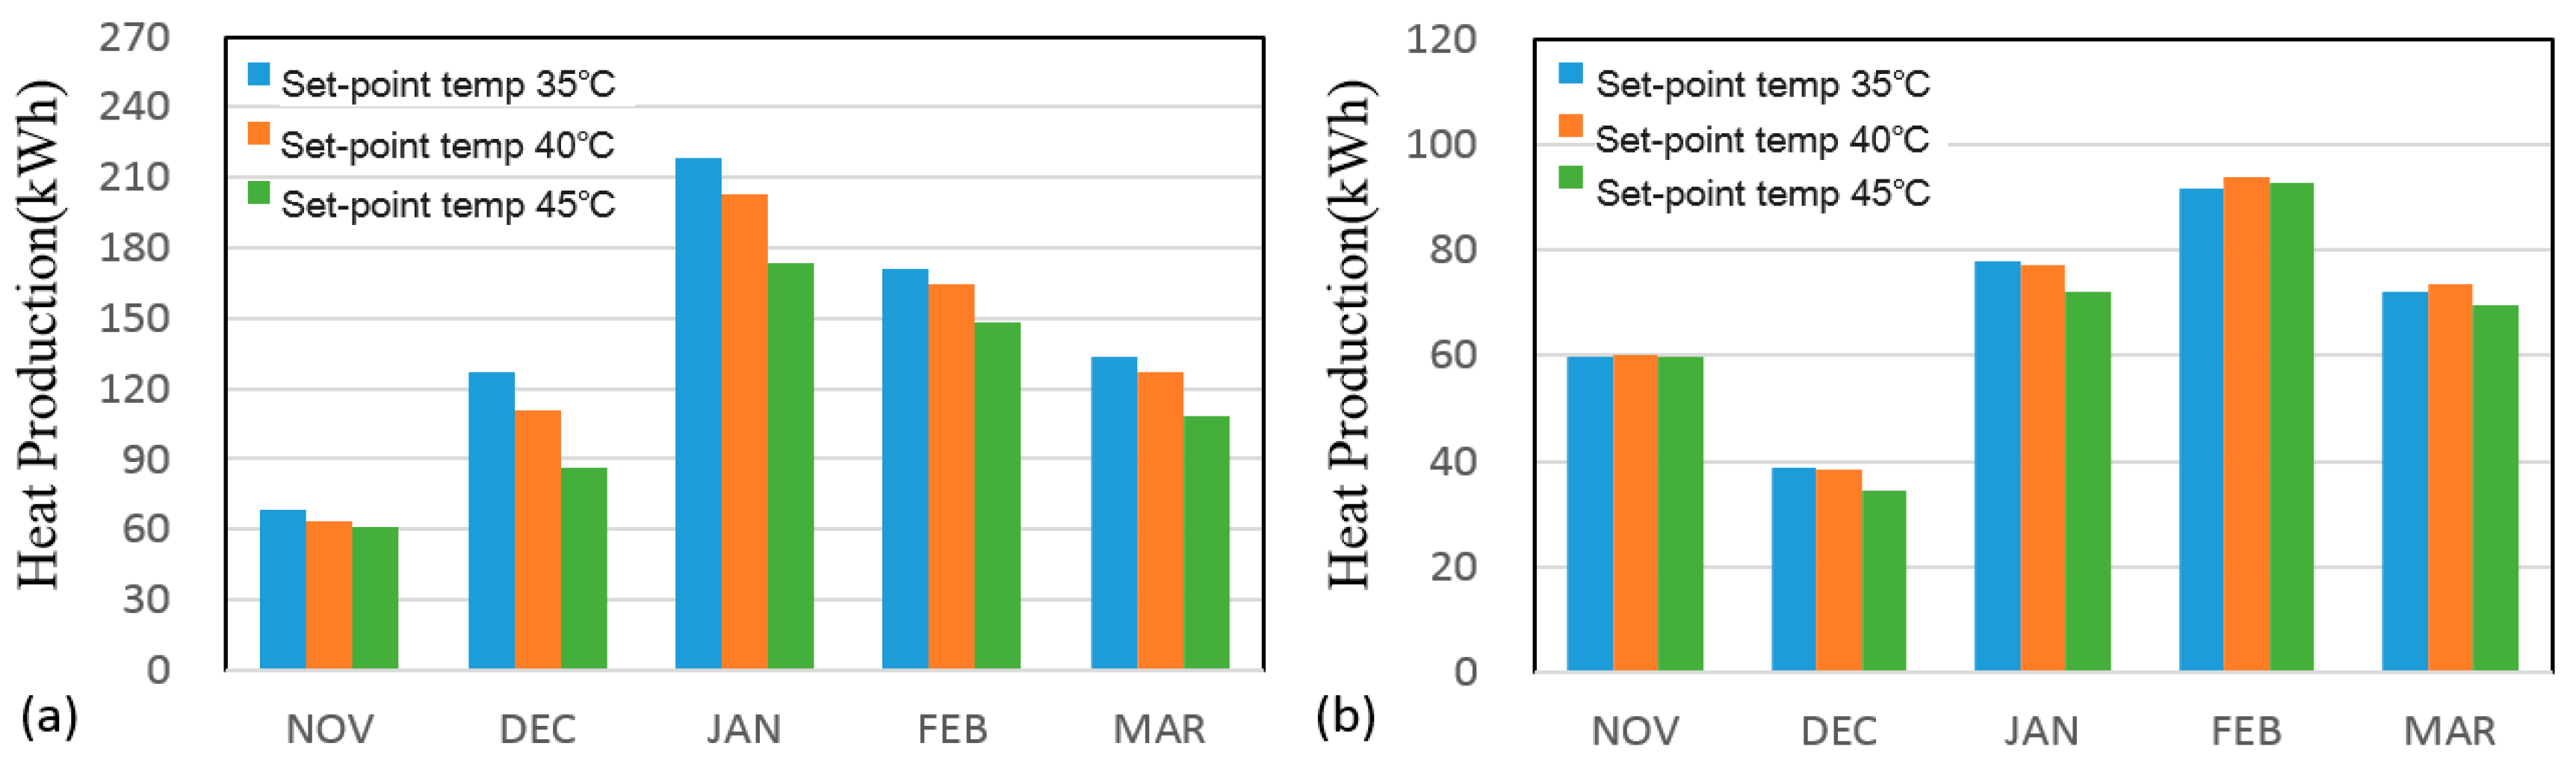
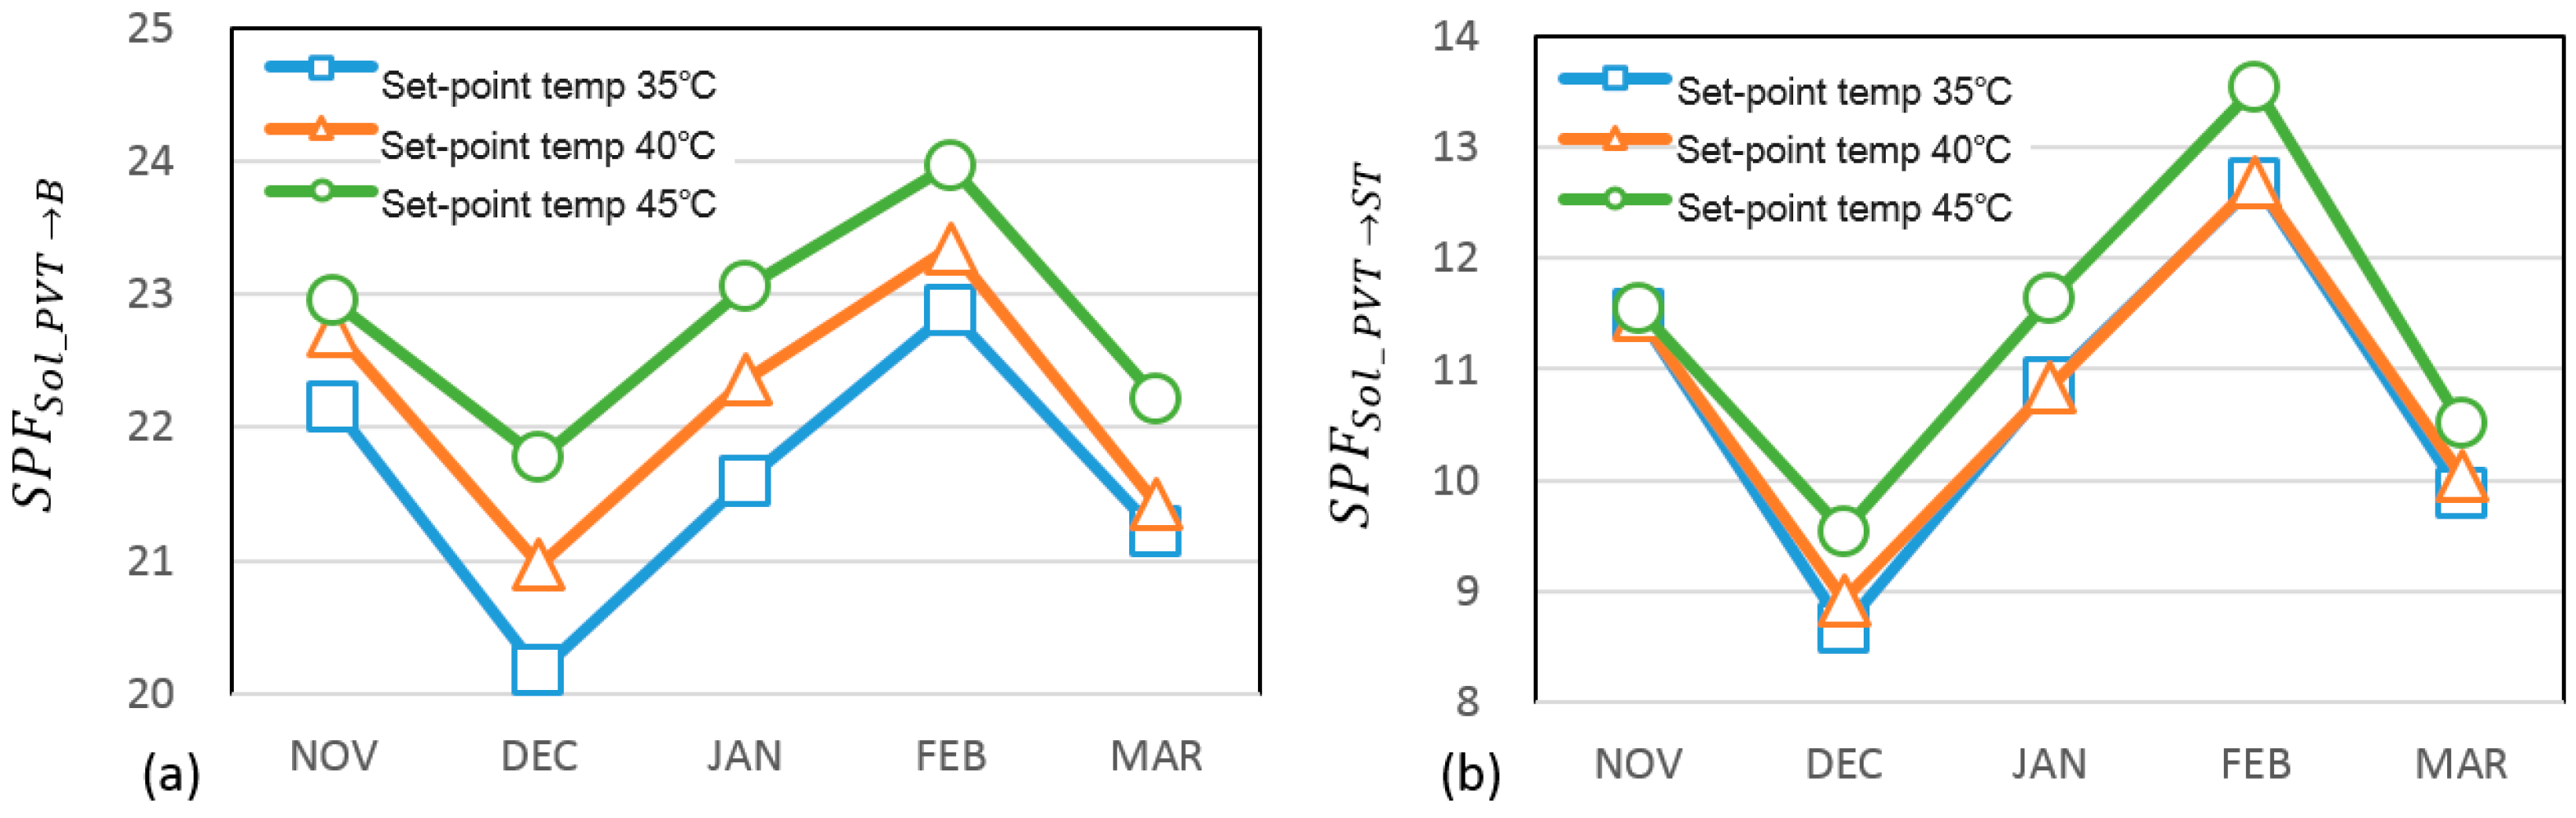
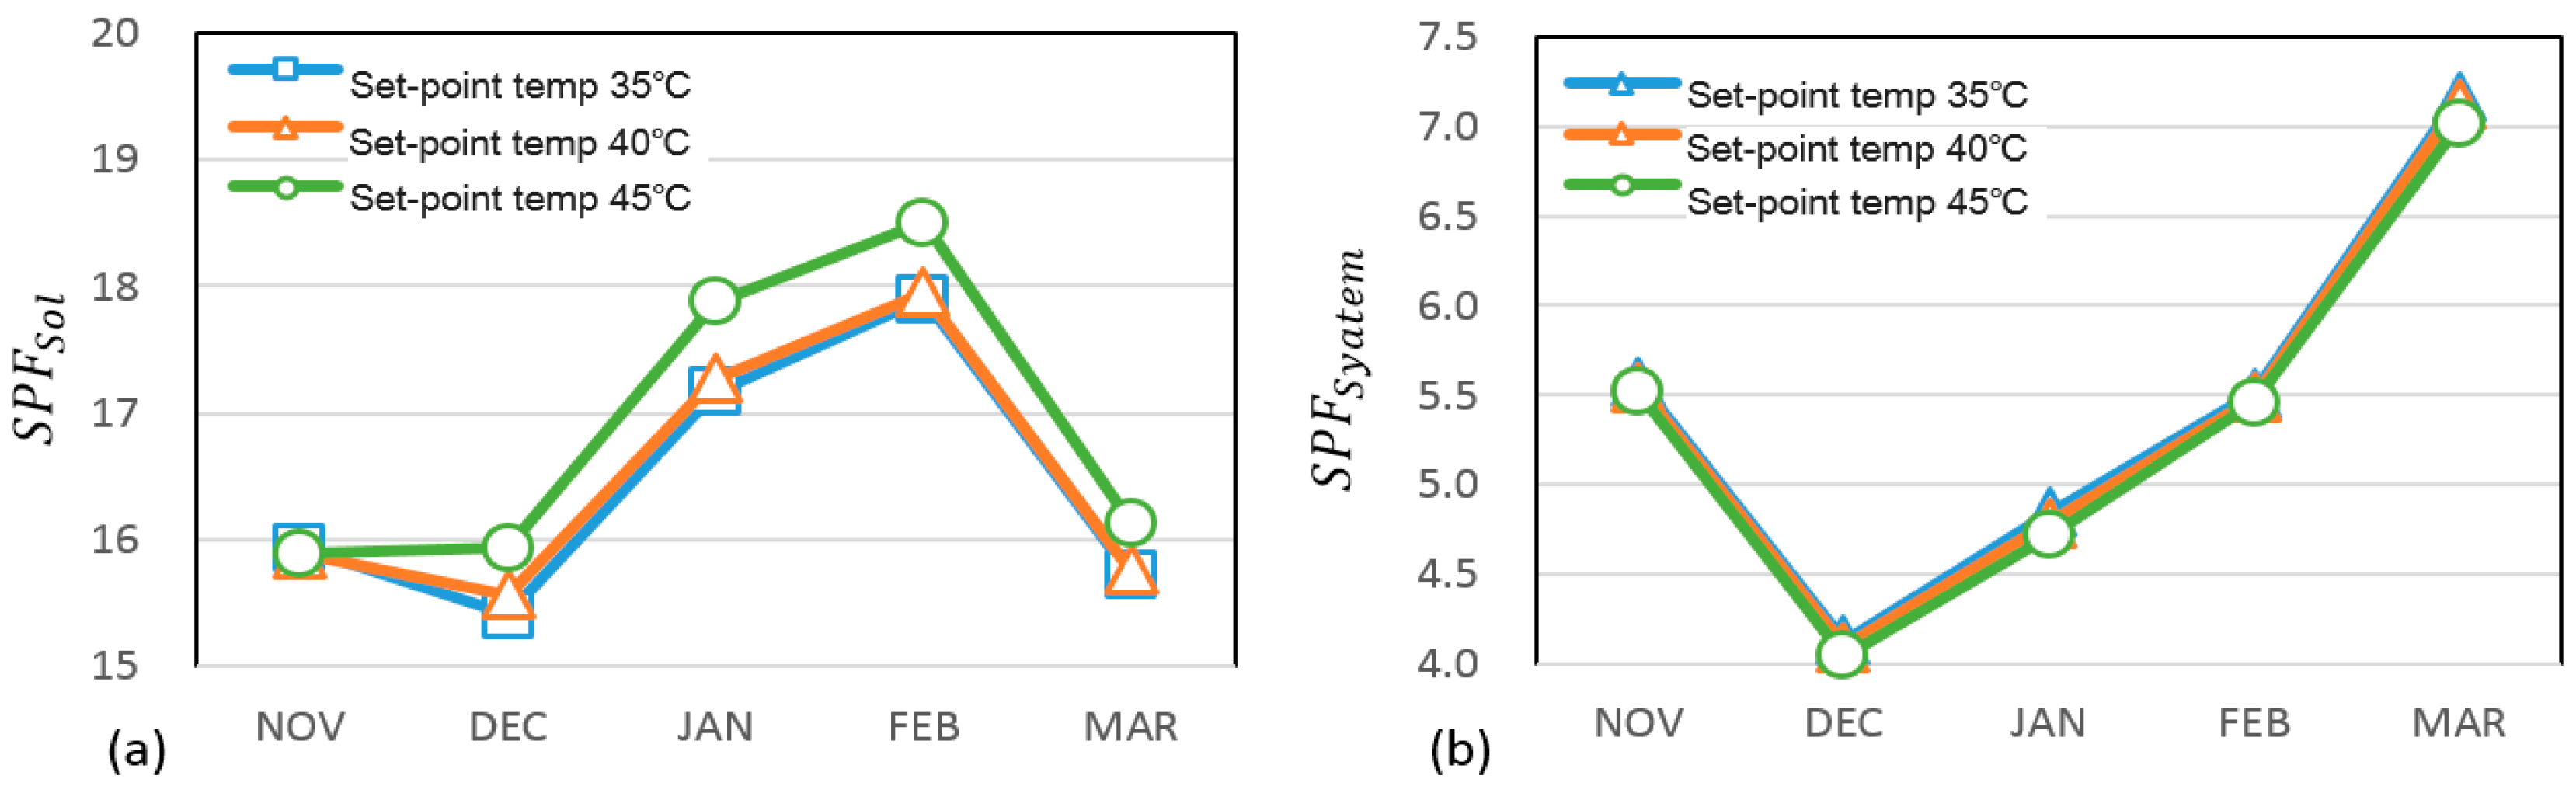
4.3. Performance Analysis According to the Set-Point Temperature of the Photovoltaic/Thermal
4.4. Performance Analysis According Operation Method of the Photovoltaic/Thermal
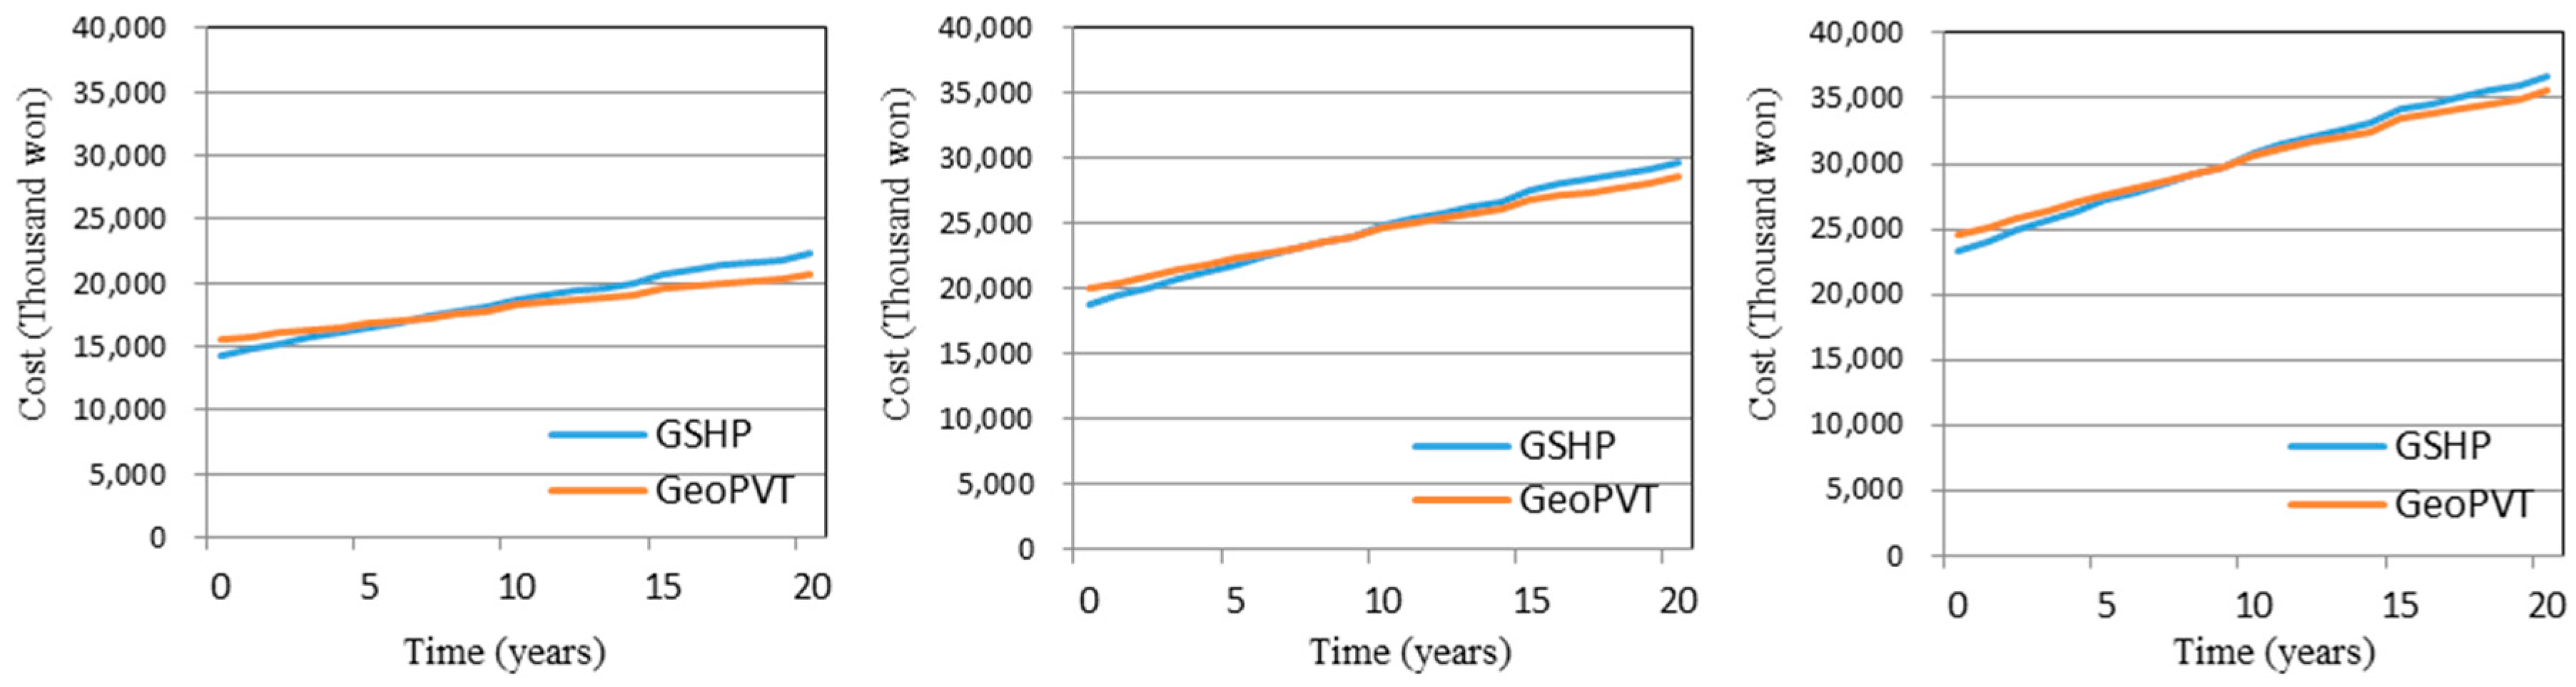
4.5. Economic Evaluation of Geo-Photovoltaic/Thermal System
5. Conclusions
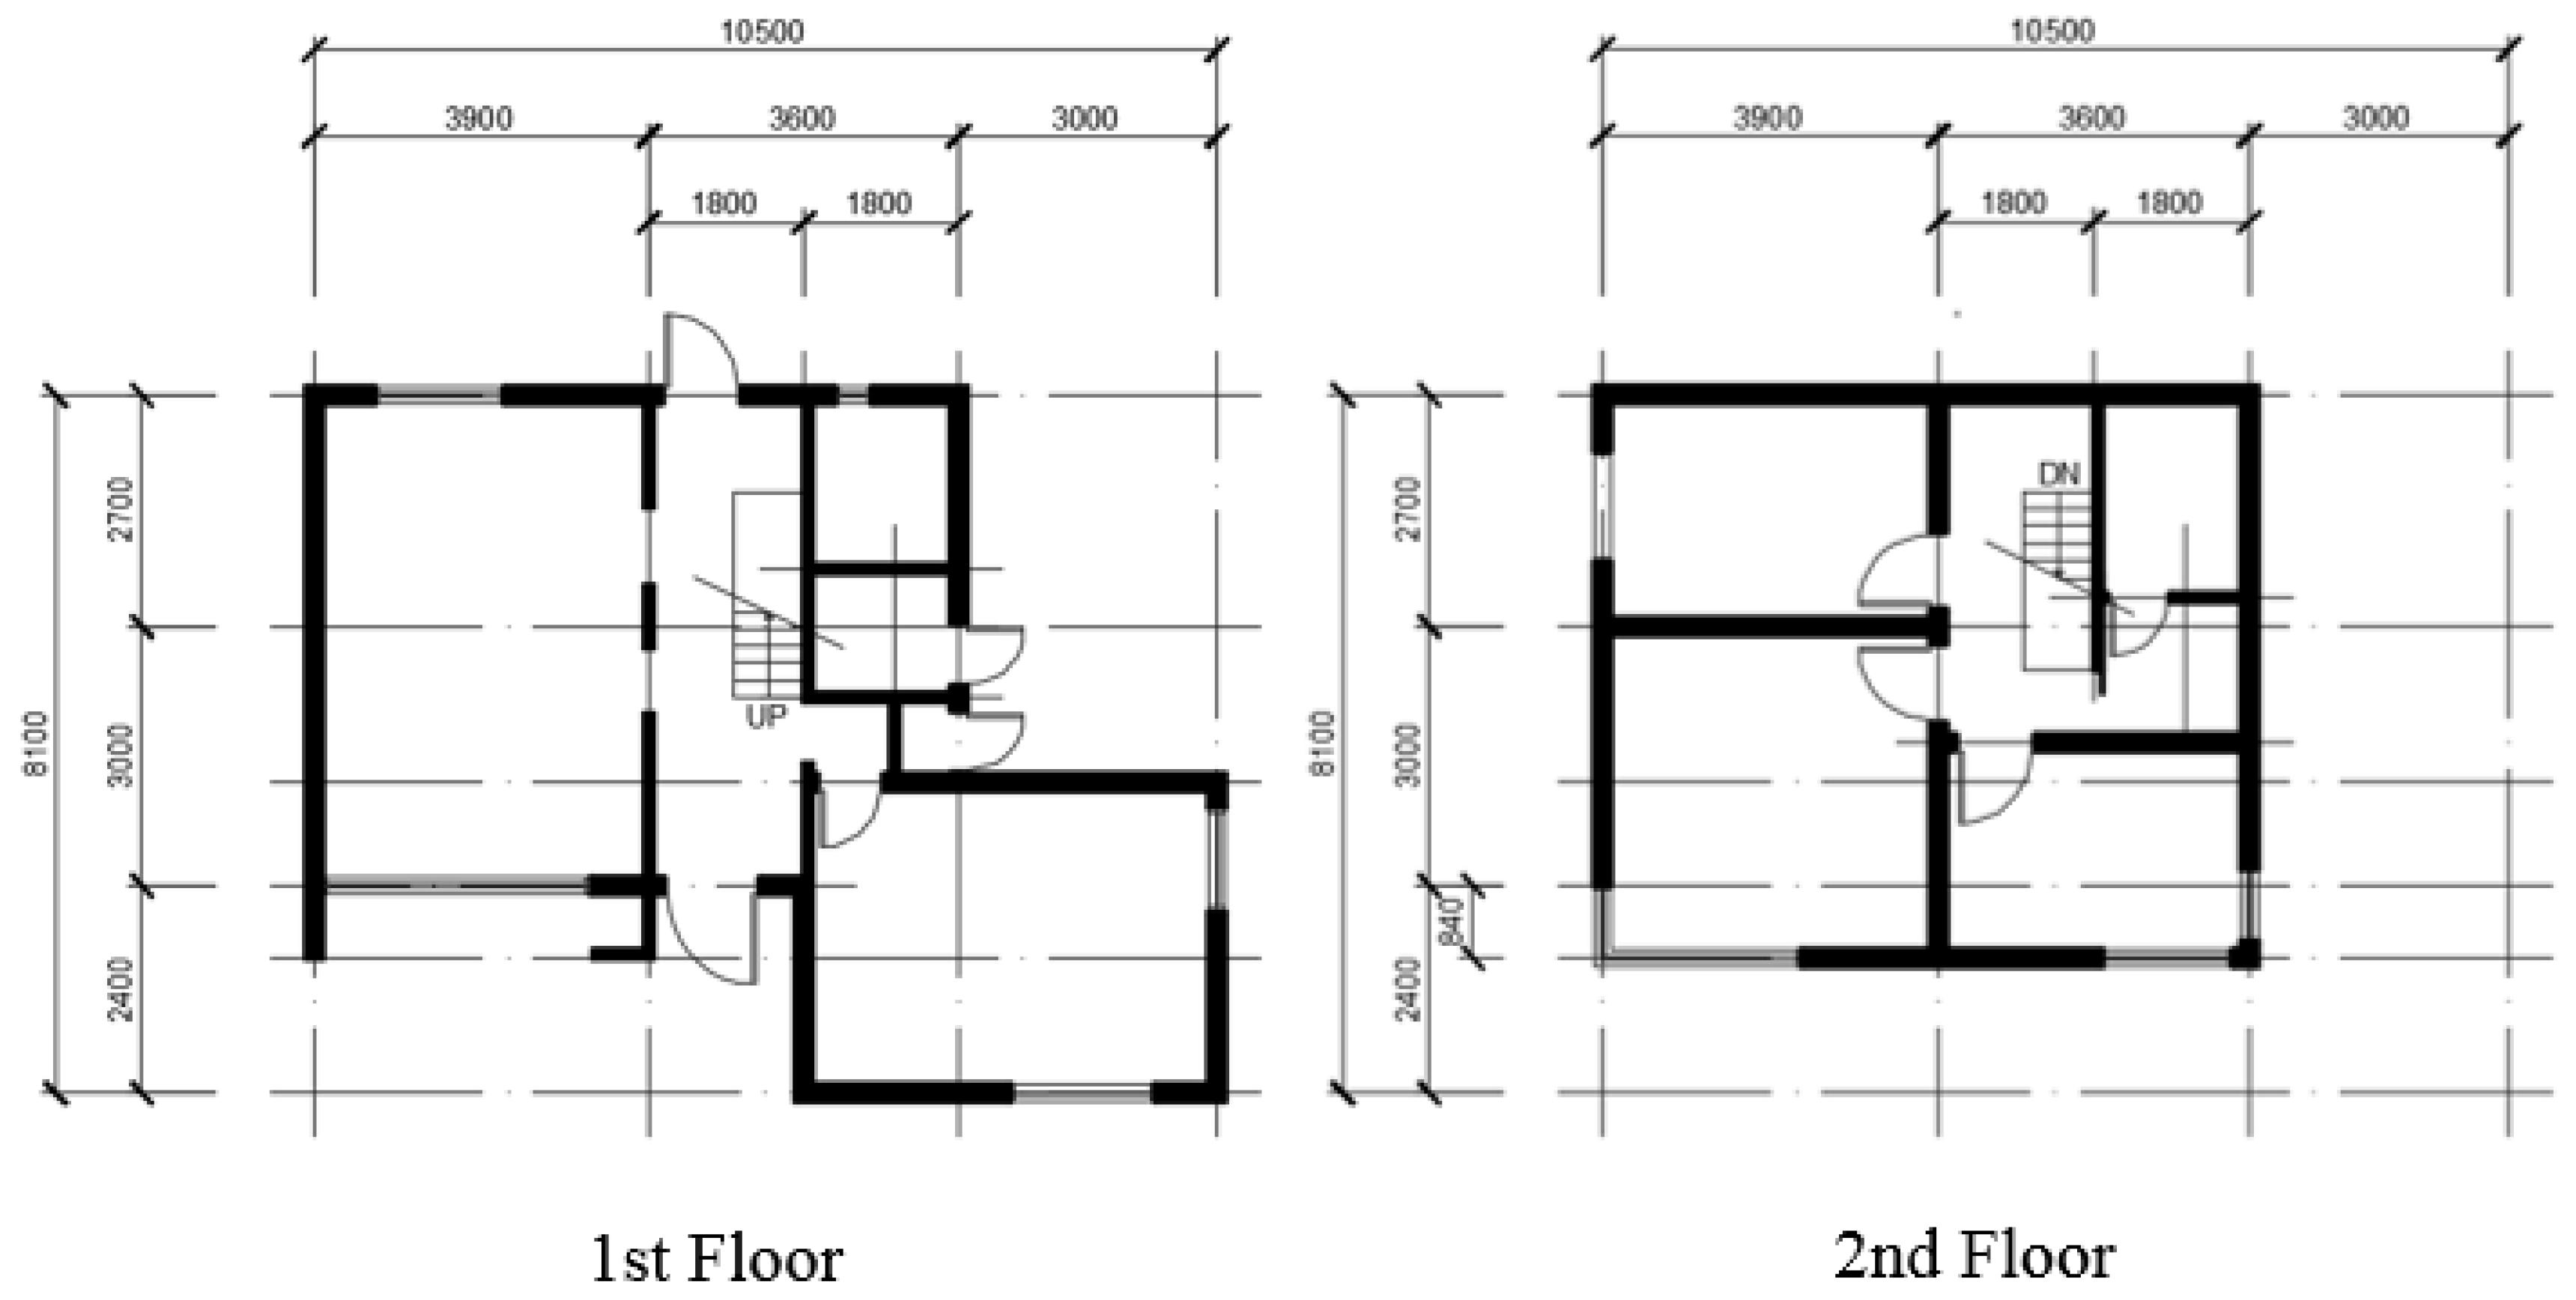
- A PVT module (1.63 m2) was assumed to have a heat capacity of 0.3 kW, so that 20 m2 of PVT system has the same capacity as 1RT (3.5 kW) of GSHP system. In this paper, a 106 m2 housing model located in Seoul, Korea was studied and the building system consists of a 10 kW GSHP (74% of the peak load), a 3.5 kW PVT system (26% of the peak load) and a 0.3 ton heat storage tank.
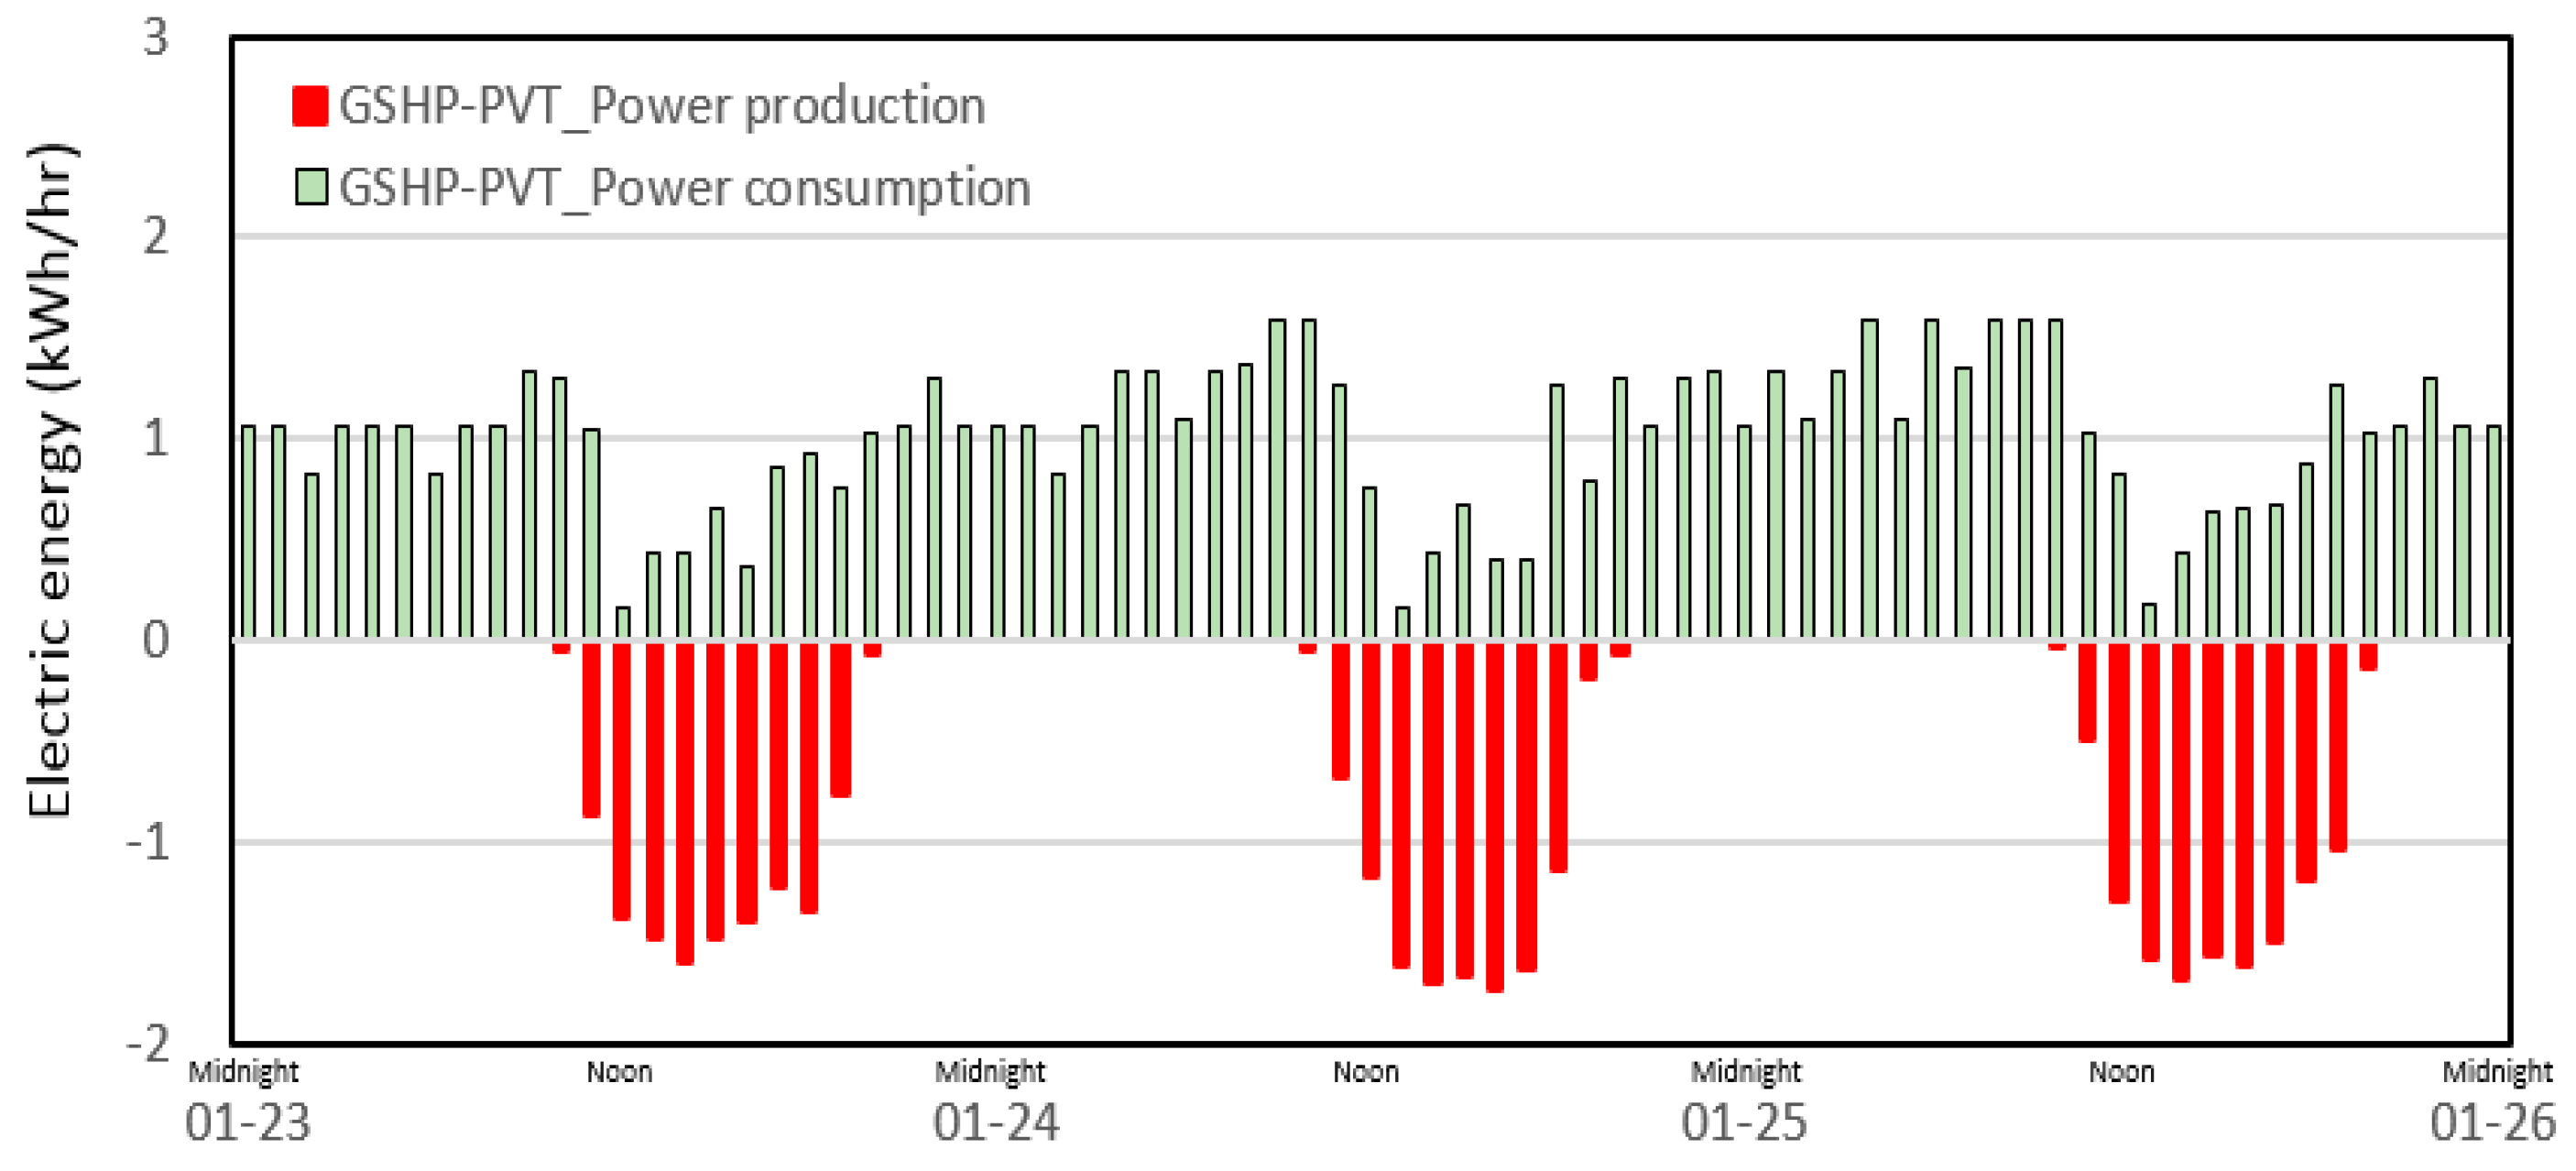
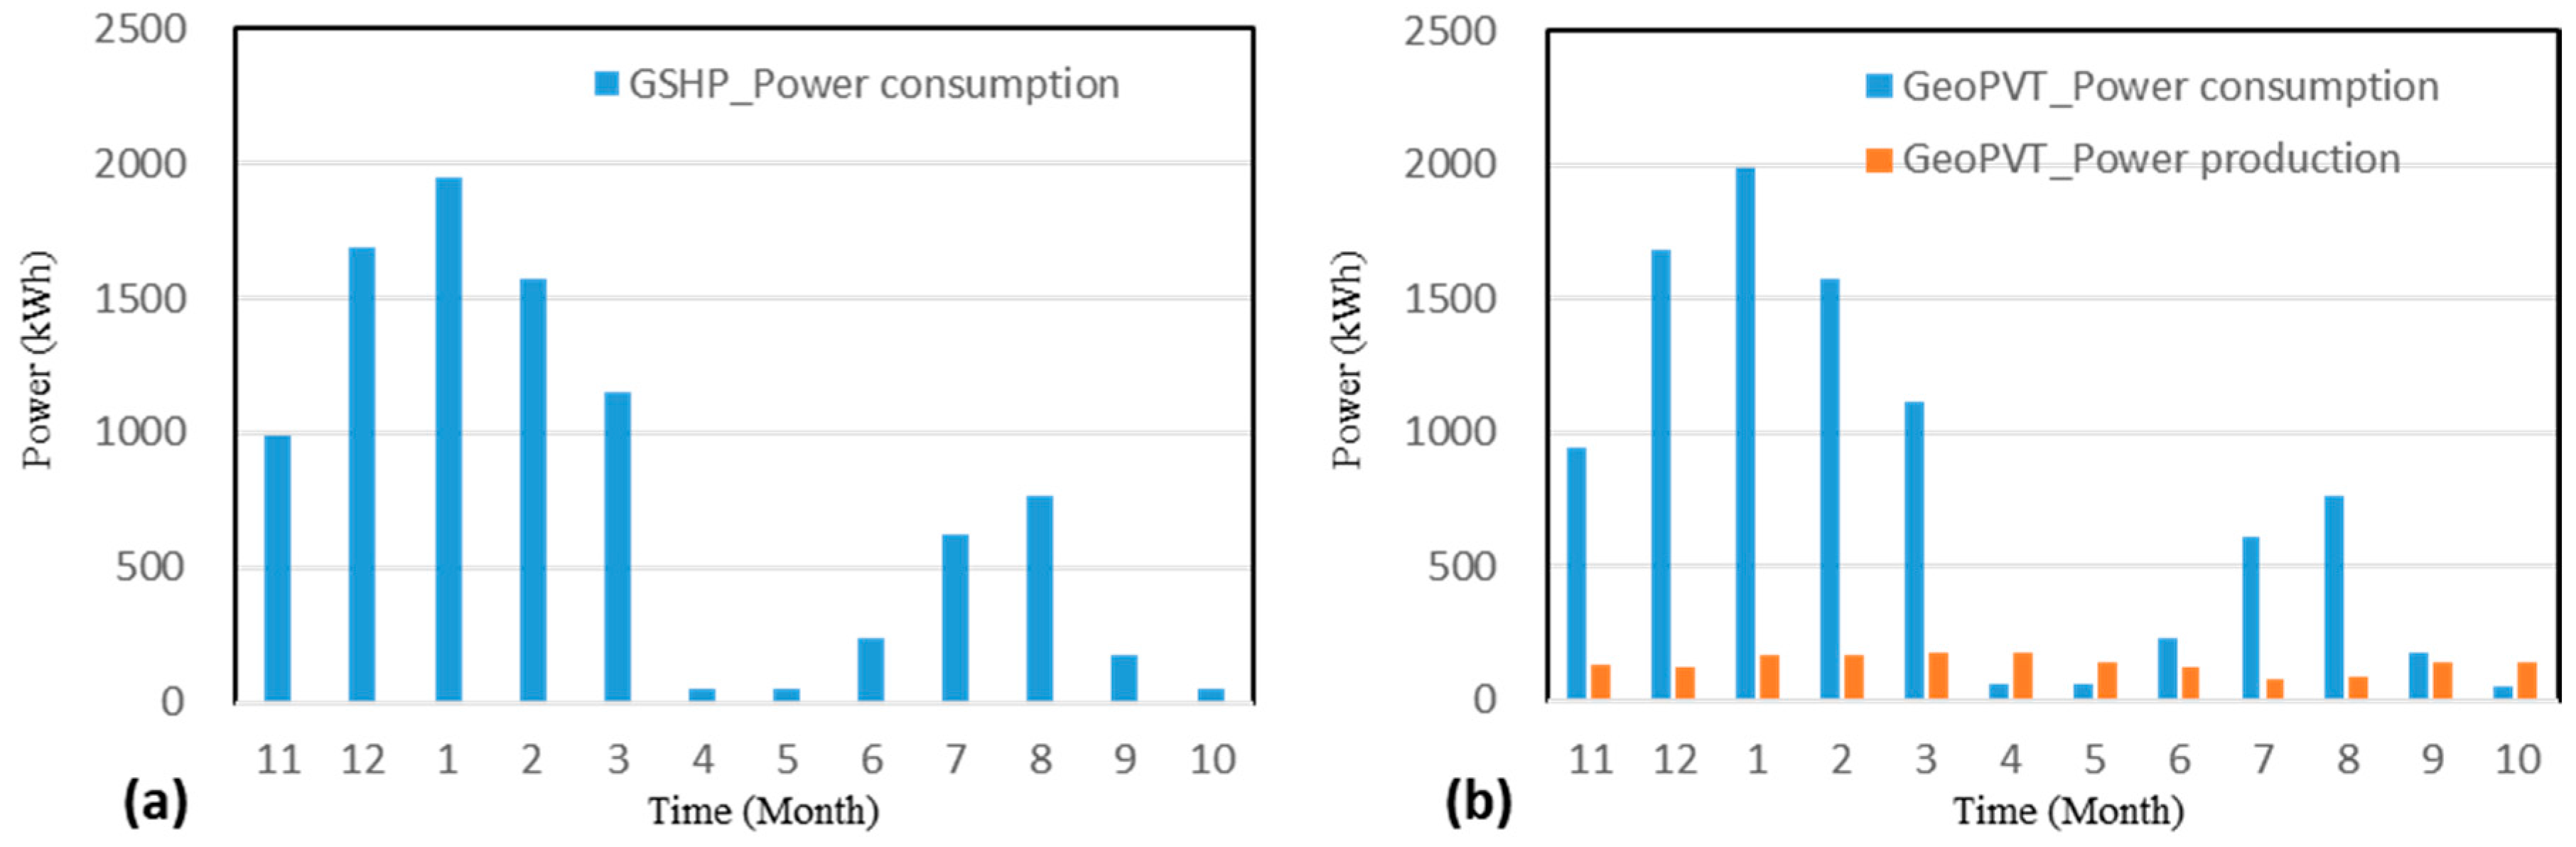
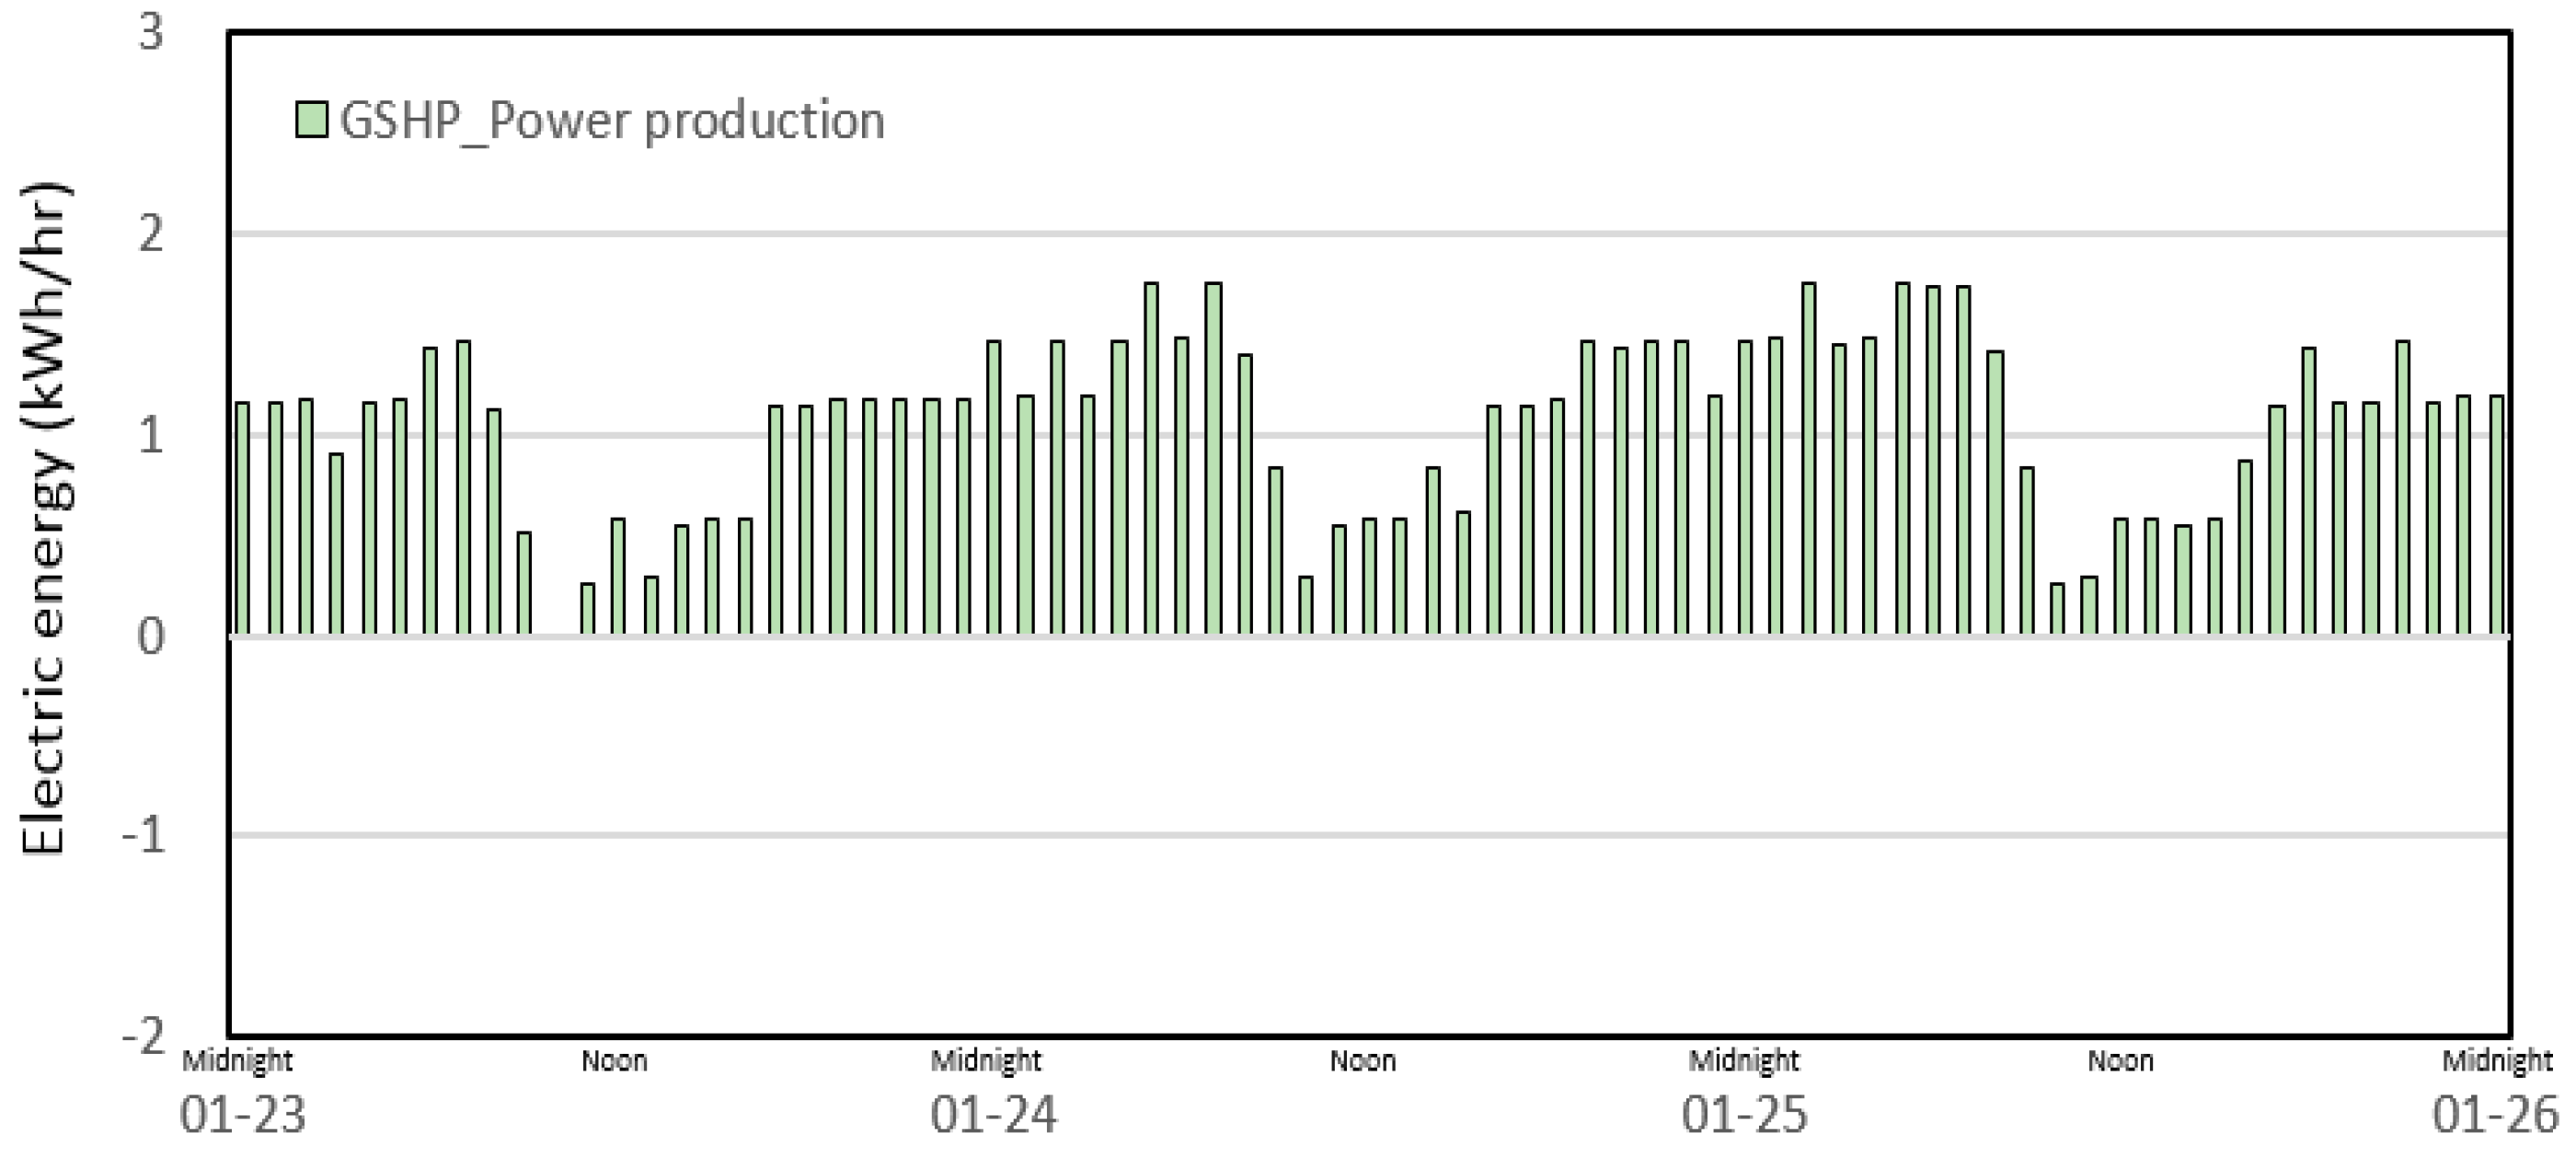
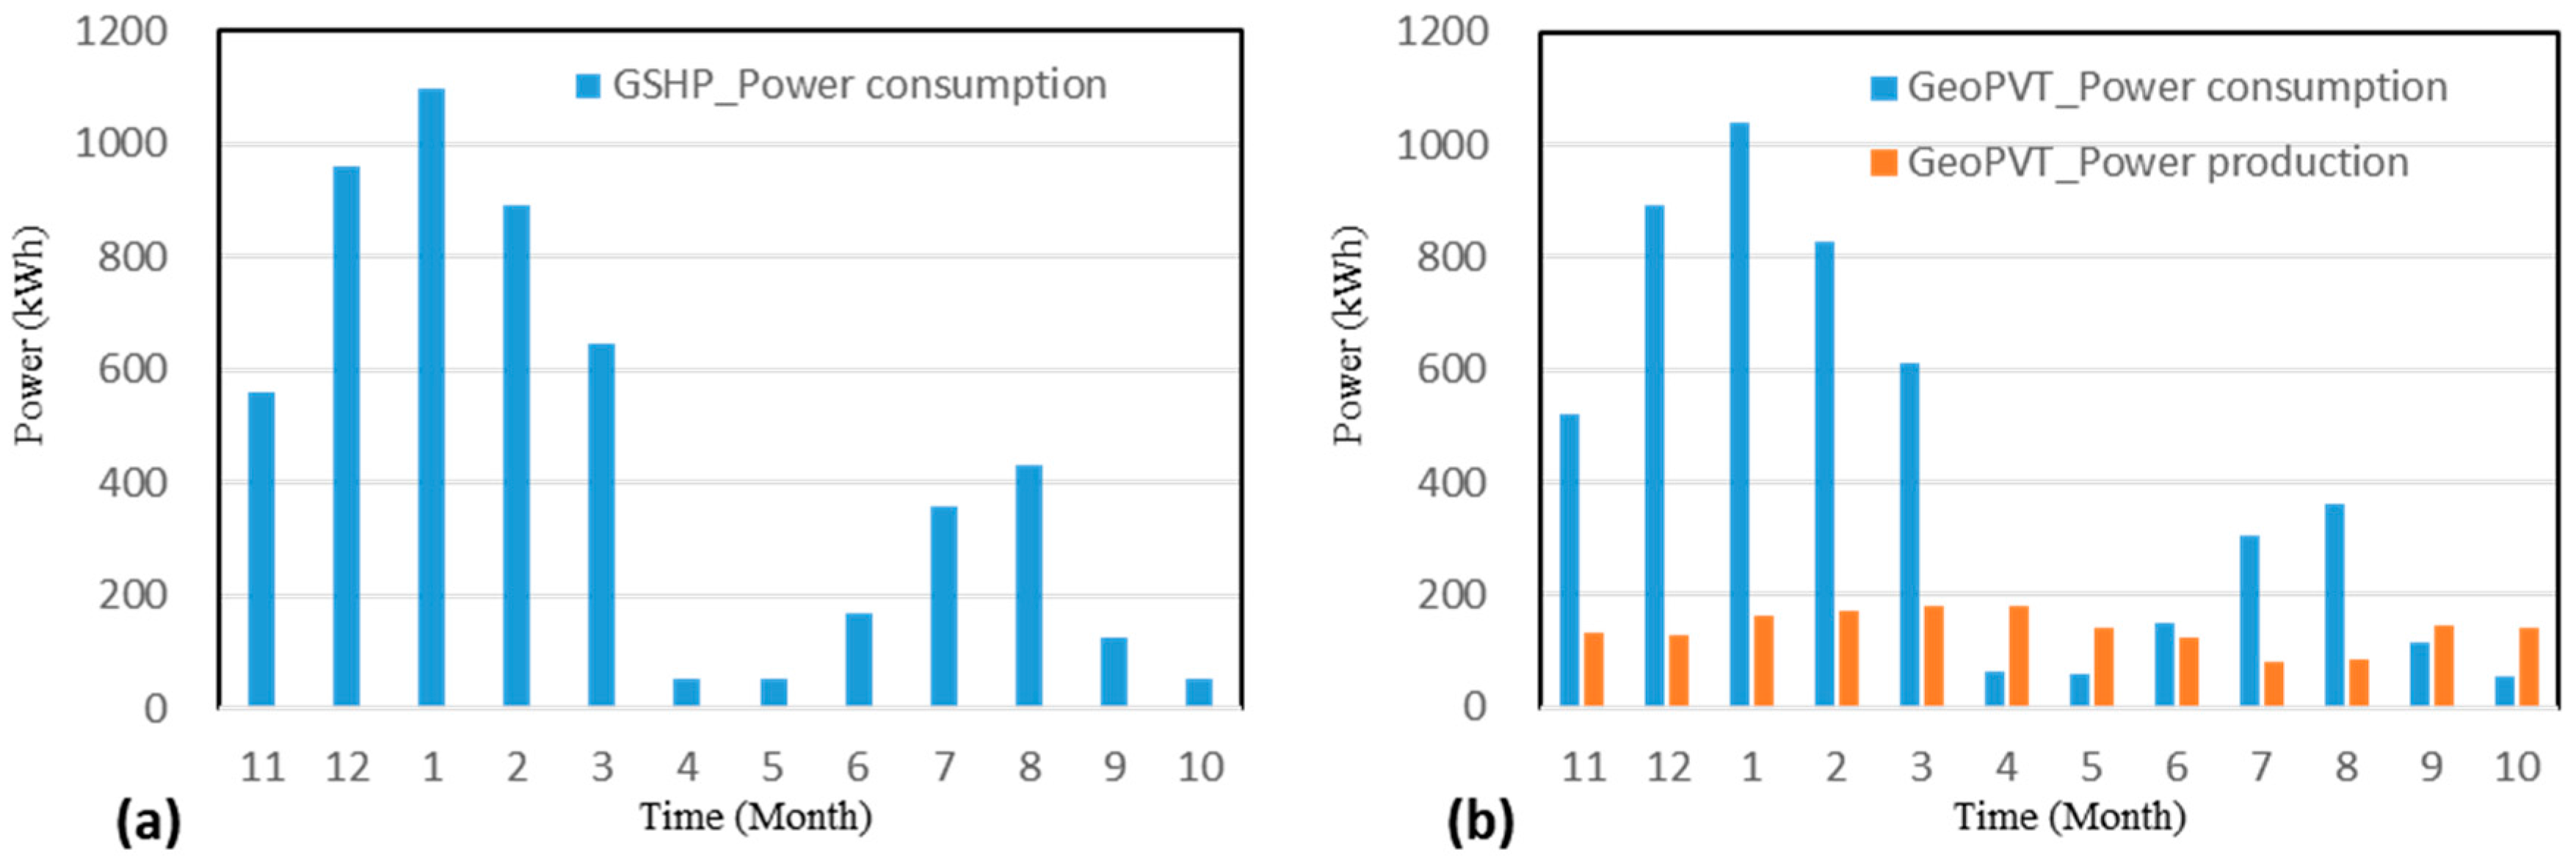
- The control logic was constructed by using the two heat sources and heat storage tanks of the hybrid system, and annual power consumption and heat quantity were analyzed through simulation analysis. As a result of 3 days of simulation, the PVT part of the hybrid system produced about 19% of total heat energy supply, reduced energy production using the GSHP system, and decreased operating time by 12%.
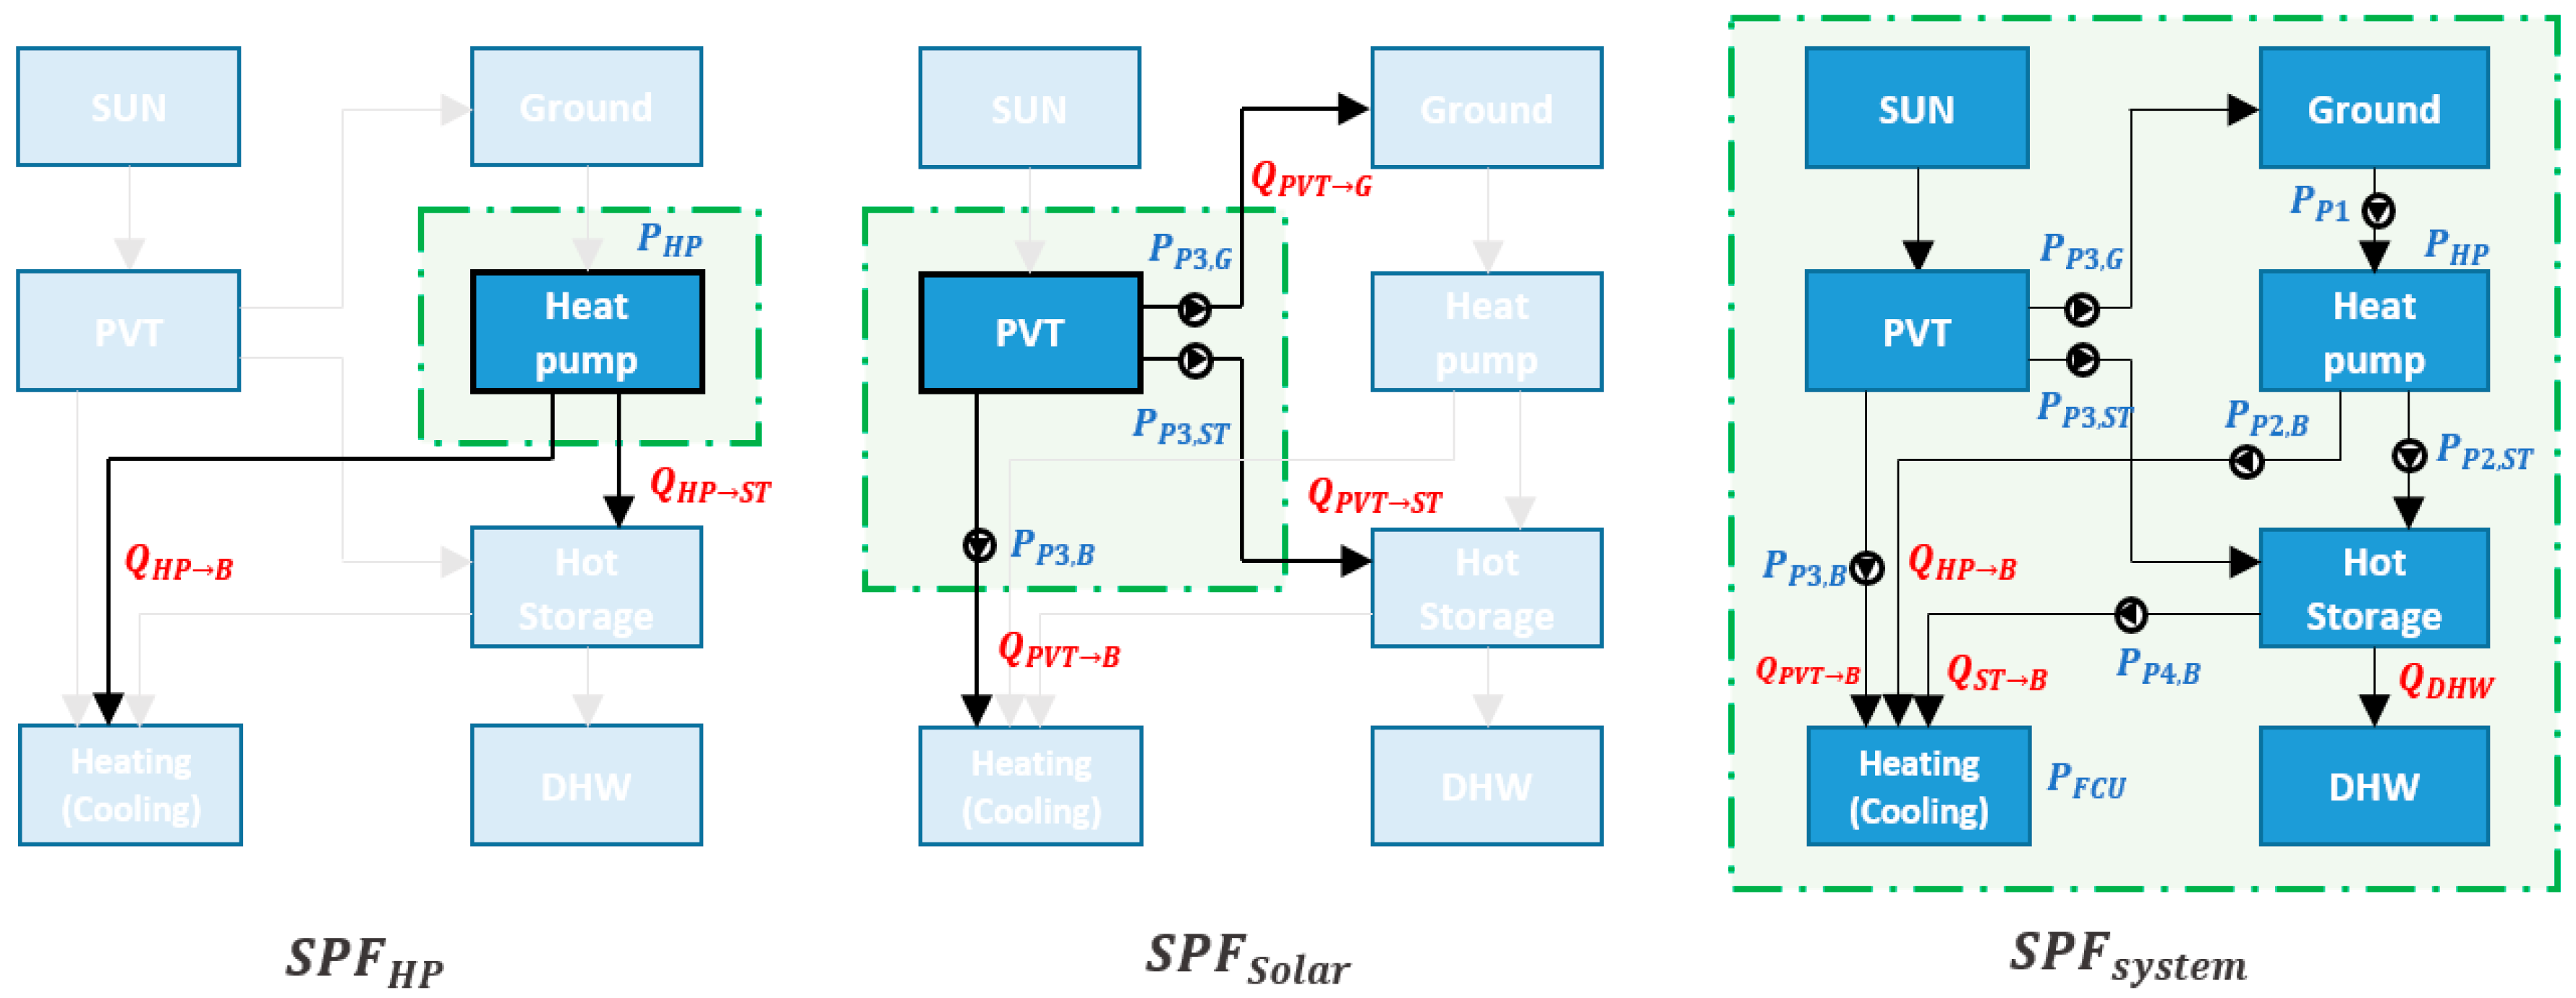
- According to the performance analysis of the hybrid system, it was confirmed that the SPFsystem was increased due to the power production of the solar photovoltaic system. The average SPFsystem during the heating period was 5.33 and increased by 102% compared with the existing system during the daytime of the building.
- The results of the performance analysis of the hybrid system according to the presence of the heat storage tank showed that SPFsystem increased when the heat storage tank was used in the daytime operation, and when it did not operate in nighttime and 24 h.
- The SPFPVT according to the set supply temperature was the highest at 5.45 at 35 °C, which was the lowest temperature of the heating set point, and the performance decreased as the set temperature increased. The SPFsystem at 40 °C and 45 °C were 5.41 and 5.35, respectively, and the performance difference according to the supply temperature was found to be 1.8%.
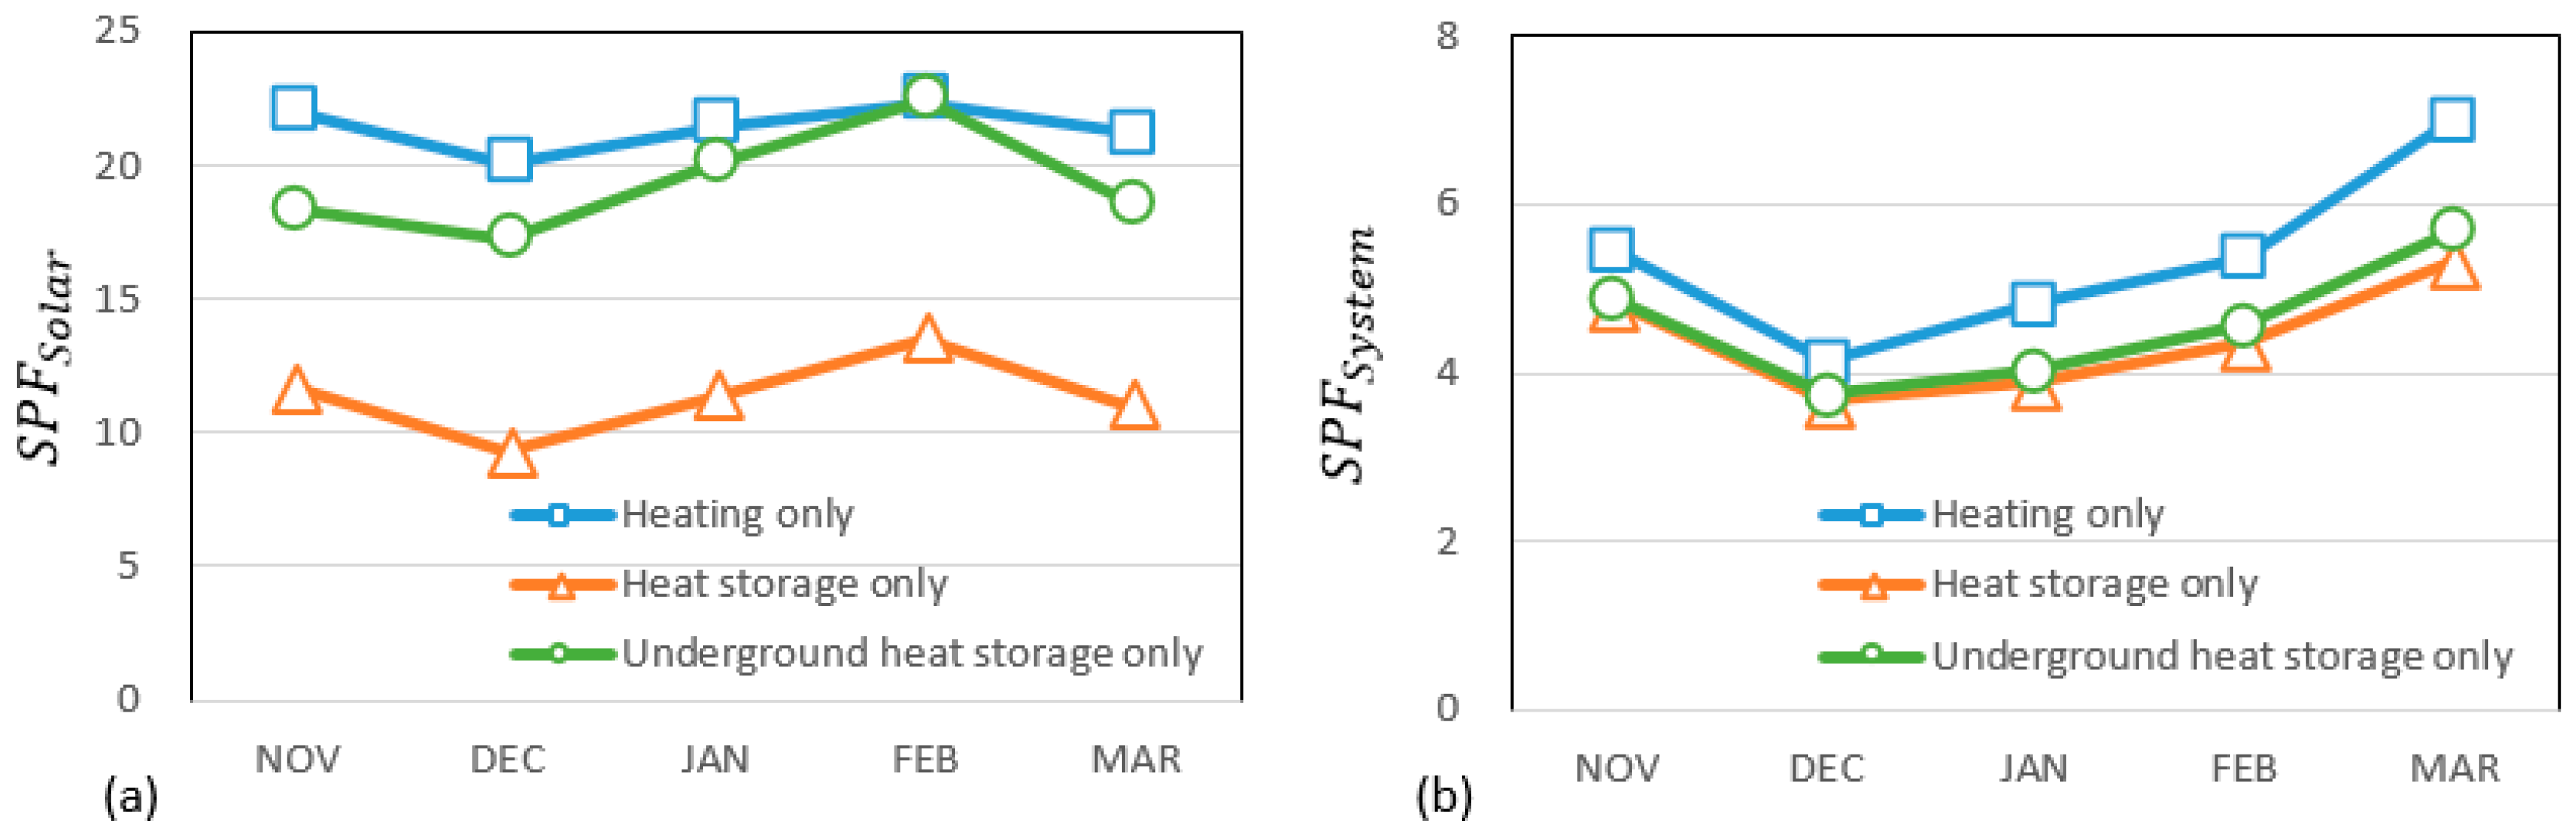
- Considering usage method of the solar heat source, the SPFsystem was the highest at 5.35 in the heating operation using solar heat. It was 4.42 under the condition that the solar heat was used for the heat storage and 4.58 in the case of the heat storage in the ground.
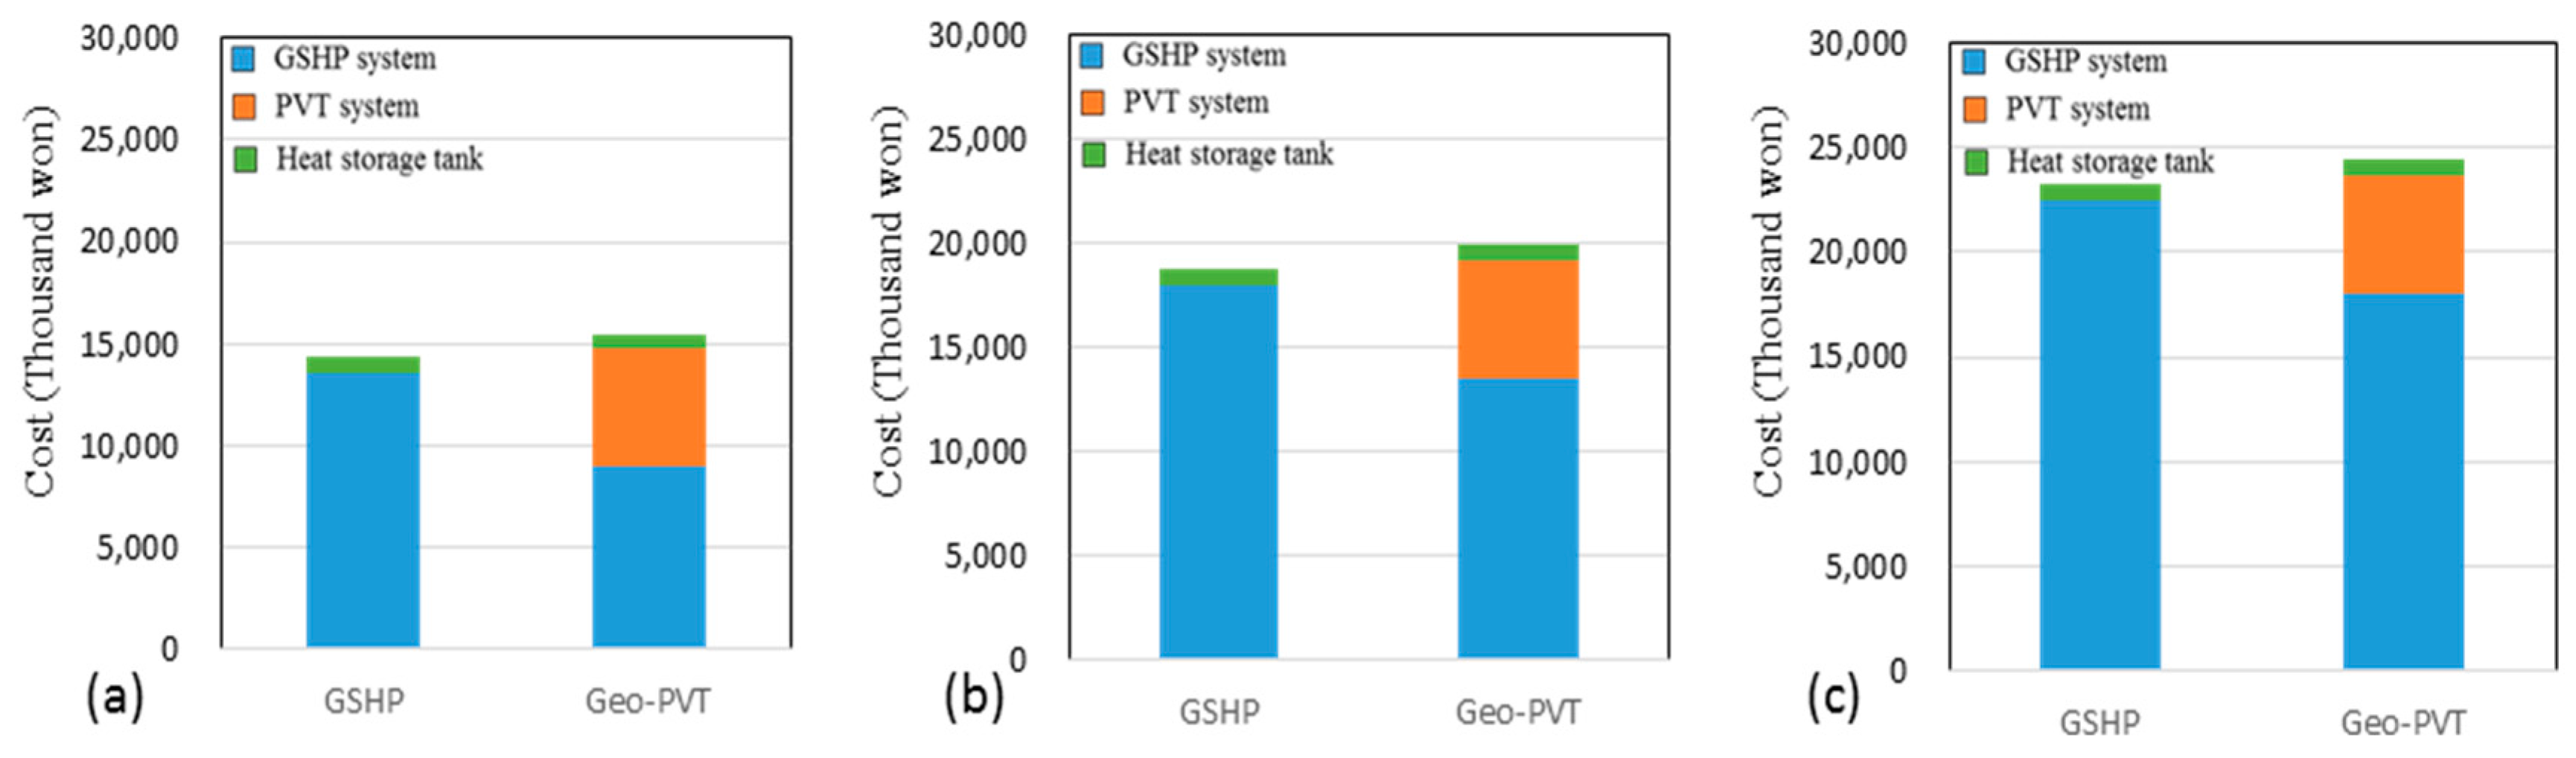
- As a result of the feasibility assessment, it was confirmed that the initial investment cost of the hybrid system was higher than that of the existing GSHP system, but the annual operating cost was reduced and the investment cost could be recovered after about 7~11 years.
Acknowledgments
Author Contributions
Conflicts of Interest
Nomenclature
Symbols
| Area | m2 | |
| Specific heat | kJ/kg °C | |
| Incidence angle modifier | - | |
| Coefficient of performance | - | |
| Heat removal factor of the collector | - | |
| Radiation | kW/m2 | |
| Heat transfer coefficient | W/m2 °C | |
| L | Pipe length | M |
| LCC | Life Cycle Cost | - |
| Mass flow rate | kg/s | |
| Power consumption | W | |
| Rated power of photovoltaic module | kW/m2 | |
| Non-recurring cost | - | |
| Recurring cost | - | |
| Rate at which energy is added to the flow stream by the collector | W | |
| reflectance | - | |
| Net absorbed solar radiation | W | |
| SPF | Seasonal performance factor | - |
| T | temperature | °C |
| I | Inflation rate | - |
| Overall loss coefficient of the collector | W/m2 °C | |
| Volume flow rate | m3/s |
Greek letters
| Tau(T) | Transmittance | - |
| Alpha(A) | Absorptance | - |
| rho(P) | Density | m3/kg |
| eta(H) | Efficiency | - |
| Beta(B) | Damping factor of ground heat exchanger | - |
Subscripts
| C | Solar collector |
| GHE | Ground heat exchanger |
| υ | Balance of a unit volume in the storage |
| b | Beam radiation |
| d | Diffue radiation |
| n | Normal incidence |
| f | Circulating fluid |
| p | Heat balance per unit length of pipe |
| L | Overall |
| PV | Photovoltaic |
| abs | Absorber plate |
| T | Total (beam + diffuse) |
| amb | ambient |
| In | Inlet |
| Out | Outlet |
| Ground | ground |
| HP→B | The heat flow from heat pump to FCU |
| HP→ST | The heat flow from heat pump to storage |
| PVT→G | The heat flow from PVT to ground |
| PVT→ST | The heat flow from PVT to storage |
| PVT→B | The heat flow from PVT to FCU |
| HP→B | The heat flow from heat pump to FCU |
| ST→B | The heat flow from storage to FCU |
References
- Gard, H.P.; Adhikari, R.S. Transient Simulation of Conventional Hybrid Photovoltaic/Thermal (PV/T) Air Heating Collector. Int. J. Energy Res. 1998, 22, 547–562. [Google Scholar]
- Takashima, T.; Tanaka, T.; Doi, T.; Kamoshida, J.; Tani, T.; Horigome, T. New proposal for photovoltaic-thermal solar energy utilization method. Sol. Energy 1994, 52, 241–245. [Google Scholar] [CrossRef]
- Arpino, F.; Cortellessa, G.; Frattolillo, A. Experimental and Numerical Assessment of Photovoltaic Collectors Performance dependence on Frame Size and Installation Technique. Sol. Energy 2015, 118, 7–19. [Google Scholar] [CrossRef]
- Badescu, V.; Landsberg, P.T.; De Vos, A. Application to Hybrid Solar Converters. J. Appl. Phys. 1997, 81, 15. [Google Scholar] [CrossRef]
- Tripanagnostopoulos, Y.; Nousia, T.; Souliotis, M.; Yianoulis, P. Hybrid Photovoltaic/Thermal Solar Systems. Sol. Energy 2002, 72, 217–234. [Google Scholar] [CrossRef]
- Mohsen, M.S.; Al-Ghandoor, A.; Al-Hinti, I. Thermal Analysis of Compact Solar Water Heater under Local Climatic Conditions; Elsevier Science B.V.: Amsterdam, The Netherlands, 2009; Volume 36, pp. 962–968. [Google Scholar]
- Wang, H.; Qi, C. Performance Study of Underground Thermal Storage in a Solar-Ground Coupled Heat Pump System for Residential Buildings. Energy Build. 2008, 40, 1278–1286. [Google Scholar] [CrossRef]
- Wang, X.; Zheng, M.; Zang, W.; Zhang, S.; Yang, T. Experimental Study of a Solar-Assisted Ground-Coupled Heat Pump System with Solar Seasonal Thermal Storage in Severe Cold Areas. Energy Build. 2010, 42, 2104–2110. [Google Scholar] [CrossRef]
- Ozgener, O. Use of Solar Assisted Geothermal Heat Pump and Small Wind Turbine Systems for Heating Agricultural and Residential Buildings. Energy 2010, 35, 262–268. [Google Scholar] [CrossRef]
- Chen, X.; Yang, H. Performance Analysis of a Proposed Solar Assisted Ground Coupled Heat Pump System. Appl. Energy 2012, 97, 888–896. [Google Scholar] [CrossRef]
- Wang, E.; Fung, A.S.; Qi, C.; Leong, W.H. Performance prediction of a hybrid solar ground-source heat pump system. Energy Build. 2012, 47, 600–611. [Google Scholar] [CrossRef]
- Yang, W.; Sun, L.; Chen, Y. Experimental Investigations of the Performance of a Solar-ground Source Heat pump system operated in heating modes. Energy Build. 2015, 89, 97–111. [Google Scholar] [CrossRef]
- Hadorn, J.-C. IEA Solar and Heat Pump Systems Solar Heating and Cooling Task 44 & Heat Pump Program Annex 38. Energy Procedia 2012, 30, 125–133. [Google Scholar]
- Solar Heating & Cooling Program International Energy Agency. Available online: www.iea-shc.org/task44 (accessed on 20 August 2017).
- The Society of Air-Conditioning and Refrigerating Engineers of Korea. Equipment Engineering Manual; SAREK: Seoul, Korea, 2011; ISBN 9788995228289. [Google Scholar]
- HellstrÄom, G. Duct Ground Heat Storage Model Manual for Computer Code; Department of Mathematical Physics, University of Lund: Lund, Sweden, 1989. [Google Scholar]
- Duffie, J.A.; Beckman, W.A. Solar Engineering of Thermal Processes, 4th ed.; John Wiley & Sons, Inc.: Hoboken, NJ, USA, 2013. [Google Scholar]
- Yu, M.G.; Nam, Y.; Yu, Y.; Seo, J. Study on the System Design of a Solar Assisted Ground Heat Pump System Using Dynamic Simulation. Energies 2016, 9, 291. [Google Scholar] [CrossRef]
- Public Procurement Service in Korea, National Market Shopping Mall. Available online: http://shopping.g2b.go.kr/ (accessed on 20 August 2017).
- Korea Energy Agency, Renewable Energy Center. Available online: http://www.knrec.or.kr/knrec/13/KNREC130110.asp?idx=1239 (accessed on 20 August 2017).
- Beginning Farmers Center. Available online: http://www.returnfarm.com/web/rf/house/BD_list.do (accessed on 20 August 2017).
- Korea Energy Agency. Available online: www.kemco.or.kr/web/kem_home_new/new_main.asp (accessed on 20 August 2017).
- The Society of Air-conditioning and Refrigerating Engineers of Korea. Society of Air-Conditioning and Refrigerating Engineers of Korea; SAREK: Seoul, Korea, 2011; ISBM 978-89-952282-9-6. [Google Scholar]
- Jeong, Y.-D.; Nam, Y. Performance Test of PVT-water System Considering Ambient Air and Circulating Water Temperature. KIEAE J. 2015, 15, 83–88. [Google Scholar] [CrossRef]
- Kim, S.-M.; Chung, K.-S.; Kim, Y.-I. An Empirical Study of Hot Water Supply Patterns and Peak Time in Apartment Housing with District Heating System. J. Energy Eng. 2012, 21, 435–443. [Google Scholar] [CrossRef]


| Contents | Value | Units | |
|---|---|---|---|
| Location | Seoul, Korea | ||
| Simulation time | November–October | Month | |
| Simulation time step | 5 | Minutes | |
| Design temperature | Heating 22, Cooling 26 | °C | |
| Operation Time | 08:00~20:00/20:00~08:00 | Hour | |
| Ventilation | 1/h | ||
| Building model | Affordable Housing Model ‘N-14-27’ | ||
| Total floor area | 106 | m2 | |
| Heat transmittance | Roof | 0.269 | 0.269 W/m2 K |
| Floor | 0.405 | 0.405 W/m2 K | |
| External wall | 0.269 | 0.269 W/m2 K | |
| Windows | 2.1 | 2.1 W/m2 K | |
| Component | Description | Value |
|---|---|---|
| Heat pump | Capacity | 10 kW (water to water type) |
| Flow rate | 0.42 kg/s (Load side) | |
| 0.5 kg/s (Source side) | ||
| Ground heat exchanger | Type | Closed type single U-tube |
| Borehole depth | 150 m | |
| Number of boreholes | 1 | |
| Borehole radius | 0.1 m | |
| PVT Module | Module Type | Unglazed water type |
| Collector width x length (Area) | 4.92 m × 3.96 m (19.5 m2) | |
| PV efficiency | 15.33% | |
| Orientation/Slope | South/45° | |
| Heat storage tank | Tank volume | 0.3 m3 |
| Heat loss coefficient | 0.694 W/m2 K | |
| Fan coil unit | Rated total cooling/heating capacity | 12 kW |
| Rated volumetric air flow rate | 0.3 m3/s | |
| Power consumption | 0.15 kW | |
| Circulation Pump1 (Heat pump source side) | Flow rate | 0.5 kg/s |
| Power consumption | 0.25 kW | |
| Circulation Pump2 (Heat pump load side) | Flow rate | 0.42 kg/s |
| Power consumption | 0.22 kW | |
| Circulation Pump3 (PVT module circulation) | Flow rate | 0.42 kg/s |
| Power consumption | 0.22 kW | |
| Circulation Pump4 (ST—FCU circulation) | Flow rate | 0.42 kg/s |
| Power consumption | 0.25 kW | |
| Soil Conditions | Storage thermal conductivity | 3.5 W/m2 K |
| Storage heat capacity | 2520 kJ/m3 K |
| Equipment | Comments | Item |
|---|---|---|
| Solar simulator | Wave range 400~100 nm | - |
| Measurement accuracy 2% 2 digit 0.4 digit/°C | ||
| Temp & Humid Chamber | Temperature range −40 °C 150 °C Uniformity ±1 °C | ALSEC 4100 |
| Humidity range 20~98% RH Uniformity ± 3.0% RH | ||
| Light source | Continues Type, Uniformity : Class B | Metal halide lamp |
| I-V test system | 1000 Volts; 3 ranges 1000 V, 100 V, 10 V/100 Amperes; 3 ranges 100 A, 10 A, 1 A | DS-100c I-V Curve tracer |
| Data logger | 20 ch, Expandable up to 200 ch by unit of 20 ch | GL820 Data logger |
| Electrical Characteristics | Value | Units |
|---|---|---|
| STC Nominal maximum output power | 250 | W |
| Open circuit voltage | 36.78 | V |
| Short circuit current | 8.93 | A |
| Nominal maximum output voltage | 30.46 | V |
| Nominal maximum output current | 8.21 | A |
| Maximum system voltage (V) | 1000 | V |
| Module size | 1644 × 992 × 40 | mm |
| Module conversion efficiency | 15.33 | % |
| Cell type | Single crystal | - |
| Section | Circulating Water Temperature 10 °C | Circulating Water Temperature 15 °C | Circulating Water Temperature 20 °C | ||||||
|---|---|---|---|---|---|---|---|---|---|
| Contents | Simulation | Test | Error Rate | Simulation | Test | Error Rate | Simulation | Test | Error Rate |
| Surface Temperature | 38.7 °C | 39.5 °C | 2.03% | 42.5 °C | 40.1 °C | 5.99% | 46.4 °C | 41.0 °C | 13.17% |
| Thermal Efficiency | 65.28% | 69.40% | 5.94% | 65.67% | 65.50% | 0.26% | 60.00% | 64.62% | 7.15% |
| Electrical Efficiency | 13.90% | 13.20% | 5.30% | 13.60% | 13.10% | 3.82% | 13.31% | 13.10% | 1.60% |
© 2017 by the authors. Licensee MDPI, Basel, Switzerland. This article is an open access article distributed under the terms and conditions of the Creative Commons Attribution (CC BY) license (http://creativecommons.org/licenses/by/4.0/).
Share and Cite
Jeong, Y.-D.; Yu, M.G.; Nam, Y. Feasibility Study of a Heating, Cooling and Domestic Hot Water System Combining a Photovoltaic-Thermal System and a Ground Source Heat Pump. Energies 2017, 10, 1243. https://doi.org/10.3390/en10081243
Jeong Y-D, Yu MG, Nam Y. Feasibility Study of a Heating, Cooling and Domestic Hot Water System Combining a Photovoltaic-Thermal System and a Ground Source Heat Pump. Energies. 2017; 10(8):1243. https://doi.org/10.3390/en10081243
Chicago/Turabian StyleJeong, Yong-Dae, Min Gyung Yu, and Yujin Nam. 2017. "Feasibility Study of a Heating, Cooling and Domestic Hot Water System Combining a Photovoltaic-Thermal System and a Ground Source Heat Pump" Energies 10, no. 8: 1243. https://doi.org/10.3390/en10081243
APA StyleJeong, Y.-D., Yu, M. G., & Nam, Y. (2017). Feasibility Study of a Heating, Cooling and Domestic Hot Water System Combining a Photovoltaic-Thermal System and a Ground Source Heat Pump. Energies, 10(8), 1243. https://doi.org/10.3390/en10081243