Abstract
The integration of Distributed Generation, Electric Vehicles, and storage without compromising the quality of the power delivery requires the deployment of a communications overlay that allows monitoring and controlling low voltage networks in almost real time. Power Line Communications are gaining momentum for this purpose since they present a great trade-off between economic and technical features. However, the power lines also represent a harsh communications medium which presents different problems such as noise, which is indeed affected by Distributed Generation, Electric Vehicles, and storage. This paper provides a comprehensive overview of the types of noise that affects Narrowband Power Line Communications, including normative noises, noises coming from common electronic devices measured in actual operational power distribution networks, and noises coming from photovoltaic inverters and electric vehicle charging spots measured in a controlled environment. The paper also reviews several techniques to mitigate the effects of noise, paying special attention to passive filtering, as for being one of the most widely used solution to avoid this kind of problems in the field. In addition, the paper presents a set of tests carried out to evaluate the impact of some representative noises on Narrowband Power Line Communications network performance, as well as the effectiveness of different passive filter configurations to mitigate such an impact. In addition, the considered sources of noise can also bring value to further improve PLC communications in the new scenarios of the Smart Grid as an input to theoretical models or simulations.
1. Introduction
The penetration of DG (Distributed Generation) based on renewables, EV (Electric Vehicles), and distributed storage in the low voltage power distribution networks entails many benefits. As a matter of fact, it will definitely contribute to achieving the main goals of the so-called Smart Grids, such as minimizing both costs and environmental impacts while maintaining system reliability, resilience, and stability []. However, it also entails great challenges especially to the grid management, which cannot keep “swimming” at the primary substation level anymore, but needs to “dive” down to the secondary substations, smart meters, and even beyond. As a token of the increase in complexity that this change of paradigm entails, assuming 100 SS (Secondary Substations) per primary substation and 100 smart meters per SS, which sounds quite reasonable in European power distribution networks [,], the number of elements that need to be considered increases four orders of magnitude.
There are different ways of approaching the new scenario sketched in previous paragraph, but all them rely on the same common idea: the solution is all about communications. In this regard, AMI (Advanced Metering Infrastructures) are being widely deployed worldwide [,,] to provide bidirectional communications which allow delivering sophisticated services such as DR (Demand Response) []. In the case of the EU (European Union), for instance, most of its members have decided to undertake massive AMI deployments involving an estimated accumulated investment of € 35,000 million for the installation of 195 million smart meters by 2020 [].
Although wireless communications of course play an important role in the Smart Grid, in general, and AMI, in particular [], PLC (Power Line Communications) specially stand out in this field [,,] due to the great trade-off between economic and technical requirements they present [].
However, the power lines were designed to transmit power and not data. Hence, they represent a harsh communications media which suffers from frequency selectivity, continuous altered loads, EMI (ElectroMagnetic Interference), and, above all, noise. DG, EV, and storage indeed represent sources of noise themselves, since they are equipped with power electronics that introduce unwanted emissions in the frequency bands where PLC works (so-called supraharmonics when such emissions are between 2 and 150 kHz).
During the last decades, theoretical models for the PLC channel [,,,] and noise [,,,,] have been developed based on measurements or analysis to mitigate such problems, contributing to take PLC from simulation environments to the field. As a result, from some time now there are singular infrastructures, such as laboratories and in-field deployments, which involves both PLC networks and DG, EV, and storage equipment. Such infrastructures can be used to further improve PLC networks and its coexistence with the ecosystem of devices they have to monitor and control (1) by obtaining measurements that can be used to fine-tune communications networks or be input to theoretical models and simulations [,,,,,,,,,,,,,], and (2) by learning through experimentation itself, which is indeed in the very origins of science.
This paper contributes to these two approaches to keep improving PLC networks in the aforementioned new scenarios of the Smart Grid with remarkable presence of DG, EV, and storage at the low voltage grids. Thus, Section 2 sets the background of the paper, presenting an overview of PLC technologies in AMI scenarios, with special emphasis on NBPLC (Narrowband PLC) technology PRIME (PoweRline Intelligent Metering Evolution) [,]. Section 3 provides a comprehensive study of typical noises in PLC networks for AMI, including normative noises, noises measured in actual operational deployments of the Spanish DSO (Distribution System Operator) Unión Fenosa Distribución, and noises coming from DG and EV equipment measured in the LINTER (Grid Interoperability Laboratory) [], also from Unión Fenosa Distribución. Section 4 reviews different noise mitigation techniques used in PLC networks, paying special attention to one of the preferred solutions by DSO for this purpose: the use of filters. Although filter design is a well-known topic, the filters for this application have to meet constrained requirements, such as bearing currents up to tens of amperes while staying compact and low-cost, or presenting high input impedance. Thus, Section 4 presents a filter specifically designed to facilitate assessing the suitability of several filter configurations to different problematic scenarios in AMI. Section 5 indeed describes the setup and methodology followed in the set of tests that were carried out in the LINTER to evaluate the effectiveness of the aforementioned configurable filter to mitigate the effects of a selection of the most representative noises presented in Section 3. Section 6 presents the spectral measurements taken during these tests. Section 7 briefly introduces PRIME Analytics [], a novel software tool that allows for network forensics, and analyzes the effects of the noise sources and filter configurations in PRIME network performance using it. Section 8 discusses the main contributions and findings of the paper. Finally, Section 9 wraps up and draws conclusions.
The configurable filter and the network forensics tool PRIME Analytics represent novel developments that have been carried out within the scope of the Spanish R&D project OSIRIS []. The presented tests and analysis have been also carried out within the scope of the OSIRIS project and aim to serve as a token of how the gathered measurements can be used to learn through experimentation. Nevertheless, the noise records are available together with the paper so that they can be used in theoretical and simulation works to further improve PLC network performance in Smart Grid scenarios.
2. PLC Technologies
2.1. Overview of PLC Technologies and Their Application to AMI
The very basic elements that compose AMI are the smart meters, which work both as sensors and actuators with bidirectional communications capabilities, and the information systems (also referred as MDMS—Meter Data Management Systems—in the literature []), where the gathered data is processed and the appropriate decisions are made. The smart meters and the information systems can be connected directly through backhaul communications technologies, resulting in monolithic communications architectures, as shown in Figure 1a.
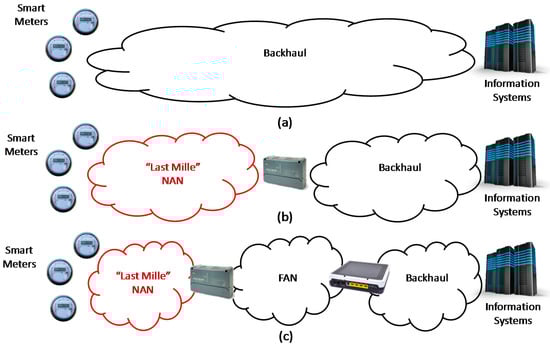
Figure 1.
Overview of Advanced Metering Infrastructure (AMI) communications architectures. (a) Monolithic; (b) Hierarchical with two network segments; (c) Hierarchical with three network segments.
Monolithic communications architectures have pros and cons [] and, in order to improve scalability, data concentrators are typically deployed, resulting in hierarchical communications architectures, as shown in Figure 1b. The place where the data concentrators are deployed may vary depending on the features of the power distribution infrastructure (e.g., number of smart meters per SS, length of the low voltage cables, number of SS per primary substation, etc.). For instance, in Europe (and China) such data concentrators are typically located at the SS since low voltage cables are long and power distribution grids are reasonably dense; whereas in the US (and Japan) they are located upwards in the power distribution hierarchy because the low voltage cables are shorter and less populated [,].
No matter where the concentrators are, the use of concentrators split the communications architecture into two main communications segments: (1) the “last mile” or NAN (Neighborhood Area Network) [,], which comprises the smart meters and the data concentrators; and (2) the backhaul, which comprises the data concentrators and the information systems. This paper focuses on the “last mile” or NAN (in red in Figure 1), notably when the concentrators are deployed at the SS, so smart meters and concentrators are directly connected through the low voltage cables.
PLC can be mainly classified in three different types [,]: UNB (Ultra NarrowBand), NB (NarrowBand), and BPL (Broadband over Power Lines). UNB is not the preferred solution for AMI in the considered communications segment since the data rate may be too low, although there are solutions available and running in the market for quite a few years, such as Aclara TWACS (Two-Way Automatic Communications System).
On the opposite side, the two main BPL standards (namely IEEE 1901 and G.hnem []) may exceed the communications and economic requirements of this segment, although there are examples where it is used as well []. In the case of Spain, for instance, DSO Iberdrola used this technology to provide broadband access some years ago, but with the launch of VDSL (Very-high-bit-rate Digital Subscriber Line) the business case stopped being economically justifiable. Nevertheless, Iberdrola learned from this experience and now they use this technology over the medium voltage or FAN (Field Area Networks) for AMI and tele-control purposes [,], resulting in the communications architecture shown in Figure 1c.
Thus, the most widely used PLC technologies for this segment are definitely NB. Table 1 summarizes the most relevant NBPLC technologies together with their main features.

Table 1.
Summary of Narrowband PLC (NBPLC) technologies.
Notably, this paper focuses on PRIME. Hence, the next section explains more in detail how this technology works.
2.2. PRIME
PRIME is a second-generation NBPLC technology that was initially developed by the PRIME Alliance [], led by DSO and chipset manufacturers such as Iberdrola, Gas Natural Fenosa, Texas Instruments or ADD (now Microchip), and later standardized by ITU-T []. The standard specifies the two lowest layers of the protocol stack, namely: the PHY (physical) and the DLL (Data Link Layer). The DLL comprises in turn the MAC (Medium Access Control) and the Convergence Layer, which deals with multiplexing upper layer protocols, as well as with flow control and ARQ (Automatic Repeat reQuest) mechanisms.
At the PHY layer, PRIME can operate at the CENELEC-A band (notably, between 41 and 89 kHz) or at the FCC/ARIB band (reaching up to 500 kHz) using OFDM (Orthogonal Frequency Division Multiplexing). The carriers may use different modulation schemes allowing for maximum PHY data rates of up to 130 kbps, in the CENELEC-A band (version 1.3.6), and up to 1 Mbps, in the FCC/ARIB band (version 1.4). However, currently all PRIME deployed networks are compliant with version 1.3.6 (which is the version considered in this paper) and use DBPSK (Differential Binary Phase Shift Keying) with FEC (Forward Error Correction) ON, which is the most robust modulation scheme, allowing maximum PHY data rates of 24.1 kbps []. In DBPSK, the first carrier of the OFDM symbol carries a value that is well-known by transmitter and receiver and the information is encoded in the phase shift with respect to that value. Therefore, this modulation scheme avoids using an equalizer at the expense of slightly worsening the effective data rate and the BER (Bit Error Rate) vs. SNR (Signal-to-Noise Ratio) curve.
At MAC layer, two kinds of nodes are defined: Base Node and Service Node. The Base Node (the so-called concentrator in AMI terminology) coordinates the PRIME network, only a single Base Node per network being allowed. The Service Nodes are the smart meters in AMI terminology. However, they may play just the role of Terminal or they can be promoted to Switches. Switches are communications repeaters whose main goal is to increase signal range in the cable via relaying, thus mitigating the effects of attenuation and noise. Figure 2 illustrates the different states and transitions of a Service Node together with the tree-wise logical topology of a PRIME network.
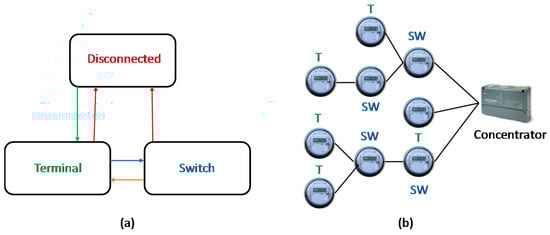
Figure 2.
(a) States and transitions of a PRIME Service Node; (b) Tree-wise logical topology of a PRIME network.
Media access control in PRIME includes a SCP (Shared Contention Period) and a CFP (Contention Free Period). Their main difference is that in the former all the service nodes can content for the channel at the same time using CSMA-CA (Carrier Sense Multiple Access with Collision Avoidance); whereas the latter guarantees a time slot for service nodes and the base node to use the channel. Current implementations only include the SCP, although the benefits of using the CFP for applications that required certain level of QoS (Quality of Service) are being investigated [].
PRIME define three types of frames:
- Beacon PDU (Packet Data Unit): PRIME networks are designed to be plug & play. Therefore, before the SCP, a period of time is reserved for the transmission of beacons, which are used by the concentrator or the switches to advertise themselves, as well as to provide network synchronization. So whenever a new smart meter is switched on, it will listen to the channel waiting for these beacons so that it can join the PRIME network.
- Promotion Needed PDU: If a new smart meter is switched on and it does not hear any beacon, it will start sending Promotion Needed PDU, which work as a kind of SOS mechanism, since any smart meter that listen to such a PNPDU will have to ask the concentrator to promote itself to switch, so that the new smart meters can reach the concentrator through it.
- Generic MAC PDU: The Generic MAC PDU can be either Data or Control packets. Figure 3 shows all the possible control packets. As it can be seen, the control packets include, for instance, the registration messages, which are used to join the PRIME network. As a result of this procedure, the new smart meter is assigned a 22-bit ID which is shorter than its MAC address (48 bits), thus reducing the overhead. Since PRIME communications are connection-oriented, the control packets also cover the connection procedure. The promotion requests which are triggered by the PNPDU are also a type of control packet. Finally, it is worthwhile to highlight also that keep-alives are yet another type of control packet which are used by the concentrator to get an idea of the connectivity status of the network.
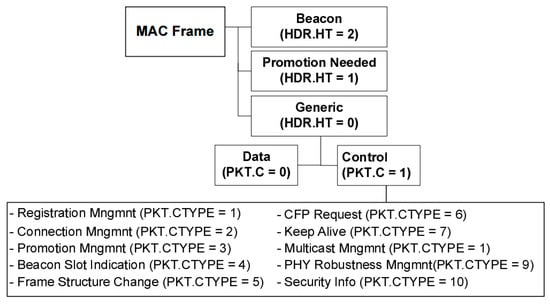 Figure 3. Overview of PRIME (PoweRline Intelligent Metering Evolution) MAC (Medium Access Control) frames.
For the sake of comprehensiveness, although it does not belong to PRIME specification, on top of PRIME or any other NBPLC technology, i.e., at the application layer, DLMS/COSEM is used, where COSEM (IEC 62056-61/62) is an energy metering profile of the DLMS (IEC 62056-53) protocol [,] Thus, DLMS/COSEM defines data models for common energy-related parameters together with a communication protocol designed to transport this kind of information.
3. Noise in PLC Networks
3.1. Traditional Noise Classification
Traditionally, the noise in PLC channels has been classified into two main categories [,]:
- Background noise, which is always present and changes slowly in time (from minutes to even hours);
- Impulsive noise, which consists of very powerful noise burst normally taking between microseconds and milliseconds.
The background noise can in turn be considered as the sum of the contribution of two types of noise, namely []:
- Colored background noise, which is in turn caused by the summation of numerous low-power sources of noise. This type of noise has a relatively low PSD (Power Spectral Density) and is named “colored” because, on the contrary to the white noise, its frequency response is not flat, but varies. The pink noise, for instance, whose PSD is inversely proportional to the frequency, is a well-known example of this type of noise.
- Narrowband noise, which consists mainly of amplitude-modulated impulses. This type of noise may be caused either by broadcast stations or by switching power supplies on the network (being also referred to as periodic impulsive noise asynchronous to the mains frequency in the latter case).
There are also two types of noise that can be considered to form the impulsive noise, namely []:
- Periodic impulsive noise synchronous to the mains frequency, which is caused by power supplies and consists mainly of impulses that last some microseconds with a repetition rate of 50 or 100 Hz.
- Asynchronous impulsive noise, which is caused by switching transients to the network and consists of random impulses that last from microseconds up to milliseconds, being much stronger than background noise.
3.2. Noise Library for NBPLC-PRIME
3.2.1. Noise Categorization
Reference [] presents a well-established categorization of noise sources for the NBPLC frequency band, in general, and for the PRIME frequency band, in particular. It must be considered that in this study: (1) the equipment involved were legitimately CE (European Conformity) marked and the related standardized emission limits and immunity requirements were met; and (2) events related with an EMI due to current/voltage components in the frequency range from 2 to 150 kHz, exceeding the immunity of an equipment in normal operation status, were analyzed. Such a categorization is summarized next []:
- EMI due to conducted emissions
- ⚪
- EMI due to lighting equipment
- ⚪
- EMI due to electricity meters
- ⚪
- EMI due to mains communication systems
- ▪
- Power supplies
- TV antenna system
- UPS for computers/servers
- Camera surveillance system
- Satellite receiver amplifier
- TV receiver
- DVD player
- LAN router/switch
- PC
- 4G/LTE base station
- Battery charger / Voltage converter
- Antenna amplifier
- Short range effect (in MV/LV secondary substations)
- ▪
- Power systems: loads and inverters
- Frequency inverters in an industrial plant
- Frequency-controlled ventilation
- Frequency-controlled water pump
- Inverters in a waste water treatment plant
- Inverter in a heat plant
- Several inverters in a rural supply area
- Commercial washing machine
- ▪
- Variable Frequency Drives in a pump station
- ▪
- Lighting equipment
- Energy efficient lighting
- Fluorescent lights
- Emergency lighting
- ▪
- Other EMI sources
- Fiber switch
- Signal attenuation by IT equipment
- Circuit breaker
- ▪
- EMI due to medical equipment
- Ultrasonic equipment
- Electrocardiograph (ECG)
- EMI due to radiated emissions
- ⚪
- Broadcast time-signal systems
- ⚪
- Contactless magnetic card reader
- ⚪
- Mobile radio receivers
- ⚪
- Traffic control system.
3.2.2. Normative Noise Signals
All the aforementioned voltage/current equipment and components have some potential for causing EMI, for which also a combination of the different sorts has to be considered in a double way: (1) cumulative effect of voltage components from all emitting equipment connected to a supply network; and (2) proliferation of different sorts of electric equipment and its different durations of operation.
The main standards related to EMC regulation and guidelines are:
- EN 50065 [];
- CISPR15 [];
- and IEC TS 62578 [].
EN 50065 is a standard used for the certification of equipment transmitting in the PLC communications band. It is, therefore, used for all PRIME equipment. Its limits are mandatory for all the equipment transmitting in the band, but it is possible to find equipment that transmits up to the limit of the band in multiple frequencies. As standard, EN 50065 only applies to PLC transmitters, so there may be equipment (e.g., inverters, luminaires) that transmit above these limits.
The standard CISPR15 is used for the certification of certain equipment that is not for communications, but that produces a considerable energy in frequencies close to those of PLC communications. Its limits are mandatory for all equipment that meets this standard, but it is possible to find equipment that transmits up to the band limit in multiple frequencies. As the limits of CISPR15 are not sufficient to allow the work of PLC communications, a more constrained limitation has been analyzed between 30 and 150 kHz.
The standards used for the certification of certain non-communications equipment do not always adequately limit the transmission of signals in the frequency bands used by PLC communications. This is why the EU seeks to create a regulatory framework that, without hindering the development of equipment such as inverters or luminaires, allows adequate coexistence between PLC communications equipment and other equipment. One of the proposals analyzed in the TC22 appears in TS 62578 and covers the range of the PRIME communications. Figure 4 summarizes the main standard emissions limits between 2 and 150 kHz.
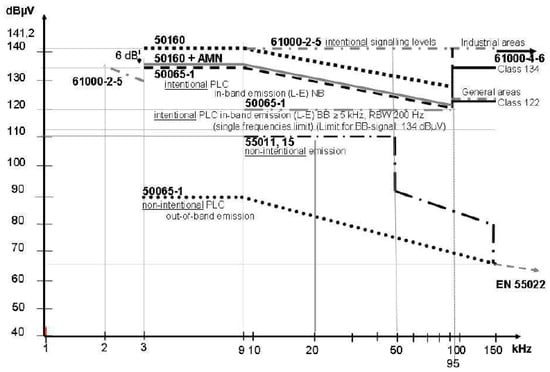
Figure 4.
Standardized emission limits, values, and Power Quality levels for the frequency range 2–150 kHz [].
The red dash line in Figure 5 shows the agreement that has been recently reached in the IEC/SC 77A/WG8 on the compatibility level for the frequency band ranging from 30 to 150 kHz as a trade-off between the two main opposing options (namely, option A in blue continuous line and option B in green continuous line) [].
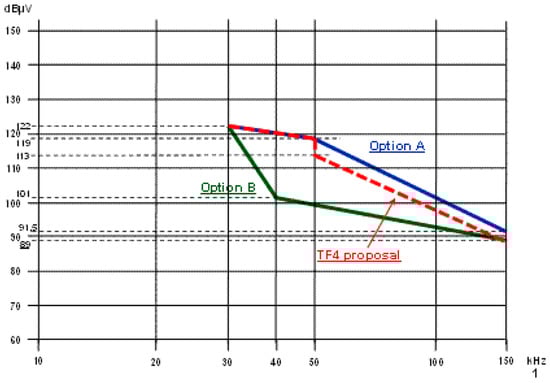
Figure 5.
Compromise compatibility level between 30 and 150 kHz agreed in the IEC /SC 77A/WG8 [].
Using as a reference the standards indicated above, a set of synthetic noises has been generated in a controlled environment to evaluate PRIME communications against noises close to the normative limits that are currently being studied in technical committees.
The equipment used for the noise generation is a signal generator in the time domain that, together with an amplifier and an RF probe, induces the signal in the power cables in a range between 40 and 90 kHz. For the calibration of the signal, an oscilloscope with the capacity to capture in time and to analyze in frequency has been used, allowing the progressive adjustment of the signal.
2 records have been generated, corresponding to curve with peaks in frequencies every 8 kHz and every 1.953 kHz. Figure 6 and Figure 7 show such noise records produced according to the regulatory limits of EN 50065. The yellow line represents the noisy signal in the time domain and the white line represents the noisy signal in the frequency domain.
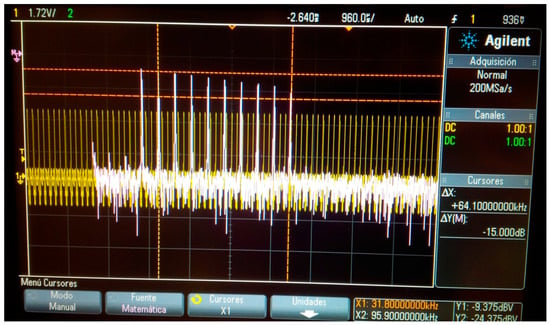
Figure 6.
Synthetic noise for EN 50065 limits with frequency peaks every 8 kHz.
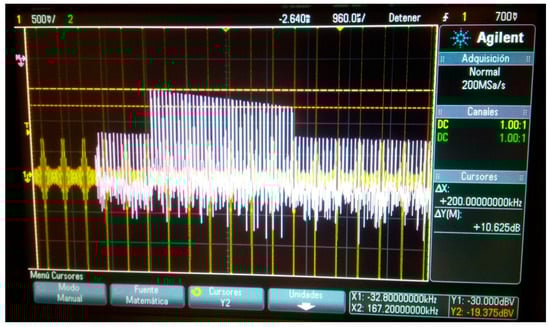
Figure 7.
Synthetic noise for EN 50065 limits with frequency peaks every 1.953 kHz.
3.2.3. Noise Signals Measured in Actual Operational Deployments
In the process of capturing noise in the field, it is always tried to capture the noise peaks and the maximum noise accumulated during a certain period of time. This is because it is assumed that those maximums are the ones that are actually hampering communications.
In general, these curves are included as maximum curves of the amplitude of the voltage versus frequency. However, it must be considered that the spectral distribution is not constant, but varies over time depending on the state of operation of the equipment generating the disturbances. Therefore, it is also interesting to have temporary records.
In addition, it is necessary to know the electrical characteristics of the environment in which the noise is measured in order to reproduce that environment in the laboratory. The noise signal can be measured in power, as direct voltage or through the current, and in all the cases it is necessary to know the impedance on which it is measured in order to reproduce it precisely later on.
Furthermore, in the context of AMI, noises do not affect all smart meters in the same way when they are operating at a high current or when they are operating at low or no current.
The methodology and the instrumentation used also have a great influence on the measurements and therefore must be identified in the records that are delivered. For example, a record obtained with a power quality equipment for electrical networks registers harmonics with respect to the fundamental frequency with a limited frequency analysis and it is very different from one obtained with a specific RF system or with the own smart meters.
Another relevant fact to keep in mind is that in the field it is always difficult to have ‘clean’ noises, understood as generated by a single disturbing source. The only elements that actually block a noise are the transformers. Therefore, below each transformer, the noises accumulate among each other. In AMI, each centralization is made up of multiple smart meters from which multiple noises can appear. The noise that comes from the load of a smart meter (i.e., household) is transmitted immediately to the rest of the smart meters nearby and can even affect more distant smart meters in a more attenuated way.
With this accumulation of noise, it is difficult to determine the true source of noise. Only in relatively well-known environments or where a noise source operates exclusively at certain time periods, the source can be detected. It is understood, therefore, that some of the records available from the real environment will not be associated with a specific source, although the predominant source is indeed identified.
Next, several noise records measured in operational power distribution networks of Unión Fenosa Distribución are presented with the aim of getting an idea of the main features that some of the noises identified in [] present in actual deployments.
In general, all the noises have been obtained as registers in the frequency domain, i.e., in a format that collects the voltage levels as a function of frequency at a given time.
All recorded noise registers represent signals that are in the frequency ranges between 15 and 170 kHz, although the analysis focuses on PRIME frequency band (i.e., between 40 and 90 kHz).
The equipment used for measuring the noise is a 4PBN sniffer from ZIV [], which allows the capture of instantaneous values and accumulated values of the frequency response of both noise and communications.
The records are JPEG images with two lines: a colored one representing the ‘instantaneous’ noise, and a gray one, superior to the colored one, which reflects the maximum level measured since the analyzer was switched on, which is the sum of the noise and the PRIME communications signal. Nevertheless, the most important features of the measured noises are characterized in order to allow reproducing them in a controlled environment.
Figure 8 shows the noise introduced by a community antenna. Community antennas are single-phase power elements that can generate noise due to their power supplies. The fact that there is a relatively large distance between the antenna and the smart meter room causes the cable that feeds the antenna to become in turn a large antenna that simultaneously transmits the noise and radiates. This radiation induces the noise in other cables of other smart meters so that, finally, the noise can be seen in smart meters different from the one of the antenna, although the maximum noise will always be seen in the smart meter corresponding to the antenna.
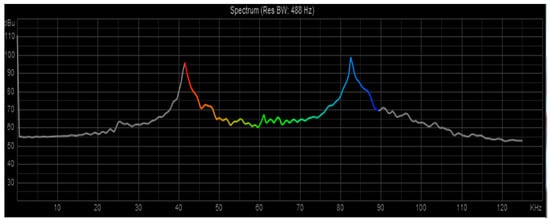
Figure 8.
Community antenna noise measured in the field (Phase R).
Figure 8 shows the R phase of the community antenna. Two peaks are observed in frequencies at 41.5 and 83 kHz in a relevant level reaching 95 and 100 dBuV respectively. In S and T phases it was lower (85 dBuV). In this situation, all the smart meters of the centralization lost their connectivity.
Figure 9 shows the noise associated to a domestic TV receiver. TV receivers are elements that can generate noise due to their power supplies or, in case of old televisions, by degradation of the demodulator components.
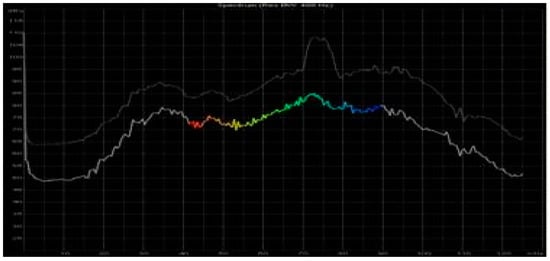
Figure 9.
TV receiver noise measured in the field.
As it can be seen in Figure 9, the noise introduced by the TV receiver is somehow colored noise, being close to 90 dBuV in the entire PRIME frequency band. This noise was higher than the received PRIME communication level and, due to the proximity of the centralization with the SS, prevented the communications in the whole PRIME network.
Figure 10 shows the noise associated to a water pump. Water pumps are infrequent elements in large residential blocks of buildings, but common in house residential areas. These pumps, generally three-phase equipment, can generate noises due to the operation of their motor.
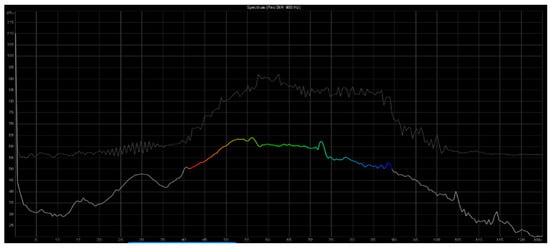
Figure 10.
Water pump noise measured in the field.
As it can be seen in Figure 10, it is also a kind of colored noise, but reaches lower levels than the TV receiver noise (notably, up to 65 dBuV). Anyway, this noise hampered the communications of all the smart meters in the same smart meter room and even of smart meters located in smart meter rooms further away from the SS.
Finally, Figure 11 shows the noise associated to an electronic ballast. In a fluorescent lamp the role of the ballast is twofold: (1) to provide the high voltage necessary for the ignition of the tube; and (2) after the ignition of the tube, to limit the current that passes through it. In both cases, the ballast can generate noise in the PRIME communication band.
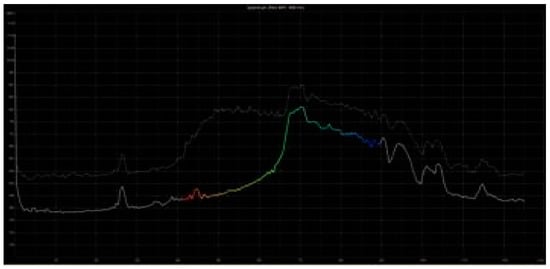
Figure 11.
Electronic ballast noise measured in the field.
As it can be seen in Figure 11, the measured noise introduced by this electronic ballast affect the upper part of the PRIME frequency band, behaving as a kind of colored noise that reaches levels up to 85 dBuV. Due to the proximity of the centralization with this noise to the SS, this noise prevented the communications in the whole PRIME network too.
3.2.4. Noise Signals Measured in the Lab
In addition to normative noise and the noise measurements taken in the field, noise measurements have been also gathered in a controlled environment such as the LINTER of Unión Fenosa Distribución []. This laboratory is equipped with around 100 smart meters and a few concentrators from the main manufacturers in the market [], as well as with DG installations based on renewables and EV charging spots. All the equipment is connected with low voltage cables of lengths ranging from 10 to 150 m and sections ranging from 4 to 35 mm2. In this case the measurements have focused indeed on the noise introduced by the DG installations and the EV charging due to their relevance in low voltage networks both currently and even more in the forthcoming years.
The equipment used for measuring the noise in this case is the HW/SW SpectraVue sniffer from Moetronix [], which allows capturing instantaneous values and accumulated values of the frequency response of both noise and communications in a range that includes PRIME frequency band.
The records are both CSV and JPEG images. The JPEG images include two lines: a green one representing the “instantaneous” noise, and a blue one, superior to the green one, which reflects the maximum level measured since the analyzer was switched on, which is the sum of the noise and the PRIME communications signal. The CSV records include the frequencies and amplitudes associated to the green line of the JPEG images (i.e., “instantaneous” noise).
EV are elements that require a rapid charging process during which they can emit significant noise levels in PRIME communication bands. Figure 12 shows the setup and components used for measuring the EV charging noise at the LINTER. As it can be seen, three different models of EV were considered, namely Renault Twicy, Renault Zoe, and Nissan Leaf.
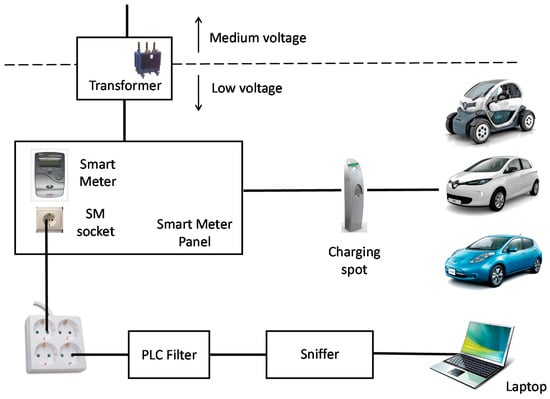
Figure 12.
Setup and components used for measuring the EV (Electric Vehicle) charging noise at the LINTER (Grid Interoperability Laboratory).
Figure 13 shows the noise measured at the LINTER when charging a Renault Twicy. It can be seen that it introduces a remarkable peak at the very beginning of the PRIME frequency band. By analyzing the CSV records with MATLAB, it can be seen that such a peak reaches −30.28 dBV at 48.29 kHz.
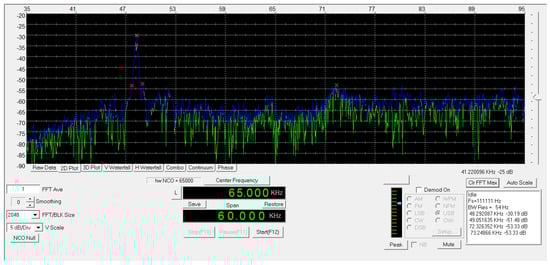
Figure 13.
Noise associated to charging a Renault Twicy.
Figure 14 shows the noise measured at the LINTER when charging a Renault Zoe. In this case, the measured noise is kind of colored, reaching levels up to −65 dBV, i.e., lower than when charging the Renault Twicy.
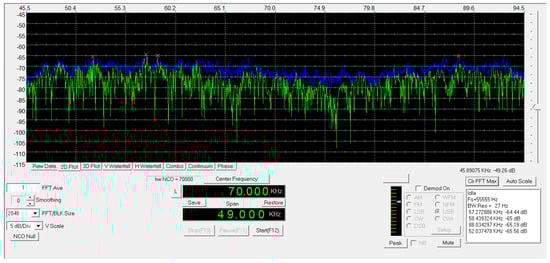
Figure 14.
Noise associated to charging a Renault Zoe.
Figure 15 shows the noise measured at the LINTER when charging a Nissan Leaf. In this case, it can be observed that it is kind of colored with two main peaks at 54 and 82 kHz that reach −60 dBV.
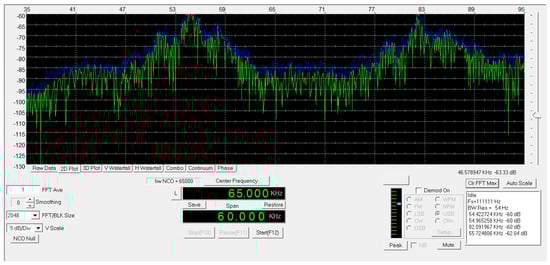
Figure 15.
Noise associated to charging a Nissan Leaf.
It should be noted that, although these records are valuable to reproduce these noises in a controlled or simulated environment with the aim of evaluating their impact in different scenarios, the noise introduces by EV charging changes with time and also depends on the charging type (e.g., slow, semi-fast or fast, single-phase or three-phase) and on the state of charge of the battery.
Regarding the inverters, they are elements that have not limited conducted emissions in the frequency bands below 150 kHz by regulation so far, so they can emit very relevant noise signals in PRIME communication band. The noise generated by inverters typically contains a series of peaks whose frequency is related to the working frequency of the inverter power electronics. In many cases the inverters are grouped by tens, reason why the accumulated noise in the installation is much bigger than the contribution of only one.
Figure 16 illustrates the setup and components used for measuring the noise coming from inverters at the LINTER. The available PV installation consists of 3 amorphous PV panels and 3 single-phase Danfoss DLX 3.8 KW inverters. The nominal power of the installation is 10 KW, obtained from a 141 m2 surface. Although there were filters available to mitigate the effects of some of the inverters, they were not used during these measurements in order to obtain the overall noise associated to the three inverters.
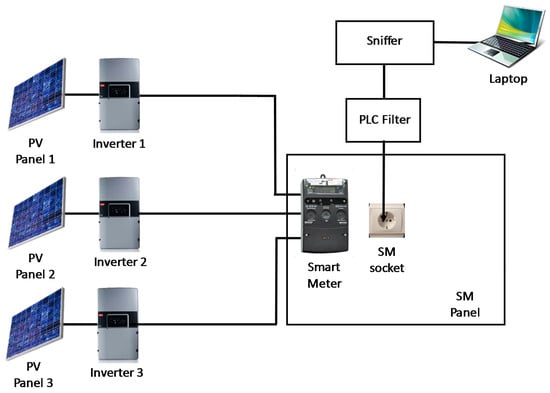
Figure 16.
Setup and components used for measuring the PV (Photovoltaic) inverter noise at the LINTER (Grid Interoperability Laboratory).
Figure 17 shows the noise measured at the LINTER with the inverters injecting between 3 and 3.2 KW. The aforementioned series of peak can be observed. Notably, five outstanding peaks can be seen, three of them inside PRIME frequency band. These three peaks are at 48, 64, and 80 kHz in this case, reaching −22.9, −28.9, and −27.3 dBV, respectively.
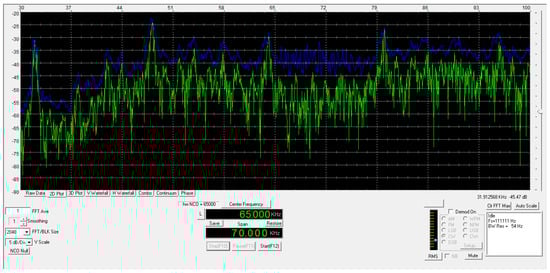
Figure 17.
Noise associated to the inverters.
As in the case of EV charging noises, although these measurements are valuable for experimentation, it should be noted that the noise introduced by the inverters also changes with time and depends on the working point, which in turn depends on the weather conditions.
3.3. Summary of Noise Signals in NBPLC-PRIME Networks
To sum up, the main features of the noises presented in this section are summarized in Table 2. Although these noises are not “pure”, Table 2 also tries to map them onto a simplified version of the traditional noise classification presented in Section 3.1.
Table 2.
Summary of noise signals in NBPLC-PRIME networks.
4. Noise Mitigation Techniques
The state of the art is plenty of proposals for mitigating the effects of noise in PLC networks. There are proposals that involve using novel modulation schemes. In [], for instance, a modulation scheme called OPP-MC-CDMA (Orthogonal Poly-Phase-based Multicarrier Code Division Multiple Access) is proposed to overcome the effects of bursty noise and multipath frequency-selective fading in BPL networks.
Compressive sensing is also a very common technique to mitigate the effects of impulsive noise in OFDM systems [], in general, and in PLC networks [,], in particular. In [] a modification of compressive sensing based on Partial Fourier Matrices is proposed, the main advantage of such a modification being that no redundancy is added, so there is no decrease in the transmission data rate.
In order to mitigate the effects of impulsive noise, there are also proposals which involve simple memoryless nonlinearity techniques, such as clipping, blanking or a combination of both [,].
Another proposal to overcome noise conditions harsher than regular ones in the field is the use of data concentrators with three phase injection capabilities []. But sometimes a very powerful noise source generates a very high-level wideband noise which results several dB above the NBPLC signal, making the communications impossible in part or even in the whole network, as it has been shown in Section 3. In current practice, this kind of situation are corrected by the installation of filters at the customer premises, in addition of investigating if the interference emission levels are above regulatory limits [].
Filters are designed to mitigate conducted noise generated by domestic or industrial appliances in the PRIME frequency band. They are installed between the interfering element (typically located at the customer’s premises) and the smart meter, as shown in Figure 18.
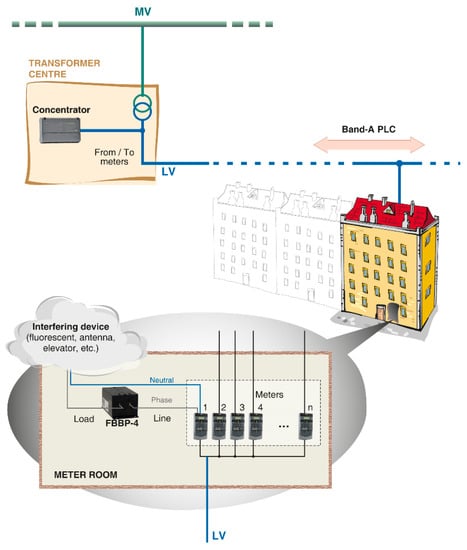
Figure 18.
Detail of filter installation.
The filters used in this kind of scenarios must meet very constrained and sometimes conflicting requirements, e.g.,: for safety reasons, they have to bear currents up to tens of amperes without any risk of burning; they have to be reasonably compact (as a rule-of-thumb, their dimensions round 5 × 5 × 10 cm); they have to present high input impedance so that the automatic recovery mechanism of the smart meter works; and their cost have to be low, since potentially a high number of filters may be deployed. Therefore, in these scenarios the best filter is not the one that better attenuate the noise (otherwise a low pass filter with a cut-off frequency before the beginning of the PRIME frequency band would be fair enough), but the one that presents the best trade-off between all the aforementioned requirements.
As a result, one of the main objectives of the OSIRIS project [] was to develop a filter that combats common noises in “last mile” of AMI reasonably well and that could be massively deployed. In order to achieve this goal, the configurable filter shown in Figure 19 was designed with the aim of easily comparing the effectiveness of different configurations.
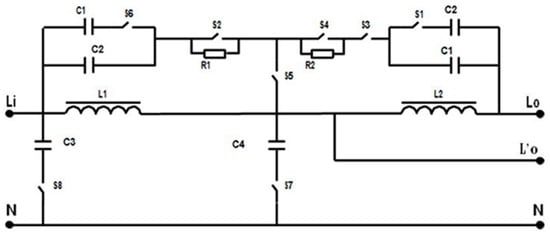
Figure 19.
Electric schematic of the configurable filter.
This configurable filter allows selecting different filter configurations by opening or closing the switches (S). The most relevant configurations for the target study are: (1) the use of one or two inductances; (2) the insertion of a capacitor to neutral; and (3) the different capacitors and resistors and their influence on the tip of the attenuation curve. Hence, in the next sections the effectiveness of the four configurations shown in Figure 20, Figure 21, Figure 22 and Figure 23, ranging from simple and cheap configurations to more sophisticated ones, are assessed in different noise scenarios. Figure 20, Figure 21, Figure 22 and Figure 23 also show the frequency response of the considered filter configurations in the PRIME frequency band.
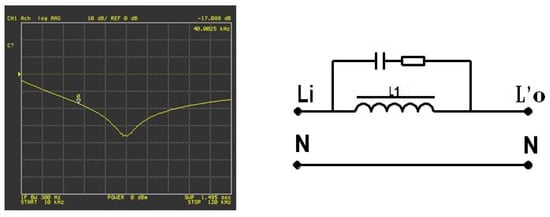
Figure 20.
Schema and frequency response of Filter F2.
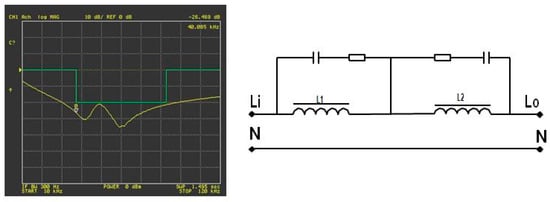
Figure 21.
Schema and frequency response of Filter F4.
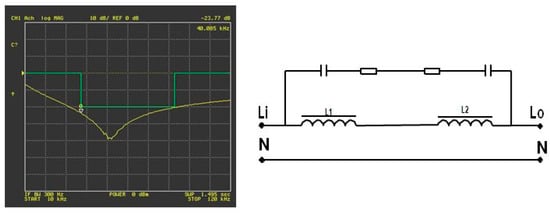
Figure 22.
Schema and frequency response of Filter F6.
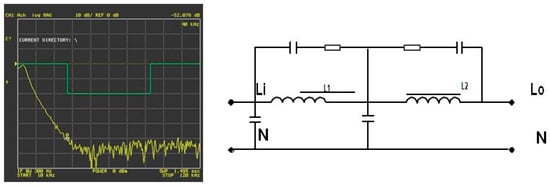
Figure 23.
Schema and frequency response of Filter F9 (low-pass differential-type filter).
In addition, the commercial filter Spica Strike [], available at the LINTER to mitigate the effects of the noise coming from the inverters in the PRIME network, is also evaluated in the next sections.
5. Laboratory Test Description
5.1. Objectives and Methodology
The set of tests presented in this section was carried out in the LINTER of Unión Fenosa Distribución, whose main characteristics have already been introduced in Section 3.2.4. The main objective of such a set of tests is twofold:
- On the one side, the tests aim to shed some light on the impact of different representative sources of noise in the performance of NBPLC networks (notably, PRIME).
- On the other side, the tests also aim to evaluate how effective different passive filters are to remove or mitigate the effects of such sources of noise, taking advantage of the configurable filter presented in Section 4.
The methodology applied in the tests is as follows:
- (1)
- First, it is checked that the scenario is isolated and that there are no other sources of noise, beside the background noise.
- (2)
- Then, the source of noise under study is introduced and measurements are taken.
- (3)
- Next, a specific configuration of the filter is used and measurements are taken again.
- (4)
- Step 3 is repeated with all the filter configurations to be evaluated.
- (5)
- Finally, the gathered measurements are analyzed and conclusions are drawn.
5.2. Considered Noise Signals
For these tests, a few representative sources of noise have been selected from the comprehensive review of sources of noise presented in Section 3. Specific samples from all the main categories presented in Section 3.2 (namely, normative noises, noises measured in the field, and noises measured in the lab) have been chosen.
Regarding normative noises, the noise that fits the limits established in the EMI norm EN 50065 with frequency steps of 1.953 kHz has been selected as for representing the worst case, since the noise pulses are more frequent and the envelope remains the same (c.f. Figure 6 and Figure 7).
Regarding the noises measured in the field, the noise generated by a community antenna has been chosen for several reasons: (1) because it represents a very common noise, considering that this kind of devices are present in every single building; and (2) because it represents a harsh noise which can prevent the communications in PRIME networks, as it was pointed out in Section 3.2.3.
Finally, regarding the noises measured in the lab, the noise generated by the charging station of an EV (notably, the Nissan Leaf) has been chosen as an example of consumption device and the noise generated by the PV panel inverters available at the LINTER has been selected as an example of generation equipment. In addition, both PV panels and electric vehicles represent, together with storage, the most novel equipment at the low voltage power networks of the Smart Grid, so the considered noises increase the potential impact of the study.
5.3. Considered Scenarios
The tests can be classified into two subsets depending on whether the noise was injected in the network using a signal generator or the source of noise was a physical component of the lab premises. To be more precise, the worst case normative noise and the community antenna noise were generated synthetically; whereas the EV charging spot and the PV inverters available at the LINTER were used.
The components and the setup of the test bench are different depending on this differentiation. Figure 24 shows the setup used in the synthetic noise injection tests. As it can be seen, the noise is synthetically generated by means of a signal generator [] and is injected in the PLC network through a RF amplifier and a bulk current injection probe []. The role of the RF amplifier is to allow evaluating the impact of different power levels of the injected signal. The RF amplifier used in these tests works from 3 kHz to 1 MHz with a maximum output power of 50 W.
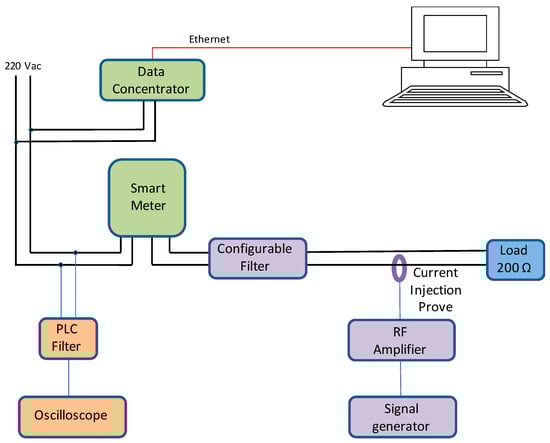
Figure 24.
Components and setup of the synthetic noise injection tests.
Figure 25 illustrates the procedure followed to synthetically reproduce the noise. As it can be seen, the inputs are either an image or a text file representing the spectrum of the noisy signal. If the input is an image, first a manual process to characterize the most significant spectral components is required. As a result of this process, a text file including pairs of (frequency, amplitude) is obtained. Such text files are processed by software to obtain pairs of (time, amplitude), since the input of the signal generator is a time-domain signal. Then, the signal is injected in the PLC network and compared with the expected one.
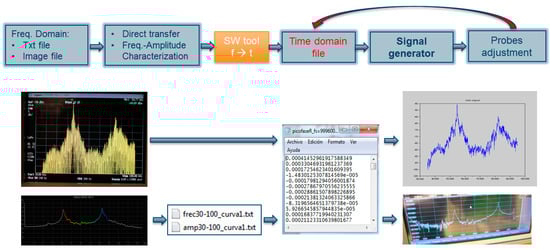
Figure 25.
Schema of the procedure followed to synthetically reproduce the noise.
Figure 26 shows the setup of the tests related to the noise associated to the charging of the EV Nissan Leaf.
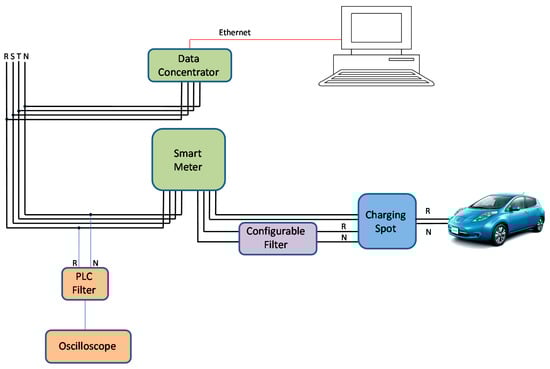
Figure 26.
Components and setup of the EV noise tests.
Figure 27 shows the setup of the tests related to the noise introduced by the inverters of the PV panels. As it has already been mentioned in Section 3.2.4, the PV system consists of amorphous panels and a three-phase power conversion consisting of 3 single-phase Danfoss DLX 3.8 KW inverters, in two of these phases (R and S) being the commercial filter Spica Strike [] to attenuate harmonics.
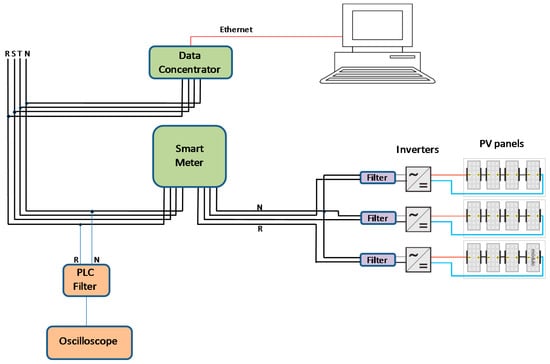
Figure 27.
Components and setup of the PV panel inverter tests.
As it is shown in Figure 24, Figure 26 and Figure 27, in all the tests the signal in the line is monitored through an oscilloscope [], which is able to show the time and frequency domain at the same time, although Section 6 will focus on the frequency domain. The data concentrator is responsible to record the measurements related to the performance of the PRIME networks that will be analyzed in Section 7.
Figure 24 and Figure 26 also show the position in the network of the configurable filter presented in Section 4, which can be present or not, as explained in Section 5.1. It is worthwhile to stress that such a configurable filter is not the same as the filters used in the PV panel inverter tests (Figure 27).
In all the tests, the data concentrator was configured to request standard consumption reports (such as S02—daily incremental consumption profile report—and S05—daily billing report) to all the smart meters in the network, so that a certain level of data traffic was guaranteed.
5.4. Lab Test Summary
Table 3 summarizes all the tests that were carried out together with their most relevant features. Each test was run during 5 min.
Table 3.
Summary of the set of tests that were carried out.
6. Test Spectral Measurements
6.1. Normative Noise Tests
These tests have been carried out following the schema of Figure 24 and correspond to test IDs N1 to N7 in Table 3, i.e., with a normative noise signal power corresponding to the 25% of the maximum output power of the amplifier. The main goal of these tests is to evaluate the effectiveness of the different considered configurations of the configurable filter (c.f., Figure 20, Figure 21, Figure 22 and Figure 23) to remove such a harsh noise.
Figure 28 shows the spectral signal measured in phase R for test N1 (i.e., no filter) when there is no PRIME communications. The normative noise can be easily recognized, the peaks reaching levels up to 90.9 dBuV. Figure 29 shows that PRIME communications reach levels around 90.9 dBuV too, so it is to be expected that the normative noise affects the PRIME communications.
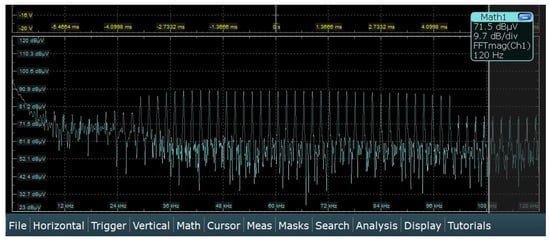
Figure 28.
Spectral signal without PRIME communications in test N1.
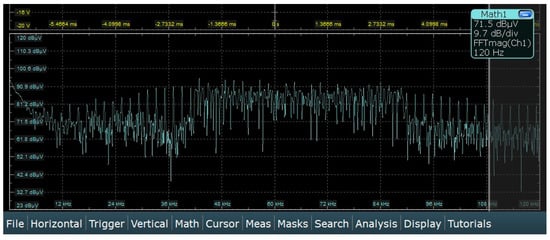
Figure 29.
Spectral signal with PRIME communications in test N1.
Figure 30 shows the spectral signal measured in phase R for test N2 (i.e., with filter F2). Filter F2 does not seem to remarkably mitigate the effects of the normative noise.
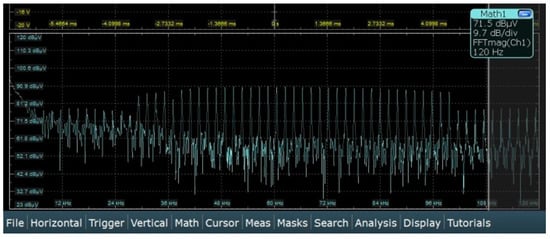
Figure 30.
Spectral signal without PRIME communications in test N2.
Figure 31 shows the spectral signal measured in phase R for test N3 (i.e., with filter F4). It can be seen that filter F4 introduces two slight dips inside the train of impulses of the normative noise, as expected from its frequency response (c.f., Figure 21).
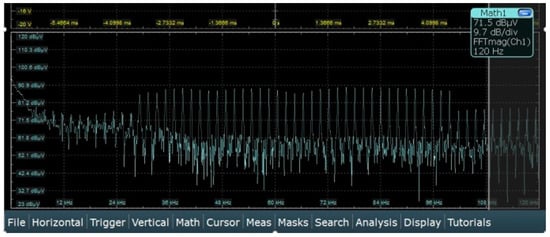
Figure 31.
Spectral signal without PRIME communications in test N3.
Tests N4 to N6 use the same filter configuration: F6. However, by switching S6 on (c.f., Figure 19), the capacitor in the left side of the superior branch is increased in test N5 and, by switching both S6 and S1 on, the value of both capacitors in the superior branch is increased in test N6. Figure 32 shows that the regular configuration of F6 introduces a dip inside the train of impulses of the normative noise.
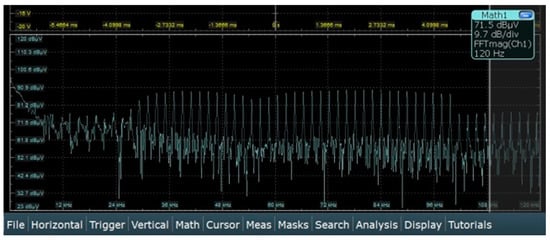
Figure 32.
Spectral signal without PRIME communications in test N4
In Figure 33 and Figure 34, it can be observed that such a dip moves towards the beginning of the PRIME frequency band as the values of the capacitors increase.
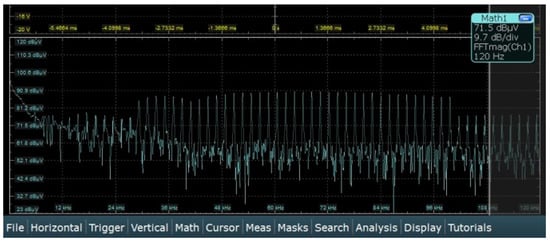
Figure 33.
Spectral signal without PRIME communications in test N5.
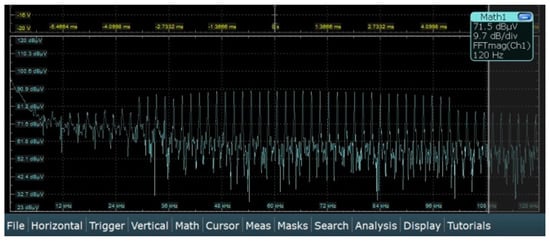
Figure 34.
Spectral signal without PRIME communications in test N6.
Finally, Figure 35 shows the spectral signal measured in phase R for test N7 (i.e., with filter F9). It can be seen that filter F9 removes the normative noise within the PRIME frequency band.
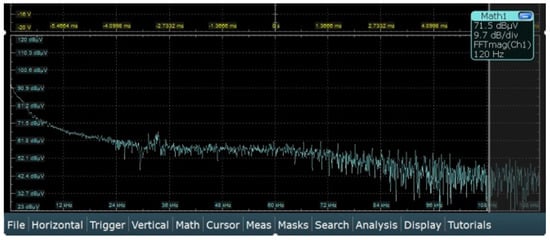
Figure 35.
Spectral signal without PRIME communications in test N7.
6.2. Antenna Noise Tests
These tests, as the ones described in previous Section 6.1, are part of the synthetic noise injection tests, so the same setup in used (Figure 24). The signal injected in this case is shown in Figure 8. This signal has peaks in frequencies of 41.5 and 83 kHz, reaching 95 and 100 dBuV respectively.
The main goal of these tests is twofold: (1) evaluate the increase of the noise when the gain of the amplifier reaches its maximum value; and (2) evaluate the effectiveness of a simple and cheap filter configuration such as filter F2 to mitigate the noise in this situation.
This set of tests comprises from test A1 to A6. From A1 to A3, the gain of the amplifier is set to 25% and, from A4 to A6, it is set to the maximum.
Figure 36 shows the spectral signal measured for test A1. It can be seen that the peaks reach level slightly higher than 90 and 100 dBuV respectively. The communications signal is between 90 and 100 dBuv, as in previous Section 6.1.
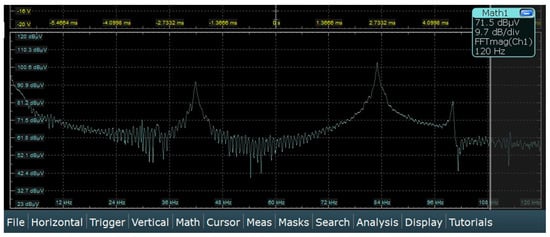
Figure 36.
Spectral signal without PRIME communications in test A1.
In tests A2 and A3, the same filter configuration F2 is used. The difference is that in test A3 the value of the capacitor of the filter is increased by switching S6 on (c.f., Figure 19). Figure 37 and Figure 38 show the spectral signal measured for tests A2 and A3 respectively. It can be seen that the filters achieve reducing the peaks of the noise down to 90 and 100 dBuV respectively.
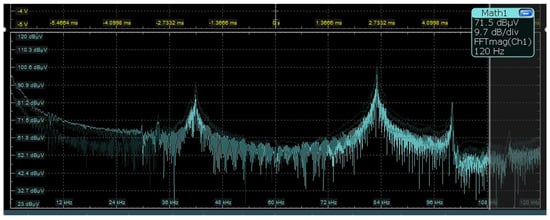
Figure 37.
Spectral signal without PRIME communications in test A2.
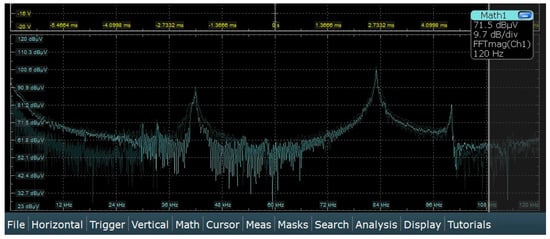
Figure 38.
Spectral signal without PRIME communications in test A3.
Like test A1, A4 consists of the injection of the community antenna noise without filtering, but in this case the gain of the amplifier is set to the maximum. Figure 39 shows that, as a result, the peaks of the noise are increased up to 100 and 115 dBuv respectively.
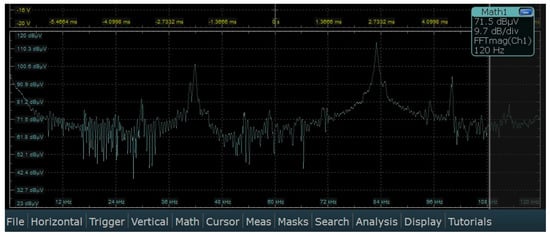
Figure 39.
Spectral signal without PRIME communications in test A4.
Tests A5 and A6 are analogous to tests A2 and A3 but with the gain of the amplifier configured to its maximum value. Based on Figure 40 and Figure 41, the filters do not seem to remarkably reduce the peaks of the noise in this case.
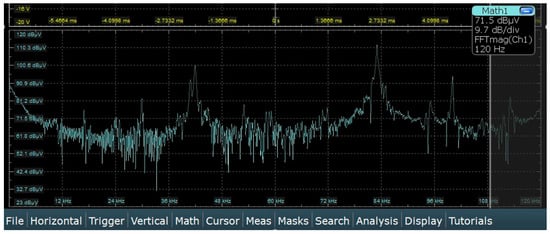
Figure 40.
Spectral signal without PRIME communications in test A5.
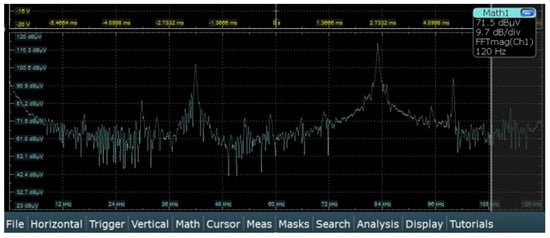
Figure 41.
Spectral signal without PRIME communications in test A6.
6.3. Electric Vehicle Noise Tests
These tests have been carried out at the LINTER following the setup shown in Figure 26 and correspond to tests IDs EV1 and EV2 in Table 3.
The main goal of these tests is to evaluate the effectiveness of a simple and cheap filter configuration such as filter F2 to mitigate the noise introduced by charging an EV (notably, a Nissan LEAF). The used charging station has a three-phase supply and it is connected to a three-phase meter. However, the charge work in single-phase mode (8 Amperes in phase R).
Figure 42 shows the spectral signal measured for test EV1 (i.e., without using the filter). It can be seen that the peaks within the PRIME frequency band reach levels slightly higher than 90 dBuV and between 80 and 90 dBuV respectively. The communications signal is between 90 and 100 dBuv, as in previous sections.
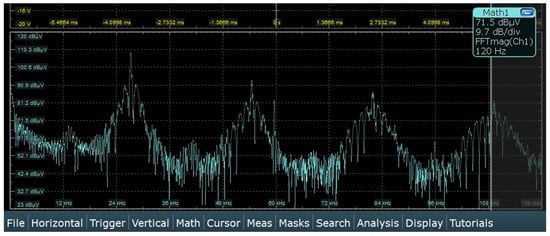
Figure 42.
Spectral signal without PRIME communications in test EV1.
Figure 43 shows the spectral signal measured for test EV2 (i.e., introducing filter F2 with switch S6 on—to increase the value of the capacitor—in phase R). It can be seen that the filter remarkably mitigates the noise, reducing the peaks in the PRIME frequency band down to around 80 dBuV and around 71.5 dBuV respectively.
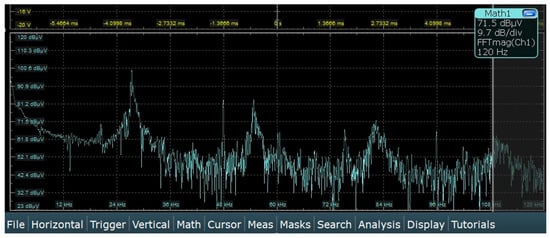
Figure 43.
Spectral signal without PRIME communications in test EV2.
6.4. Photovoltaic Inverter Noise Tests
These tests have been carried out at the LINTER following the setup shown in Figure 27 and correspond to test IDs PVI1 and PVI2 in Table 3.
The main goal of these tests is to evaluate the effectiveness of the commercial filter Spica Strike [], available at the LINTER, to mitigate the noise introduced by the PV inverters. To be more precise, the PV system has two filters (for the R and S phases, the T phase is not filtered) installed in the AC outputs of the inverters; the effect of removing the filter in the R phase will be checked by comparing the result without and with filter.
Figure 44a shows the spectral signal measured for test PVI1 (i.e., without using the filter) and Figure 44b shows the spectral signal measured for test PVI2 (i.e., with the filter in phase R). Comparing both figures, it can be observed that the filter remarkably mitigates the effects of the noise, being especially effective as the frequency increases.
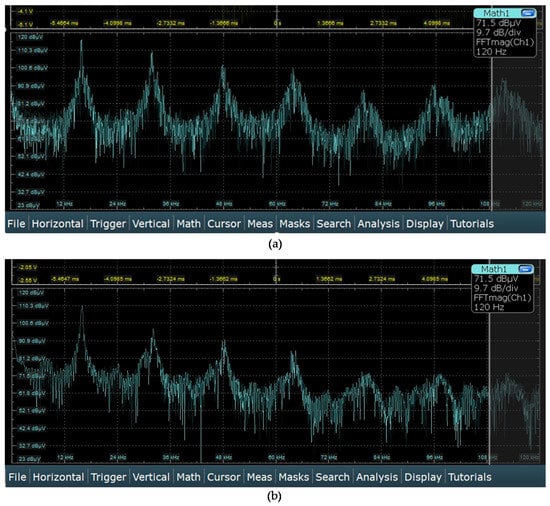
Figure 44.
(a) Spectral signal without PRIME communications in test PVI1 (without filter); (b) Spectral signal without PRIME communications in test PVI2 (with filter).
7. Traffic Traces Analysis
7.1. Basis of the Traffic Analysis Tool PRIME Analytics
PRIME Analytics [] is a cutting-edge software tool, developed within the scope of the OSIRIS project, which aims to assist DSO to remotely diagnose communications problems in their operative NBPLC PRIME networks by analyzing reports and logs provided by the deployed data concentrators. Figure 45 shows an overview of how PRIME Analytics works. Notably, it takes as input the standard topology report S11, a log with topology events and a log with traffic traces, and provides as output a set of graphs and processed data. Based on such processed data, network forensics analysis are made to determine whether a scenario is problematic from communications perspective or not, and to answer typical forensics questions in case it is problematic, such as why, where, and who.
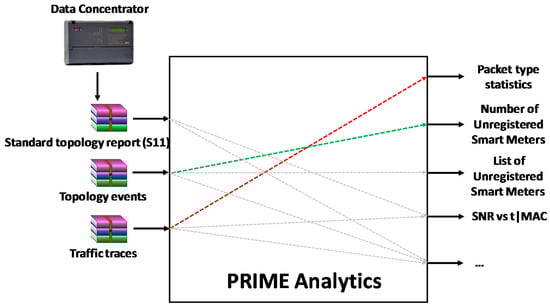
Figure 45.
PRIME Analytics simplified schema.
In this study, two parameters, obtained from the output of PRIME Analytics, are considered as figures of merit to evaluate the impact of the noise sources in PRIME communications and the effectiveness of the filter to mitigate such an impact:
- Ratio between ALV_B and ALV_S (ALV_B/S): As Figure 45 shows, PRIME Analytics provides statistics of packet types based on the traffic traces log. The analysis performed in this study focuses on two types of packets in particular: ALV_B and ALV_S. ALV_B refers to the keep-alive messages that the data concentrator (the Base node in PRIME terminology) sends to the smart meters. The ALV_S refers to the answers of the smart meters (the Service nodes in PRIME terminology) to the keep-alive messages from the concentrator. The concentrator has independent counters to keep track of the number of ALV_B and ALV_S messages sent to and received from each smart meter. These counters are used to obtain statistics on the quality of the communications with each smart meter, as well as to proceed to unregister a smart meter from the network when the difference between them exceeds a given threshold. In addition, the concentrator configures a specific keep-alive timeout at each smart meter and, whenever any smart meter does not receive any ALV_B message during such a timeout, it proceeds to unregister from the network. Furthermore, if the smart meter is connected with the concentrator through one or more switches, the switch(es) would process the unregistration message, proceeding to remove that smart meter from their forwarding table. Therefore, the higher the difference between the ALV_B and ALV_S, the worse the conditions of the communications network, since this indicates that either the ALV_B messages or the ALV_S got lost. In the ideal situation, where no messages get lost, each ALV_B sent by the concentrator would be answered with the corresponding ALV_S sent by the appropriate smart meter, so the ratio between these two types of messages would be 1.
- Number of unregistered nodes: whenever a smart meter is unregistered from the network (no matter if the procedure is triggered by the concentrator or by the smart meter), the concentrator make a note of such an event in the topology event log. Therefore, by processing such a topology event log, PRIME Analytics calculates the overall number of unregistered nodes. This parameter is used in this study since it reflects the performance of the network: the higher the number of unregistered nodes, the worse the performance of the network. It should be noted that if the same smart meter unregisters from the network, registers to the network and unregisters again during the same test, both unregistrations count, since this provides indeed an idea of how harsh the communications are.
7.2. Normative Noise Tests
Figure 46 shows the results obtained for the normative noise tests. Test N7 (where filter F9 was used) is not considered since the logs were not recorded by mistake. Nevertheless, based on the spectral measurements (Figure 35), F9 clearly outperformed the rest of the filter configurations in terms of removing the noisy signal. Apart from this, Figure 46 shows that test N1 (where no filter was used) is the worst situation from the communications perspective, as it could be expected. Filter configuration F4 (used in N3) shows the worst performance in this scenario, followed by filter configuration F2 (used in N2). Filter configuration F6 (used in tests from N4 to N6) shows the best performance. In addition, it can be observed that the communications work better as the capacitors in the upper branch of F6 increase and so the dip within the series of noisy pulses move to the beginning of the PRIME frequency band. These results may be related with the fact that PRIME uses DBPSK (c.f., Section 2.2), so the first carrier of the OFDM symbol transmits a well-known value agreed by transmitter and receiver which is used as reference for the subsequent frequency shifts, and invites to conclude that protecting the lower part of the PRIME frequency band yields better communications performance.
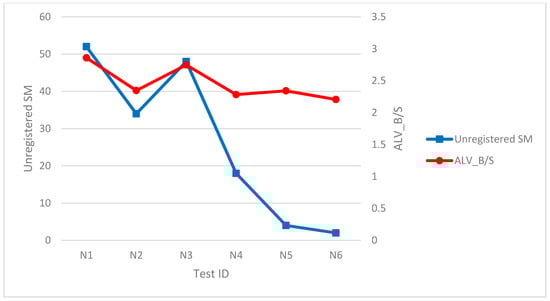
Figure 46.
Traffic traces analysis for the normative noise tests.
7.3. Antenna Noise Tests
Figure 47 shows the results obtained for the antenna noise tests. It shows that these tests can be classified into two main groups: (1) tests from A1 to A3, where the gain of the amplifier was set to 25% of its maximum; and (2) tests from A4 to A5, where the gain of the amplifier was set to its maximum. In the first group, based on the number of unregistered nodes, it seems that the filter configuration used (F2) performs better when the capacitor increases and the frequency dip move towards the beginning of the PRIME frequency band, as in the previous case. In the second group, based on Figure 47, the filter does not seem to be effective, as it was also observed in the spectral measurements (Figure 40 and Figure 41).
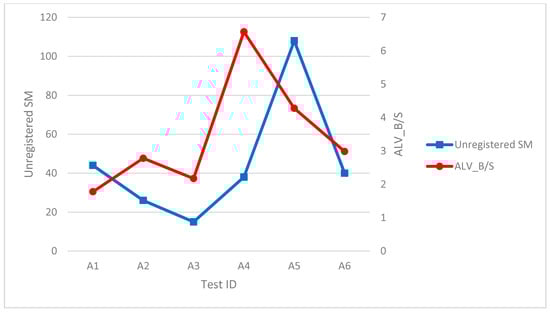
Figure 47.
Traffic traces analysis for the antenna noise tests.
7.4. Electric Vehicle Noise Tests
Figure 48 shows the results of the EV noise tests. It can be seen that the use of filter configuration F2 with switch S6 on to increase the value of the capacitor improves the network performance both in terms of ALV_B/S and number of unregistered smart meters, which agrees with the spectral measurements (Figure 42 and Figure 43).
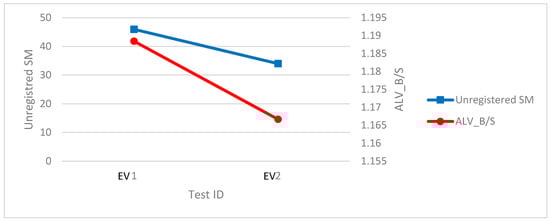
Figure 48.
Traffic traces analysis for the EV noise tests.
7.5. Photovoltaic Inverter Noise Tests
Figure 49 shows the results of the PV inverter tests. First, it can be observed that the noise introduced by the PV inverter remarkably hampers the network performance. However, the commercial filter available in the LINTER proves to effectively mitigate the noise effects, which also agrees with the spectral measurements (Figure 44).
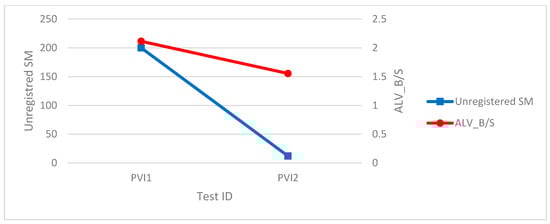
Figure 49.
Traffic traces analysis for the PV inverter noise tests.
8. Discussion
Communications networks are of capital importance in Smart Grids. PLC technologies are especially relevant in these scenarios since they provide benefits to DSO, such as that they use the power lines themselves as communications medium, so deployment costs are dramatically reduced. In particular, NBPLC technologies are being widely used in the “last mile” or NAN of many AMI deployments especially in Europe, since they fit the characteristics of European low voltage networks and meet the communications requirements of the application. All these NBPLC technologies operate in the CENELEC A band (between 35 and 90 kHz), where a wide range of devices radiate unwanted emissions mainly due to their power electronics. As a result, the frequency disturbances in the range from 2 to 150 kHz (the so-called supraharmonics) have become a hot topic both in research and standardization [,]. Hence, some recent research works have investigated the effects associated to consumer electronics [], to PV inverters [,] or to EV charging [] in this frequency range.
However, there are just a few studies that investigate the effects of such unwanted emissions in the NBPLC network performance based on actual experiments and measurements. Reference [] presents a great study along this research line, addressing the impact of several DER (namely, hydropower turbine and pump, PV inverters, and storage equipment) on NBPLC PRIME communications based on a set of experiments carried out at the Spanish CEDER (Center for the Development of Renewable Energies). Reference [] also addresses this issue by investigating the impact of changes in impedance related to PV production on the quality transmission of FSK NBPLC networks by means of field measurements, simulations and measurements taken from a simple laboratory setup.
This paper represents another contribution along this research line, presenting some features which stand out among current state of the art. The overview of noises in NBPLC networks represents a very comprehensive study, including normative noises, noises coming from consumer electronics that prevent actual operational PRIME networks from working properly, as well as noises coming from PV inverters and EV charging. In addition, the paper reviews different noise mitigation techniques, paying special attention to passive filters, which is in practice the preferred solution of DSO for this purpose, with the main aim of coming up with a filter that presents a fair enough performance and can be massively deployed. Thus, based on a set of experiments carried out in the LINTER of Unión Fenosa Distribución and using own-developed hardware and software tools (namely, a configurable filter and the network forensics tool PRIME Analytics []), the paper also evaluates the impact of some relevant sources of noise on PRIME communications, together with the effectiveness of different passive filter configurations to mitigate such an impact.
The analysis of the traffic traces performed with PRIME Analytics shows that the considered sources of noise affect to PRIME network performance to different extent, provoking certain instabilities.
The spectral measurements show that the most effective filter configuration in terms of mitigating the noise is filter 9 (a low pass differential-type filter which presents an attenuation in PRIME band of more than 48 dB, c.f., Figure 23 and Figure 35). However, this type of filter has an important drawback: it does not allow the reconnection of the breaker (power control) embedded in the smart meter by infinitive impedance detection because the filter presents a low capacitive impedance at 50 Hz if the capacity to neutral is not controlled. This problem could be solved by using an active element, but DSO are reluctant to this option since it increases the complexity of managing the filter (e.g., the active element may fail, consumes energy, and requires certain maintenance tasks). Therefore, the application of this filter is bounded to those locations where breakers are not used or the reconnection is manual.
Based on the spectral measurements and on the traffic analysis, filter F6 shows a remarkable performance without presenting the aforementioned problem. Filter F2 also proves to be a simple and cheap solution that works properly in the considered scenarios, thus representing a great option for massive deployment.
In the assessment of both filter F6 and F2, it is observed that when the value of the capacitor increases and so the notch of the filter moves towards the beginning of the PRIME frequency band, PRIME network performance improves, which fits the fact that DBPSK is used.
Finally, the commercial filter used in the LINTER to mitigate the effects of the PV inverters also shows a great performance based on both the spectral measurements and the traffic analysis.
9. Conclusions
This paper presents a comprehensive study of noise sources, their effects and countermeasures in NBPLC PRIME networks. The topic is addressed from a practical perspective. First, the paper presents a set of noises both generated synthetically (normative noises) and measured in the field (noises coming from consumer electronic devices) or in the LINTER of Unión Fenosa Distribución (noises coming from EV charging spots and PV inverters). Next, the paper presents a practical analysis of noise effects and mitigation based on actual tests carried out in the LINTER, where representative noise sources and different passive filter configurations are considered with the main aim of coming up with a filter that combats common noises in the “last mile” of AMI reasonably well and could be massively deployed. Thus, the data gathered in these test is used to evaluate the impact of the considered noises and the effectiveness of the considered filters in PRIME network performance. This work relies mainly on the configurable filter and the network forensics tool PRIME Analytics developed within the scope of the Spanish R&D project OSIRIS.
The presented analysis shows that filter F9 outperforms the rest of the filters. However, this filter does not allow the reconnection of the breaker (power control) embedded in the smart meter by infinitive impedance detection, making it inappropriate for many in-field deployments. Filter F6 and filter F2 also show reasonable performance, filter F2 especially representing a great option for massive deployments due to its simplicity and cost. The analysis also shows that protecting the beginning of the PRIME frequency band seems to improve PRIME network performance, which fits with the fact that DBPSK is used.
The noise measurements presented in this paper represents a contribution themselves, since they can be used for the development of novel theoretical models or for running simulations that enable further improving the performance of NBPLC networks in the presence of DER.
Acknowledgments
This work has been partly funded by the Spanish Ministry of Economy and Competitiveness through the National Program for Research Aimed at the Challenges of Society under the project OSIRIS (RTC-2014-1556-3) and through the network of excellence REDYD2050 (ENE2015-70032-REDT). The authors would like to thank all the partners in the OSIRIS project and REDYD2050. The authors would like to especially thank: Eutimio Sánchez (Unión Fenosa Distribución), Alejandro Mulas (Unión Fenosa Distribución) Miguel Seijo (Universidad Carlos III de Madrid), and Mario Sanz (Universidad Carlos III de Madrid) for their support during the lab tests; and Pedro Moura (University of Coimbra) and Javier Matanza (ICAI School of Engineering) for their help and valuable comments while reviewing the paper. Finally, the authors would also like to thank Energies reviewers for the valuable comments to improve the quality of the paper.
Author Contributions
All authors have coordinately worked in the different parts of the article.
Conflicts of Interest
The authors declare no conflict of interest.
Acronyms
| AMI | Advanced Metering Infrastructure |
| ARQ | Automatic Repeat request |
| BPL | Broadband over Power Line |
| CE | European Conformity |
| CFP | Contention Free Period |
| COSEM | Companion Specification for Energy Metering |
| CSMA-CA | Carrier Sense Multiple Access with Collision Avoidance |
| DBPSK | Differential Binary Phase Shift Keying |
| DER | Distributed Energy Resources |
| DG | Distributed Generation |
| DLL | Data Link Layer |
| DLMS | Device Language Message Specification |
| DR | Demand Response |
| DSO | Distribution System Operator |
| EMC | ElectroMagnetic Compatibility |
| EMI | ElectroMagnetic Interference |
| EU | European Union |
| EV | Electric Vehicle |
| FAN | Field Area Network |
| FEC | Forward Error Correction |
| FSK | Frequency-Shift Keying |
| LINTER | Grid Interoperability Laboratory |
| MAC | Medium Access Control |
| MDMS | Meter Data Management System |
| NAN | Neighborhood Area Network |
| NB | Narrowband |
| OFDM | Orthogonal Frequency Division Multiplexing |
| PDU | Packet Data Unit |
| PHY | PHYsical layer |
| PLC | PowerLine Communications |
| PN | Promotion Needed |
| PRIME | PoweRline Intelligent Metering Evolution |
| PSD | Power Spectral Density |
| QoS | Quality of Service |
| R&D | Research & Development |
| SCP | Shared Contention Period |
| SS | Secondary Substation |
| TWACS | Two-Way Automatic Communications System |
| UNB | Ultra-Narrowband |
| VDSL | Very-high-bit-rate Digital Subscriber Line |
References
- International Energy Agency. Technology Roadmap: Smart Grids. 2015. Available online: https://www.iea.org/publications/freepublications/publication/TechnologyRoadmapHow2GuideforSmartGridsinDistributionNetworks.pdf (accessed on 14 July 2017).
- López, G.; Moura, P.S.; Custodio, V.; Moreno, J.I. Modeling the neighborhood area networks of the smart grid. In Proceedings of the 2012 IEEE International Conference on Communications (ICC), Ottawa, ON, Canada, 10–15 June 2012; pp. 3357–3361. [Google Scholar]
- EURELECTRIC. Power Distribution in Europe: Facts & Figures. 2013. Available online: http://www.eurelectric.org/media/113155/dso_report-web_final-2013-030-0764-01-e.pdf (accessed on 14 July 2017).
- Depuru, S.S.S.R.; Wang, L.; Devabhaktuni, V. Smart meters for power grid: Challenges, issues, advantages and status. Renew. Sustain. Energy Rev. 2011, 15, 2736–2742. [Google Scholar] [CrossRef]
- Uribe-Perez, N.; Hernandez, L.; de la Vega, D.; Angulo, I. State of the Art and Trends Review of Smart Metering in Electricity Grids. Appl. Sci. 2016, 6, 68. [Google Scholar] [CrossRef]
- Andreadou, N.; Guardiola, M.; Fulli, G. Telecommunication Technologies for Smart Grid Projects with Focus on Smart Metering Applications. Energies 2016, 9, 375. [Google Scholar] [CrossRef]
- Siano, P. Demand Response and Smart Grids: A survey. Renew. Sustain. Energy Rev. 2014, 30, 461–478. [Google Scholar] [CrossRef]
- European Comission. Cost-Benefit Analyses & State of Play of Smart Metering Deployment in the EU-27; European Comission: Brussels, Belgium, 2014. [Google Scholar]
- Mahmood, A.; Javaid, N.; Razzap, S. A review of wireless communications for Smart Grids. Renew. Sustain. Energy Rev. 2015, 41, 248–260. [Google Scholar] [CrossRef]
- Galli, S.; Scaglione, A.; Wang, Z. For the Grid and Through the Grid: The Role of Power Line Communications in the Smart Grid. Proc. IEEE 2011, 99, 998–1027. [Google Scholar] [CrossRef]
- Cano, C.; Pittolo, A.; Malone, D.; Lampe, L.; Tonello, A.M.; Dabak, A.G. State of the Art in Power Line Communications: From the Applications to the Medium. IEEE J. Sel. Areas Commun. 2016, 34, 1935–1952. [Google Scholar] [CrossRef]
- Sharma, K.; Saini, L.M. Power-line communications for smart grid: Progress, challenges, opportunities and status. Renew. Sustain. Energy Rev. 2017, 67, 704–751. [Google Scholar] [CrossRef]
- Lopez, G.; Moreno, J.I.; Amarıs, H.; Salazar, F. Paving the road toward Smart Grids through large-scale advanced metering infrastructures. Electr. Power Syst. Res. 2015, 120, 194–205. [Google Scholar] [CrossRef]
- Hensen, C.; Schulz, W. Time dependence of the channel characteristics of low voltage power-lines and its effects on hardware implementation. AEU Int. J. Electron. Commun. 2000, 54, 23–32. [Google Scholar]
- Zimmermann, M.; Dostert, C. A multipath model for the power-line channel. IEEE Trans. Commun. 2002, 50, 553–559. [Google Scholar] [CrossRef]
- Galli, S.; Banwell, T. A novel approach to the modeling of the indoor power line channel—Part II: Transfer function and its properties. IEEE Trans. Power Deliv. 2005, 20, 1869–1878. [Google Scholar] [CrossRef]
- Oh, H.M.; Choi, S.; Kim, Y.; Lee, J.J.; Whang, K.C. A Systematic Approach to Analyzing Multipath Parameters from PLC Channel Response. IEEE Trans. Power Deliv. 2008, 23, 1921–1929. [Google Scholar]
- Middleton, D. Statistical-physical model of electromagnetic interference. IEEE Trans. Electromagn. Compat. 1977, 19, 106–126. [Google Scholar] [CrossRef]
- Hooijen, O.G. On the channel capacity of the residential power circuit used as digital communications medium. IEEE Commun. Lett. 1998, 2, 267–268. [Google Scholar] [CrossRef]
- Zimmermann, M.; Dostert, C. Analysis and modeling of impulsive noise in broadband powerline communications. IEEE Trans. Electromagn. Compat. 2002, 44, 249–258. [Google Scholar] [CrossRef]
- Benyoucef, D. A new statistical model of the noise power density spectrum for powerline communication. In Proceedings of the 7th ISPLC, Kyoto, Japan, 26–28 March 2003; pp. 136–141. [Google Scholar]
- Andreadou, N.; Pavlidou, F. Modeling the noise on OFDM power-line communications system. IEEE Trans. Power Deliv. 2010, 25, 150–157. [Google Scholar] [CrossRef]
- Cataliotti, A.; Cosentino, V.; di Cara, D.; Guaiana, S.; Panzavecchia, N.; Tine, G. A New Solution for Low-Voltage Distributed Generation Interface Protection System. IEEE Trans. Instrum. Meas. 2015, 64, 2086–2095. [Google Scholar] [CrossRef]
- Artale, G.; Cataliotti, A.; Cosentino, V.; di Cara, D.; Fiorelli, R.; Guaiana, S.; Tine, G. A New Low Cost Coupling System for Power Line Communication on Medium Voltage Smart grids. IEEE Trans. Smart Grid 2016, PP, 1. [Google Scholar] [CrossRef]
- Papadopoulos, T.A.; Papagiannis, G.K.; Dokopoulos, P.S. Low-Voltage Distribution Line Performance Evaluation for PLC Signal Transmission. IEEE Trans. Power Deliv. 2008, 23, 1903–1910. [Google Scholar] [CrossRef]
- Masood, B.; Usman, M.; Gul, M.; Khan, W. Measurements and characterization of power transformer and low voltage access network for NB-PLC. Int. J. Commun. Syst. 2017. [Google Scholar] [CrossRef]
- Kim, M.-S.; Son, D.-M.; Ko, Y.-B.; Kim, Y.H. A simulation study of the PLC-MAC performance using network simulator-2. In Proceedings of the 2008 IEEE International Symposium on Power Line Communications and Its Applications, Jeju City, Korea, 2–4 April 2008; pp. 99–104. [Google Scholar]
- Sanz, A.; Piñero, P.J.; Montoro, D.; Garcia, J.I. High-accuracy distributed simulation environment for PRIME networks analysis and improvement. In Proceedings of the 2012 IEEE International Symposium on Power Line Communications and Its Applications, Beijing, China, 27–30 March 2012; pp. 108–113. [Google Scholar]
- Gogic, A.; Mahmutbegovic, A.; Borovina, D.; Çavdar, İ.H.; Suljanovic, N. Simulation of the narrow-band PLC system implementing PRIME standard. In Proceedings of the 2014 IEEE International Energy Conference (ENERGYCON), Cavtat, Croatia, 13–16 May 2014; pp. 1520–1525. [Google Scholar]
- Matanza, J.; Alexandres, S.; Rodriguez-Morcillo, C. Advanced metering infrastructure performance using European low-voltage power line communication networks. IET Commun. 2014, 8, 1041–1047. [Google Scholar] [CrossRef]
- Larrañaga, J.; Legarda, J.; Urrutia, I.; Sendin, A. An experimentally validated PRIME subnetwork simulation model for utility applications. In Proceedings of the 2015 IEEE International Symposium on Power Line Communications and Its Applications (ISPLC), Austin, TX, USA, 29 March–1 April 2015; pp. 95–100. [Google Scholar]
- Matanza, J.; Kiliccote, S.; Alexandres, S.; Rodríguez-Morcillo, C. Simulation of low-voltage narrow-band power line communication networks to propagate OpenADR signals. J. Commun. Netw. 2015, 17, 656–664. [Google Scholar] [CrossRef]
- Wolkerstorfer, M.; Schweighofer, B.; Wegleiter, H.; Statovci, D.; Schwaiger, H.; Lackner, W. Measurement and simulation framework for throughput evaluation of narrowband power line communication links in low-voltage grids. J. Netw. Comput. Appl. 2016, 59, 285–300. [Google Scholar] [CrossRef]
- Ikpehai, A.; Adebisi, B.; Rabie, K.M.; Haggar, R.; Baker, M. Experimental Study of 6LoPLC for Home Energy Management Systems. Energies 2016, 9, 1046. [Google Scholar] [CrossRef]
- Seijo, M.; López, G.; Matanza, J.; Moreno, J.I. Planning and Performance Challenges in Power Line Communications Networks for Smart Grids. Int. J. Distrib. Sens. Netw. 2016. [Google Scholar] [CrossRef]
- Gonzalez-Sotres, L.; Mateo, C.; Frias, P.; Rodriguez-Morcillo, C.; Matanza, J. Replicability Analysis of PLC PRIME Networks for Smart Metering Applications. In Proceedings of the 2017 IEEE Manchester PowerTech, Manchester, UK, 18–22 June 2017. [Google Scholar]
- PRIME Alliance Official Site. Available online: http://www.prime-alliance.org/ (accessed on 14 July 2017).
- ITU-T, G.9904: Narrowband Orthogonal Frequency Division Multiplexing Power Line Communication Transceivers for PRIME Networks. Available online: https://www.itu.int/rec/T-REC-G.9904-201210-I/en (accessed on 18 August 2017).
- LINTER Official Web Page. Available online: http://www.unionfenosadistribucion.com/en/smart+grids/research+and+development/1297137260045/find+out+about+our+laboratory.html (accessed on 14 July 2017).
- PRIME Analytics. Available online: http://panal.it.uc3m.es/osiris-project/prime-analytics-prime-networks-analyzer-based-on-traffic-traces/ (accessed on 14 July 2017).
- OSIRIS Project Official Web Site. Available online: http://www.proyecto-osiris.com/ (accessed on 14 July 2017).
- Xu, G.; Yim, S.; Kim, I.H.; Pande, T.; Lu, X. Implementation and field test results of a software defined PLC modem. In Proceedings of the 2012 IEEE International Symposium on Power Line Communications and Its Applications, Beijing, China, 27–30 March 2012; pp. 66–71. [Google Scholar]
- Short, T.A. Electric Power Distribution Equipment and Systems; CRC Press: Boca Raton, FL, USA, 2005; ISBN 13 978-0849395765. [Google Scholar]
- Fadlullah, Z.M.; Fouda, M.M.; Kato, N.; Takeuchi, A.; Iwasaki, N.; Nozaki, Y. Toward intelligent machine-to-machine communications in smart grid. IEEE Commun. Mag. 2011, 49, 60–65. [Google Scholar] [CrossRef]
- López, G.; Moura, P.; Moreno, J.; Camacho, J. Multi-Faceted Assessment of a Wireless Communications Infrastructure for the Green Neighborhoods of the Smart Grid. Energies 2014, 7, 3453–3483. [Google Scholar] [CrossRef]
- Rahman, M.M.; Hong, C.S.; Lee, S.; Lee, J.; Razzaque, M.A.; Kim, J.H. Medium access control for power line communications: An overview of the IEEE 1901 and ITU-T G.hn standards. IEEE Commun. Mag. 2011, 49, 183–191. [Google Scholar] [CrossRef]
- Ikpehai, A.; Adebisi, B.; Rabie, K. Broadband PLC for Clustered Advanced Metering Infrastructure (AMI) Architecture. Energies 2016, 9, 569. [Google Scholar] [CrossRef]
- Sendin, A.; Simon, J.; Urrutia, I.; Berganza, I. PLC deployment and architecture for Smart Grid applications in Iberdrola. In Proceedings of the 18th IEEE International Symposium on Power Line Communications and Its Applications, Glasgow, UK, 30 March–2 April 2014; pp. 173–178. [Google Scholar]
- Sendin, A.; Simon, J.; Solaz, M.; Andersson, L.; Maurer, M. MVBPL—Reliable, future proof and cost efficient. In Proceedings of the 23rd International Conference on Electricity Distribution (CIRED), Lyon, France, 15–18 June 2015. [Google Scholar]
- Haidine, A.; Tabone, A.; Müller, J. Deployment of power line communication by European utilities in advanced metering infrastructure. In Proceedings of the 2013 IEEE 17th International Symposium on Power Line Communications and Its Applications, Johannesburg, South Africa, 24–27 March 2013; pp. 126–130. [Google Scholar]
- Sendin, A.; Urrutia, I.; Garai, M.; Arzuaga, T.; Uribe, N. Narrowband PLC for LV smart grid services, beyond Smart Metering. In Proceedings of the 18th IEEE International Symposium on Power Line Communications and Its Applications, Glasgow, UK, 30 March–2 April 2014; pp. 168–172. [Google Scholar]
- Excerpt from Companion Specification for Energy Metering—Architecture and Protocols; DLMS User Association: Zug, Switzerland, 2009.
- Excerpt from COSEM—Identification System and Interface Classes; DLMS User Association: Zug, Switzerland, 2010.
- CENELEC—SC205A: Study Report on Electromagnetic Interference between Electrical Equipment/SYSTEMS in the Frequency Range Below 150 kHz, 2nd ed.; DLMS User Association: Zug, Switzerland, 2013.
- CENELEC—EN 50065-1: Signaling on Low-Voltage Electrical Installations in the Frequency Range 3 kHz to 148.5 kHz—Part 1: General Requirements, Frequency Bands and Electromagnetic Disturbances; DLMS User Association: Zug, Switzerland, 2011.
- IEC—CISPR 15: 2013+AMD1:2015. Limits and Methods of Measurement of Radio Disturbance Characteristics of Electrical Lighting and Similar Equipment; DLMS User Association: Zug, Switzerland, 2015.
- Draft IEC—TS 62578. Power Electronics Systems and Equipment—Technical. Specification: Operation Conditions and Characteristics of Active Infeed Converter Applications Including Recommendations for Emission Limits Below 150 kHz, 2nd ed.; DLMS User Association: Zug, Switzerland, 2012.
- IEC/SC 77A/WG8, Minutes from the ACEC Webinar; DLMS User Association: Zug, Switzerland, 2017.
- ZIV 4PBN Official Site. Available online: https://www.ziv.es/products/communications/networking/at-secondary-substations/prime-base-nodeservice-node-4pbn/ (accessed on 14 July 2017).
- Seijo, M.; López, G.; Moreno, J.I.; Matanza, J.; Alexandres, S.; Rodríguez-Morcillo, C.; Martín, F. Let there be light: Dissecting how PRIME networks work based on actual traffic traces. In Proceedings of the IEEE International Conference on Smart Grid Communications (SmartGridComm), Miami, FL, USA, 2–5 November 2015; pp. 472–477. [Google Scholar]
- Moetronix SpectraVue Official Web Site. Available online: http://www.moetronix.com/spectravue.htm (accessed on 14 July 2017).
- Rabie, K.M.; Alsusa, E. On Improving Communication Robustness in PLC Systems for More Reliable Smart Grid Applications. IEEE Trans. Smart Grid 2015, 6, 2746–2756. [Google Scholar] [CrossRef]
- Caire, G.; Al-Naffouri, T.Y.; Narayanan, A.K. Impulse noise cancellation in OFDM: An application of compressed sensing. In Proceedings of the 2008 IEEE International Symposium on Information Theory, Toronto, ON, Canada, 6–11 July 2008; pp. 1293–1297. [Google Scholar]
- Lampe, L. Bursty impulse noise detection by compressed sensing. In Proceedings of the 2011 IEEE International Symposium on Power Line Communications and Its Applications, Udine, Italy, 3–6 April 2011; pp. 29–34. [Google Scholar]
- Mehboob, A.; Zhang, L.; Khangosstar, J. Adaptive impulsive noise mitigation using Multi Mode Compressive Sensing for powerline communications. In Proceedings of the 2012 IEEE International Symposium on Power Line Communications and Its Applications, Beijing, China, 27–30 March 2012; pp. 368–373. [Google Scholar]
- Matanza, J.; Alexandres, S.; Rodriguez-Morcillo, C. Difference sets-based compressive sensing as denoising method for narrow-band power line communications. IET Commun. 2013, 7, 1580–1586. [Google Scholar] [CrossRef]
- Kim, Y.; Bae, J.N.; Kim, J.Y. Performance of power line communication systems with noise reduction scheme for smart grid applications. IEEE Trans. Consum. Electron. 2011, 57, 46–52. [Google Scholar] [CrossRef]
- Korki, M.; Hosseinzadeh, N.; Moazzeni, T. Performance evaluation of a narrowband power line communication for smart grid with noise reduction technique. IEEE Trans. Consum. Electron. 2011, 57, 1598–1606. [Google Scholar] [CrossRef]
- Sendin, A.; Llano, A.; Arzuaga, A.; Berganza, I. Field techniques to overcome aggressive noise situations in PLC networks. In Proceedings of the 2011 IEEE International Symposium on Power Line Communications and Its Applications, Udine, Italy, 3–6 April 2011; pp. 113–117. [Google Scholar]
- Berganza, I.; Sendin, A.; Arzuaga, A.; Sharma, M.; Varadarajan, B. PRIME on-field deployment First summary of results and discussion. In Proceedings of the 2011 IEEE International Conference on Smart Grid Communications (SmartGridComm), Brussels, Belgium, 17–20 October 2011; pp. 297–302. [Google Scholar]
- Spica Strike Filter Technical Specifications. Available online: http://www.spica.be/strike/ (accessed on 14 July 2017).
- Active Technologies AT-AWG 1102 Signal Generator. Available online: http://www.activetechnologies.it/wp-content/uploads/2016/02/BrochureAT_1102_1104_Web.pdf (accessed on 14 July 2017).
- Probe FCC F-120. Available online: http://www.arbenelux.com/wp-content/uploads/2015/01/DS-F-120-3A-Rev-RLSE_b877.pdf (accessed on 14 July 2017).
- R&S RTE 1022 Digital Oscilloscope. Available online: http://www.testforce.com/Product%20Files/Rohde-Schwarz/RTE.pdf (accessed on 14 July 2017).
- Bollen, M.; Olofsson, M.; Larsson, A.; Rönnberg, S.; Lundmark, M. Standards for supraharmonics (2 to 150 kHz). IEEE Electromagn. Compat. Mag. 2014, 3, 114–119. [Google Scholar] [CrossRef]
- Subhani, S.; Cuk, V.; Coben, J.F.G. A Literature Survey on Power Quality Disturbances in the Frequency Range of 2–150 kHz. In Proceedings of the International Conference on Renewable Energies and Power Quality (ICREPQ’14), Málaga, Spain, 4–6 April 2017. [Google Scholar]
- Rönnberg, S. Emission and Interaction from Domestic Installations in the Low Voltage Electricity Network up to 150 kHz. Ph.D. Thesis, Luleå University of Technology, Luleå, Sweden, 2013. [Google Scholar]
- Klatt, M.; Meyer, J.; Schegner, P.; Koch, A.; Myrzik, J.; Darda, T.; Eberl, G. Emission levels above 2 kHz—Laboratory results and survey measurements in public low voltage grids. In Proceedings of the 22nd International Conference and Exhibition on Electricity Distribution (CIRED 2013), Stockholm, Sweden, 10–13 June 2013; pp. 1–4. [Google Scholar]
- Rönnberg, S.; Bollen, M.; Larsson, A. Emission from small scale PV-installations on the low voltage grid. In Proceedings of the International Conference on Renewable Energies and Power Quality (ICREPQ’14), Cordoba, Spain, 8–10 April 2014. [Google Scholar]
- Schöttke, S.; Meyer, J.; Schegner, P.; Bachmann, S. Emission in the frequency range of 2 kHz to 150 kHz caused by electrical vehicle charging. In Proceedings of the 2014 International Symposium on Electromagnetic Compatibility, Gothenburg, Sweden, 1–4 September 2014; pp. 620–625. [Google Scholar]
- Uribe-Pérez, N.; Angulo, I.; Hernández-Callejo, L.; Arzuaga, T.; de la Vega, D.; Arrinda, A. Study of Unwanted Emissions in the CENELEC-A Band Generated by Distributed Energy Resources and Their Influence over Narrow Band Power Line Communications. Energies 2016, 9, 1007. [Google Scholar] [CrossRef]
- Roggo, D.; Horta, R.; Capponi, L.; Eggenschwiler, L.; Decorvet, F.; Pellodi, C.; Buholzer, F. Electromagnetic interferences in Smart Grid applications: A case study with PLC smart meters and PV energy generation. In Proceedings of the 24th International Conference on Electricity Distribution (CIRED), Glasgow, UK, 12–15 June 2017. [Google Scholar]
© 2017 by the authors. Licensee MDPI, Basel, Switzerland. This article is an open access article distributed under the terms and conditions of the Creative Commons Attribution (CC BY) license (http://creativecommons.org/licenses/by/4.0/).