Article

Do the Different Exergy Accounting Methodologies Provide Consistent or Contradictory Results? A Case Study with the Portuguese Agricultural, Forestry and Fisheries Sector

Marine, Environment and Technology Centre—MARETEC, Department of Mechanical Engineering, Instituto Superior Técnico, Universidade de Lisboa, Avenida Rovisco Pais, 1, 1049-001 Lisbon, Portugal
*
Author to whom correspondence should be addressed.
Energies 2017, 10(8), 1219; https://doi.org/10.3390/en10081219
Submission received: 22 June 2017 / Revised: 24 July 2017 / Accepted: 11 August 2017 / Published: 17 August 2017

Abstract

:
Three exergy accounting approaches are used to evaluate exergy efficiency: the Energy Resources Exergy Accounting (EREA), the Natural Resources’ Exergy Accounting (NREA) and the Extended Exergy Accounting (EEA). To test the consistency of the results provided by these methodologies, we apply them to evaluate the Portuguese agricultural, forestry and fisheries (AFF) sector, from 2000 to 2012. EREA shows an increase of 30% in the efficiency of the Portuguese AFF sector, while NREA and EEA methodologies increases of 27% and 43%, respectively. Although the results are consistent for the AFF sector, the same does not happen in the fisheries subsector, whose exergetic efficiency increases 14% with the EREA but decreases 42% with the NREA approach. The ratio of output to useful exergy reveals that a better thermodynamic efficiency is not translated into a higher energy service efficiency because fishing vessels have to travel more to get the same fish. Thus, results provided by the EREA and NREA approaches are complementary and both are needed to provide a realistic picture of exergy efficiency. On the other hand, results obtained by the EEA approach are dominated by capital and environmental impacts, revealing the disproportionality between material and immaterial inputs in this methodology.

1. Introduction

Sustainable development is the desirable long term goal of bringing humankind to a compromise between its welfare and the protection of our planet. According to Pezzey [1] “A temptation when writing on ‘defining sustainability’ is to try to distill, from the myriad debates, a single definition which commands the widest possible academic consent. However, several years spent in fitful pursuit of this goal have finally persuaded me that it is an alchemist’s dream, no more likely to be found than an elixir to prolong life indefinitely”. Still, the most consensual definition of sustainable development is provided by the Brundtland Report [2]: “Sustainable development is development that meets the needs of the present without compromising the ability of future generations to meet their own needs”.
The sustainability of society is critically dependent on the agricultural, forestry and fisheries (AFF) sector because all mass and energy flows that maintain our society come either directly from the environment or from the energy and mass surpluses obtained in this sector and the resource extraction and energy transformation sectors. The AFF sector provides all the food, feed and fiber and is also a major source of renewable energy resources. According to Committee on Twenty-First Century Systems Agriculture [3], the sustainability of the AFF sector should take into account the environmental, social and economic dimensions:
  • Satisfy human food, feed, and fiber needs, and contribute to biofuels needs.
  • Enhance environmental quality and the resource base.
  • Sustain the economic viability of agriculture.
  • Enhance the quality of life for farmers, farm workers, and society as a whole.
Several efforts have been made in measuring the sustainability of the AFF sector, but the focus is, in most cases, only on one of the pillars of sustainability. The complementary research of both social and economic sustainability dimensions with efficiency and environmental extraction is both scarce and complex since no common unit is easily found and accepted. Also, success in one dimension does not imply the same for the others. The economic viability of an agricultural sector is not directly correlated with the environmental efficiency of the same sector nor the wellbeing of farmers.
Exergy analysis is an assessment methodology that has been used to account for efficiency at several scales, which can be society as a whole, economic sectors or industries. The term efficiency usually reflects a narrow approach that considers only one type of output and input flows. However, an efficiency measure of the AFF sector that would take into account several types of flows, such as the extraction from the environment of renewable and non-renewable resources, undesired output flows such as waste and pollution and the capital and labour flows involved, could present useful insights about its sustainability. Further assessment of other aspects, such as the economic viability of agriculture or the quality of life of farmers, would still be needed for a complete evaluation of sustainability.
Exergy is the maximum amount of work that can be obtained from a system (a resource or a flow) when it is brought to equilibrium with the surrounding environment through a reversible process [4]. One of the key properties of exergy is that it allows the conversion of all inputs and outputs of a process into a common unit, allowing comparisons otherwise impossible.
The first methodology to quantify exergy flows was the energy resources’ exergy accounting (EREA) methodology that started with energy carriers only [5]. Later, natural resources were included [6] in the natural resources’ exergy accounting (NREA) methodology and more recently capital, labour and environmental externalities [7] in the extended exergy accounting (EEA) methodology.
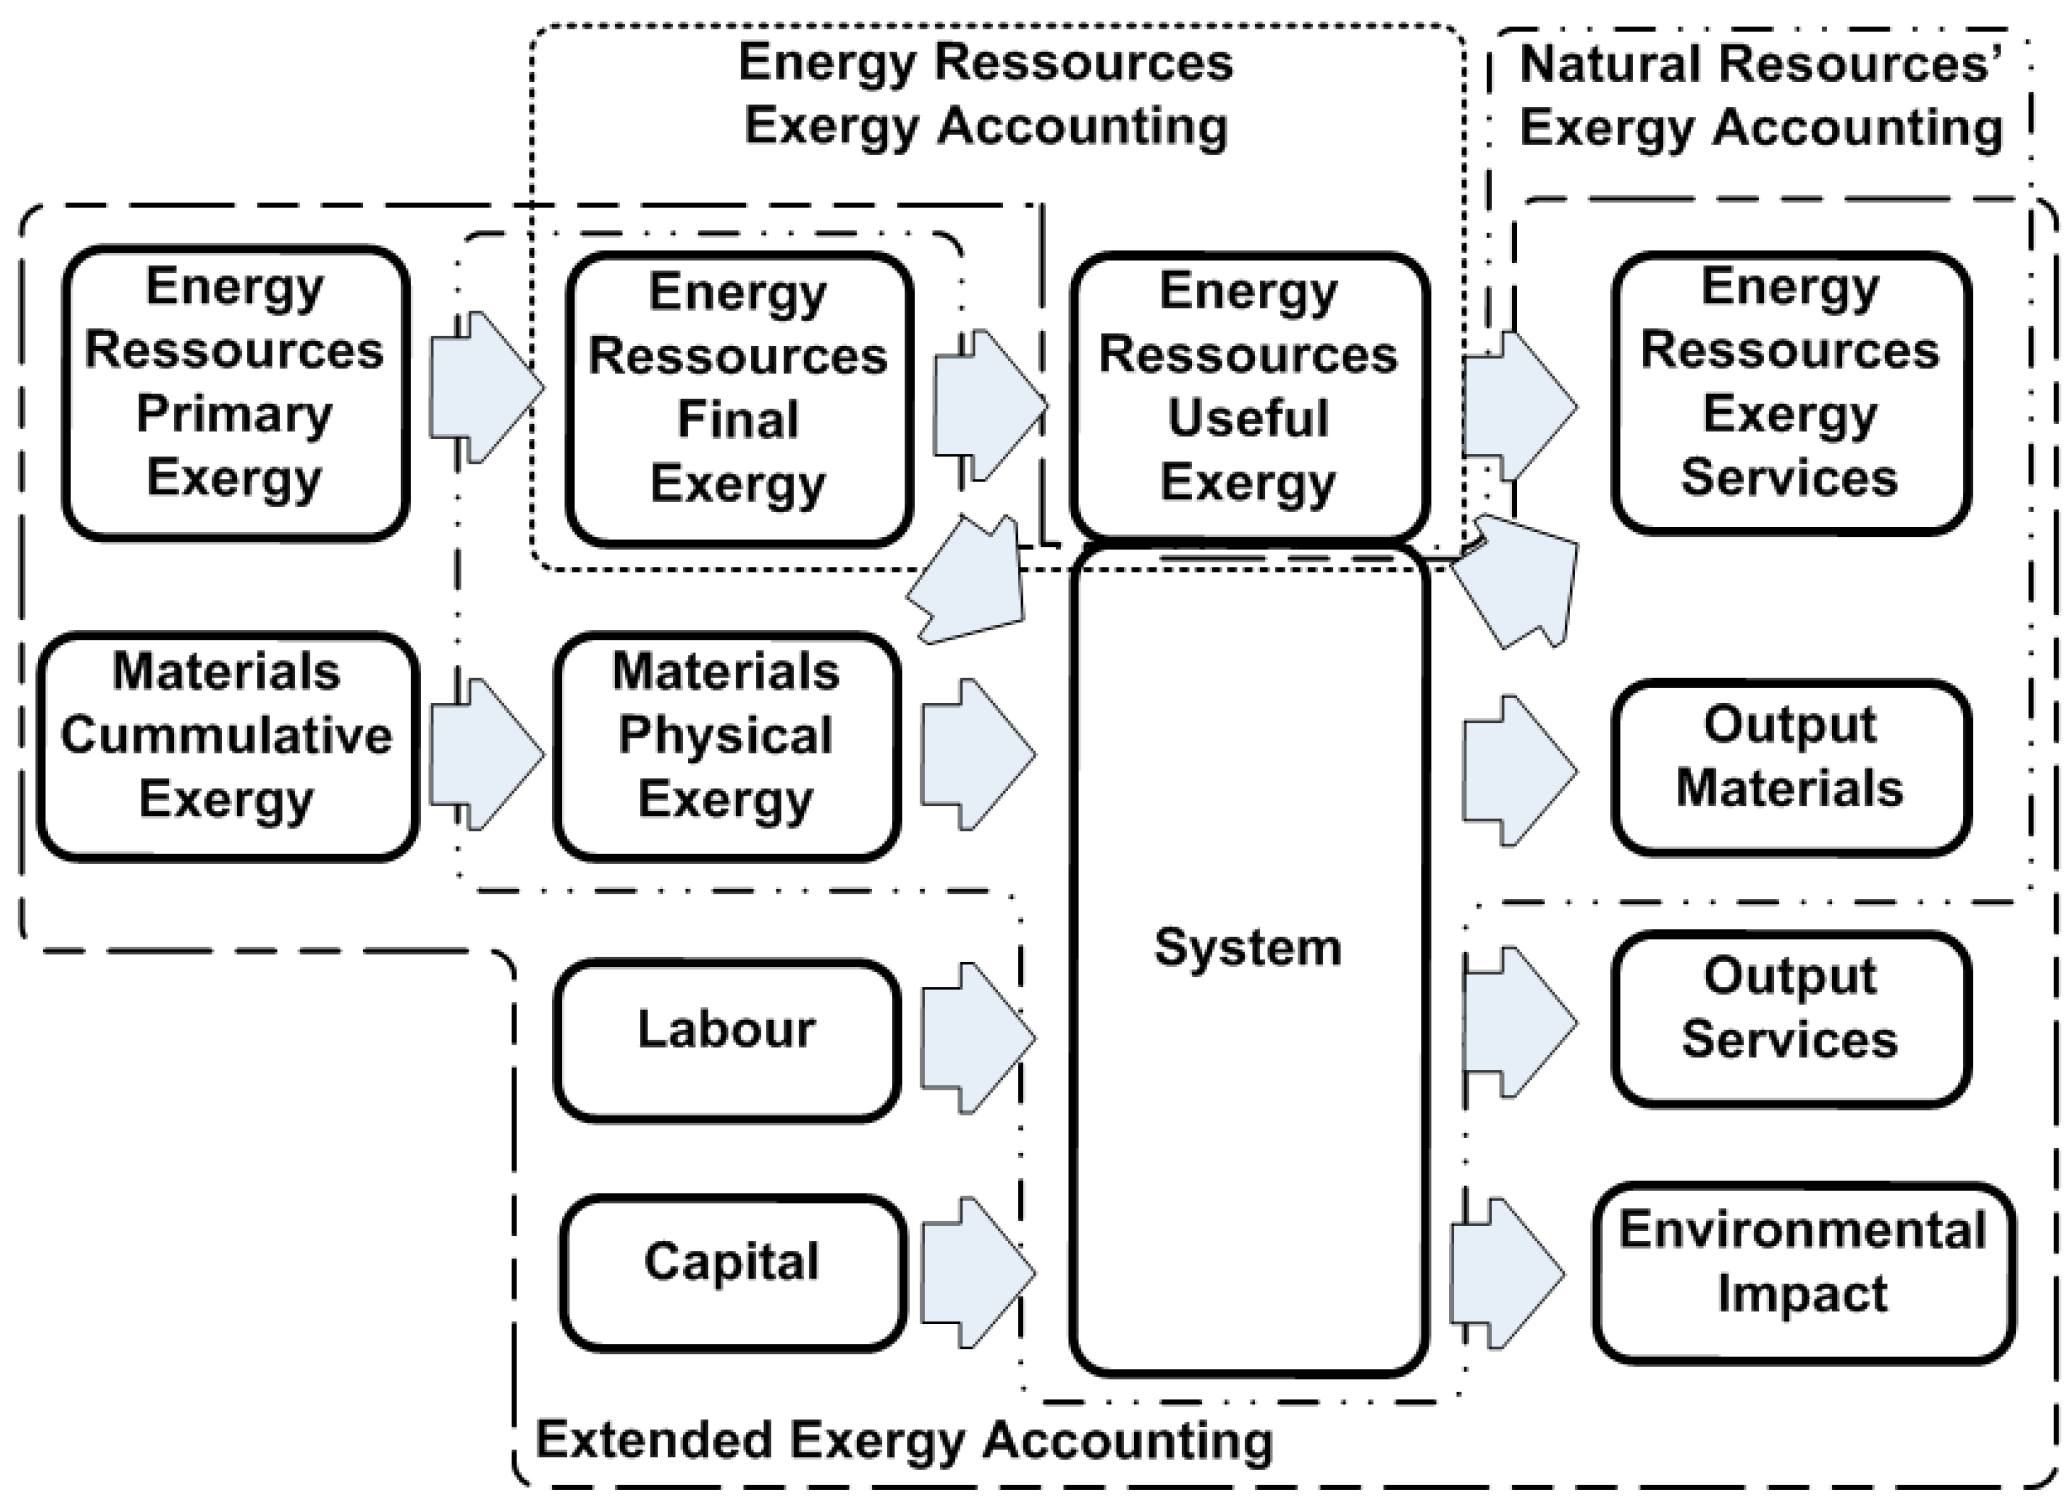
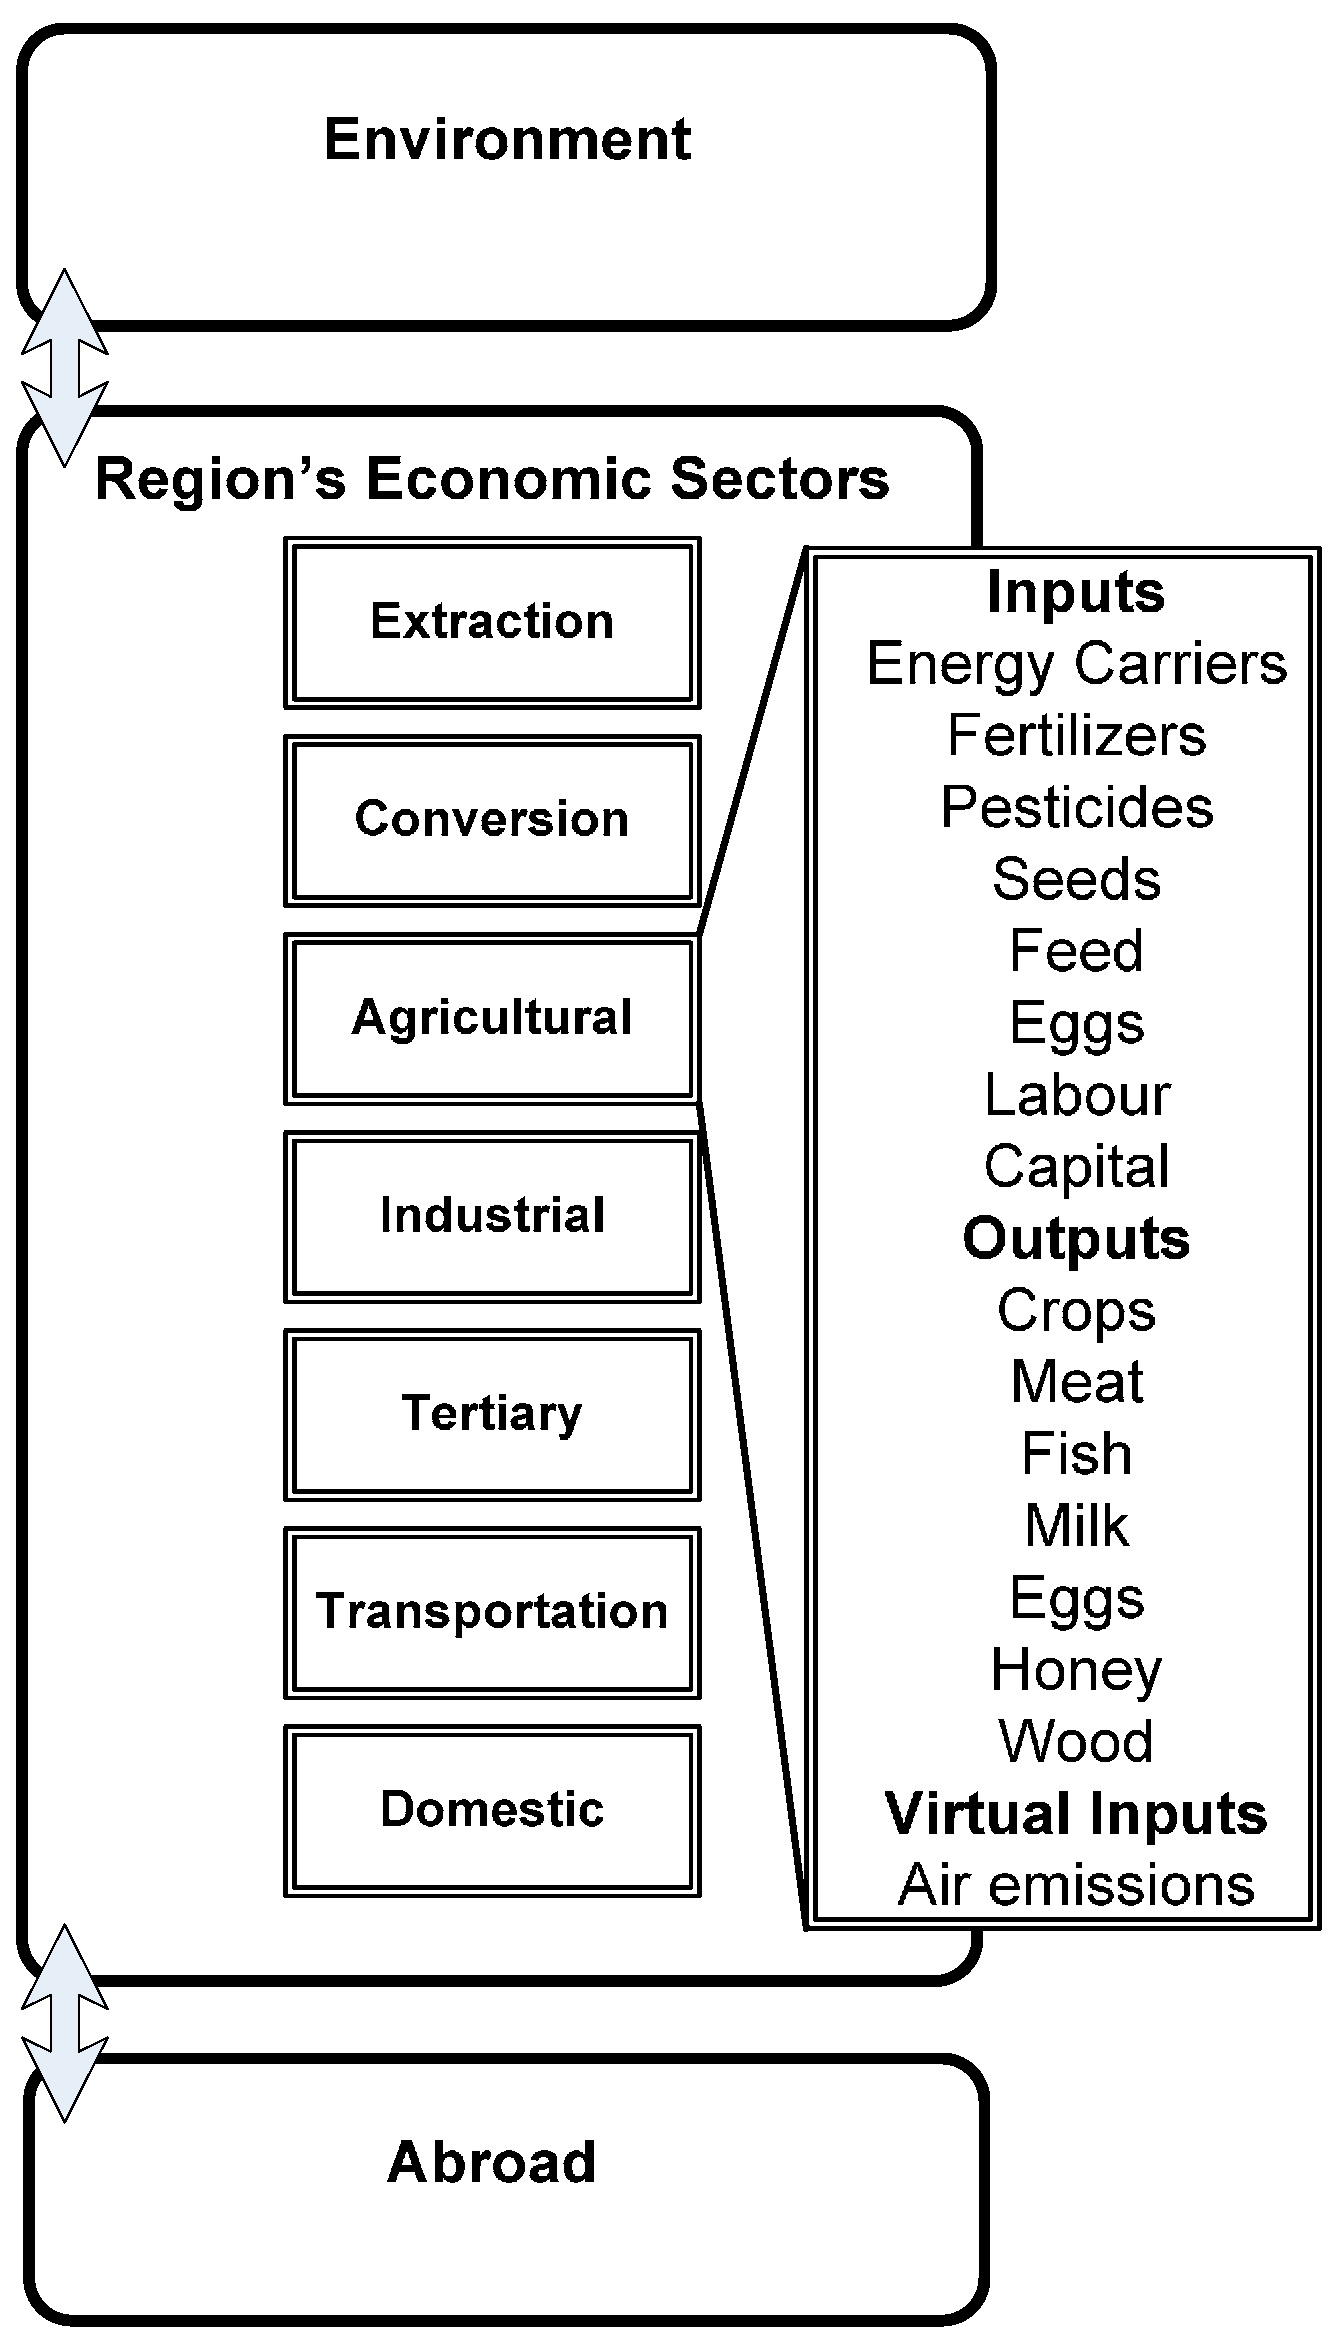
EREA is an input assessment method that measures the exergy embedded (or intrinsic) in the energy carriers used by the transformation devices (inputs) and the useful exergy (outputs) (Figure 1). With EREA is possible to determine how well the system converts the final exergy to useful work from the available energy carriers and transformation devices; this knowledge can then be used to propose measurements to improve the efficiency of the system.
EREA quantifies the useful exergy that is available for each end use, but does not inform on how well that exergy service is being used. To illustrate, consider two similar gasoline vehicles on a highway, the first with only one passenger and the second with five people on board. When assessing both systems by EREA the useful exergy is the same since the energy carrier-end use pairs are the same (gasoline-transportation). However, when measuring the system output, in this case the number of passengers times distance, the performances are widely different.
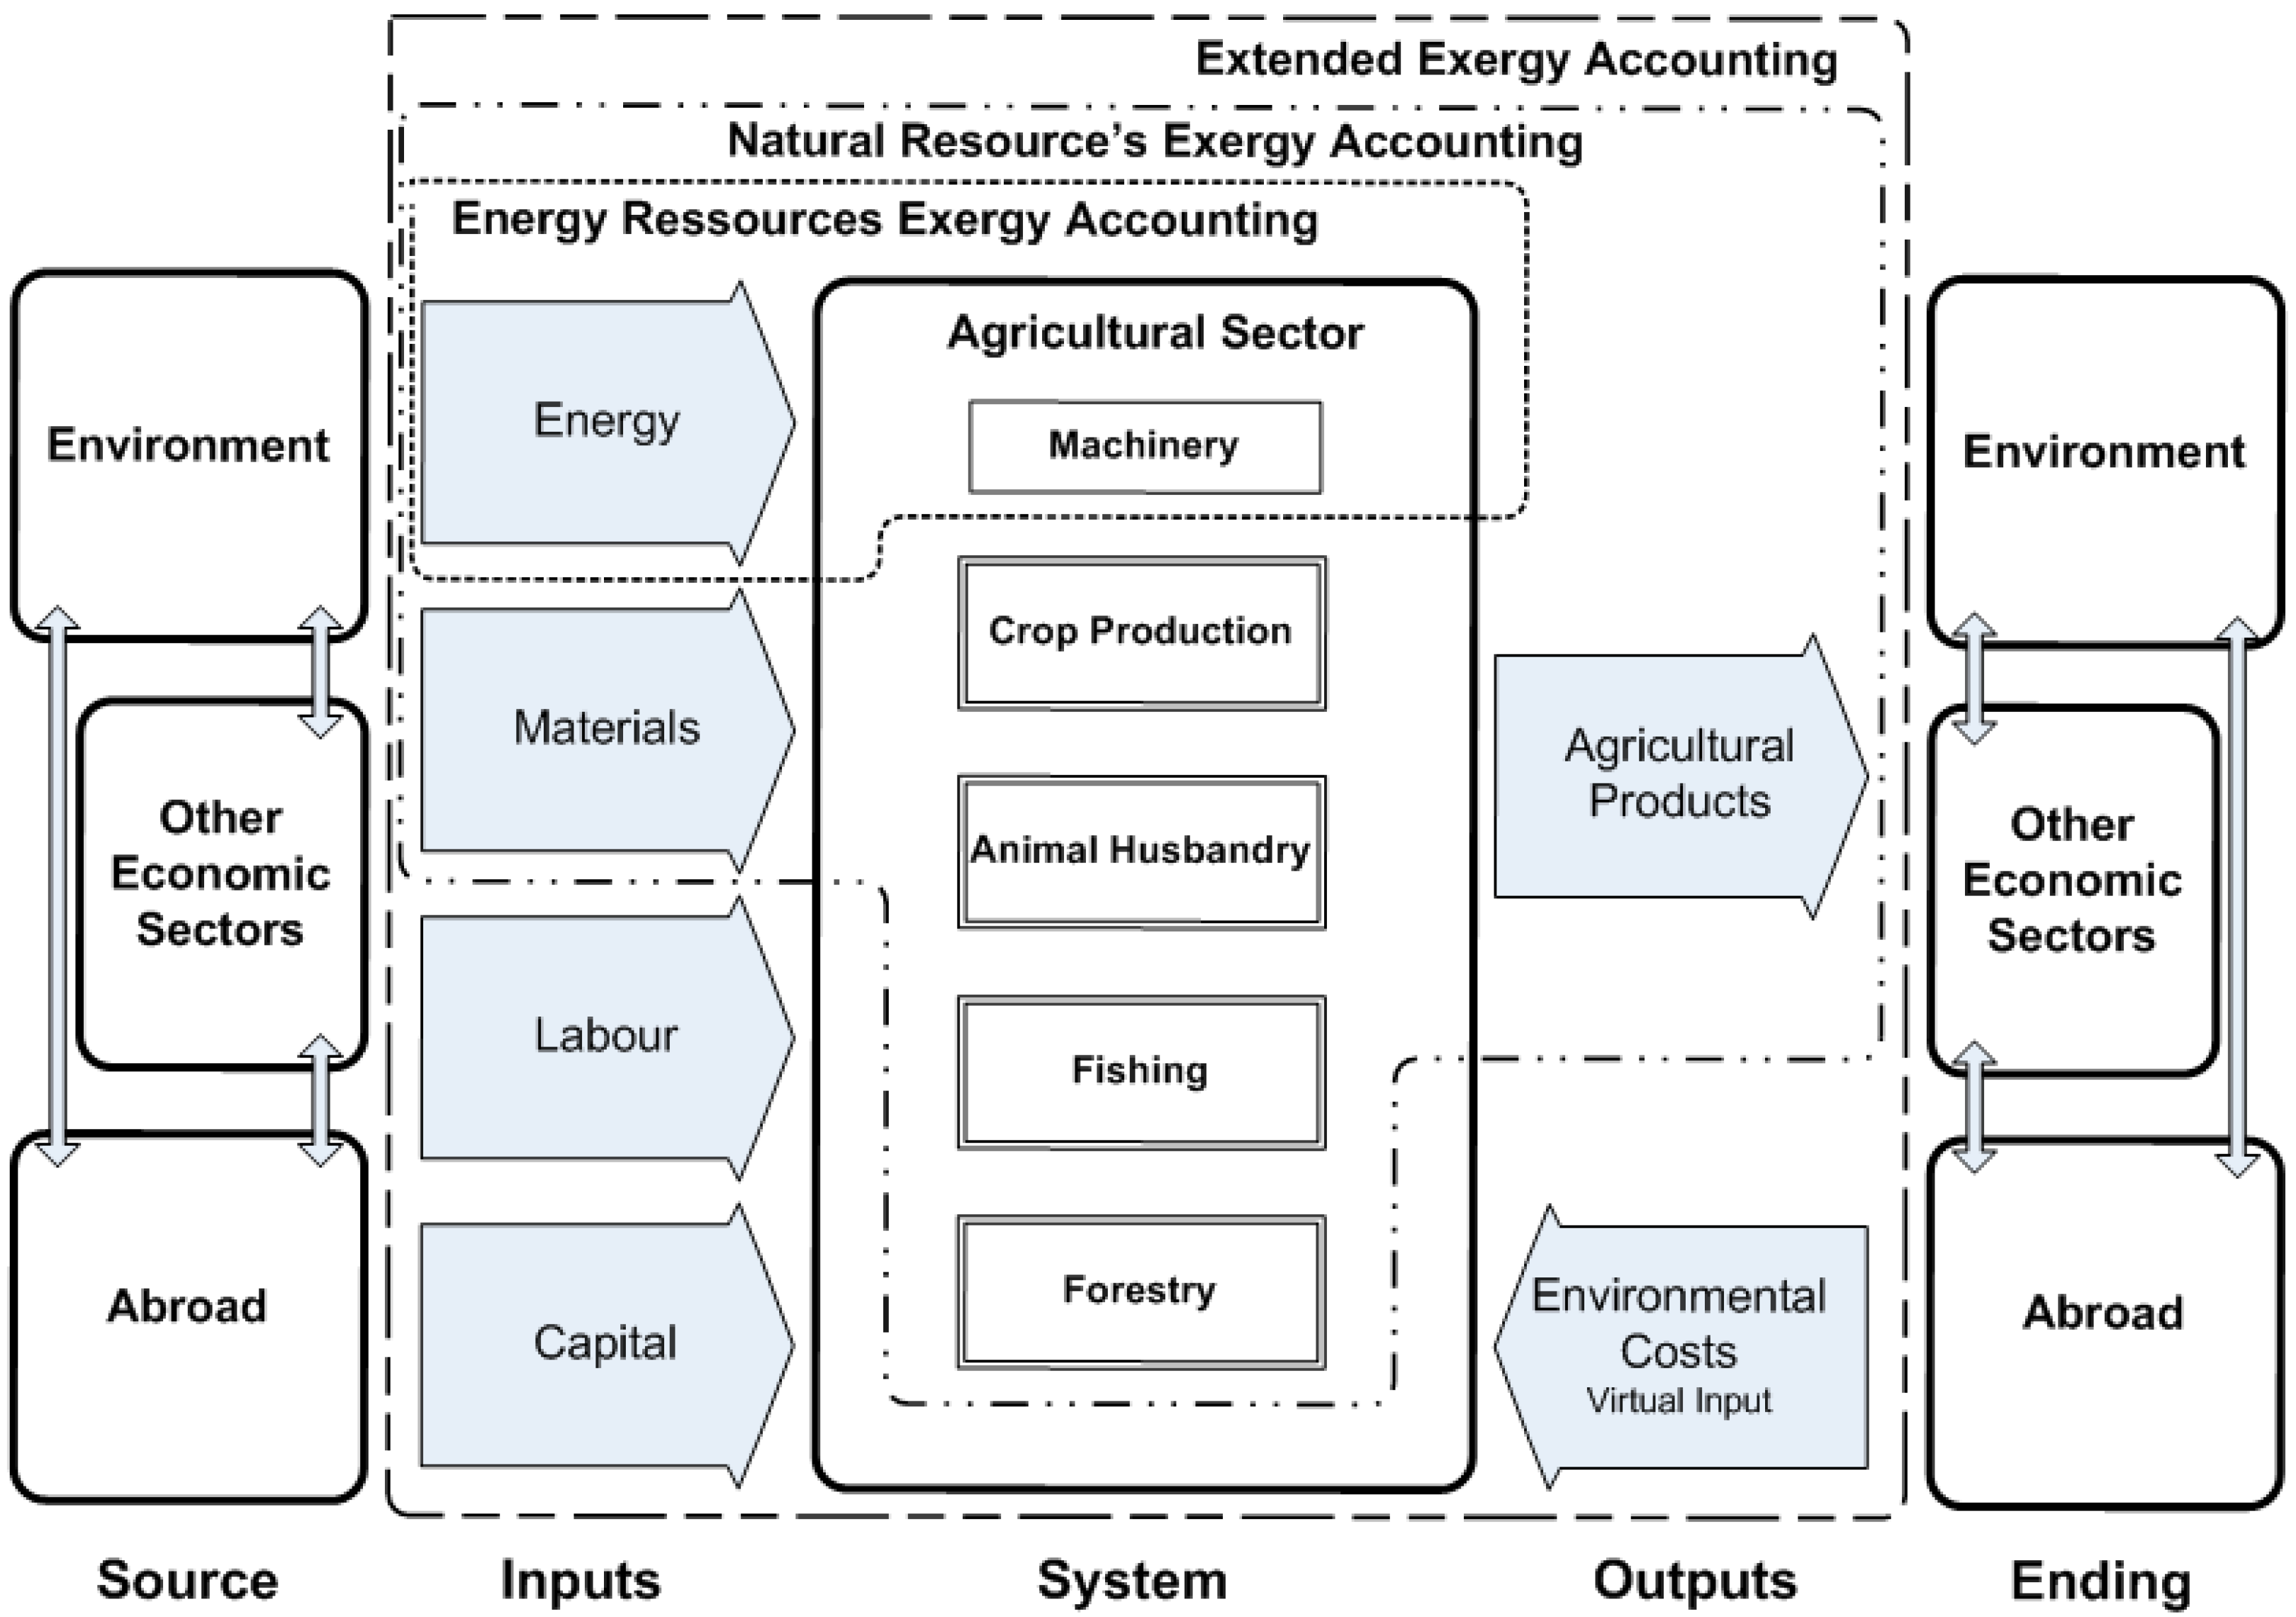
NREA is an input-output assessment where all energy and matter that enters and leaves the system is accounted for (Figure 1). Contrary to EREA, no information on how each energy carrier is used is needed but more data is required to account for all fluxes across system boundaries. By accounting both the input and output fluxes, the NREA approach measures the overall physical performance of the transformation process.
Finally, EEA is similar to NREA but also introduces capital and labour as inputs and environmental impact as a virtual input, integrating the social, economic and environmental pillars of sustainability. Translating capital, labour and environmental impact externalities into an exergetic cost is a key feature of EEA as it reflects the real thermodynamic system’s efficiency and the usually hidden resource costs [8]. The production factors are no longer just energy resources (EREA) or energy and matter (NREA) but also immaterial flows which are essential to assess the system’s behaviour (Figure 1). The exergy of inputs is no longer the physical and chemical exergies but the cumulative exergy introduced by [9] in the cumulative exergy consumption methodology (CExC). The latter takes into account the sum of all the exergetic content of resources that are consumed in a production chain. Consequently, the main focus of EEA is to find the real exergy embodied into the output flows under study, adding not only all exergy necessary to bring all inputs to the specific space and time domains but also all labour, capital and environmental impacts.
First exergetic studies focusing exclusively on agriculture adopted an EREA approach and included conversion in agriculture machinery, such as tractors, and electric pumps. Agricultural sectors of Saudi Arabia [10], Turkey [11], Jordan [12], Iran [13] and finally Malaysia [14] were studied longitudinally (except for Jordan) in order to verify the evolution of efficiency. The efficiencies of devices vary widely among studies.
First exclusive NREA approaches to agriculture also included virtual environmental impact as an input to integrate pollutant emissions [15]. The input-output ratio was approximately 10 (ten times more exergy in inputs than outputs) but solar radiation was responsible for 90 to 95% of the inputs with an estimated photosynthetic efficiency of 4.5%. A combination of EEA and cumulative exergy extraction from the natural environment was proposed by [16] to measure the agricultural performance of 29 countries from 1990 to 2003. As important findings, the study highlighted the three types of resources that agricultural production most extracts from the natural environment: organic content in top soil, feed and water. Finally, it concluded that the exergy efficiency in the livestock sector is much lower than in the crop sector.
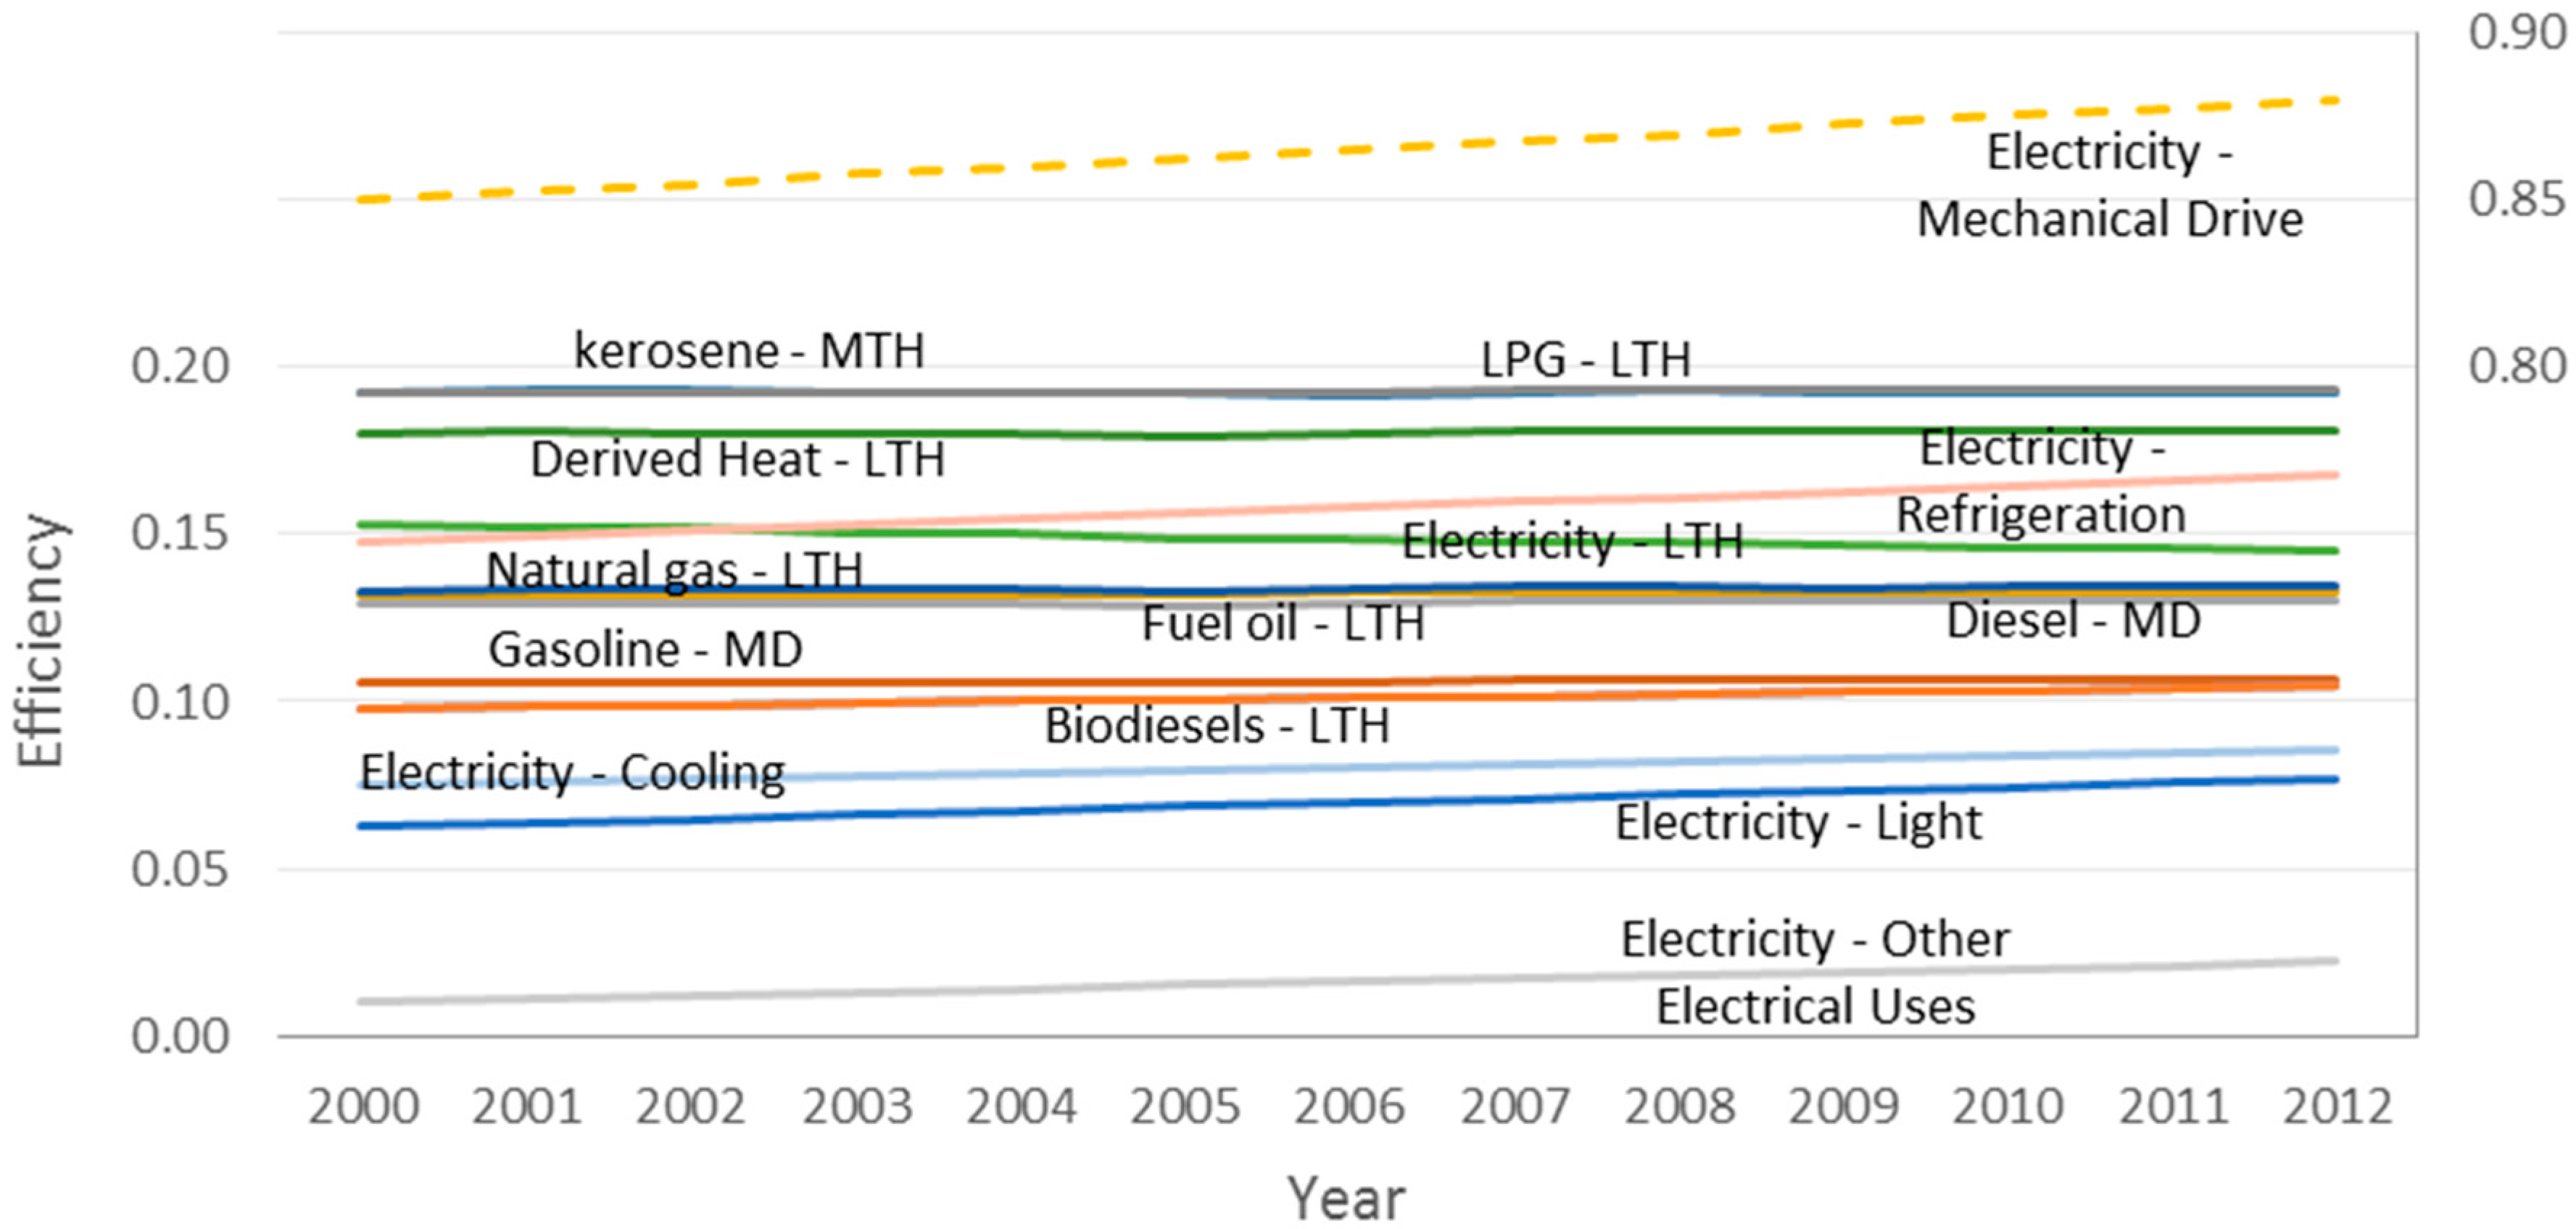
Some societal exergy studies that use the EREA approach, also included, in detail, the AFF sector [17,18]. These studies have allocated all energy carriers (e.g., diesel) used in the AFF sector to end-uses (e.g., mechanical drive). The AFF sectors of Sweden [19,20], Japan [21] and Italy [22] were assessed by the NREA methodology where the major energetic and material inputs were considered along with all the production from the sector. EEA studies also addressed the AFF sector. Efficiencies estimated by the EEA approach for the province of Siena, Italy [23]; the U.K. economy [24]; Chinese society [25,26,27,28,29], and the economy of Nova Scotia, Canada [30] were all below 100%. These EEA studies did not take into account solar radiation, but considered crops and wood as extractions from the environment and not as productions.
All three methodologies have been used to assess the performance of society [31] and of the AFF sector. However, analyses typically focus on results provided by only one methodology without justifying the use of that specific methodology in detriment of others. Also, there are major differences in the exergy inputs and outputs that are accounted for, across published NREA and EEA analyses of the agricultural sector. This is problematic if results provided by the three methodologies or even by the same methodology are inconsistent driving to different policy recommendations.
The present study evaluates the performance of the agricultural sector in Portugal, between 2000 and 2012, applying three exergy methodologies: the energy carrier’s exergy accounting approach, the natural resource’s exergy accounting approach and the extended exergy accounting.

2. Methodology and Data

2.1. Exergy Accounting of Energy Resources

Appendix A briefly revisits the exergy concept. More detail can be found in [32]. EREA measures the useful exergy services delivered to each end use. EREA estimates the system’s useful exergy by multiplying the intrinsic exergy applied to the system by the specific real efficiency for each energy carrier in its dominant end use. The efficiencies reflect the actual performance of the machinery or device that uses the energetic carrier in each end use (Figure 2). The accounting methodology is done in four separate steps [17,32]. First, all final energy that enters the system is converted into final exergy, multiplying each carrier by its exergy factor. Second, end-uses are allocated to each energy carrier. Third, a real exergy (or second law) efficiency is attributed to each carrier-end use pair based on the actual final to useful transformation devices involved. Finally, all useful exergy obtained from each end use category are added to discover the overall system’s useful exergy delivery and calculate an output-input ratio to assess the efficiency of the transformation process.

2.1.1. End Use Categories

From all energy carriers presented in the statistical data, natural gas, biofuels, heat production and fuel oil were predominantly used in low temperature heat processes while liquefied petroleum gas and kerosene were mainly used to support medium temperature heat devices. Gasoline and diesel were prevalent in motors in fisheries and agricultural machinery, being used mainly for transportation in the fisheries subsector and mechanical drive in general (including transportation) in crops, husbandry and forestry [17]. Electrical energy was used for several end uses: 26.7% for low temperature heat (water and process heating), 51.7% for mechanical drive (irrigation, material handling and other process use), 5.0% for lighting, 4.2% for cooling (AC), 10.0% for refrigeration (industrial cooling) and 2.4% for other electrical equipment like phones, computers and network devices [33].

2.1.2. Conversion Efficiencies

Efficiencies vary by end use and by energy carrier since the technologies involved are different. Low temperature heat (LTH) efficiencies considered were 10% for solid biofuels and biodiesel, 13% for natural gas and fuel oil, 15% from electricity and 18% from derived heat. Medium temperature heat (MTH) achieved better efficiencies since higher temperature flows have higher exergetic content. Both liquefied petroleum gas and kerosene were considered to have a 19% transformation efficiency. Gasoline and diesel were used for transportation and mechanical drive (MD) with 11% and 13% efficiencies, respectively. Also electricity was used to drive mechanical appliances with an increasing efficiency from 85% in 2000 to 88% in 2012 (Figure 2). All efficiency values were obtained from [34,35].

2.2. Natural Resources’ Exergy Accounting Approach

The NREA approach consists in quantifying all energy and matter that enters and leaves the system in the common unit of exergy. Contrary to EREA where the system is analysed in order to understand how the energy resources are used, in this methodology the system is evaluated only by quantifying the inputs and outputs, without any knowledge about the system’s internal behaviour (Figure 3). The ratio between outputs and inputs will reflect how well energy and matter are being used and offers insights on the sustainability of the agricultural sector. Although the amount of data is usually a lot bigger than in EREA, the methodology is simpler to apply since we only have to address the exergetic content for each flux across the system’s boundaries.
In this study, there is a clear distinction between the Agricultural, Forestry and Fisheries Sector and the environment (see Figure 3) focusing on the efficiency of anthropogenic activities. We consider crops, wood removals and fish from aquaculture as outputs because they are a product of an anthropogenic activity. In contrast with other studies [23,24,25,26,27,28,29,30] we do not count them as an extraction from the environment because they do not appear spontaneously. In contrast, we consider fish catch as a natural input from the environment.

2.3. Extended Exergy Accounting Approach

Extended exergy analysis adds, on top of natural NREA, the immaterial inputs that are crucial to run and maintain the system working and also adds the environmental impact as a virtual input (Figure 3). Labour and capital exergy estimations are based on two postulates elaborated by Sciubba [36], defending that the global influx of exergy resources are mainly used to sustain workers and, that the capital exergy flux is proportional to the labour exergy flux. The proposed equation to evaluate the exergy used to sustain all workers is (exergy of labour): E L = f × e s u r v × N h , where f is an amplification factor that represents the society consumption over the survival mode, e s u r v is the minimum exergy required to maintain healthy metabolic needs (2500 kcal/day per person or 1.05 × 10⁷ J/day·person) and N h is the total population. The amplification factor is estimated using the Human Development Index (HDI) [37] which, based on three social dimensions, reflects the development of a country, f = H D I H D I 0 , being HDI0 the Human Development Index of a pre-industrial society ( H D I 0 0.055 ) [36]. Labour equation implies that E L is linearly dependent on the HDI and independent of the fraction of workers in the society and the type of work. The exergy equivalent of Labour ( e e L ) for the society, or economic sector, can be calculated dividing the exergy of labour by the total hours worked ( N w h ) , e e L = E L N w h .
Seckin et al. [38] followed by Rocco et al. [8] slightly changed the equation proposed by Sciubba [36] for the exergy of the capital flux from E K = M 2 S × E L   to E K = M 2 S S × E L where S is sum of all wages and M2, defined by the European Central Bank [39], is an intermediate monetary aggregate which reflects the currency under circulation plus the liquid deposits (maturity up to 2 years and redeemable up to 3 months). The new formulation considers M2-S because labour (reflected as the wages in the previous formula) was already internalized as an exergetic flux. The exergy equivalent of capital is obtained by dividing the total exergy of the capital flux by the monetary circulation, e e K = E K M 2 S . Capital equation assumes that the monetary aggregate M2 minus wages is eligible to the productive sector and represents the effective capital that drives all economic sectors. To translate money into exergy, the capital equation assumes the relationship developed for labour: e e K = E K M 2 S = E L S .
Any material stream that is not physically confined and represents a discharge of the system to the environment is considered a pollutant. The environmental impact in EEA consists in developing a state-of-the-art process to bring the pollutant wastes and emissions to equilibrium with the reference environment. The total amount of exergy used in the innovative process is accounted for as an environmental externality and a virtual input to the economic sector. The equivalent exergy of the environmental impact portrays all exergetic consumption to run such a process (real or virtual) namely energy, matter, capital and labour having no relation with the pollutant physical exergy.

2.4. Reference Environment

The reference environment should be carefully chosen since the resource flow has exergy due to the imbalance (lack of equilibrium) with this reference state. The flow will have zero exergy in complete equilibrium with the reference state. In this study, the pressure P0 = 101325 Pa and temperature T0 = 298.15 K were adopted as well as the standard chemical composition of the natural environment. This is the reference environment used by Kotas [40] to estimate chemical exergy values that were used in this study.

2.5. Time Window and Control Volume

Recent exergy studies of countries or large regions focus on the seven economic sectors of society plus the environment and abroad [24,30,41] (see Table 1).
This study focuses on just one economic sector, the AFF, because of the relevance and preponderance in sustaining human life. Figure 4 exhibits the agricultural sector within the region’s economy and specifies inputs and outputs considered for this study.
Time and regional boundaries were chosen in accordance with the available data, since few data were available posterior to 2012 and there was a lot of missing data prior to 2000.

2.6. Data

The statistical office of the European Union, Eurostat, provides in its database [42] the quantities of energy carriers, pesticides, fertilizers, harvested crops, meat slaughtered, fish catch, incubation eggs, milk collection, fish aquaculture, wood removals, atmospheric emissions, population, human labour and economic information. The energy of energy carriers was assumed to be the lower heating value (LHV) and the exergy factors for the energy carriers are the ratio of the standard chemical exergy of the organic fuels to the LHV, these factors being obtained from [40,43,44]. However, the consumption matrix of energy carriers is only available in two branches, being the first the agricultural plus the forestry subsectors and the second is the fisheries subsector. Also the data for pesticides and fertilizers is not disaggregated between agriculture and forestry subsectors. Due to this limitation and not wanting to apply some educated division between these carriers on both subsectors, all aggregated results will be presented in the conjunction of the agriculture and forestry subsectors.
Crop seeds, feed, produced eggs and honey carriers and some nutritional energy values for products not intended for human consumption were obtained from the statistics division of the Food and Agriculture Organization of the United Nations (FAOSTAT) [45]. Nutritional energy values assigned to each food element, in its raw state, are from USDA (United States Department of Agriculture) National Nutrient Database [46]. Moisture content of all food items was considered to be equal between USDA and Eurostat databases. All economic values such as compensation for employees, agricultural gross value added (GVA), monetary aggregate M2 and gross domestic product (GDP) were obtained at current prices and converted to constant euro GDP prices through a GDP price deflator obtained from the economic and financial affairs of the European commission (Ameco) [47]. The GDP price deflator is referenced to 2010 and measures the ratio between real GDP and the nominal GDP, providing a measure of inflation over the period.
Agricultural outputs were obtained in mass units, except wood which was available in volume units, and converted to exergy units using the energetic nutritional value presented in the USDA database [46] or in FAO (Food and Agriculture Organization of the United Nations) nutritive factors table [48], for food compounds.
The food (and feed) energy content was considered equal to the metabolizable energy as defined by [46]. The energy content (combustible or gross energy) of the ingested food should be measured by a bomb calorimetry. However, foods are not fully digested and absorbed by the organism. From the ingested or gross energy, some is lost to faeces (faecal energy) and gases (combustible gas), the rest is the digestible energy. Subtracting from the digestible energy, the energy that is lost is urine and heat results in metabolizable energy [49]. Data available from the United States Department of Agriculture for food energy is based on the Atwater system which is equivalent to the metabolizable energy [46]. The choice to use the metabolizable energy was mainly due to the lack of a complete database of combustible or gross energy.
The aggregate of food energy values presented are not fully ingested by society. Food supply chains cover five steps: agricultural production, postharvest, handling and storage, processing and packaging and finally distribution and consumption. In each step food is lost or wasted and the total in Europe reaches 31%. For Europe, at the producer level, food losses and waste accounts 2% for cereals, 3.1% for meat, 3.5% for milk, 9.4% for fish and seafood, 10% for oilseeds and pulses and 20% for roots, fruits and vegetables [50]. Such losses are not edible for societal consumption.
To fill in the gaps for a given resource or product, in a year or more, data was interpolated (between known values) or extrapolated (in extremes of the data set) by a linear regression made from all the other known values.
Fluxes inside the sector were not considered and only fluxes between sectors that have economic relevance were accounted for. Although seeds, feed and incubations are produced by the sector, they were considered to leave the agricultural sector to other economic activities (ex. industry or tertiary) and returned as an input, essential to the production. However straw, green fodder and manure (used as a fertilizer) that are internal inputs and outputs of activities within the sector were not accounted for.
Solar radiation, vital for crop production, and water, essential for crops and livestock, were not included in the study. The sun radiation is not an anthropogenic controlled flux and it can be seen as a flux from the environment with no economic value. Water from rain follows the same thinking as it is not an anthropogenic activity but irrigation water should have been an input although the lack of trustworthy data prevented its use in the study.
Animal skins production data (including wool) is only available for goats and sheep but the absence of a specific exergetic value for skins lead us to consider only the wool production flux that has a specific exergy of 5850 kJ/kg [51]. However, its exergetic value is very low ranging from 51 TJ in 2000 to 35 TJ in 2012. Other animal products such as lanolin or cow’s leather were not accounted for, due to lack of data. For lanolin and cow’s leather there are no specific exergetic values while for cow’s leather there is also no production data.
Wood removals are considered as under bark and the exergy values were obtained from Dewulf et al. [52]. Dry matter exergy values are 22.11 MJ/kg for softwoods and 22.01 MJ/kg for hardwoods and densities of 450 kg/m3 and 650 kg/m3 respectively. Moisture content was assumed to be 20%.
Environmental remediation exergy costs were estimated by multiplying the pollutant air emission (obtained in mass units) by the specific extended cost of removing the pollutant from the atmosphere. Studying the transportation sector for Turkey, Seckin et al. [38] also created a virtual process to find the environmental extended exergy cost of three pollutants: carbon dioxide (57,600 kJ/kg), methane (322,400 kJ/kg) and nitrous oxide (10,600 kJ/kg). Dai et al. [53] studying the transportation sector in China determined the specific environmental remediation exergy cost of carbon monoxide (11,800 kJ/kg), nitrogen oxides (3610 kJ/kg) and sulphur oxides (5890 kJ/kg). For ammonia, the chemical exergy was used as the extended exergy cost of removing the pollutant (since no study is available in the literature) and valued by 19,841 kJ/kg.

3. Results

3.1. Energy Resources’ Exergy Accounting

3.1.1. Energy Resources

Energy resources are essential as they fuel all the machinery applied in the AFF sector. In the agriculture and forestry subsectors, energy use decreased drastically, more than 50%, mainly due to the decrease in the use of diesel to one third of the initial value (Figure 5).
In contrast to agriculture and forestry, the consumption of energy resources in fishery has almost tripled due to the diesel carrier (Figure 6). In this subsector, LPG (Liquefied Petroleum Gas) and gasoline were also replaced by biodiesels and electricity. Notably, electricity grew from an 8% share in 2000 for agriculture and forestry to 23% in 2012 while in fishery and aquaculture (just fishery subsector from now on) it increased from 2.6% to 7.1% in 2012.

3.1.2. End-Uses

Mechanical drive (e.g., tractors, irrigation pumps) and transportation (ex. boat engines) consume the biggest share of useful exergy in the sector. The decrease of 56% in the exergetic input of energy carriers in agriculture and forestry, from 2000 to 2012, was reflected in a 39% decrease in the amount of useful exergy applied to both subsectors (Figure 7). Fisheries increase energy carriers’ consumption by 291% and obtained a 320% increase of useful exergy (Figure 8). Both improvements are associated to an increasing final-to-useful efficiency and are mostly due to the increased use of electricity, namely in irrigation.

3.1.3. Sector and Subsector Efficiencies

All subsectors have increased their efficiency (Figure 9) with agriculture and forestry showing a better performance. The increase in the share of electricity and the reduction of the share of diesel (mostly associated to the transition from diesel-powered to electrically-powered irrigation pumps) allowed an increase in performance of 38% (from 16% to 22%) for agriculture and forestry and 30% (from 16% to 21%) overall. Fishery also increased their conversion efficiency from energy carriers to useful exergy from more than 14% to 16%.
To test whether the increase in efficiency was only due to technological improvements we estimated EREA subsectorial efficiencies assuming the carrier end-use pairs efficiencies were constant from the year 2000 onwards (Figure 10). In these conditions, the useful exergy per final exergy would have increased 35% for agriculture and forestry (from 16% to 22%), 8% for fishery (from 15% to 16%) and 27% overall (from 16% to 21%), showing that the overall increase in efficiency was due not only to better technologies but also reflect a wiser choice of energy carriers for the desired end-use.

3.2. Natural Resources’ Exergy Accounting

3.2.1. Total Outputs

About two thirds of all agricultural, forestry and fisheries exergetic output is from wood removals. The changes in the overall annual production that ranges between 140 PJ to 160 PJ are controlled by changes in wood production (for a more detailed description see Appendix B). The aggregated production intended for food and feed decreased 14% mainly due to a 20% decrease in crops harvested despite a 20% increase in meat production (Figure 11).
The production matrix for the Portuguese AFF sector has remained almost constant, being forestry the major producer and increasing its share. Fishery nutritional values are neglected while energetic values for animal husbandry are constant and the share of vegetables and fruits have decreased, mainly after 2004 (Figure 12).

3.2.2. Total Inputs

Overall input to the agricultural sector is decreasing (24% over the 13 years) mainly due to fewer amounts of energy resources which alone represented 29% of all inputs in 2012 (Figure 13 and Figure 14). Seeds, fertilizers, pesticides and eggs for incubations were almost negligible in the sector’s consumption matrix while feed is by far the biggest input (for a more detailed description see Appendix C).

3.2.3. Sector and Subsector Efficiencies

The agricultural sector relies heavily on environmental conditions to sustain production. Water and radiation are offered freely by our natural environment and do not constitute a societal activity. Their contribution leads to efficiencies higher than 100% for agriculture and forestry. This subsector reached a 255% efficiency in 2012, a 36% increase since 2000, contrasting with fishery, which decreased its efficiency by 53% from a 43% efficiency in 2000 to 20% in 2012 (Figure 15).

3.3. Extended Exergy Accounting

The inclusion of three new production factors offers a new perspective of the AFF sector and allows comparisons between material and immaterial inputs. Exclusively for the three immaterial inputs of the EEA approach, the agriculture and forestry subsectors are quantified separately to allow comparisons between them.

3.3.1. Labour

Total exergy allocated to labour was calculated by the labour equation with HDI values from the United Nations Development Programme—Human Development Reports [37] and total population and number of workers data from the Eurostat database [42]. These values as well as other labour and capital statistics are available in Appendix D. To measure the associated labour exergy to the AFF sector and subsectors, the total societal labour exergy was multiplied by the fraction of workers in this sector and subsectors. This assumes that all workers have the same labour exergy independently of the sector or even the working hours, which is consistent with the equation used.
The number of workers and respective labour exergy is far superior for agriculture over forestry and fishery (Figure 16). Total labour exergy remained constant due to an increase in the HDI values and to a decrease in the number of workers in the AFF sector. Overall equivalent exergy of labour increased rapidly from 51.5 MJ/h in 2000 to 89.0 MJ/h in 2012 which means that the necessary societal exergy to produce one hour work increased 73% in 13 years. Although the cost of labour was similar, in the beginning of the century, for all three subsectors, in 2012 the necessary exergy to supply one hour work to agriculture was 30% higher than to forestry and fishery. This increase was due to the decrease in the number of hours worked per year by farmers from about 2000 to less than 1500 h in 2012.

3.3.2. Capital

In addition to labour, capital is a fundamental key for a productive system and should also be introduced as an input. To discover the monetary aggregate associated to the AFF sector, a direct relation was made between M2 and total gross value added (GVA) of the country (which in case of Portugal is almost identical). The monetary aggregate of the sector and subsectors under analysis was obtained assuming a linear relationship with the GVA of the AFF sector and subsectors allowing the calculation of different equivalent exergy of capital (eek) for each of the three subsectors. Capital exergy relates to labour exergy through the ratio M 2 S S S S S which is higher than 1, reaching 8 for forestry. The S subscript in the previous equation means that the considered values are sector or subsector related.
The exergy of capital has decreased 42% from 2000 to 2012, mainly due to a strong decrease in AFF’s GVA (Figure 17). The equivalent exergy of capital has been constant for all subsectors with the agriculture subsector presenting the highest value. The explanation is that the wage per hour in agriculture subsector is more than five times lower than in fishery or forestry, although there was a 73% increase in the wage per hour in agriculture (in 13 years) compared to an 18% increase for forestry and 12% for fishery (at constant 2010 prices).

3.3.3. Environmental Impact

The EEA considers that the exergy value of the waste or pollutant should not be his chemical exergy but the extended exergy cost to avoid the pollutant or bring the pollutant to the dead state. Such extended exergy costs are the sum of all physical exergy required to run the cleaning process plus the labour and capital exergy fluxes imperative to run the process [54]. Carbon dioxide is mainly emitted from the combustion of fossil and renewable fuels; emissions from biomass (not used as fuel) were not accounted for because in a life cycle perspective biomass is neutral. Emissions by animals comprise carbon dioxide and methane from enteric fermentation in the ruminants’ digestive system. The methodology doesn’t account carbon dioxide from animal husbandry but accounts methane emissions, being the total amount almost exclusively from livestock production (Figure 18). The total exergy needed for environmental clean-up from atmospheric emissions is the biggest input of the system showing a decrease of 10% over the years. Carbon dioxide represents almost two thirds of the equivalent exergy and methane the remaining part, being the exergy from the other pollutants residual. Methane emissions follow the trend line of animal husbandry production (almost constant) and carbon dioxide follows the decreasing trend line of energy resources.

3.3.4. Total Inputs

All three immaterial inputs addressed by EEA are quantitatively superior to NREA inputs. The biggest share of energetic and material inputs reached 14% in 2012, revealing the discrepancy between immaterial and material inputs and pointing out capital and labour as the main factors of production. Environmental impact proved to be the strongest concern and quantitatively exceeded all other inputs (Figure 19). Overall values dropped 25% due to the decrease in energy resources, capital and air emissions.

3.3.5. Sector and Subsector Efficiencies

The introduction of three highly valuable production factors to the input matrix dramatically lowered the efficiency of all AFF subsectors. The agriculture and forestry subsector increased their efficiency by 33% (from 27% in 2000 to 36% in 2012) while fishery increased its efficiency by 32% (from 2.7% in 2000 to 3.6% in 2012) (Figure 20). This improvement was mainly due to a decrease of the capital exergetic input.

4. Discussion and Conclusions

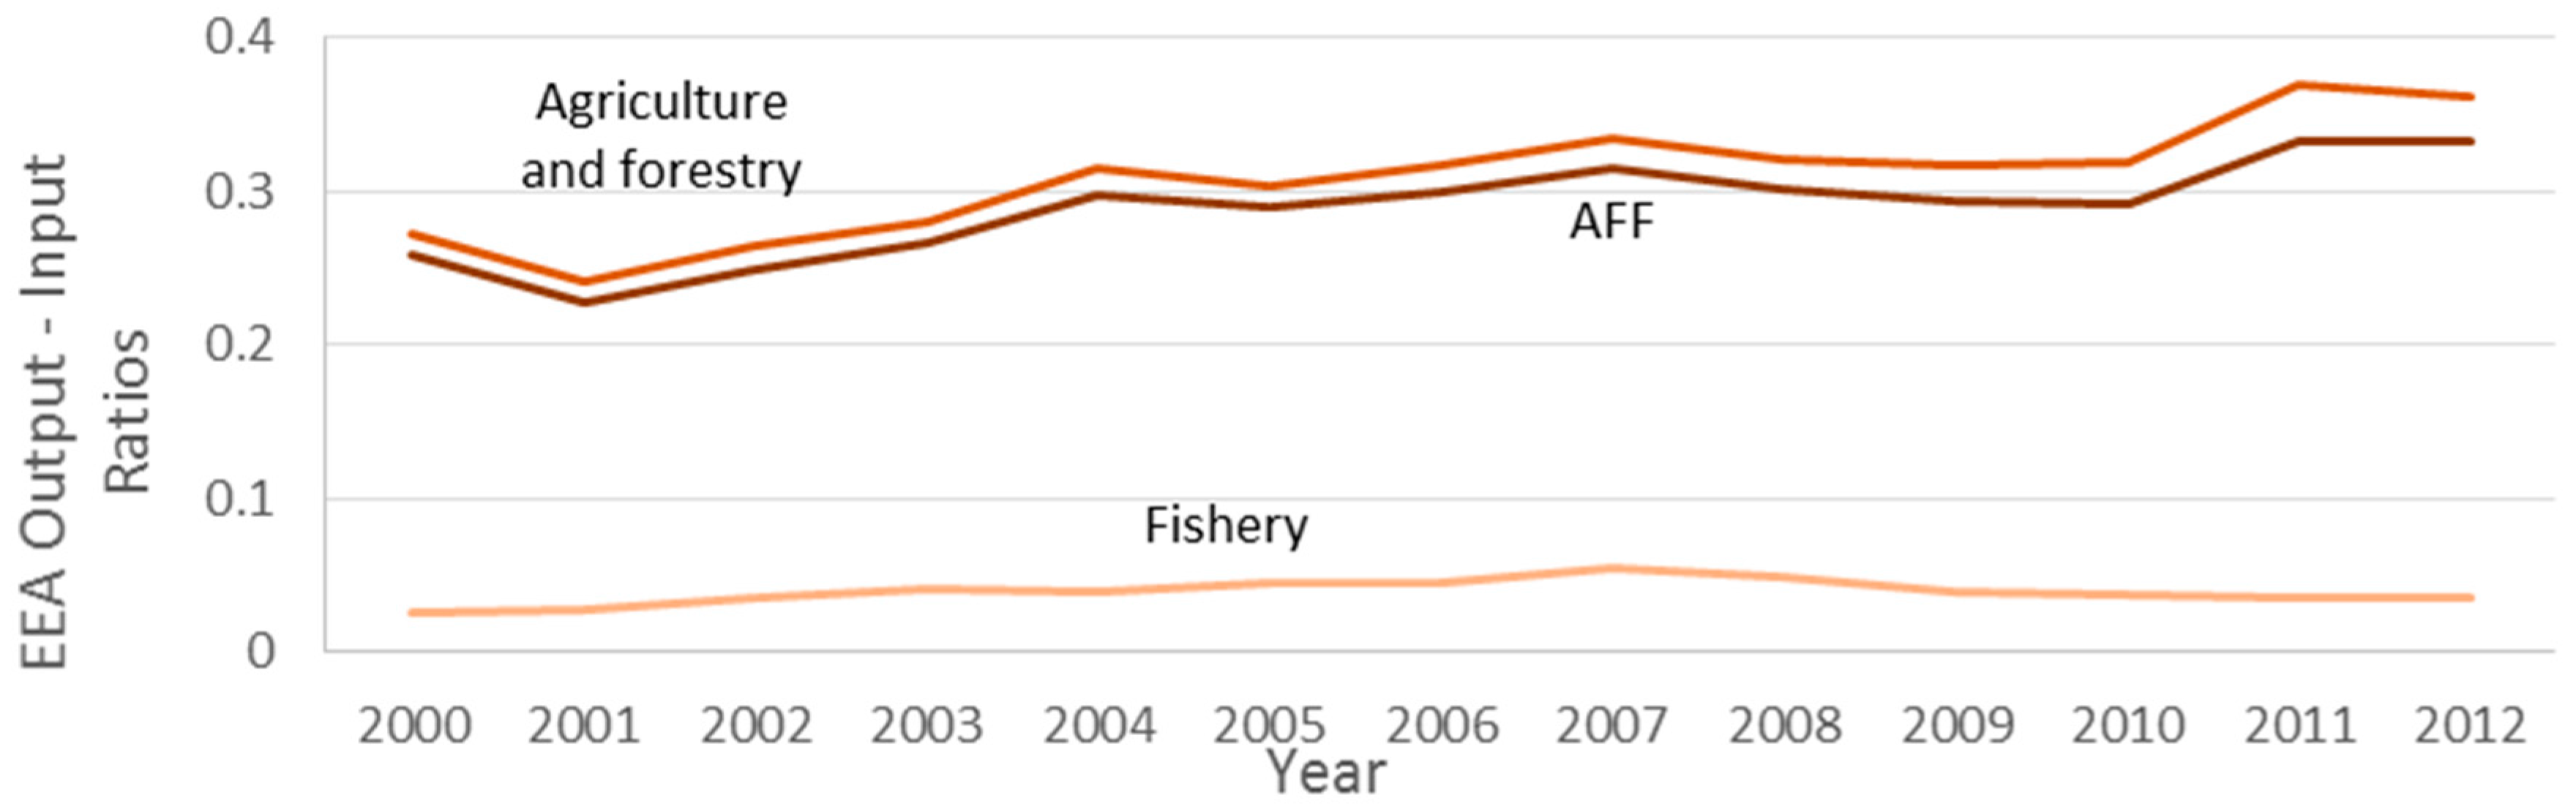
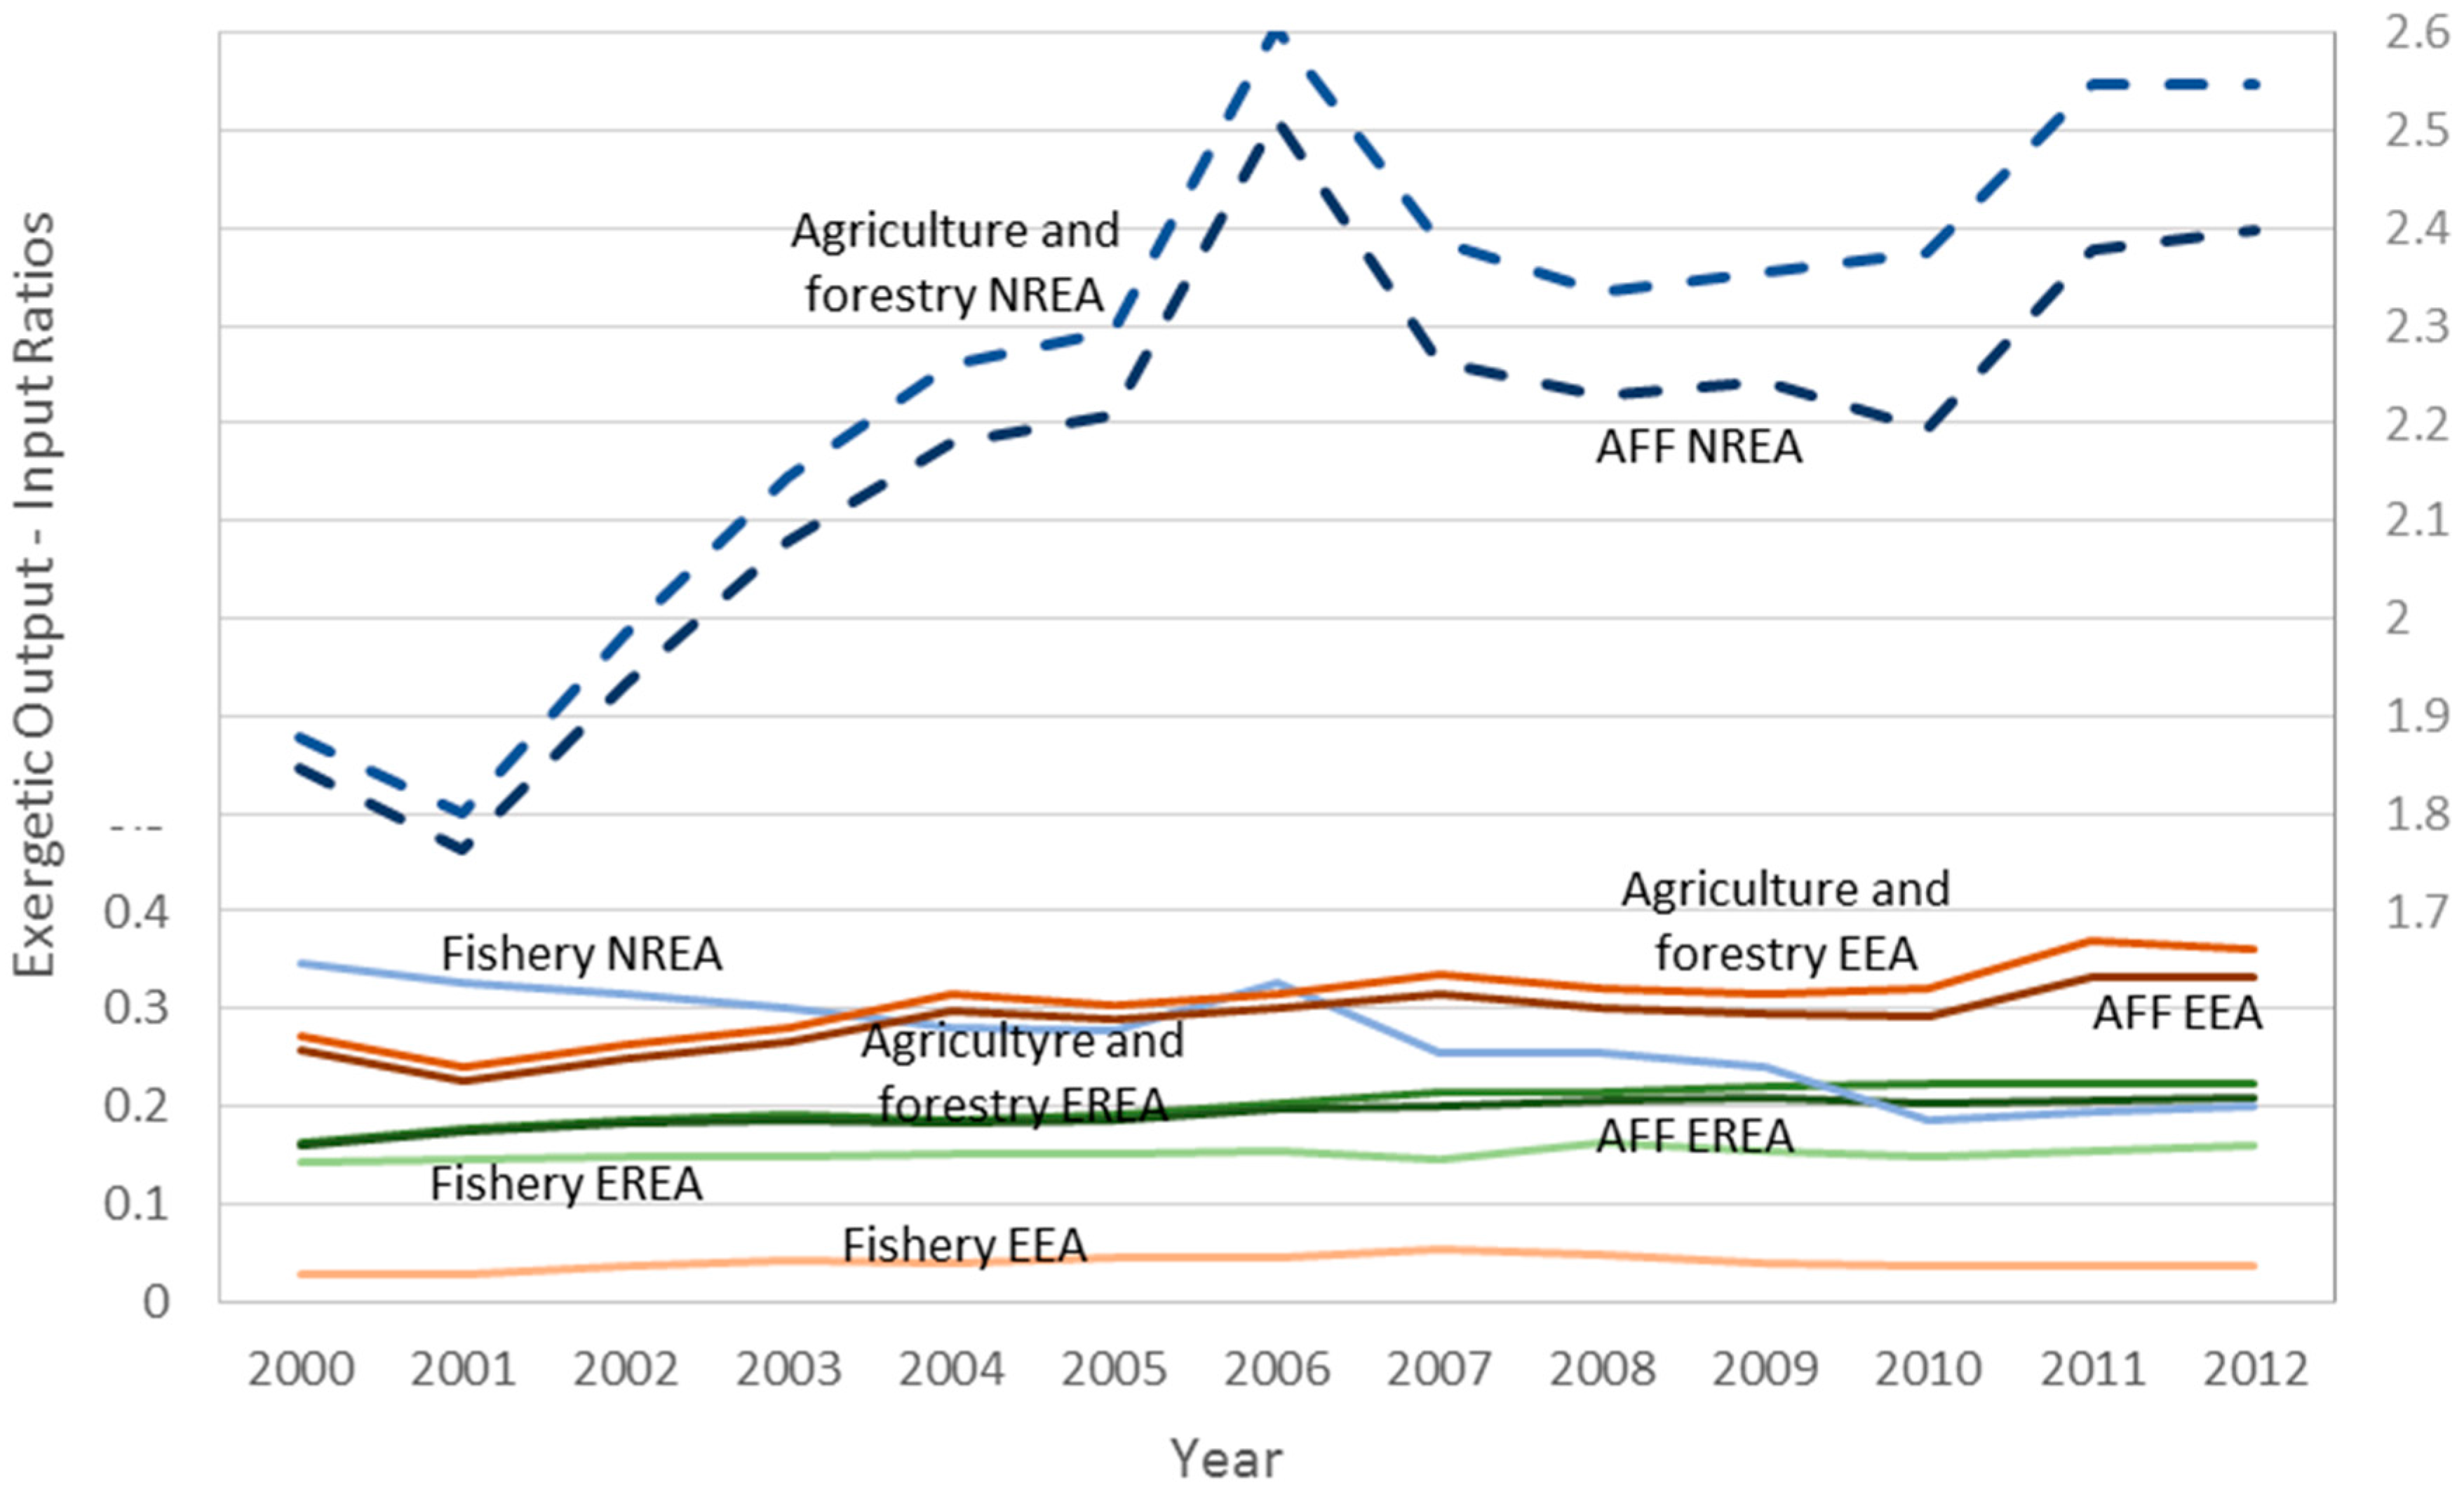
Results obtained for the Agriculture, Forestry and Fisheries (AFF) sector and subsectors, regarding the ratio of exergy outputs to inputs, using the three exergy accounting methodologies are synthesized in Figure 21. Results for the AFF sector are similar among methodologies. With the EREA approach there is a 30% increase in the overall efficiency due to a better match between the energy carrier and the end uses. NREA presented a similar growth in overall efficiency representing the sector’s return over the applied energy and matter. The EEA methodology showed the same overall tendency regarding the evolution of efficiency, although the results are clearly dominated by the capital and environmental impact. For the fisheries subsector, the results are contradictory among methodologies.
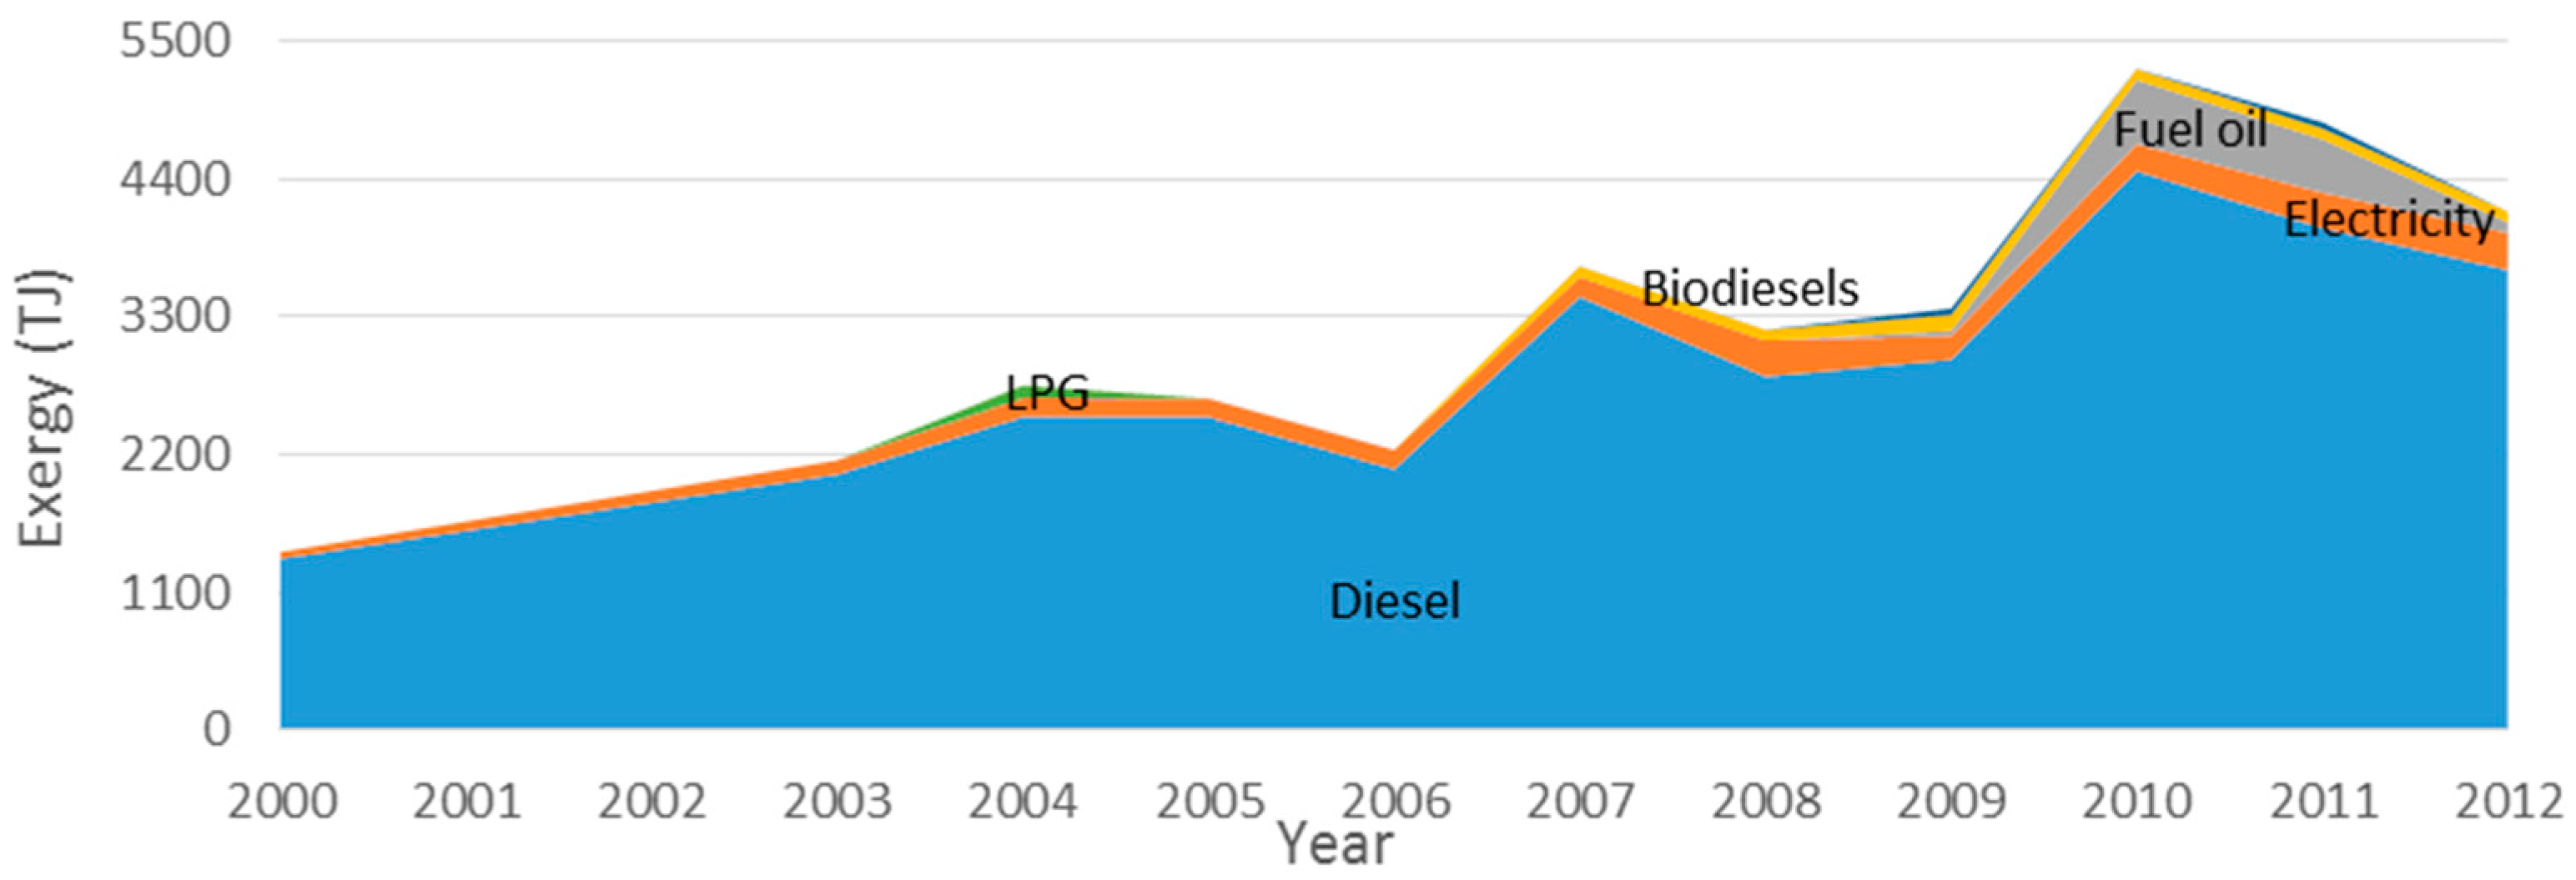
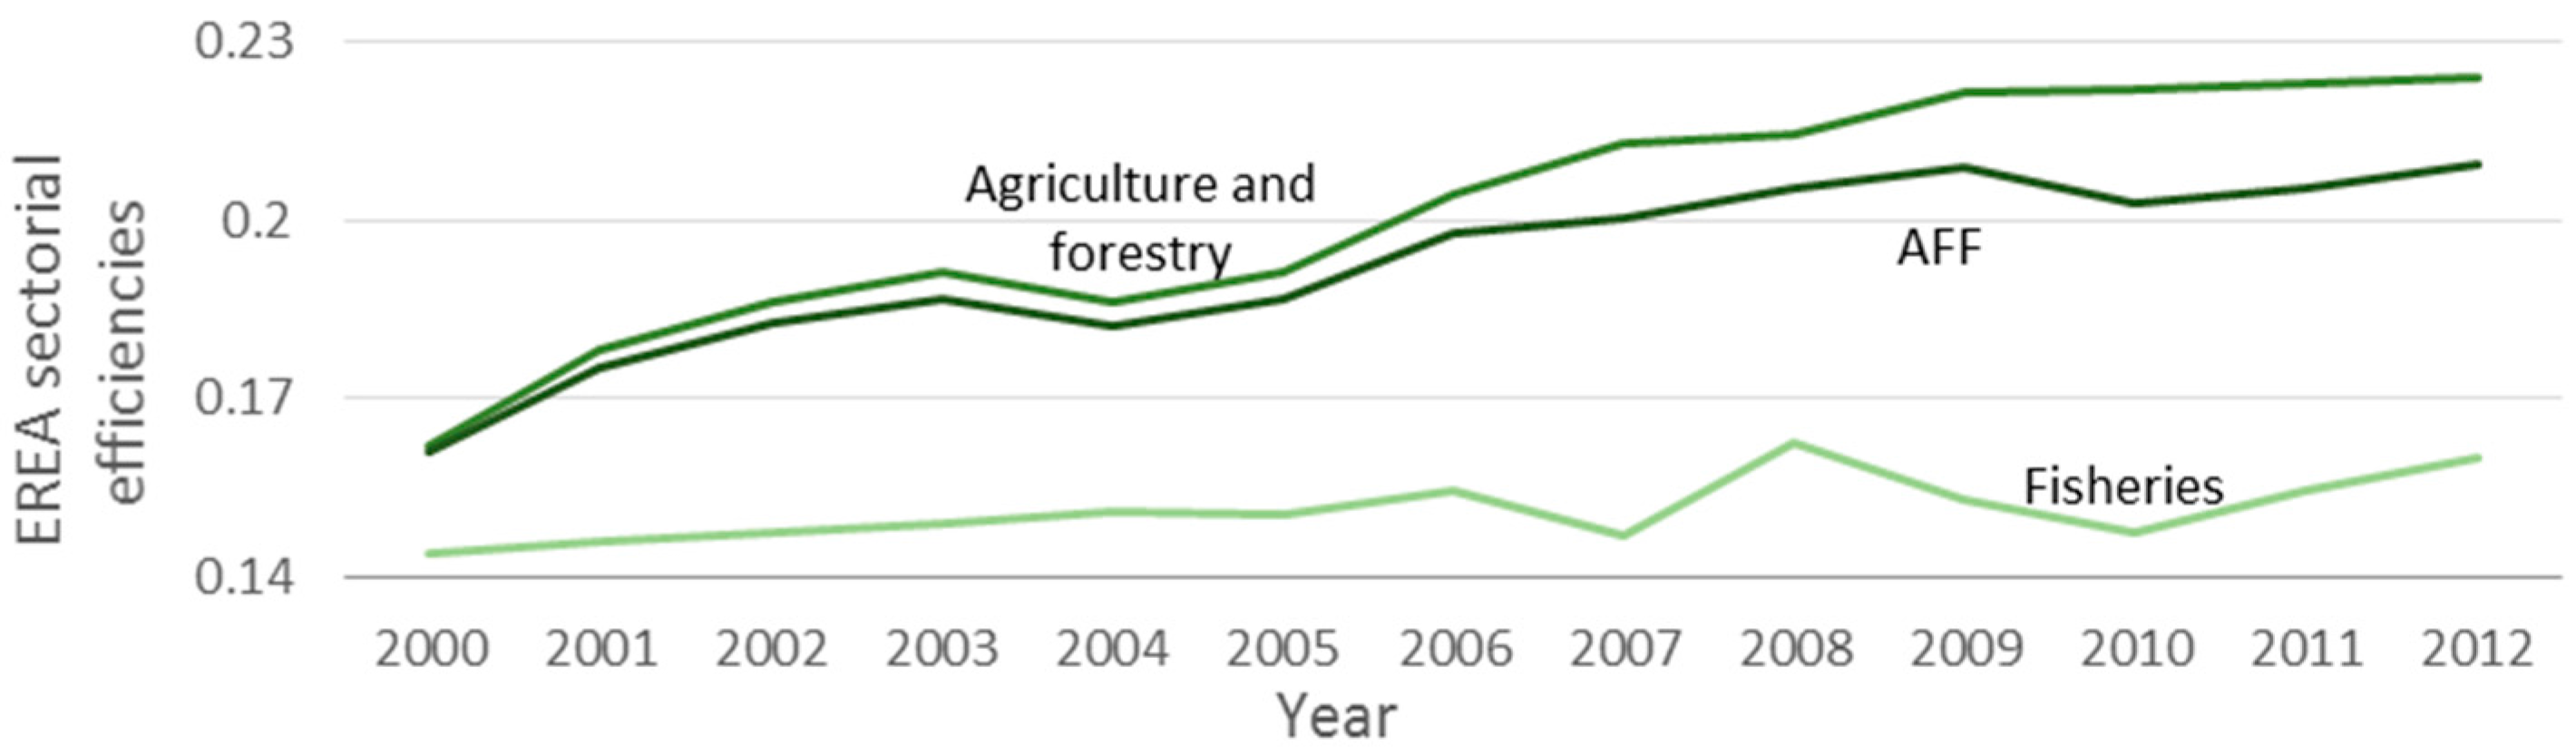
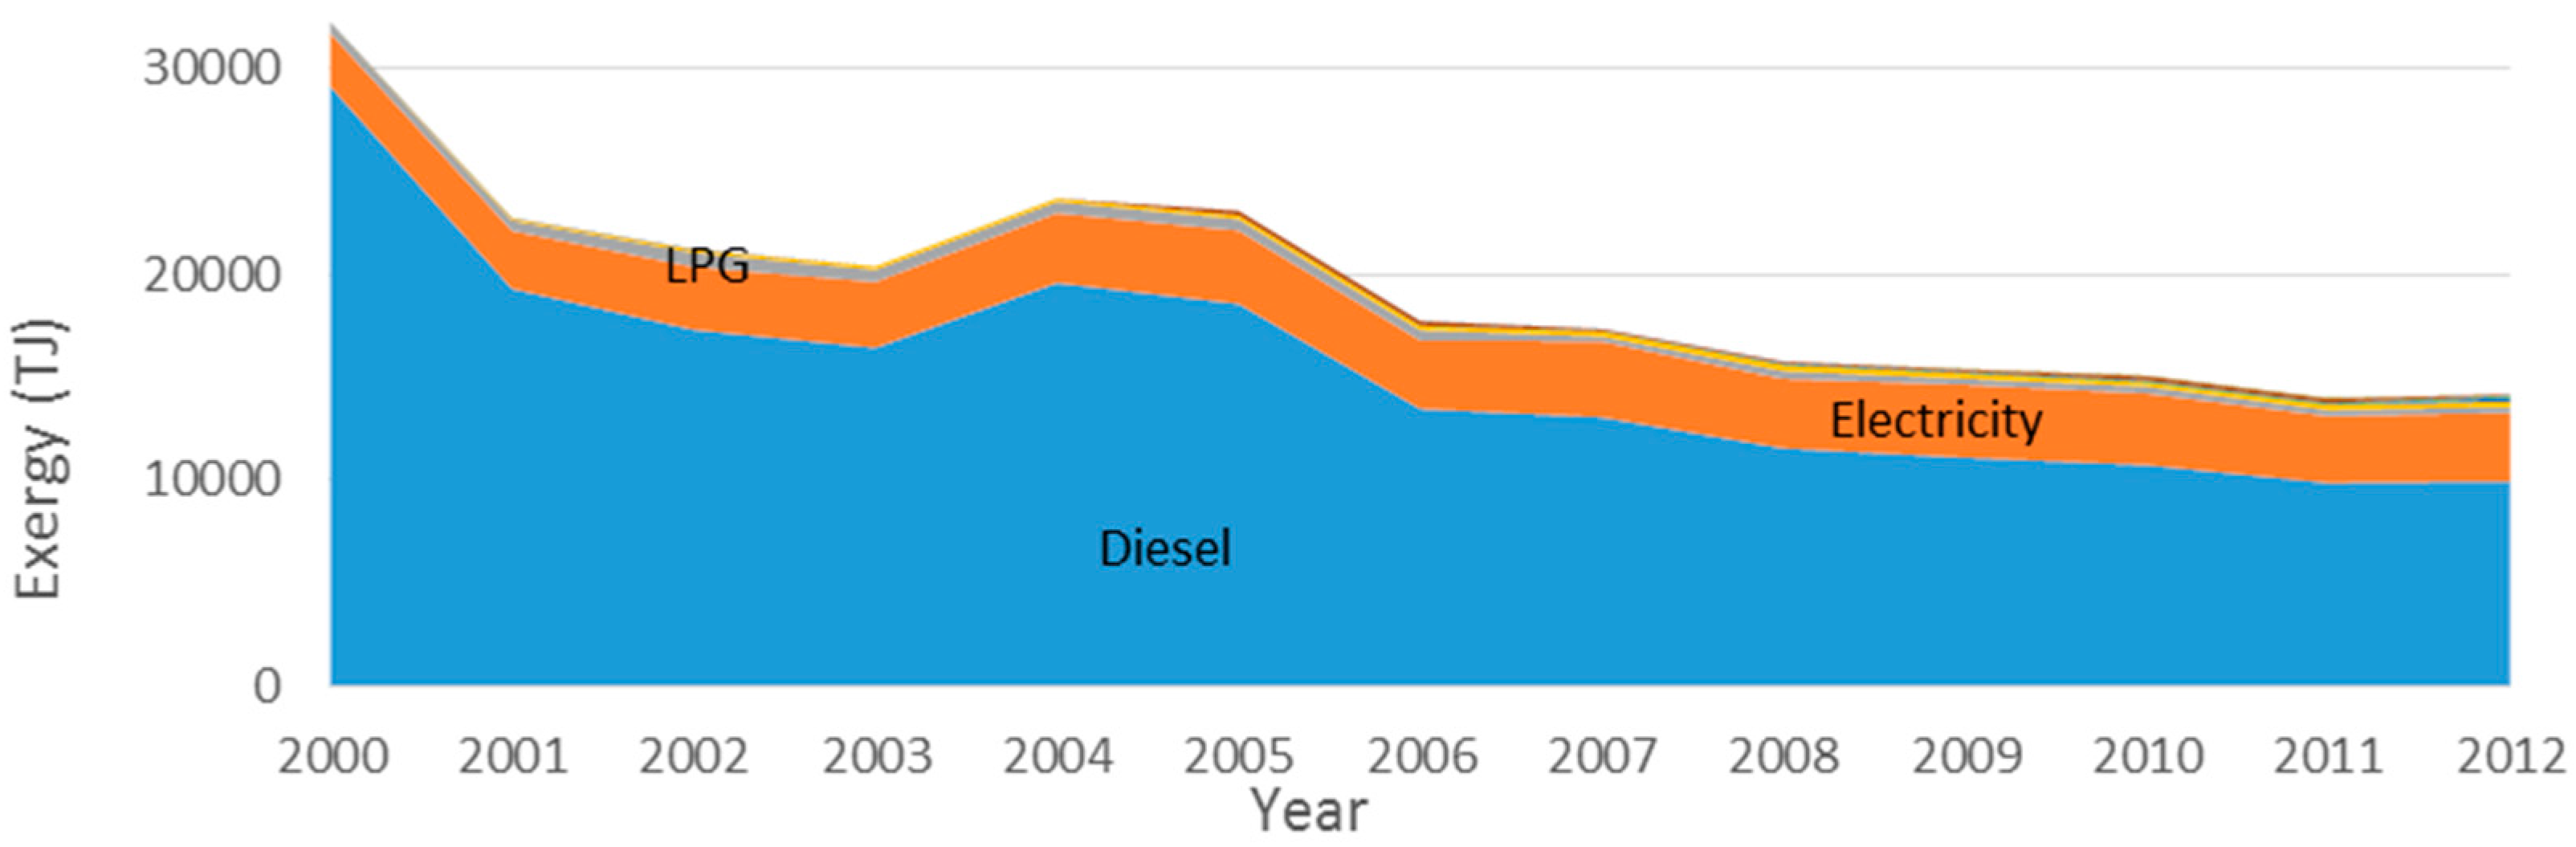
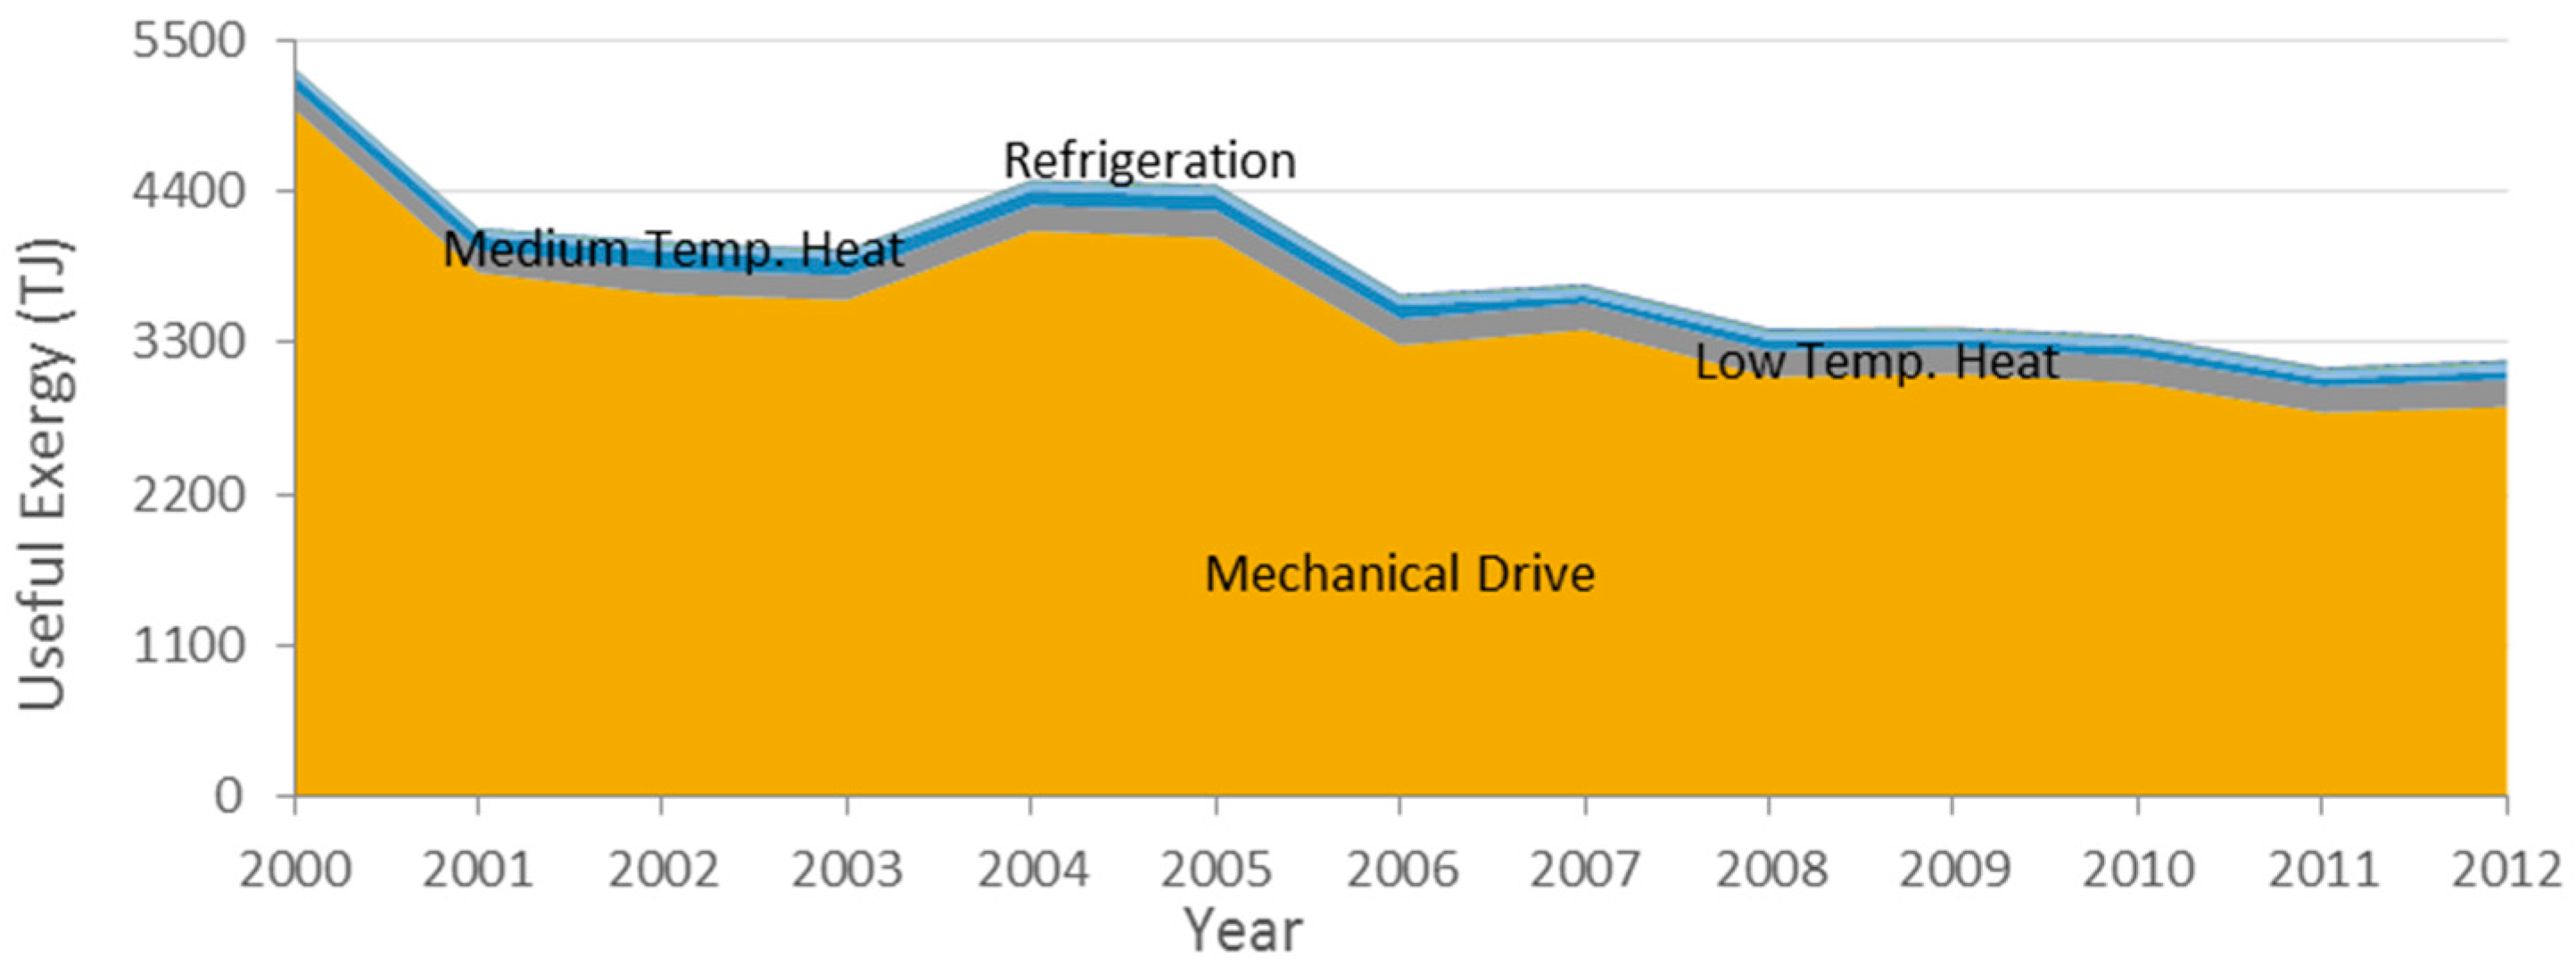
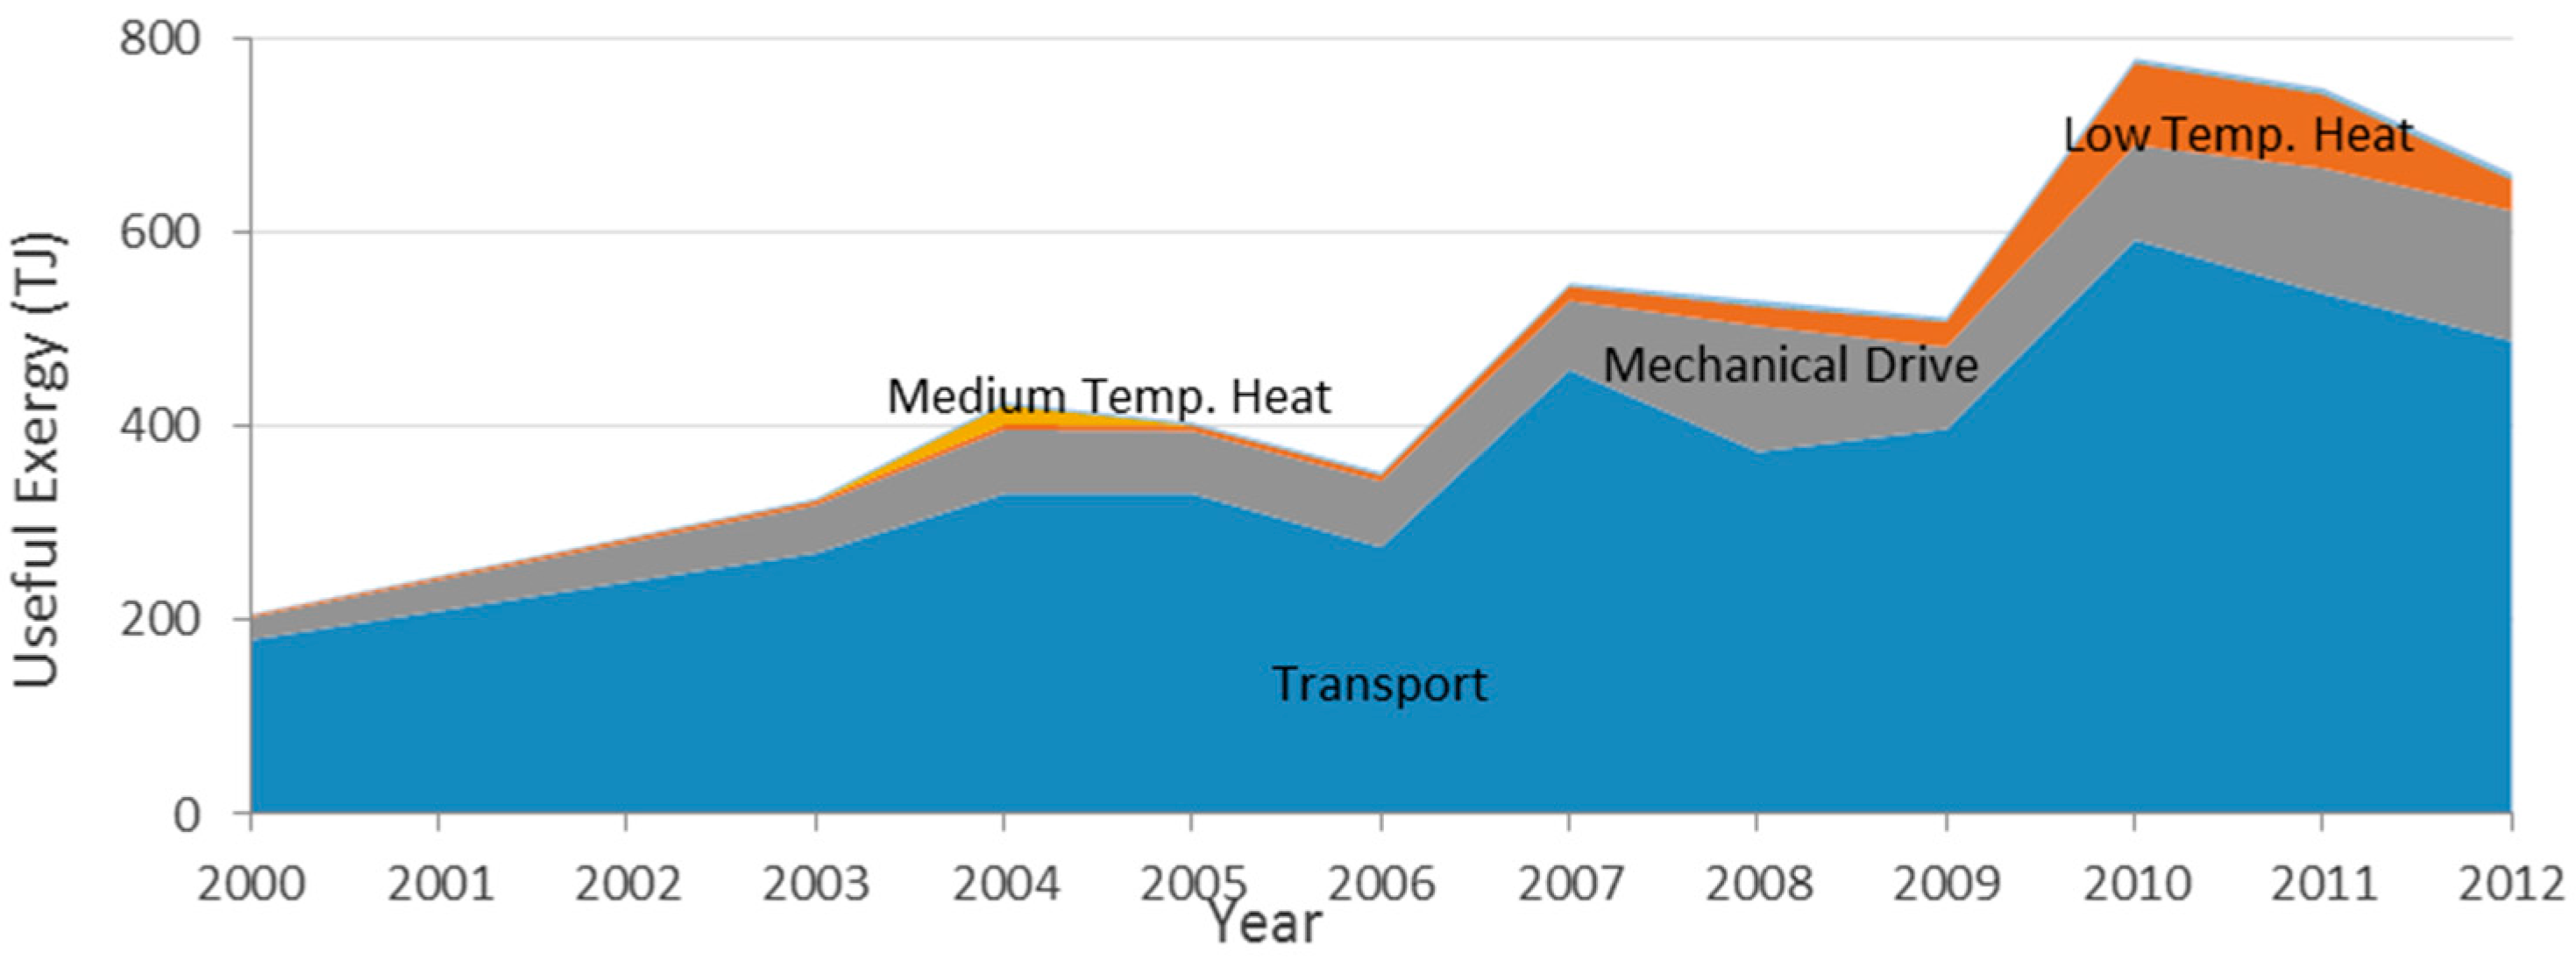
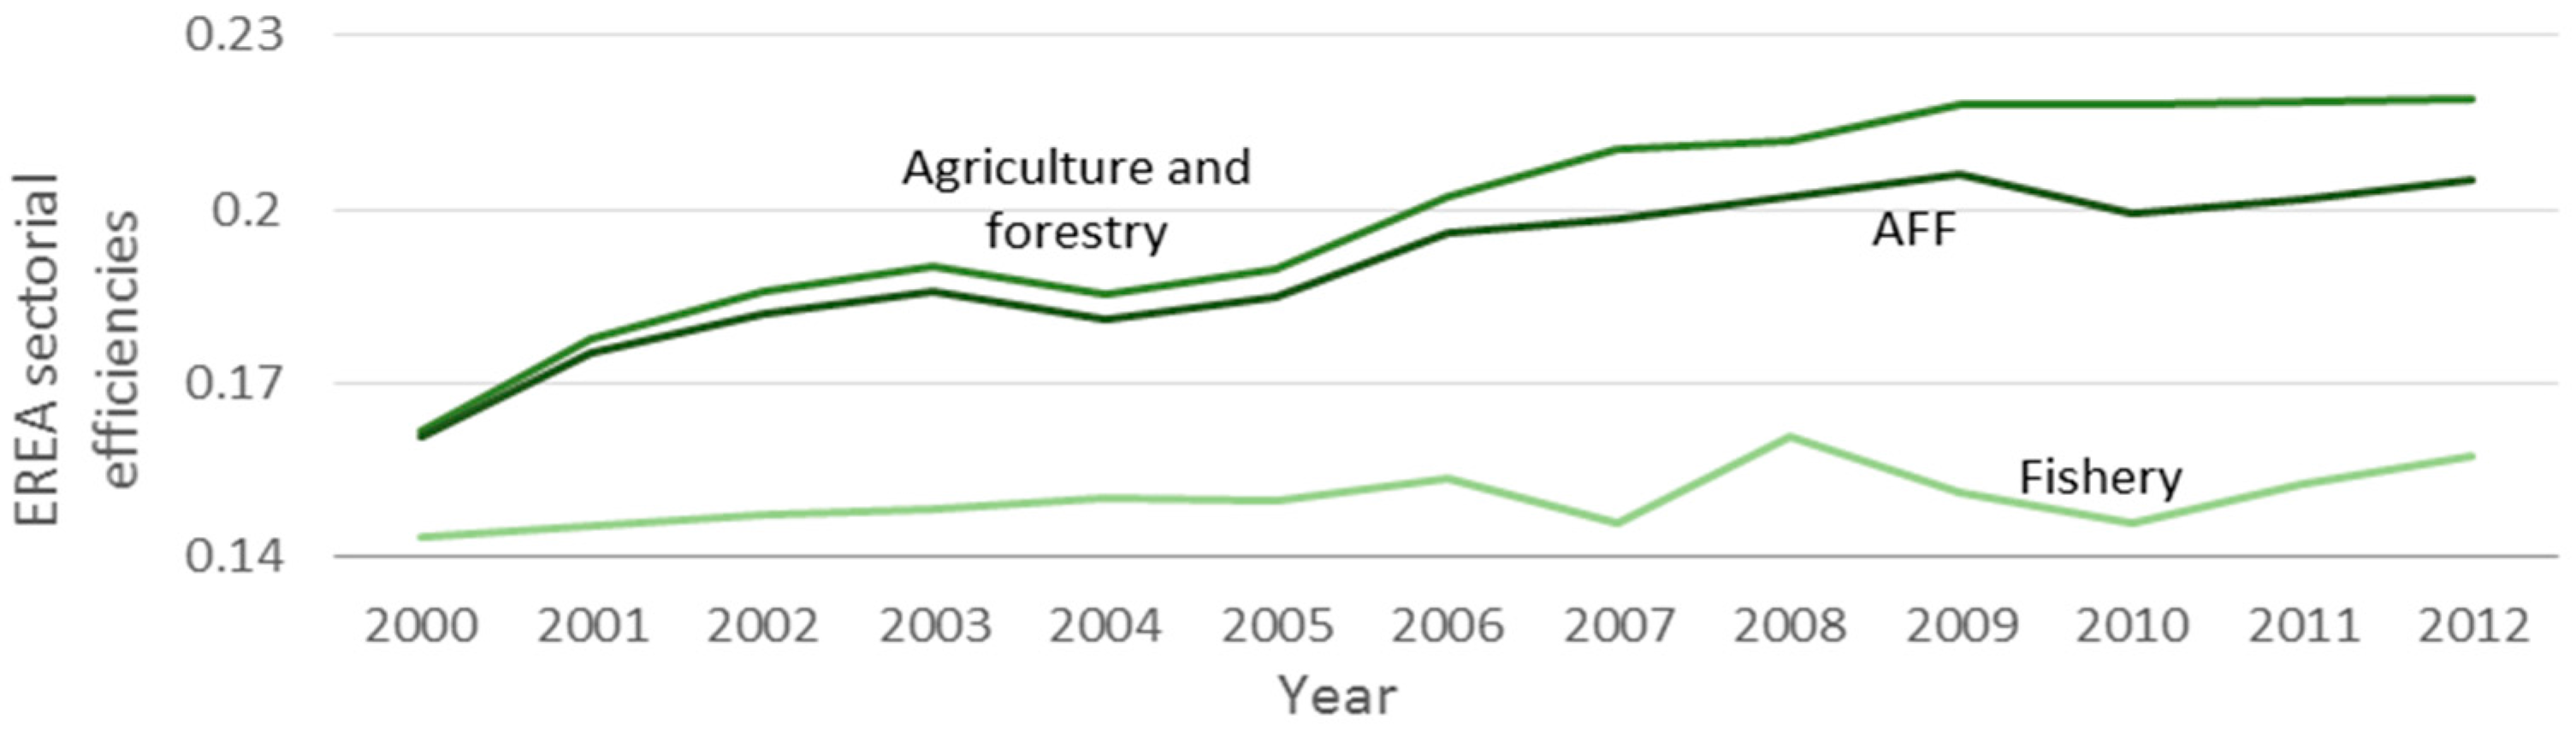
Energy resources’ exergy accounting (EREA) only addresses one type of inputs—energy carriers—to estimate the available useful exergy for its end uses and the overall efficiency. Although it estimates the actual amount of exergy that is delivered to a system function, no information regarding the output is introduced in the analysis. For Portugal, the overall efficiency reached 21% and is rapidly increasing over time due to a bigger share of the use of electricity whose efficiency is substantially higher, mainly for its predominant use in mechanical drives, mostly associated with irrigation systems. In fisheries, diesel fuel continues to be preponderant in fishing vessels, although with lower efficiencies. This explains the different performance levels of the two subsectors.
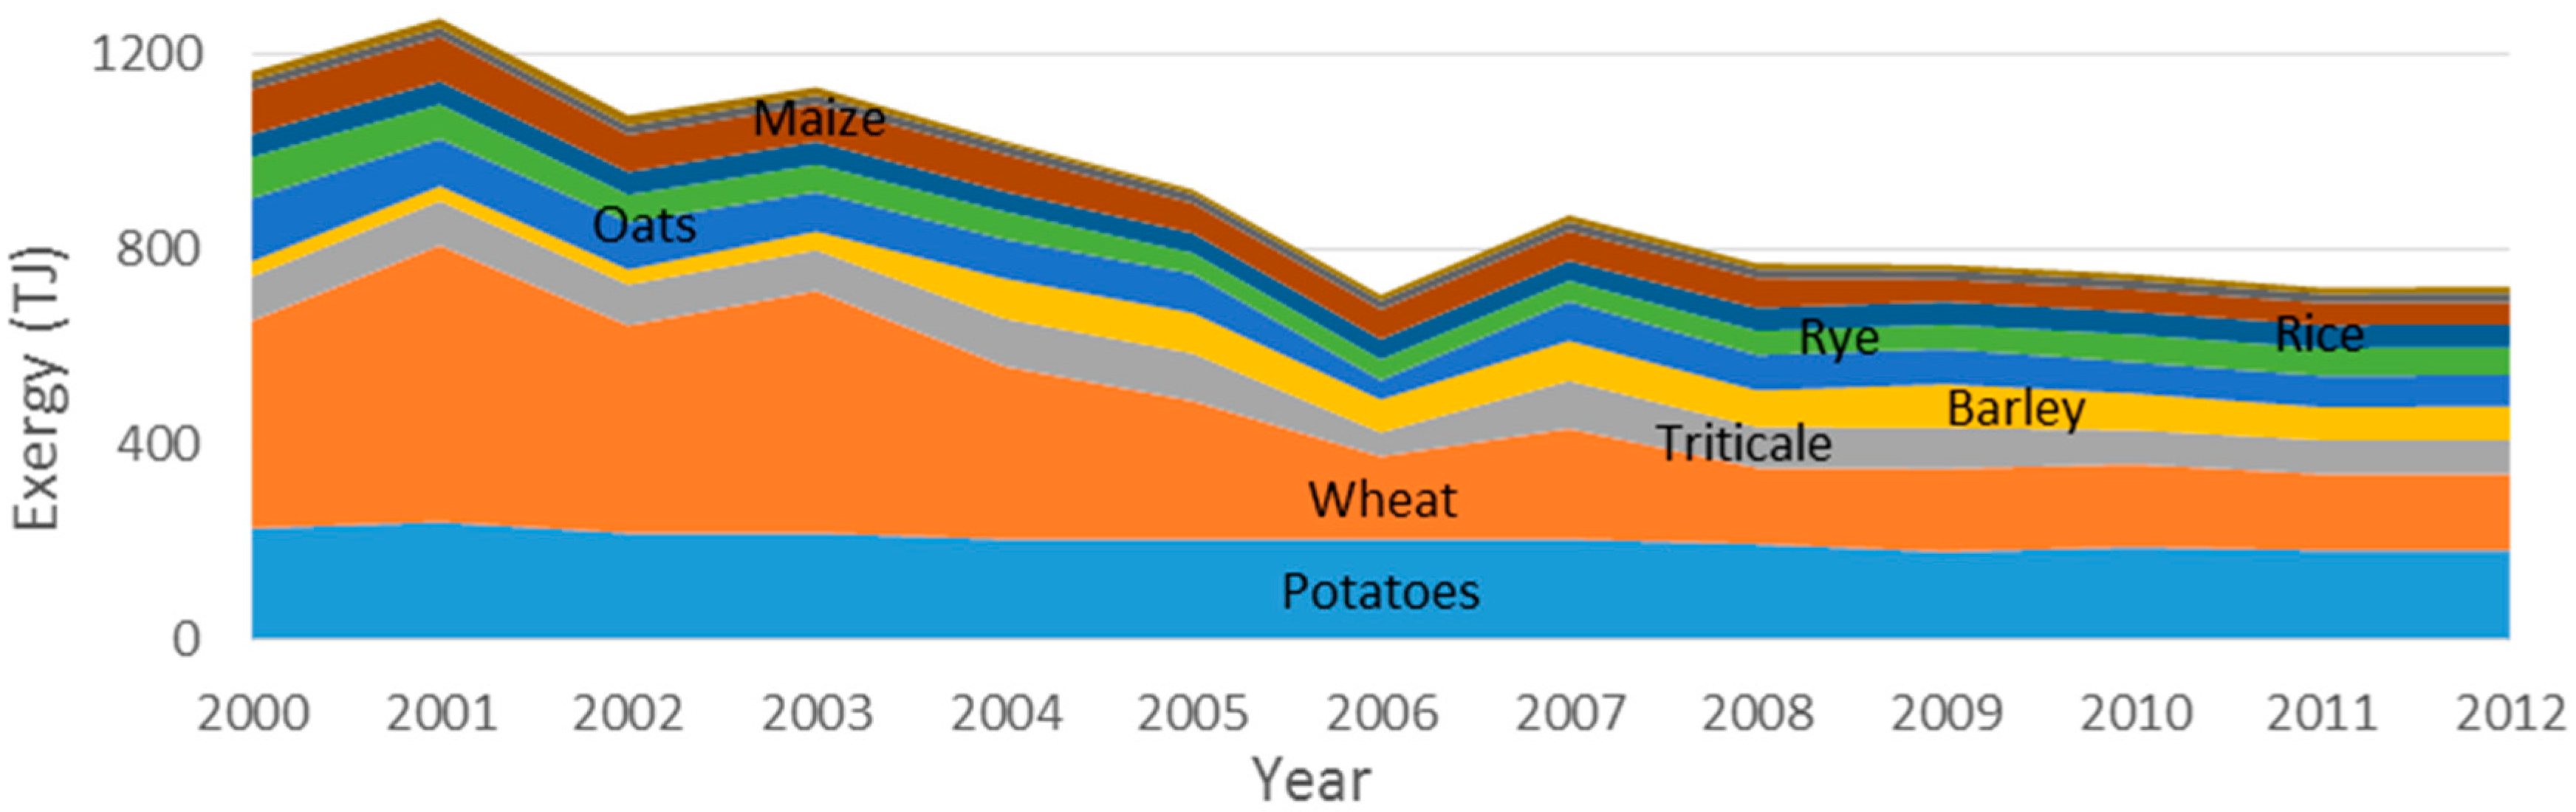
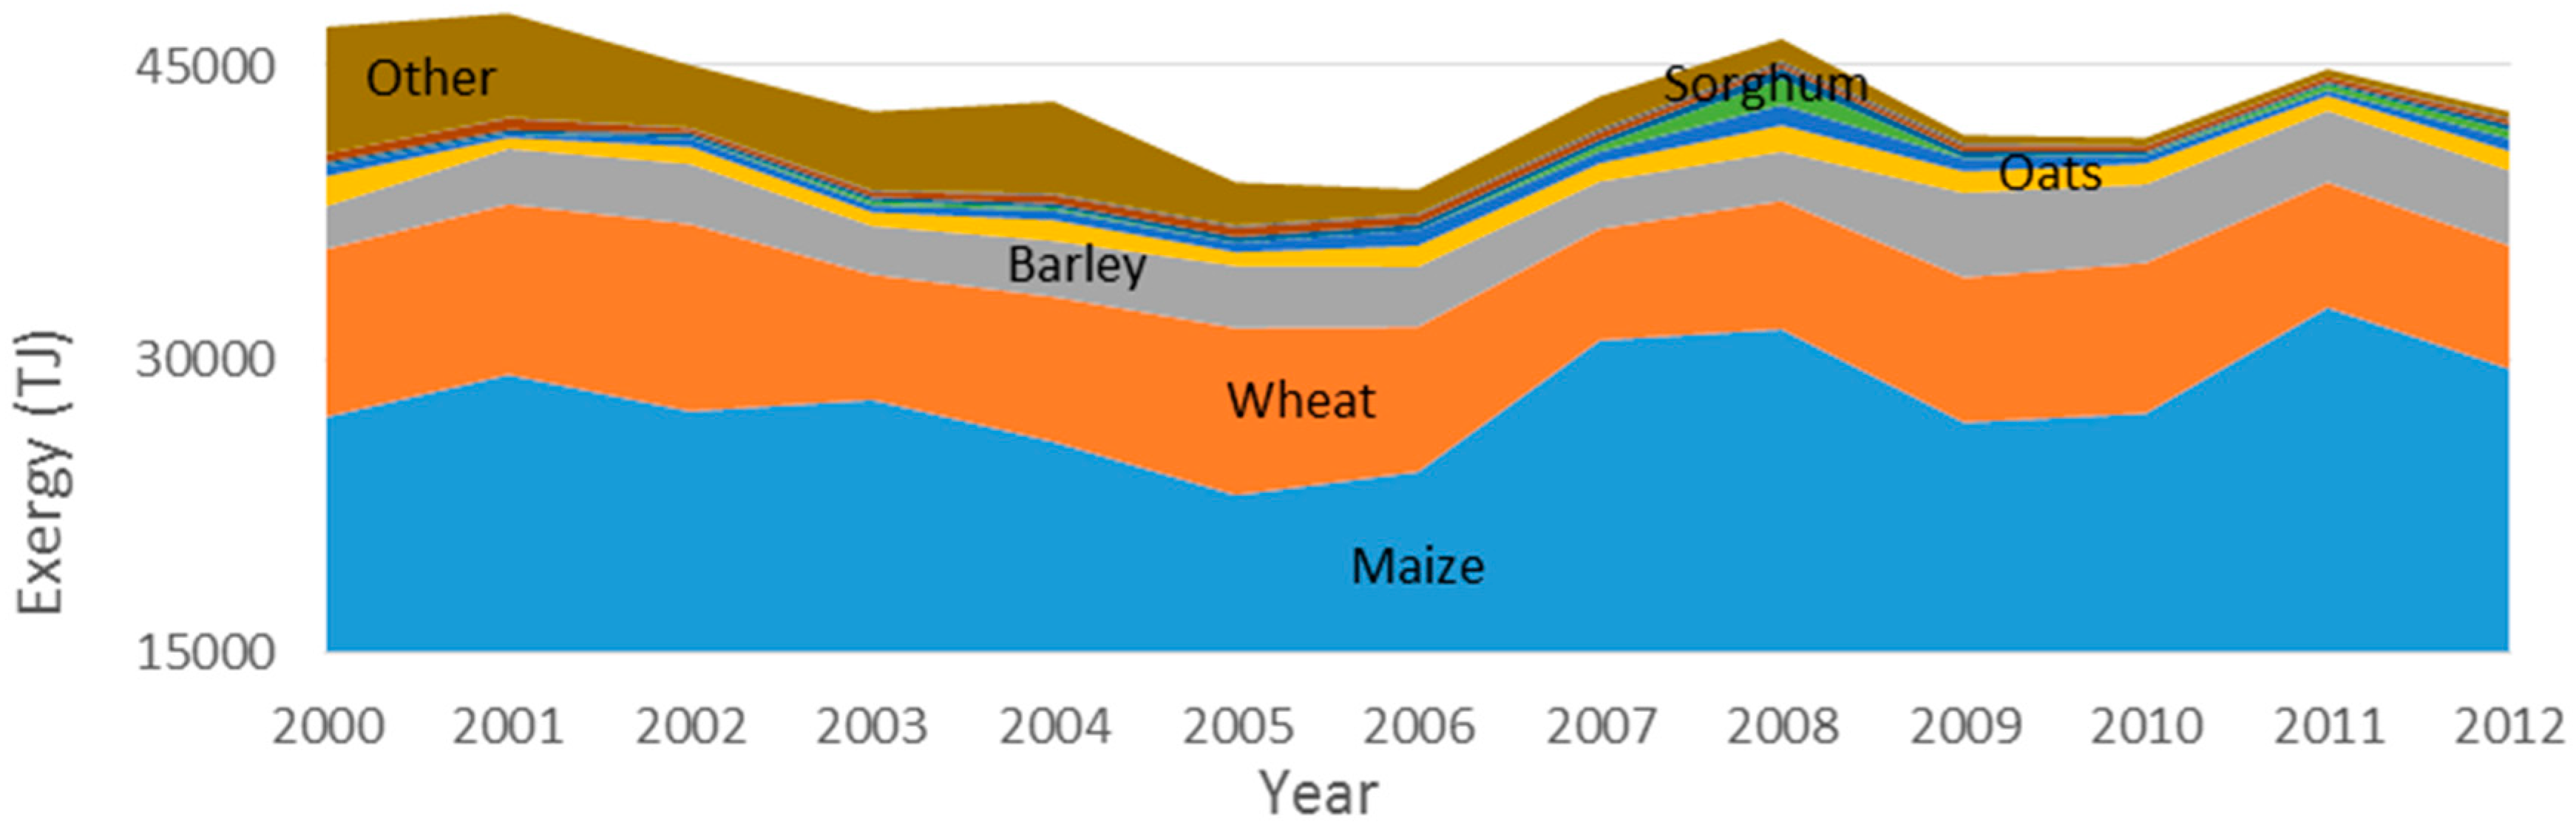
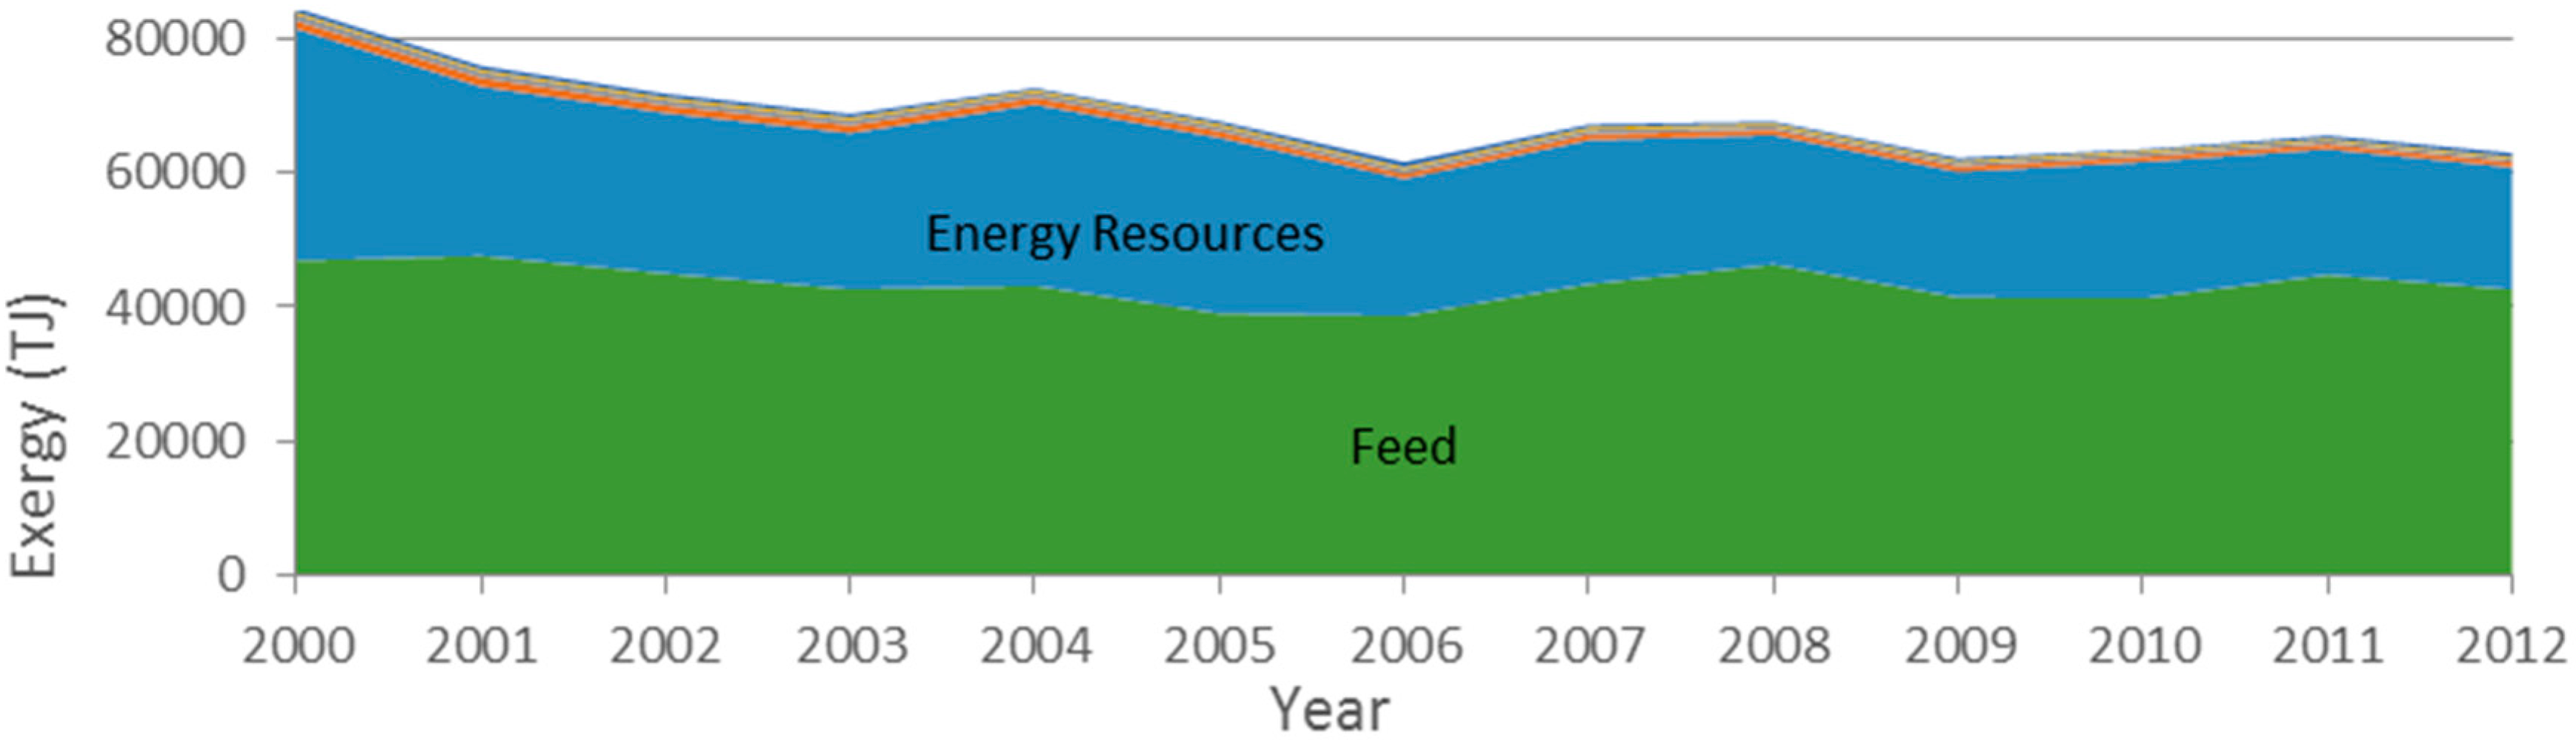
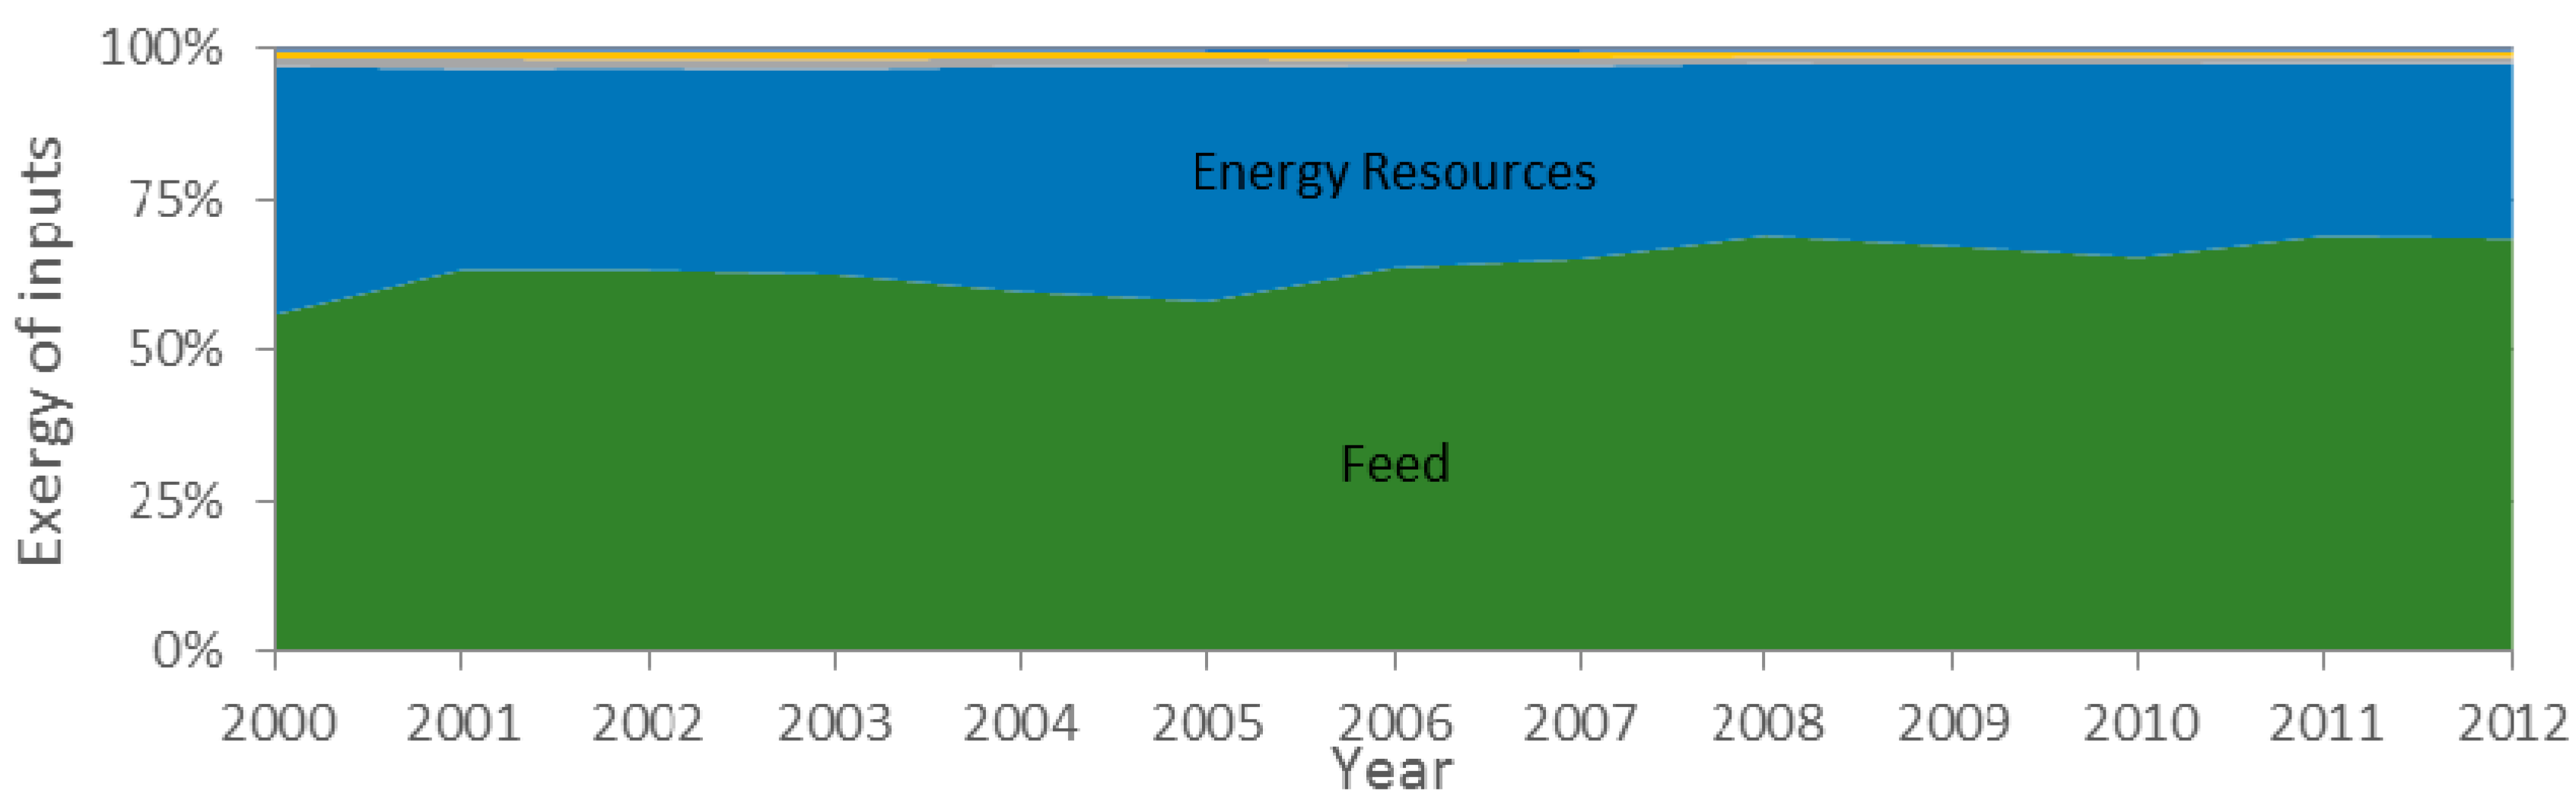
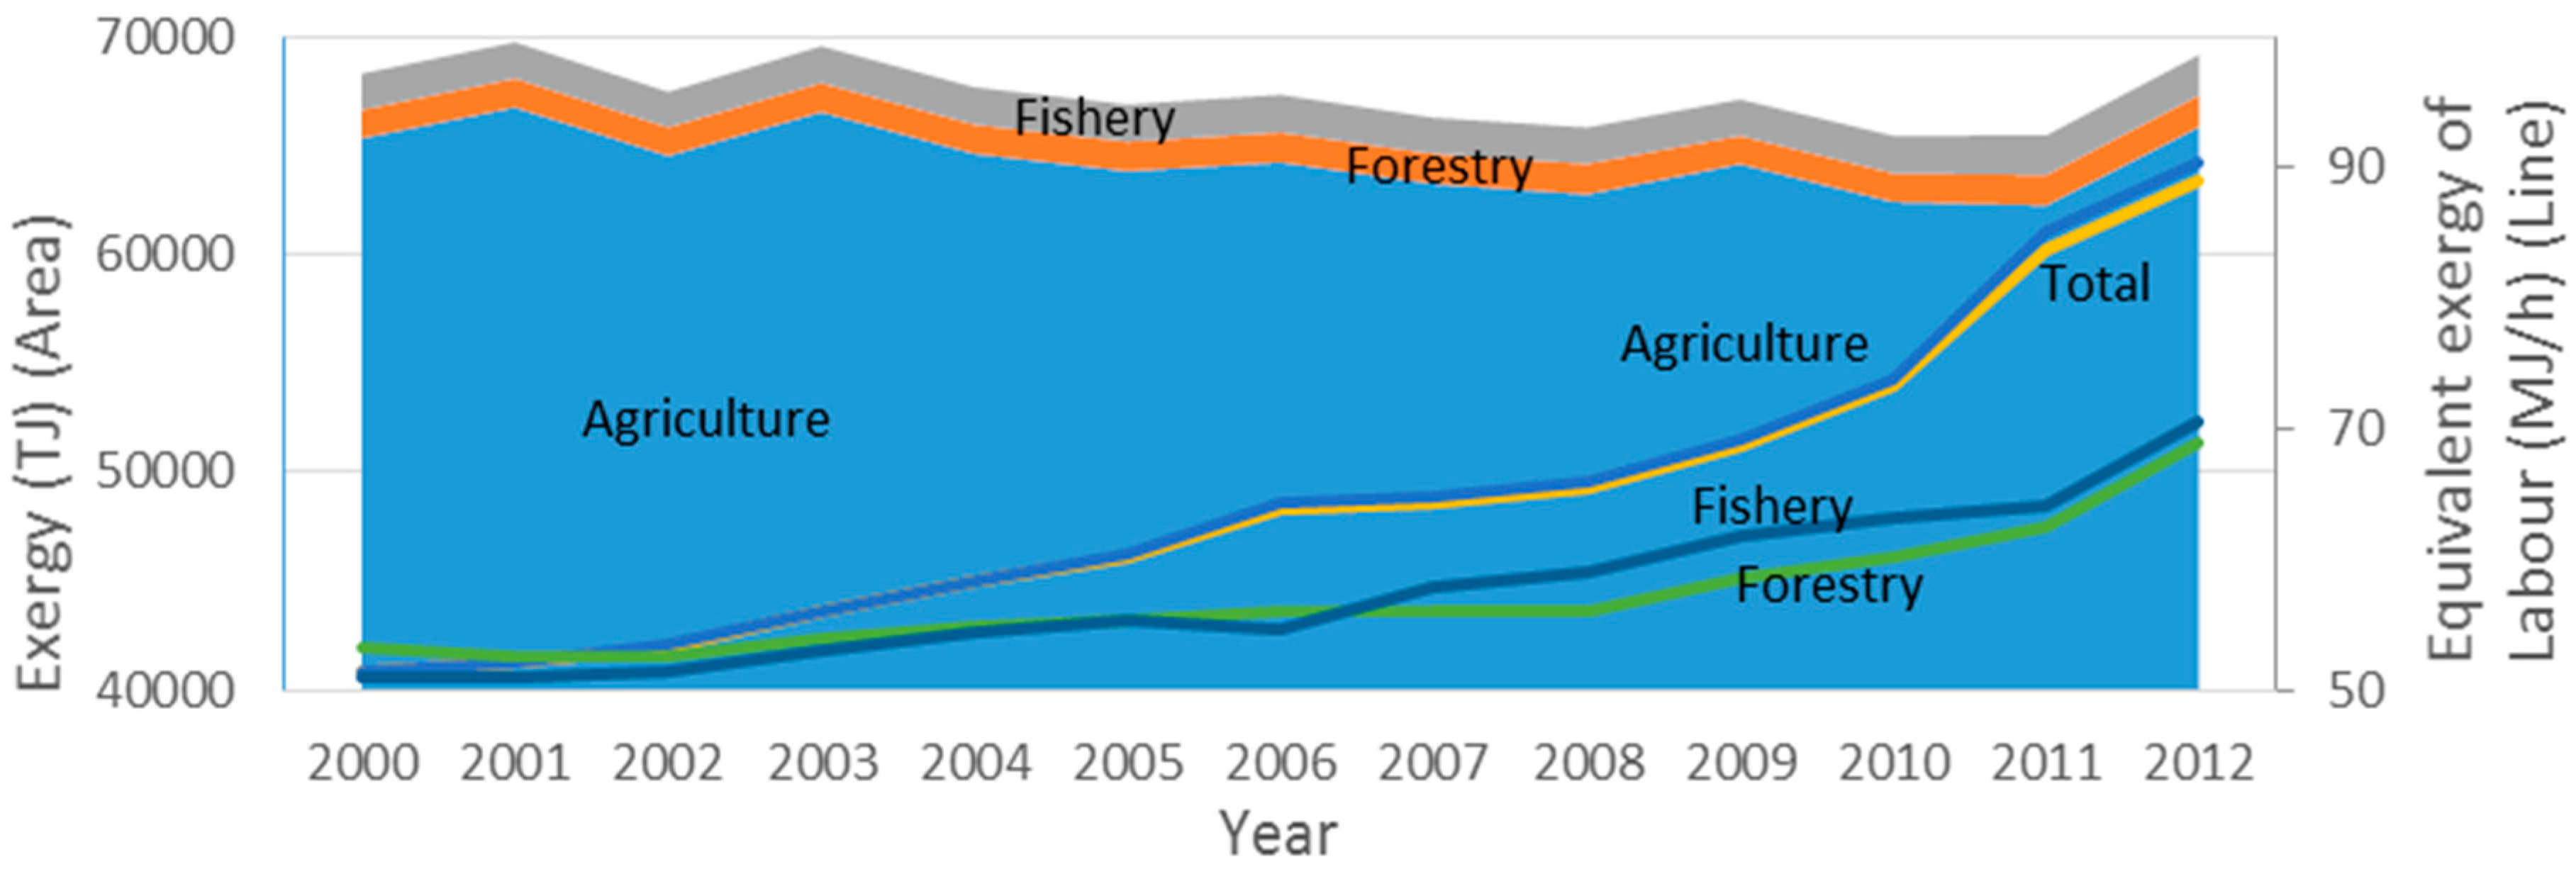
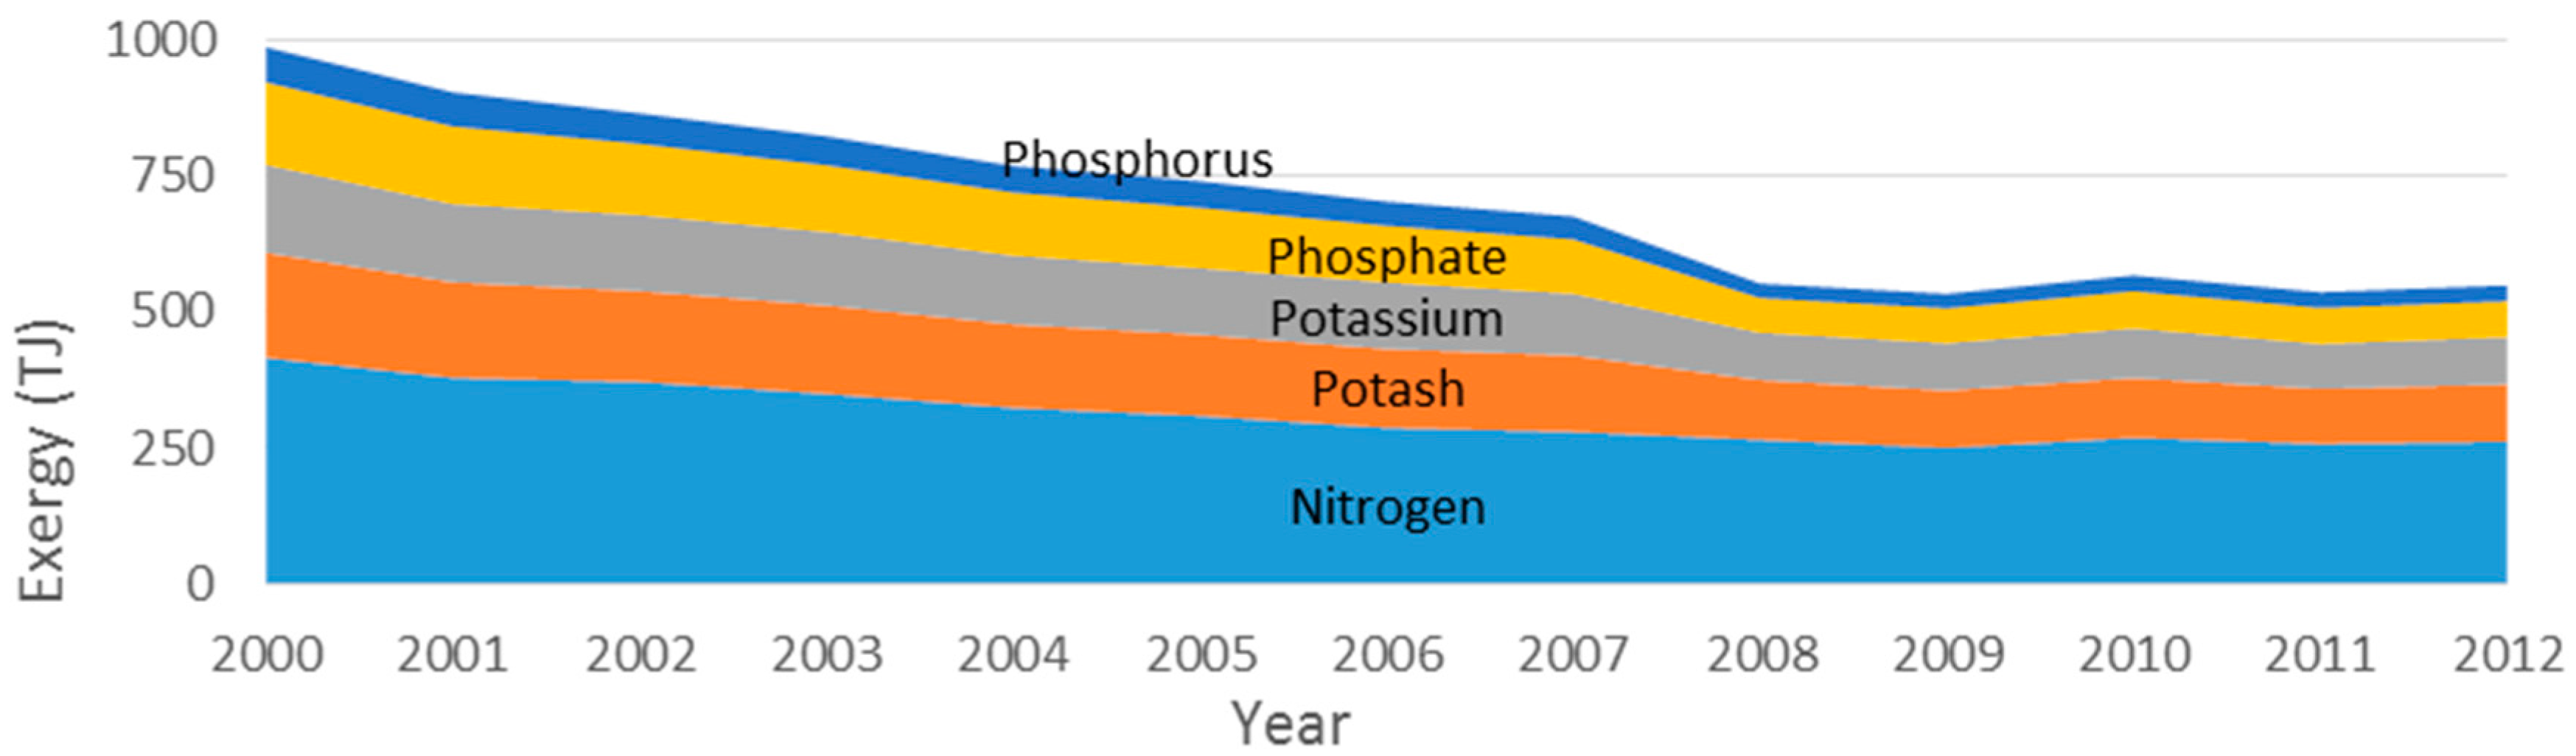
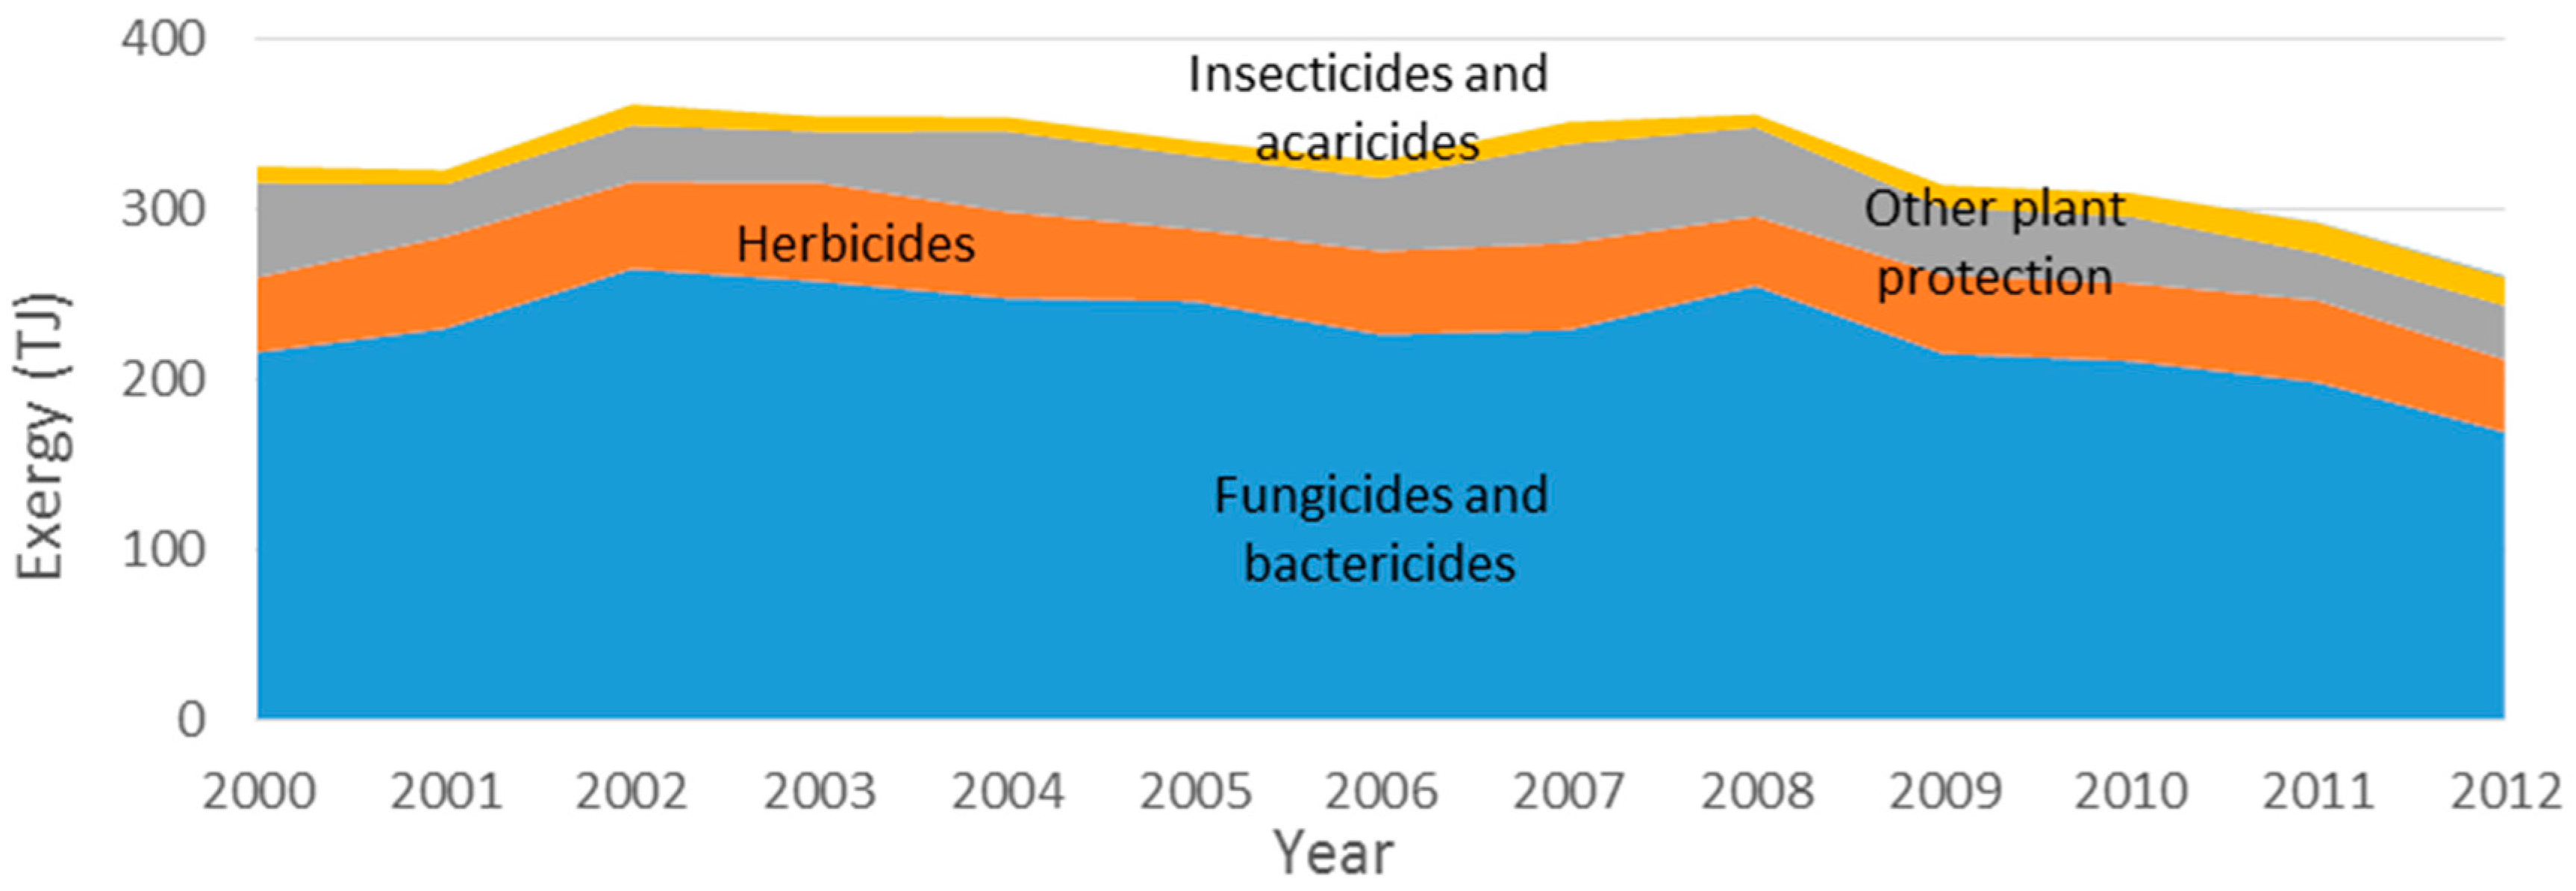
The natural resources exergy accounting (NREA) approach uses all energetic and physical inputs and outputs to describe a system’s efficiency without any knowledge about the system’s processes and resources utilization. In the present analysis, all inputs were accounted for only by their intrinsic exergies values, not by their cumulative exergy values. The exergy that has been used to transform and bring the inputs to the boundaries of the AFF sector are integrated in the other economic sectors like industry for the fertilizers and pesticides, extraction and conversion for energy carriers and tertiary and transportation for almost all. The exergy input has decreased 24% since 2000 (
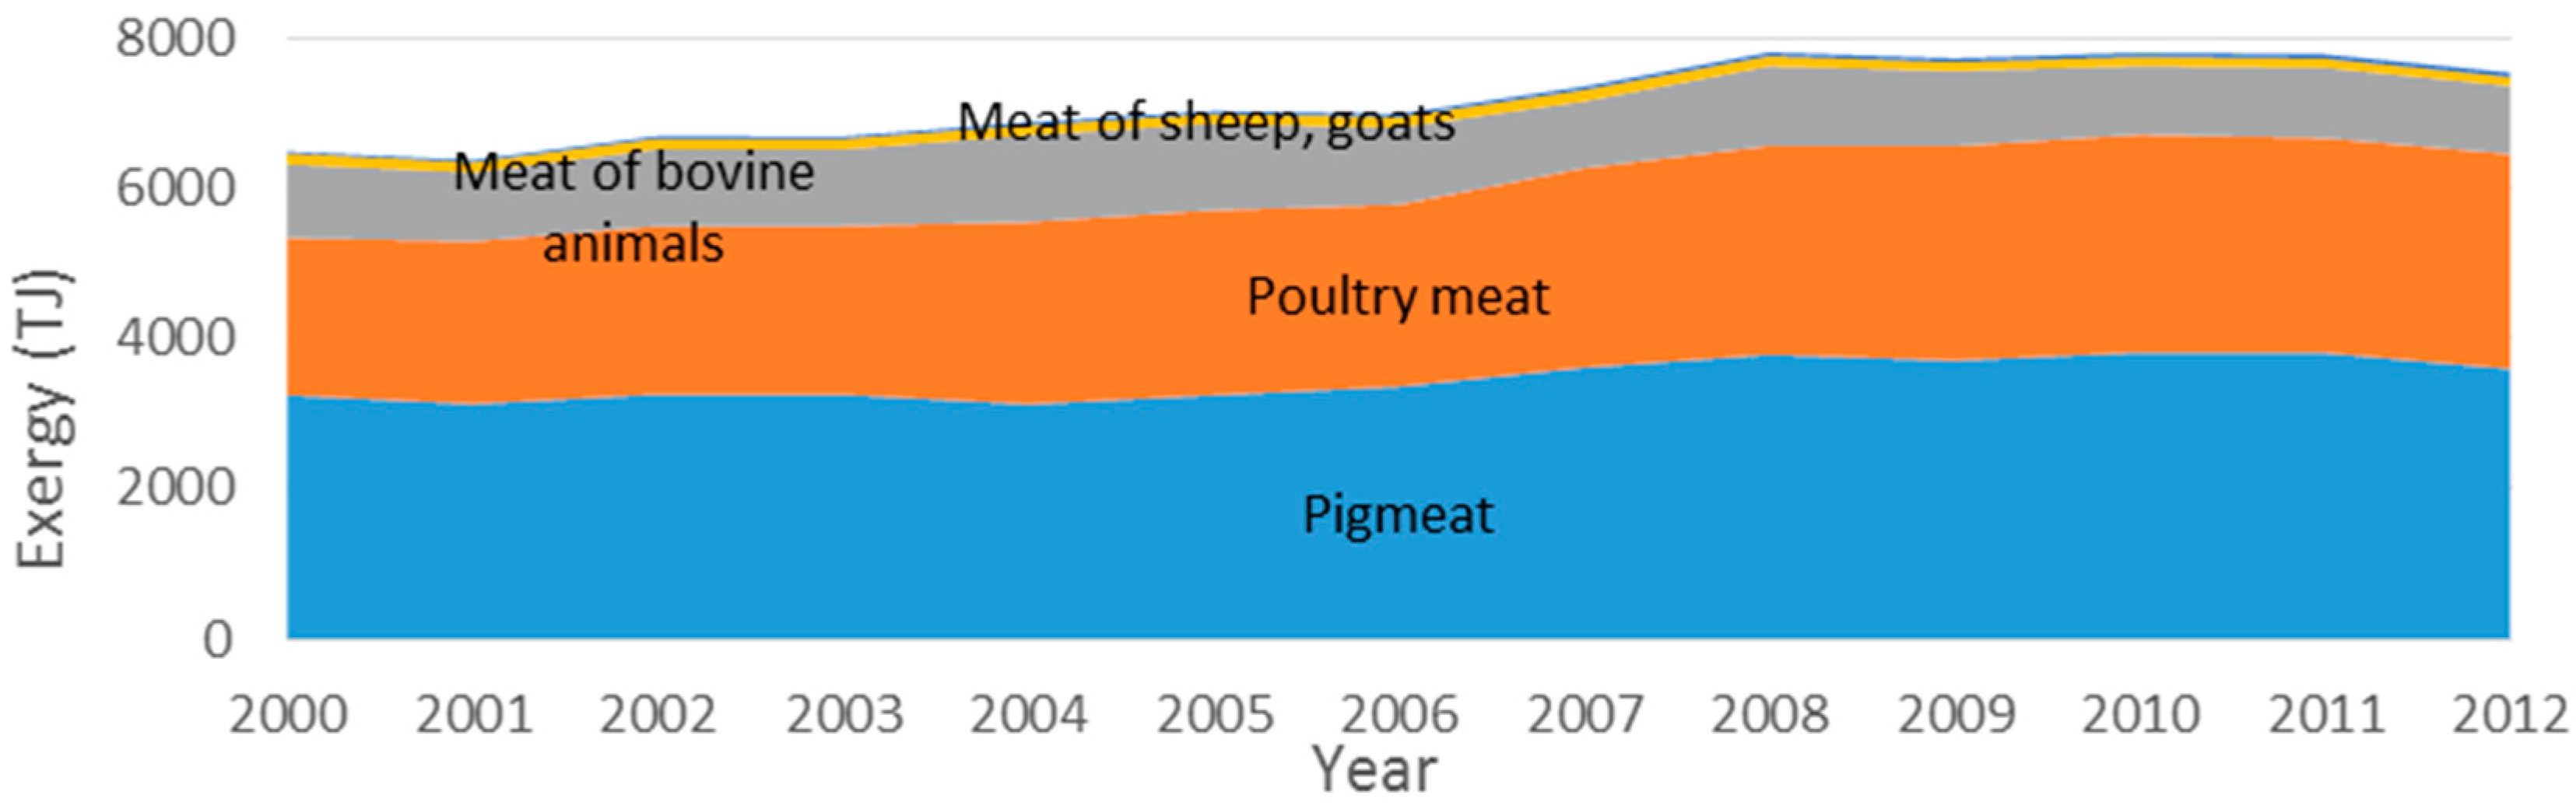
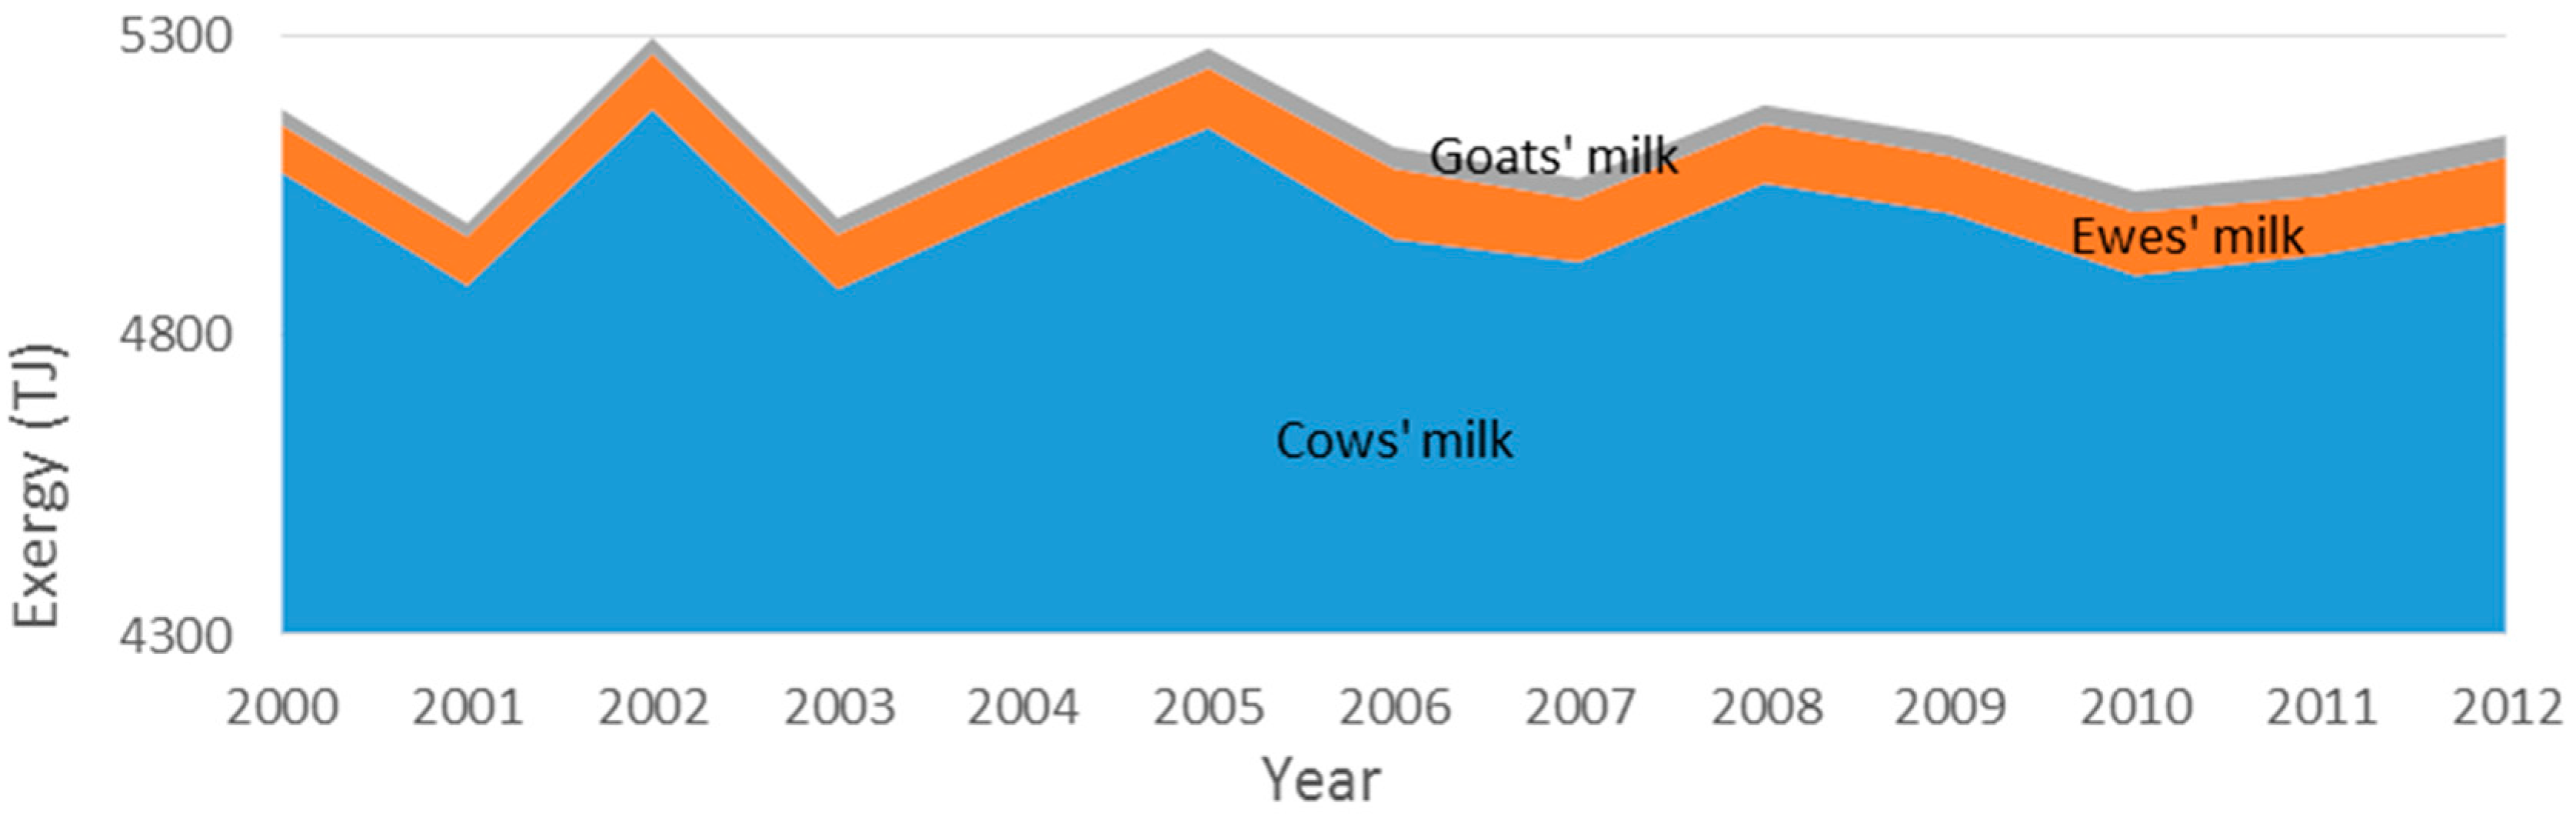
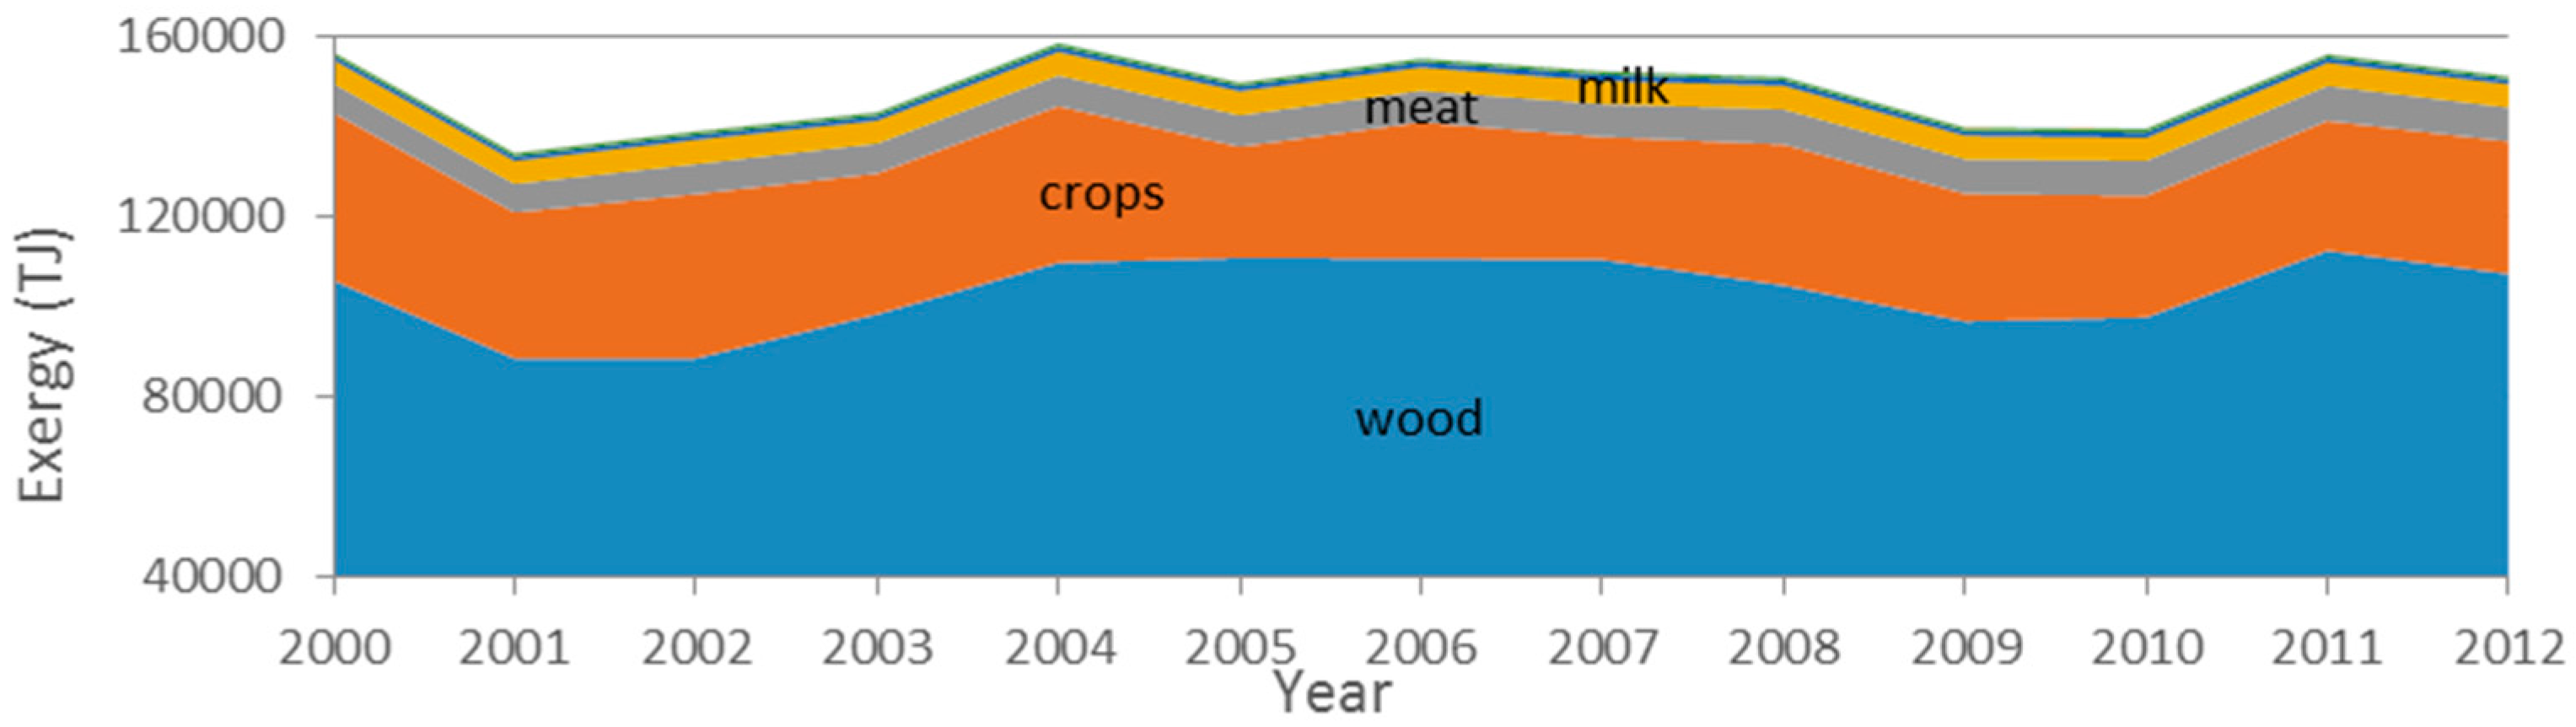
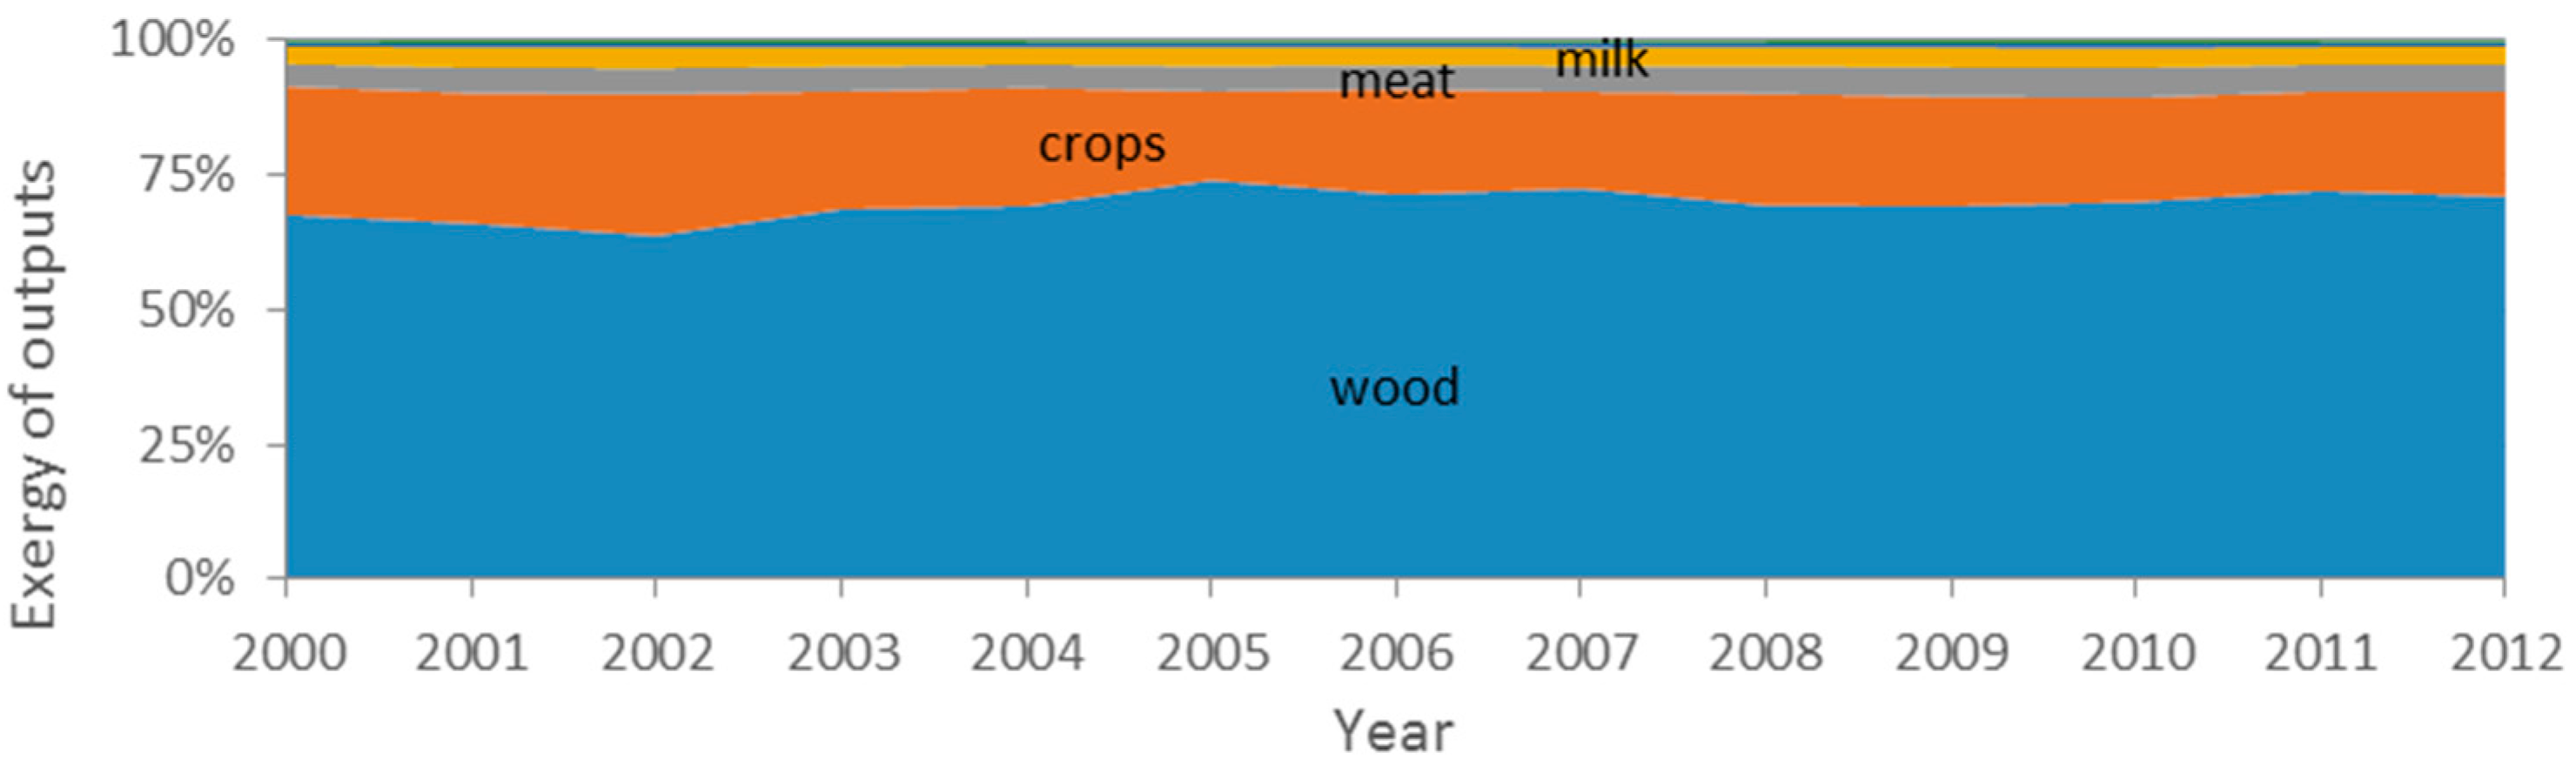
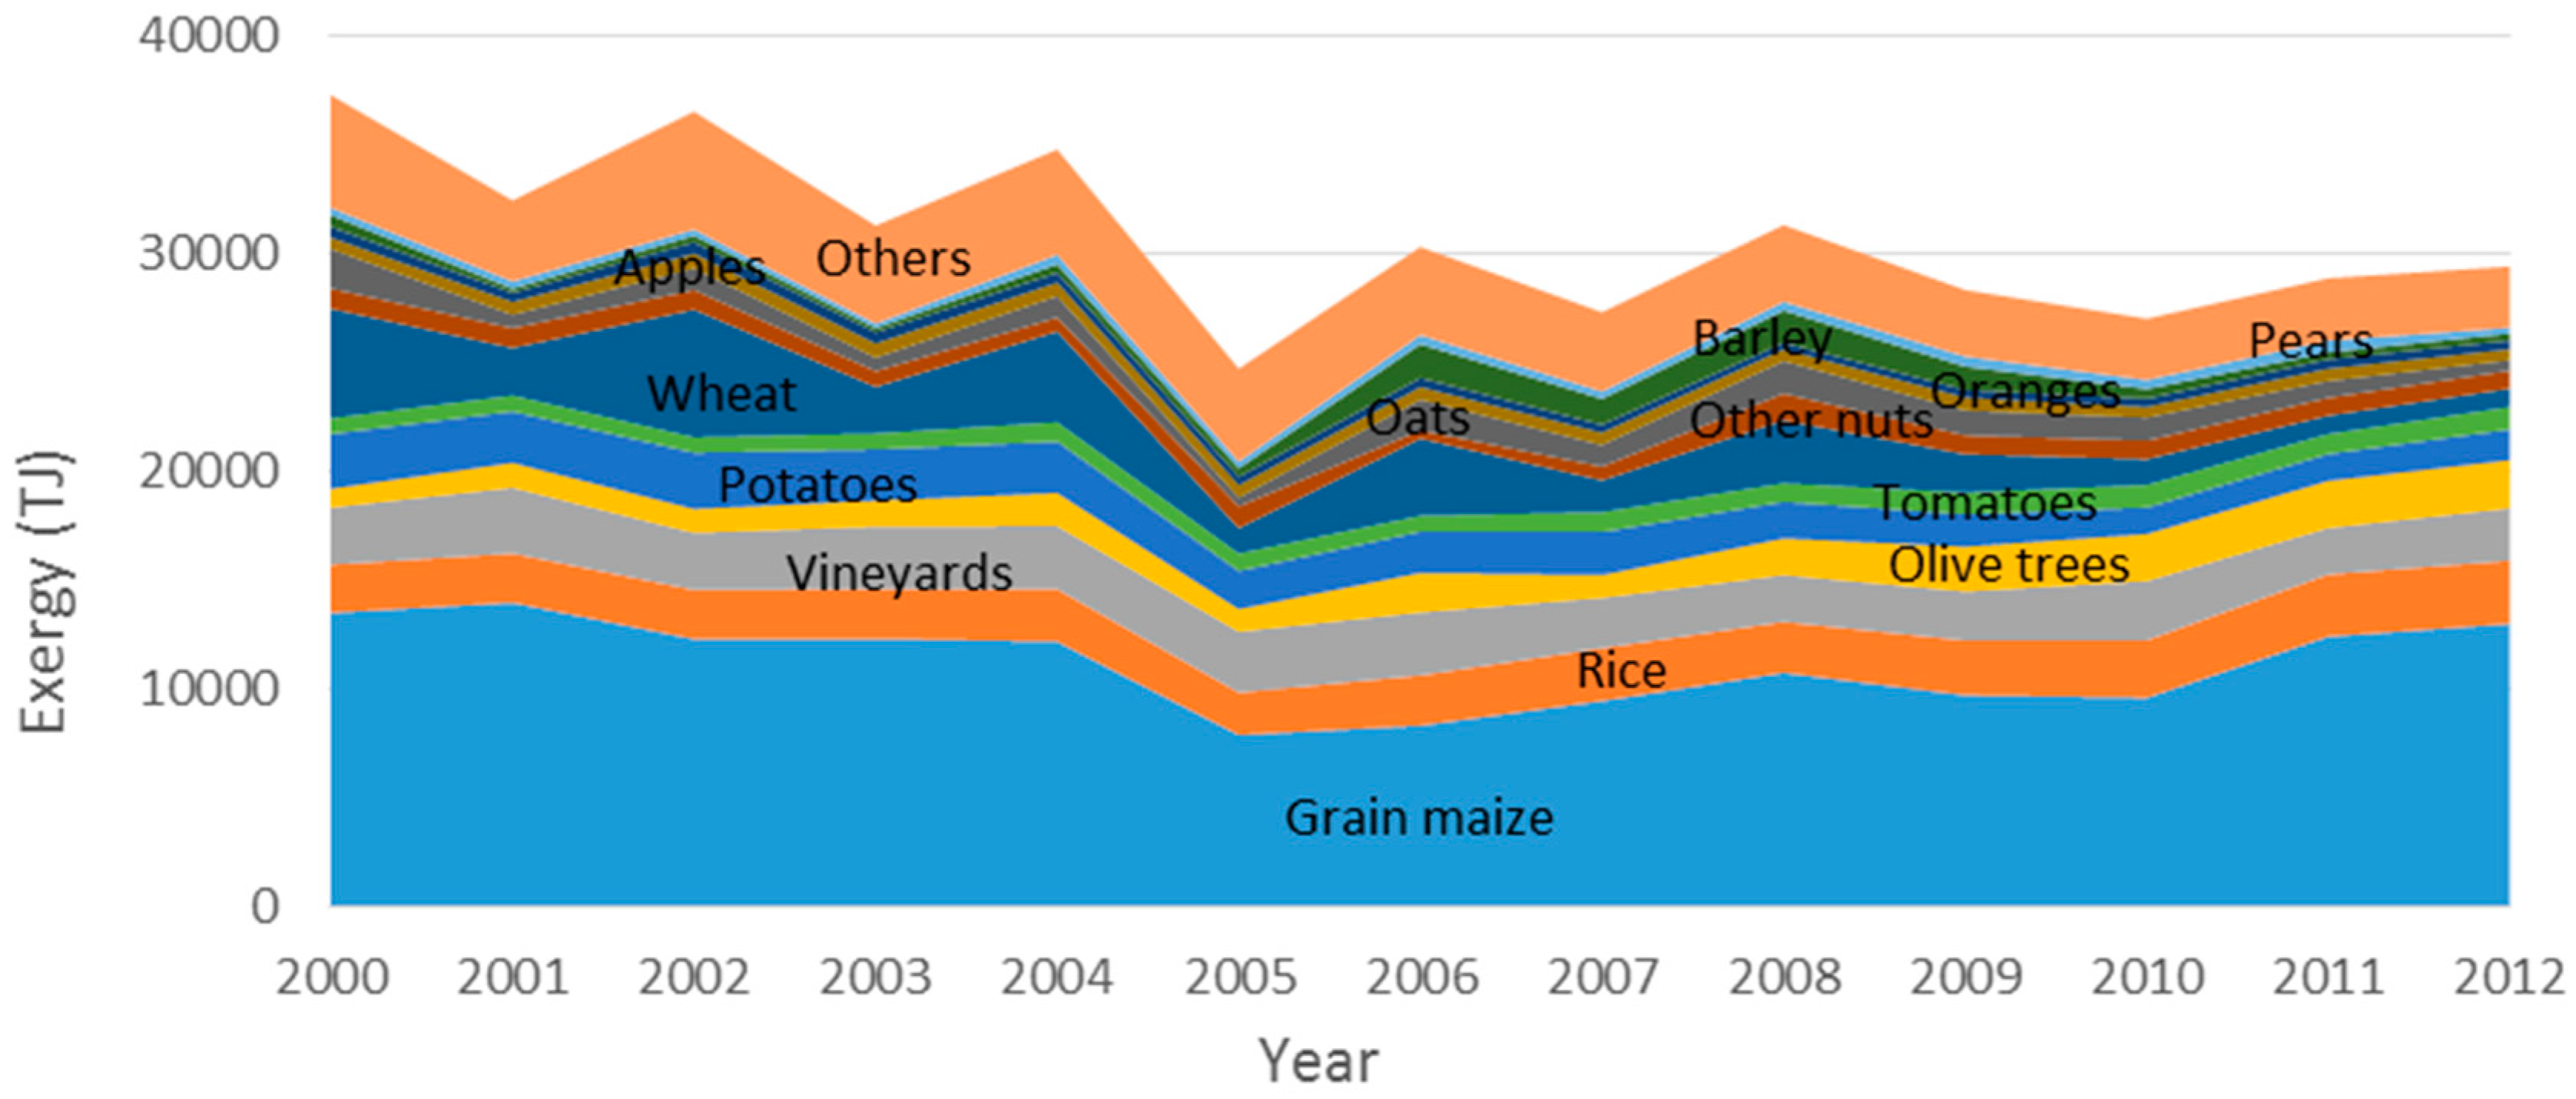
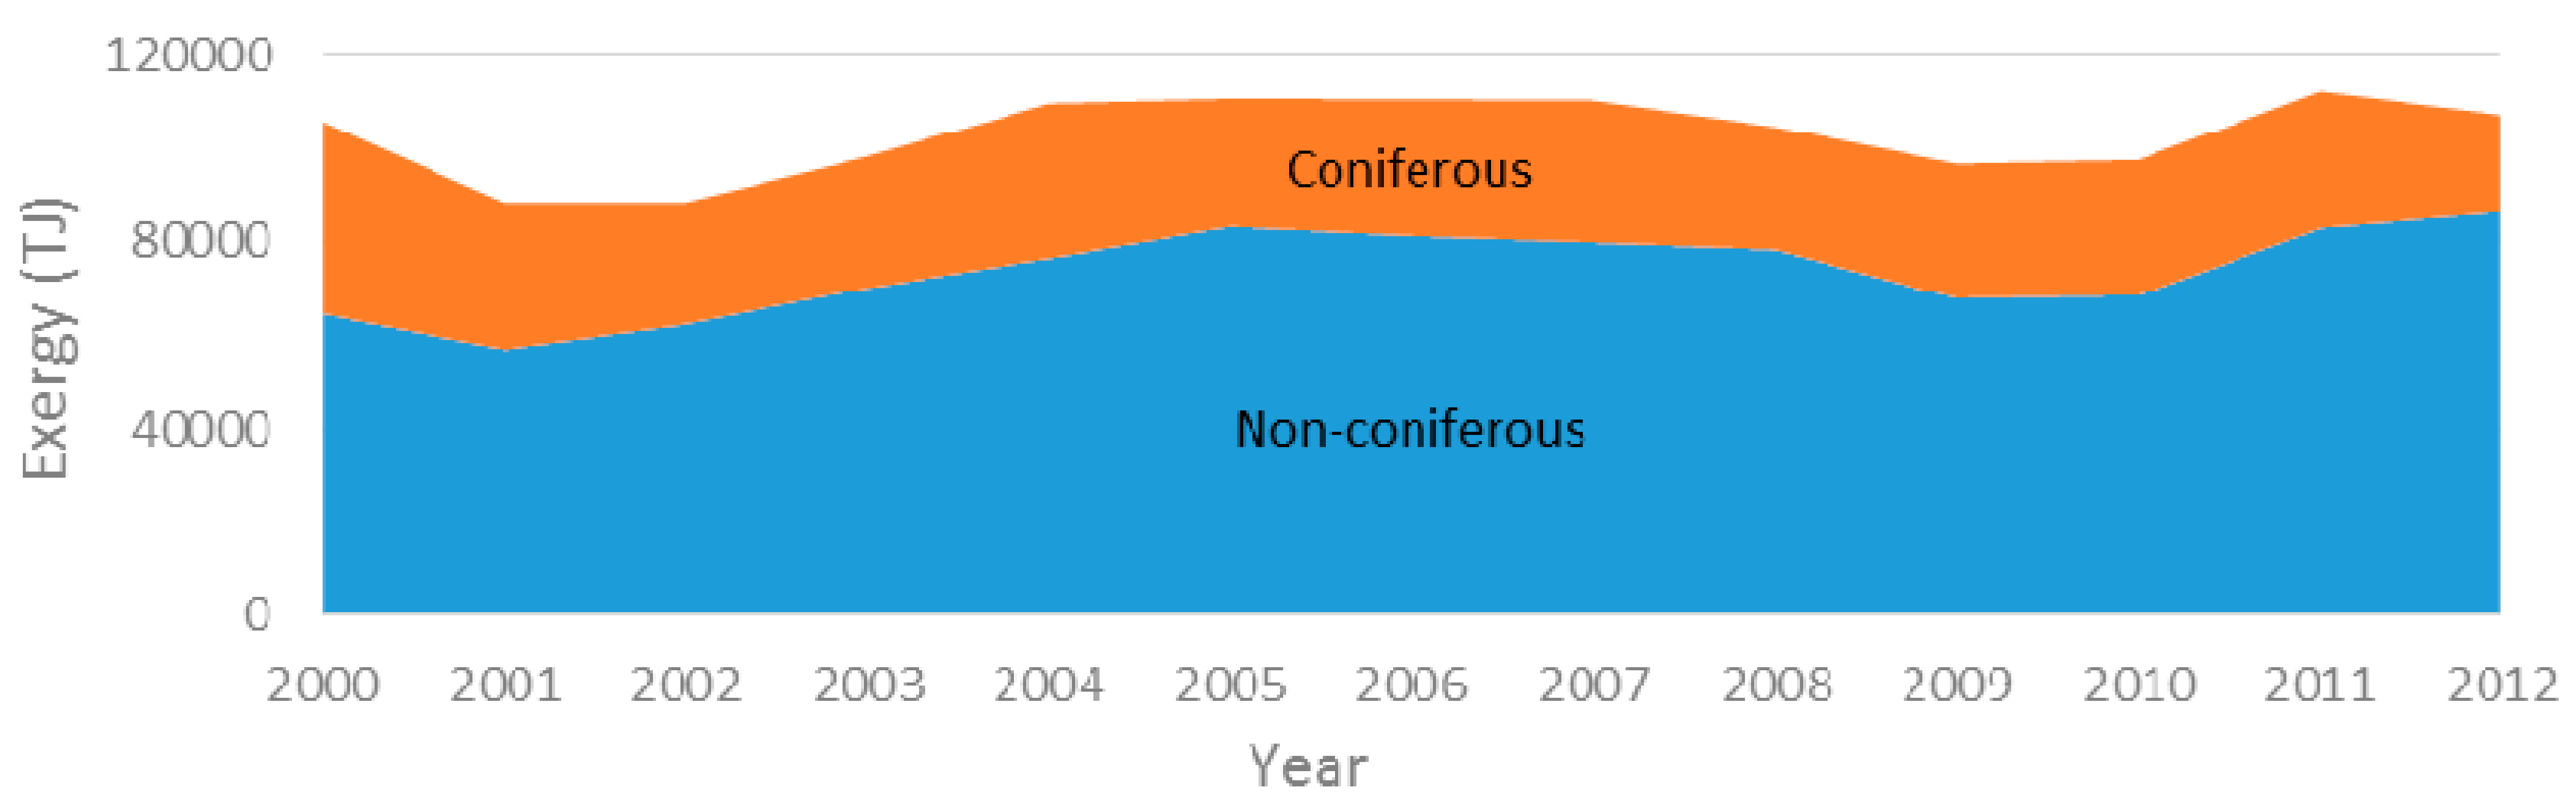
Figure 13) with feed for animal husbandry representing the biggest share (68% in 2012), followed by the energy resources. The exergy of feed is on average 140% superior to the exergy of all crops harvested, which means that Portuguese agriculture does not produce enough to support its animal husbandry. Feed does not consider green fodder, pasture, meadows and straw because these are internally produced and consumed in the sector. The output-input ratio of animal husbandry (with feed and incubation eggs as inputs, only) evolved from 26%, in 2000, to 31% in 2012. This positive evolution indicates either a better use of feed in livestock production or a bigger share of non-accounted feed. The exergy output from the sector is mostly embedded in wood and harvested crops with wood exergy reaching a share of 71% in 2012 (Figure 11).
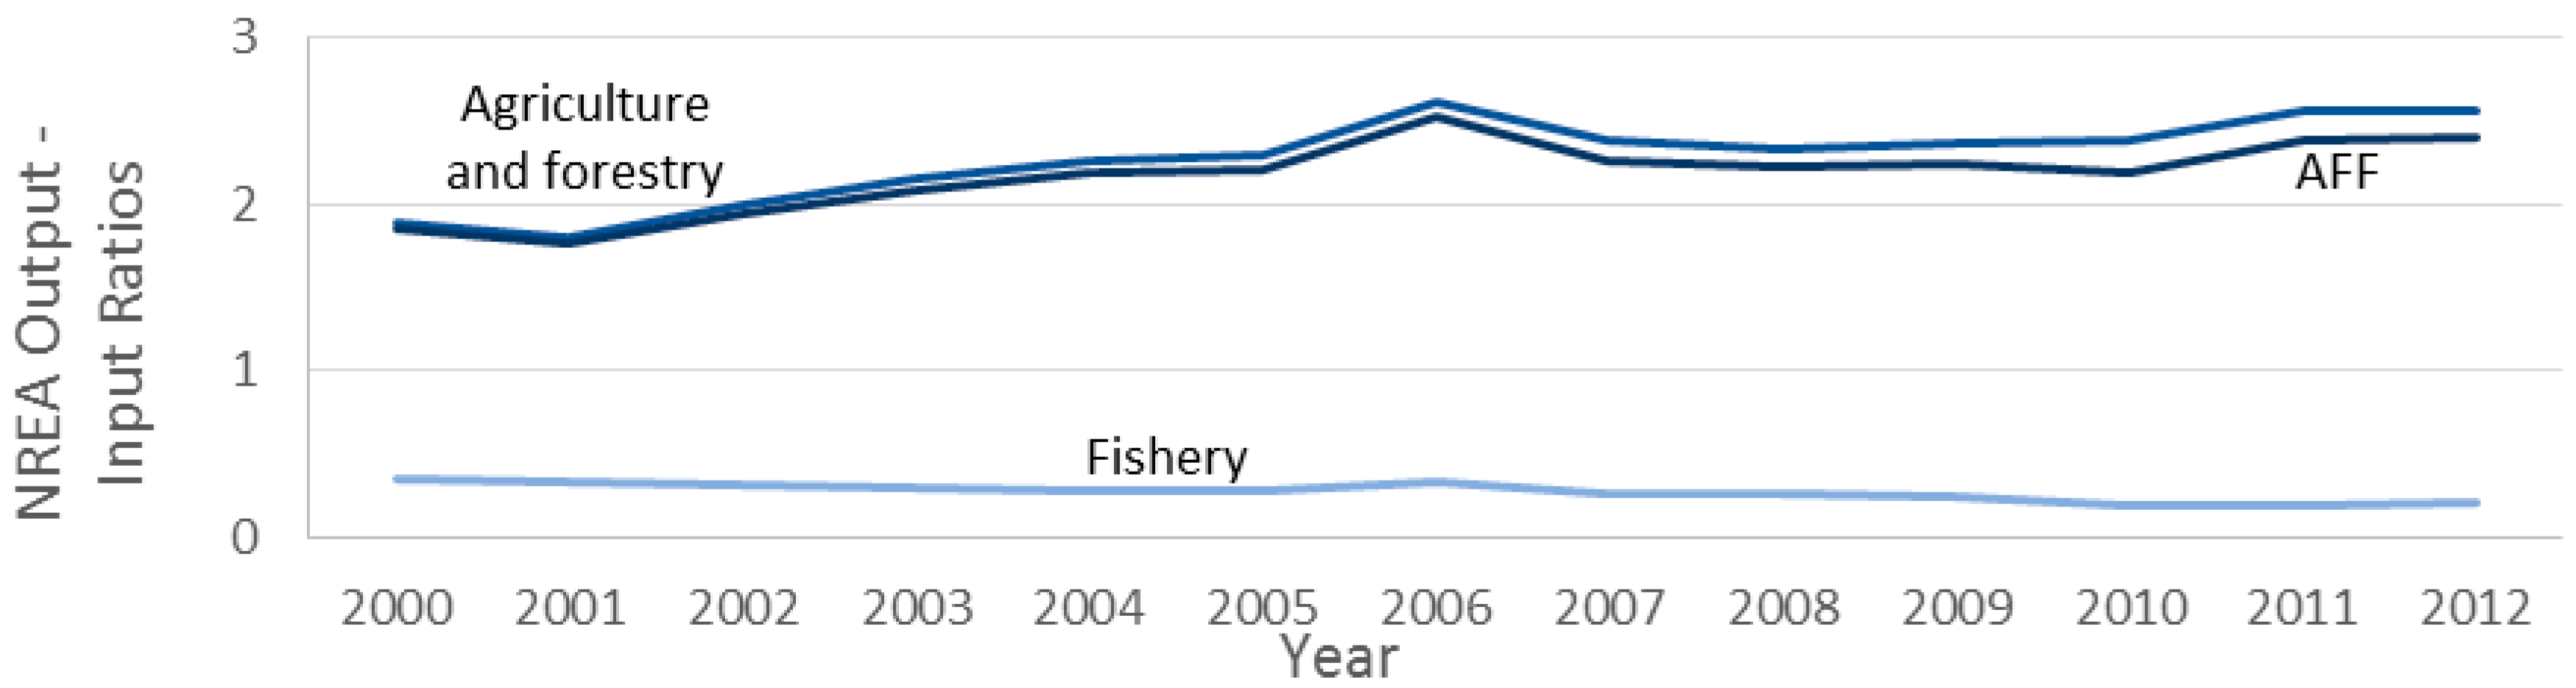
Although exergy is degraded, the output-input ratio of the agricultural and forestry subsectors can be higher than one (contrary to other economic sectors except extraction and conversion based on renewables) because solar radiation is not taken into account. Considering NREA, the sector’s overall ratio increased more than 27% in this period being close to 2.5 in 2012, which means that for every exergy Joule that entered in the AFF sector, two and a half Joules were harvested. Agriculture and forestry performed much better than fishery (
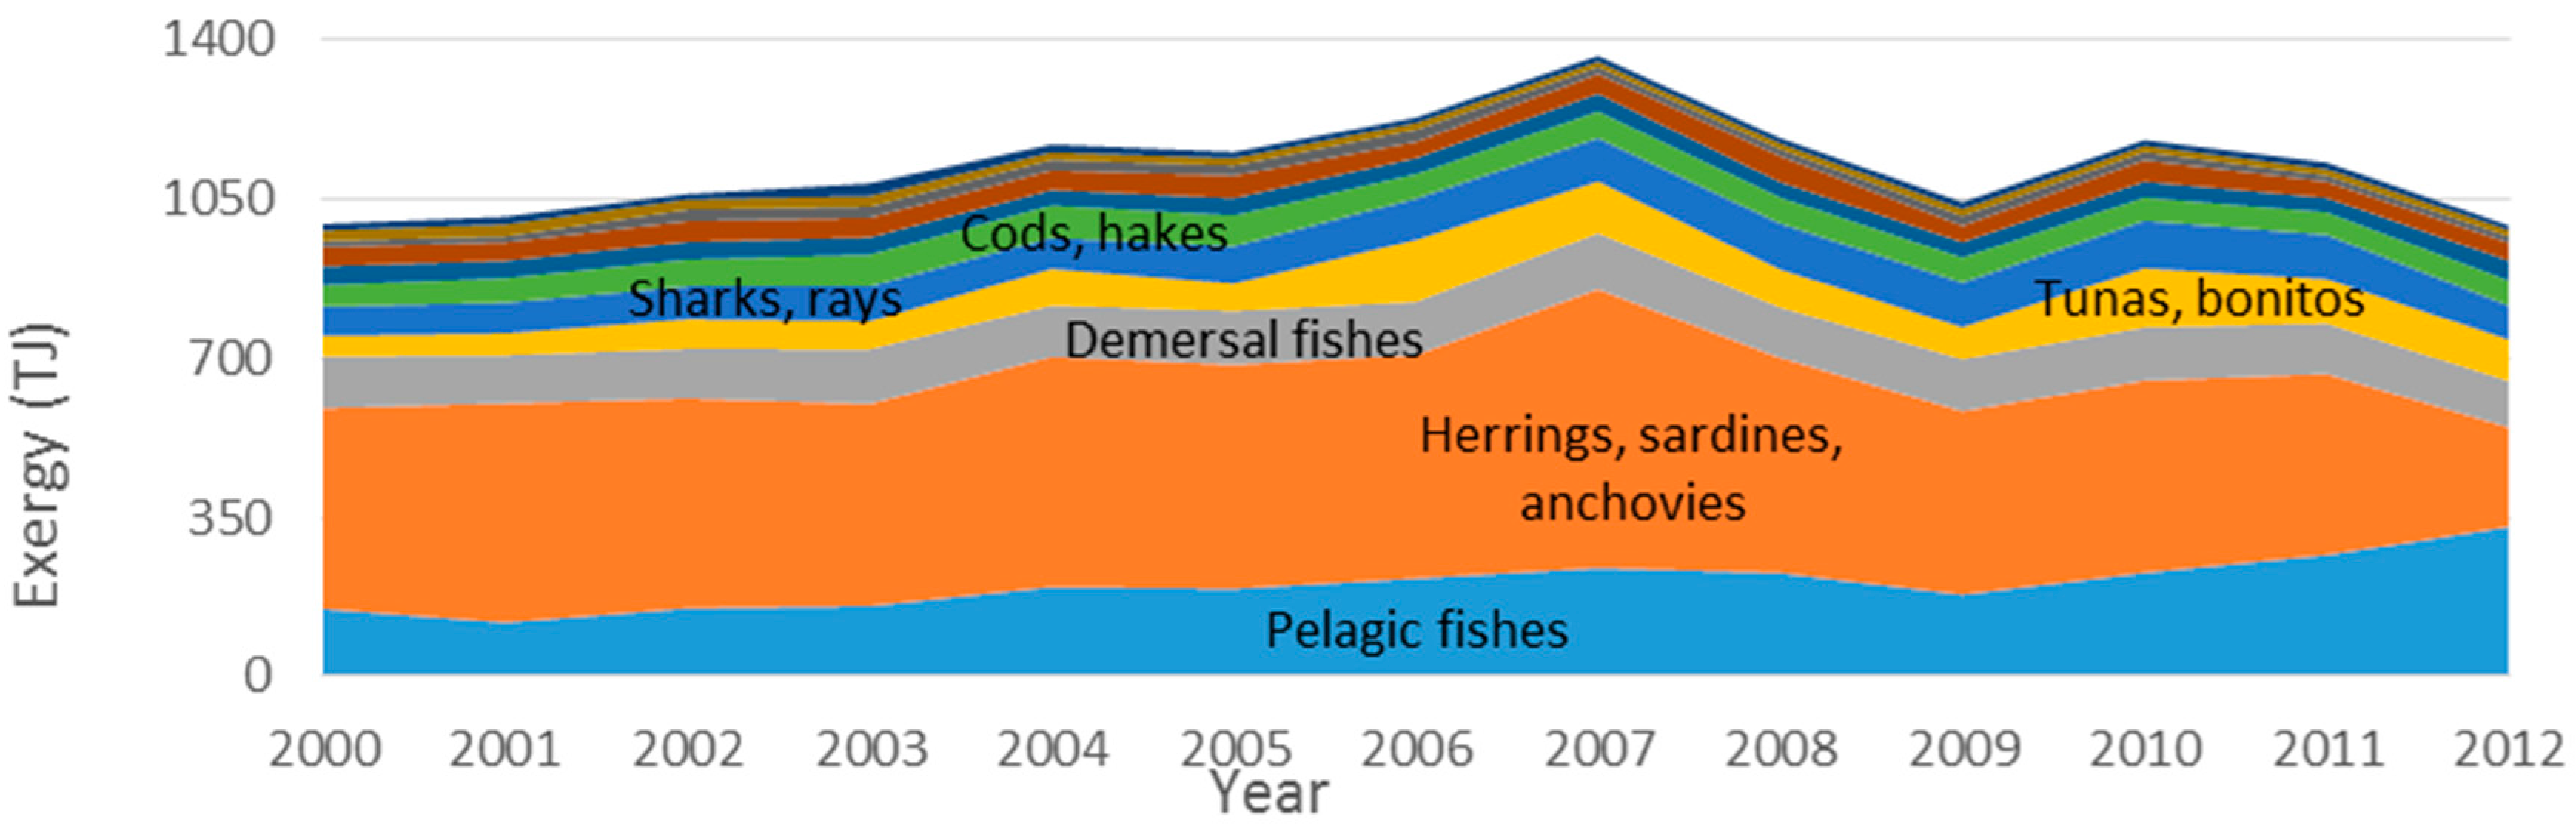
Figure 15) whose efficiency decreased 53% since 2000 (from 43% in 2000 to 20% in 2012). This decreasing efficiency verified for fisheries and aquaculture is exclusive for the NREA methodology. While in EREA we observe a better match between the energy carrier and the end use, in NREA the total amount of nutritional values from fish caught is decreasing for each exergy unit spent on the fishery activities.
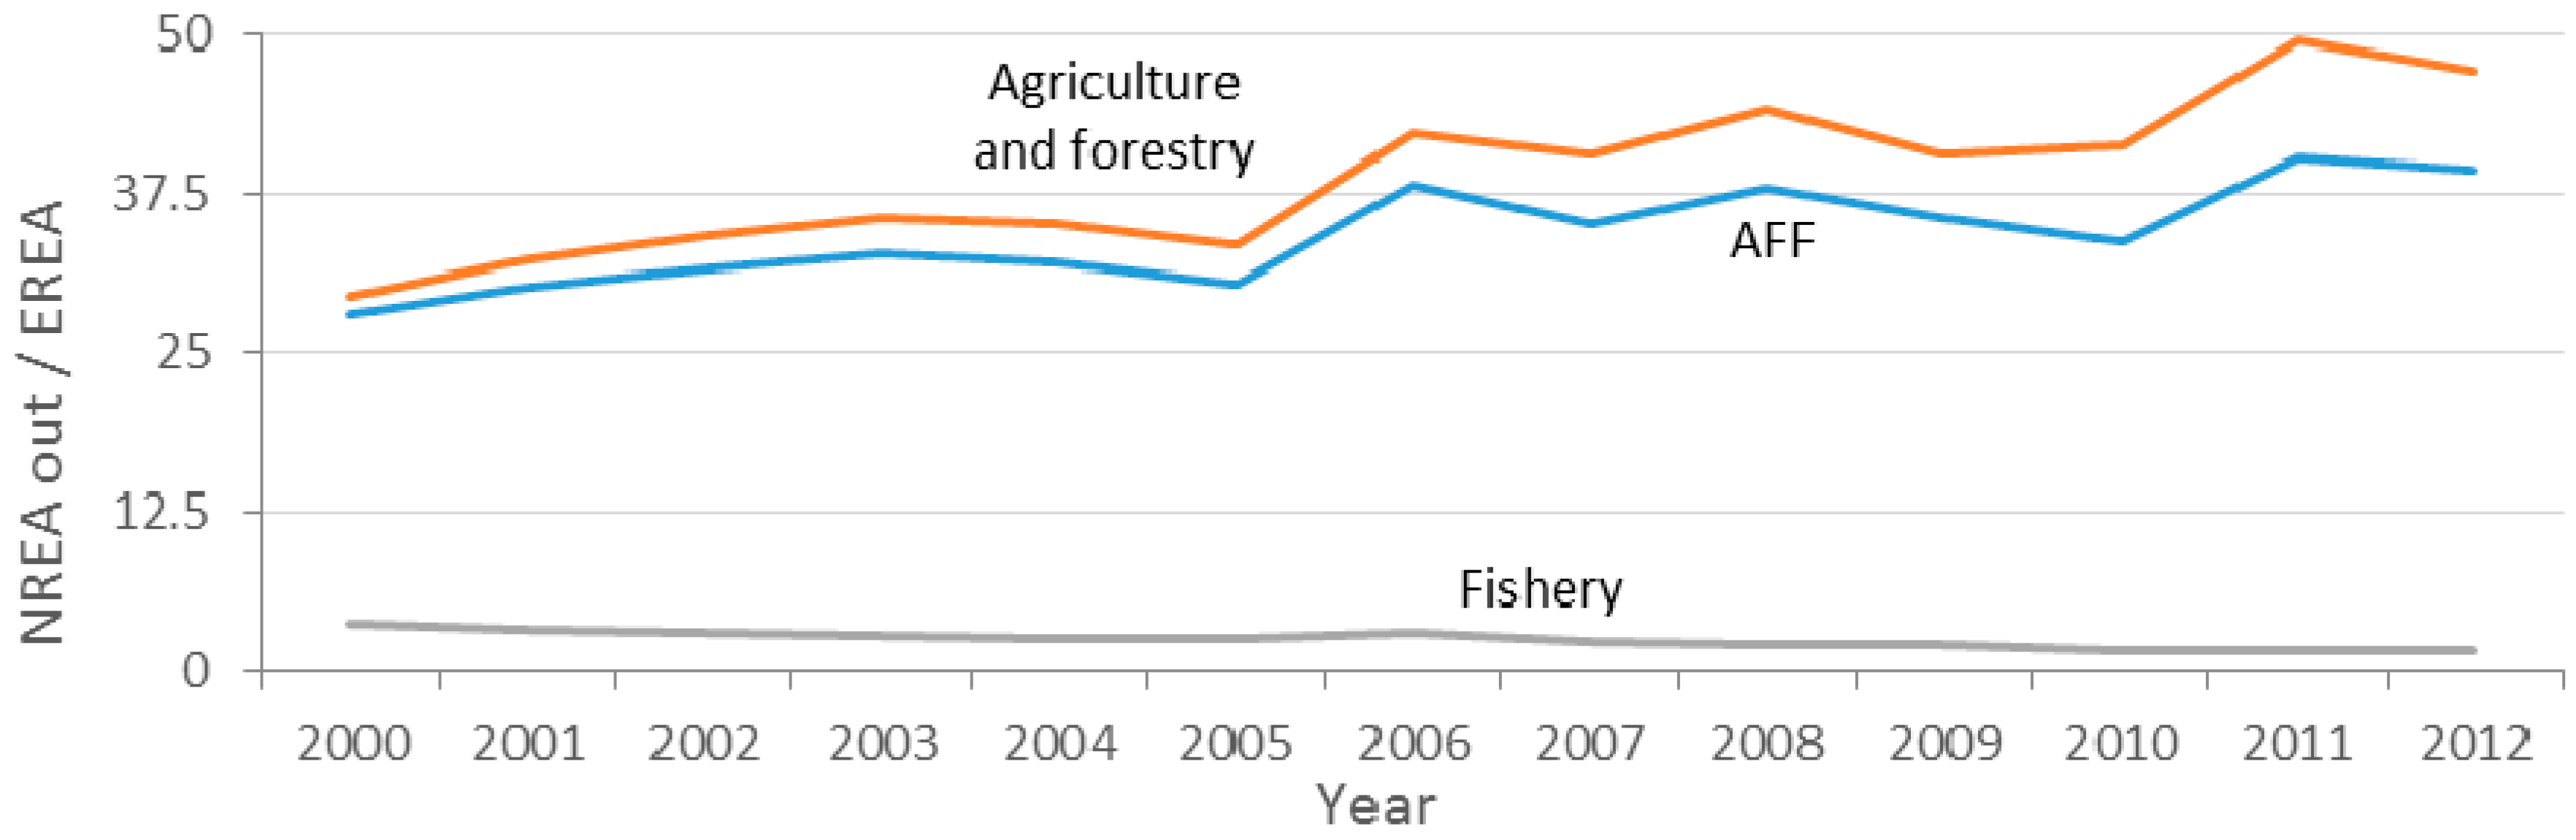
The explanation for this puzzle is revealed by looking at the ratio of the output exergy (measured by the NREA methodology) to the useful exergy (measured by the EREA methodology) which is a proxy for the efficiency of the energy services in the AFF sector (see Figure 22). Contrary to agriculture and forestry which improved the efficiency of the exergy services by 59% (from 27 to 47), fishery reduced theirs to 31% of the initial value (from 5 to 1.5). While in the agriculture subsector each Joule of useful exergy produced 47 Joules of food in 2012, in fishery only 1.5 Joules were caught. The agriculture and forestry subsectors are less dependent on energy resources.
The efficiency of the exergy services in fisheries is the amount of fish catch per unit of useful exergy. To explain this better, we will focus on the diesel carrier, which is responsible for almost 90% of the consumption matrix (in 2012) and used for transportation services. The fish catch per useful exergy ratio is equal to the fish catch per distance travelled times the thermodynamic efficiency of the boat engine (distance travelled per unit of useful exergy). In fisheries a higher thermodynamic efficiency is not translated into higher energy services efficiency presumably because fish population is decreasing leading fishing vessels to travel more (or more often) to get the same amount of fish.
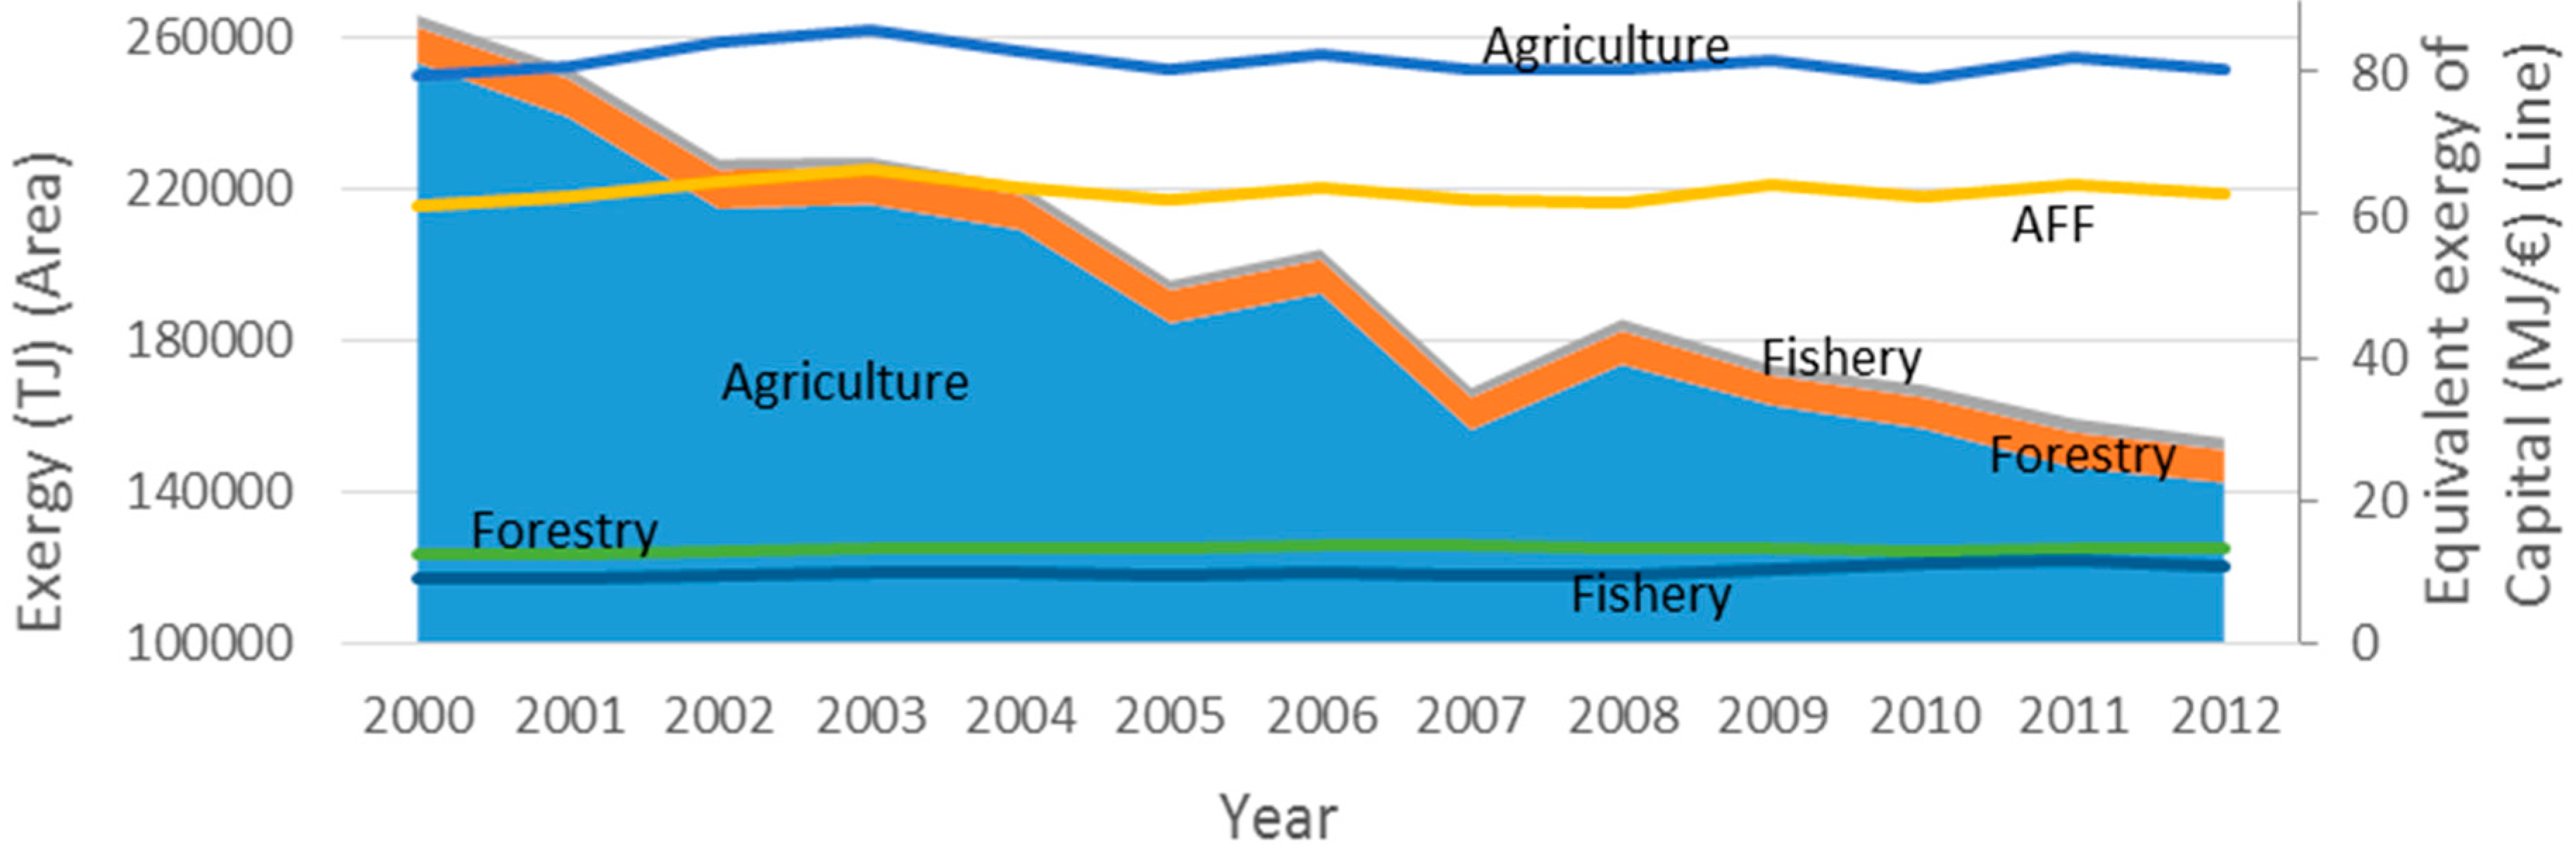
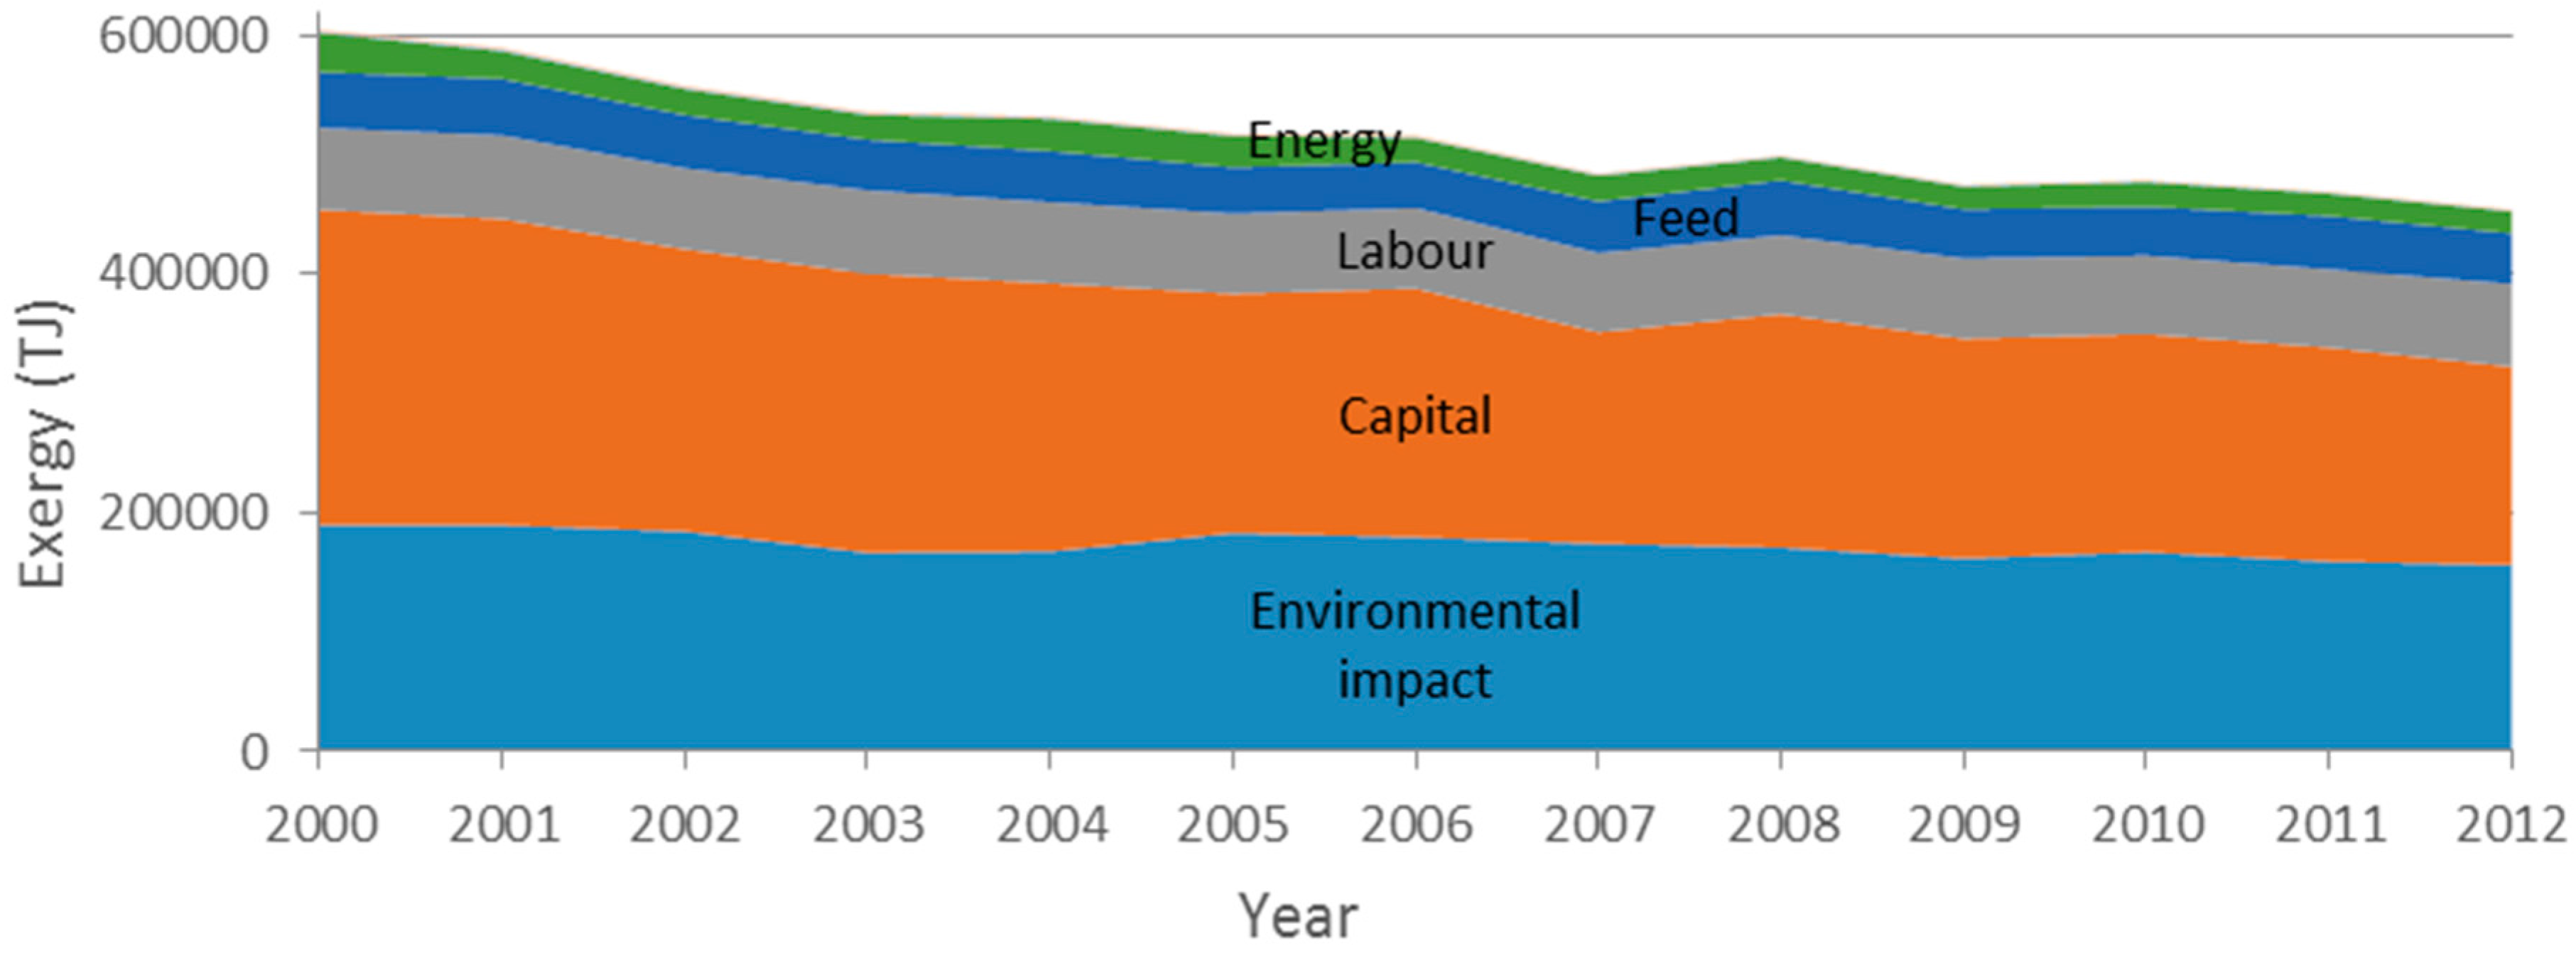
Extended exergy accounting (EEA) allows us to compare the weight of different inputs. The exergy embodied in labour, which is less than an average daily work in other sectors (1500 h per year and per worker in 2012), has the same magnitude of all other material and energetic inputs taken together. Capital exergy is predominant over labour and although it is rapidly decreasing over time, it is larger than the overall exergy of outputs. 
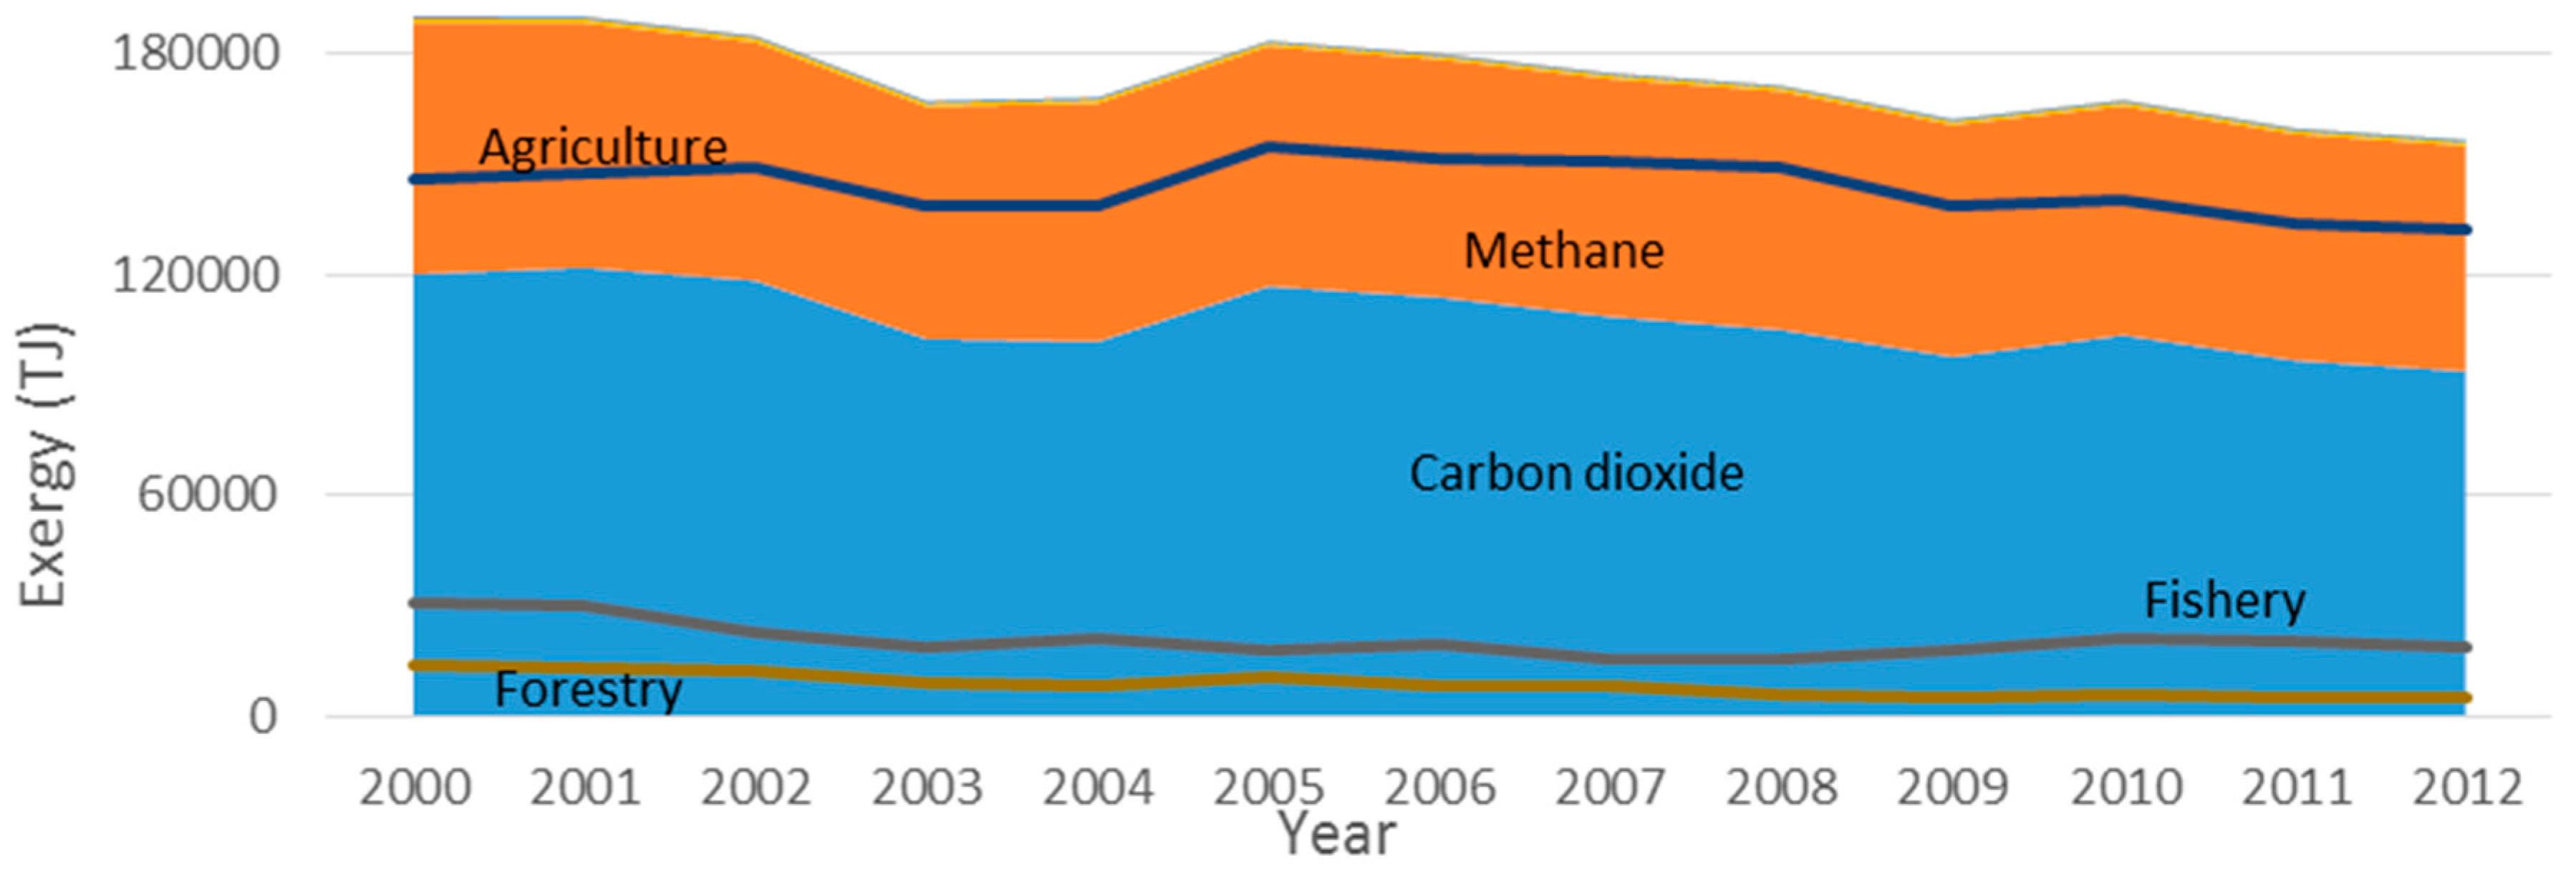
Figure 18 also shows that actually, the bigger input in EEA is the environmental impact from the sector, being all three immaterial inputs seven times superior to the material ones. These results raise issues regarding the proportionality between material and immaterial inputs in the EEA methodology. By considering that the cost of labour and capital is a cumulative societal exergy and, by accounting all other inputs in its intrinsic form, the study reveals the disproportionality that results from this inconsistency. Also, measuring the capital input to the sector by all currency money (M2) minus wages creates an additional problem, because some of this money is used to buy all energetic and material inputs that entered the agricultural sector, and that were taken already into account for by their intrinsic exergies. Following the proposed methodology leads to double counting all natural resources inputs because both intrinsic exergy plus the currency money necessary to buy them are taken into account.
So, are the different exergy accounting methodologies providing consistent or contradictory results? Results provided by the EREA and NREA approaches can be contradictory but they are complementary because the EREA is focused on the thermodynamic efficiency while the NREA extends the boundary allowing the evaluation of the efficiency of the energy service. Both approaches are important in providing a realistic picture of the sectorial exergy efficiency. On the other hand, results obtained by the EEA approach are completely dominated by the exergies of capital and environmental impacts, revealing the disproportionality between material and immaterial inputs in this methodology. Improving the estimation of EEA externalities, labour and capital, for sectorial studies, remains a challenge for future studies.
We propose and apply to our case studies of the AFF sector, using the NREA and EEA approaches, methodological options to account for the renewable flows obtained from the environment, that are more adequate for sustainability assessments. While former NREA and EEA studies [19,21,22,23,24,25,26,27,28,29,30] account all crops, wood and fisheries as an input to the agricultural sector from the environment, this study acknowledges that all these flows are renewable and an output of human activities. Fish catch (excluding fish farming) is considered an extraction because no human activity helps to feed and raise the fish and excessive catches together with pollution have caused a decrease in fish population [55]. For a better assessment of sustainability, it would be important to include and correctly evaluate in NREA and EEA studies, the environmental positive impact of the carbon dioxide sequestered from atmosphere by the AFF sector because, although there is a substantial fraction of the carbon content in vegetables, fruits, crops and wood that is released after consumption, some carbon remains sequestered in living beings and wood used for veneer and saw logs.

Acknowledgments

Work financially supported by FCT/MCTES (PIDDAC) through project UID/EEA/50009/2013.

Author Contributions

Tiago Domingos provided significant comments throughout the study; Tania Sousa helped conceptually and technically with the application of the methodologies, contributed to the interpretation of the results and writing of the paper; and Ricardo Manso undertook the analysis, writing the code to manipulate datasets, and wrote most of the paper.

Conflicts of Interest

The authors declare no conflict of interest.

Appendix A. The Exergy Concept

Exergy is measured in relation to a reference environment characterized by a temperature, T0, a pressure p 0 , and a chemical composition. When the system is in equilibrium with the environment, the system is at the “dead state” and its exergy is null.
A system or stream can have several types of mechanical energy (or exergy), depending on the relation to the surrounding environment. If it has non-zero velocity then it possesses kinetic energy and both the specific energy and exergy are given by e x k = V 2 V 0 2 2 being V its velocity. It has a potential energy or exergy if it is bound to a conservative force (gravitational, elastic, electric, …) being the gravitational potential energy the most common. Both the specific gravitational potential energy and exergy are the same and given by e x p g = g ( z z 0 )   being g gravitational acceleration and zz0 the height relative to the “dead state”.
The physical exergy, which is the maximum amount of work that can be extracted by taking the resource from its initial pressure and temperature to the reference environment at T0 and p0, is e x p h = ( u u 0 ) + p 0 ( v v 0 ) T 0 ( s s 0 )   [43], being u 0 , v 0 and s 0 the specific internal energy, specific volume and specific entropy at the “dead state”. All the change in internal energy of the system can be converted to work except: (1) the minimum energy that must be dissipated in the form of heat to decrease the entropy from s to s 0 and (2) the minimum mechanical energy that must be used to increase the volume from v to v 0 .
For an open system, the physical exergy that accompanies the mass flow must take into account also the flow work and is given by e x f ,   p h = h h 0 T 0 ( s s 0 ) where h 0 is the specific enthalpy at the “dead state”. As pointed out by Sciubba [23] this equation truly expresses the real attribute of exergy: the amount of useful work that can be extracted from a certain system is measured by its enthalpic content ( h h 0 ) but taking into account that the system has to dissipate energy in the form of heat to get rid of entropy.
The exergy associated to heat transfer ( Q ) is E x Q = Q ( 1 T 0 T ) . This exergy is obtained by a direct application of the Carnot efficiency and represents the maximum amount of work that the heat flow can produce. Finally, the chemical exergy of a substance, or resource, is the maximum work that can be obtained by taking it from T0 and p 0 to chemical equilibrium with the reference environment. The reference environment could be the lithosphere (Earth crust) if the substance is a solid compound, the hydrosphere (water on, under and above the surface) if it is a dissolved ionic compound or the atmosphere if it is a gaseous compound. The specific chemical exergy of a compound is computed by Romero and Linares [56] as: e x c h = i Δ f G 0 + e l n e l b c h , e l 0 were Δ f G 0 is the standard Gibbs energy of formation, n e l , the number of moles of element el in the compound and b c h , e l 0 the standard chemical exergy of each element.
The total specific exergy of a system or resource can now be written as the sum of all components: e x S = e x k + e x p + e x p h + e x c h . In any real or irreversible process the entropy generated multiplied by T 0 is the exergy loss during the transformation process e x l o s s = T 0 σ .

Appendix B. Output Flows by NREA

Appendix B.1. Crops Harvested

Harvested crops include cereals, root crops, industrial crops, fibre crops, vegetables, fruits, nuts, vineyards and olive trees. Overall nutritional energy values are obtained by multiplying each crop mass production by their specific nutritional energy. Table A1 presents all crop specific nutritional energies [46] of all products in the production database [42].
Table A1. Specific Nutritional Energy (SNE) in kJ/100 g for each harvested crop [46].
CropSNECropSNECropSNECropSNE
Almonds2423Mushrooms130Oranges197Radishes66
Apples218Eggplants104Other berries225Raspberries220
Apricots201Eggplants104Other brassicas150Red pepper166
Bananas371Endives71Other citrus fruits180Rice1548
Barley1473Figs310Other fresh vegetables100Rye and maslin1414
Beans368Garlic623Other fruits369Sour cherries209
Black currants264Grain maize1527Other leafy or stalked vegetables117Spinach97
Broad and field beans1377Hazelnuts2629Other nuts2170Strawberries136
Cabbage (white)103Kiwis255Other pulses354Sugar beet293
Carrots173Leeks255Peaches165Sunflower seed1289
Cauliflower and broccoli140Lemons and acid limes126Pears239Tomatoes74
Celeriac176Lettuces65Peas339Triticale1406
Cherries263Melons141Plums192Vineyards288
Chestnuts891Oats and mixed grain1628Pomelos and grapefruit134Walnuts2738
Chicory96Olive trees481Potatoes321Watermelons127
Courgettes80Onions166Quinces238Wheat1418
Cucumbers65
From the 65 accounted products, Figure A1 presents the 13 top crops that most contributed to the annual nutritional energy production. It is important to mention that grain maize represents nearly 40% of the total, that farmers sharply decreased wheat, oats and potatoes production and opted for olive trees and tomatoes. Overall crop production decreased 20%.
Figure A1. Nutritional energy output from crop production.
Energies 10 01219 g023

Appendix B.2. Meat Slaughtering

In the past, animal husbandry was a fundamental source of labour but in this 21st century they just represent the root of protein in our food. It’s not just the high protein content and the retained nitrogen but also the specific animal amino acids and high biological value that favour their consumption. Meat production is available in mass units from the Eurostat database [42] and nutritional energy values [46] were chosen as a raw mix of meat for each animal (Table A2).
Table A2. Specific Nutritional Energy (SNE) in kJ/100 g for each slaughtered meat [46].
MeatSNEMeatSNEMeatSNE
Meat of bovine animals979Meat of rabbits569Pigmeat995
Meat of horses, asses, mules or hinnies556Meat of sheep and goats1067Poultry meat979
Figure A2 presents the produced energy from animal slaughtering to human consumption. Livestock is slowly increasing with pigs and poultry becoming the major intervenient. Meat of rabbits and horses is residual and can hardly be seen on the graph.
Figure A2. Nutritional energy output from meat slaughtering.
Energies 10 01219 g024

Appendix B.3. Fish Catch

Portugal, being on the southwest corner of Europe and with its long border with the Atlantic Ocean always looked at the sea as a primary source of resource extraction. As animal husbandry, fish is a fundamental source of iron and protein, has a high biological value and with the advantage of having less and better quality fat content. Fish catch is available by catching zones, fish families and individually [42].
Table A3 presents the specific nutritional energy considered for each fish, the average of their nutritional values if a family or an assumed average if in a zone. Total energy from fish catch increased until 2007 and decreased since then, mainly due to the common fisheries policy who manages fish stock for the European Union as a whole. This policy sets quotas for each member state which is allowed to catch a certain amount of each type of fish. Figure A3 shows a partial catch matrix, with the most important contributors of the Portuguese fishery. The reducing quota of sardines, a Portuguese favourite, which represented, in the past, almost 50% of the incoming energy, nowadays is relegated to second place. Upper fish fluxes of the graph represent coastal fishes; squids, cuttlefishes and octopuses; clams, cockles and arkshells; flounders, halibuts and soles and twenty more fish species families.
Table A3. Specific Nutritional Energy (SNE) in kJ/100 g for fish [46].
FishSNEFishSNEFishSNE
Abalones, winkles, conchs439Lobsters, spiny-rock lobsters469Mussels360
Aquatic mammals462Marine fishes not identified500Oysters213
Carps, barbels and cyprinids531Miscellaneous aquatic animals500River eels770
Clams, cockles, arkshells360Miscellaneous coastal fishes500Salmons, trouts, smelts594
Cods, hakes, haddocks343Miscellaneous demersal fishes500Scallops, pectens289
Crabs, sea-spiders364Miscellaneous diadromous fishes650Shads824
Flounders, halibuts, soles294Miscellaneous freshwater fishes465Sharks, rays, chimaeras544
Freshwater crustaceans300Miscellaneous marine crustaceans300Shrimps, prawns297
Herrings, sardines, anchovies661Miscellaneous marine molluscs330Squids, cuttlefishes, octopuses343
King crabs, squat-lobsters377Miscellaneous pelagic fishes500Tunas, bonitos, billfishes602
Figure A3. Nutritional energy output from fish catch.
Energies 10 01219 g025

Appendix B.4. Aquaculture

Aquaculture in Portugal is residual due to our borders with the Atlantic Ocean. Major energy supplied based on fish species is represented on Figure A4, being the total exergy not relevant to the fisheries and aquaculture subsector. Flounders, halibuts and soles are increasing its share while coastal fishes are reducing in a fluctuating production, with a small tendency to increase, over the years. Specific nutritional values are similar to the fisheries.
Figure A4. Nutritional energy output from aquaculture production.
Energies 10 01219 g026

Appendix B.5. Milk

Milk is a rich source of calcium and vitamin D with benefits for bones and teeth and processed into a diversity of dairy products such as cheese, butter, yogurt and cream. Specific nutritional values (Table A4) are for unprocessed milk at the producer level [46] and the production is in mass units [42].
Table A4. Specific Nutritional Energy (SNE) in kJ/100 g for milk [46].
MilkSNEMilkSNEMilkSNE
Cows’ milk268Ewes’ milk451Goats’ milk288
Milk production remained solid over the years due to dairy produced quota, a measure by the European governments to control milk production. Cow’s milk represents almost the totality of milk production (Figure A5) and, as an exergy input to the society, is five times bigger than total fish catch.
Figure A5. Nutritional energy output from collected milk.
Energies 10 01219 g027

Appendix B.6. Honey

Honey is produced by honey bees and from flowers’ nectar. It is sweet due to high levels of fructose and glucose and possesses antiseptic and antibacterial properties. Overall honey production increased more than 50% through the 13 years (Figure A6). The specific nutritional energy of honey is 1272 kJ per 100 g of product [46].
Figure A6. Nutritional energy output from produced honey.
Energies 10 01219 g028

Appendix B.7. Eggs

Eggs are one of the best sources of protein and represent the reference food in the biological value scale. Produced eggs are mainly for human food and for incubations to produce laying hens or poultry meat. It should be noted that incubation eggs are part of the produced eggs and an input to the system. Table A5 presents the specific nutritional energy of Hen eggs and an average for other bird’s eggs.
Table A5. Specific Nutritional Energy (SNE) in kJ/100 g for eggs.
EggsSNEEggsSNE
Hen eggs599Other bird’s eggs776
Hens’ eggs are predominant in production and incubation with a stable total exergy produced (Figure A7).
Figure A7. Nutritional energy output from produced eggs.
Energies 10 01219 g029

Appendix B.8. Wood

Forest area, in Portugal, accounts for 38% of the total area which is a high percentage compared with other European countries. Pulp and paper industry’s sector represented, in 2012, 4.4% of GDP, 8% of total industrial production and 1.2% of economy’s employment [57]. Wood removals are considered as under bark with a moisture content of 20%. Production is available in volume units and specific exergy values (Table A6) obtained from Dewulf et al. [52].
Table A6. Wood exergies per type of wood [52].
WoodExergy (MJ/kg)Exergy (GJ/m3)WoodExergy (MJ/kg)Exergy (GJ/m3)
Coniferous17.6887.9596Non-coniferous17.60811.4452
Total industrial round wood removals had minor fluctuations over the years but the non-coniferous (hardwoods) to coniferous (softwoods) ratio increased from 1.57 in 2000 to 4.12 in 2012 (Figure A8). Coniferous wood is mainly (70%) for saw logs and veneer logs and the remaining for pulpwood. Non-coniferous wood is more than 90% for pulpwood and the remaining for fuelwood. To highlight the importance of the forestry subsector, the total exergy collected from wood is roughly 3.5 times superior to the total exergy of harvested crops.
Figure A8. Exergy output from wood removals.
Energies 10 01219 g030

Appendix C. Input Flows by NREA

Appendix C.1. Fertilizers

Growing plants or trees extract nutrients from the soil that are taken away as the cultivated plants are harvested or tree fruits are removed. To allow soil productivity and enhance plant’s growth, with increasing trees and plants densities, is necessary to artificially add nutrients by fertilising the soil. The fertilisers can be organic (e.g., compost, manure), bio-fertiliser (containing living microorganisms) or industrialized chemical compounds. The main nutrients are nitrogen (N), phosphorus (P) and potassium (K) and the compounds phosphate (P2O5) and potash (K2O).
The chemical exergy values (Table A7) were estimated with the corresponding chemical formula, multiplying molecular mass by the standard chemical exergy (values from [44] or alternatively [58]).
Table A7. Fertilizers’ chemical exergies.
FertilizerChemical FormulaMolecular Mass g/molExergy kJ/molExergy kJ/kgAlternatively [58]Exergy kJ/kg
Potassium/PotashK2O94.203413.143854400
NitrogenNH4NO380.04348294.836823680
Phosphorus/PhosphateP2O5141.9446319.522512700
Fertilizer usage has decreased, from 2000 to 2008, to 55% of its initial value and remained constant thereafter (Figure A9). Nitrogen is the most applied fertilizer accounting nowadays for almost half of the total exergy.
Figure A9. Exergy of fertilizers into agriculture.
Energies 10 01219 g031

Appendix C.2. Pesticides

Pesticides are biological or chemical substances that are mainly used in agriculture to protect plants from the harmful and damaging influences of microbes and plant diseases. They also kill and remove pests, insects and weeds that prevent the plants from a healthy grow. Plant grow regulators are used to protect the crop or fruit, after or before harvest, during storage and transport.
Eurostat presents data for six types of aggregated pesticides: fungicides and bactericides; herbicides, haulm destructors and moss killers; insecticides and acaricides; molluscicides; plant growth regulators and other plant protection products. Chemical exergy values were adopted from [58,59] being the herbicides value the average of six known herbicides and the insecticides value the average of three insecticides active substances (Table A8). Fungicides and bactericides represent almost two thirds of total usage which decreased 20% from 2002 onwards (Figure A10).
Table A8. Pesticides chemical exergies.
Pesticide TypeExergy kJ/kgReference
Fungicides and bactericides27,900[58]
Herbicides, haulm destructors and moss killers24,100[59]
Insecticides and acaricides19,900
Molluscicides, total19,900
Other plant protection products24,100
Plant growth regulators, total24,100
Figure A10. Exergy of pesticides into agriculture.
Energies 10 01219 g032

Appendix C.3. Seeds

As harvested cereals, roots or vegetables leave the soil new seeds must be planted. These seeds are part of the collected crops and will origin new plants to be harvested. Seeds used in agriculture are available in mass units for each plant type [45] and specific exergy values presented in Table A9. Figure A11 exhibits the top products that were used as seeds. Seeds follow the trend of harvest, as expected. The ratio of harvests to seed exergies exceeds 30.
Table A9. Specific Nutritional Energy (SNE) in kJ/100 g for seeds [46].
SeedSNESeedSNESeedSNESeedSNE
Barley1473Cow peas, dry1432Oats1628Sesame seed2399
Beans, dry1427Grain, mixed1455Oilseeds 1800Sorghum1377
Broad and horse beans1436Groundnuts1733Peas, dry1448Soybeans614
Buckwheat1381Hempseed1800Poppy seed2231Sunflower seed1289
Cabbages and brassicas150Lentils1448Potatoes321Taro (cocoyam)360
Canary seed1624Linseed2076Pulses1423Triticale1406
Castor oil seed1800Lupins1633Rapeseed2068Vegetables, fresh150
Cereals1455Maize1527Rice, paddy1172Vetches1360
Chick peas1499Millet1582Rye1414Wheat1418
Cottonseed1059Mustard seed1963Safflower seed1314Yams422
Figure A11. Nutritional energy of seeds into crop production.
Energies 10 01219 g033

Appendix C.4. Feed

Animal feed represents food given to animals. Green plants that animals forage are not accounted as input to animal husbandry nor as an output because they never exit the sector. Feed used in agriculture is available in mass units for each of the constituents [45] and specific exergy values taken from [46,48] (Table A10).
Table A10. Specific Nutritional Energy (SNE) in kJ/100 g for feed components [46,48].
Feed ProductSNEFeed ProductSNEFeed ProductSNEFeed ProductSNE
Apples218Fats, Animals, Raw3257Oilcrops Other1639Rye1414
Aquatic Plants180Fish Body Oil3776Olive Oil3700Sesame seed2399
Bananas371Fish, Liver Oil3776Onions166Sesameseed Oil3700
Barley1473Freshwater Fish400Palm kernels2152Sorghum1377
Beans368Fruits, Other203Peas339Soyabean Oil3700
Butter, Ghee3001Groundnuts1733Pelagic Fish400Soyabeans614
Cassava667Maize1527Potatoes321Sugar beet293
Cephalopods343Marine Fish Other400Poultry Meat979Sugar cane135
Cereals Other1488Meat, Other858Pulses354Sunflower seed1289
Coconuts770Milk—Excluding Butter353Rape and Mustard Oil3700Sweet potatoes359
Cottonseed1059Millet1582Rape and Mustardseed2068Tomatoes74
Crustaceans300Oats1628Rice1548Vegetables Other226
Demersal Fish400Offals, Edible486Roots Other449Wheat1418
Eggs682Oilcrops Oil, Other3700
It is important to notice that the exergetic contents of maize used to feed animals and total harvests are of the same magnitude (see Figure A12) which explains the need to import the majority of cereals used to produce feed. From the 54 accounted products used to produce feed, maize represented 57% of all inputs in 2000 and 69% in 2012. Total exergy over time has a slight tendency to decrease, reducing 10% from 2000 to 2012.
Figure A12. Nutritional energy of feed into animal husbandry.
Energies 10 01219 g034

Appendix C.5. Incubation eggs

Poultry meat increased 40% over 13 years and consequently the incubated eggs. Part of the produced eggs is for incubations which ranged from 10% in 2000 to over 15% in 2012. Exergy on incubations increase 75% over the considered years (Figure A13). Data from the Eurostat database [42] is in number of egg units and, in order to measure the mass content, the egg’s average mass [60] was multiplied by the respective number of eggs into incubation (Table A11).
Table A11. Specific Nutritional Energy (SNE) in kJ/100 g [46] and average mass for eggs [60].
EggsSNEMass (g)EggsSNEMass (g)EggsSNEMass (g)
Ducks’ eggs77670Guinea fowl eggs6639Turkey eggs71679
Geese eggs775144Hens’eggs59953
Figure A13. Nutritional energy of incubation eggs.
Energies 10 01219 g035

Appendix D. Additional Data

Missing data is relevant on HDI values (54%) and eggs for incubation which represented 40%, mainly on non-relevant fluxes of turkey and duck’s eggs. There was also missing data on pesticides (about 15%), feed (7%), crops (5%), meat (4%), energy (3%), aquaculture (2%) and fish catch (1%). All other fluxes had no missing data.
Table A12 presents the HDI values for Portugal where the interpolated data is in italic. Table A13 presents the price deflator in a 2010 reference from which all monetary values were multiplied, since all were downloaded at current prices. Table A14 presents the population and workers allocated to each AFF subsector and Table A15 all the monetary values of GVA, M2 and wages.
Table A12. HDI values for Portugal (italic values interpolated).
2012201120102009200820072006200520042003200220012000
0.82200.81910.81590.81030.80530.80290.79920.79000.79170.78800.78420.78050.7800
Table A13. Price deflator values referenced to 2010.
2012201120102009200820072006200520042003200220012000
99.33399.73010099.36098.28396.60493.80990.91387.98485.92583.06879.71476.859
Table A14. Population and workers allocated to each AFF subsector (thousands).
Workers2012201120102009200820072006200520042003200220012000
Population10,51410,55710,57310,56810,55810,54210,52210,50310,48310,45810,41910,36210,289
Agriculture497.2489.8508.8534.3542.2546.2556.9557.3566.7591585.9604.3584.6
Forestry10.910.910.610.712.011.811.811.711.711.811.711.911.6
Fishery14.014.314.013.914.414.315.014.915.015.014.815.014.8
Table A15. Monetary values of all sectors and AFF sector at constant 2010 prices (Billion Euro for Total values and Million Euro for subsectorial values). Total—All sectors, GVA—gross value added, Wages—Compensation of employees.
Monetary Values2012201120102009200820072006200520042003200220012000
Total GVA141149151149151151147146148145147147145
Total M2163174173170179163159157150147147153151
Agriculture GVA2224218424132440249725382887289132723260333736553869
Agriculture M22585253727652776294627353113309733123294332737844019
Agriculture Wages817756787784782787778795780775768825823
Forestry GVA647689657613662682708716785814893893841
Forestry M2752800753697782735763767795822890924874
Forestry Wages1081041029810510110010210010099106106
Fishery GVA399412396378419418413416459459476509521
Fishery M2464478454430494450445446464464474527541
Fishery Wages170160156160175178176179176175173186186

References

  1. Pezzey, J.C.V. Sustainability constraints versus “optimality” versus intertemporal concern, and axioms versus data. Land Econ. 1997, 73, 448. [Google Scholar] [CrossRef]
  2. Imperatives, S. Report of the World Commission on Environment and Development: Our Common Future; Oxford University Press: Oxford, UK, 1987. [Google Scholar]
  3. National Research Council. Toward Sustainable Agricultural Systems in the 21st Century; National Academies Press: Washington, DC, USA, 2010. [Google Scholar]
  4. Dewulf, J.; Van Langenhove, H.; Muys, B.; Bruers, S.; Bakshi, B.R.; Grubb, G.F.; Paulus, D.M.; Sciubba, E. Exergy: Its Potential and Limitations in Environmental Science and Technology. Environ. Sci. Technol. 2008, 42, 2221–2232. [Google Scholar] [CrossRef] [PubMed]
  5. Reistad, G. Available Energy Conversion and Utilization in the United States. ASME Trans. Ser. J. Eng. Power 1975, 97, 429–434. [Google Scholar] [CrossRef]
  6. Wall, G. Exergy: A Useful Concept; TH: Göteborg, Sweden, 1986. [Google Scholar]
  7. Sciubba, E. Beyond thermoeconomics? The concept of Extended Exergy Accounting and its application to the analysis and design of thermal systems. Exergy Int. J. 2001, 1, 68–84. [Google Scholar]
  8. Rocco, M.V.; Colombo, E.; Sciubba, E. Advances in exergy analysis: A novel assessment of the Extended Exergy Accounting method. Appl. Energy 2014, 113, 1405–1420. [Google Scholar] [CrossRef]
  9. Szargut, J. Analysis of cumulative exergy consumption. Int. J. Energy Res. 1987, 11, 541–547. [Google Scholar] [CrossRef]
  10. Dincer, I.; Hussain, M.M.; Al-Zaharnah, I. Energy and exergy utilization in agricultural sector of Saudi Arabia. Energy Policy 2005, 33, 1461–1467. [Google Scholar] [CrossRef]
  11. Utlu, Z.; Hepbasli, A. Assessment of the energy and exergy utilization efficiencies in the Turkish agricultural sector. Int. J. Energy Res. 2006, 30, 659–670. [Google Scholar] [CrossRef]
  12. Ghandoor, A.A.; Jaber, J.O. Analysis of energy and exergy utilisation of Jordan’s agricultural sector. Int. J. Exergy 2009, 6, 491. [Google Scholar] [CrossRef]
  13. Avara, A.; Karami, M. Energy and exergy efficiencies in agricultural and utility sectors of Iran compared with other countries. In Proceedings of the 2010 2nd International Conference on Mechanical and Electrical Technology (ICMET), Singapore, 10–12 September 2010; pp. 6–10. [Google Scholar]
  14. Ahamed, J.U.; Saidur, R.; Masjuki, H.H.; Mekhilef, S.; Ali, M.B.; Furqon, M.H. An application of energy and exergy analysis in agricultural sector of Malaysia. Energy Policy 2011, 39, 7922–7929. [Google Scholar] [CrossRef]
  15. Chen, G.Q.; Jiang, M.M.; Yang, Z.F.; Chen, B.; Ji, X.; Zhou, J.B. Exergetic assessment for ecological economic system: Chinese agriculture. Ecol. Model. 2009, 220, 397–410. [Google Scholar] [CrossRef]
  16. Hoang, V.-N.; Alauddin, M. Analysis of agricultural sustainability: A review of exergy methodologies and their application in OECD countries. Int. J. Energy Res. 2011, 35, 459–476. [Google Scholar] [CrossRef]
  17. Serrenho, A.C.; Warr, B.; Sousa, T.; Ayres, R.U.; Domingos, T. Structure and dynamics of useful work along the agriculture-industry-services transition: Portugal from 1856 to 2009. Struct. Chang. Econ. Dyn. 2016, 36, 1–21. [Google Scholar] [CrossRef]
  18. Guevara, Z.; Sousa, T.; Domingos, T. Insights on Energy Transitions in Mexico from the Analysis of Useful Exergy 1971–2009. Energies 2016, 9, 488. [Google Scholar] [CrossRef]
  19. Wall, G. Exergy conversion in the Swedish society. Resour. Energy 1987, 9, 55–73. [Google Scholar] [CrossRef]
  20. Gong, M.; Wall, G. Exergy Analysis of the Supply of Energy and Material Resources in the Swedish Society. Energies 2016, 9, 707. [Google Scholar] [CrossRef]
  21. Wall, G. Exergy conversion in the Japanese society. Energy 1990, 15, 435–444. [Google Scholar] [CrossRef]
  22. Wall, G.; Sciubba, E.; Naso, V. Exergy use in the Italian society. Energy 1994, 19, 1267–1274. [Google Scholar] [CrossRef]
  23. Sciubba, E.; Bastianoni, S.; Tiezzi, E. Exergy and extended exergy accounting of very large complex systems with an application to the province of Siena, Italy. J. Environ. Manag. 2008, 86, 372–382. [Google Scholar] [CrossRef] [PubMed]
  24. Gasparatos, A.; El-Haram, M.; Horner, M. Assessing the sustainability of the UK society using thermodynamic concepts: Part 2. Renew. Sustain. Energy Rev. 2009, 13, 956–970. [Google Scholar] [CrossRef]
  25. Chen, G.Q.; Chen, B. Extended-exergy analysis of the Chinese society. Energy 2009, 34, 1127–1144. [Google Scholar] [CrossRef]
  26. Zhang, B.; Chen, G.Q. Physical sustainability assessment for the China society: Exergy-based systems account for resources use and environmental emissions. Renew. Sustain. Energy Rev. 2010, 14, 1527–1545. [Google Scholar] [CrossRef]
  27. Dai, J.; Chen, B. Extended exergy-based ecological accounting of China during 2000–2007. Procedia Environ. Sci. 2011, 5, 87–95. [Google Scholar] [CrossRef]
  28. Dai, J.; Fath, B.; Chen, B. Constructing a network of the social-economic consumption system of China using extended exergy analysis. Renew. Sustain. Energy Rev. 2012, 16, 4796–4808. [Google Scholar] [CrossRef]
  29. Chen, B.; Dai, J.; Sciubba, E. Ecological accounting for China based on extended exergy. Renew. Sustain. Energy Rev. 2014, 37, 334–347. [Google Scholar] [CrossRef]
  30. Bligh, D.C.; Ugursal, V.I. Extended exergy analysis of the economy of Nova Scotia, Canada. Energy 2012, 44, 878–890. [Google Scholar] [CrossRef]
  31. Sousa, T.; Brockway, P.E.; Cullen, J.M.; Henriques, S.T.; Miller, J.; Serrenho, A.C.; Domingos, T. The need for robust, consistent methods in societal exergy accounting. Ecol. Econ. 2017, 141, 11–21. [Google Scholar] [CrossRef]
  32. Sciubba, E.; Wall, G. A brief commented history of exergy from the beginnings to 2004. Int. J. Thermodyn. 2007, 10, 1–26. [Google Scholar]
  33. Department of Energy. Draft 2012 Integrated Energy Planning Report—Annexure A—Technical Report; Department of Energy: Pretoria, South Africa, 2012.
  34. Palma, M.; Sousa, T.; Guevara, Z. How Much Detail Should We Use to Compute Societal Aggregated Exergy Efficiencies? Energies 2016, 9, 364. [Google Scholar] [CrossRef]
  35. Ayres, R.U.; Warr, B. Accounting for growth: The role of physical work. Struct. Change Econ. Dyn. 2005, 16, 181–209. [Google Scholar] [CrossRef]
  36. Sciubba, E. A revised calculation of the econometric factors α- and β for the Extended Exergy Accounting method. Ecol. Model. 2011, 222, 1060–1066. [Google Scholar] [CrossRef]
  37. Human Development Index (HDI). Human Development Reports. Available online: http://hdr.undp.org/en/content/human-development-index-hdi (accessed on 18 September 2014).
  38. Seckin, C.; Sciubba, E.; Bayulken, A.R. Extended exergy analysis of Turkish transportation sector. J. Clean. Prod. 2013, 47, 422–436. [Google Scholar] [CrossRef]
  39. European central Bank. Eurosystem statistics. Available online: https://www.ecb.europa.eu/stats/money_credit_banking/monetary_aggregates/html/hist_content.en.html (accessed on 13 June 2015).
  40. Kotas, T.J. The Exergy Method of Thermal Plant Analysis; Butterworths: London, UK, 1985. [Google Scholar]
  41. Milia, D.; Sciubba, E. Exergy-based lumped simulation of complex systems: An interactive analysis tool. Energy 2006, 31, 100–111. [Google Scholar] [CrossRef]
  42. Database—Eurostat. Available online: http://ec.europa.eu/eurostat/data/database (accessed on 10 January 2015).
  43. Szargut, J.; Morris, D.R.; Steward, F.R. Exergy Analysis of Thermal, Chemical, and Metallurgical Processes; Hemisphere: New York, NY, USA, 1988. [Google Scholar]
  44. Szargut, J. Exergy Method: Technical and Ecological Applications; WIT Press: Boston, MA, USA, 2005. [Google Scholar]
  45. FAOSTAT. Available online: http://www.fao.org/faostat/en/#home (accessed on 23 January 2015).
  46. US Department of Agriculture; Agricultural Research Service; Nutrient Data Laboratory. USDA National Nutrient Database for Standard Reference, Release 27; USDA: Washington, DC, USA, 2014.
  47. EUROPA—Economic and Financial Affairs—Indicators -AMECO database. Available online: http://ec.europa.eu/economy_finance/ameco/user/serie/SelectSerie.cfm (accessed on 13 March 2015).
  48. ESS: Nutritive Factors. Available online: http://www.fao.org/economic/the-statistics-division-ess/publications-studies/publications/nutritive-factors/en/ (accessed on 11 July 2015).
  49. Food and Agriculture Organization of the United Nations. Food Energy—Methods of Analysis and Conversion Factors; Food and Agriculture Organization of the United Nations: Rome, Italy, 2003. [Google Scholar]
  50. Koester, U.; Empen, J.; Holm, T. Food Losses and Waste in Europe and Central Asia; Food and Agriculture Organization of the United Nations: Rome, Italy, 2013. [Google Scholar]
  51. Seckin, C.; Sciubba, E.; Bayulken, A.R. An application of the extended exergy accounting method to the Turkish society, year 2006. Energy 2012, 40, 151–163. [Google Scholar] [CrossRef]
  52. Dewulf, J.; Bösch, M.E.; de Meester, B.; van der Vorst, G.; van Langenhove, H.; Hellweg, S.; Huijbregts, M.A.J. Cumulative Exergy Extraction from the Natural Environment (CEENE): A comprehensive Life Cycle Impact Assessment method for resource accounting. Environ. Sci. Technol. 2007, 41, 8477–8483. [Google Scholar] [CrossRef] [PubMed]
  53. Dai, J.; Chen, B.; Sciubba, E. Extended exergy based ecological accounting for the transportation sector in China. Renew. Sustain. Energy Rev. 2014, 32, 229–237. [Google Scholar] [CrossRef]
  54. Sciubba, E. A Thermodynamically Correct Treatment of Externalities with an Exergy-Based Numeraire. Sustainability 2012, 4, 933–957. [Google Scholar] [CrossRef]
  55. Food and Agriculture Organization of the United Nations. The State of the World Fisheries and Aquaculture 2014: Opportunities and Challenges; Food and Agriculture Organization of the United Nations: Rome, Italy, 2014. [Google Scholar]
  56. Romero, J.C.; Linares, P. Exergy as a global energy sustainability indicator. A review of the state of the art. Renew. Sustain. Energy Rev. 2014, 33, 427–442. [Google Scholar] [CrossRef]
  57. Celpa. Boletim Estatístico; Industria Papeleira Portuguesa: Lisboa, Portugal, 2014. [Google Scholar]
  58. Özilgen, M.; Öner, E.S. Biothermodynamics: Principles and Applications; CRC Press: Boca Raton, FL, USA, 2017. [Google Scholar]
  59. Dewulf, J.; van Langenhove, H.; van de Velde, B. Exergy-Based Efficiency and Renewability Assessment of Biofuel Production. Environ. Sci. Technol. 2005, 39, 3878–3882. [Google Scholar] [CrossRef] [PubMed]
  60. Weight Equivalents: Eggs. Available online: Hannaone.com (accessed on 13 August 2018).
Figure 1. Exergy accounting methodologies.
Energies 10 01219 g001
Figure 2. Energy carriers’ conversion efficiency from 2000 to 2012 (full lines on the left axis and dashed line on the right axis).
Energies 10 01219 g002
Figure 3. Exergy accounting methodologies for the Agricultural, Forestry and Fisheries Sector.
Energies 10 01219 g003
Figure 4. Inputs and outputs of the Agriculture, Forestry and Fishery (AFF) sector.
Energies 10 01219 g004
Figure 5. Exergy of energy resources’ inputs to agriculture and forestry.
Energies 10 01219 g005
Figure 6. Exergy of energy resources’ inputs to the fishery subsector.
Energies 10 01219 g006
Figure 7. Useful Exergy by end use category in agriculture and forestry.
Energies 10 01219 g007
Figure 8. Useful Exergy by end use category in fisheries.
Energies 10 01219 g008
Figure 9. AFF sector and subsectors efficiencies by EREA approach.
Energies 10 01219 g009
Figure 10. AFF sector and subsectors efficiencies by EREA approach considering year 2000 carrier-end use efficiencies.
Energies 10 01219 g010
Figure 11. Natural resources exergy output from the AFF sector.
Energies 10 01219 g011
Figure 12. Natural resources exergy output from the AFF sector in percentage.
Energies 10 01219 g012
Figure 13. Natural resources exergy inputs to the AFF sector.
Energies 10 01219 g013
Figure 14. Natural resources exergy inputs to the AFF sector in percentage.
Energies 10 01219 g014
Figure 15. AFF sector and subsectors efficiencies by NREA approach.
Energies 10 01219 g015
Figure 16. Exergy of labour into AFF subsectors and equivalent exergy of labour.
Energies 10 01219 g016
Figure 17. Capital exergy into AFF subsectors and equivalent exergy of capital.
Energies 10 01219 g017
Figure 18. The virtual exergy input due to pollutant emissions into AFF subsectors.
Energies 10 01219 g018
Figure 19. Extended exergy input to the AFF sector.
Energies 10 01219 g019
Figure 20. AFF sector and subsectors efficiencies by EEA approach.
Energies 10 01219 g020
Figure 21. AFF sector and subsectors’ efficiencies by methodology (full lines on the left axis and dashed lines on the right axis). EREA in shades of green, NREA in shades of blue and EEA in shades of orange.
Energies 10 01219 g021
Figure 22. Ratio between output exergy from the sector and the useful exergy from energy resources.
Energies 10 01219 g022
Table 1. Description of Economic Sectors, Environment and Abroad.
Extraction (Ex)Extraction of minerals and ores, coal mining, oil and gas extraction, refining and fuel manufacturing.
Conversion (Co)Power, cogeneration and heat plants, based on renewables and non-renewables.
Agriculture, Forestry and Fisheries (AFF)Crop and animal production, forestry and logging, fisheries and aquaculture. Includes animal products like milk, honey and eggs.
Industry (In)All manufacturing industry excluding refining.
Tertiary (Te)Public and private sector services, includes schools, hospitals, construction, trade and commerce, tourism, real estate and finance.
Transportation (Tr)Private and commercial transportation of people and goods.
Domestic (Do)Includes households and population.
Environment (E)Lithosphere, the hydrosphere and the atmosphere.
Abroad (A)Other countries or regions outside de economic system boundaries which allow energy and mass transfers.

